Abstract
Flood control infrastructure is essential for the development of cities and the population’s well-being. The goal is to protect human and economic resources by reducing the inundation area and controlling the flood level and peak discharges. Detention basins can do this by storing a large volume of water to be released after the peak discharge. By doing this, a large amount of energy is stored, which can be recovered via micro-hydropower. In addition, as the release flow is controlled and almost constant, Pumps as Turbines (PAT) could be a feasible and economic option in these cases. Thus, this study investigates the feasibility of micro-hydropower (MHP) in urban detention basins, using the Santa Lúcia detention basin in Belo Horizonte as a case study. The methodology involved hydrological modeling, hydraulic analysis, and economic and environmental assessment. The results demonstrated that PAT selection has a crucial role in the feasibility of the MHP, and exploiting rainfall with lower intensities but higher frequencies is more attractive. Using multiple PATs with different operating points also showed promising results in improving energy production. In addition to the economic benefits, the MHP in the detention basin produces minimal environmental impact and, as it exploits a wasted energy source, it also reduces the carbon footprint in the urban water cycle.
1. Introduction
Water management has an important role in the agenda proposed by the United Nations Foundation, where 17 Sustainable Development Goals (SDGs) were proposed to end poverty and protect the planet [1]. Among these goals, SDGs 6, 7, and 14 are directly related to water management, as they relate to safe drinking water, renewable energies, and water life, respectively. In addition, SDG 3, which aims at health and wellness, is intrinsically related to water management, as several diseases are transmitted through water.
As urban centers keep developing and increasing, water management in cities becomes essential to avoid economic and social losses. Urbanization disrupts the natural hydrological cycle of the basin, as the runoff surface is drastically changed, increasing the risk of floods [2,3]. Traditional drainage systems are designed to rapidly transport the runoff flow through a network of galleries and channels [4]. However, these systems often operate above the designed conditions due to irregular occupation and lack of maintenance [5,6]. Larger structures, such as detention basins, can be considered to regulate the peak flow and maintain a steady and acceptable hydraulic condition in the drainage system [7,8]. However, these structures demand a high investment and a large area to be effective. The integration with the urban environment is essential for the success of these structures, creating, for example, parks that the community can use during dry periods.
The development of urban centers also increases the demand for water and energy, intrinsically related resources, as electric energy requires a large amount of water to be produced, and drinking water requires energy for treatment and distribution [9]. This intrinsic relation can cause conflicts in multiple uses of water, as presented in [10]. The case study presented by the authors showed that hydropower can be directly affected by the increase in water demand and leakages. The relationship between Water, Energy, and Food (WEF) was studied in [11] in five Central Asian cases. The authors observed challenges concerning the WEF management and highlighted that water governance and land management are critical in this context.
In addition to urbanization, the water management in cities faces another challenging problem: climate change. In this context, extreme events are more frequent: drought periods are becoming larger and more severe, and the rainy season is more intense [12,13,14,15,16]. Drinking water systems are pumping water from distant sources to meet the demand, and intermittency is more common and frequent during dry periods [12]. On the other hand, floods are causing more damage and losses, as drainage systems are not designed to operate with more frequent and intense precipitation. Thus, new approaches must be developed to efficiently manage these new conditions in the water cycle [17,18,19].
Sustainable Urban Drainage Systems (SUDSs) represent a transformative approach to urban water management, integrating flood control, water quality improvement, and resource optimization [20]. By prioritizing natural processes and multifunctional design, SUDSs address the limitations of conventional systems while creating opportunities for innovation [21]. One such opportunity lies in integrating micro-hydropower generation to recover the hydraulic energy typically dissipated in drainage networks [22,23]. Large dams with multiple uses already optimize their operation to maximize the benefits, including flood control and energy production [24,25]. Harnessing the kinetic and potential energy of urban water flows not only diversifies renewable energy sources but also enhances the overall performance of drainage infrastructure, contributing to the development of smart and resilient urban systems. In addition, exploiting commonly wasted energy potentials, close to the consumers, can relieve bigger hydropower plants and the electrical system as a whole, contributing to better management of WEF [26].
In this context, this study evaluates the technical, economic, and environmental feasibility of micro-hydropower (MHP) within an urban detention basin, using the Santa Lúcia basin in Belo Horizonte, Brazil, as a case study. By analyzing hydrological behavior, hydraulic potential, and economic feasibility, the research explores integrating microgeneration technologies into sustainable urban water management frameworks. Pumps as Turbines (PATs) are considered in the MHP configuration to reduce the investment. The results show that the PAT selection greatly impacts the operation and economic feasibility, indicating that small PATs are preferable, as they can operate for longer periods. The optimal control of the reservoir water level is another important aspect to evaluate, as it affects the PAT operation, but flood control must be guaranteed. Compared to other energy recovery strategies, there is a lack of studies in the literature focusing on drainage systems. Therefore, this system’s potential, feasibility, and technical aspects are not well known. Thus, this study’s aim is to contribute to the broader research on renewable energy integration in urban infrastructure, offering insights into scalability, policy implications, and the role of interdisciplinary strategies in urban planning.
2. Materials and Methods
The research was structured into three key stages, hydrological, hydraulic, and economic–environmental analyses, as presented in Figure 1. This approach ensured a thorough assessment of the feasibility of an MHP in the detention basin.
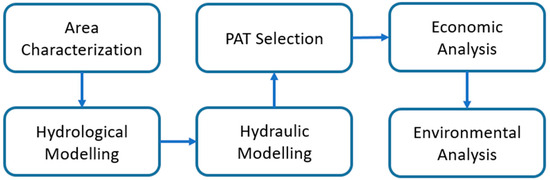
Figure 1.
Flowchart of the methodological process.
2.1. Area Characterization
The Santa Lúcia detention basin, located in the Leitão Creek watershed in Belo Horizonte, Brazil, serves as an important component of the city’s urban drainage infrastructure. Designed to mitigate flood risks and control stormwater runoff in a highly urbanized region, the basin addresses challenges posed by impermeable surfaces that increase surface flow. Table 1 summarizes the Santa Lúcia detention basin characteristics: currently covers an area of 30,800 m2 (Figure 2b) and maintains a permanent water level at an elevation of 900.65 m, corresponding to a dead storage volume of 42,710 m3. The dam height and length are 18 m and 115 m, respectively. Although it has a small area, this detention basin plays a pivotal role in flood attenuation [27]. Leitão Creek, with 350 ha, drains the water beneath the reservoir (Figure 2c), passing through a central opening that allows excess water to spill into the basin. Downstream of this opening, the channel narrows, creating a Venturi-like effect that restricts upstream inflow and raises the water level within the basin (Figure 2e) [28]. The reservoir is also equipped with a tulip-type auxiliary spillway (Figure 2f), which is activated when the water level reaches 900.81 m. An emergency spillway is located at elevation 903.00 m, while the dam crest lies at 904.00 m. The spillway capacity is 39 m3/s. The Leitão Creek feeds the Arrudas River in downtown Belo Horizonte.

Table 1.
Characteristics of the case study in Santa Lúcia detention basin.
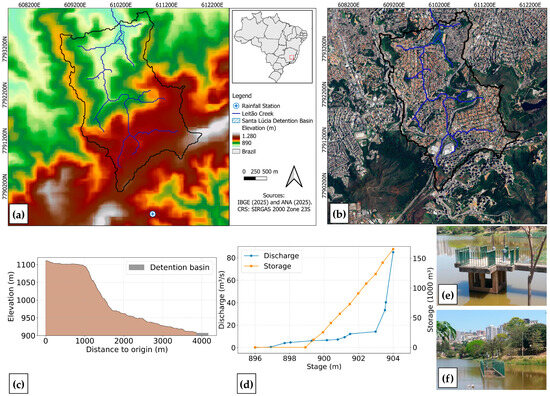
Figure 2.
(a) Topography of the study area; (b) urbanization within the study area; (c) stage–discharge and stage–storage relationships employed in the reservoir model (adapted from [29]); (d) inflow–outflow channel system (adapted from [29]); (e) tulip-type auxiliary spillway (adapted from [29]); (f) tulip-type auxiliary spillway in operation (adapted from [29]).
2.2. Hydrological Modelling
Hydrological modelling was carried out using the HEC-HMS 4.11 software, adopting a lumped approach to represent the hydrological processes in the Leitão Creek watershed. Topographic data were obtained from the ANADEM digital elevation model [30], while rainfall inputs were provided by the National Center for Monitoring and Early Warning of Natural Disasters (CEMADEN) station 314480501A [31], covering the entire year of 2019 with a 10 min temporal resolution (Figure 2a).
The Deficit and Constant loss method was used to simulate infiltration processes, based on four key parameters: Initial Deficit (300 mm), Maximum Deficit (300 mm), Constant Rate (42 mm/h), and Impervious Percentage (55%). The loss parameters were defined using soil physical characteristics from the HYBRAS database [32,33], which provides hydrophysical properties of Brazilian soils. The Leitão Creek, located upstream of the Santa Lúcia detention basin, lies in a headwater region characterized by soils close to the parent material (Cercadinho and Sabará formations) [28], resulting in the predominance of Inceptisols and Entisols—shallow soil types, often in steep slopes, that are highly prone to runoff generation, leading to rapid saturation and surface runoff [34]. The Impervious Percentage was determined from land use zoning and soil permeability requirements established by the Municipal Master Plan of Belo Horizonte, as made available through [29].
Rainfall interception by vegetation was simulated using the Simple Canopy method, with parameters defined as Initial Storage = 0%, Maximum Storage = 5 mm, and Crop Coefficient = 1.0, as vegetation interception is less important for hydrological responses in this highly urbanized area. To transform excess rainfall into direct runoff, the SCS Unit Hydrograph method was applied, with a lag time of 16.731 min, estimated using the kinematic approach. Flow velocities used in this estimation considered standard runoff conditions for urban pavements with different longitudinal slopes, as follows: 1.3 m/s for 1% slope, 2.6 m/s for 3%, and 5.2 m/s for 17% (based on technical guidelines for hydraulic design) [35]. Stage–storage and stage–discharge curves used in the reservoir routing through the Modified Puls method are shown in Figure 2d.
2.3. Hydraulic Analysis
Based on the hydrological study, the micro-hydropower plant layout will be designed, and the number and type of PATs to be installed will be defined. Given the variability in the hydraulic conditions in the detention basin, PATs with different characteristics can be selected to maximize the energy produced (Equation (1)).
where γ is the water-specific weight, Q is the available flow, H is the available head, η is the PAT efficiency (including the motor as a generator), and Δt is the time operating in these hydraulic conditions.
To select the PATs, the methodology proposed by [36] is used. The flow and head in turbine mode (QT and HT), on its Best Efficiency Point (BEP), are defined in this hydrological study. These values are used to calculate the specific speed in turbine mode (Equation (2)). Following this, the specific speed in pump mode can be calculated using Equation (3) [37].
where NST is the specific speed in turbine mode, nt is the rotational speed in turbine mode, and NSP is the specific speed in pump mode.
Afterwards, the head and flow in pump mode are calculated using Equations (4) and (5), respectively.
where HP is the head in pump mode on its BEP, QP is the flow in pump mode on its BEP, and np is the rotational speed in pump mode.
These values of flow and head in pump mode are used to select a pump and define its costs. To estimate its performance, in turbine mode, under different hydraulic conditions, Equation (6), proposed by [38], and Equations (7)–(9), proposed by [39], are used.
where ηT is the PAT efficiency on its BEP, Hi is the available head in time i, Qi is the available flow in time i, Pi is the PAT power in time i, PT is the PAT power on its BEP, and ηi is the PAT efficiency in time i.
The calculation procedure involved evaluating the efficiency of the PATs and selecting the one with the highest performance for operation at any given moment, provided the flow rate is between 0.5- and 1.5-times QT. Any excess (Qi > 1.5 QT) was reassigned to other PATs, as well as when the flow rate was too low (Qi < 0.5 QT). It is important to highlight that this work is based on theoretical results. Thus, the pump characteristics obtained (QP and HP) may not be available on the market.
2.4. Economic and Environmental Analysis
To estimate the investment (I) associated with implementing the MHP, Equation (10), developed for small-scale projects in Brazil [40], is used.
To compare the performance of the different PATs assembled in the MHP, the Energy Cost index (EC) presented in Equation (11) is used. This index relates the investment for a given PAT and its annual energy production (EA); i.e., it roughly gives the cost to produce 1 kWh.
The feasibility of the MHP is evaluated considering the cost and energy production of all PATs installed. In this case, the benefits are considered throughout the entire life cycle of the MHP (50 years). Maintenance costs are also considered every five years, and the base rainfall intensity used as reference was randomly changed in each year of the MHP life cycle. Finally, the revenue of the energy produced is conservatively estimated using the lowest energy tariff (TE) in Minas Gerais state in Brazil: 0.53071 BRL/kWh. Payback and Internal Rate of Return (IRR) are the metrics used to evaluate the economic feasibility of the MHP.
A comprehensive environmental impact assessment analyzes the sustainability benefits of reducing reliance on conventional energy sources. The environmental benefit is estimated based on Brazil’s carbon footprint for energy generation (38.5 kg/MWh) [41]. The calculation considers the amount of energy generated and the reduction in greenhouse gas emissions, as all produced energy is supposed to be consumed internally (public illumination), contributing to a measurable reduction in the carbon footprint.
3. Results
3.1. Hydrological Modeling
There was between 1100 mm and 1200 mm of rainfall in Belo Horizonte in 2019, ranging from 0 mm in August to 254 mm in December [31]. The CEMADEN gauge accumulated 705.8 mm in 2019, this difference being a consequence of missing information in November and December. However, February to April registered 281.7 mm, 124.2 mm, and 128.9 mm, respectively, which was close to or even greater than the climatological average of Belo Horizonte [32]. This lack of information does not preclude the analysis proposed in this study, as it focuses on the potential and feasibility of energy generation by harnessing the basin’s water storage and release. These processes were well represented from February to April, providing enough information regarding the potential of energy generation in this structure. Future works must consider more extended periods of hydrological simulations to optimize energy generation without compromising the purpose of flood smoothing.
The 10 min rainfall ranged from 0 mm to 26.5 mm (~160 mm/h), with the highest concentration in February and March (Figure 3). Streamflow quickly responded to rainfall (Figure 3) due to the high degree of urbanization and the Creek’s small size, highlighting the importance of modeling in a 10 min step. These responses varied from 10 min to the time of concentration (~30 min), indicating the flashiness of overland flow generation. Even smaller time steps (e.g., 5 min) may be needed to improve peak simulation in flash flood modeling [42]. However, ref. [28] also observed quick responses in the same creek by applying the SWMM in a 10 min configuration.
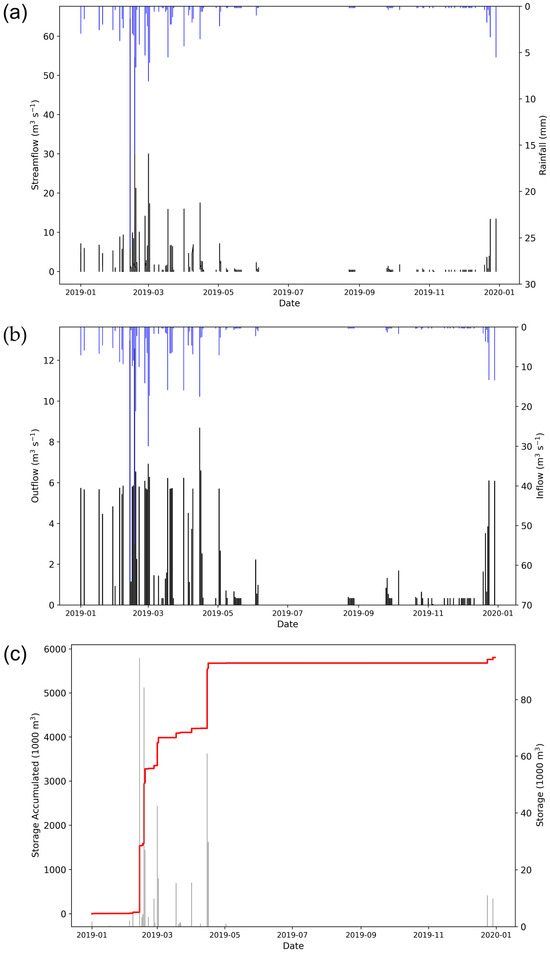
Figure 3.
Hydrological model results in a 10 min time step in 2019: (a) rainfall (blue) and streamflow (black) time series in Leitão creek upstream of the detention basin; (b) detention basin inflow (blue) and outflow (black) time series; and (c) detention basin storage (grey) and accumulated storage (red) time series.
Streamflow reached 64.4 m3/s at 3:40 PM on February 13th, 10 min after the peak rainfall intensity of 160 mm/h. This magnitude is within the peak flow values expected during heavy rains in the Leitão creek [28]. Detention basin storage and outflow responded to the modeled inflow (Figure 3). Outflow ranged from 0 to 12.9 m3/s, whereas storage ranged from 0 to 94.7 × 10³ m3. The maximum accumulation rate was in February after consecutive heavy rainfalls (Figure 3). The outflow maximum value (12.9 m3/s) happened 40 min after the maximum inflow (64.4 m3/s), following successive rainfall events that shaped the storage–release process (Figure 3). This delayed response and magnitude decrease showcase the detention basin’s importance in dampening peak flows and reducing floods in Belo Horizonte downtown. The storage accumulation throughout the year, together with the outflow, highlights the potential of energy generation during and after heavy rainfall events.
3.2. Energy Generation
To select the PATs, the extreme precipitation events (5, 10, 30, and 60 min) with a 50-year return period, presented in [27], are considered. This procedure considers the great variability in rainfall. Thus, it is expected that the selected PATs combined will have a wide range of operations, allowing for better potential exploitation. The main characteristics of the selected PATs are shown in Table 2.
Table 2.
Characteristics of the selected PATs.
The cost of PAT D is noticeably high, as its power is significantly higher. The first analysis showed that, despite the higher power, the high flows necessary for PAT D to operate occur only briefly. Thus, this PAT was not considered as its economic benefit is very low. Instead, in cases of high flows, the value was distributed among the available PATs or, if possible, stored in the reservoir, operating the MHP for longer. Figure 4 shows the energy generation for each PAT for 2019. PAT C was the most effective, generating 70% of the total energy. However, PATs A and B had a crucial role operating during periods with low precipitation—between July and November, when PAT C was not able to operate. This highlights the importance of PATs with different characteristics to maximize energy production throughout the year. Figure 5 shows how many times each PAT was switched on or off. It can be observed that PATs A and B have a higher frequency in operation as they are able to operate even with low precipitation.
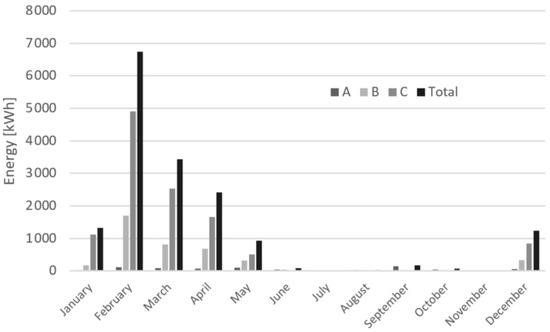
Figure 4.
Energy production for each PAT during 2019.
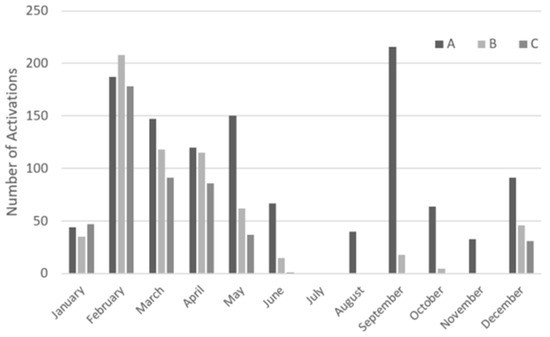
Figure 5.
Activation for each PAT during 2019.
The economic and environmental analysis for the MHP is shown in Table 3. The effectiveness of PAT C is once again highlighted, showing the lowest cost per unit of energy produced. Considering only the economic aspect, the MHP could be designed with only PAT C. In addition to the lower cost, operationally, it would be less complex to operate only with one machine. Overall, the MHP is economically feasible and generates an environmental benefit equivalent to 63 trees.
Table 3.
Economic and environmental results.
Table 4 compares the average power produced in different energy recovery systems. Considering the layout proposed for the case study using three PATs, the average power production is 1.88 kW. Compared to the energy available in wastewater plants, it has much lower potential. Compared to the energy recovery in water distribution networks, the potential in the case study is compatible with the sites with lower potential. Finally, the case study is of the same magnitude as the only SUDS analysis available. The difference between these approaches highlights how the variable flow in the MHP has an important role in energy production and its feasibility, as a more constant flow observed in wastewater plants allows the MHP to operate better.
Table 4.
Economic and environmental results (adapted from [43]).
4. Conclusions
This study showed a case study to harness energy from detention basins used in urban drainage systems. From an economic standpoint, the MHP is feasible, producing a benefit of BRL 8740.00 per year, with a payback of 7.34 years. In addition, the environmental benefit is estimated to reduce 634 kg of carbon emissions per year, as the MHP exploits a wasted energy source. From a technical standpoint, this study showed that a comprehensive analysis has to be conducted to select an adequate turbine, as the flow variability is very high. The results indicate that the frequency and intensity of the rainfall are the major parameters for the correct PAT selection. For the case study, the PAT selected considering the intensity of a 30 min rain showed the best results for energy production. The PAT selected, considering the 60 min of rain, had the poorest results, as rain with long duration was sporadic in this case study. The PATs selected for 5 and 10 min of rain had average results, as the rainfall for the case study frequently surpassed their capacity. However, these smaller PATS were the only ones capable of operating during dry periods, which can be an effective approach in other areas. It is important to highlight that, for the present study, the detention basin has the capacity to store the restricted flow by the MHP. In other cases, this can be a limitation as the PAT flow is constantly changing, or an additional feature to optimize the MHP operation, restricting the PAT flow to improve its energy production while storing the extra volume in the reservoir. Compared to other energy recovery approaches, the average power in this case study is satisfactory. However, it is still much lower than the existing potential in wastewater plants, where a constant flow allows the MHP to operate better. Finally, as this study considered PATs to reduce the investments, it was also observed that, for some conditions of head and flow, there is no available pump on the market, which can be a barrier in some cases. Hydrokinetic turbines can be a suitable alternative for this kind of potential.
Author Contributions
Conceptualization, A.S.G.K. and G.M.; methodology, A.S.G.K., A.F.R., R.P.G.B. and G.M.; software, A.S.G.K., A.F.R., R.P.G.B. and G.M.; validation, A.S.G.K., A.F.R., R.P.G.B. and G.M.; formal analysis, A.S.G.K., A.F.R., R.P.G.B., B.M.B., J.I. and G.M.; writing—original draft preparation, A.S.G.K., A.F.R., R.P.G.B., B.M.B., J.I. and G.M.; writing—review and editing, A.S.G.K., A.F.R., R.P.G.B., B.M.B., J.I. and G.M.; supervision, G.M. All authors have read and agreed to the published version of the manuscript.
Funding
This research was funded by National Council for Scientific and Technological Development (CNPq) grant number [305256/2021-1] and by Universal Demand Project from Fundação de Amparo à Pesquisa do Estado de Minas Gerais (FAPEMIG) grant number APQ 01320 21.
Data Availability Statement
All data of the model used in this research can be requested from the corresponding author through the indicated e-mail.
Conflicts of Interest
The authors declare no conflicts of interest.
Abbreviations
The following abbreviations are used in this manuscript:
| BEP | Best Efficiency Point |
| IRR | Internal Rate of Return |
| MHP | Micro-Hydropower |
| PAT | Pump as Turbine |
| SDG | Sustainable Development Goals |
| SUDS | Sustainable Urban Drainage Systems |
References
- Carlsen, L.; Bruggemann, R. The 17 United Nations’ sustainable development goals: A status by 2020. Int. J. Sustain. Dev. World Ecol. 2022, 29, 219–229. [Google Scholar] [CrossRef]
- Feng, B.; Zhang, Y.; Bourke, R. Urbanization impacts on flood risks based on urban growth data and coupled flood models. Nat. Hazards 2021, 106, 613–627. [Google Scholar] [CrossRef]
- Wang, J.; Hu, C.; Ma, B.; Mu, X. Rapid urbanization impact on the hydrological processes in Zhengzhou, China. Water 2020, 12, 1870. [Google Scholar] [CrossRef]
- Marsalek, J.; Barnwell, T.O.; Geiger, W.; Grottker, M.; Huber, W.C.; Saul, A.J.; Torno, H.C. Urban drainage systems: Design and operation. Water Sci. Technol. 1993, 27, 31–70. [Google Scholar] [CrossRef]
- Monachese, A.P.; Gómez-Villarino, M.T.; López-Santiago, J.; Sanz, E.; Almeida-Ñauñay, A.F.; Zubelzu, S. Challenges and Innovations in Urban Drainage Systems: Sustainable Drainage Systems Focus. Water 2024, 17, 76. [Google Scholar] [CrossRef]
- Francisco, T.H.S.; Menezes, O.V.C.; Guedes, A.L.A.; Maquera, G.; Neto, D.C.V.; Longo, O.C.; Chinelli, C.K.; Soares, C.A.P. The Main challenges for improving urban drainage systems from the perspective of Brazilian professionals. Infrastructures 2022, 8, 5. [Google Scholar] [CrossRef]
- Bellu, A.; Fernandes, L.F.S.; Cortes, R.M.; Pacheco, F.A. A framework model for the dimensioning and allocation of a detention basin system: The case of a flood-prone mountainous watershed. J. Hydrol. 2016, 533, 567–580. [Google Scholar] [CrossRef]
- Jacob, A.C.P.; Rezende, O.M.; de Sousa, M.M.; de França Ribeiro, L.B.; de Oliveira, A.K.B.; Arrais, C.M.; Miguez, M.G. Use of detention basin for flood mitigation and urban requalification in Mesquita, Brazil. Water Sci. Technol. 2019, 79, 2135–2144. [Google Scholar] [CrossRef]
- Ackerman, F.; Fisher, J. Is there a water–energy nexus in electricity generation? Long-term scenarios for the western United States. Energy Policy 2013, 59, 235–241. [Google Scholar] [CrossRef]
- Souza, R.G.; Barbosa, A.; Meirelles, G. The water–energy nexus of leakages in water distribution systems. Water 2023, 15, 3950. [Google Scholar] [CrossRef]
- Hamidov, A.; Daedlow, K.; Webber, H.; Hussein, H.; Abdurahmanov, I.; Dolidudko, A.; Helming, K. Operationalizing water-energy-food nexus research for sustainable development in social-ecological systems: An interdisciplinary learning case in Central Asia. Ecol. Soc. 2022, 27, 12. [Google Scholar] [CrossRef]
- Arnbjerg-Nielsen, K. Quantification of climate change effects on extreme precipitation used for high resolution hydrologic design. Urban Water J. 2012, 9, 57–65. [Google Scholar] [CrossRef]
- Kreibich, H.; Van Loon, A.F.; Schröter, K.; Ward, P.J.; Mazzoleni, M.; Sairam, N.; Abeshu, G.W.; Agafonova, S.; AghaKouchak, A.; Aksoy, H.; et al. The challenge of unprecedented floods and droughts in risk management. Nature 2022, 608, 80–86. [Google Scholar] [CrossRef] [PubMed]
- Ashley, R.M.; Balmforth, D.J.; Saul, A.J.; Blanskby, J.D. Flooding in the future–predicting climate change, risks and responses in urban areas. Water Sci. Technol. 2005, 52, 265–273. [Google Scholar] [CrossRef]
- Trenberth, K.E. The impact of climate change and variability on heavy precipitation, floods, and droughts. Encycl. Hydrol. Sci. 2005, 17, 1–11. [Google Scholar]
- Galaitsi, S.E.; Russell, R.; Bishara, A.; Durant, J.L.; Bogle, J.; Huber-Lee, A. Intermittent domestic water supply: A critical review and analysis of causal-consequential pathways. Water 2016, 8, 274. [Google Scholar] [CrossRef]
- Zhou, Q. A review of sustainable urban drainage systems considering the climate change and urbanization impacts. Water 2014, 6, 976–992. [Google Scholar] [CrossRef]
- Kang, N.; Kim, S.; Kim, Y.; Noh, H.; Hong, S.J.; Kim, H.S. Urban drainage system improvement for climate change adaptation. Water 2016, 8, 268. [Google Scholar] [CrossRef]
- Mailhot, A.; Duchesne, S. Design criteria of urban drainage infrastructures under climate change. J. Water Resour. Plan. Manag. 2010, 136, 201–208. [Google Scholar] [CrossRef]
- García, A.I.A.; Santamarta, J.C. Scientific evidence behind the ecosystem services provided by sustainable urban drainage systems. Land 2022, 11, 1040. [Google Scholar] [CrossRef]
- Ashley, R.M.; Gersonius, B.; Digman, C.; Horton, B.; Bacchin, T.; Smith, B.; Baylis, A. Demonstrating and monetizing the multiple benefits from using SuDS. J. Sustain. Water Built Environ. 2018, 4, 05017008. [Google Scholar] [CrossRef]
- Ramos, H.M.; Teyssier, C.; Samora, I.; Schleiss, A.J. Energy recovery in SUDS towards smart water grids: A case study. Energy Policy 2013, 62, 463–472. [Google Scholar] [CrossRef]
- Duan, H.F.; Gao, X. Flooding control and hydro-energy assessment for urban stormwater drainage systems under climate change: Framework development and case study. Water Resour. Manag. 2019, 33, 3523–3545. [Google Scholar] [CrossRef]
- Rahimi, H.; Ardakani, M.K.; Ahmadian, M.; Tang, X. Multi-reservoir utilization planning to optimize hydropower energy and flood control simultaneously. Environ. Process. 2020, 7, 41–52. [Google Scholar] [CrossRef]
- Rafique, A.; Burian, S.; Hassan, D.; Bano, R. Analysis of operational changes of Tarbela Reservoir to improve the water supply, hydropower generation, and flood control objectives. Sustainability 2020, 12, 7822. [Google Scholar] [CrossRef]
- McNabola, A.; Mérida García, A.; Rodríguez Díaz, J.A. The role of micro-hydropower energy recovery in the water-energy-food nexus. Environ. Sci. Proc. 2022, 21, 27. [Google Scholar]
- Perché, E.A.; Amaral, L.P. Simulação Hidrológica Da Bacia De Detenção Santa Lúcia, Na Cidade De Belo Horizonte; Centro Federal de Educação Tecnológica de Minas Gerais: Belo Horizonte, Brazil, 2015. [Google Scholar]
- Rosa, D.W.; Nascimento, N.O.; Moura, P.M.; Macedo, G.D. Assessment of the hydrological response of an urban watershed to rainfall-runoff events in different land use scenarios–Belo Horizonte, MG, Brazil. Water Sci. Technol. 2020, 81, 679–693. [Google Scholar] [CrossRef]
- Rosa, D.W.B. Hydrological Response of an Urban Watershed to the Implementation of Compensatory Drainage Techniques—Leitão Creek Basin, Belo Horizonte, Minas Gerais, Brazil. 2017. 218 f. Master’s Dissertation, School of Engineering, Federal University of Minas Gerais, Belo Horizonte, Brazil, 2017. [Google Scholar]
- Laipelt, L.; de Andrade, B.C.C.; Collischonn, W.; Amorim, A.; Paiva, R.C.D.; Ruhoff, A. ANADEM: A Digital Terrain Model for South America. Remote Sensing 2024. Submitted for Publication. Available online: https://www.preprints.org/manuscript/202404.1305/v1 (accessed on 25 May 2025).
- Instituto Nacional de Meteorologia (INMET). Portal Oficial do Instituto Nacional de Meteorologia. 2025. Available online: https://portal.inmet.gov.br/ (accessed on 23 May 2025).
- Ottoni, M.V.; Ottoni Filho, T.B.; Schaap, M.G.; Lopes-Assad, M.L.R.; Rotunno Filho, O.C. Hydrophysical database for Brazilian soils (HYBRAS) and pedotransfer functions for water retention. Vadose Zone J. 2018, 17, 1–17. [Google Scholar] [CrossRef]
- BELO HORIZONTE. Subsecretariat of Urban Planning—SUPLAN. Soil Permeability Rate—BHMap. Data Dictionary—Master Plan of the Municipality of Belo Horizonte (Law No. 11.181/2019). Available online: http://bhgeo.pbh.gov.br/sites/geoportal.pbh.gov.br/files/BHGEO/DICIONARIO_DADOS/taxa_permeabilidade_11181.pdf (accessed on 15 May 2025).
- Mello, C.R.D.; Curi, N. Hydropedology. Ciência E Agrotecnologia 2012, 36, 137–146. [Google Scholar] [CrossRef]
- Pinheiro, M.C. Guidelines for the Development of Hydrological Studies and Hydraulic Designs in Mining Projects; Brazilian Water Resources Association (ABRH): Porto Alegre, Brazil, 2011; ISBN 978-85-8868-632-8. [Google Scholar]
- Balacco, G.; Fiorese, G.D.; Alfio, M.R.; Totaro, V.; Binetti, M.; Torresi, M.; Stefanizzi, M. PaT-ID: A tool for the selection of the optimal pump as turbine for a water distribution network. Energy 2023, 282, 128366. [Google Scholar] [CrossRef]
- Stefanizzi, M.; Capurso, T.; Balacco, G.; Binetti, M.; Camporeale, S.M.; Torresi, M. Selection, control and techno-economic feasibility of Pumps as Turbines in Water Distribution Networks. Renew. Energy 2020, 162, 1292–1306. [Google Scholar] [CrossRef]
- Novara, D.; McNabola, A. The development of a decision support software for the design of micro-hydropower schemes utilizing a pump as turbine. Proceedings 2018, 2, 678. [Google Scholar] [CrossRef]
- Perez-Sanchez, M.; Sánchez-Romero, F.J.; Ramos, H.M.; López-Jiménez, P.A. Improved planning of energy recovery in water systems using a new analytic approach to PAT performance curves. Water 2020, 12, 468. [Google Scholar] [CrossRef]
- Meirelles, G.; Brentan, B.; Izquierdo, J.; Ramos, H.; Luvizotto, E., Jr. Trunk network rehabilitation for resilience improvement and energy recovery in water distribution networks. Water 2018, 10, 693. [Google Scholar] [CrossRef]
- Brasil, Ministério da Ciência e Tecnologia. Estimativas Anuais de Emissões de Gases de Efeito Estufa no Brasil, 6th ed.; Ministério da Ciência e Tecnologia: Brasília, Brazil, 2022.
- Yang, L.; Smith, J.A.; Baeck, M.L.; Zhang, Y. Flash flooding in small urban watersheds: Storm event hydrologic response. Water Resour. Res. 2016, 52, 4571–4589. [Google Scholar] [CrossRef]
- McNabola, A.; Coughlan, P.; Corcoran, L.; Power, C.; Williams, A.P.; Harris, I.M.; Taylor, R.; Packwood, A. Energy recovery in the water & waste water industry using micro-hydropower: A review. In Proceedings of the IASTED International Conference on Power and Energy Systems, Naples, Italy, 25–27 June 2012. [Google Scholar]
Disclaimer/Publisher’s Note: The statements, opinions and data contained in all publications are solely those of the individual author(s) and contributor(s) and not of MDPI and/or the editor(s). MDPI and/or the editor(s) disclaim responsibility for any injury to people or property resulting from any ideas, methods, instructions or products referred to in the content. |
© 2025 by the authors. Licensee MDPI, Basel, Switzerland. This article is an open access article distributed under the terms and conditions of the Creative Commons Attribution (CC BY) license (https://creativecommons.org/licenses/by/4.0/).