Article

The Influence of Combined Energy Dissipators on Navigable Flow Characteristics at Main Channel—Tributary Confluences in Trans-Basin Canals: A Case Study of the Jiuzhou River Section, Pinglu Canal

1
National Engineering Research Center for Inland Waterway Regulation, School of River and Ocean Engineering, Chongqing Jiaotong University, Chongqing 400074, China
2
Key Laboratory of Ministry of Education for Hydraulic and Water Transport Engineering, School of River and Ocean Engineering, Chongqing Jiaotong University, Chongqing 400074, China
3
Pinglu Canal Group Co., Ltd., Nanning 532200, China
*
Author to whom correspondence should be addressed.
Water 2025, 17(15), 2214; https://doi.org/10.3390/w17152214
Submission received: 10 June 2025 / Revised: 15 July 2025 / Accepted: 20 July 2025 / Published: 24 July 2025
(This article belongs to the Section Hydraulics and Hydrodynamics)

Abstract

The flow characteristics at the tributary entrance are crucial for ensuring safe navigation where the main channel and tributary converge. Along the inter-basin canal, numerous tributaries feature large confluence angles and significant flow discharge ratios. An experimental study investigated how these factors influence flow patterns, leading to proposed mitigation measures. This research employed a 1:50-scale physical river model and a sediment deposition model. It analyzed navigable flow conditions including velocity, flow patterns, the confluence ratio, the bottom elevation difference, and the confluence angle at the main channel–tributary junction. Focusing on the Jiuzhou River tributary entrance (Pinglu Canal), which has a large confluence ratio, significant bottom elevation difference, and wide confluence angle, this study tested two solutions: a single energy dissipator and a combined energy dissipator system. Sediment deposition modeling compared the effectiveness of these approaches. The results showed that implementing a steep slope with a three-stage stilling pool in the Jiuzhou River entrance section effectively manages confluences with large elevation differences, wide angles, and high flow discharge ratios. This configuration significantly improves entrance flow characteristics.

1. Introduction

In August 2022, China began the construction of the Pinglu Canal, located within the Guangxi Zhuang Autonomous Region. As a new trade outlet, the canal promises to deepen the economic connections between China and Southeast Asia. Starting from the Xijin Reservoir Area, the canal, when complete, will run approximately 84 miles, eventually flowing into the Beibu Gulf. The canal is being built to accommodate 5000-ton vessels, and once completed by the end of 2026, the canal is expected to have an annual capacity of 89 million tons of trade cargo. There are many tributaries along the Pinglu Canal, of which the major tributaries total 26, including the former main stream of Shaping River and the main stream of Qinjiang River (Figure 1). After the construction of the canal, the bottom of each tributary mouth and the bottom of the canal will have different degrees of difference, with the relationship between each tributary mouth and the canal shown in Table 1; from the table, it can be seen that the bottom of the riverbed of each tributary mouth in the current situation is higher than the bottom of the canal by about 1~16 m. Therefore, the connection between the mouth of each tributary and the main stream of the canal and the arrangement are directly related to the navigational conditions of the canal, and the water flow of the canal is an important issue to be studied.
The flow structure within the confluence zone is complex and highly turbulent. Cross-basin canals serve as river–sea intermodal transport corridors, connecting distinct river basins. They enable inter-basin water transfers to meet canal water demands and promote sustainable regional socioeconomic development. Within these canal networks, confluences function as critical hydraulic nodes, governing water transport development along individual river sections. At these junctions, the converging main stream and tributary flows interact directly. This interaction frequently generates high transverse flow velocities and complex, disturbed flow patterns, resulting in significant navigational hazards. Consequently, the integration of confluence flow remediation measures is pivotal for ensuring seamless navigation of the canal.
To improve water flow at the river junction and ensure navigation safety, engineers typically use various energy dissipation measures like stilling basins, overflow dams, and diversion dikes. Zhou et al. [1] found that under uniform flow conditions, a hydraulic-jump-stepped spillway exhibits lower specific energy than a traditional stepped spillway. During large discharges, the hydraulic-jump-stepped spillway provides superior energy dissipation. Sun et al. [2] combined hydraulic model experiments and numerical simulations to study hydraulic characteristics. They observed that the initial entrainment point for a trapezoidal energy dissipation block-stepped combined dissipator moved progressively downstream as the flow rate increased. Salmasi et al. [3] investigated the effects of step slope and number on energy dissipation, revealing that more steps correlate with higher dissipation rates. Zhang et al. [4] used a two-equation turbulence model for full-field 3D numerical simulations of X-shaped broad-crested weir-stepped spillway hybrid systems, confirming enhanced energy dissipation performance.
The research of Stojnic et al. [5] highlights a specific location (entrance to the steps) within a common energy-dissipating structure (stilling basin with stepped chute) where potentially damaging, highly unstable water pressure occurs on the floor. Sowlati et al. [6] determined that secondary basins provide supplemental energy dissipation, mitigating excessive riverbed scouring. Feng et al. [7] developed a segmented pier-stepped energy dissipation structure, which stabilizes outflow, reduces cavitation damage risk, and improves dissipation efficiency. Chavhan et al. [8] optimized guide-vane spillways to improve energy dissipation trajectories. Recent innovations include pool-step-type spillways designed to augment dissipation effects (Nikseresht et al. [9]; Ghaderi et al. [10]; Guenther et al. [11].
This study examines the flow characteristics at river confluences under different tributary inflow patterns. Researchers worldwide employ model tests to provide insights relevant to practical engineering applications. Ghobadian et al. [12] used SSIIM1 software (https://nilsol.folk.ntnu.no/ssiim/, accessed on 19 July 2025), increasing the confluence angle from 30° to 115°. Their results indicate increased streamwise velocity near the centerline and the inner wall of the bend. Pourvahedi et al. [13] utilized SSIIM2 to reduce the confluence angle from 105° to 45°, finding that the maximum scour depth decreased by approximately 96%. Stojnic et al. [5] observed that increasing the chute slope from 30° to 50° significantly shifts the location of the bottom-pressure jump toe (average, fluctuating, and extreme pressures) downstream by about one tailwater depth. For the 50°-inclined stepped chute, the extreme pressure coefficient was roughly three times higher than that reported for smooth chutes in the literature. Guillén Ludeña et al. [14] studied a 70° confluence, identifying turbulence formed in the tributary, a main vortex, and inflow from the main channel. They highlighted the key role played by near-bed vortices induced by tributary flow deflection. Liu et al. [15] found similar results for 60° and 90° Y-shaped confluences. However, compared to the 90° case, 60° confluence exhibited a smaller separation zone and reduced overall spiral flow eddy currents. Flow at 60° confluence was also more susceptible to velocity separation effects at the junction. Penna et al. [16] simulated 10 different confluences (45° to 90°). Their study revealed that higher confluence angles lead to wider and longer stagnation zones in the upstream corner and separation zones. Flow deflection at the entrance downstream of the tributary also increased with the angle, though the maximum flow velocity did not necessarily correlate with the junction angle. Mosley et al. [17] analyzed velocity data in confluence areas using flume experiments, identifying tributary backwater effects leading to flow stagnation during low-flow periods. Bradbrook et al. [18] further investigated the impact of discordant bed elevations on confluence hydraulics, concluding that bed discordance strengthens secondary circulation and enlarges the separation zone. Canelas et al. [19] characterized the flow field resulting from bed discordance at a fixed 70° open-channel confluence. They observed flow separation downstream of the tributary step and negative vorticity generation along the main channel axis.
At present, although the application of hydraulic energy dissipation has been very common, for dry tributaries like the Pinglu Canal, the river bottom difference is large and the flow of water confluence is intense in cross-basin canals, so the use of a single energy dissipator is often unable to obtain an effective energy dissipation effect. Therefore, the combined application of different types of energy dissipaters is particularly important. In this paper, the effect of different combinations of energy dissipators on the navigational flow characteristics at the confluence of dry and tributary streams is investigated by the physical modeling of the mouth of the tributary of the Old Zhoujiang River in the Pinglu Canal Project at a scale of 1:50. This study provides empirical support for cross-basin canal navigation management and establishes a framework for similar engineering applications.

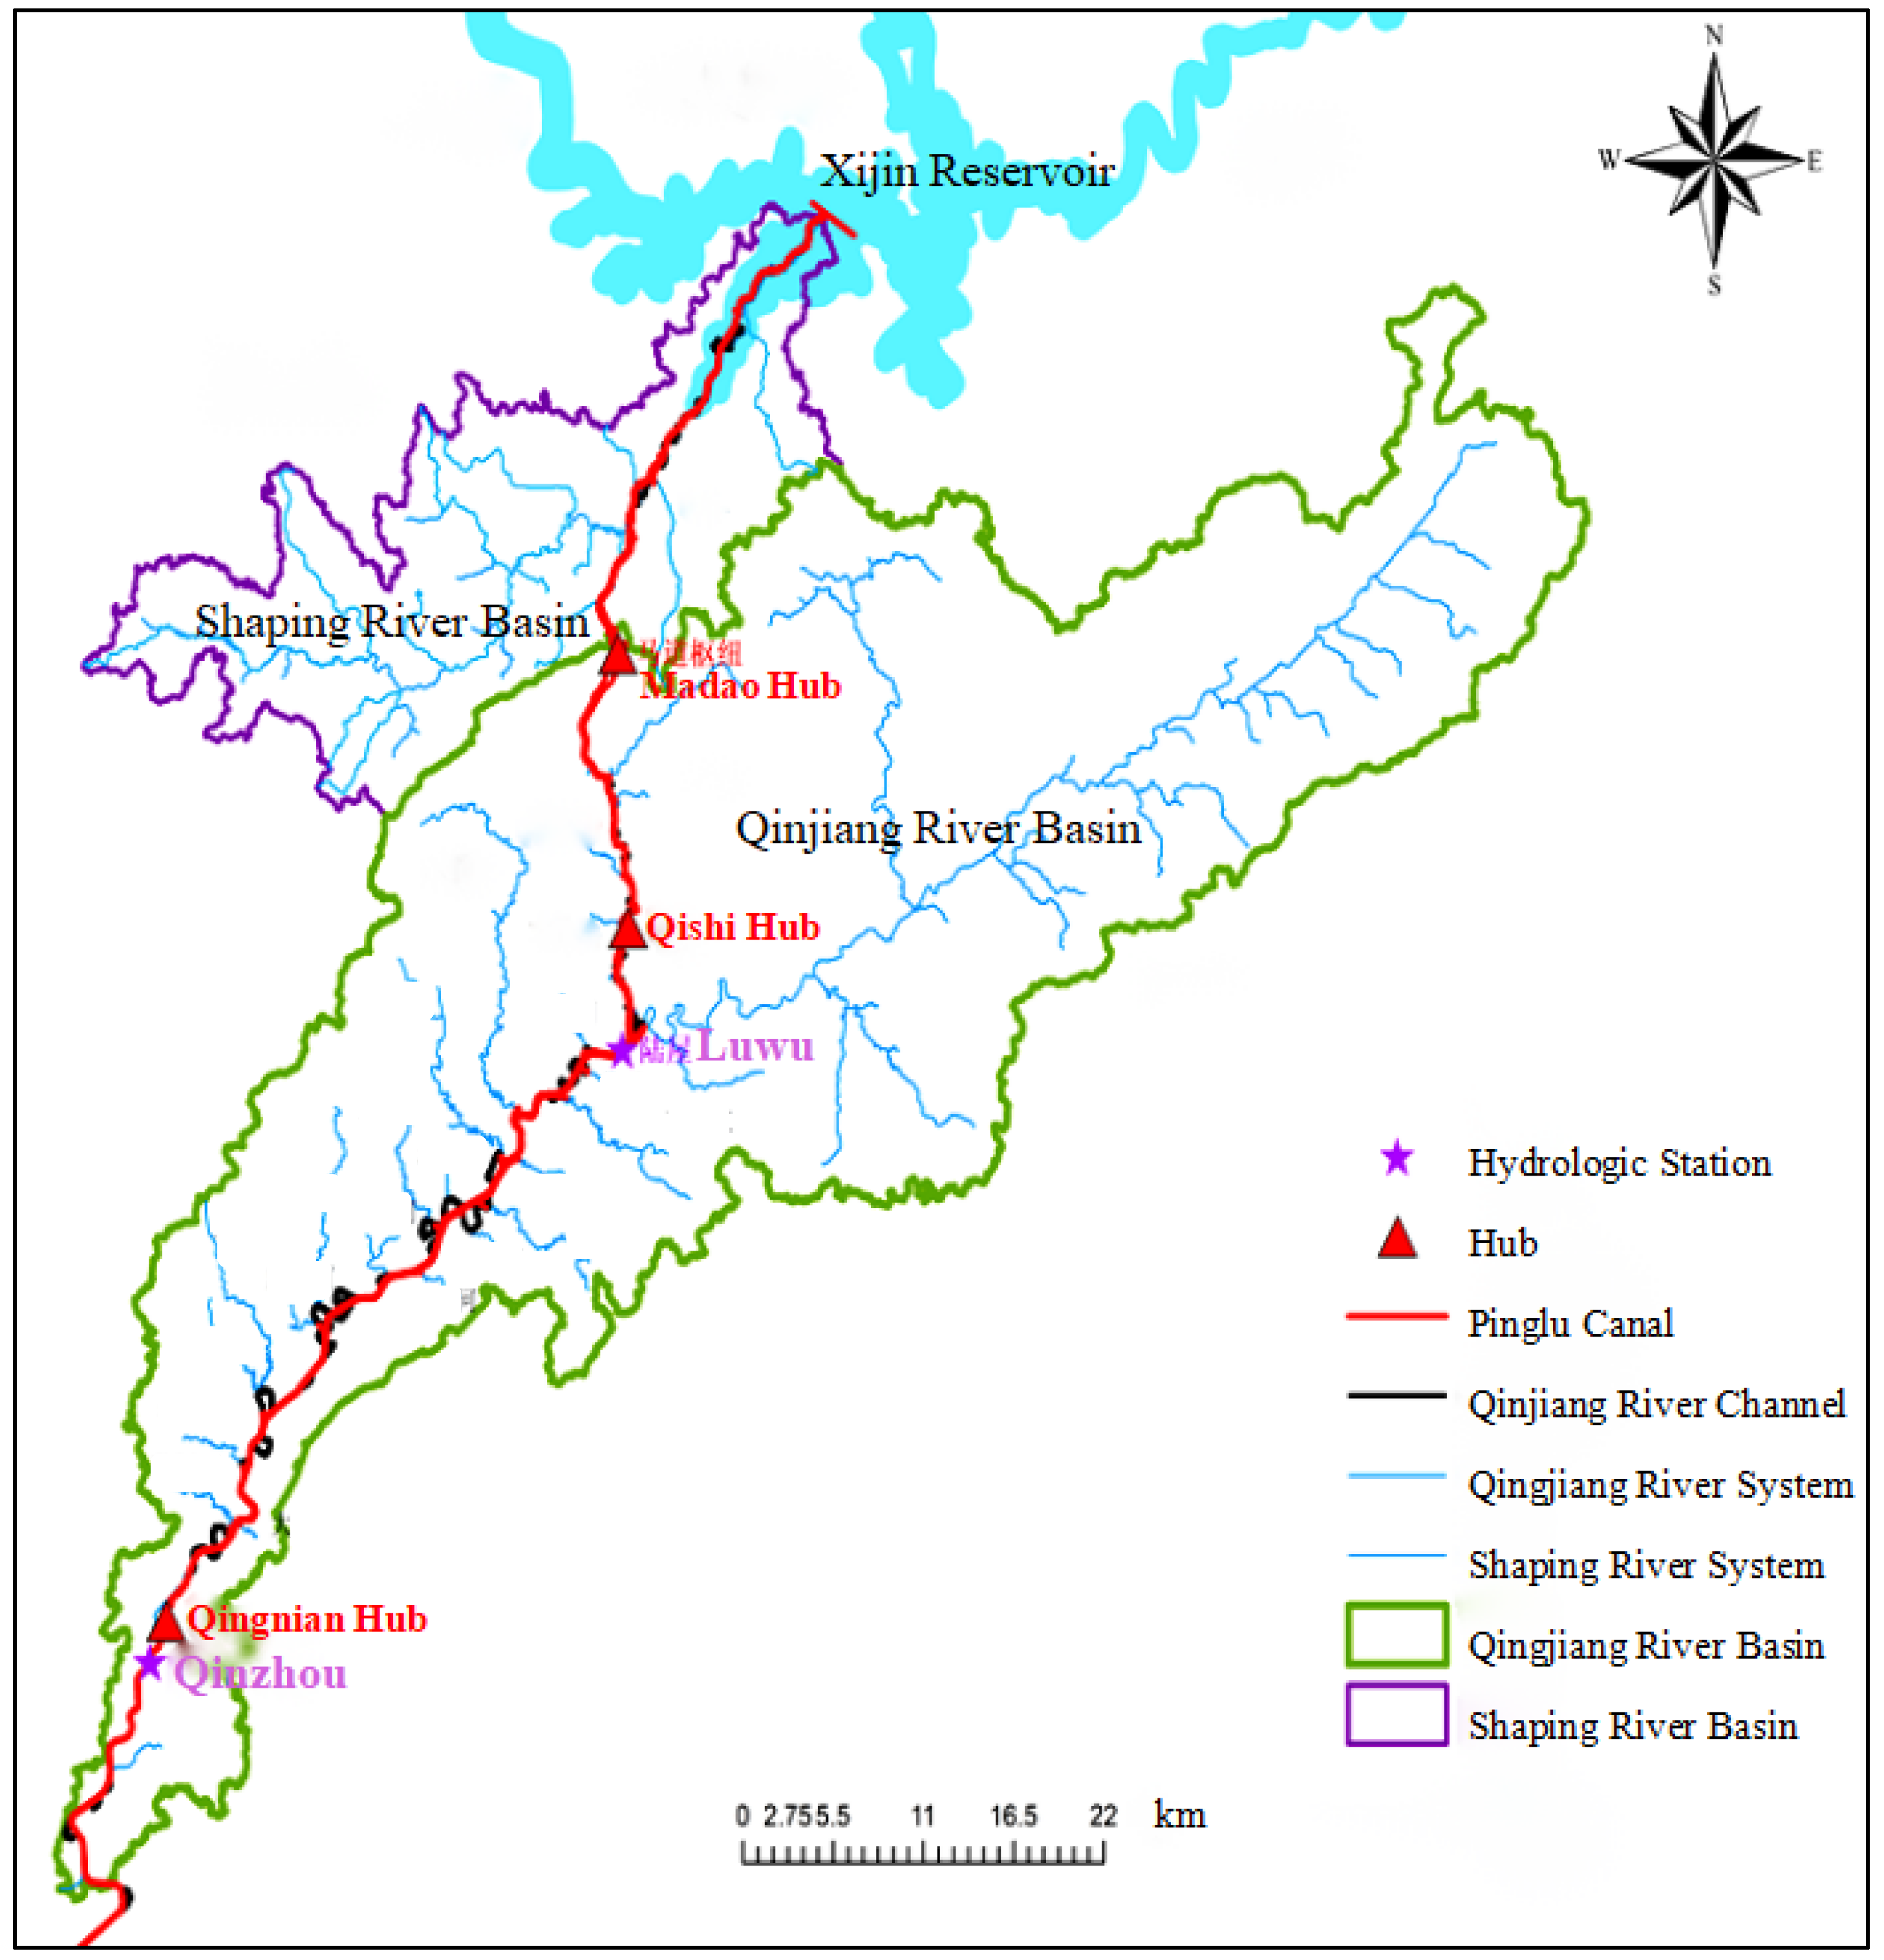
2. Overview of Jiuzhou River

The Qinjiang River is a natural waterway predating the Pinglu Canal’s excavation, stretching 179 km along its main course. As a tributary, it converges with the canal in Luwu Town at approximately 20 degrees. During dry seasons, the Qinjiang averages 60 m in width and 2 m in depth, and maintains a riverbed gradient of roughly 0.4‰. The adjacent canal channel features a bottom elevation of 1.7 m, a bottom width of 80 m, and 1:2 side slopes. Access roads (3 m wide) are constructed at varying elevations based on the terrain. The Qinjiang River Basin (2230.8 km2 catchment area) lies within a subtropical monsoon climate zone. This low-latitude region experiences mild temperatures, abundant sunshine, and significant rainfall peaking from April to September with annual precipitation reaching 1800 mm. The average annual flow is 64.37 m3/s, producing a runoff volume of 2.03 billion m3 and a runoff depth of 900 mm.
Jiuzhou River, a right-bank tributary of the Qin River, joins the Pinglu Canal near Wen’aozi Village (Jiuzhou Town) at 45°. Its dry-season characteristics include the following: average width of 15 m, depth of 0.8 m, and gradient of 0.8‰. The canal at this junction maintains consistent specifications: 80 m bottom width, 1:2 side slopes, and 27.7 m bottom elevation. Terrain-adaptive 3 m wide access roads flank the channel. With a 200 km2 catchment area, the Jiuzhou produces an annual runoff of 180 million m3 and an average flow of 4.6 m3/s. Its suspended sediment and flow processes appear in Figure 2 and Figure 3. The Jiuzhou forms a Y-shaped confluence where its curved main and tributary channels meet the Pinglu Canal at 45°.
The Pinglu Canal’s planned channel is designed to meet Class I Inland Waterway standards, accommodating 5000-ton vessels. The channel is engineered for a full 5000-ton navigation capacity upon completion, with dimensions of 80 m (bottom width) × 6.7 m (depth) × 360 m (minimum bend radius). Based on navigation requirements and ship model testing, the following flow conditions will govern the Jiuzhou River confluence section post-construction: maximum longitudinal velocity ≤ 2.5 m/s, maximum transverse velocity ≤ 0.3 m/s, and water surface gradient ≤ 2.0‰.

3. Model Design and Verification

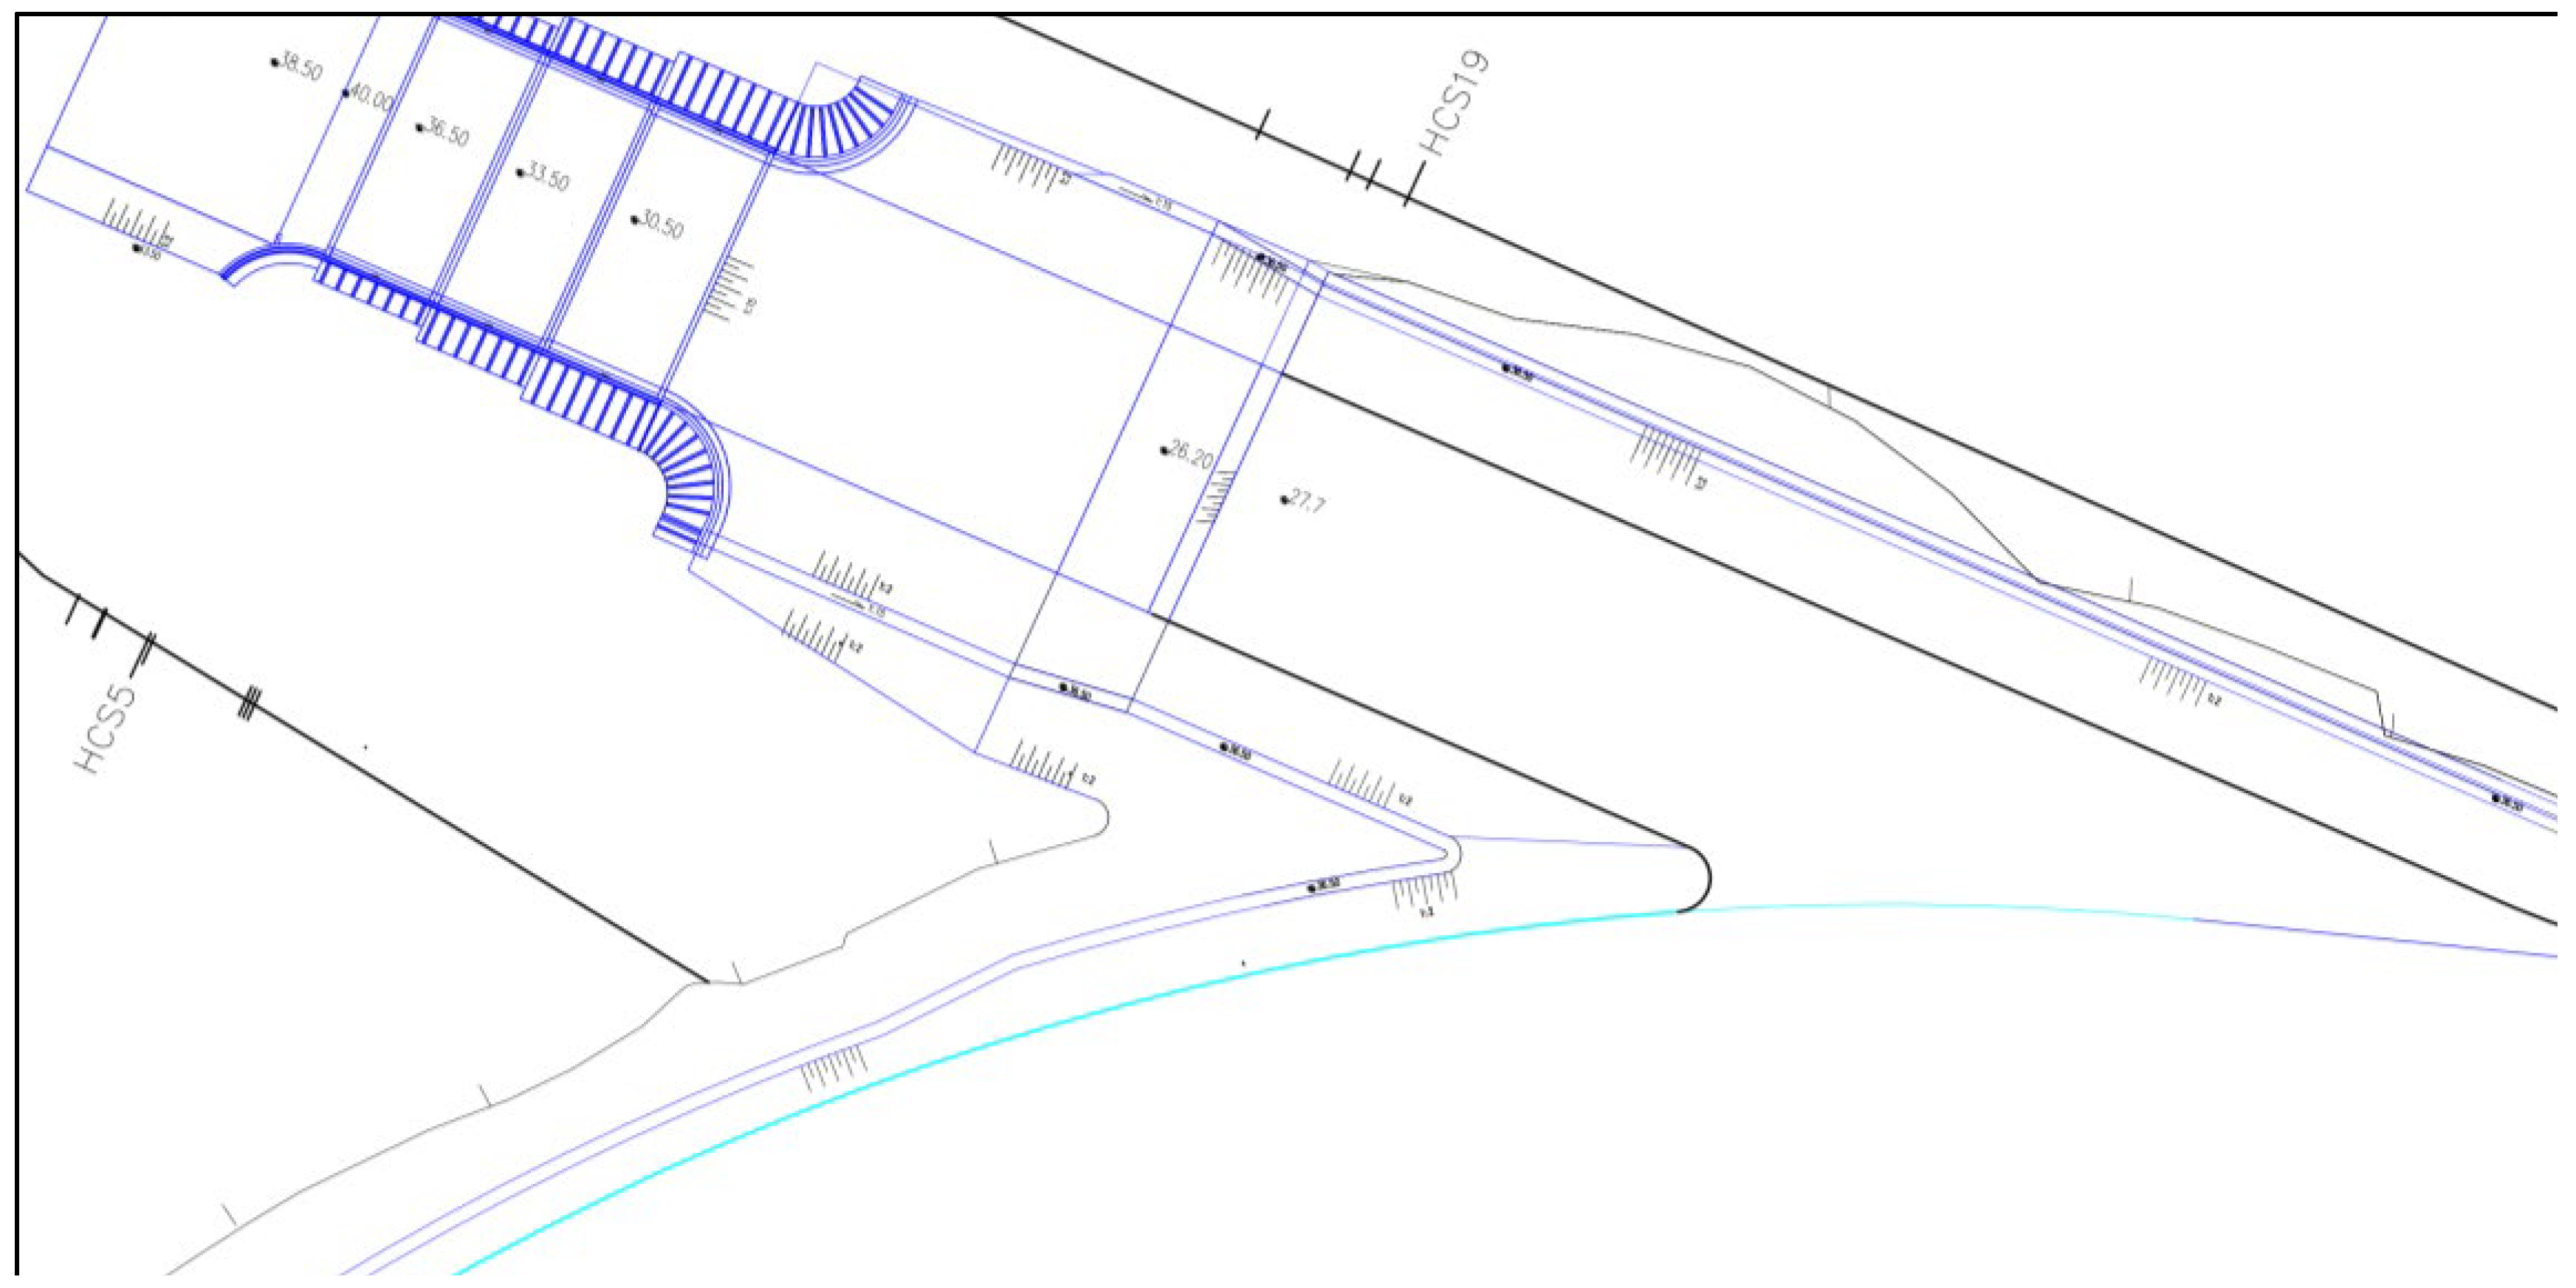
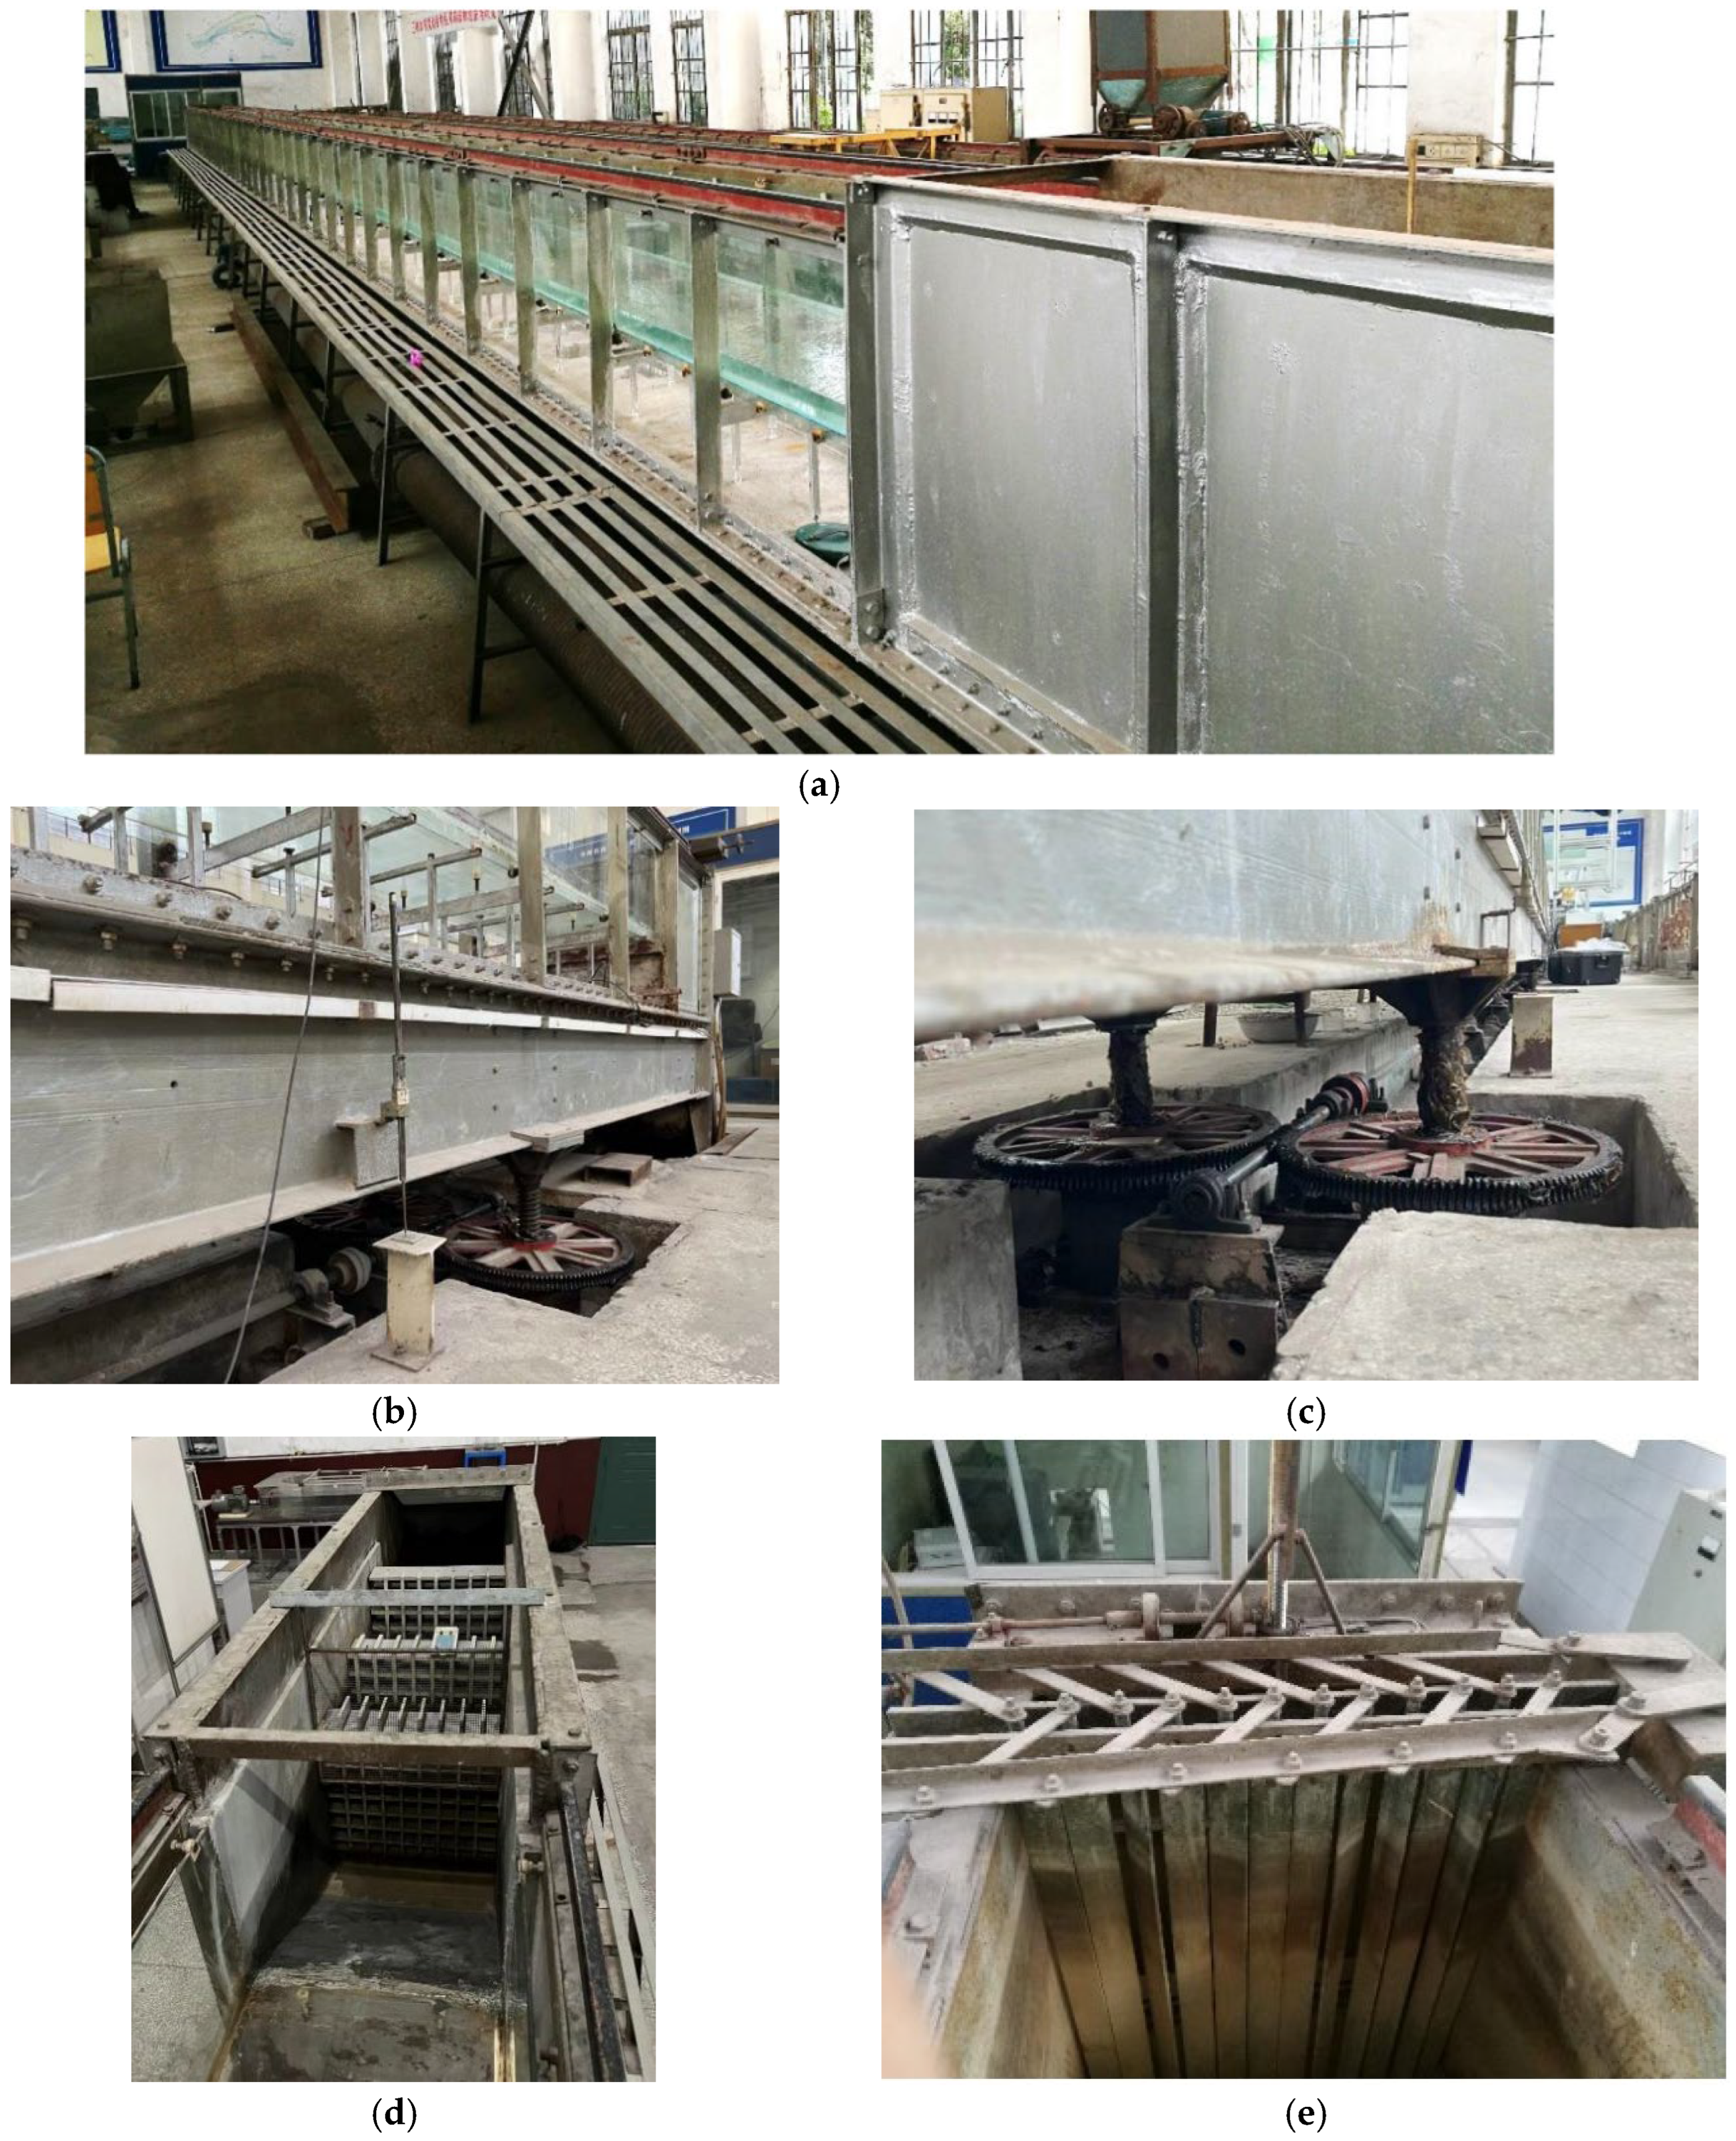
Establishment of Physical Mode

In this paper, a 1:50-scale river engineering model test was used to study the surface flow problem at the tributary entrance.
Combined with the purpose, scope, and similarity requirements of this study, a normal fixed-bed model with a geometric scale of 1: 50 (Figure 4) was used in the experiment. The scope of the model includes the intersection of the main branches of the Jiuzhou River, and the tributary part is about 1.1 km long; the main stream of the canal is about 1.4 km below the entrance of some tributaries and about 1.2 km above the entrance of tributaries, and the main stream is about 2.6 km long. The model range can ensure the reasonable distribution of the flow into the model; the inlet has a sufficient length and bending section. Let the water flow into the test section in each period be fully adjusted. The outlet is relatively straight, which ensures the similarity of the flow pattern of the model tail. The drawing errors of the section plane and elevation are less than 0.5 mm, the installation error plane is controlled within ±1.0 cm, and the elevation error is controlled within ±0.5 mm. In addition, local cross-sections were used to carefully shape the local complex terrain such as convex mouths, rocks, reefs, stone beams, and deep pools to ensure the geometric similarity of the model.
During the experiments, water levels in the model channel were measured using point gauges (UFO F3 PLUS) with an accuracy of ±0.1 mm. The point-level water gauge device and its operating principle are shown in Figure 5. A total of 26 point gauges were installed throughout the model’s reach, spaced at an average interval of approximately 7 m. The test used the XKVMS-03 surface flow field measurement system, which is based on the principle of Particle Image Velocimetry (PIV), and utilized the image processing, pattern recognition, and fast time series processing technologies; the flow velocity measurement range is 0~5 m/s, and the flow velocity measurement accuracy is ±0.001 m/s, with the measurement system’s schematic diagram shown in Figure 6. The laser position is as shown in Figure 6. In the test, three repetitions were performed for each set of protocols and the average value was used as the test result to minimize the effect of test error.
Under low-water conditions, the minimum water depth in the tributary is approximately 2 m, corresponding to a model minimum depth of 4 cm. De-Zhi, Z et al. [20] found that to prevent capillary effects from affecting Froude-number similarity, the minimum water depth in open-channel flow models should exceed 1.5 cm. This satisfies the requirement of a minimum guaranteed depth of 1.5 cm to prevent surface tension interference with flow behavior in the model. To ensure consistency in the flow structure and free water surface between the model and prototype, the flow resistance in the model strictly satisfies resistance similarity conditions with the prototype—namely, simultaneous adherence to both Froude similarity (Fr) and roughness similarity. Furthermore, the large 1:50 scale ratio adopted for the model aims to ensure sufficiently high Reynolds numbers (Re), guaranteeing fully turbulent flow and minimizing viscous force effects. Experimental data indicate that during flood conditions, model Reynolds numbers exceed 10,000, while the minimum Reynolds number during the dry season still surpasses 1200. During construction, the river model incorporated a total of 113 cross-sections: 56 sections were arranged in the tributary and 57 in the main channel(Figure 7). At confluences and bends, cross-section spacing was reduced (Figure 6) to achieve higher topographic accuracy. The model riverbed topography was then shaped using cement mortar plastering.
This experiment utilizes two distinct flow conditions for the main stream and tributary: in the first scenario, the tributary flow rate is 532 m3/s with a main stream flow of 340 m3/s and a tailwater level of 35.32 m, while the second condition features a tributary flow of 297 m3/s and zero main stream discharge.

4. Physical Model Validation

Four water-gauging stations were installed along the Jiuzhou River tributary to record instantaneous water surface elevations in the prototype. Model verification results show close correspondence between prototype and simulated water surface profiles, with particularly consistent longitudinal gradient matching (Table 2). The relative error between the model and the prototype water level was strictly controlled, and the error range complied with the standard hydraulic modeling accuracy requirements to ensure that the model resistance was similar.

5. Energy Dissipation Scheme and Effect Analysis

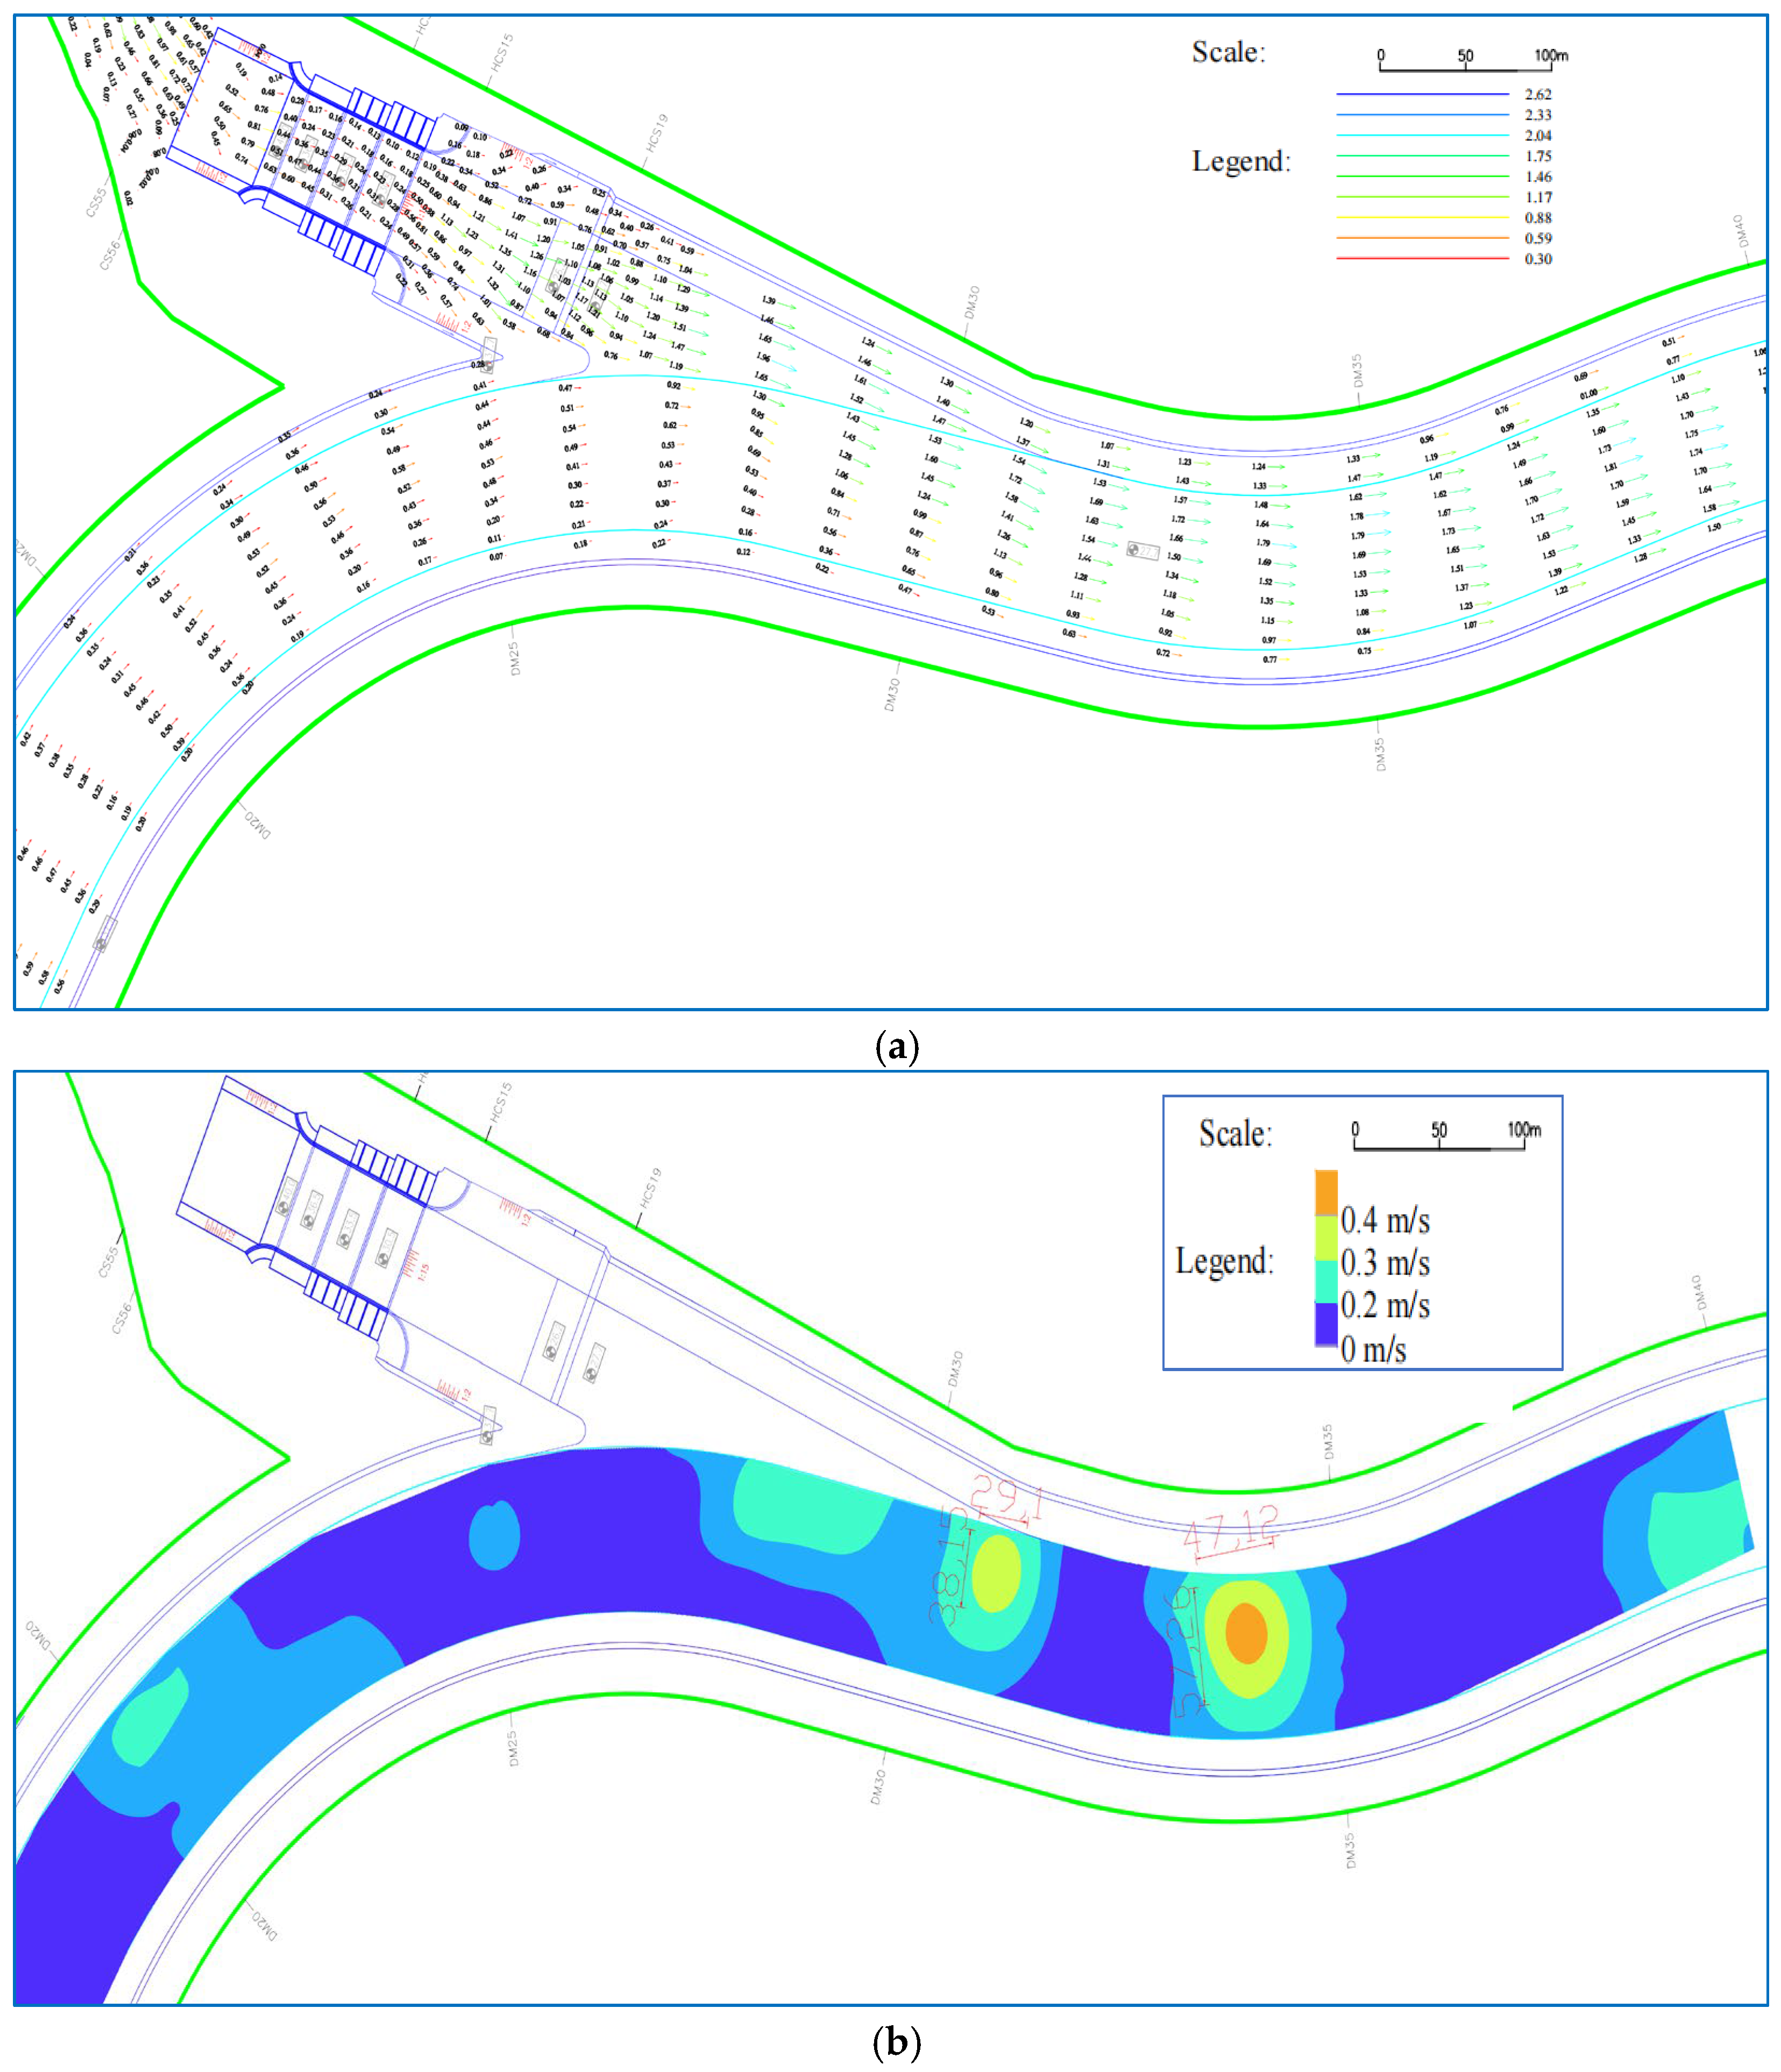
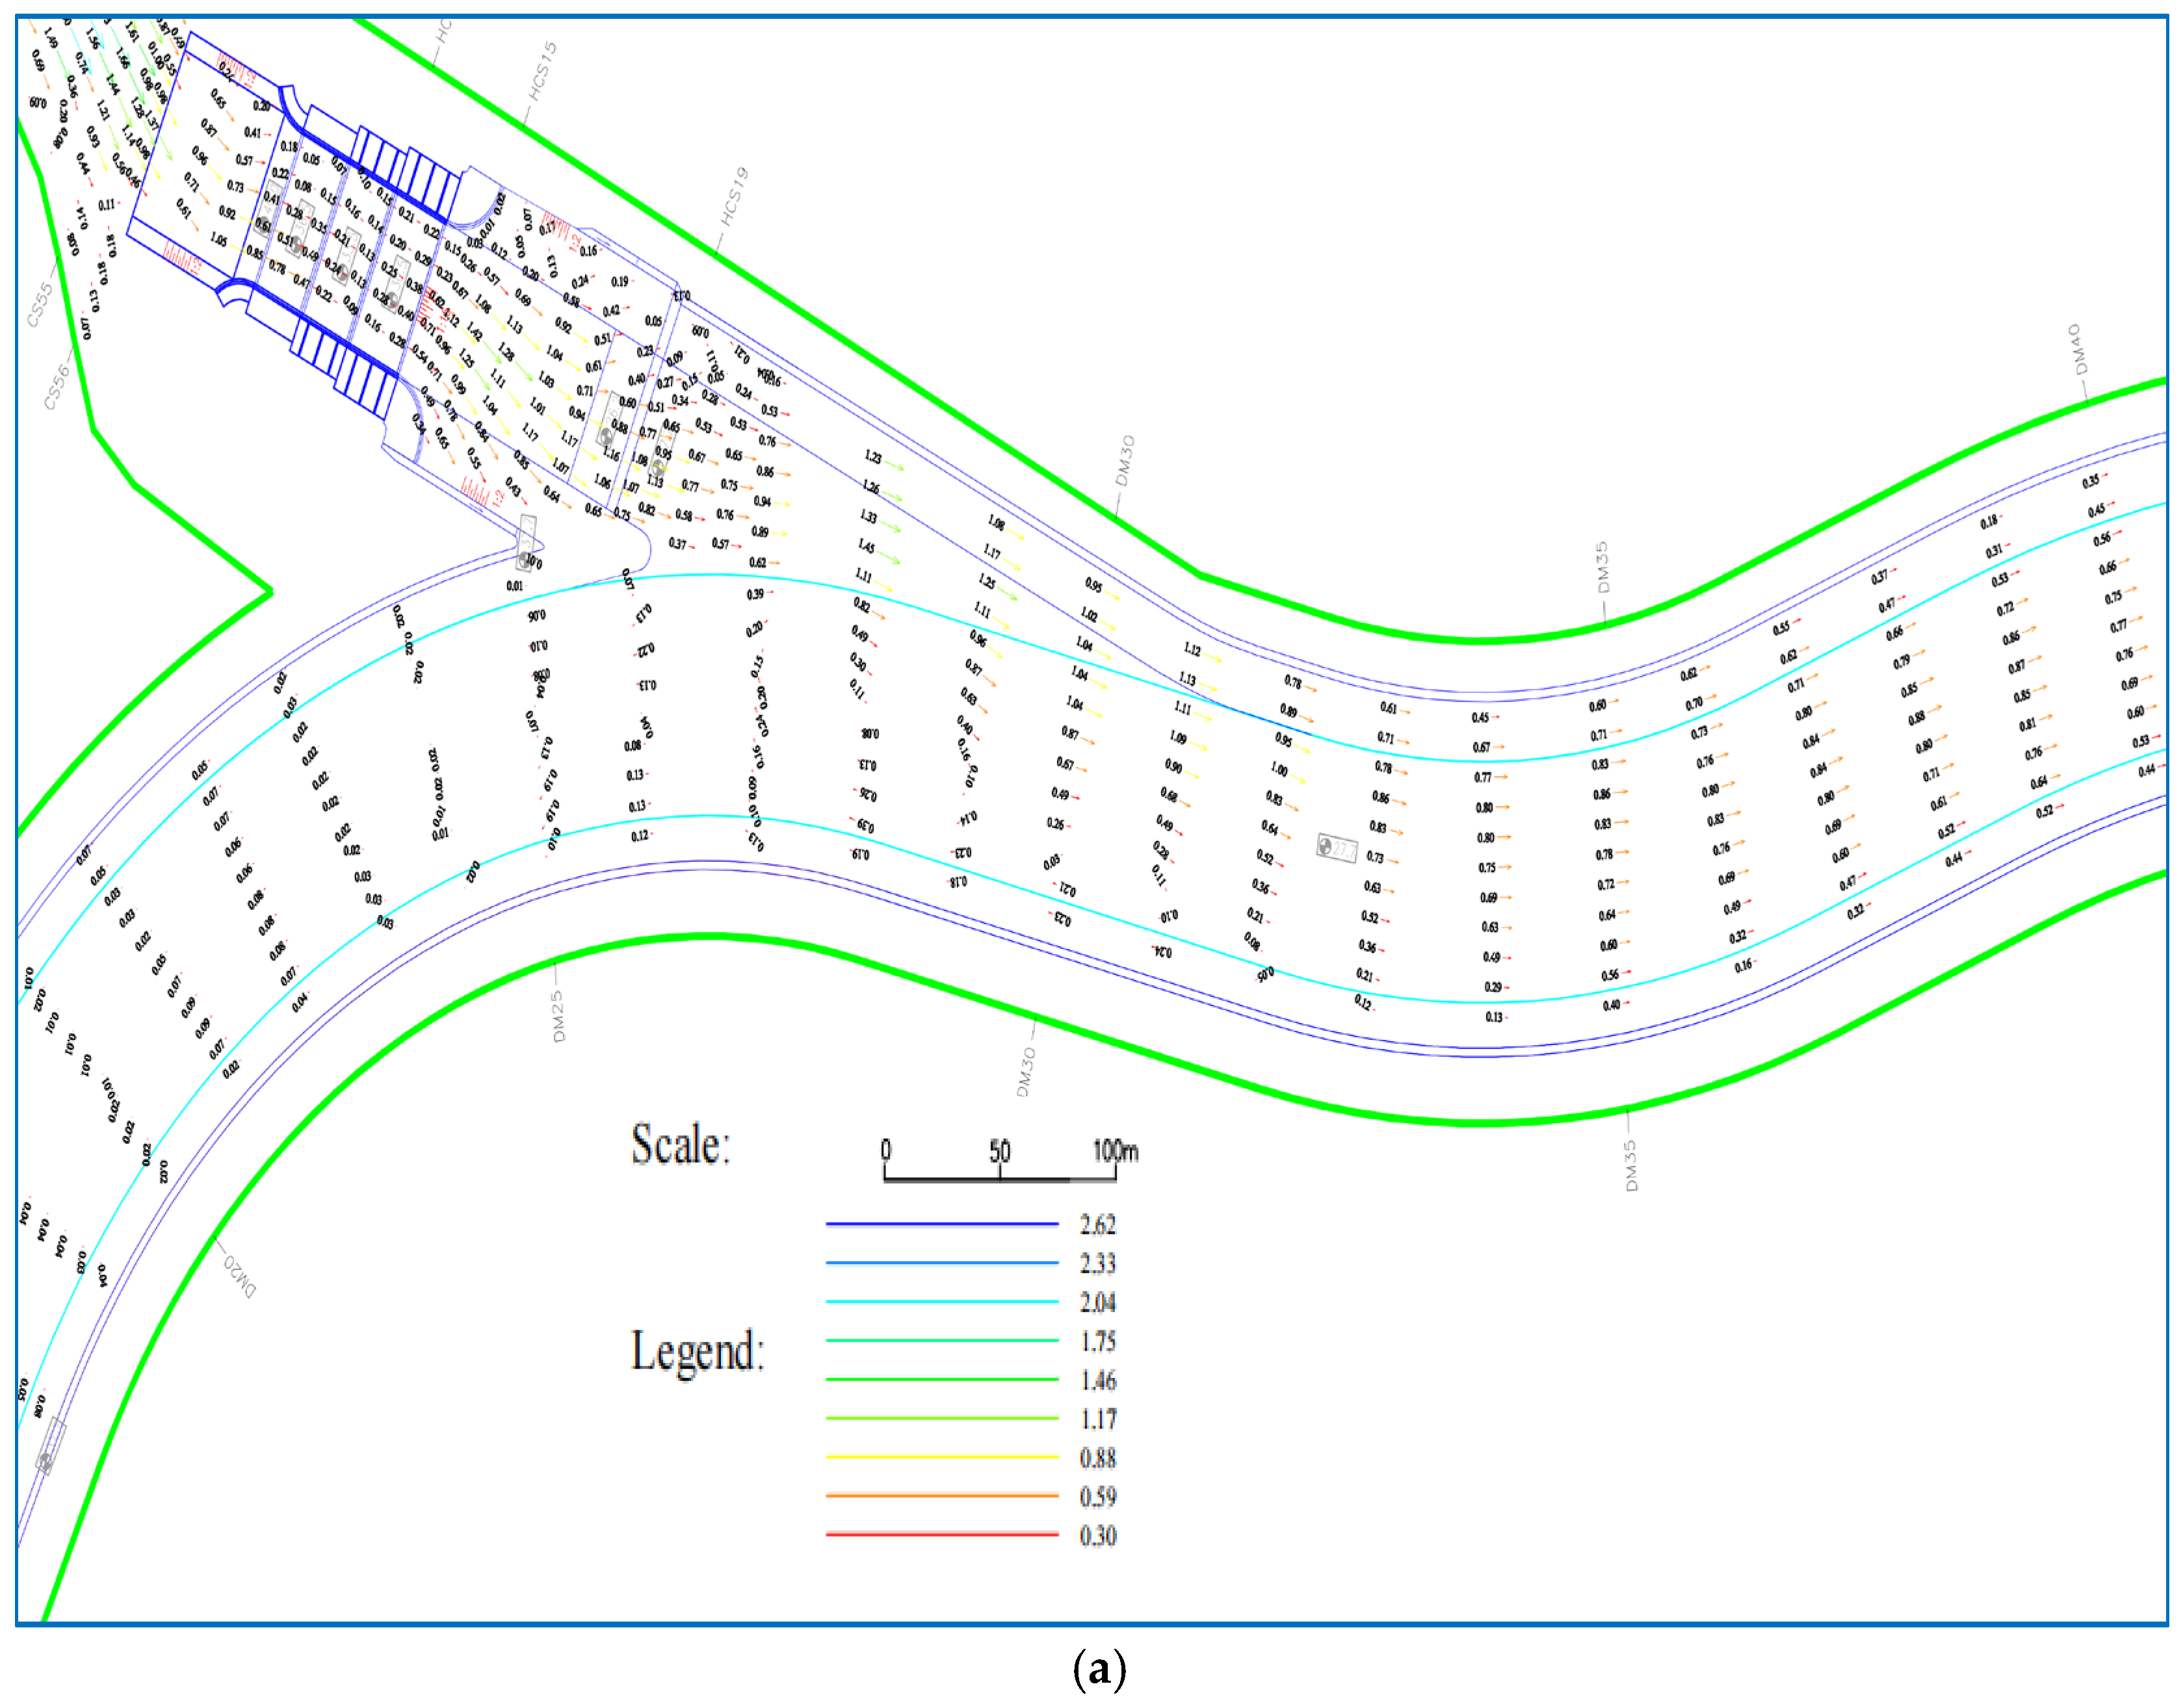
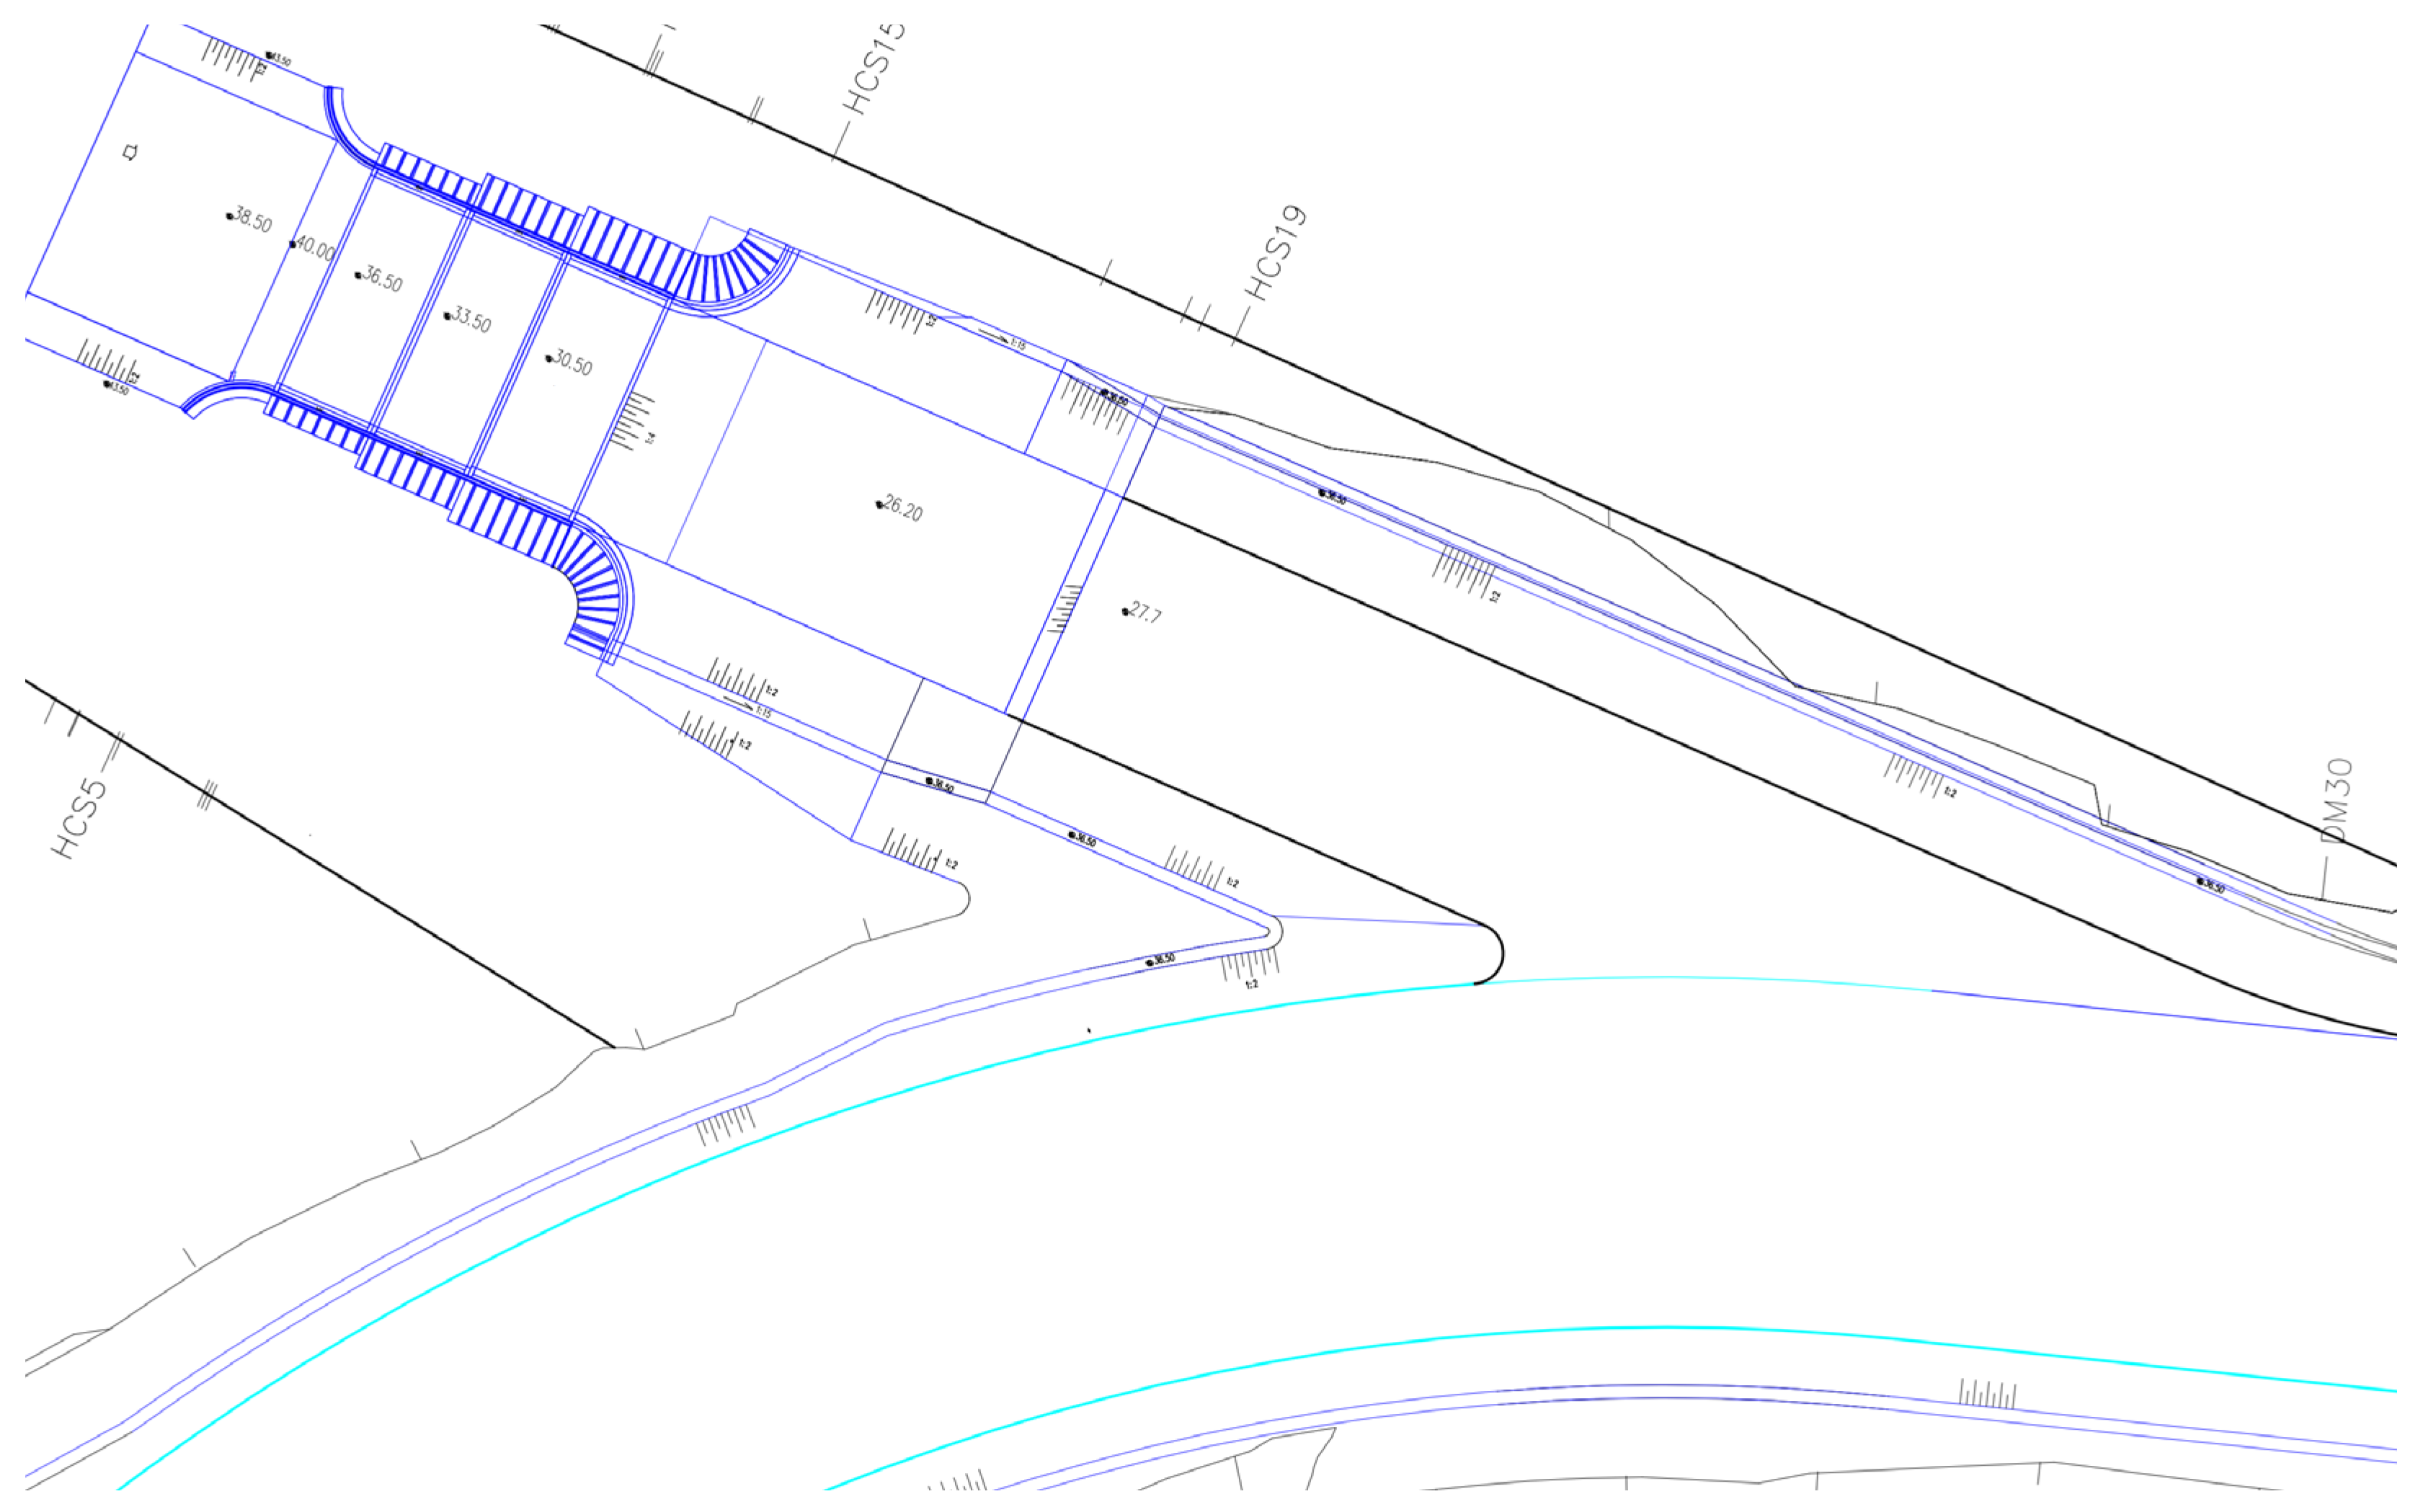
5.1. Measure One: Three-Stage Stilling Basin + 1:15 Slope

The preliminary design scheme for the Jiuzhou section of the Pinglu Canal, combined with the above remediation ideas, is as follows: The main stream section of the model is 2.6 km long. The upstream side of the tributary mouth is 1.2 km long, and the downstream side is 1.4 km long. The tributary section is approximately 1 km long. The stepped stilling pool is designed at the intersection of the trunk and branch. The tributary mouth section is widened from section HCS1 to HCS3 to a bottom elevation of 38. The elevation of the left and right slopes is 43 m, and the slope ratio is 1:2. The bottom width of the sharp bend section of the main stream is widened to 92 m, and the bend radius is increased to 300 m. The inlet angle of the tributary is adjusted from 90° to 0–70°. A stepped stilling basin is designed at the intersection of the main and tributary streams, with the intersection section between HCS3 and HCS19. The inlet of the stilling basin on both sides is connected to the section between HCS2 and HCS5 by an arc-shaped retaining wall with a radius of 18.6 m. The retaining wall is 43 m high, and the height between sections HCS4 and HCS6 is 40 m. The cross-section from HCS14 to HCS15 on both sides of the outlet is connected by a 20 m radius circular retaining wall, and the retaining wall is 43 m high.
The stilling basin is 54.4 m wide and 73 m long in total. The first-stage stilling basin is 22 m long from section HCS6 to HCS7 and has a bottom elevation of 36 m. The first-stage step is 2 m long. The second-stage stilling pool is 22 m long from section HCS9 to HCS10. The bottom elevation is 33.5 m, and the second-stage step is 2 m long. The third-stage stilling basin is 24 m long from section HCS12 to HCS13. The bottom elevation is 30 m. The three-stage step is 1 m long. The outlet of the stilling basin slopes from HCS14 to HCS16 at a ratio of 1:15. The bottom elevation of the slope is 26.2 m. From HCS16 to HCS17, there is a stilling basin with a bottom elevation of 26 m. The elevation from HCS17 to the top of the HCS18 slope is 27.7 m, as shown in Figure 8.
Under Working Condition 1, the flow concentration within the intersection channel increases closer to the left boundary, although overall magnitudes remain low. This results from flow conditioning in the stilling basin, the relatively small angle between the channel centerline and the tributary inflow direction, and the absence of complex flow patterns (Figure 9a). However, despite the stilling basin’s treatment of the tributary inflow, transverse velocities are excessive within the channel. Measurements show a maximum transverse velocity of 0.49 m/s in the left region of section DM34. Furthermore, areas of non-compliant flow velocity occur along the left side of sections DM30-DM32 (transverse scale: 38.15 m; longitudinal scale: ~29.1 m) and nearly encompass the entire cross-section in sections DM33-DM35 (transverse scale: 57.26 m; longitudinal scale: ~47.12 m) (Figure 9b). Consequently, the transverse velocity distribution fails to meet specification requirements.
To further assess flow patterns and water surface fluctuations in the confluence zone, observation points were established at section DM25 (experiencing significant water-level fluctuation within the confluence area) and downstream section DM29. Water-level fluctuations were approximately 33 cm at DM25 and 31.3 cm at DM29. Despite these fluctuations, the flow pattern within the channel remained stable and well-formed.
In the case of Working Condition 2, because there is no flow in the main stream, when the tributary flows into the main stream, there will be partial backflow in the sections DM25-DM30, but after the energy dissipation of the stilling pool, the backflow velocity is small, and the maximum backflow is 0.27 m/s. The flow velocity in the channel of the intersection area is within 2 m/s, and the rest of the flow pattern is good, with the angle between the centerline of the channel and the direction of the incoming flow of the tributary also being relatively small, as shown in Figure 10a. Under this condition, through the energy dissipation effect of the stilling basin, the transverse velocity in the channel range partially exceeds the standard value, the maximum value is 0.35 m/s, and the position is located on the left side of the boundary line of the section DM29 channel. The transverse scale of the area beyond the standard value is 21.07 m, and the longitudinal scale is 22.18 m. The transverse velocity distribution basically meets the requirements of the specifications, as shown in Figure 10b.
Compared with Working Condition 1, Working Condition 2 sets up observation points at the same section, in which the water-level fluctuation difference at section DM25 is about 17.89 cm, and the water-level fluctuation difference at section DM29 is 33.54 cm. The flow pattern in the channel is good and stable.
In summary, the test results are analyzed as follows: This measure adopts the use of the stilling basin to deal with the tributary flow. However, due to the terrain characteristics of typical mountainous rivers, the inflow velocity is fast. In the case of large upstream inflow, the lateral velocity of the confluence area exceeds the standard value in a large range, which needs to be further optimized.

5.2. Measure Two: 1:15 Gentle Slope + Three-Stage Stilling Basin

A 50 m long grit chamber, excavated at the outlet of the three-stage stilling basin of the first structure, has a bottom elevation of 27.7 m. To fully dissipate the energy of the falling tributary flow and block the left-side tributary flow (which enters with a larger inflow angle and higher flow rate) from entering the main stream, a 1:15 slope was constructed. This slope extends from the tail of the grit chamber (elevation 28.7 m) down to a bottom elevation of 26.2 m. Downstream, the channel transitions from section HCS16 to HCS17 by means of a stilling basin with a bottom elevation of 26.7 m. From section HCS17 to HCS18, the top elevation of the slope is 27.7 m, as shown in Figure 11.
The combined flow velocity at the entrance section of the river confluence was measured. Within the channel, the combined flow velocity is below 2.0 m/s, with a maximum value of 1.69 m/s observed on the left side near section DM31. Between sections DM27 and DM30, the large angle between the channel centerline and the main stream results in a more complex flow pattern, as illustrated in Figure 12a. Measurement results indicate that setting a 1:15 gentle slope significantly improved the transverse flow velocity. Consequently, no areas within the confluence section channel exceed the specified velocity limits, meeting the safe navigation standard (Figure 12b). An analysis of flow velocities from sections DM26 to DM36 under Working Condition 1 shows the following:
The maximum combined velocity is 1.69 m/s, occurring at section DM35. The minimum combined velocity is 0.35 m/s, occurring at section DM29. The maximum transverse velocity is 0.30 m/s, occurring at section DM34. The minimum transverse velocity is 0.00 m/s, occurring at sections DM26, DM27, DM29, DM30, DM34, and DM35. In summary, the comparative analysis of the test results for the 1:15 gentle slope combined with a three-stage stilling pool reveals that under Working Condition 1, the energy dissipation effect of this configuration ensures that no flow velocities exceed the standard limits within the channel, enabling safe ship navigation.

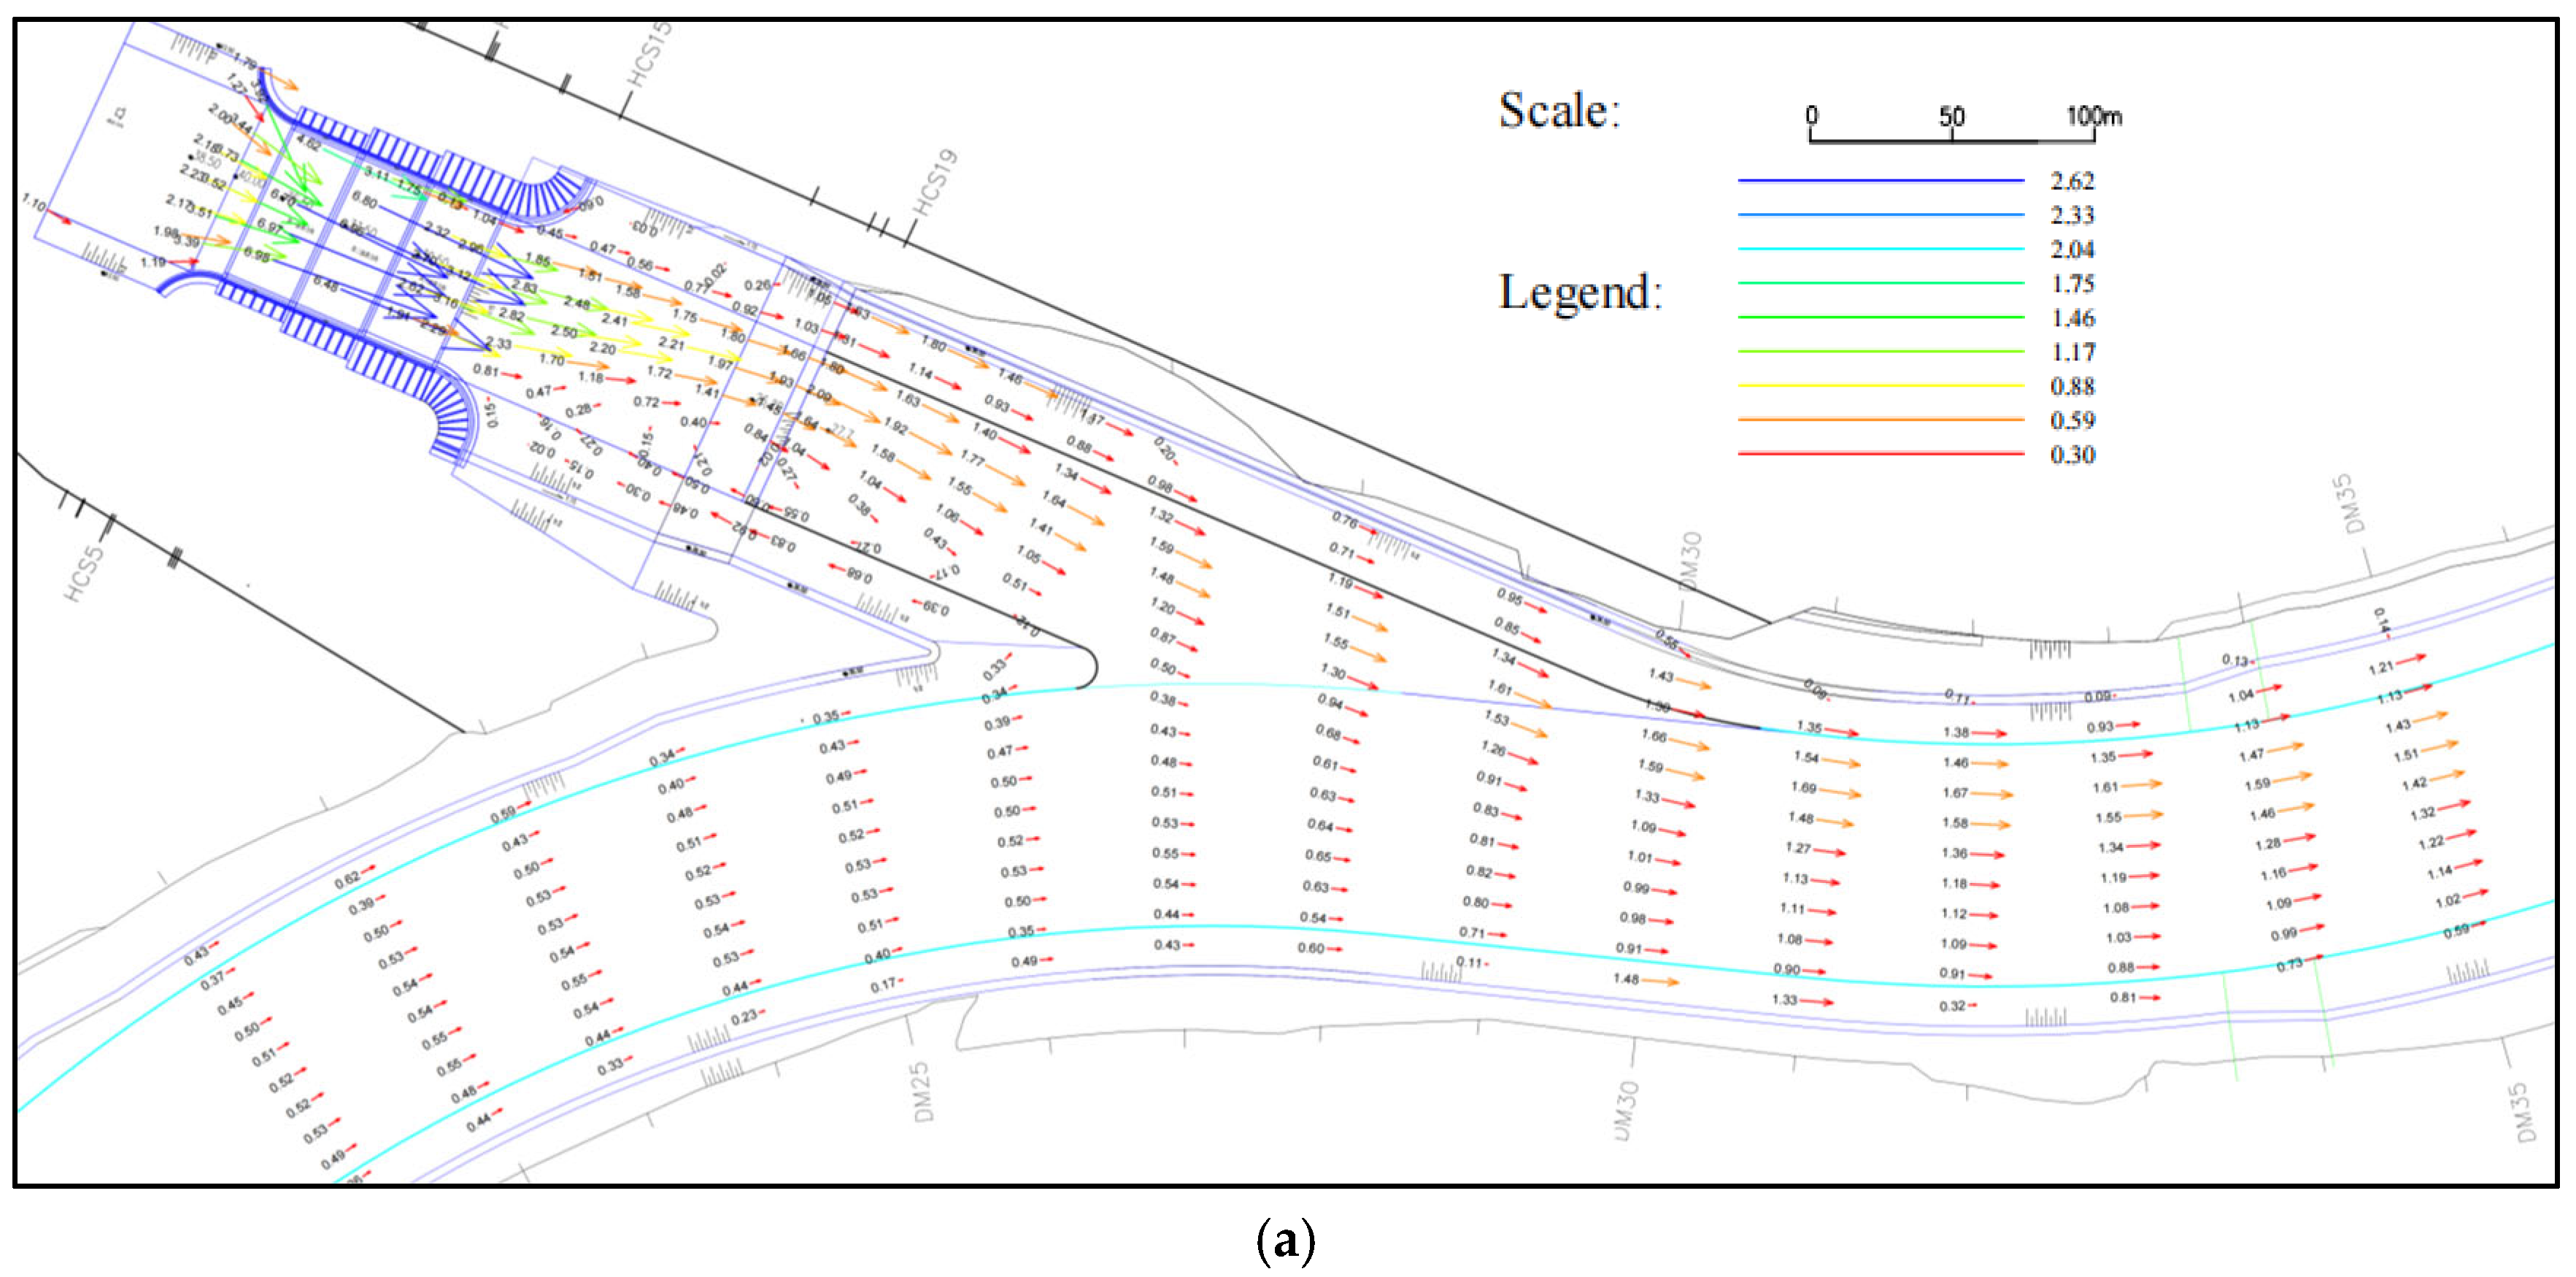
5.3. Measure Three: 1:4 Steep Slope + Three-Stage Stilling Pool

Measure 3 steepened the slope from 1:15 to 1:4. This modification, with an elevation of 26.6 m at the slope toe (Figure 13), aims to reduce the adverse effects of transverse velocity at the confluence of the main stream and tributary on main stream navigation.
Measurement results indicate that the resultant velocity in the entrance channel section improved more significantly due to energy dissipation effects. With a small angle between the channel centerline and the main stream, and the absence of complex flow patterns (Figure 14a), flow conditions remained stable.
In the confluence section, the transverse velocity distribution shows substantial enhancement after implementing the 1:4 steep slope. No areas within this channel section exceed critical velocity thresholds, confirming navigational safety (Figure 14b).
To further evaluate flow patterns and surface fluctuations, observation points were established at upstream section DM25 (model entrance) and downstream section DM29 (near left bank). Water-level fluctuations measured 33.54 cm at DM25 and 44.72 cm at DM29, with stable flow patterns observed throughout the channel.
A comparative analysis of the ‘1:4 steep slope + three-stage stilling pool’ configuration under Working Condition 1 demonstrates a significant reduction in transverse flow velocity. Measured velocities now comply with navigational standards while maintaining optimal flow patterns. This configuration is therefore recommended for implementation.

5.4. Analysis of Results

Following the implementation of Governance Measures 2 and 3, hydraulic conditions show notable improvements. Under Working Condition 1, the channel’s combined flow velocity decreased to 1.69 m/s and 1.58 m/s (0.10 m/s and 0.21 m/s lower than pre-implementation, respectively), while transverse velocities reduced to 0.30 m/s and 0.29 m/s (0.19 m/s and 0.20 m/s lower). Original measures maintained minimal angles between the channel centerline and tributary flow, avoiding complex flow conditions. However, at main stream flow Q = 532 m3/s and tributary flow Q = 340 m3/s, the maximum combined velocity reached 1.79 m/s, with a peak transverse velocity of 0.49 m/s along the left side of section DM34.
Velocity-exceedance zones were observed: a 38.15 m (transverse) × 29.1 m (longitudinal) area in sections DM30–DM32, and a near-full-channel zone in DM33–DM35 spanning 57.26 m × 47.12 m. These transverse velocity distributions failed to comply with specifications. At reduced flows (Q_main stream = 297 m3/s; Q_tributary = 0 m3/s), the maximum velocities were 1.11 m/s (combined) and 0.28 m/s (transverse). Minor backflow (≤0.27 m/s post-energy dissipation) occurred in DM25–DM30 due to tributary inflow against the stagnant main stream, though channel velocities remained <2 m/s with favorable flow alignment.
Measures 2 and 3 (3—featuring a sloped three-stage stilling basin base) enhanced energy dissipation, reducing turbulence and improving hydraulic stability. The slope redirected tributary inflow toward the right bank, decreasing its intersection angle with the main stream bend’s centerline. Post-Measure 2, Condition 1’s peak combined velocity was 1.79 m/s, but complex flow persisted in DM27–DM30 due to misalignment. Measure 2 reduced transverse velocity by 0.19 m/s (to 0.30 m/s) at high flow, eliminating exceedance zones and meeting navigation standards (Figure 14a).
Measure 3 further decreased Condition 1 velocities to 1.58 m/s (combined) and 0.29 m/s (transverse), with main stream velocities 0.10–0.12 m/s lower than in Measure 1. Its 1:4 slope design eliminated exceedance areas and complex flows through improved channel alignment and energy dissipation. Water-level fluctuations measured 33.54 cm at model inlet DM25 and 44.72 cm at left-bank DM29, with stable channel flow throughout.

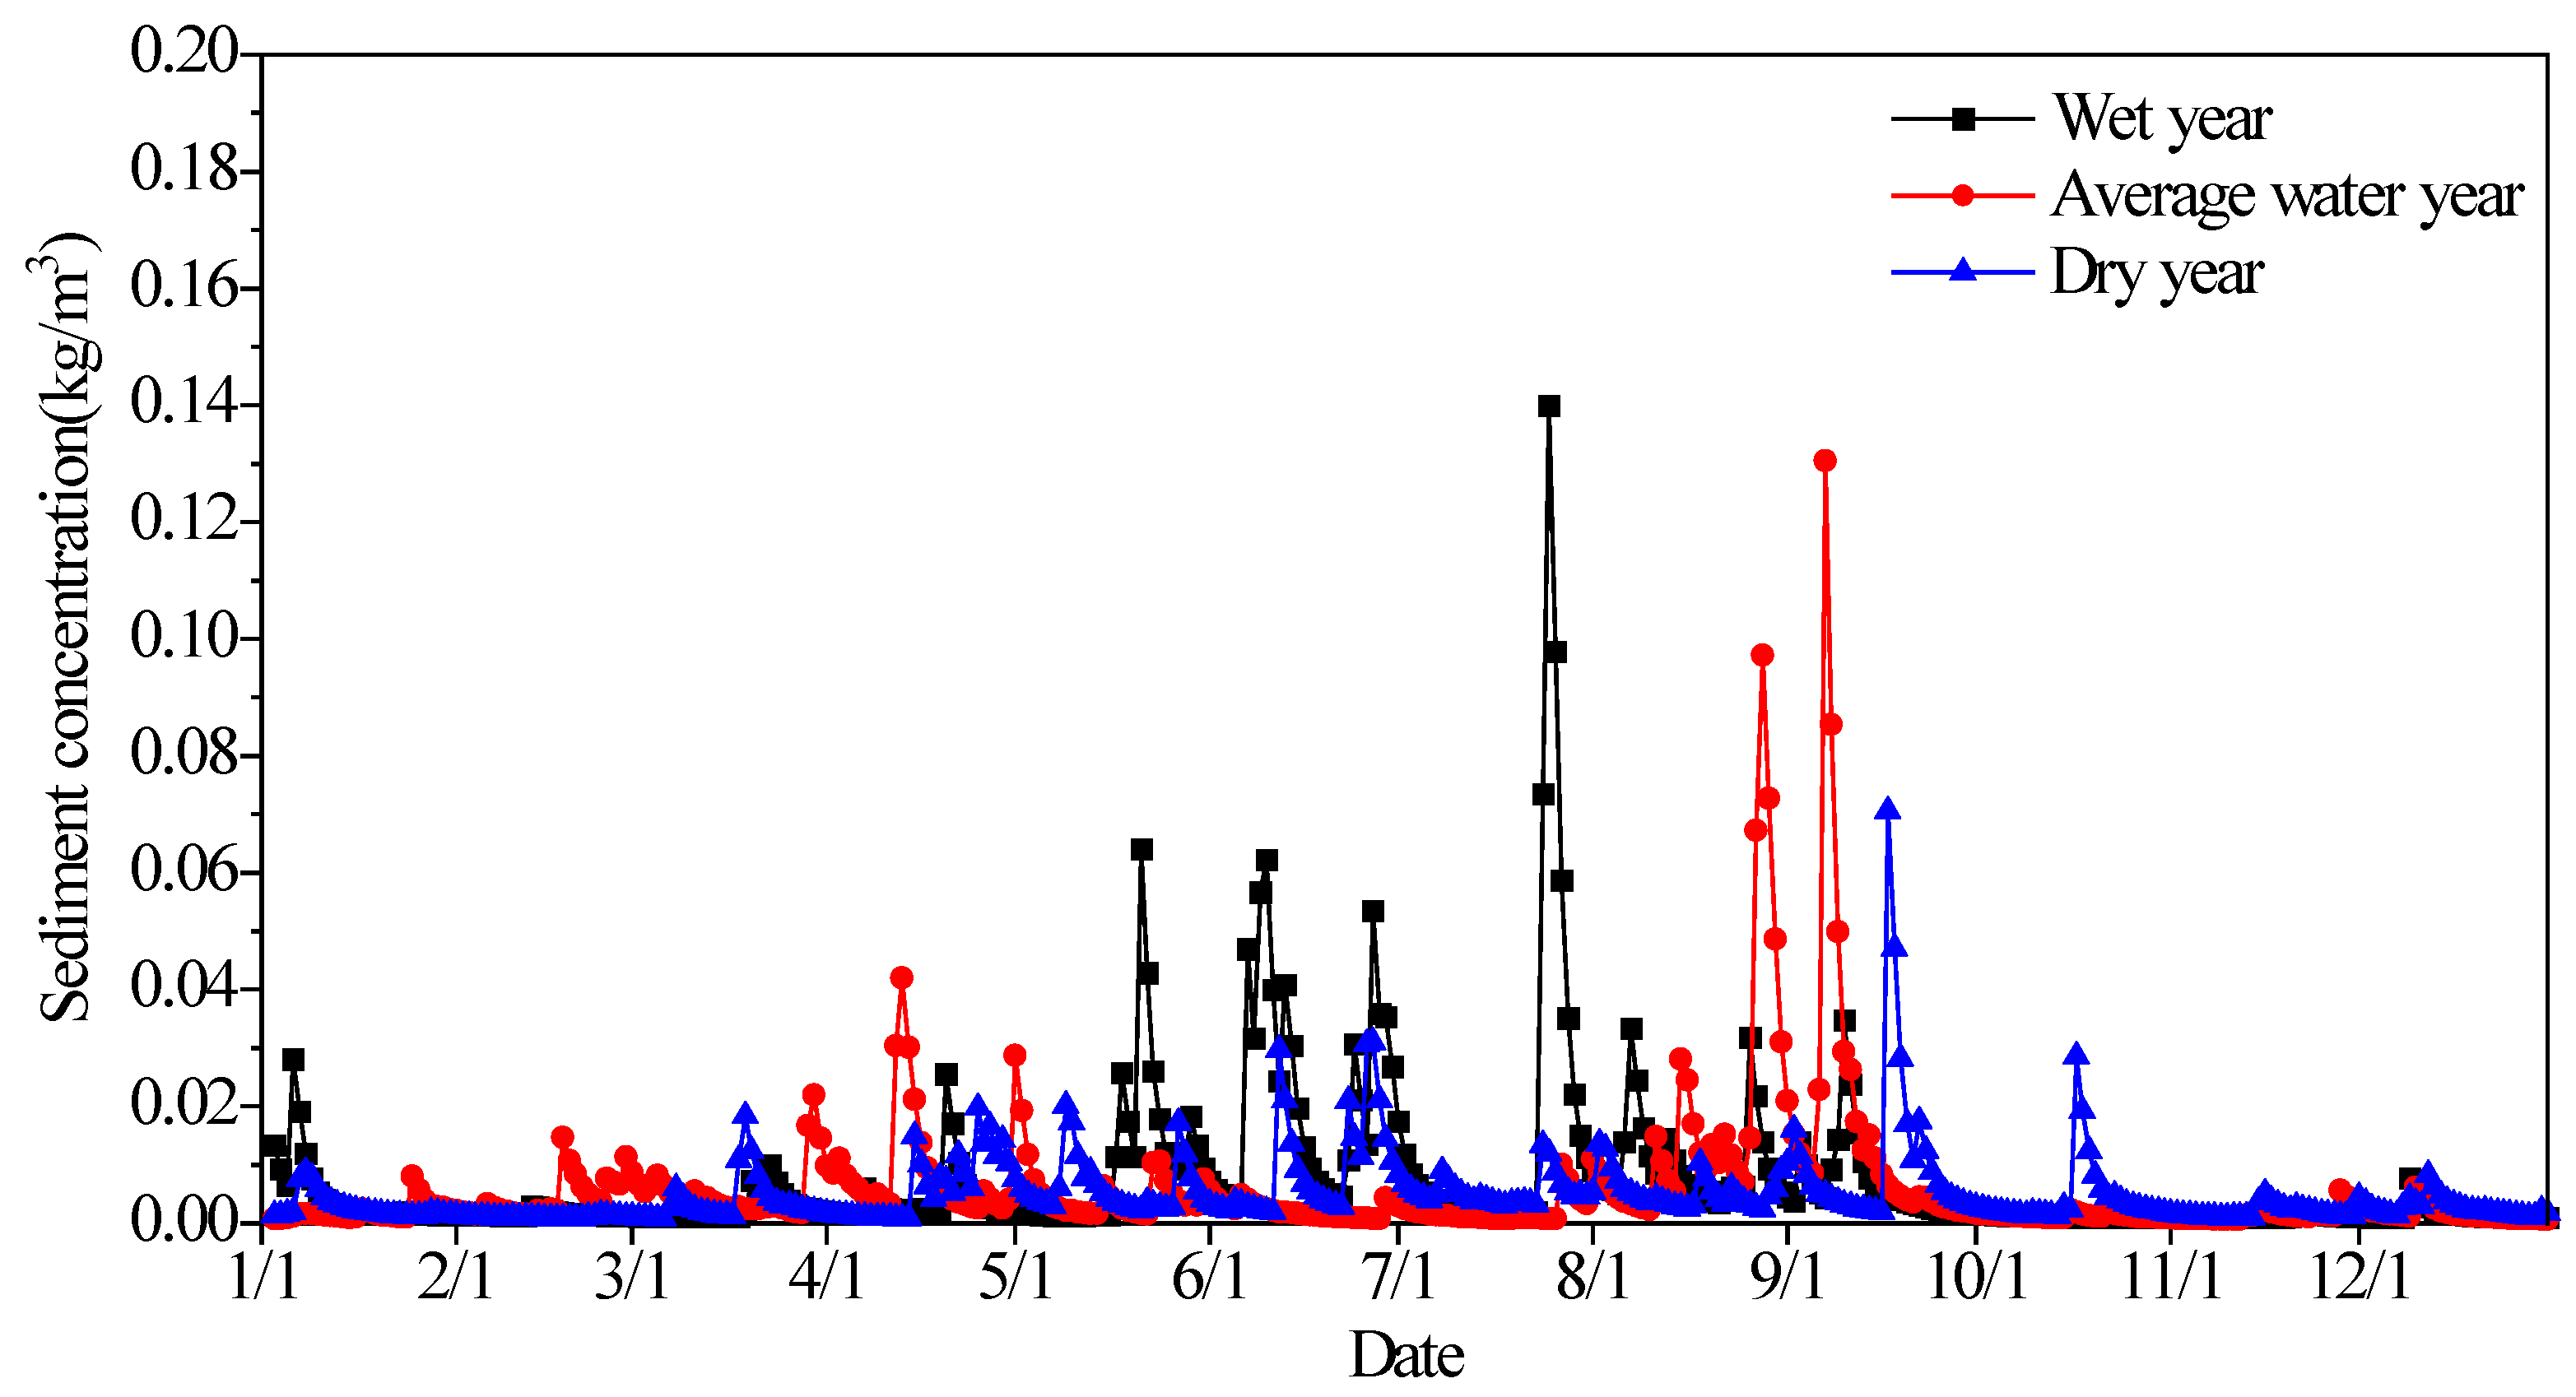
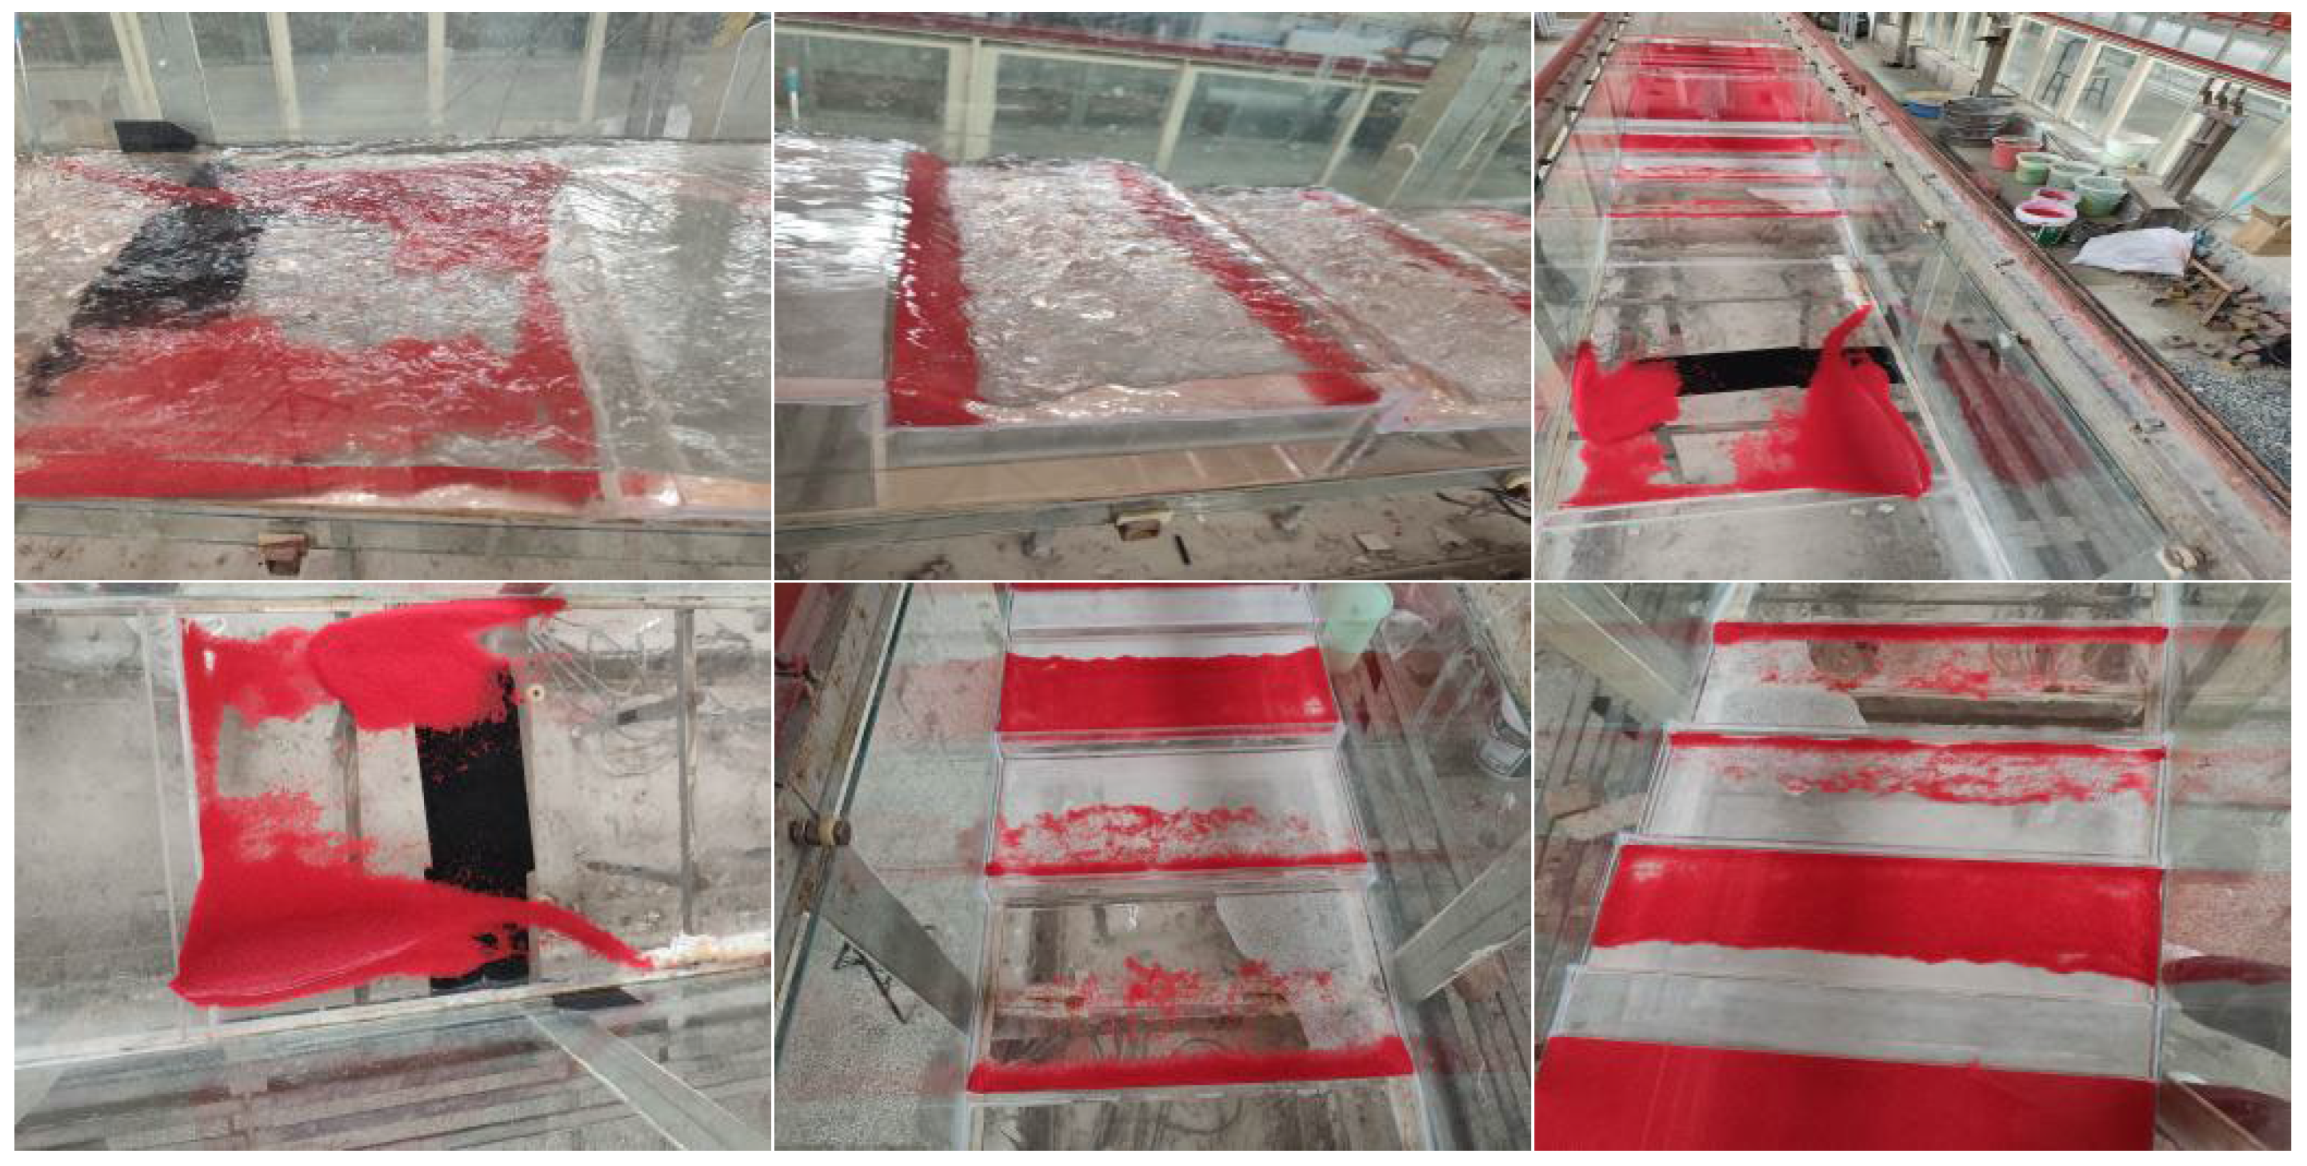
6. Analysis of Sediment Deposition in Tributary Mouth

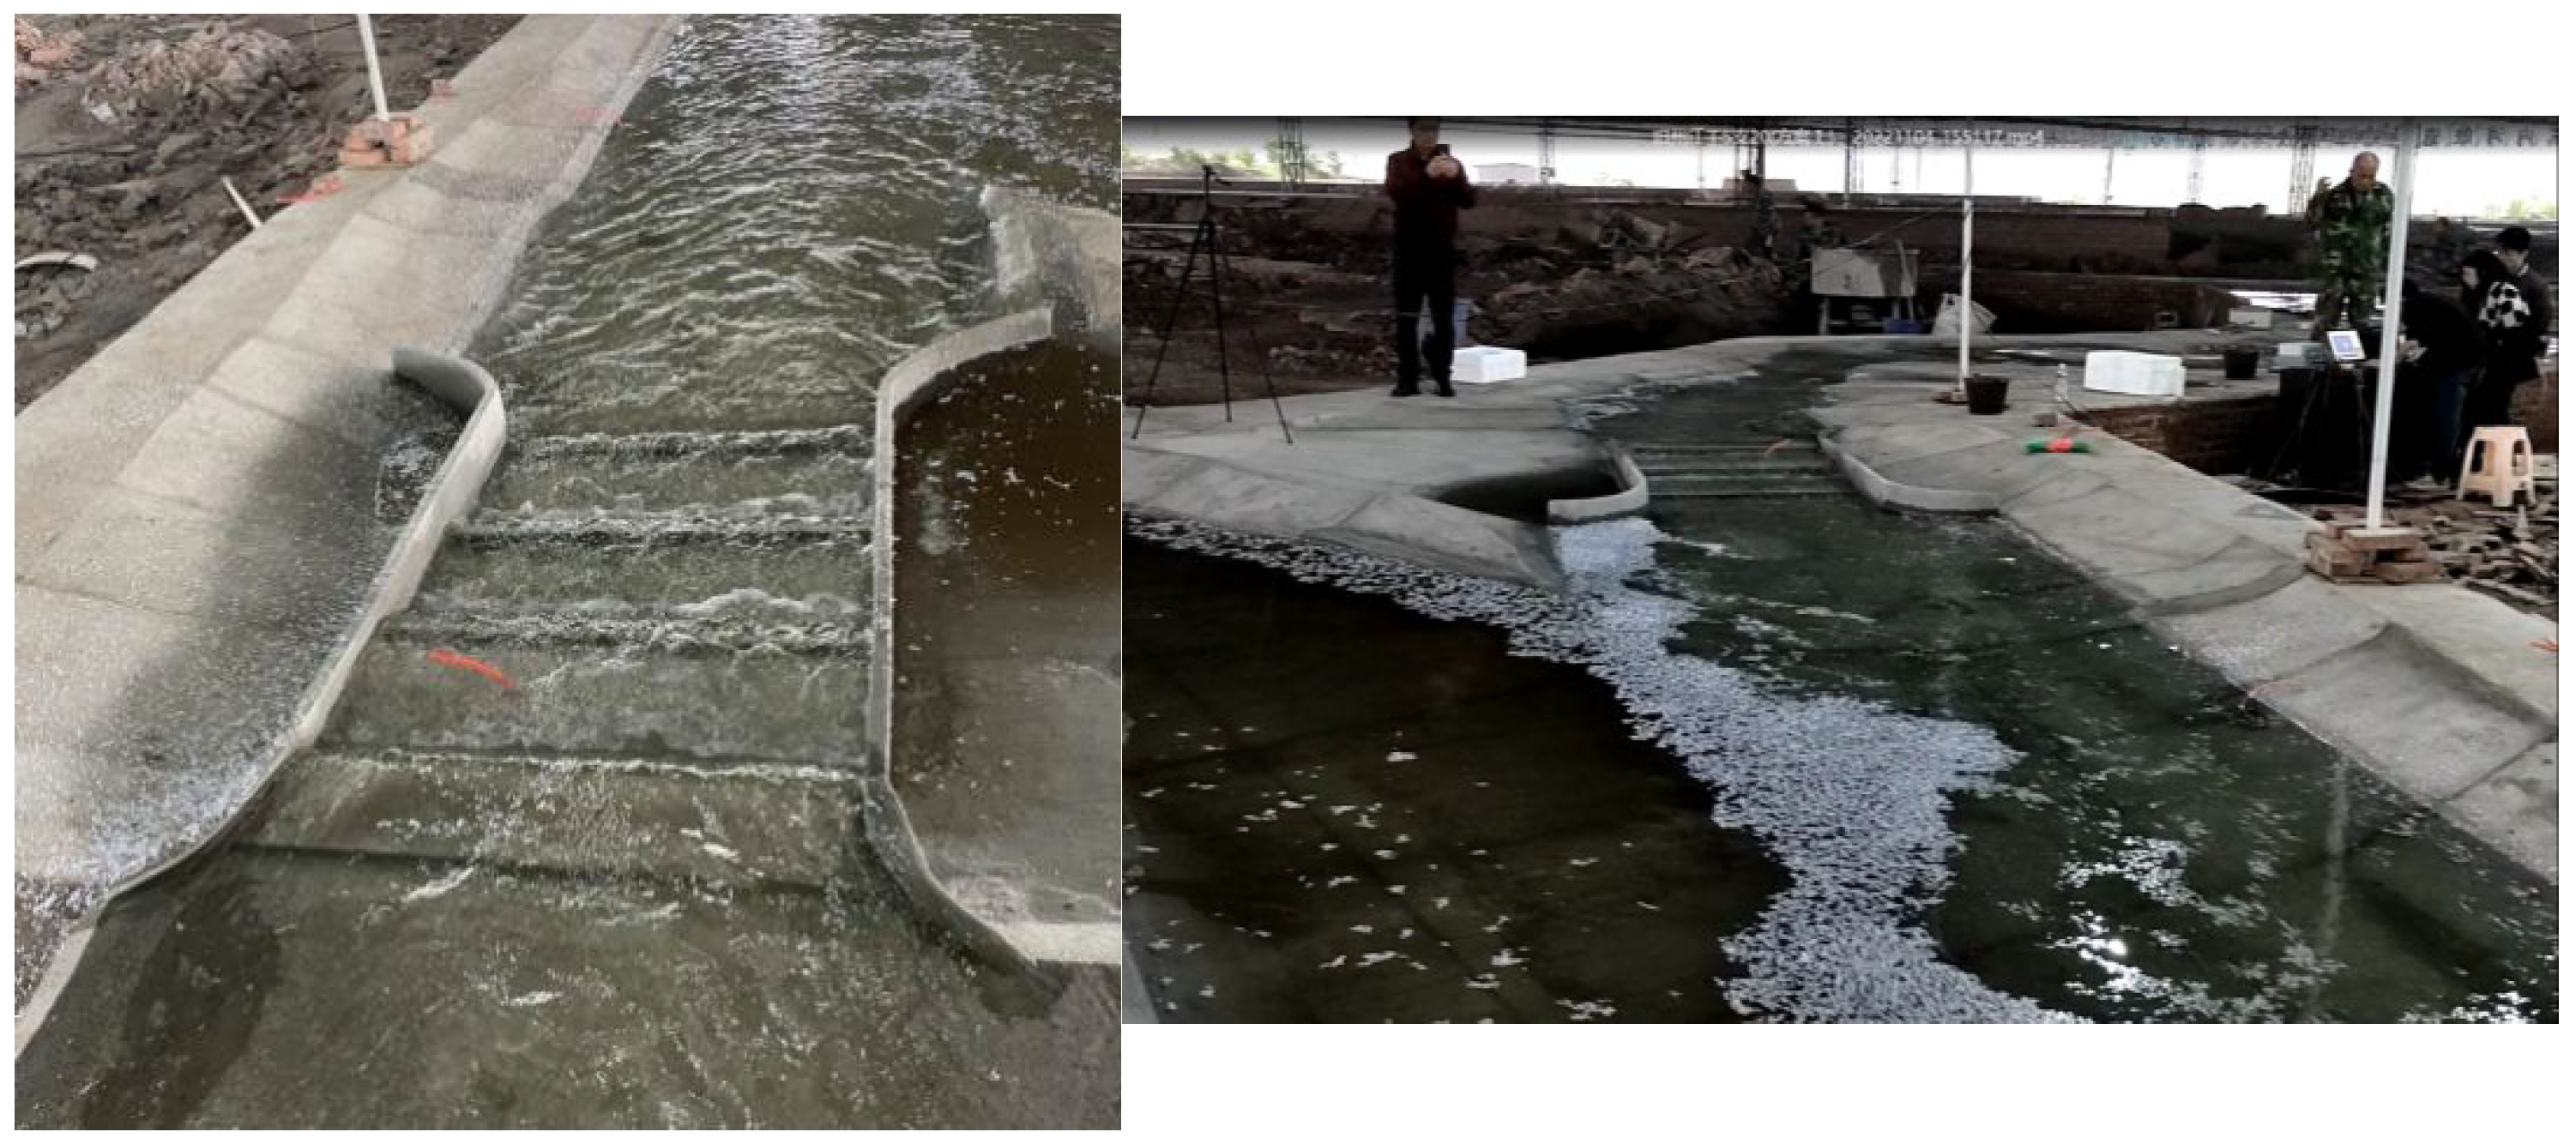
6.1. High-Precision Adjustable-Slope Flume Test System

The 28 m long, high-precision, adjustable-slope flume test system measures 28 m (L) × 0.56 m (W) × 0.7 m (H). Its structure consists of three layers: a base bearing support system with rotating gears for height adjustment; a mid-section steel frame that stabilizes the upper flume and transfers slope adjustments; and an upper glass flume with sidewalls and a floor constructed from 3.3 m (L) × 0.552 m (W) × 0.008 m (thick) glass panels. The flume features a three-stage flow-straightening grille at the inlet for flow conditioning and dual tailgate types (hinged and sluice gates) for coarse/fine flow adjustment. It achieves exceptional precision with a glass installation tolerance of ±0.2 mm, total length tolerance of ±0.5 mm, and structural deformation tolerance of ±0.3 mm. The slope is adjustable from −0.1% to 0.7% via a motorized gear system operating at 5.5 mm/min, ensuring superior performance. Refer to Figure 15 for on-site photos.

6.2. Sediment Deposition Conditions

To validate the sediment deposition and scour effects of Measure 3 under real-world conditions, a physical scale model study was conducted for Operational Cases 1 and 2 at the Jiuzhou River tributary inlet. The experimental setups are illustrated in Figure 16.
Experimental observations revealed that under Working Condition 1, sediment erosion and deposition were highly pronounced. Most sediment accumulated in the first energy dissipater and settling basin, while minimal deposition occurred in the second and third dissipaters. This pattern occurred because lower flow velocities in the primary dissipater allowed significant sediment deposition. As sediment accumulation reached a threshold in the primary dissipater, gradual increases were observed in the secondary and tertiary dissipaters. However, higher downstream flow velocities transported most sediment farther downstream until the 1:4 energy dissipation slope reduced velocities, prompting deposition in the settling basin. Measurements confirmed a sediment retention rate exceeding 94% in the dissipaters and settling basin.
Under Working Condition 2, the influence of flow on sediment transport was reduced at moderate flow velocities, and sediment was essentially intercepted in the first two dissipation basins, with only a very small portion of the sediment carried downstream by the flow in a suspended mass motion. Therefore, Measure 3 demonstrated strong sediment retention efficacy under both scenarios, aligning with mathematical model predictions for tributary sediment deposition.
In summary, compared to the original design and Measure 1, both transverse and longitudinal flow velocities for Measure 2 comply with the land canal navigation standard (Table 3). Although neither Measure 1 nor 2 exhibited areas where transverse velocity exceeded standards, the large angle between the channel centerline and main stream in the DM27-to-DM30 reach under Optimization Scheme 1 creates complex flow patterns that significantly impact ship navigation. Considering engineering feasibility, cost-effectiveness, and environmental compatibility, the recommended treatment measure is Measure 3: the 1:4 steep slope with the three-stage stilling basin.

7. Conclusions

This study investigated the effectiveness of combined energy dissipation structures in managing complex flow characteristics at the confluence of the Jiuzhou River tributary with the Pinglu Canal main channel, characterized by a large confluence angle (~90°), significant bed elevation difference (~9.7 m), and high flow discharge ratio. Physical modeling at a 1:50 scale led to the following key conclusions:
(1)
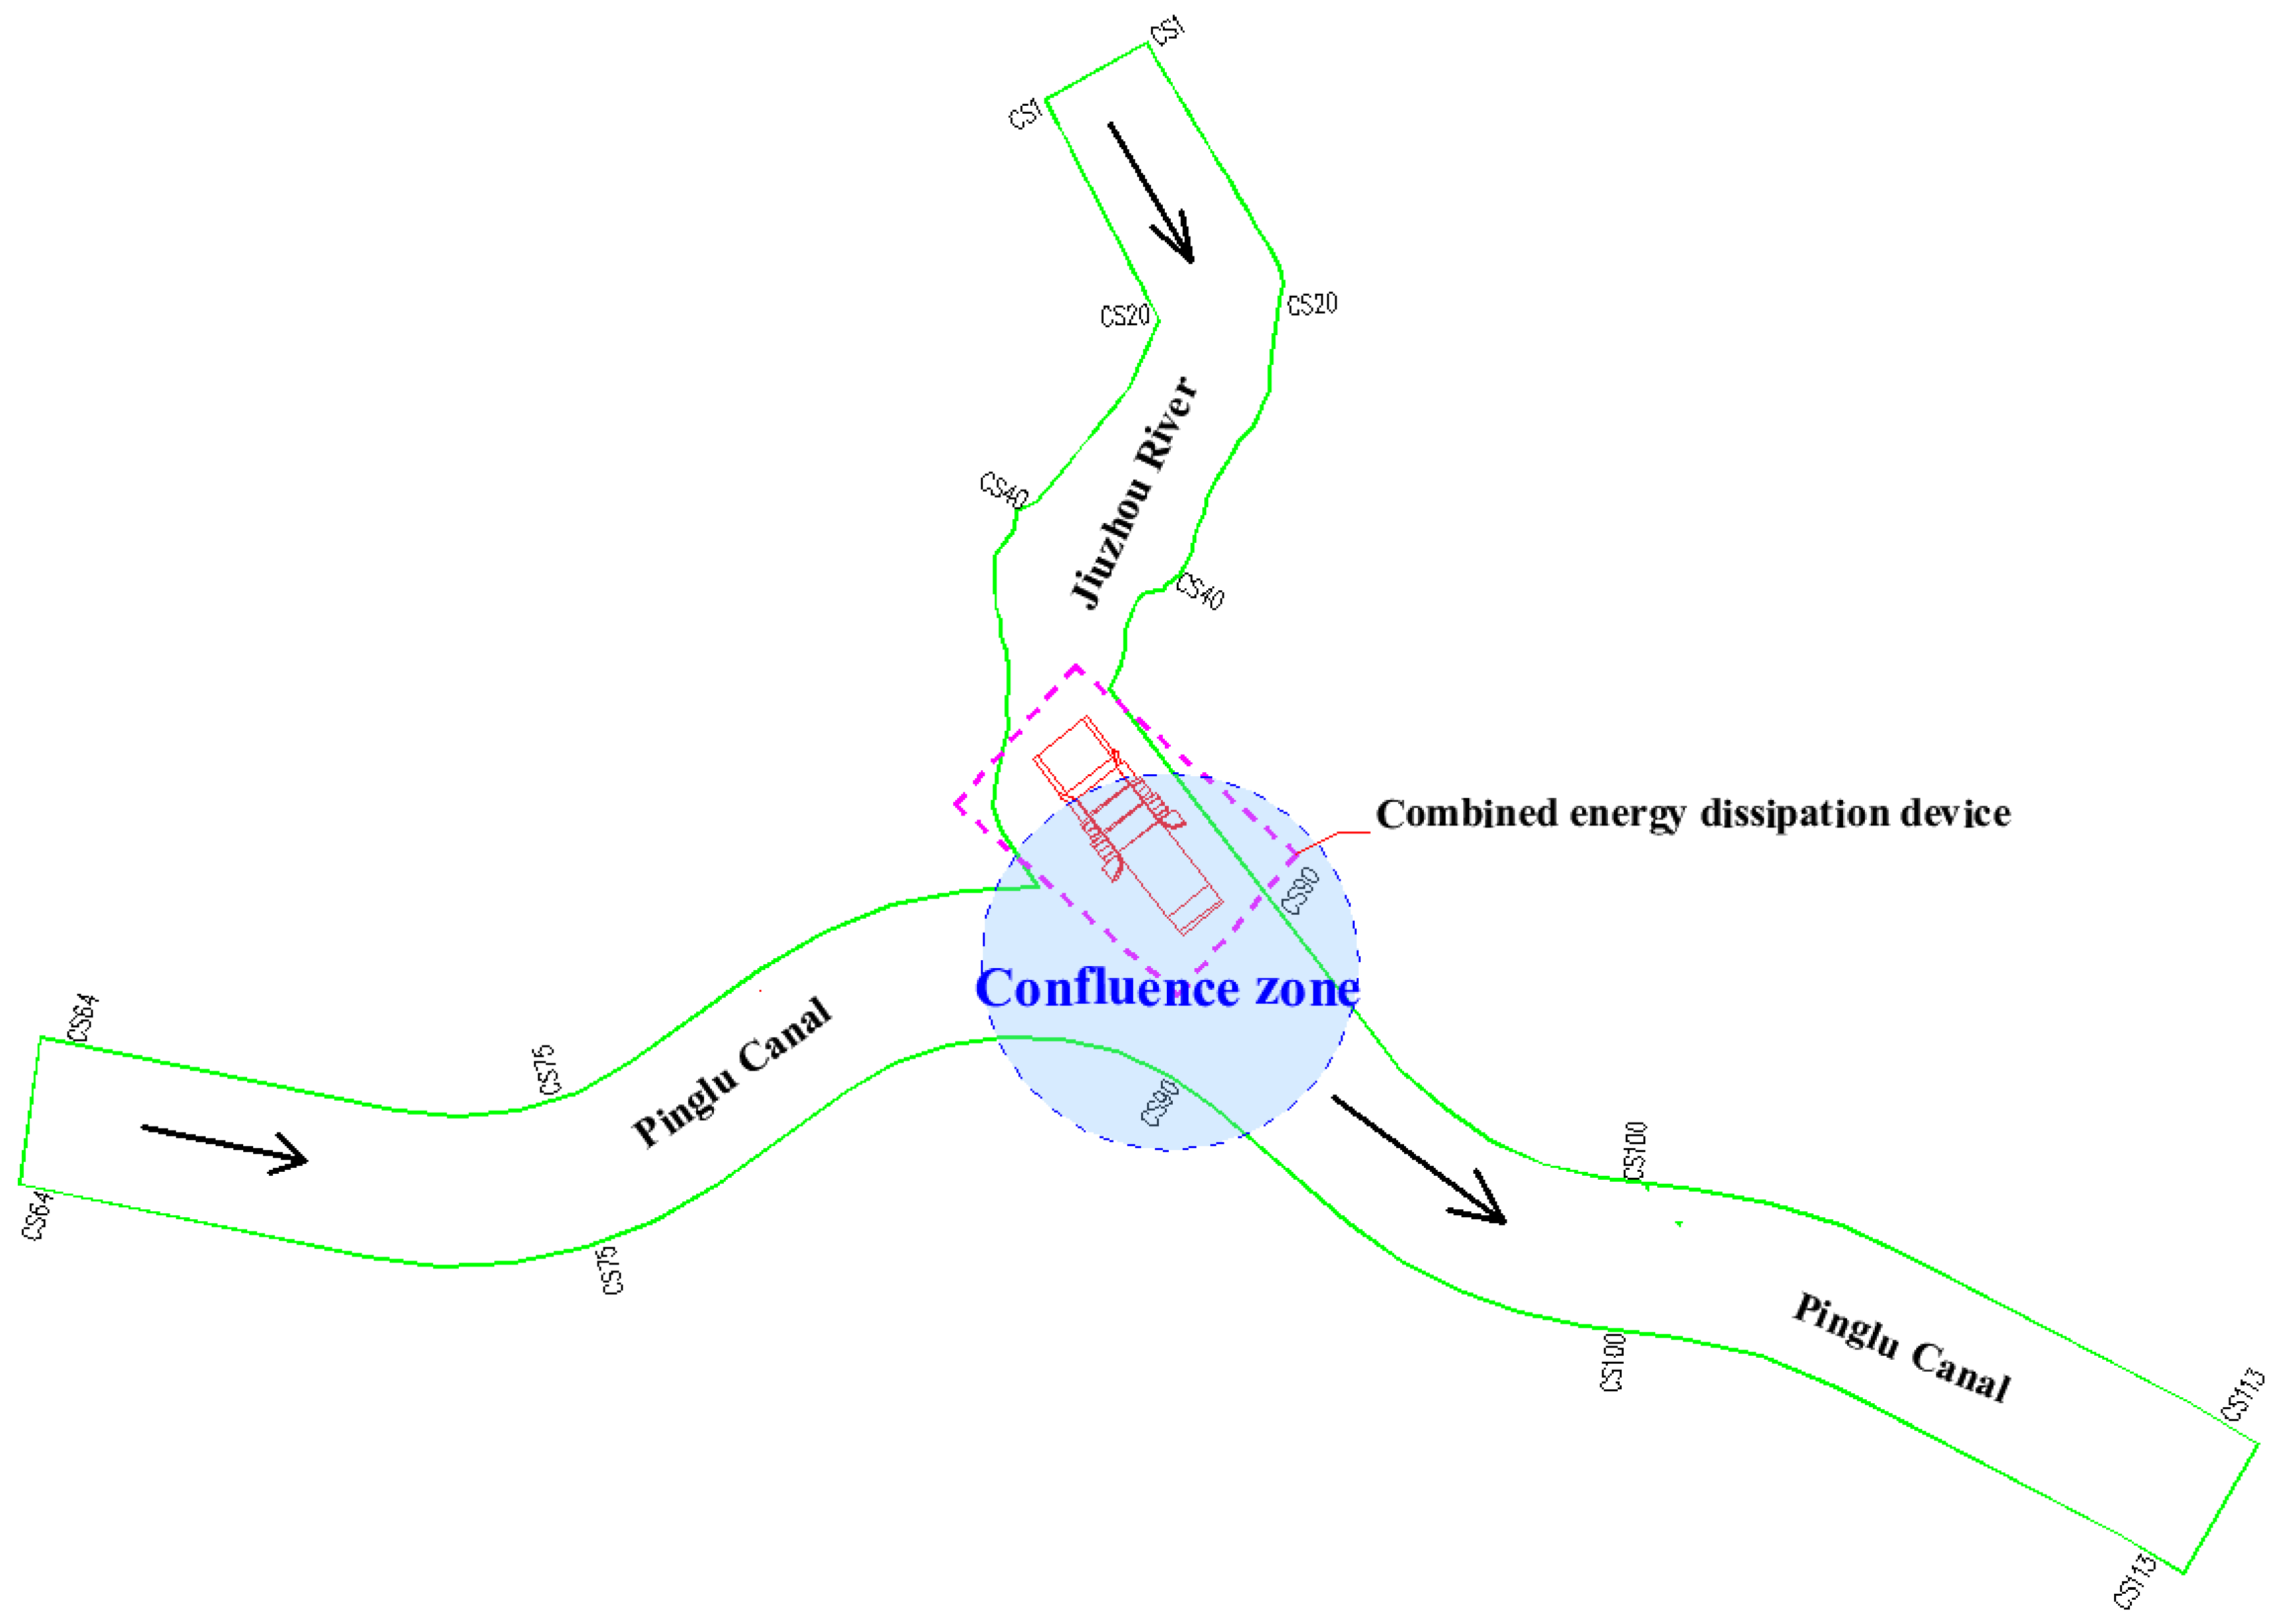
Effective Solution for Complex Confluences: The integrated structure featuring a 1:4 steep slope connected to a three-stage stilling basin proved to be the optimal solution for mitigating adverse navigational flow conditions under such challenging confluence geometry. This combined dissipator effectively addressed the high-energy inflow and large elevation drop.
(2)
Significant Flow Improvement: The implementation of this steep slope + three-stage basin scheme drastically improved the flow field within the navigation channel. Under high-flow conditions (tributary Q = 532 m3/s, main channel Q = 340 m3/s), the maximum longitudinal velocity was reduced to 1.58 m/s and the maximum transverse velocity was reduced to 0.29 m/s. These values are well within the Class I waterway navigation safety standards (longitudinal ≤ 2.5 m/s, transverse ≤ 0.3 m/s).
(3)
Elimination of Flow Hazards: The optimized scheme completely eliminated the large areas of excessive transverse velocity and complex, disturbed flow patterns (such as oversized recirculation zones) observed in the initial design and other tested schemes (e.g., single three-stage basin, gentle slope + basin). Flow stability was achieved, particularly in the critical confluence reach (sections DM27-DM35), maintaining favorable flow patterns even amidst significant water-level fluctuations.
(4)
Superiority over Alternatives: Comparative analysis demonstrated the clear advantage of the 1:4 steep slope + three-stage basin (Measure 3) over the single three-stage basin (Measure 1) and the 1:15 gentle slope + basin (Measure 2). Measure 1 suffered from widespread transverse velocity exceedance and complex flows. Measure 2 met velocity standards but still exhibited potentially disruptive flow patterns due to unfavorable flow angles in the bend confluence area. Measure 3 not only met all velocity standards but also achieved stable flow alignment and efficiently dissipated energy before significant interaction with the main channel flow. The steep slope structure also aided in deflecting the tributary inflow toward the right bank, optimizing the confluence angle.
(5)
Effective Sediment Management: Physical sediment modeling confirmed the high sediment retention efficiency of the recommended combined dissipator. Under high-flow conditions (Condition 1), retention rates exceeded 94%, primarily depositing sediment in the first-stage basin and downstream settling basin. Under moderate flow (Condition 2), retention reached near 100%. This significantly minimizes sediment intrusion into the high-velocity sections of the dissipators and the main navigation channel, reducing long-term maintenance requirements.
(6)
Current research on diverse combinations of complex conditions within river basins remains limited. Establishing effective navigation management strategies for waterway systems integrating such multifaceted scenarios would significantly advance future waterway regulation efforts.
(7)
Compared to previous studies, while a single stepped stilling basin demonstrates excellent energy dissipation efficacy under conventional conditions, it proves inadequate for achieving effective energy reduction in trans-basin river systems under complex scenarios. In this study, the combined energy dissipation system has demonstrated remarkable performance in effectively resolving the challenges posed by high-energy inflows and significant elevation drops. Consequently, the combined deployment of multiple energy dissipators becomes imperative.
(8)
Practical Significance: Considering the demonstrated improvements in navigational flow safety, effective sediment control, structural feasibility, and cost-effectiveness, the 1:4 steep slope combined with the three-stage stilling basin is strongly recommended as the optimal remediation measure for the Jiuzhou River confluence into the Pinglu Canal.
Overall, this research demonstrates that the integrated design of a steep slope (1:4) and a three-stage stilling basin provides a robust and effective solution for ensuring navigational safety and managing sediment at the tributary confluences of large-scale canal systems characterized by challenging geometry (large angle, high bottom drop, large flow ratio). This provides an empirical basis for the waterway regulation of trans-basin river systems under multiple integrated complex conditions, and it offers a practical design framework for similar confluence structures in trans-basin waterway projects.

Author Contributions

Conceptualization, L.H.; Methodology, L.H.; Software, K.D.; Validation, J.H.; Formal analysis, T.Y.; Investigation, K.D.; Data curation, T.Y.; Writing—original draft, K.D.; Writing—review & editing, L.H.; Funding acquisition, J.H. All authors have read and agreed to the published version of the manuscript.

Funding

This work is supported by the National Key Research and Development Program of China (Grant No.: 2023YFB2604700) and Guangxi Science and Technology Major Project (Grant No.: AA23023009) and Joint Cultivation Base for Graduate Students in Civil and Hydraulic Engineering established by Chongqing Jiaotong University & Chongqing Shipping Engineering Survey and Design Institute of the Yangtze River (Grant No.: JDLHPYJD2019001).

Data Availability Statement

The date pertaining to this study are available in the article’s Results section; further inquiries can be directed to the corresponding author.

Conflicts of Interest

Junhui He was employed by Pinglu Canal Group Co.,Ltd. The remaining authors declare that the research was conducted in the absence of any commercial or financial relationships that could be construed as a potential conflict of interest.

References

  1. Zhou, Y.; Wu, J.; Ma, F.; Hu, J. Uniform flow and energy dissipation of hydraulic-jump-stepped spillways. Water Sci. Technol. Water Supply 2020, 20, 1546–1553. [Google Scholar] [CrossRef]
  2. Tian, Y.; Li, Y.; Sun, X. Study on the Hydraulic Characteristics of the Trapezoidal Energy Dissipation Baffle Block-Step Combination Energy Dissipator. Water 2022, 14, 2239. [Google Scholar] [CrossRef]
  3. Salmasi, F.; Abraham, J. Effect of slope on energy dissipation for flow over a stepped spillway. Water Sci. Technol. Water Supply 2022, 22, 5056–5069. [Google Scholar] [CrossRef]
  4. Zhang, T.; Wu, C.; Lu, H.; Zheng, Z. 3-D numerical simulation of flow on stepped spill way combined with X-shape flaring gate piers. J. Hydraul. Eng. 2004, 8, 15–20. (In Chinese) [Google Scholar]
  5. Stojnic, I.; Pfister, M.; Matos, J.; Schleiss, A.J. Airwater flow in a plain stilling basin below smooth and stepped chutes. J. Hydraul. Res. 2023, 61, 51–66. [Google Scholar] [CrossRef]
  6. Hashjani, T.S. Hydraulic Study of Secondary Stilling Basins; University of Windsor: Windsor, Canada, 1997. [Google Scholar]
  7. Feng, Z.; Li, Y.; Tian, Y.; Li, Q. Effects of Energy Dissipation Pier Arrangements on the Hydraulic Characteristics of Segmented Pier-Type Step Energy Dissipator Structures. Water 2022, 14, 3590. [Google Scholar] [CrossRef]
  8. Chavhan, V.; Hinge, G. Trajectory features and energy dissipation of conventional and modified (Deflector) Ski-Jump bucket. Mater. Today Proc. 2021, 49, 1973. [Google Scholar] [CrossRef]
  9. Nikseresht, A.H.; Talebbeydokhti, N.; Rezaei, M.J. Numerical simulation of two-phase flow on step-pool spillways. Sci. Iran. 2013, 2, 222–230. [Google Scholar]
  10. Ghaderi, A.; Abbasi, S.; Francesco, S.D. Numerical Study on the Hydraulic Properties of Flow over Different Pooled Stepped Spillways. Water 2021, 13, 710. [Google Scholar] [CrossRef]
  11. Guenther, P.; Felder, S.; Chanson, H. Flow aeration, cavity processes and energy dissipation on flat and pooled stepped spillways for embankments. Environ. Fluid Mech. 2013, 13, 50. [Google Scholar] [CrossRef]
  12. Ghobadian, R.; Tabar, Z.S.; Koochak, P. Numerical study of junction-angle effects on flow pattern in a river confluence located in a river bend. Water SA 2016, 42, 43–51. [Google Scholar] [CrossRef]
  13. Pourvahedi, M.; Hosseini, K.; Mousavi, S.F.; Geranmayeh, K. Effect of geometry and hydraulic parameters on the bed morphology in a confluence using numerical approach. Appl. Water Sci. 2023, 13, 180. [Google Scholar] [CrossRef]
  14. Guillén Ludeña, S.; Cheng, Z.; Constantinescu, G.; Franca, M.J. Hydrodynamics of mountain-river confluences and its relationship to sediment transport. J. Geophys. Res. Earth Surf. 2017, 122, 901–924. [Google Scholar] [CrossRef]
  15. Liu, X.; Li, L.; Hua, Z.; Tu, Q.; Yang, T.; Zhang, Y. Flow Dynamics and Contaminant Transport in Y-Shaped River Channel Confluences. Int. J. Environ. Res. Public Health 2019, 16, 572. [Google Scholar] [CrossRef] [PubMed]
  16. Penna, N.; De Marchis, M.; Canelas, O.B.; Napoli, E.; Cardoso, A.H.; Gaudio, R. Effect of the Junction Angle on Turbulent Flow at a Hydraulic Confluence. Water 2018, 10, 469. [Google Scholar] [CrossRef]
  17. Mosley, M.P. An experimental study of channel confluences. J. Geol. 1976, 84, 538–562. [Google Scholar] [CrossRef]
  18. Bradbrook, K.F.; Lane, S.N.; Richards, K.S. Role of Bed Discordance at Asymmetrical River Confluences. J. Hydraul. Eng. 2001, 127, 351–368. [Google Scholar] [CrossRef]
  19. Canelas, O.B.; Ferreira, R.M.L.; Guillén-Ludea, S.; Alegria, F.C.; Cardoso, A.H. Three-dimensional flow structure at fixed 70° open-channel confluence with bed discordance. J. Hydraul. Res. 2019, 58, 434–446. [Google Scholar] [CrossRef]
  20. Zhao, D.Z.; Li, Y. Effect of surface tension on hydraulic model test. J. Hydraul. Eng. 2004, 4, 38–41. (In Chinese) [Google Scholar] [CrossRef]
Figure 1. Inter-basin relationship map for the Pinlu Canal.
Water 17 02214 g001
Figure 2. Suspended sediment concentration process of Jiuzhou River.
Water 17 02214 g002
Figure 3. Flow process of Jiuzhou River.
Water 17 02214 g003
Figure 4. Physical model of the confluence section of the Jiuzhou River tributary.
Water 17 02214 g004
Figure 5. Point-level water gauge and its measuring principles.
Water 17 02214 g005
Figure 6. Surface flow measurement principle.
Water 17 02214 g006
Figure 7. Layout of Jiuzhou River entrance model.
Water 17 02214 g007
Figure 8. Layout plan of three-stage stilling basin + 1:15 slope.
Water 17 02214 g008
Figure 9. Three-stage stilling basin surface flow field and cross-flow nephogram of main stream and tributary. (a) Surface flow field diagram of three-stage stilling pool in Working Condition 1; (b) cross-flow cloud diagram of three-stage stilling pool in Working Condition 1.
Water 17 02214 g009
Figure 10. Surface flow field and cross-flow velocity contour plot for the main channel and tributary under Condition 2 in the three-stage stilling pool. (a) Surface flow field diagram of three-stage stilling pool in Condition 2; (b) surface flow field diagram of stilling basin in Condition 2.
Water 17 02214 g010aWater 17 02214 g010b
Figure 11. 1:15 gentle slope + three-stage stilling pool layout plan.
Water 17 02214 g011
Figure 12. Surface flow and streamlines at confluence for three-stage stilling basin on gentle slope (1:15 scale) under Working Condition 1. (a) Surface flow field diagram of 1:15 gentle slope three-stage stilling pool in Working Condition 1; (b) cross-flow cloud map of 1:15 gentle slope three-stage stilling pool in Condition 1.
Water 17 02214 g012aWater 17 02214 g012b
Figure 13. 1:4 steep slope + three-stage stilling pool layout plan.
Water 17 02214 g013
Figure 14. Working Condition 1: Surface flow field and cross-sectional velocity contours for main stream and tributary in a 1:4-scale three-stage stilling basin on a steep slope. (a) The surface flow field diagram of the ‘1:4 steep slope three-stage stilling pool’ in Working Condition 1; (b) cross-flow cloud map of the ‘1: 4 steep slope three-stage stilling pool’ in Condition 1.
Water 17 02214 g014
Figure 15. Photo of the 28 m water flume. (a) Flume exterior appearance; (b) adjustable-slope measuring pin; (c) lower bearing and motor gear; (d) inlet rectifier grid; (e) tailgate.
Water 17 02214 g015
Figure 16. Sediment erosion/deposition.
Water 17 02214 g016
Table 1. Statistics on confluences of main tributaries to the Pinglu Canal.
Tributary NameTributary 20-Year Flood Discharge (m3/s)Maximum Longitudinal Velocity (m/s)Maximum Transverse Velocity (m/s)Present Bed Elevation of Tributary (m)Designed Channel Bed Elevation (m)Bed Elevation Difference (m)Angle Between Tributary and Channel (°)
Lion River2770.570.286052.37.790
Shaping River 12602.130.825852.35.740
Jiuzhou River 4891.30.763727.39.790
Xinping River7041.020.8214.31.31345
Wangwu River88.61.250.323627.38.745
Datang River2100.950.353227.34.745
Jiawu River1811.070.28171.315.750
Yawan River49.81.160.08171.315.790
Dingwu River4191.560.3415.51.314.230
Jiucun River1291.280.2513.71.312.460
Qingtang River5671.810.8713.51.312.270
Shabu River4711.220.55121.310.745
Chenwu River72.91.40.12111.39.7100
Yangwu River42.61.510.20111.39.755
Guangping River2571.90.4211.71.310.490
Yangmei River59.91.560.2591.37.7110
Panbiao River53.91.30.428.31.3735
Santa River6221.780.605.71.34.430
Xinwu River1151.780.605.71.34.430
Xiadi River2641.820.593.41.32.160
Niujiang River1551.820.593.41.32.160
Laocun River3541.950.4531.31.745
Dawu River75.11.980.5051.33.745
Maoping River2302.420.4551.33.745
Table 2. Water-level verification results.
Water Ruler
No.
Results
Model Water Depth (m)Model Corresponding to
Prototype Water Depth (m)
Prototype Water Depth (m)Relative Error (‰)
Z10.810240.5140.530.49
Z20.8004 40.0239.99 0.75
Z30.79339.6539.601.26
Z40.789239.4639.450.25
Table 3. Summary of remediation results of various control measures.
Control MeasuresWorking ConditionMaximum Longitudinal Velocity m/sMaximum Transverse Velocity m/sAngle Between Central Line of Channel and Main StreamMaximum Water-Level Fluctuation Difference (cm)
Three-stage stilling basin11.790.49mi33
21.110.28mi33.54
1: 15 gentle slope + three-stage stilling pool11.690.3the larger--
1: 4 steep slope + three-stage stilling basin11.580.29mi44.72
Disclaimer/Publisher’s Note: The statements, opinions and data contained in all publications are solely those of the individual author(s) and contributor(s) and not of MDPI and/or the editor(s). MDPI and/or the editor(s) disclaim responsibility for any injury to people or property resulting from any ideas, methods, instructions or products referred to in the content.

