Article

Microbial DNA-Based Monitoring of Underground Crude Oil Storage Bases Using Water-Sealed Rock-Cavern Tanks

1
Department of Systems Innovation, School of Engineering, The University of Tokyo, Tokyo 113-8656, Japan
2
Japan Underground Oil Storage Co., Tokyo 108-0073, Japan
3
Frontier Research Center for Energy and Resources, School of Engineering, The University of Tokyo, Tokyo 113-8656, Japan
*
Author to whom correspondence should be addressed.
Water 2025, 17(15), 2197; https://doi.org/10.3390/w17152197
Submission received: 20 June 2025 / Revised: 19 July 2025 / Accepted: 21 July 2025 / Published: 23 July 2025
(This article belongs to the Section Hydrogeology)

Abstract

Strategic petroleum reserves are critical for energy security. In Japan, 0.5 million kiloliters of crude oil (12% of the state-owned reserves) is stored using underground rock-cavern tanks, which comprise unlined horizontal tunnels bored into bedrock. Crude oil is held within the tank by water inside the tank, the pressure of which is kept higher than that of the crude oil by natural groundwater and irrigation water. This study applied microbial DNA-based monitoring to assess the water environments in and around national petroleum-stockpiling bases (the Kuji, Kikuma, and Kushikino bases) using the rock-cavern tanks. Forty-five water samples were collected from the rock-cavern tanks, water-supply tunnels, and observation wells. Principal-component analysis and hierarchical clustering indicated that microbial profiles of the water samples reflect the local environments of their origins. Particularly, the microbial profiles of water inside the rock-cavern tanks were distinct from other samples, revealing biological conditions and hence environmental characteristics within the tanks. Moreover, the clustering analysis indicated distinct features of water samples that have not been detected by other monitoring methods. Thus, microbial DNA-based monitoring provides valuable information on the in situ environments of rock-cavern tanks and can serve as an extremely sensitive measurement to monitor the underground oil storage.

1. Introduction

Strategic petroleum reserves are stockpiles of crude oil and other hydrocarbons, including natural gas liquids, and refined products such as gasoline, that are maintained to cope with short-term disruption of oil supply during an energy crisis. The International Energy Agency (IEA) mandates that affiliate countries hold emergency reserves equal to ≥90 days of their net imports in the previous year [1].
Japan, an IEA member that is heavily dependent on imports for crude oil because of the lack of substantial domestic resources, currently holds 43 million kL of crude oil (equivalent to 116 days of IEA standard) as state-owned reserves exclusively for emergencies [2]. Moreover, 12 and 2.3 million kL (equivalent to 81 and 6 days, respectively) of crude oil are held by the private sector (for commercial purposes) and in collaboration with oil-producing countries (under bilateral agreements), respectively. An additional 1.4 and 2.1 million tons of liquefied petroleum gas (equivalent to 53 and 73 days, respectively) are stored by the state and private companies, respectively.
The state-owned reserves of crude oil are stored at 10 national storage bases located in coastal areas across Japan [3]. Seven of these bases comprise onshore (under- or aboveground) or offshore (floating) storage tanks/containers, collectively storing ca. 88% of the state-owned reserves. The other three bases, namely Kuji, Kikuma, and Kushikino national petroleum stockpiling bases, use artificial underground rock caverns as storage tanks to store approximately 12% of the state-owned reserves.
The rock-cavern tanks comprise unlined horizontal tunnels bored in granitic (the Kuji and Kikuma bases) or andesitic (the Kushikino base) low-permeable bedrocks 20 to 65 m below ground level [4,5]. The tunnels have oval- or round-top, bread-shaped sectional structures with lengths of 230–555 m, widths of 18–20.5 m, and heights of 22–30 m (Table 1). Each base has seven (the Kikuma base) or ten (the Kuji and Kushikino bases) such tunnels that interconnect with one another and compose three storage units, respectively (the rock-cavern tanks T1, T2, and T3 of each base). Crude oil is held within the tank by water inside the cavern, the pressure of which is kept higher than that of the crude oil and headspace (filled with nitrogen gas) of the cavern (Figure 1). Water pressures within the rock-cavern tanks are maintained by natural groundwater seeping into the unlined caverns from surrounding strata as well as irrigation water artificially supplied via specialized water-supply tunnels, which are horizontal and unlined tunnels bored above the rock-cavern tanks. Irrigation water can penetrate from the tunnels, as well as boreholes connected to the tunnels, to rock strata peripheral to the tanks in a hydrostatic-driven manner. Together with the mechanical resilience of the bedrock, such “water-sealing” (or “water-curtain”) system can effectively prevent crude oil migration, enabling the rock-cavern tanks to safely store the crude oil even during earthquakes and other natural disasters [5,6].
Crude oil reserves were injected into the rock-cavern tanks in the three petroleum stockpiling bases in 1993 or 1994 and have been stored for over 30 years so far with no release. The integrity of storage is checked by monitoring the internal pressure, water inflow, seismic motion, temperature of groundwater and composition of the headspace gas of the tanks [4,7,8]. Moreover, the water quality within the tanks and their surrounding underground environments (such as observation wells on/around the bases) is regularly assessed to examine any possible environmental impact of the storage. In addition, the hydraulics of groundwater around the tanks have been studied to optimize the water-sealing system [9,10,11,12]. However, the in situ environments within/around the rock-cavern tanks should also be studied to ensure the secure storage of crude oil.
Microbial deoxyribonucleic acid (DNA)-based monitoring is an application of microbial community analysis to environmental monitoring, where microbes present in the environment and/or inflow fluid are used as indicators (markers and tracers) to gather information on the environment and to track fluid flow. More specifically, microbial DNA extracted from water samples from the target environment is assessed via high-throughput DNA sequencing, most typically of amplicons of the 16S ribosomal ribonucleic acid (rRNA) gene as a phylogenetic marker. The taxonomic composition of the microbial community present in each sample is then assessed based on this data and used as the microbial profile of the sample, and by comparing microbial profiles, information on the target environment can be obtained. Recently, DNA-based monitoring has been applied to subsurface environments (e.g., subsurface formations of petroleum fields), providing useful information, including possible inter-well connectivity, breakthrough of injected water, and microbial ecosystems [13,14,15,16,17,18,19,20,21,22,23,24,25,26,27].
This study applied microbial DNA-based monitoring to the rock-cavern tanks of the three crude oil stockpiling bases in Japan. We aimed to acquire novel information on the in situ environments within the storage tanks as well as their possible interactions with the surrounding environments.

2. Materials and Methods

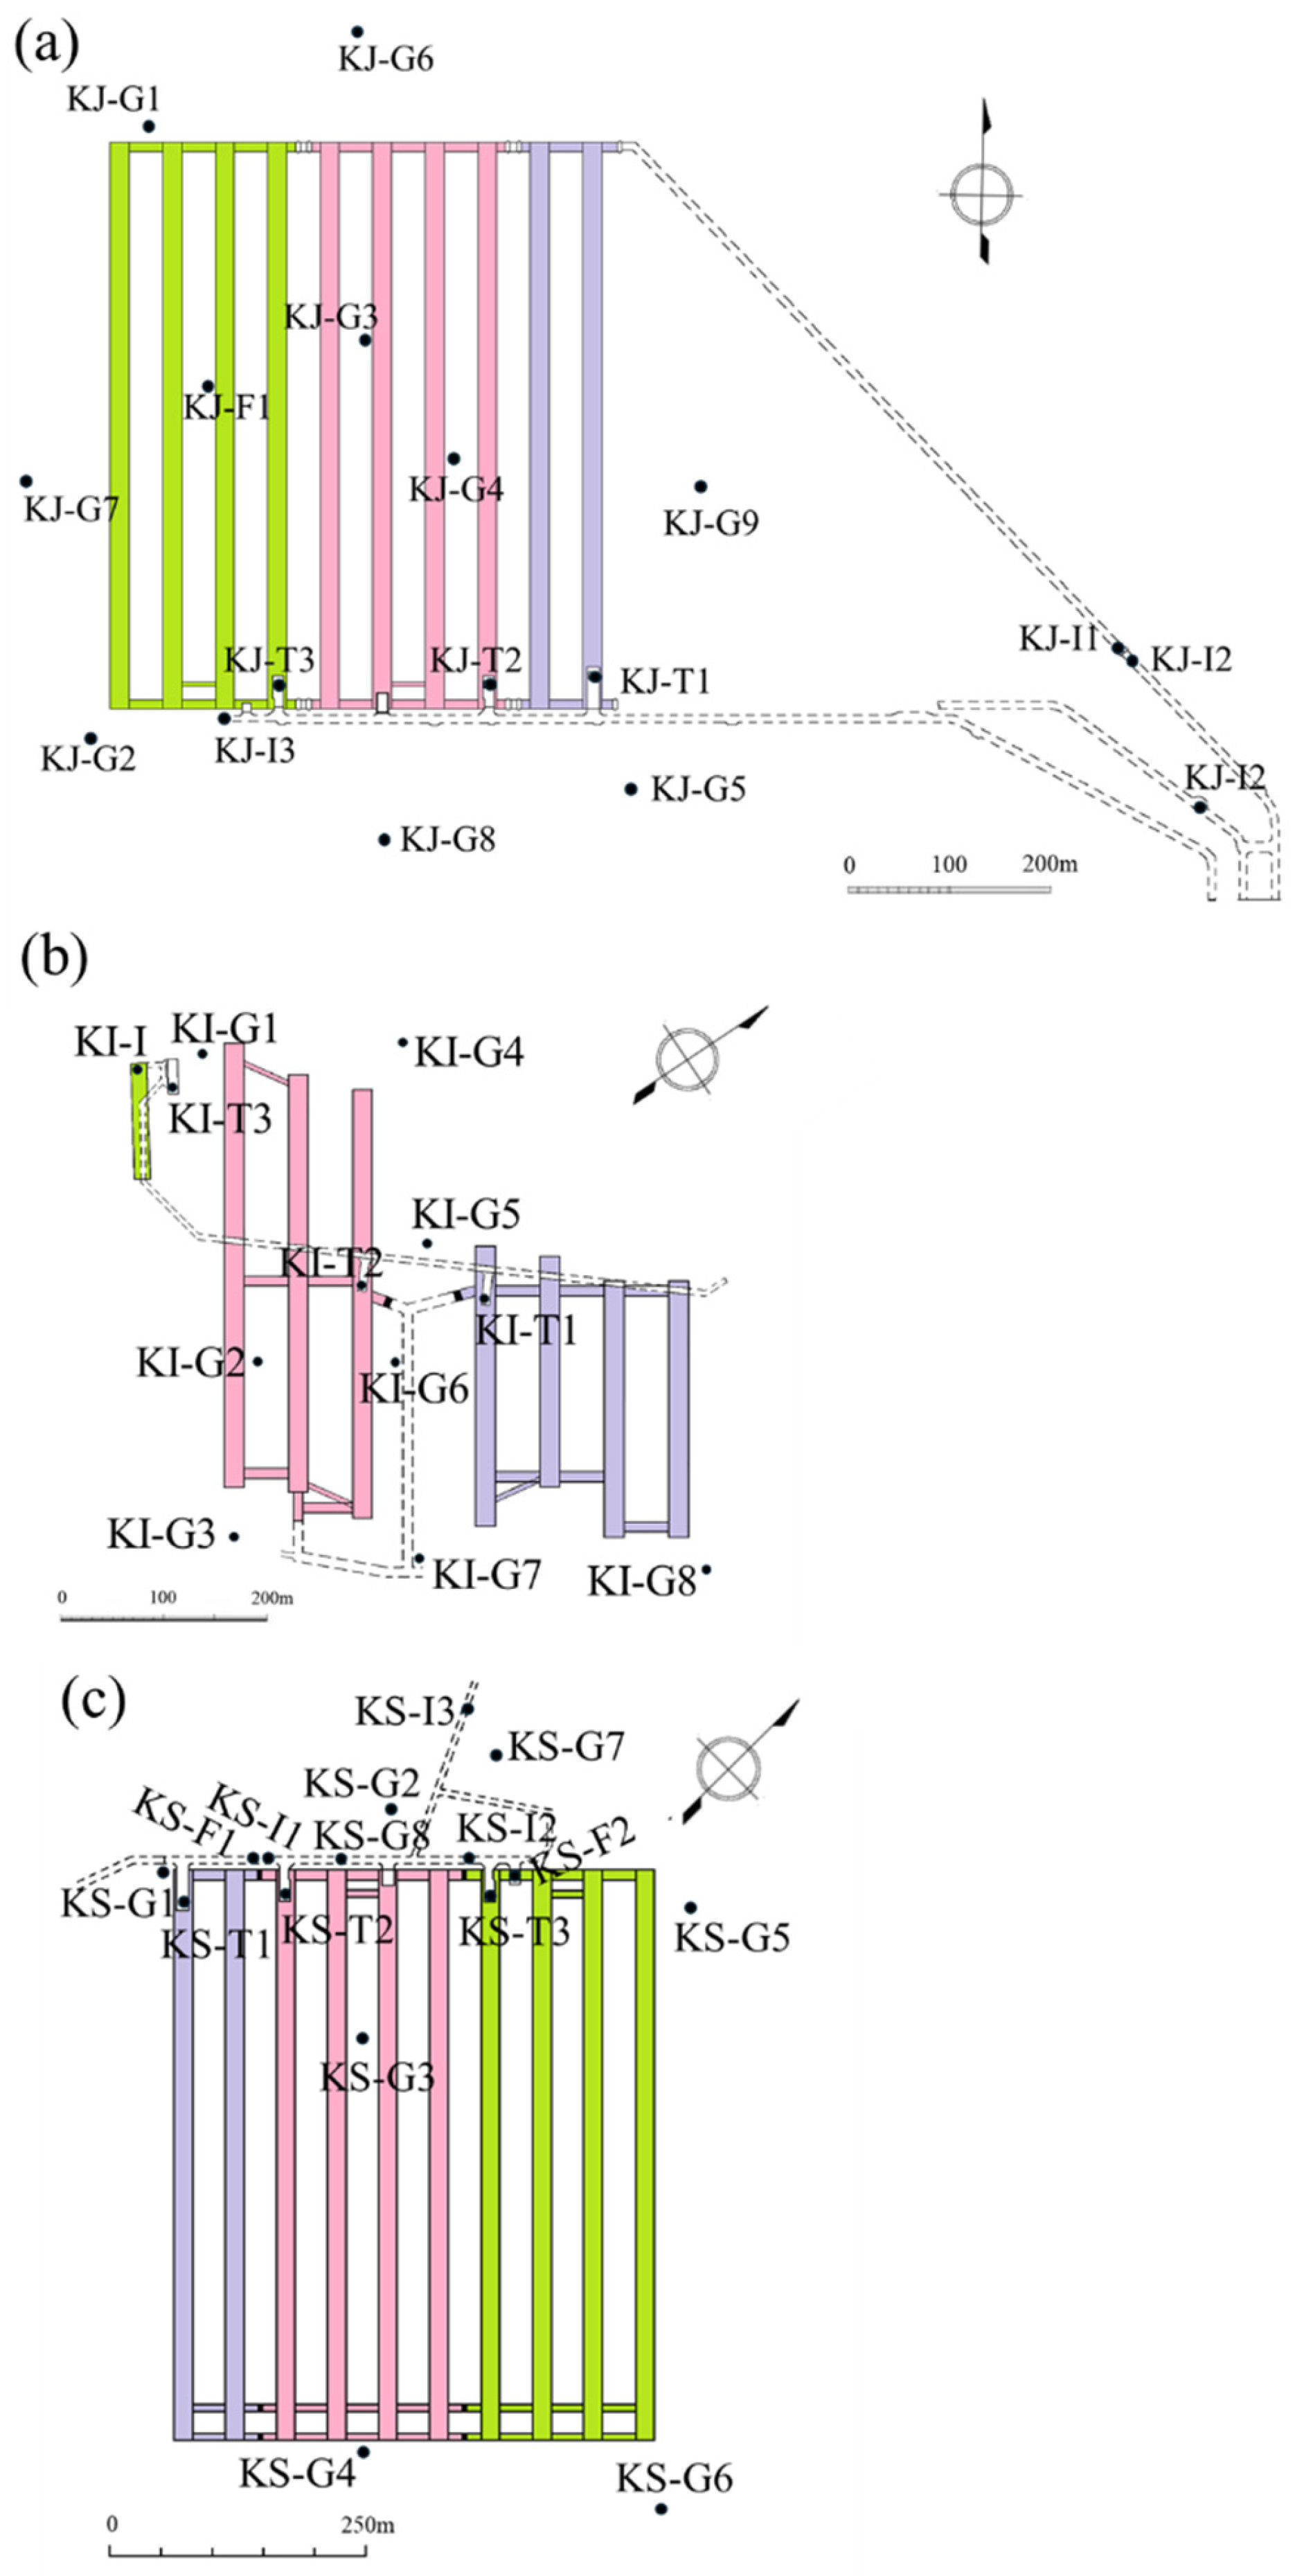
2.1. General Description of the Sampling Sites

Water samples were collected from the three national petroleum stockpiling bases at Kuji (Iwate prefecture), Kikuma (Ehime prefecture) and Kushikino (Kagoshima prefecture), which are located in Honshu, Shikoku, and Kyushu (three of the four main islands of Japan), respectively. Table 1 presents the general characteristics of the rock-cavern tanks. The locations of sampling sites in each base are shown in Figure 2.

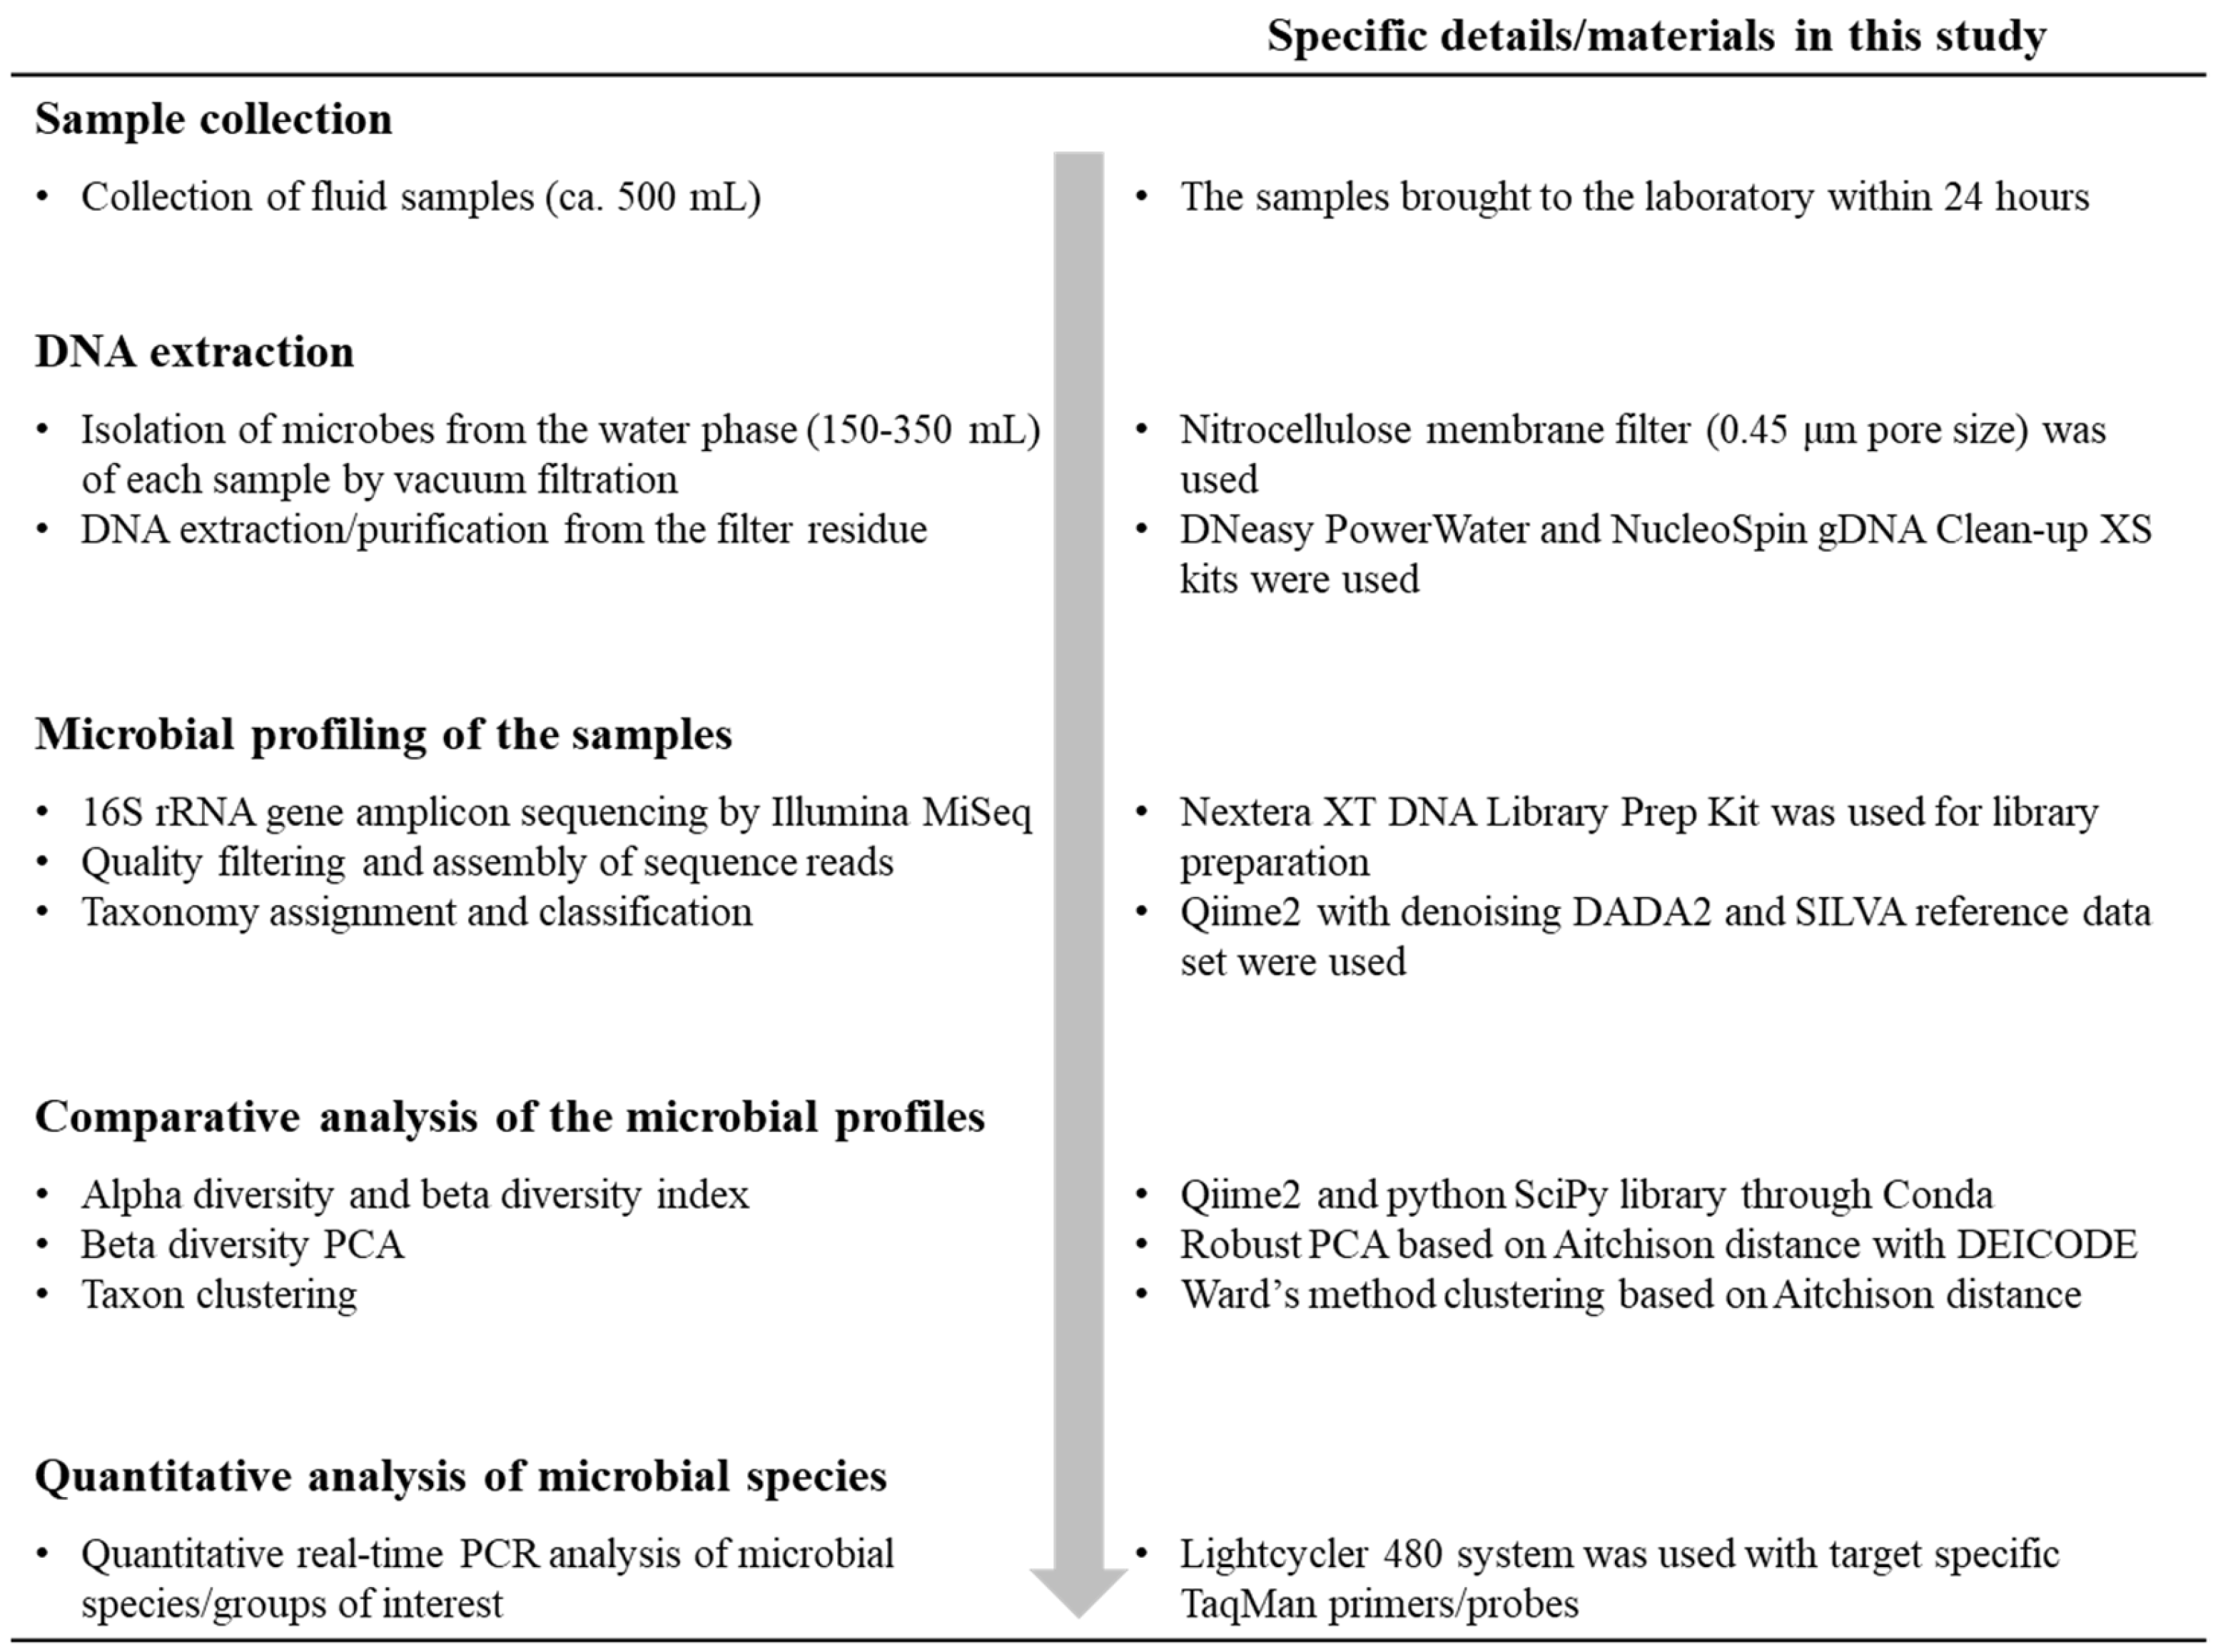
2.2. Sample Collection

The workflow diagram of this study is shown in Figure 3. Samples of water inside the underground rock-cavern tanks (abbreviated as T in sample names: Table 2) were collected from sampling ports of drainage lines of the tanks. Samples of irrigation water (abbreviated as I in sample names: Table 2) were collected from the water-supply tunnels via sampling ports of the tunnels. Samples of feedwater supplied to water-supply tunnels (abbreviated as F in the sample names: Table 2) were collected from sampling ports in water lines feeding the tunnels. Groundwaters (abbreviated as G in sample names: Table 2) were sampled from observation wells on and around the bases by manual pumping. Water samples (ca. 500 mL) were stored in sterile polypropylene bottles (CP500, Az One, Osaka, Japan). Each bottle was filled to the rim with water, tightly sealed with a sterile polypropylene cap, and shipped at 4 °C to the laboratory within 24 h of sampling.

2.3. DNA Extraction

Microbes in water samples were collected by filtering 150–350 mL of each sample through an analytical filter unit with a nitrocellulose filter (0.45-µm pore size) (Nalgene Nunc International, Rochester, New York, NY, USA) under vacuum. DNA was extracted from microbial cells trapped on the filter via chemical and physical cell lysis followed by DNA purification with an ion-exchange column using the DNeasy PowerWater Kit (Qiagen, Hilden, Germany). Extracted DNA was purified and concentrated by an ion-exchange column using the NucleoSpin gDNA Clean-up XS Kit (Macherey-Nagel, Düren, Germany). DNA concentrations were fluorometrically quantified by using a Qubit 3.0 fluorometer (Thermo Fisher Scientific, Waltham, MA, USA) with the Qubit dsDNA HS Assay Kit (Thermo Fisher Scientific). A mock sample (distilled water) was processed in parallel as a control for exogenous DNA contamination during DNA extraction or PCR. No amplification of 16S rRNA gene fragment was detected in the mock sample.

2.4. Sequencing of 16S rRNA Gene Amplicons

Sequencing libraries of 16S rRNA gene amplicons were constructed by using DNA extracted from samples as polymerase chain reaction (PCR) templates. The hypervariable V6 region of bacterial and archaeal 16S rRNA genes was amplified with primers U789F (5′-TAGATACCCBGGTAGTCC-3′) and U1068R (5′-CTGACGRCRRCCATGC-3′) [28], which target a wide range of bacteria and archaea, with additional overhangs for subsequent library preparation. A 25-µL PCR reaction mixture contained KAPA HiFi HotStart ReadyMix (2×) (Roche, Basel, Switzerland), 10 µM of each primer, and 10 ng of DNA template. PCR was performed with an initial denaturation at 95 °C for 3 min; 25 cycles at 98 °C for 20 s, 65 °C for 15 s, and 72 °C for 15 s; and a final extension at 72 °C for 1 min. Sequencing libraries were prepared by using the Nextera XT DNA Library Prep Kit (Illumina, San Diego, CA, USA) and were sequenced by using MiSeq (Illumina) (250 bp pair-end sequencing) at Biken Biomics (Osaka, Japan).

2.5. Phylogenetic Characterization of the 16S rRNA Gene Amplicon Sequences

Resulting raw reads were processed on the Quantitative Insights Into Microbial Ecology 2 (QIIME 2) platform (version 2023.7) [29] using DADA2 for clustering into amplicon sequence variants (ASVs) [29,30]. Sequencing reads with ambiguous nucleotides, a length <250 bp, lacking a complete barcode, or a primer at only one end were excluded from the analysis. Reads were clustered into ASVs at a threshold of 97% sequence identity. ASV taxonomy was assigned using the Ribosomal Data Project classifier with the publicly available SILVA reference database (version 138.1) [31,32,33] through QIIME 2 [34,35]. ASVs assigned to known taxa are classified to more specific taxonomic levels. The total number of reads assigned to each ASV was counted, and proportions of each group in the amplicons were calculated.

2.6. Statistical Analyses of the Microbial Profiles of Samples

For the alpha-diversity analysis, the Shannon diversity [36] and Pielou’s evenness indexes [37] were estimated using QIIME2. For the compositional beta-diversity analysis [38], the DEICODE plugin (version 0.2.3, 2019) was used in QIIME 2 for the robust principal component analysis (PCA) with the Aitchison distance, a compositional beta-diversity metric rooted in a centered log-ratio transformation and matrix completion. These were calculated using the web-based interactive computing platform Jupyter Notebooks (version 7.1.2) [39] in Python with a package manager Conda (version 24.3.0) (Anaconda Software Distribution, Austin, TX, USA). Biplots were drawn with Python with the matplotlib patches. Ellipse in matplotlib (version 3.7.2) was used for drawing confidence ellipses [40,41].
For the hierarchical clustering analysis, Ward’s linkage method [42] was employed as this can effectively cluster noisy datasets and minimize the variance between the clusters. Pairwise Aitchison distances between samples were calculated using the compositional data analysis package [43,44] in the Python 3 library scikit-bio (version 0.6.0) [45] and used as the distance metrics for clustering. The clustering was performed by using the hierarchical clustering functions (scipy.cluster.hierarchy) in the Python library SciPy (version 1.11.2) [46]. Both the dendrogram and the corresponding cophenetic correlation coefficient (CCC) were derived from deterministic hierarchical clustering procedures [47,48]. The dendrogram was fully reproducible under fixed input data and methodological parameters, with the CCC values remaining constant across the repeated runs.

2.7. Real-Time Quantitative Polymerase Chain Reaction

The DNA extracted from the selected samples were used for quantitative PCR (qPCR) analyses to quantify copy numbers of DNA molecules of specific targets (a taxonomic group or species of interest) within the template DNA. Group-specific primers and TaqMan probes for total archaea [ARC787F (5′-ATTAGATACCCSBGTAGTCC-3′), ARC915P (5′-AGGAATTGGCGGGGGAGCAC-3′), ARC1059R (5′-GCCATGCACCWCCTCT-3′) [49]], total bacteria [BAC338F (5′-ACTCCTACGGGAGGCAG-3′), BAC516P (5′-TGCCAGCAGCCGCGGTAATAC-3′), BAC805R (5′-GACTACCAGGGTATCTAATCC-3′) [49]], and Pseudomonas [Pse435F (5′-ACTTTAAGTTGGGAGGAAGGG-3′), Pse449P (5′-ACAGAATAAGCACCGGCTAAC-3′), Pse686R (5′-ACACAGGAAATTCCACCACCC-3′) [50]] were used. Each 10 µL reaction mixture comprised 1 µL of template DNA, 300 nM of the specific primer, 200 nM of the specific TaqMan probe, 5 µL of Premix Ex Taq (Takara, Kyoto, Japan), and PCR-grade sterilized water. PCR amplification was performed in a LightCycler 480 system (Roche Diagnostics, Mannheim, Germany) using an initial 30 s of incubation at 95 °C, 50 cycles of denaturation for 5 s each at 95 °C, and annealing/extension for 30 s at 60 °C. The amplification efficiency of the primer-probe sets was 1.93–1.96. Three separate trials were conducted per sample. Standard curves were constructed per assay by using nearly full-length fragments of the 16S rRNA genes of Methanothermobacter thermautotrophicus strain ∆H for the archaeal assay and P. aeruginosa strain PAO1 for the bacterial and Pseudomonas assays.

3. Results

The characteristics of the water samples are shown in Table 2. In total, 45 water samples, including water inside the rock-cavern tanks (T), irrigation water inside the water-supply tunnels (I), feedwater supplied to the water-supply tunnels (F) and groundwater from the observation wells (G) were collected from the Kuji, Kikuma, and Kushikino bases (KJ, KI, and KS in sample names, respectively) in November 2020, December 2021, and January 2023, respectively. No visible crude oil was present in the water samples. In the Kuji and Kikuma bases, the water pressures inside the tanks are primarily maintained by irrigation water from water-supply tunnels. In the Kushikino base, the water pressures inside the tanks are primarily maintained by natural groundwater, while irrigation water from the water-supply tunnels is also used mainly to prevent crude oil migration between rock caverns. In the Kuji base, a relatively large amount of natural groundwater is seeping into the tanks (Table 1), causing an excess amount of drainage from the tanks. To minimize the cost of water use, the drainage water from tanks is treated and reused as feedwater to water-supply tunnels in the Kuji base. On the other hand, tap water and industrial water are used as the feedwater to water-supply tunnels in the Kikuma and Kushikino bases.

3.1. Microbial Community Composition

The microbial profiles of the samples at the class level are shown in Figure 4. In total, 4–37% of microbes in water samples from the rock-cavern tanks were affiliated with the domain Archaea. In the other samples (irrigation water, feedwater and groundwater), microbes mostly belong to the domain Bacteria, and archaeal species were rarely detected; however, archaeal species were detected in groundwater samples KI-G5 and KI-G8 and irrigation water samples KS-I2 and KS-I3 with relatively high relative abundances (5–17%).

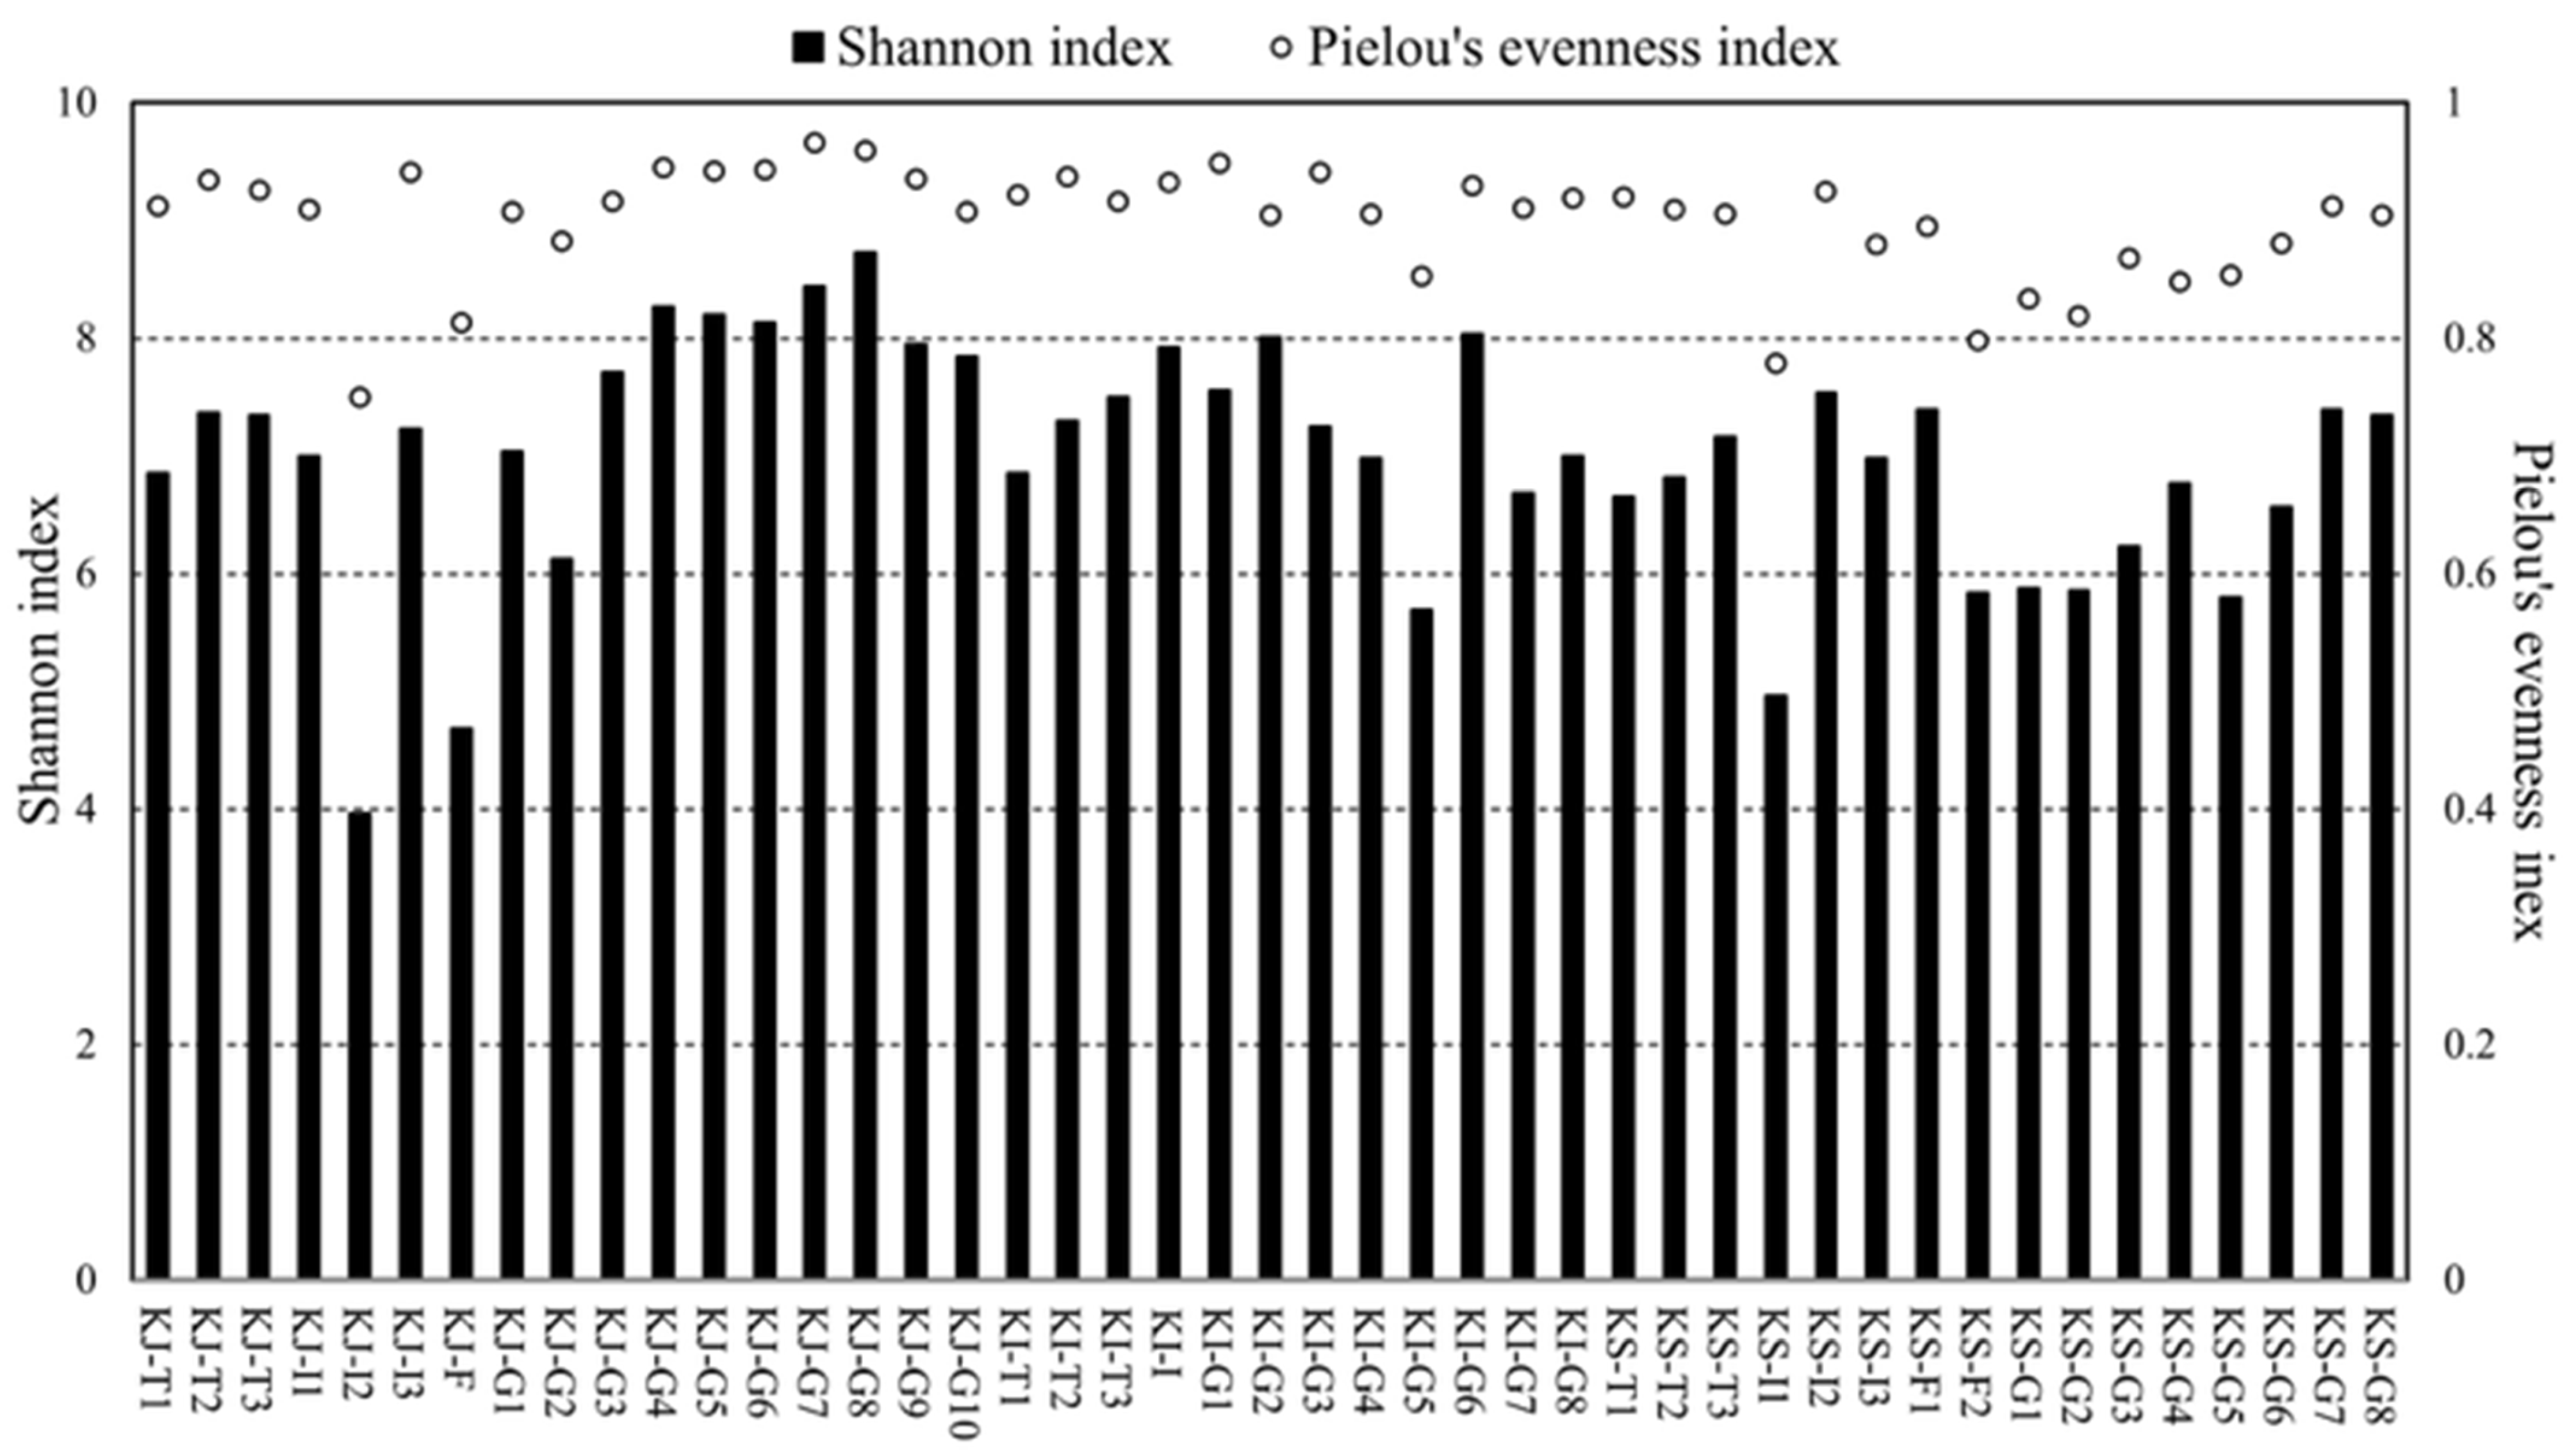
3.2. Data Trend in Alpha Diversity Index

The alpha-diversity indexes for the microbial profiles (at the species level) of the water samples are generally comparable with or higher than those of other environments, such as soil and aquatic environments (Figure 5) [50]. The Shannon’s diversity and Pielou’s evenness indexes of the samples are, on average, 7.0 and 0.9, respectively. The values of the Shannon index of environmental microbial communities have been shown to be usually between 1.5 and 3.5 and rarely surpass 4.5 [50], while the values of Pielou’s evenness index are around 0.5 [51]. Compared with these previous studies, our samples have relatively low uncertainty and high diversity. An irrigation water sample (KS-I1 and KJ-I2) and a feedwater sample (KJ-F) have relatively low alpha-diversity indexes, suggesting that the varieties and/or quantities of available nutrients are relatively limited in environments within the water-supply tunnel of the Kushikino and Kuji bases and the feedwater of the Kuji base.

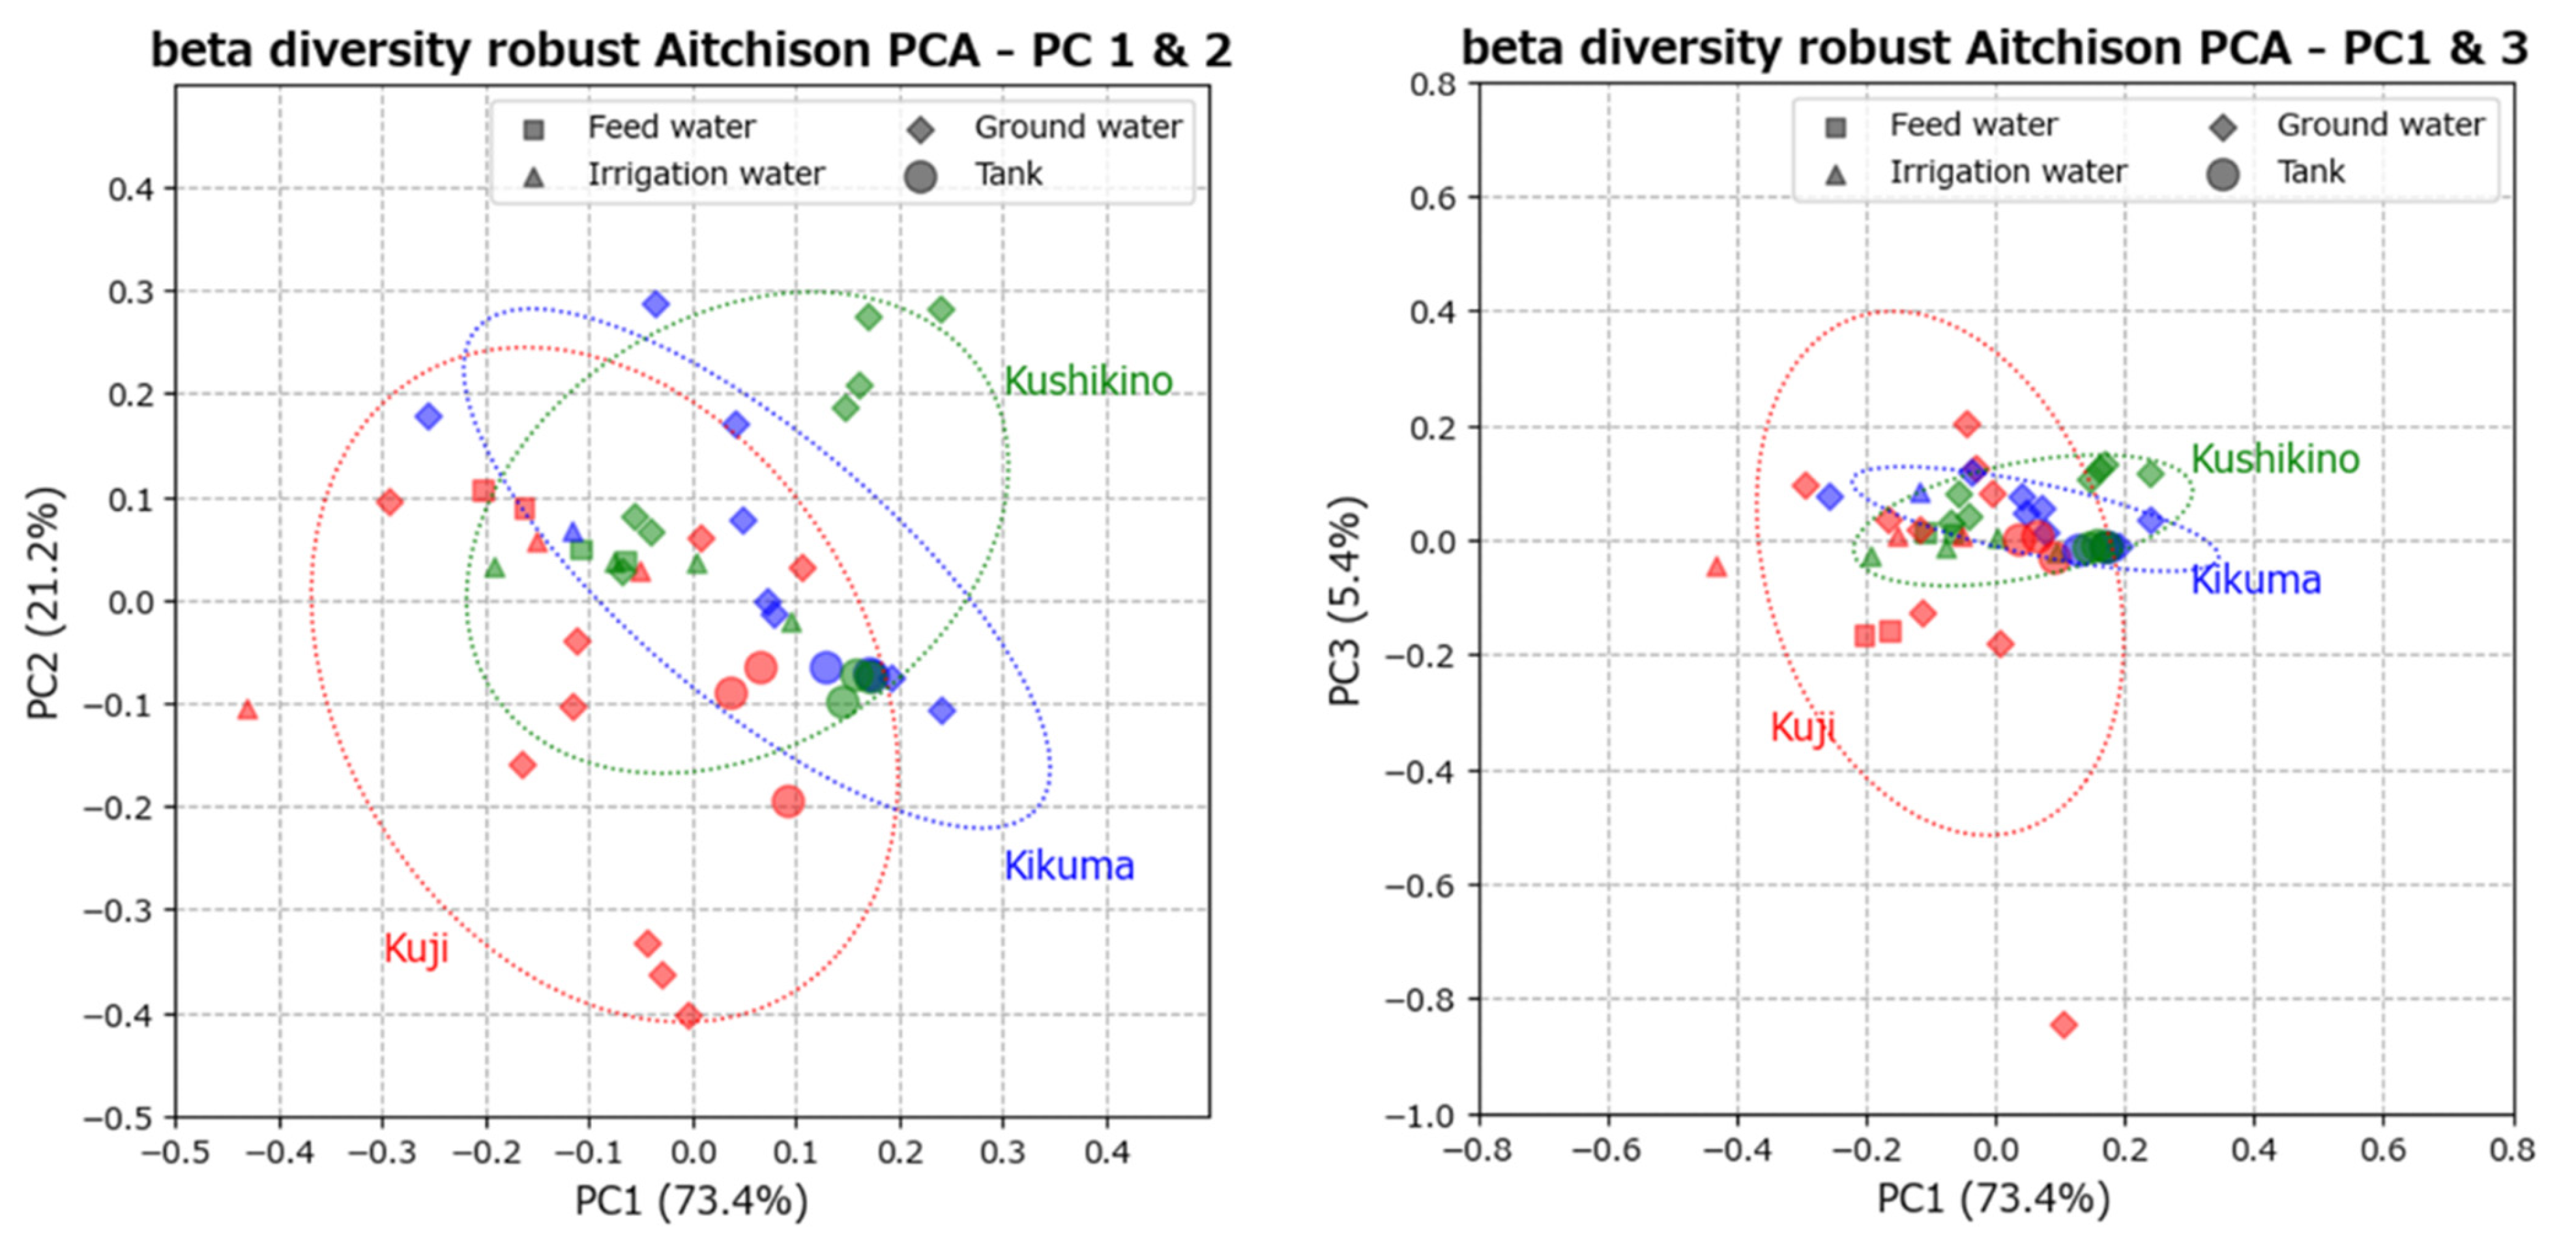
3.3. Data Visualization of Beta Diversity with PCA of Robust Aitchison Distances

The beta-diversity (Bray–Curtis) metric [52] based on the robust PCA with Aitchison distance of the microbial profiles (at the species level) of water samples with the confidence ellipse overlays is shown in Figure 6; ellipses are drawn at 95% confidence intervals for each base. This method is robust for data with high sparsity (such as data of microbial profiles) compared with classical PCA [53,54,55]. The contributions of a variable to the principal components, PC 1, 2, and 3 are, respectively, 73.4%, 21.2% and 5.4%, cumulatively explaining 100% of the total variance. The principal components are well correlated with samples, suggesting they vary together. Although the confidence ellipse of each base identifies each community tendency, the microbial profiles of waters inside the rock-cavern tanks are plotted close to each other (particularly those from the same bases) in the lower-right quadrant of the score plot. Similarly, the microbial profiles of irrigation and feedwaters are mostly plotted close to each other, mainly in the upper-left quadrant. The microbial profiles of the groundwater samples are distributed across the score plot, yet some of the groundwaters from the same bases are plotted relatively close to each other. This suggested that the microbial profiles of the samples reflect the types of water and/or the local environments from which samples were collected.

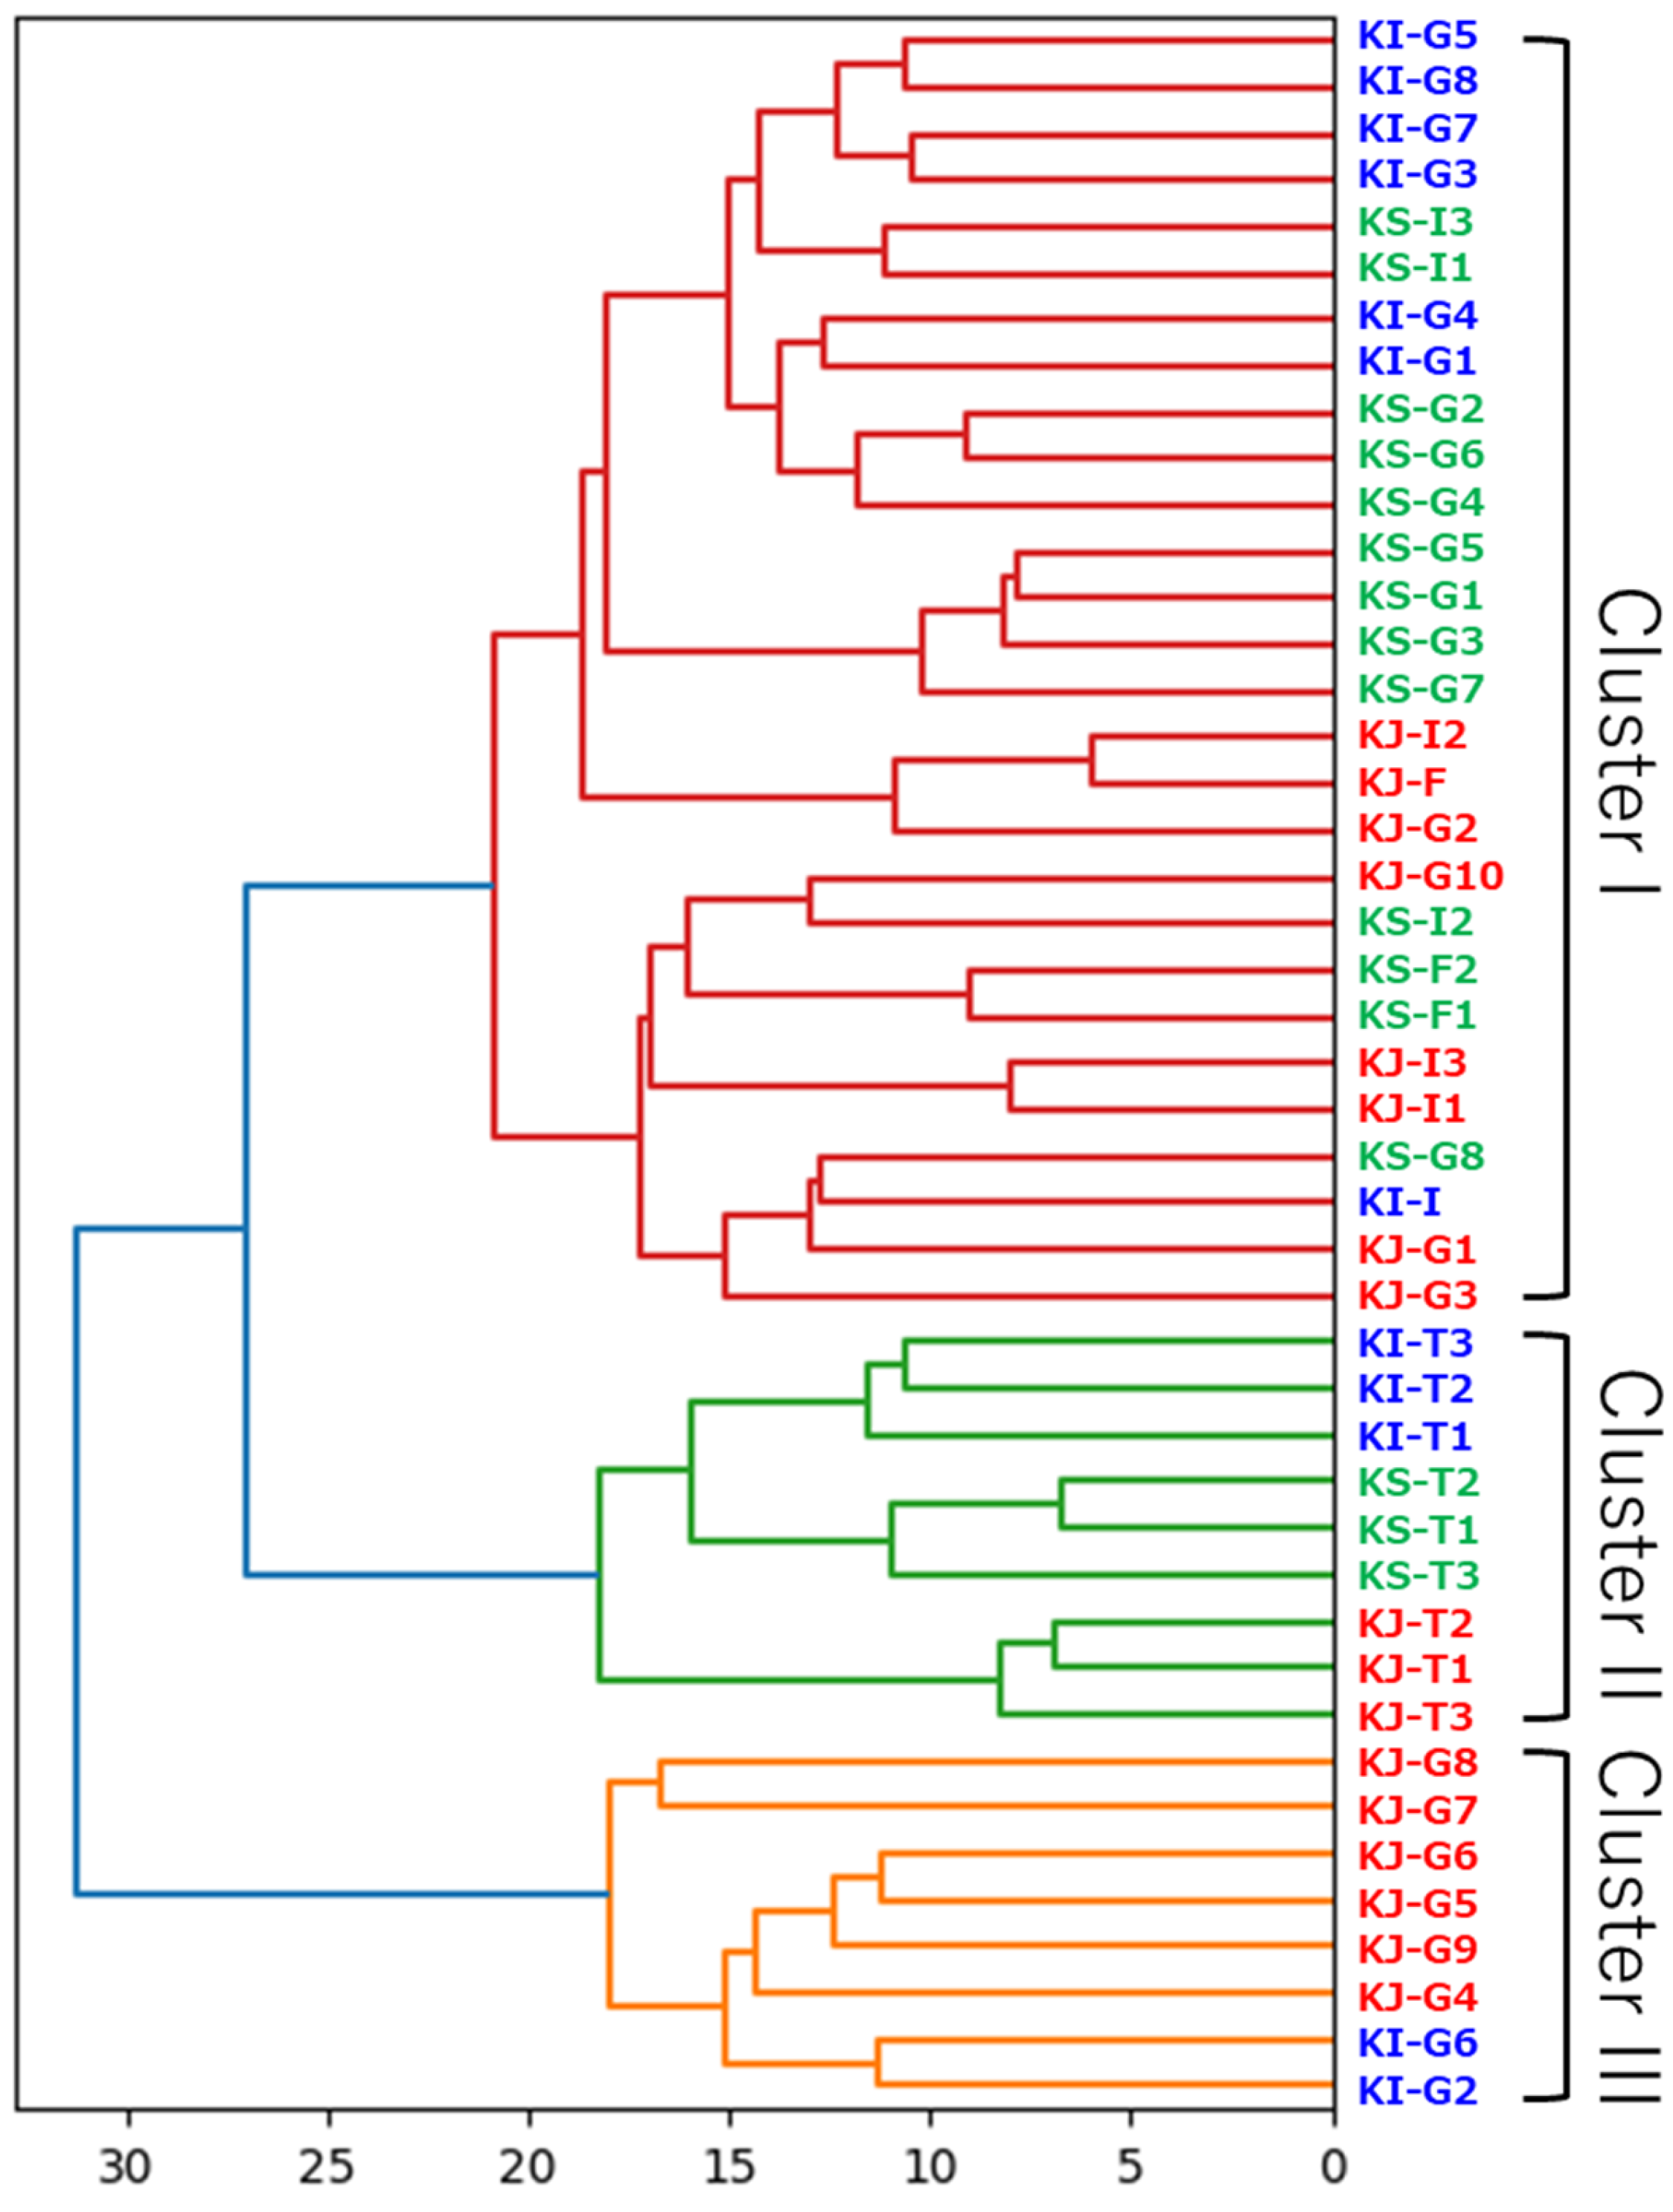
3.4. Data Visualization Using Aitchison Distances and Ward’s Linkage Method

The similarity between the microbial profiles (at the species level) was complementarily analyzed by hierarchical clustering based on the pairwise Aitchison distances. The dendrogram obtained using Ward’s linkage method [42] is shown in Figure 7. Overall, the microbial profiles of the 45 samples were grouped into three clusters (I, II, and III). The robustness of the clustering was tested by evaluating CCC across different data subsets and clustering parameters. The CCC for the whole dataset (45 samples) was 0.67, indicating a moderate correlation between the clustering structure and the original pairwise distances. It was also noted that CCCs for the clusters I, II and III were 0.6, 0.85 and 0.88, respectively (CCC for the dataset combining the clusters II and III, except the cluster I was 0.83). Thus, it was indicated that the clusters II and III effectively preserved over 85% of the original distance relationships, while the cluster I was relatively heterogeneous and might be relatively less robust. All samples of the irrigation waters (KJ-I1–3, KI-I, and KS-I1–3) and feedwaters (KJ-F and KS-F1–2) were assigned to cluster I; all groundwater samples from the Kushikino base (KS-G1–8) were also assigned to cluster I; groundwater samples from the Kuji and Kikuma bases were divided into clusters I (KJ-G1–3, and 10 and KI-G1, 3–5, and 7–8) and III (KJ-G4–9 and KI-G2, 9). Notably, all samples of water inside the rock-cavern tanks (KJ-T1–3, KI-T1–3, and KS-T1–3) were exclusively assigned to cluster II, further suggesting that the microbial profiles, and hence the environments within the rock-cavern tanks, are distinct from those of other samples but relatively similar to each other.
To gain insight into the in situ environments within the underground rock-cavern tanks, cluster II was analyzed in further detail. The subcluster structure of cluster II was compared with the profiles of crude oil reserves stored in the tanks (Figures S1 and S2). Crude oils from six different origins are stored in the nine tanks. Among them, two tanks in the Kikuma base (from which KI-T2 and KI-T3 were collected) both store crude oil from a certain petroleum field (oil A in Figure S2). Similarly, tanks in the Kuji and Kushikino bases store crude oil of the same origin: crude oil from a certain petroleum field (oil E in Figure S2) is stored in tanks of the Kuji and Kushikino bases (from which KJ-T2 and KS-T3 were collected), and crude oil from another petroleum field (oil C in Figure S2) is stored in tanks of the Kuji and Kushikino bases (from which KJ-T3 and KS-T2 were collected). However, regardless of the origins of crude oil stored in the tanks (except for tanks T2 and T3 of the Kikuma base, which both stored the same crude oil, oil A: Figure S2), each subcluster contains water samples exclusively from tanks of the same base. This suggested that the microbiota within the rock-cavern tank is affected by the in situ environments rather than the characteristics of the stored crude oil.

3.5. Data Visualization Using Robust Z-Score Heatmap and qPCR Quantification of 16S rRNA Gene

The microbial profiles of the water inside the tanks were then used to infer the environmental conditions within the rock-cavern tanks. A normalized robust z-score heatmap of genera detected in at least one of the tanks with a relative abundance >3% is shown in Figure 8 [56]. Generally, strict anaerobic microorganisms, such as methanogenic archaea (methanogens, such as archaea of the genera Methanobacterium, Methanoculleus, Methanoregula, Methanosaeta, Methanolinea, and an unclassified genus of the family Methanomicrobiaceae) and sulfate-reducing bacteria (SRB) (i.e., bacteria that can utilize at least one of sulfur compounds, such as sulfate, thiosulfate and elemental sulfur, as terminal electron acceptors, e.g., bacteria of the genera Desulfatirhabdium, Desulfosporosinus, Desulfovibrio, Geobacter and Sulfuricurvum), accounted for a significant portion of microbial compositions present in water samples inside the tanks. In particular, methanogens are highly sensitive to oxygen and therefore serve as indicators of anaerobic environments. Despite their strict anaerobic requirements, SRB has been detected in diverse environments, including many aerobic regions [57]. However, the microbial compositions of the rock-cavern tanks differed significantly among the three bases (i.e., the subclusters of cluster II in Figure 7), likely reflecting differences between the environmental conditions in each base. The qPCR quantification of 16S rRNA gene copy numbers of total archaea and bacteria in DNA from the rock-cavern tank samples is shown in Figure 9. At the domain level, most microbes in the rock-cavern tanks belong to the domain Bacteria, while microbes belonging to the domain Archaea are significantly abundant in KS-T1 and KS-T2. At the species level, bacteria of the genus Candidatus Omnitrophus were the only species commonly detected in all tanks with relative abundance >1%. The genus Ca. Omnitrophus comprises uncultivated bacteria mostly detected in anoxic aquatic environments [58].
In samples of water inside the rock-cavern tanks of the Kuji base (KJ-T1, KJ-T2, and KJ-T3), obligate anaerobes, particularly methanogens and SRB, account for substantial portions of the microbial components: 10%, 10%, and 6% of the sequences were affiliated with methanogens (mainly archaea of the genus Methanoregula); 21%, 25%, and 15% were related to SRB (e.g., bacteria of the genera Desulfatirhabdium, Desulfovibrio, Desulfosporosinus and Trichlorobacter). This suggested that at least part of the environment inside the rock-cavern tanks is highly anaerobic. However, a significant portion of the microbes detected in the tanks is related to bacteria found in aerobic or microaerobic environments (such as bacteria of the genus Hydrogenophaga and unclassified genera of the orders Saccharimonadales and Campylobacterales), suggesting that the environments within the tanks are not uniform and harbor relatively oxic (and/or microoxic) regions together with anoxic regions. Moreover, sulfur-oxidizing bacteria of the genus Sulfuricurvum were detected in all water samples from the tanks of the Kuji base with high relative abundances (24%, 10%, and 11% of the sequences in KJ-T1, KJ-T2, and KJ-T3, respectively), while they were seldom detected in tanks of the other bases. A bacterium of the genus, Sulfuricurvum kujiense, has been previously isolated from the Kuji base [59,60]. Skujiense is a chemolithoautotrophic facultative anaerobe (or microaerophile) that can grow using thiosulfate or sulfide as the electron donors and nitrate or low concentration of oxygen as the electron acceptors. Overall, in the rock-cavern tanks of the Kuji base, sulfur metabolism (oxidation and reduction of sulfur compounds) is relatively active.
In water samples from tanks of the Kikuma base (KI-T1, KI-T2, and KI-T3), 13%, 4%, and 11% of sequences were affiliated with methanogens (mainly archaea of the genera Methanoregula and Methanoculleus), and 14%, 21%, and 11% were closely related to SRB (e.g., bacteria of the genera Desulfovibrio and Geobacter). In addition, bacteria of unclassified genera of the families Rhodocyclaceae and Spirochaetaceae were commonly detected with high relative abundances in all three tanks. However, the microbial profiles were relatively divergent among the three samples: In KI-T1, species of obligately anaerobic acetogenic bacterium (Acetobacterium) and facultatively anaerobic nitrate-reducing bacteria (Nitratifractor and Alicycliphilus) were detected with high relative abundances (4%, 3%, and 7%, respectively). In KI-T2, an obligately anaerobic SRB of the genus Geobacter was detected with high relative abundance (6%). In KI-T3, an aerobic bacterium of the genus Rhizobium, which is typically a plant root symbiont [61,62], was detected with high relative abundance (14%). Thus, compared with those of other bases, the three rock-cavern tanks of the Kikuma base have environments relatively distant from one another. More specifically, nitrate reduction, sulfate reduction, and aerobic metabolisms are implied to be relatively active in tanks T1, T2 and T3, respectively.
In samples of water from the rock-cavern tanks of the Kushikino base (KS-T1, KS-T2, and KS-T3), 32%, 34%, and 19% of the sequences were affiliated with methanogens (mainly archaea of the genera Methanobacterium, Methanoculleus, Methanoregula and Methanosaeta), and 19%, 21%, and 21% of the sequences were related to SRB (bacteria of the genera Desulfatirhabdium, Desulfovibrio, Pelotomaculum and the family SCADC1-2-3) in KS-T1, KS-T2, and KS-T3, respectively. In the sample KS-T3, bacteria of the genus Pelotomaculum were detected with high relative abundance (12%). Pelotomaculum are known to anaerobically oxidize organic acids via syntrophic cooperation with methanogens [63]. Thus, the rock-cavern tanks of the Kushikino base may harbor the most anaerobic environments among those of the three bases, in which methanogenesis is probably active.
By assessing the microbial profiles of the irrigation water, feedwater, and groundwater samples (in clusters I and III, Figure 7), subsurface environments surrounding the rock-cavern tanks could be assessed. Interestingly, the subcluster structures of the groundwater samples tend to depend on the locations of observation wells relative to the rock-cavern tanks (Figure 2 and Figure 7). For example, a group of groundwater samples from the Kushikino base (KS-G1, 3, 5, and 7) forms a distinct subcluster within cluster I. These samples were collected from observation wells located on the north-west side of the area directly above the underground rock-cavern tanks. Furthermore, in KS-G1, 3, 5, and 7, bacteria of the genus Pseudomonas were detected with high relative abundances (Figure S3). Quantitative PCR confirmed higher abundances of bacteria of the genus Pseudomonas in these four samples among the groundwater samples from the Kushikino base (Figure S3). The genus Pseudomonas comprises enormously diverse species and has been detected in a wide range of environments (terrestrial, freshwater, marine and host organisms) [64,65]. The reason for the high abundances of Pseudomonas in these samples is currently unknown and will be further examined in future studies.

4. Discussion

This study applied microbial community analysis to monitor the rock-cavern tanks in national strategic petroleum stockpiling bases in Japan. Previous studies investigated the diversity and abundance of bacteria in the rock-cavern tanks of the Kuji base mainly based on 16S rRNA gene clone libraries and competitive PCR [66,67]. In this study, microbial profiles of the water environments (the rock-cavern tanks, water-supply tunnels, and groundwater) in the three bases were comprehensively characterized by 16S rRNA gene amplicon sequencing and used as environmental indicators for monitoring. In our previous study, we applied the microbial DNA-based monitoring to natural petroleum reservoirs (subsurface geological formations that contain trapped petroleum) in an oilfield [26]. The microbial communities in the rock-cavern tanks are significantly different from those observed in natural petroleum reservoirs. Although anaerobic microbes (such as methanogens and sulfate reducers) were detected in both environments, the former consist of mesophilic microorganisms with diverse metabolic traits (including both aerobic and anaerobic microbes), while the latter typically consist of thermophilic anaerobes [26]. Our results indicate that microbial DNA-based monitoring can provide novel insights into the in situ water environments within the underground rock-cavern tanks. Overall, such tanks harbor rich microbial ecosystems containing diverse species. However, the species compositions differed significantly among the tanks, most probably reflecting differences in the availability of electron acceptors (such as oxygen) and nutrients in the environments within the tanks. In the Kuji base, the metabolism of sulfur compounds (particularly, sulfur oxidation) is probably active in the rock-cavern tanks, in agreement with the previous study [66,67], which suggested the presence of a sulfur cycle in the tank. Sulfur compounds probably originated from the surrounding sulfur-rich environment, as sulfur mines and sulfur-rich springs are present in the vicinity of the Kuji base [68,69]. The microbial profiles of the tanks of the Kikuma base are relatively different from each other and suggest that nitrate reduction, sulfate reduction, and aerobic metabolism are relatively active in tanks T1, T2, and T3, respectively. As the Kikuma base is located close to residential areas and farmland, eutrophic water may be supplied from the surface to the tanks (particularly, T1 and T3). The tanks of the Kushikino base harbor mostly highly anoxic environments, where methanogenesis is active. In agreement with this observation, the evolution of methane was detected in the headspace gas of the tanks. Unlike other bases (where irrigation water is mainly used), the Kushikino base primarily employs a natural influx of groundwater for water sealing, which probably contributes to maintaining the anoxic conditions within the tanks. Metabolic activities of microbial communities in the water samples (e.g., methanogenic activity of the samples from the tanks of the Kushikino base) will be assessed in future studies to examine the above hypotheses. Thus, microbial profiles reveal characteristics of the in situ environments inside the rock-cavern tanks, which are useful for interpreting the results of other monitoring methods. In future studies, water samples will be collected periodically to analyze the possible impact of seasonal or annual environmental changes on microbial communities. Particularly, the temporal stability of microbial profiles of the tanks will be analyzed to determine if they represent persistent residents or transient populations, assessing their reliability as environmental indicators. Moreover, microbial profiles will be integrated with data obtained from other monitoring methods (e.g., physicochemical profiles of the water samples, such as concentrations of ions and dissolved oxygen) to clarify drivers of microbial community structures and further understand the in situ environments.
Our results also suggest that microbial profiles can be used to monitor the possible environmental impact of underground oil storage. The hierarchical clustering analysis indicates that the locations of the sampling sites (such as observation wells) relative to the rock-cavern tank can influence the microbial profiles of corresponding samples (Figure 7). For example, the distinct microbial profiles were notable in a group of samples from the observation wells directly above the tanks (KS-G1, 3, 5, and 7). Although the cause of such feature remains to be further studied, it must be noted that other monitoring methods (such as chemical analyses of the groundwater) have indicated no significant characteristic of these samples distinct from other samples. Therefore, microbial DNA-based monitoring can potentially provide an extremely sensitive measurement to detect possible environmental effects of underground oil storage. It must be noted that the limited number of samples (12–17 samples per base) may limit the ability to detect subtle differences, especially in groundwater. To capture spatial variability around the tanks, increasing sample size will be useful but practically hindered by the limited number of observation wells. To alleviate such limitations, natural spring water nearby the bases can also be included for monitoring in future studies.

5. Conclusions

This study demonstrated that microbial DNA-based monitoring provides valuable information on the in situ environments inside the rock-cavern tanks of the national petroleum stockpiling bases in Japan. The comprehensive analysis of microbial profiles suggested microbial metabolisms (such as methanogenesis, reduction/oxidation of sulfur compounds, nitrate reduction and aerobic metabolisms) are likely active within the storage tanks, which can potentially affect the secure operations of oil storage (e.g., methane evolution within the tanks). Moreover, it also revealed potential influences of surrounding environments on the ecosystems inside the storage tanks (e.g., influx of eutrophic water into the tanks). Furthermore, the comparative analysis of microbial profiles may act as an extremely sensitive measurement to detect the possible impact of underground oil storage on the proximal environments. Therefore, microbial DNA-based monitoring can contribute to ensuring the integrity of the strategic petroleum reserves. As a less-expensive and less-laborious passive monitoring technique, it also holds potential general applicability to various underground storage facilities worldwide. To improve the resolution and reliability, microbial DNA-based monitoring can be combined with the next-generation numerical simulation technologies integrated with artificial intelligence and real-time control systems [70,71], which are the recent focus of intensive research in the fields of energy/resource engineering [72].

Supplementary Materials

The following supporting information can be downloaded at: https://www.mdpi.com/article/10.3390/w17152197/s1, Figure S1. Beta-diversity index of Robust PCA and biplot with the confidence ellipse of the first three principal components of a data set of microbial profiles. Figure S2. Dendrogram of hierarchical clustering analysis of microbial profiles for rock-cavern tanks based on Aitchison distance results. Figure S3. 16S rRNA gene copy numbers of DNA extracted from t water samples from the Kushikino base.

Author Contributions

Conceptualization, A.G. and H.K.; methodology, A.G. and H.K.; formal analysis, A.G.; investigation, A.G., S.W., K.U., and Y.M.; resources, T.O. and H.K.; data curation, A.G. and H.K.; writing—original draft preparation, A.G.; writing—review and editing, T.O. and H.K.; visualization, A.G.; supervision, H.K.; project administration, A.G., T.O., and H.K.; funding acquisition, T.O. and H.K. All authors have read and agreed to the published version of the manuscript.

Funding

This study was supported by Japan Underground Oil Storage Co. and the Japan Society for the Promotion of Science (JSPS) Grant-in-Aid for Scientific Research (C) 21K04961 (to H.K.) and Grant-in-Aid for Scientific Research (B) 24K01414 (to H.K.).

Data Availability Statement

Raw reads of 16S rRNA gene amplicons were deposited in the Sequence Read Archive of the DNA Data Bank of Japan under the BioProject PRJDB19638.

Acknowledgments

The data used in this paper was obtained from the project carried out under contract from the Agency for Natural Resources and Energy regarding the National Petroleum Stockpiling Base. Japan Underground Oil Storage Co., Ltd. provided support for the sample collection and data interpretation. The Agency for Natural Resources and Energy agreed to submit this article for publication. JSPS is a nonprofit organization for the promotion of scientific research and is not directly involved in this study except for funding.

Conflicts of Interest

The authors declare no conflicts of interest. The funders had no role in the design of the study; in the collection, analyses, or interpretation of data; in the writing of the manuscript; or in the decision to publish the results. Author T. O. was employed by the company Japan Underground Oil Storage Co. The remaining authors declare that the research was conducted in the absence of any commercial or financial relationships that could be construed as a potential conflict of interest.

Abbreviations

The following abbreviations are used in this manuscript:
hhours
minminutes
mmeter
sseconds
kLkiloliter
mLmilliliter (10−3 dm3)
µLmilliliter (10−3 dm3)
µMmicro mol/dm3
ppm10−6 g per kilogram water
ngnanogram (10−9 g)
°Cdegree Celsius
%percent

References

  1. International Energy Agency (IEA). Japan Oil Security Policy. Part of Oil Security Policy. 18 August 2022. Available online: https://www.iea.org/articles/japan-oil-security-policy (accessed on 1 November 2024).
  2. Japan, Ministry of Economy, Trade and Industry. Japan’s Energy White Paper 2023. 2023. Available online: https://www.meti.go.jp/english/press/2023/0606_003.html (accessed on 1 November 2024).
  3. Petroleum & LP Gas Stockpiling, Japan Organization for Metals and Energy Security (JOGMEC). 2018. Available online: https://www.jogmec.go.jp/content/300320107.pdf (accessed on 1 November 2023).
  4. Kiyoyama, S. The Present State of Underground Crude Oil Storage Technology in Japan. Tunn. Undergr. Space Technol. 1990, 5, 343–349. [Google Scholar] [CrossRef]
  5. Watanabe, K.; Jodai, K.; Miyashita, K.; Oono, K.; Yamamoto, N.; Hirooka, S.; Kataoka, S. Influence of Earthquakes on the Rock Caverns of Underground Petroleum Stockpiling Bases. J. Groundw. Hydrol. 2022, 64, 21–34. (In Japanese) [Google Scholar] [CrossRef]
  6. Yoshida, H.; Ohto, Y.; Furui, D. Regarding the tsunami damage and the crisis measures by the earthquake on March 11, 2011 in the national oil stockpiling base in Kuji, Japan. Explosion 2011, 21, 111–116. (In Japanese) [Google Scholar] [CrossRef]
  7. Jodai, K.; Uede, K.; Honda, M.; Hasegawa, M.; Kojima, K.; Ogawa, T. Simplified Criteria for Daily Inspection of Water-Sealing Function Stability of Underground Oil Cavern. J. Jpn. Soc. Civ. Eng. Collect. Pap. C 2007, 63, 624–634. (In Japanese) [Google Scholar] [CrossRef]
  8. Yamashita, M.; Amadomari, T.; Hirai, T.; Bouno, H.; Suenaga, H. An Application of Fiber-Optic Temperature Measurement for Groundwater Behavior Monitoring at Underground Petroleum Stockpiling Base. J. Groundw. Hydrol. 2022, 64, 35–48. (In Japanese) [Google Scholar] [CrossRef]
  9. Morfeldf, C. Storage of Oil and Gas in Unlined Caverns. In Proceedings of the SPE European Spring Meeting, Amsterdam, The Netherlands, 29–30 May 1974. [Google Scholar] [CrossRef]
  10. Lindblom, U.E. History and Present Status of Hydrocarbon Storage in Excavated Rock Caverns. In Proceedings of the Rock Mechanics in Petroleum Engineering, Delft, The Netherlands, 29–31 August 1994. [Google Scholar] [CrossRef]
  11. Li, Y.; Zhang, B.; Shi, L.; Ye, Y. Dynamic Variation Characteristics of Seawater Intrusion in Underground Water-Sealed Oil Storage Cavern under Island Tidal Environment. Water 2019, 11, 130. [Google Scholar] [CrossRef]
  12. Zhang, H.; Zhang, B.; Li, Y.; Wang, L.; Li, Y.; Shi, L.; Wang, H. Probabilistic analysis of water-sealed performance in underground oil storage considering spatial variability of hydraulic conductivity. Sci. Rep. 2022, 12, 13782. [Google Scholar] [CrossRef]
  13. Lascelles, P.; Wan, J.; Robinson, L.; Allmon, R.; Evans, G.; Ursell, L.; Scott, N.M.; Chase, J.; Jablanovic, J.; Karimi, M.; et al. Applying Subsurface DNA Sequencing in Wolfcamp Shales, Midland Basin. In Proceedings of the SPE Hydraulic Fracturing Technology Conference and Exhibition, Woodlands, TX, USA, 24–26 January 2017. [Google Scholar] [CrossRef]
  14. Vigneron, A.; Alsop, E.B.; Lomans, B.P.; Kyrpides, N.C.; Head, I.M.; Tsesmetzis, N. Succession in the Petroleum Reservoir Microbiome through an Oil Field Production Lifecycle. ISME J. 2017, 11, 2141–2154. [Google Scholar] [CrossRef]
  15. Silva, J.; Ursell, L.; Percak-Dennett, E. Applying Subsurface DNA Diagnostics and Data Science in the Delaware Basin. In Proceedings of the SPE Hydraulic Fracturing Technology Conference and Exhibition, Woodlands, TX, USA, 23–25 January 2018. [Google Scholar] [CrossRef]
  16. Percak-Dennett, E.; Liu, J.; Shojaei, H.; Luke, U.; Thomas, I. High Resolution Dynamic Drainage Height Estimations Using Subsurface DNA Diagnostics. In Proceedings of the SPE Western Regional Meeting, San Jose, CA, USA, 23–26 April 2019. [Google Scholar] [CrossRef]
  17. Ursell, L.; Hale, M.; Menendez, E.; Zimmerman, J.; Dombroski, B.; Hoover, K.; Everman, Z.; Liu, J.K.; Shojaei, H.; Percak-Dennett, E.M.; et al. High Resolution Fluid Tracking from Verticals and Laterals Using Subsurface DNA Diagnostics in the Permian Basin. In Proceedings of the SPE/AAPG/SEG Unconventional Resources Technology Conference, Denver, CO, USA, 22–24 July 2019. [Google Scholar] [CrossRef]
  18. Schlecht, M.; Sawadogo, J.; Sadeghi, S.; Reeve, N.; Haggerty, M.; Liu, J.; Ursell, L. Improved Stacked Permian Development by Integrating DNA Diagnostics with Traditional Reservoir Analysis. In Proceedings of the SPE Annual Technical Conference and Exhibition, Virtual, 26–29 October 2020. [Google Scholar] [CrossRef]
  19. Sawadogo, J.; Haggerty, M.; Mallory, C.L.; Huchton, J.; DeAngelis, W.; Price, C. Impact of Completion Design and Interwell Communication on Well Performance in Full Section Development: A STACK Case Study Using DNA Based Diagnostics. In Proceedings of the SPE Annual Technical Conference and Exhibition, Virtual, 26–29 October 2020. [Google Scholar] [CrossRef]
  20. Sawadogo, J.; Ursell, L.; Reeve, N.; Schlecht, M. Mature Fields—Optimizing Waterflood Management through DNA Based Diagnostics. In Proceedings of the Abu Dhabi International Petroleum Exhibition & Conference, Abu Dhabi, United Arab Emirates, 9–12 November 2020. [Google Scholar] [CrossRef]
  21. Li, J.; Pang, Z.; Tian, L.; Zhao, H.; Bai, G. Variations of Stable Isotopes in Daily Precipitation in a Monsoon Region. Water 2022, 14, 2891. [Google Scholar] [CrossRef]
  22. Paruch, L.; Paruch, A.M. An Overview of Microbial Source Tracking Using Host-Specific Genetic Markers to Identify Origins of Fecal Contamination in Different Water Environments. Water 2022, 14, 1809. [Google Scholar] [CrossRef]
  23. Zhang, Y.; Dekas, A.E.; Hawkins, A.J.; Primo, J.C.; Gorbatenko, O.; Horne, R.N. Comparison of Microbial Profiling and Tracer Testing for the Characterization of Injector-Producer Interwell Connectivities. Water 2022, 14, 2921. [Google Scholar] [CrossRef]
  24. Zhang, Y.; Huang, T. DNA-Based Tracers for the Characterization of Hydrogeological Systems—Recent Advances and New Frontiers. Water 2022, 14, 3545. [Google Scholar] [CrossRef]
  25. Zhang, Y.; Horne, R.N.; Hawkins, A.J.; Primo, J.C.; Gorbatenko, O.; Dekas, A.E. Geological activity shapes the microbiome in deep-subsurface aquifers by advection, Proc. Natl. Acad. Sci. USA 2022, 119, e2113985119. [Google Scholar] [CrossRef] [PubMed]
  26. Kobayashi, H.; Goto, A.; Feng, X.; Uruma, K.; Momoi, Y.; Watanabe, S.; Sato, K.; Zhang, Y.; Horne, R.N.; Shibuya, T.; et al. Long-Term Microbial DNA-Based Monitoring of the Mature Sarukawa Oil Field in Japan. SPE Reserv. Eval. Eng. 2023, 26, 1110–1119. [Google Scholar] [CrossRef]
  27. Tang, P.; Zhang, W.; Wang, H.; Zhou, J.; Dang, Y.; Chao, Z. Analysis of the Hydromechanical Properties of Compact Sandstone and Engineering Application. Water 2023, 15, 2011. [Google Scholar] [CrossRef]
  28. Baker, G.C.; Smith, J.J.; Cowan, D.A. Review and re-analysis of domain-specific 16S primers. J. Microbiol. Methods. 2003, 55, 541–555. [Google Scholar] [CrossRef]
  29. Bolyen, E.; Rideout, J.R.; Dillon, M.R.; Bokulich, N.A.; Abnet, C.C.; Al-Ghalith, G.A.; Alexander, H.; Alm, E.J.; Arumugam, M.; Asnicar, F.; et al. Reproducible, Interactive, Scalable and Extensible Microbiome Data Science Using QIIME 2. Nat. Biotechnol. 2019, 37, 852–857. [Google Scholar] [CrossRef]
  30. Callahan, B.J.; McMurdie, P.J.; Rosen, M.J.; Han, A.W.; Johnson, A.J.A.; Holmes, S.P. Dada2: High-Resolution Sample Inference from Illumina Amplicon Data. Nat. Methods 2016, 13, 581–583. [Google Scholar] [CrossRef]
  31. Quast, C.; Pruesse, E.; Yilmaz, P.; Gerken, J.; Schweer, T.; Yarza, P.; Peplies, J.; Glöckner, F.O. The SILVA Ribosomal RNA Gene Database Project: Improved Data Processing and Web-Based Tools. Nucleic Acids Res. 2013, 41, D590–D596. [Google Scholar] [CrossRef]
  32. Yilmaz, P.; Parfrey, W.L.; Yarza, P.; Gerken, J.; Pruesse, E.; Quast, C.; Schweer, T.; Peplies, J.; Ludwig, W. The SILVA and “All-Species Living Tree Project (LTP)” Taxonomic Frameworks. Nucleic Acids Res. 2014, 42, D643–D648. [Google Scholar] [CrossRef]
  33. Glöckner, F.O.; Yilmaz, P.; Quast, C.; Gerken, J.; Beccati, A.; Ciuprina, A.; Bruns, G.; Yarza, P.; Peplies, J.; Westram, R.; et al. 25 Years of Serving the Community with Ribosomal RNA Gene Reference Databases and Tools. J. Biotechnol. 2017, 261, 169–176. [Google Scholar] [CrossRef]
  34. Bokulich, N.A.; Kaehler, B.D.; Rideout, J.R.; Dillon, M.; Bolyen, E.; Knight, R.; Huttley, G.A.; Caporaso, J.G. Optimizing Taxonomic Classification of Marker-Gene Amplicon Sequences with QIIME 2’s q2-Feature-Classifier Plugin. Microbiome 2018, 6, 90. [Google Scholar] [CrossRef] [PubMed]
  35. Robeson, M.S.; O’Rourke, D.R.; Kaehler, B.D.; Ziemski, M.; Dillon, M.R.; Foster, J.T.; Bokulich, N.A. RESCRIPt: Reproducible Sequence Taxonomy Reference Database Management. PLOS Comput. Biol. 2021, 17, e1009581. [Google Scholar] [CrossRef] [PubMed]
  36. Shannon, C.E.; Weaver, W. The Mathematical Theory of Communication; University of Illinois Press: Champaign, IL, USA, 1949. [Google Scholar]
  37. Pielou, E.C. The Measurement of Diversity in Different Types of Biological Collections. J. Theor. Biol. 1966, 13, 131–144. [Google Scholar] [CrossRef]
  38. Estaki, M.; Jiang, L.; Bokulich, N.A.; McDonald, D.; González, A.; Kosciolek, T.; Martino, C.; Zhu, Q.; Birmingham, A.; Vázquez-Baeza, Y.; et al. QIIME 2 enables comprehensive end-to-end analysis of diverse microbiome data and comparative studies with publicly available data. Curr. Protoc. Bioinform. 2020, 70, e100. [Google Scholar] [CrossRef]
  39. Kluyver, T.; Ragan-Kelley, B.; Pérez, F.; Granger, B.; Bussonnier, M.; Frederic, J.; Kelley, K.; Hamrick, J.; Grout, J.; Corlay, S.; et al. Jupyter Notebooks—A Publishing Format for Reproducible Computational Workflows. In Positioning and Power in Academic Publishing: Players, Agents and Agendas; IOS Press: Amsterdam, The Netherlands, 2016; pp. 87–90. [Google Scholar] [CrossRef]
  40. Spruyt, V. How to Draw an Error Ellipse Representing the Covariance Matrix. Computer Vision for Dummies. 3 April 2014. Available online: https://www.visiondummy.com/2014/04/draw-error-ellipse-representing-covariance-matrix (accessed on 1 November 2023).
  41. CarstenSchelp.github.io. Bits, Pieces, Nuts and Bolts on Data Analysis and Machine Learning. Schelp, C. An Alternative Way to Plot the Covariance Ellipse. Available online: https://carstenschelp.github.io/2018/09/14/Plot_Confidence_Ellipse_001.html (accessed on 1 November 2023).
  42. Ward, J.H. Hierarchical Grouping to Optimize an Objective Function. J. Am. Stat. Assoc. 1963, 58, 236–244. [Google Scholar] [CrossRef]
  43. Quinn, T.P.; Richardson, M.F.; Lovell, D.; Crowley, T.M. Propr: An R-Package for Identifying Proportionally Abundant Features Using Compositional Data Analysis. Sci. Rep. 2017, 7, 16252. [Google Scholar] [CrossRef]
  44. Jin, S.; Notredame, C.; Erb, I. Compositional Covariance Shrinkage and Regularised Partial Correlations. SORT 2023, 47, 245–268. [Google Scholar] [CrossRef]
  45. Rideout, J.R.; Caporaso, G.; Bolyen, E.; McDonald, D.; Baeza, Y.V.; Alastuey, J.C.; Pitman, A.; Morton, J.; Navas, J.; Gorlick, K.; et al. Scikit-Bio/Scikit-Bio: Scikit-Bio 0.6.0. Zenodo. 2024. [Google Scholar] [CrossRef]
  46. Virtanen, P.; Gommers, R.; Oliphant, T.E.; Haberland, M.; Reddy, T.; Cournapeau, D.; Burovski, E.; Peterson, P.; Weckesser, W.; Bright, J.; et al. SciPy 1.0: Fundamental Algorithms for Scientific Computing in Python. Nat. Methods 2020, 17, 261–272. [Google Scholar] [CrossRef]
  47. Everitt, B.S.; Landau, S.; Leese, M.; Stahl, D. Cluster Analysis, 5th ed.; Wiley Series in Probability and Statistics; King’s College London: London, UK, 2011. [Google Scholar]
  48. Murtagh, F.; Legendre, P. Ward’s Hierarchical Agglomerative Clustering Method: Which Algorithms Implement Ward’s Criterion? J. Classif. 2014, 31, 274–295. [Google Scholar] [CrossRef]
  49. Yu, Y.; Lee, C.; Kim, J.; Hwang, S. Group-Specific Primer and Probe Sets to Detect Methanogenic Communities Using Quantitative Real-Time Polymerase Chain Reaction. Biotechnol. Bioeng. 2005, 89, 670–679. [Google Scholar] [CrossRef] [PubMed]
  50. Gaines, W.L.; Richy, H.J.; Lehmkuhl, J.F. Monitoring Biodiversity: Quantification and Interpretation; PNW-GTR-443. General Technical Report; U.S. Department of Agriculture, Forest Service, Pacific Northwest Research Station: Washington, DC, USA, 1999; p. 27. [Google Scholar] [CrossRef]
  51. Francé, J.; Varkitzi, I.; Stanca, E.; Cozzoli, F.; Skejić, S.; Ungaro, N.; Vascotto, I.; Mozetič, P.; Gladan, Ž.N.; Assimakopoulou, G.; et al. Large-Scale Testing of Phytoplankton Diversity Indices for Environmental Assessment in Mediterranean Sub-regions (Adriatic, Ionian and Aegean Seas). Ecol. Indic. 2021, 126, 107630. [Google Scholar] [CrossRef]
  52. Bray, J.R.; Curtis, J.T. An Ordination of the Upland Forest Communities of Southern Wisconsin. Ecol. Monogr. 1957, 27, 325–349. [Google Scholar] [CrossRef]
  53. Aitchison, J.; Barceló-Vidal, C.; Martín-Fernández, J.A.; Pawlowsky-Glahn, V. Logratio Analysis and Compositional Distance. Math. Geosci. 2000, 32, 271–275. [Google Scholar] [CrossRef]
  54. Martino, C.; Morton, J.T.; Marotz, C.A.; Thompson, L.R.; Tripathi, A.; Knight, R.; Zengler, K. A Novel Sparse Compositional Technique Reveals Microbial Perturbations. mSystems. 2019, 4, e00016-19. [Google Scholar] [CrossRef]
  55. Gloor, G.B.; Macklaim, J.M.; Pawlowsky-Glahn, V.; Egozcue, J.J. Microbiome Datasets Are Compositional: And This Is Not Optional. Front. Microbiol. 2017, 8, 2224. [Google Scholar] [CrossRef]
  56. Malo, N.; Hanley, J.A.; Cerquozzi, S.; Pelletier, J.; Nadon, R. Statistical Practice in High-Throughput Screening Data Analysis. Nat. Biotechnol. 2006, 24, 167–175. [Google Scholar] [CrossRef]
  57. Gibson, G.R. Physiology and Ecology of the Sulphate-Reducing Bacteria. J. Appl. Bacteriol. 1990, 69, 769–797. [Google Scholar] [CrossRef]
  58. Smith, G.J.; Angle, J.C.; Solden, L.M.; Borton, M.A.; Morin, T.H.; Daly, R.A.; Johnston, M.D.; Stefanik, K.C.; Wolfe, R.; Gil, B.; et al. Members of the Genus Methylobacter Are Inferred To Account for the Majority of Aerobic Methane Oxidation in Oxic Soils from a Freshwater Wetland. mBio 2018, 9, e00815-18. [Google Scholar] [CrossRef]
  59. Kodama, Y.; Watanabe, K. Isolation and Characterization of a Sulfur-Oxidizing Chemolithotroph Growing on Crude Oil under Anaerobic Conditions. Appl. Environ. Microbiol. 2003, 69, 107–112. [Google Scholar] [CrossRef]
  60. Kodama, Y.; Watanabe, K. Sulfuricurvum kujiense gen. nov., sp. nov., a Facultatively Anaerobic, Chemolithoautotrophic, Sulfur-Oxidizing Bacterium Isolated from an Underground Crude-Oil Storage Cavity. Int. J. Syst. Evol. Microbiol. 2004, 54, 2297–2300. [Google Scholar] [CrossRef] [PubMed]
  61. Jones, K.M.; Kobayashi, H.; Davies, B.W.; Taga, M.E.; Walker, G.C. How rhizobial symbionts invade plants: The Sinorhizobium-Medicago model. Nat. Rev. Microbiol. 2007, 5, 619–633. [Google Scholar] [CrossRef] [PubMed]
  62. Ardissone, S.; Kobayashi, H.; Kambara, K.; Rummel, C.; Noel, K.D.; Walker, G.C.; Broughton, W.J.; Deakin, W.J. Role of BacA in Lipopolysaccharide Synthesis, Peptide Transport and Nodulation by Rhizobium sp. NGR234. J. Bacteriol. 2011, 193, 2218–2228. [Google Scholar] [CrossRef] [PubMed]
  63. Qiu, Y.-L.; Sekiguchi, Y.; Hanada, S.; Imachi, H.; Tseng, I.; Cheng, S.; Ohashi, A.; Harada, H.; Kamagata, Y. Pelotomaculum terephthalicum sp. nov. and Pelotomaculum isophthalicum sp. nov.: Two Anaerobic Bacteria That Degrade Phthalate Isomers in Syntrophic Association with Hydrogenotrophic Methanogens. Arch. Microbiol. 2006, 185, 172–182. [Google Scholar] [CrossRef]
  64. Spiers, A.J.; Buckling, A.; Rainey, P.B. The causes of Pseudomonas diversity. Microbiology 2000, 146, 2345–2350. [Google Scholar] [CrossRef]
  65. Silby, W.M.; Winstanley, C.; Godfrey, S.A.C.; Levy, S.B.; Jackson, R.W. Pseudomonas genomes: Diverse and adaptable. FEMS Microbiol. Rev. 2011, 35, 652–680. [Google Scholar] [CrossRef]
  66. Watanabe, K.; Kodama, Y.; Syutsubo, K.; Harayama, S. Molecular characterization of bacterial populations in petroleum-contaminated groundwater discharged from underground crude oil storage cavities. Appl. Environ. Microbiol. 2000, 66, 4803–4809. [Google Scholar] [CrossRef]
  67. Watanabe, K.; Kodama, Y.; Kaku, N. Diversity and abundance of bacteria in an underground oil-storage cavity. BMC Microbiol. 2002, 2, 23. [Google Scholar] [CrossRef]
  68. Nakamura, H.; Sumi, K. Geothermal Investigations of Matsukawa Hot Spring area. Bull. Geol. Surv. Jpn. 1958, 12, 73–84. (In Japanese) [Google Scholar]
  69. Imai, A.; Shikazono, N.; Shimizu, M.; Shimazaki, H. Sulfur Isotope Study on Hg and Sb Deposits in Japan. Resour Geol. 2006, 56, 37–48. [Google Scholar] [CrossRef]
  70. Aljubran, M.J.; Horne, R.N. Thermal Earth model for the conterminous United States using an interpolative physics-informed graph neural network. Geotherm. Energy 2024, 12, 25. [Google Scholar] [CrossRef]
  71. Yang, H.; Yu, C.; Wang, S.; Scheirer, A.H.; Kong, X.; Zhao, H.; Yang, X.; Wang, S.; Jiang, L. DNA-sequencing method maps subsurface fluid flow paths for enhanced monitoring. Commun. Earth Environ. 2025, 6, 306. [Google Scholar] [CrossRef]
  72. Sun, S.; Firoozabadi, A.; Wheeler, M. Introduction of COMPES: Finding directions in energy and computational science. Comput. Energy Sci. 2024, 1, 1–2. [Google Scholar] [CrossRef]
Figure 1. Schematic of the crude oil storage using an underground water-sealed rock-cavern tank.
Water 17 02197 g001
Figure 2. Schematic maps of the Kuji (a), Kikuma (b), and Kushikino (c) national petroleum stockpiling bases. T1, T2 and T3 are colored purple, pink, and green, respectively. Sampling locations are indicated by sample names, as listed in Table 2. Access tunnels are also indicated (dashed lines).
Water 17 02197 g002
Figure 3. Workflow diagram of microbial DNA-based monitoring of the underground oil-storage bases.
Water 17 02197 g003
Figure 4. Microbial profiles of samples from the Kuji, Kikuma, and Kushikino bases based on 16S rRNA gene amplicon sequencing. The relative abundance (%) of major taxonomic groups (class level) is shown along with their classification at the domain level on the right-hand side. The horizontal axis shows sample names. Taxonomic assignment was performed with QIIME 2. Taxa representing >5% of assignable sequences in at least one sample are shown. Taxa representing ≤5% of sequences in all samples and groups assigned to an unclassified class are grouped in the “Others” category.
Water 17 02197 g004
Figure 5. Alpha-diversity indexes of microbial profiles of samples at the species level. Shannon’s diversity and Pielou’s evenness indices are shown as bar and point plots. The horizontal axis shows the sample names.
Water 17 02197 g005
Figure 6. Beta-diversity index of robust PCA plot with the confidence ellipse of the first three principal components of a data set of microbial profiles. Ellipses are drawn at 95% confidence intervals per base, providing a map of how the bases relate to each other. The first component explains 73.4% of the variation, the second component 21.2%, and the third component 5.4%. Symbols are colored red, blue, or green for the Kuji, Kikuma and Kushikino bases, respectively. Symbols represent sample types (circles, triangles, squares, and diamonds represent waters inside the rock-cavern tanks, irrigation waters, feedwaters, and groundwaters, respectively).
Water 17 02197 g006
Figure 7. Dendrogram of hierarchical clustering analysis of microbial profiles based on Aitchison distance results. Ward’s linkage method was used to cluster microbial profiles, which are labeled with sample names. Kuji, Kikuma and Kushikino are colored red, blue, and green, respectively. Assigned clusters are shown on the right-hand side.
Water 17 02197 g007
Figure 8. Normalized robust Z-score heatmap of samples from rock-cavern tanks of Kuji, Kikuma, and Kushikino bases based on 16S rRNA gene amplicon sequences at the genus level. Taxonomic assignment was performed with QIIME 2. Taxa representing >3% of assignable sequences in at least one sample are shown. For groups assigned to unclassified genera, their classifications at higher taxonomic levels are shown in parentheses.
Water 17 02197 g008
Figure 9. 16S rRNA gene copy numbers of DNA extracted from the rock-cavern tanks. Copy numbers were quantified by qPCR using primer-probe sets for the 16S rRNA genes of the domains Archaea (filled diamonds) and Bacteria (open triangles). Mean values from triplicate measurements are plotted with standard errors (error bars). The horizontal axis shows the sampled tanks.
Water 17 02197 g009
Table 1. Characteristics of the rock-cavern tanks.
KujiKikumaKushikino
Location (prefecture)IwateEhimeKagoshima
Rock typeGraniteGraniteAndesite
Year of construction1989–19921989–19921988–1991
Year of oil in199319941993
Tank capacity (kL)1.75 million1.5 million1.75 million
Cavern dimension,
W × H × L (m)
18 × 22 × 54020.5 × 30 × 230 − 44818 × 22 × 555
Mean sea level (m)−20 to −42−35 to −65−20 to −42
Subsurface depth (m)Under −100−65 to −100Under −100
Total water inflow (m3/day) *4600200320
Feedwater supply (m3/day) *200040 to 5020 to 40
Note: * Measurement date is the end of November 2020.
Table 2. Sampling location information. Samples from Kuji were obtained in November 2020, from Kikuma in December 2021, and from Kushikino in January 2023.
KujiKikumaKushikino
Tank (T)KJ-T1/T2/T3KI-T1/T2/T3KS-T1/T2/T3
Irrigation water (I)KJ-I1/I2/I3KI-IKS-I1/I2/I3
Feedwater (F)KJ-F-KS-F1/F2
Groundwater (G)KJ-G1 to G10KI-G1 to G8KS-G1 to G8
Sample number171216
Disclaimer/Publisher’s Note: The statements, opinions and data contained in all publications are solely those of the individual author(s) and contributor(s) and not of MDPI and/or the editor(s). MDPI and/or the editor(s) disclaim responsibility for any injury to people or property resulting from any ideas, methods, instructions or products referred to in the content.

