Article

Exploration of Phosphorus Release Characteristics in Sediments from the Plains River Network: Vertical Distribution and the Response of Phosphorus and Microorganisms

College of Environmental Science and Engineering, Donghua University, Shanghai 201620, China
*
Author to whom correspondence should be addressed.
Water 2025, 17(15), 2196; https://doi.org/10.3390/w17152196
Submission received: 5 June 2025 / Revised: 18 July 2025 / Accepted: 20 July 2025 / Published: 23 July 2025

Abstract

Plains River networks are important natural ecosystems that play a vital role in storing, draining, conserving, and purifying water. This study selected the river network in the northern plain of Jiaxing as the research area. Samples were collected in October 2023. Sediments were collected using a sampler and divided into five layers according to the collection depth, namely the surface layer (5 cm), the second layer (15 cm), the third layer (25 cm), the fourth layer (35 cm), and the bottom layer (45 cm). This study analyzed the vertical distribution of each form of phosphorus, the vertical distribution of the microbial community, and the response between the two in the sediments of this plain river network. The results showed high sediment TP concentrations (633.9–2534.7 mg/kg) in this plain river network. The vertical distribution trend of Fe-P was almost the same as that of TP and had the highest concentration (134.9–1860.1 mg/kg). Ca-P is the second highest phosphorus content, which is also an inert phosphorus component, as well as Al-P, and both exhibit a relatively low percentage of surface layers. Proteobacteria, Firmicutes, Bacteroidetes, and Actinobacteria showed heterogeneity in the vertical distribution of sediments. The river network sediments in the Plains River have a high potential for phosphorus release, with most sites acting as phosphorus “sources”. The sediments in the second of these layers show a strong tendency to release phosphorus. Bottom sediments have a low capacity to both adsorb and release phosphorus. The findings of this study will provide a theoretical foundation for the prevention and management of river networks in this plain.

1. Introduction

Phosphorus is a major limiting factor for biological growth [1], and fluctuations in phosphorus concentration can directly affect the eutrophication status of the overlying water. Excess phosphorus in water can lead to aquatic plant blooms, algae growth, and dissolved oxygen depletion [2]. Phosphorus in water bodies comes from nonpoint (exogenous phosphorus) and point (endogenous phosphorus) nutrient sources. Even if exogenous phosphorus inputs are controlled, the continued release of endogenous phosphorus can still cause water quality damage [3]. It is evident that phosphorus in sediments exerts a significant influence on the phosphorus concentration in the overlying water. It is imperative to investigate the current status of phosphorus in sediments and the potential risk of its release.
Phosphorus in sediments exists in a variety of forms. Phosphorus can be categorized as TP (total phosphorus), OP (organic phosphorus), L-P (soluble and loosely bound phosphorus), Fe-P (iron-bound phosphorus), Al-P (aluminum-bound phosphorus), Ca-P (calcium-bound phosphorus), and BD-P (reductant soluble phosphorus). The collective term “mobile phosphorus” is used to refer to L-P, Fe-P, and OP [4]. Phosphorus is unevenly distributed in the soil environment [5]. The analysis of surface sediment phosphorus concentrations alone is insufficient for determining the phosphorus status of sediments. This underscores the necessity of examining the vertical profiles of sediment phosphorus at various depths. Prior research has examined the spatial heterogeneity of soil total phosphorus (TP) at various spatial scales [6]. Research [7] has reported the vertical distribution of inorganic phosphorus in wetlands. Research [8] has also explored the distribution of phosphorus by depth in sediments at different times of cyanobacterial growth.
The effectiveness of phosphorus in soil is subject to mediation by a range of biotic and abiotic factors [9]. The soil microbial community (biotic factor) plays a pivotal role in the soil phosphorus cycle [10]. On the one hand, soil microorganisms can promote the utilization of effective phosphorus by releasing hydrolytic enzymes to mineralize organic phosphorus and transform difficult-to-degrade phosphorus [11]. On the other hand, effective phosphorus limitation can be mitigated by regulating the community composition of microorganisms involved in phosphorus cycling [12]. Changes in microorganisms cause changes in the characteristics of the ecosystem. Therefore, understanding microbial communities is essential for exploring water ecosystems.
Subterranean microorganisms also exhibit vertical heterogeneity [13]. In recent years, research [14] reported the response of soil particle size to the vertical distribution of microorganisms. Research [15] investigated the vertical distribution of microorganisms in relation to the properties of soil depth. Research [16] also reported different vertical distributions of microbial biomass with soil depth. Nevertheless, only a limited number of studies have provided comprehensive insights into the vertical distribution of phosphorus in sediments, particularly in conjunction with the vertical distribution of microorganisms. Vertical distribution characteristics and content of each form of phosphorus may be related to the vertical distribution of microorganisms.
The Plains River network watershed, situated in the southern region of Lake Taihu, was selected as the study site for this investigation. The network is located at the outlet of Lake Taihu, which may result in the backfilling of water from the network into Lake Taihu. It is necessary to analyze the nutrient status of this river network to provide certain theoretical ideas for the management of Taihu Lake and the river network. The analytical objectives that we wanted to achieve in this study were (1) to study the vertical distribution of phosphorus in the sediment in all its forms, (2) to assess the risk of phosphorus release from each layer of sediment, (3) to determine the vertical distribution of the microbial community in the sediment, and (4) to analyze the response of phosphorus to the microorganisms in terms of vertical distribution.

2. Materials and Methods

2.1. Study Site and Sample Collection

The river network in the northern plain of Jiaxing was selected as the study site (Figure 1). The point map in Figure 1 shows all the points used in the project, and there are a large number of them. For the current study, considering the workload, the number of points has been reduced. Points 3, 10, 14, 18, 19, and 20 were selected as the research objects of this paper because these areas are representative. Samples were collected in October 2023. The sediment was collected using a sampler, and the samples were subsequently categorized into five layers according to the depth at which they were collected. These layers were designated as follows: surface (5 cm), second layer (15 cm), third layer (25 cm), fourth layer (35 cm), and bottom layer (45 cm). Additionally, the overlying water was collected as water samples, and the water temperature and pH were determined on-site using a multiparameter water quality meter (HACH HQ40d). All samples were transported back to the laboratory within 12 h for pre-treatment. Sediment microbial samples were stored in a −80 °C refrigerator. The sample’s SRP was determined spectrophotometrically (UV-1900i, Shimadzu Enterprise Management Co., Ltd., Kyoto, Japan) in accordance with the procedure outlined in the Chinese Environmental Standard Law. Phosphorus TP, Fe-P, OP, L-P, BD-P, Al-P, and Ca-P in sediment forms were determined with reference to the previous literature [17].

2.2. Experimental Methods

The following steps constitute the sediment adsorption isotherm experiment for phosphorus: A total of 0.2 g of each sediment sample was transferred to a 100-milliliter conical flask containing a KH2PO4 solution of varying concentrations (0, 1, 2, 5, 10, 15, and 20 milligrams per liter). The conical flasks were hermetically sealed and subjected to agitation in a thermostatic shaker at 220 rpm for 18 h at a temperature of 25 ± 1 °C. Following the cessation of oscillation, the supernatant was isolated, and the phosphate concentration in the filtrate was quantified by molybdenum-antimony spectrophotometry, after the sample had been filtered through a 0.45 μm membrane [18].

2.3. Methods of Analysis

The calculation method for the P adsorption capacity Qt (mg/L) of sediment is as follows:
Q t = C 0 C t V W
The location of the experiment is as follows: C0 represents the initial concentration of the P solution, expressed in milligrams per liter (mg/L). Ct denotes the concentration of P at a given time point (t) during the reaction process, also expressed in mg/L. V is the volume of solution in liters. W is the mass of sediment in grams. When the adsorption process reaches equilibrium, Ct and Qt are expressed as Ce and Qe, respectively.
The modified Freundlich isothermal adsorption model is as follows [19]:
Q e = K f C e n K f C e 0 n Q e 0
NAP =   K f ( C e 0 ) n + Q e 0
EP C 0 F = NAP K f n
The location of the aforementioned item is as follows: In this context, Kf represents the adsorption coefficient, expressed in L/g. The value of n is a constant, while EPC0F denotes the concentration of P at the equilibrium system of adsorption and desorption, expressed in mg/L. Additionally, NAP signifies the sum of weakly adsorbed P in the equilibrium system, along with the weakly adsorbed P adsorbed on the surface of the sediment, expressed in mg/g [20].
The method for determining whether sediments act as “sources” or “sinks” of P in overlying waters:
δ = S R P n E P C 0 n
The location of the aforementioned item is as follows: SRP represents the orthophosphate concentration in the overlying water, expressed in milligrams per liter. When δ is less than zero, the sediment is classified as a “source” of phosphorus; conversely, when δ is greater than zero, the sediment is identified as a “sink” of phosphorus.

2.4. Microbial Sequencing

Following their return to the laboratory, all sediment samples were stored in a refrigerator at −80 °C. Microbial sequencing was then commissioned by TinyGene Bio-Tech (Shanghai, China) Co., Ltd. A PowerSoil DNA Isolation Kit (Mobio Laboratories Inc., San Diego, CA, USA) was utilized in accordance with the manufacturer’s instructions to extract DNA from the sediments. One end of the DNA fragment is complementary to the primer base and fixed in place on the chip. The opposite end is randomly coupled with another nearby primer and is also immobilized, forming a “bridge.” Polymerase chain reaction (PCR) amplification is employed to produce DNA clusters. The DNA amplicon is linearized to a single-stranded configuration. Modified DNA polymerase and dNTP with four fluorescent markers are introduced, with the synthesis of a single base occurring in each cycle. The surface of the reaction plate was scanned with a laser to ascertain the type of nucleotide that had been polymerized in the initial round of reactions for each template sequence. The chemical cleavage of the “fluorescent group” and the “termination group” is conducted in order to facilitate the polymerization of the second nucleotide. The fluorescent signals collected in each round are counted, thus enabling the sequence of the template DNA fragment to be determined.
To facilitate the storage and sharing of high-throughput sequencing data generated by various laboratories, the NCBI Data Center has established a large-capacity database, SRA (Sequence Read Archive, http://www.ncbi.nlm.nih.gov/Traces/sra, accessed on 18 October 2023.), to store and share raw sequencing data, as shown below:
@HWI-ST531R:144:D11RDACXX:4:1101:1212:1946 1:N:0:ATTCCT
ATNATGACTCAAGCGCTTCCTCAGTTTAATGAAGCTAACTTCAATGCTGAGATCGTTGACGACATCGAATGGGAACTTCAATGC
+HWI-ST531R:144:D11RDACXX:4:1101:1212:1946 1:N:0:ATTCCT
?A#AFFDFFHGFFHJJGIJJJICHIIIIJJGGHIIJJIJIIJIHGIOFEHIIJBFFHGJJJIHHHDFFFFDIJIIJIIHJKU

2.5. Data and Statistical Analysis

The experimental data were processed in Excel, plotted using Origin 2022, and mapped based on ArcGIS 10.8 for the sampling points. Subsequently, Pearson’s correlation analysis was carried out for each physicochemical parameter using IBM SPSS Statistics 25.

3. Results and Discussion

3.1. The Vertical Distribution Characteristics of Various Forms of Phosphorus in Sediments

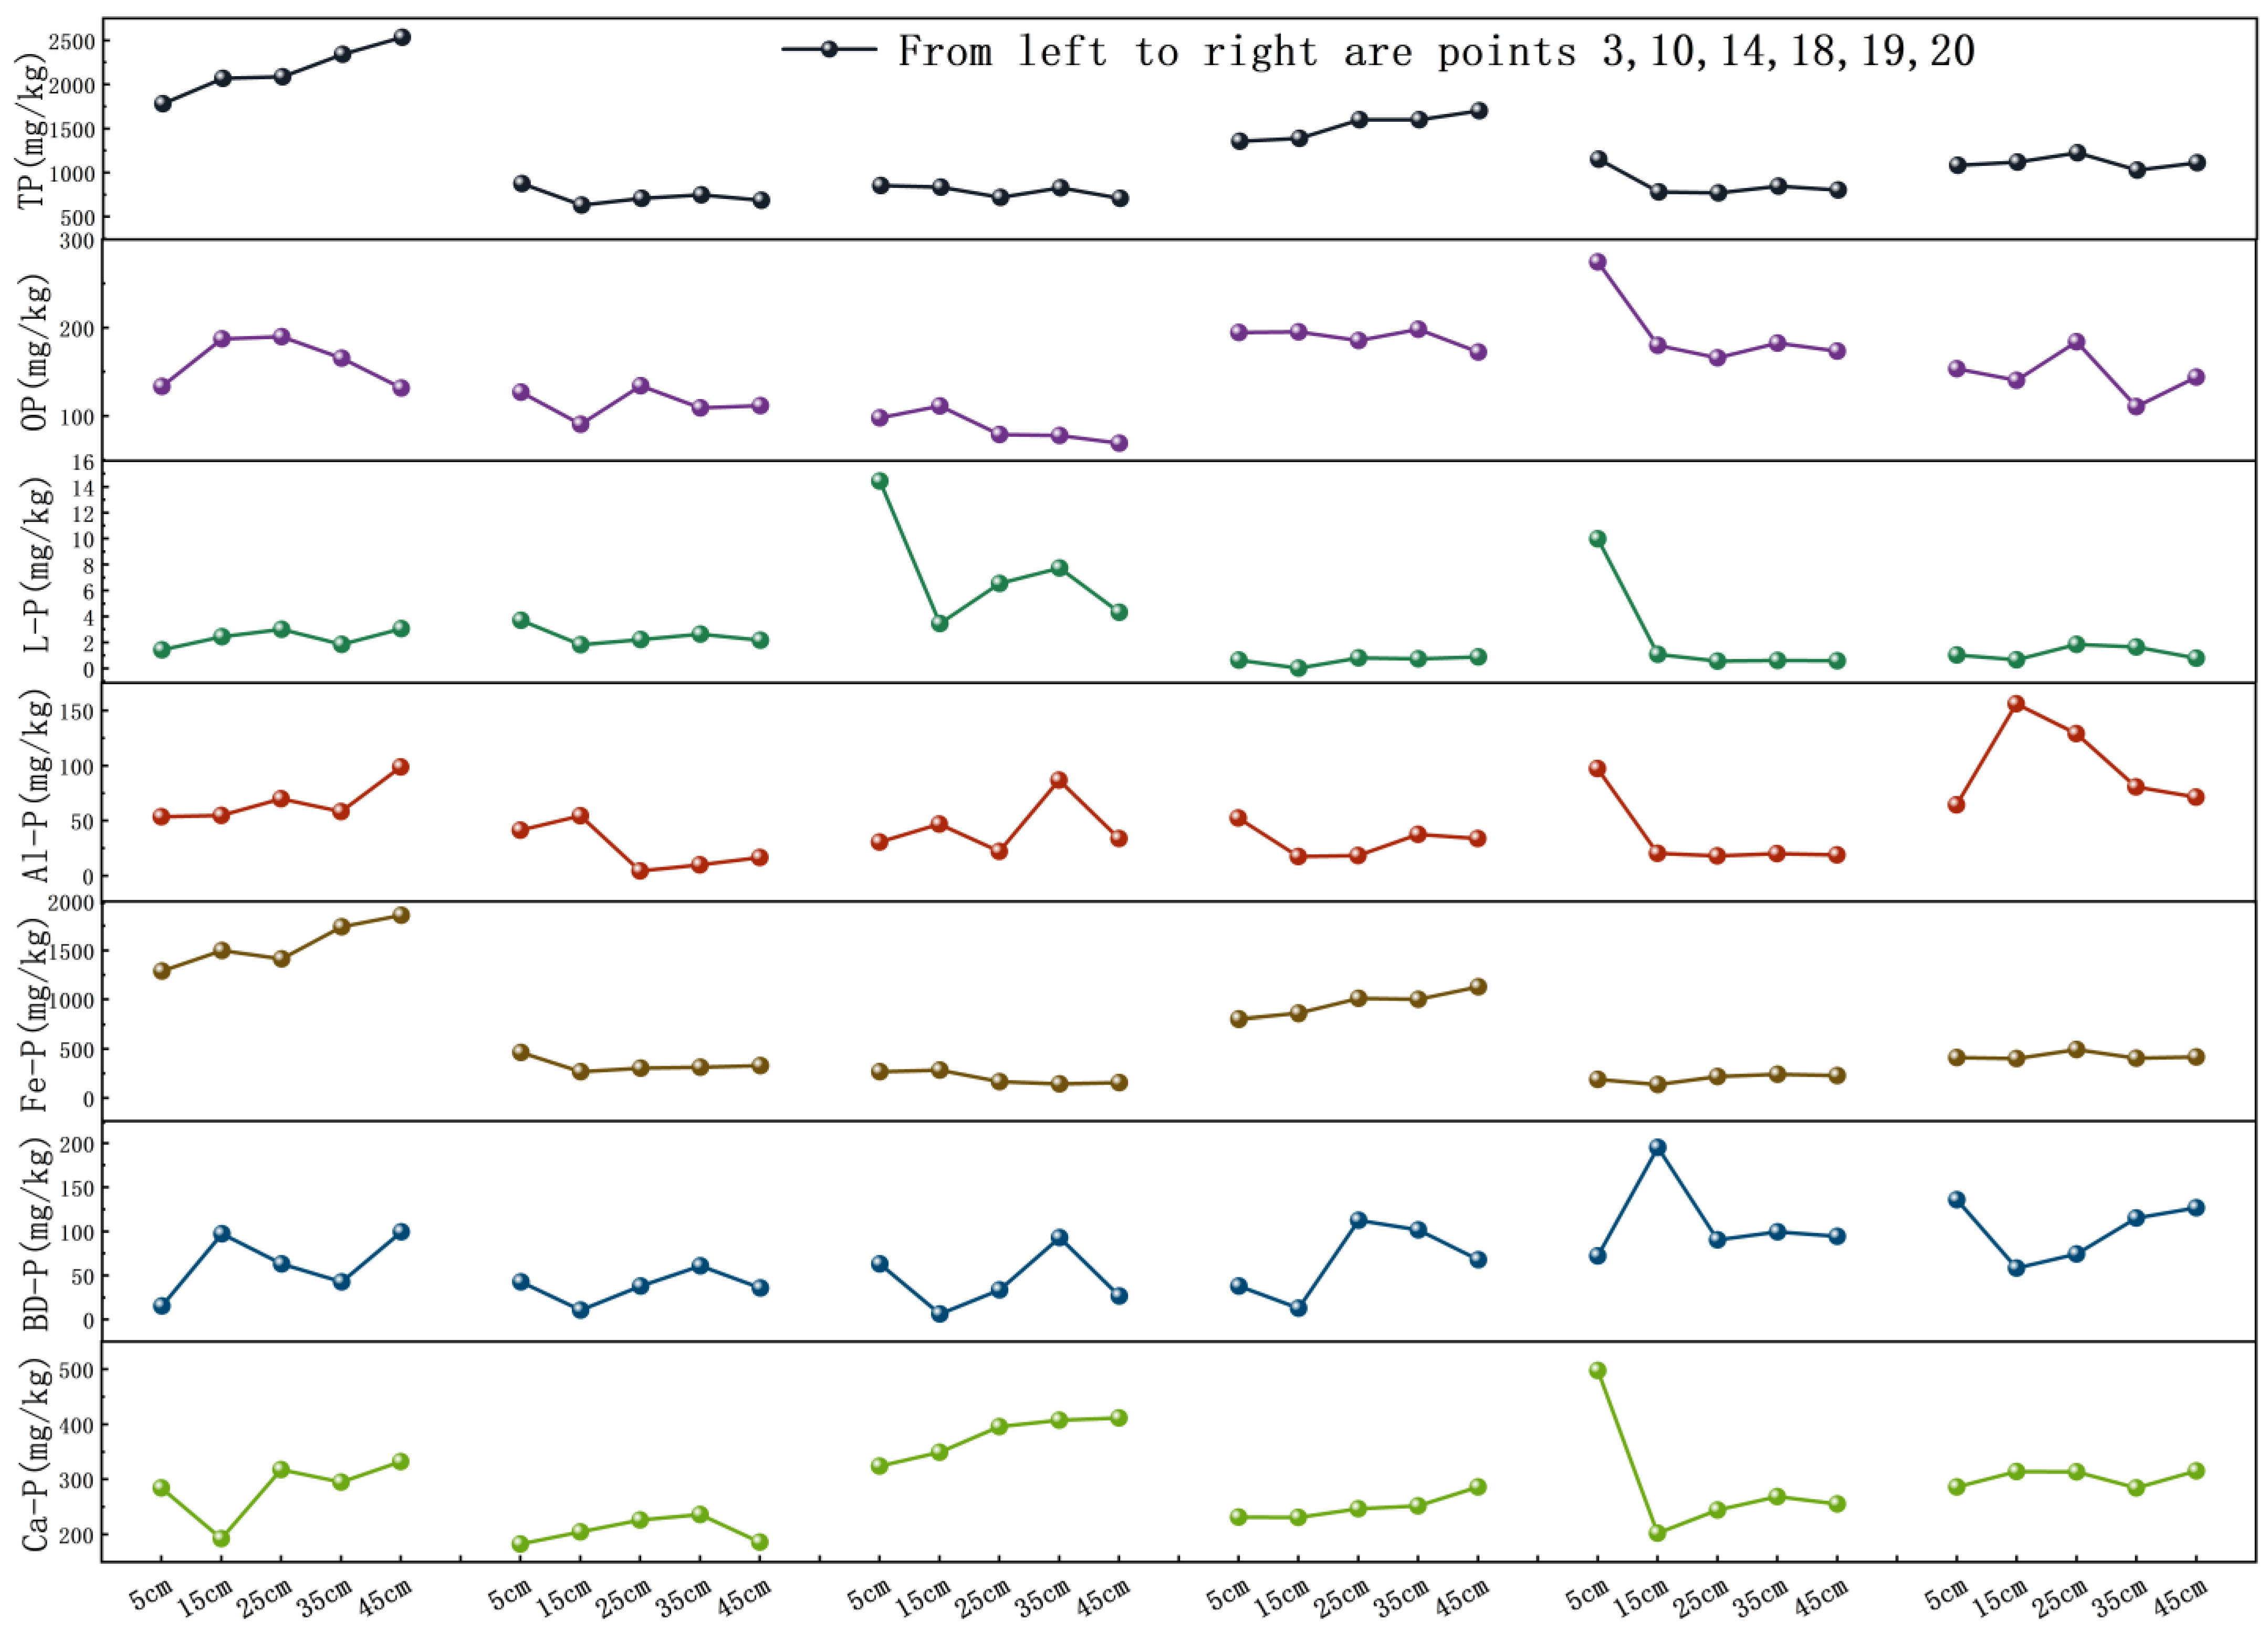
3.1.1. Sediment Phosphorus Vertical Distribution

Figure 2 illustrates the distinctive attributes and patterns of vertical distribution of individual forms of phosphorus across the sedimentary layers. TP concentrations range from 633.9 to 2534.7 mg/kg, which is relatively high [6]. Fluctuating surface-to-bottom concentrations related to phosphorus input, output, and accumulation in the sediments [21]. It can be clearly seen that the TP concentration at site 3 is significantly higher than at the other sites. This is mainly because the lakeshore is surrounded by paddy fields and artificial fishponds, and the influx of large quantities of fertilizers and feeds increases the levels of phosphorus in the sediments [22]. The adsorption of phosphorus in sediments is primarily facilitated by clay minerals, metal (Fe, Mn, and Al) oxides, and hydroxides. Phosphorus adsorbed on inorganic components becomes inorganic phosphorus [23], and organic phosphorus is contained in settled organic matter [24]. Furthermore, certain microorganisms are capable of accumulating phosphorus in the form of polyphosphates [25].
Analyzing TP concentrations alone does not assess the trophic status of sediments. Generally, assessing the concentration of each form of phosphorus is a more accurate representation of the specifics of the sediment. Because the release potentials of phosphorus in different forms are distinct. OP concentrations showed the same fluctuating changes as TP, and the fluctuations were greater. OP concentrations ranged from 68.75–274.49 mg/kg, accounting for 5.19–23.84% of TP. In terms of percentage (Figure 3), the surface layer (5 cm) has the lowest percentage of OP, and the middle layer (35 cm) has the highest percentage of OP. OP is mainly found in a variety of organisms, the composition is more complex and can be diffused into the overlying water through hydrolysis, mineralization, resuspension, and diffusion [24]. L-P accounted for 0.00132–1.69% of the TP concentration, and this form had the lowest phosphorus concentration (0.0183–14.43 mg/kg). This is consistent with previous findings [26]. Although L-P is low in most lake sediments, a previous study showed that L-P had the highest bioavailability of phosphorus of the six groups of forms [27]. Al-P concentrations ranged from 4.41–155.98 mg/kg and accounted for 0.62–13.91% of TP. Al-P concentrations in the present study were slightly lower than in previous studies [28]. The concentration share of Al-P can be clearly observed to be higher in all bottom layers than in the surface layer. Because Al-P is not easily released, phosphorus in the surface mesocosm may flow into the bottom layer with the pore space and eventually become permanently buried in the sediments. Fe-P accounted for 16.5–74.4% of TP and was the most abundant form of phosphorus, as well as the one that was readily released. It is noteworthy that the vertical concentration change of Fe-P is almost the same as that of TP. This phenomenon may be caused by the high Fe-P occupancy. The vertical concentrations of BD-P exhibited greater variability and constituted a smaller proportion of the total. Ca-P was the second-highest phosphorus content and had the lowest percentage in the surface layer. It and Al-P are also inert phosphorus fractions, and both exhibit a relatively low percentage of surface layers. This is mainly because inert phosphorus is often buried in sediments where it is not easily dissolved.

3.1.2. The Vertical Distribution Characteristics of Mobile Phosphorus in Sediments

Loosely adsorbed phosphorus, iron-bound phosphorus, and organic phosphorus are collectively referred to as mobile phosphorus [29]. The movement of phosphorus from sediments can be assessed more efficiently based on the mobile phosphorus fraction than on the total phosphorus content [8]. Therefore, this study focuses on a separate analysis of removable phosphorus. The range of mobile phosphorus concentrations was 229.3–1994.8 mg/kg, with a range of 27.6–81.7%. This concentration is higher than the results of previous studies of Dianchi [30]. In addition to this, the surface sediment mobile phosphorus concentration in Chaohu Lake was 205 mg/kg [31]. The surface sediment mobile phosphorus concentration in Lake Taihu was 181 mg/kg [26]. From Figure 3, it can be seen that the mobile phosphorus concentration at site 3 is significantly higher than at the other sites. The concentration of mobile phosphorus at each site is similar to the distribution of TP concentrations. This indicates that the higher the level of sediment contamination, the higher the percentage of mobile phosphorus in the sediment. All but points 18 and 19 showed the lowest bottom-movable phosphorus content. This may be related to the fact that the OP in the surface mesocosm is more susceptible to hydrolysis, mineralization, resuspension and diffusion [24]. It may also be related to the dissolved oxygen in the sediment as well as the oxidation-reduction potential (ORP). Hypoxia and low ORP states promote the conversion of Fe3+ and thus the dissolution of Fe-P [32].

3.2. Sediment Release Characteristics

3.2.1. Parameters of Phosphorus Adsorption in Sediments

A modified Freundlich isothermal adsorption model was used to fit the adsorption-resolved state of phosphorus in each sediment layer. Isothermal adsorption for 0 min can be found to be negative at this time, indicating that a resolved release state occurs at lower phosphorus concentrations (Figure S1). As the adsorption time increases, the sediments gradually enter the adsorption state and the adsorption rate increases. The R2 of the points fitted by the Freundlich model were 0.943–0.981, 0.956–0.976, 0.897–0.982, 0.867–0.992, 0.927–0.947, and 0.905–0.970, respectively. The application of Freundlich’s equation is an effective method for characterizing the adsorption of phosphorus from sediments. This approach allows for the identification of crucial parameters, such as the maximum phosphorus uptake and the equilibrium constant of the adsorption reaction.
Parameters such as NAP, EPC0, and KF, which can represent the ability of sediment to release phosphorus by adsorption, were fitted by the Freundlich isothermal adsorption model (Figure 4). EPC0 characterizes the ability of sediments to buffer exogenous phosphorus and immobilize endogenous phosphorus, with higher values indicating a stronger tendency of release [33]. Phosphorus adsorbed to the sediment at EPC0 is referred to as naturally adsorbed phosphorus (NAP) [34], with higher values representing easier release from the sediment. The KF value reflects the relative affinity of the sediment for phosphate, with higher values indicating greater sediment adsorption capacity [35]. High EPC0 and low KF indicate a high capacity for phosphorus release, and low EPC0 and high KF indicate a high capacity for phosphorus adsorption [36]. It can be clearly seen that NAP and EPC0 are lower in the surface layer than in the second layer (15 cm), whereas the KF values are higher in the surface layer, which indicates that the surface sediment has a somewhat stronger ability to adsorb phosphorus compared with the middle layer. Sediments in the second layer show a stronger tendency to release phosphorus. The adsorption parameters in the bottom layer (45 cm) were all lower, indicating that the bottom sediments have a lower capacity to adsorb and release phosphorus. Phosphorus concentrations were generally low in the second layer (15 cm). Phosphorus concentration fluctuations are influenced by a variety of factors, possibly more releases, possibly more microbial perturbations, and possibly physical factors such as temperature and pH. In conclusion, the phenomenon echoes the above conclusion that the second layer (15 cm) of sediment is more capable of releasing phosphorus.

3.2.2. Sediment “Source” and “Sink” Role Determination

The difference between EPC0 and SRP determines whether sediment plays a “source” or “sink” role [37]. At EPC0-SRP > 0, sediments act as a “source” of phosphorus and are at risk of releasing phosphorus to the overlying water. At EPC0-SRP < 0, sediments act as phosphorus “sinks” and are at risk of adsorbing phosphorus. And when the difference between parameter EPC0 and SRP is larger, the role of “source” or “sink” is more significant. As can be seen from Figure 4B, all points show EPC0 > SRP, except for point 19 and very few stratifications. This suggests that the majority of sediments act as phosphorus “sources” with a tendency to release phosphorus to the overlying water.

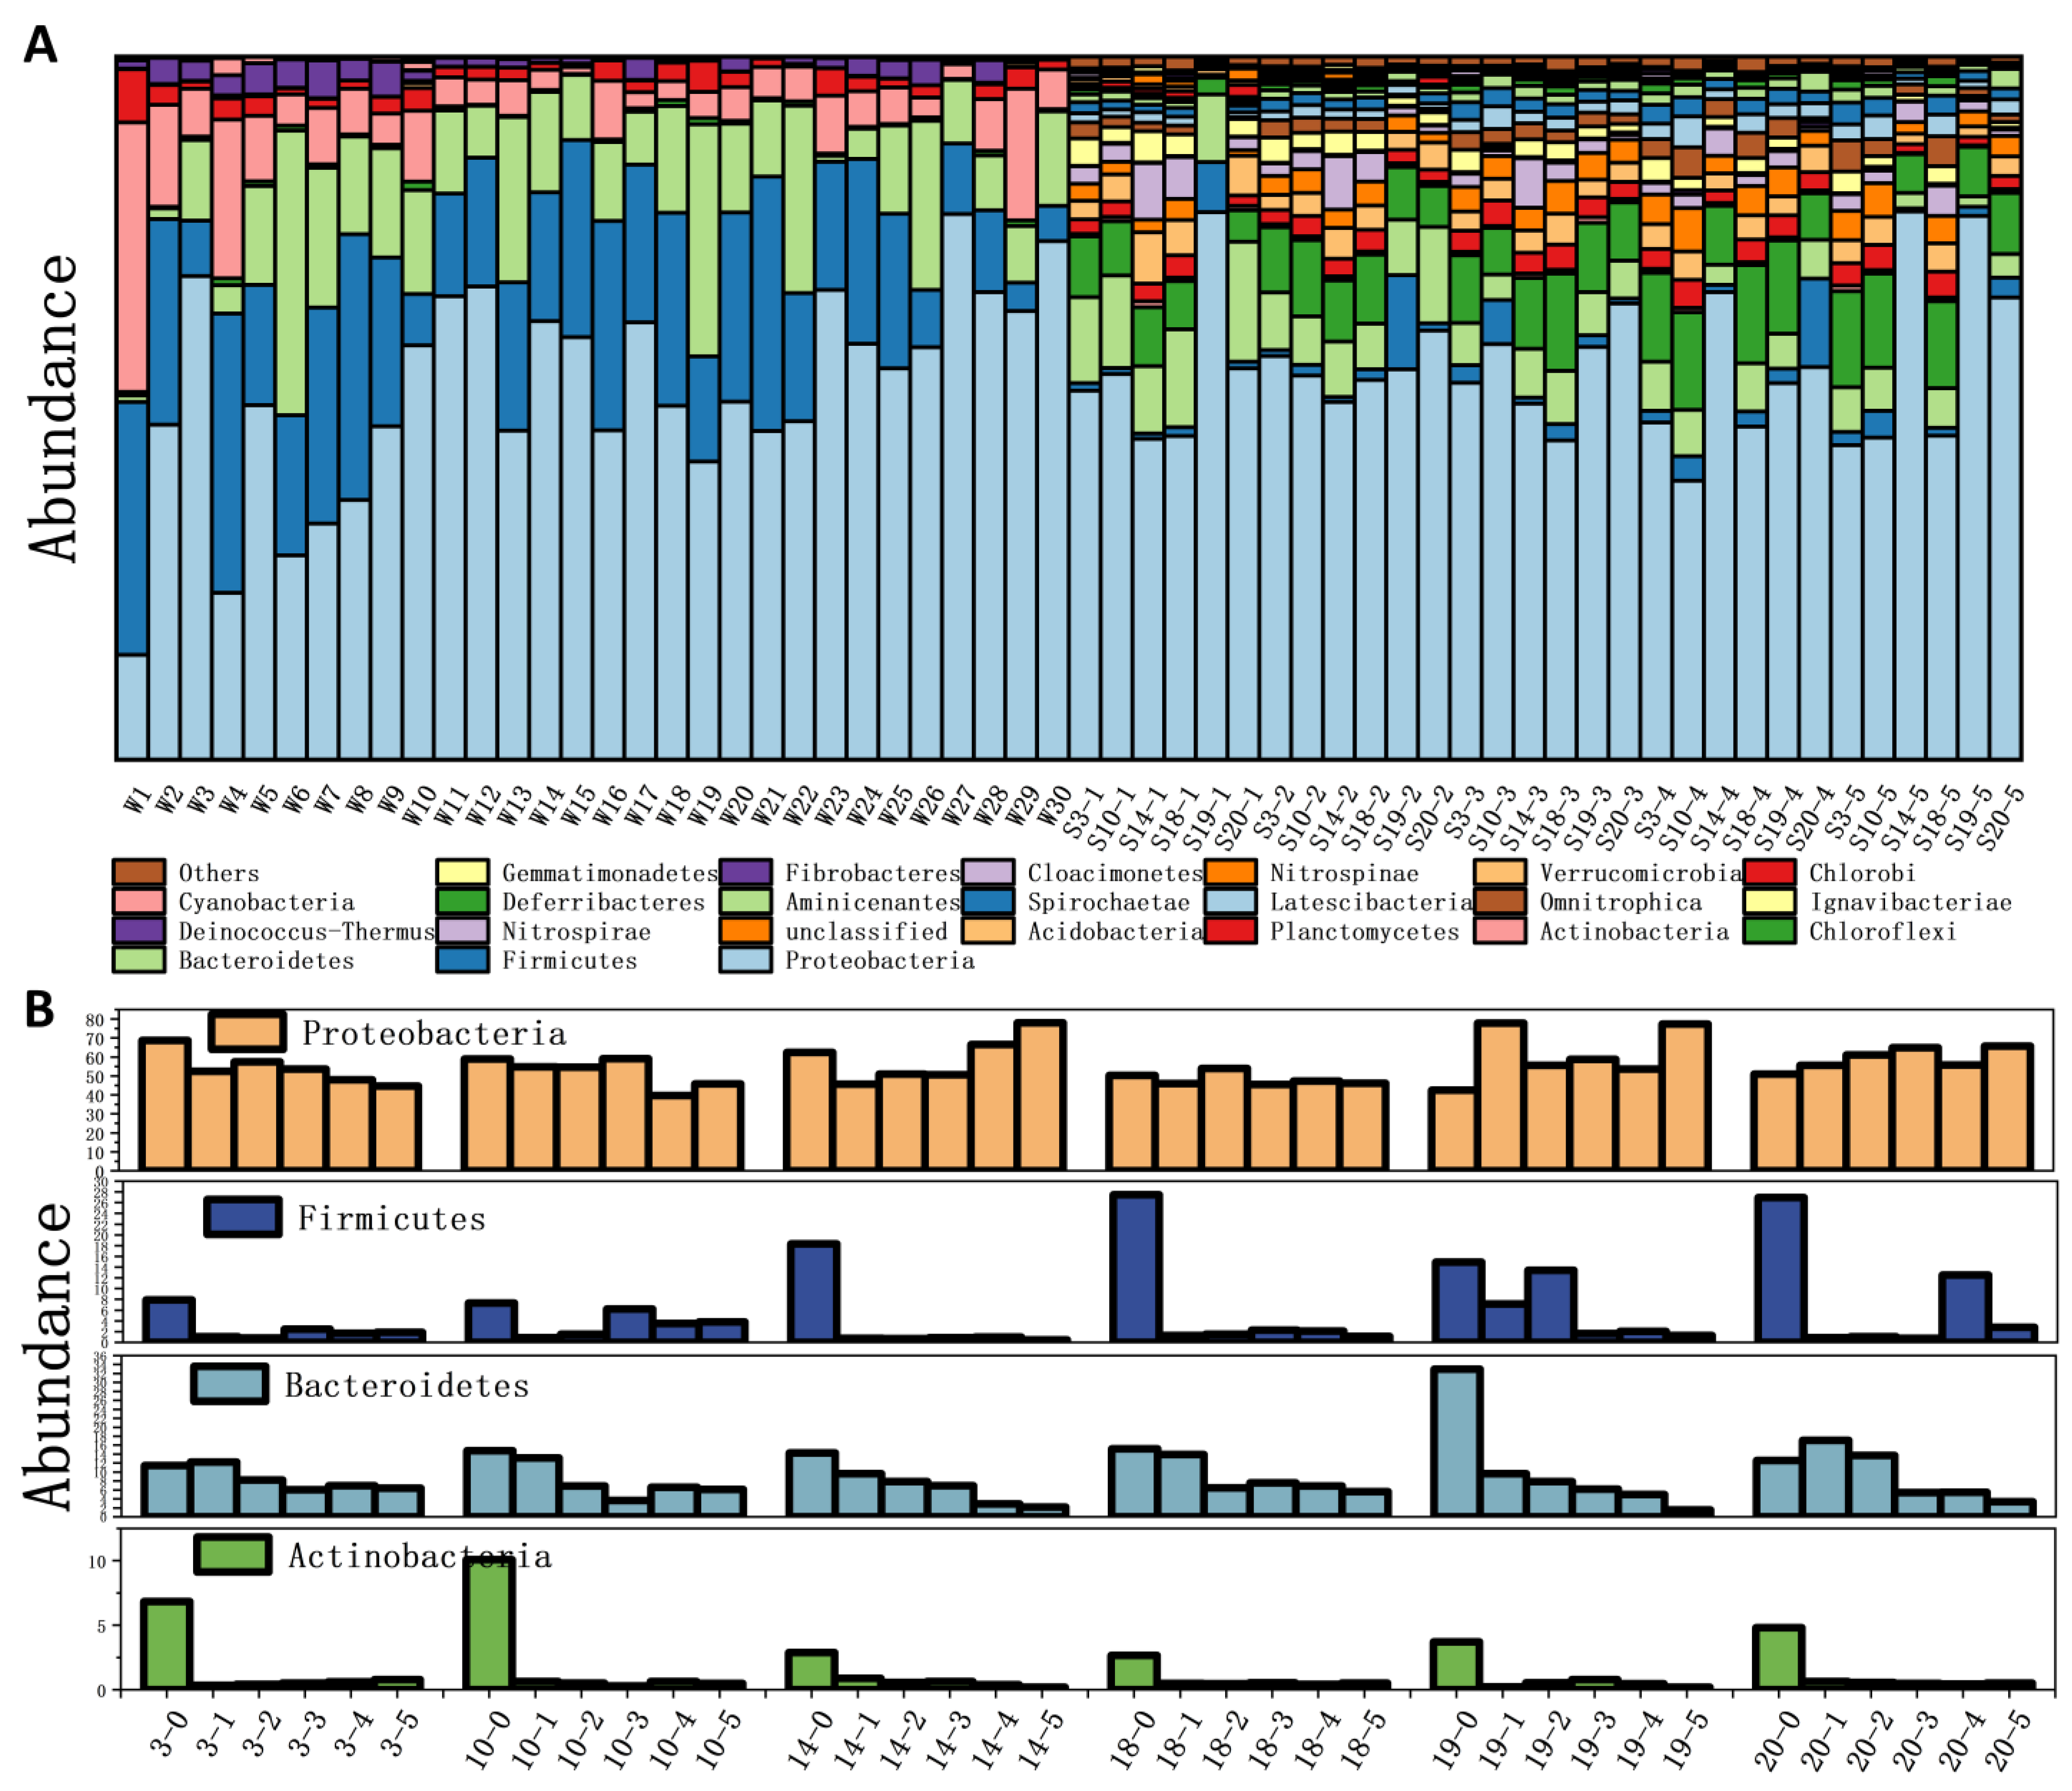
3.3. Vertical Distribution of Sediment Microorganisms

The vertical structure of microorganisms is driven by certain factors that covary with depth. The composition and biomass of microbial communities in sediments are subject to influence from a range of biotic and abiotic factors. These factors vary with depth and location. A total of 1,098,117 high-quality 16S rDNA reads were detected from 30 sediment samples. It was clustered into 5555 OTUs, 23 phyla, and 104 genera. At the phylum level, the relative abundance of sediment microorganisms was high for Proteobacteria (39.66–77.97%), Firmicutes (0.47–13.39%), Bacteroidetes (1.52–17.09%), Chloroflexi (2.35–13.97%), Actinobacteria (0.2–0.87%), Planctomycetes (0.19–3.98%), Acidobacteria (0.79–7.29%), and others. Proteobacteria are always the most abundant gateway in the vast majority of studies reported on sediment bacterial communities. Degradation and metabolism are largely dependent on this gate [38]. The abundance of Firmicutes is generally related to the degree of sediment eutrophication [39]. Organic carbon-rich environments favor the survival of Bacteroidetes [40]. Chloroflexi is a relatively ancient phylum that is an important participant in the biogeochemical cycling of elements such as C, N, and S. It is also a major player in the biogeochemical cycling of these elements. Many studies have shown that Actinobacteria are phosphorus-solubilizing bacteria (PSB) that play an important role in fixing phosphate [41]. Planctomycetes is a dominant organic carbon-degrading bacterium [42]. Acidobacteria have the ability to remove phosphorus and reduce iron [43].
As can be seen from Figure S2, microbial uniformity (Shannon and Simpson indices) as well as diversity (chao1 and ACE indices) showed fluctuating changes from the surface layer to the bottom layer. Overall, the mesopelagic layer was richer in microorganisms, and the microbial diversity of the surface layer was slightly higher than that of the bottom layer. In short, the bottom is poorer in microorganisms. This may be caused by low oxygen and water content in the substrate [16]. Deeper soils are denser and have lower oxygen concentrations. Anaerobic conditions caused by hypoxic conditions can inhibit the growth of fungi and bacteria in deep soils [44]. Second, natural biological processes in ecosystems usually occur at the soil surface, e.g., organic matter formed by decaying and dying plants generally pools at the surface and then travels with water to the deeper layers of the soil. The vertical distribution of nutrients is also a significant contributing factor to the vertical heterogeneity of microbial communities.
Phosphorus-solubilizing microorganisms have been found in several phyla such as Actinobacteria, Ascomycota, Bacteroidetes, Basidiomycota, Euryarchaeota, Firmicutes, Mucoromycota, and Proteobacteria [45]. The dephosphorylating bacteria are mainly grouped into eight phyla, of which the dominant bacteria are Proteobacteria, Firmicutes, Bacteroidetes, and Actinobacteria [45]. This study, therefore, focuses on these four sectors. As can be seen from Figure 5B, the relative abundance of microorganisms in each layer showed significant heterogeneity. The relative abundance of Proteobacteria showed fluctuation from the surface layer to the bottom layer, as the 3, 10, 18, and 20 points show more abundance in the middle layer, and the 14 and 19 points show more abundance in the bottom layer. The relative abundance of Proteobacteria in the surface layer is not the highest layer. The fluctuating pattern of relative abundance of Firmicutes is stronger, with higher relative abundance in the middle layers. This may be due to the fact that the abundance of Firmicutes in the sediments is positively correlated with the degree of eutrophication [46]. The pattern of change in the relative abundance of Bacteroidetes is obvious, mostly showing a decreasing phenomenon from the surface layer to the bottom layer. In short, the surface layer is the most abundant layer. This pattern is consistent with previous findings [15]. Actinobacteria showed little regularity of change in relative abundance and were the least abundant of the four phyla.
Consistent with the sediments, Proteobacteria remained the most abundant phylum in the overlying water. Next, the more abundant are Firmicutes, Bacteroidetes, and Actinobacteria. These are typical freshwater microorganisms, similar to the microbial community structure of other water bodies. It is noteworthy that the relative abundance of Firmicutes and Actinobacteria, in addition to Proteobacteria, was significantly higher in water than in sediment. Bacteroidetes, on the other hand, changed little. Firmicutes are widely distributed in eutrophic water bodies, and the higher abundance also indicates the trophic status of this river network. Firmicutes may play an important role in the mineralization metabolism of organic phosphorus when the water column is deficient in active phosphorus. Research on Actinobacteria has focused on the soil environment. Recent studies on aquatic ecology have revealed the role of Actinobacteria in heterotrophic nitrification and aerobic denitrification as well as organic carbon removal capacity [47]. Actinobacteria as the dominant species in this Plains River network suggests that this water body may have a strong aerobic denitrification capacity, but further proof is still needed.

3.4. Response Between Sediment Microbes and Phosphorus

As can be seen from Figure 6B, TP is significantly and positively correlated with Fe-P (r = 0.973), OM (r = 0.74), and Mobile-P (r = 0.98). This suggests that the phosphorus fraction in the river network sediments of this plain is mainly influenced by the dominance of mobile phosphorus. Combined with the above experimental results, it can be hypothesized that the risk of endogenous phosphorus release from this Plains River network is high. EPC0, which indicates sediment phosphorus release capacity, was positively correlated with L-P and Fe-P and negatively correlated with Ca-P. Both L-P and Fe-P are readily releasable forms of phosphorus, from which it can be inferred that these two forms of phosphorus are important in the release of phosphorus from the river network sediments in this plain. Ca-P is relatively stable and makes a low contribution to phosphorus flux. However, it is also converted to dissolved phosphorus at low pH or in the presence of phosphorus-solubilizing bacteria. OM was significantly positively correlated with mobile phosphorus OP and Fe-P (r = 0.81, r = 0.69) and negatively correlated with EPC0, which characterizes release capacity (r = −0.23). This phenomenon is consistent with previous findings [48]. This may be due to the ability of OM to enhance the adsorption of phosphorus from sediments and inhibit its release [49]. At the same time, OM and the anaerobic conditions it generates can promote the growth of iron-oxidizing bacteria and the adsorption of phosphorus by iron hydroxide and thus the formation of Fe-P [50].
Figure 6A shows the RDA results for samples selected from different sediment layers at the six sampling locations, with 11.92% and 22.93% interpretations for the two RDA axes, respectively. The majority of surface sediment samples were concentrated in the first and second quadrants, where the influence of microbial communities and phosphorus patterns was particularly evident. As can be seen from Figure 6A, a positive correlation with TP is observed for Actinobacteria, Acidobacteria, and Chloroflexi. Bacteroidetes, Nitrospirae, Proteobacteria, and Firmicutes, on the other hand, are positively correlated with L-P, Ca-P, and Al-P. Previous studies have shown that phosphate-solubilizing bacteria promote the solubilization of phosphorus in the calcium-bound state [51]. Notably, Fe-P and OM, on the other hand, were negatively correlated with these microorganisms. It has been previously shown that Firmicutes will participate in the reduction of Fe (III) [52]. It can promote the dissolution of phosphorus in the iron-bound state. Proteobacteria, which were most abundant in the sediment, showed a significant positive correlation with OP concentrations, which would likely accelerate the conversion of OP to soluble IP, which would then be released from the sediment into the overlying water [24]. Proteobacteria and Firmicutes were positively correlated. A significant negative correlation was observed between Proteobacteria and the Actinobacteria and Acidobacteria groups.

4. Conclusions

(1) The concentrations of each form of phosphorus in the vertical direction in the river network sediments of this plain demonstrated fluctuating changes. Of these, Fe-P accounted for the highest TP concentrations, 16.5–74.4%, and was the most abundant form of phosphorus, as well as the one that was readily released. The vertical trends of Fe-P and TP are almost the same. Ca-P is the second-highest phosphorus content, which is also an inert phosphorus component, as well as Al-P, and both exhibit a relatively low percentage of surface layers. L-P, on the other hand, is the least abundant phosphorus.
(2) From the Freundlich isothermal adsorption model fitted with parameters such as NAP, EPC0, and KF, which can indicate the ability of sediment to adsorb and release phosphorus, NAP and EPC0 in the surface layer were lower than that in the second layer (15 cm), while the value of KF in the surface layer was higher, which indicates that the surface sediment has a somewhat stronger ability to adsorb phosphorus compared with the middle layer. Sediments in the second layer show a stronger tendency to release phosphorus. The adsorption parameters in the bottom layer (45 cm) were all lower, indicating that the bottom sediments have a lower capacity to adsorb and release phosphorus.
(3) Proteobacteria were the most abundant phylum in terms of microbial detection. Microorganisms with dephosphorylation functions show heterogeneity in the vertical distribution of sediments. It is noteworthy that the relative abundance of Firmicutes, Bacteroidetes, and Actinobacteria, in addition to Proteobacteria, was significantly higher in water than in sediment.
(4) From the correlation analysis, TP is significantly positively correlated with Fe-P (r = 0.973), OM (r = 0.74), and Mobile-P (r = 0.98). OM is significantly positively correlated with mobile phosphorus OP and Fe-P (r = 0.81, r = 0.69) and negatively correlated with EPC0, which characterizes release capacity (r = −0.23). Positively correlated with TP are Actinobacteria, Acidobacteria, and Chloroflexi. Bacteroidetes, Nitrospirae, Proteobacteria, and Firmicutes, on the other hand, are positively correlated with L-P, Ca-P, and Al-P. The following represents the findings and conclusions derived from this study. The microorganisms influencing the vertical distribution of phosphorus in sediments are Bacteroidetes, Nitrospirae, Proteobacteria, and Firmicutes.
It is our hope that this study will contribute to the development of novel strategies for the prevention and management of river networks in this plain.

Supplementary Materials

The following supporting information can be downloaded at: https://www.mdpi.com/article/10.3390/w17152196/s1, Figure S1: Freundlich isothermal adsorption fits at each site; Figure S2: Alpha index at each point; Table S1: Indicators of overlying water at six sampling sites.

Author Contributions

X.D.: investigation, data curation, formal analysis, and writing—original draft. H.C.: data curation and formal analysis. Y.C.: investigation. X.Y.: conceptualization and methodology. H.Y.: conceptualization and methodology. W.H.: conceptualization, methodology, and funding acquisition. All authors have read and agreed to the published version of the manuscript.

Funding

This study was supported by the Natural Science Foundation of Shanghai (23ZR1400700) and the National Natural Science Foundation (52000024). And the APC was funded by [23ZR1400700].

Data Availability Statement

Data will be made available upon request.

Conflicts of Interest

The authors declare no conflicts of interest.

References

  1. Lürling, M.; Oosterhout, F.V. Controlling eutrophication by combined bloom precipitation and sediment phosphorus inactivation. Water Res. 2013, 47, 6527–6537. [Google Scholar] [CrossRef] [PubMed]
  2. Saha, B.; Chakraborty, S.; Das, G. A mechanistic insight into enhanced and selective phosphate adsorption on a coated carboxylated surface. J. Colloid Interface Sci. 2009, 331, 21–26. [Google Scholar] [CrossRef] [PubMed]
  3. Sun, C.; Wang, S.; Wang, H.; Hu, X.; Yang, F.; Tang, M.; Zhang, M.; Zhong, J. Internal nitrogen and phosphorus loading in a seasonally stratified reservoir: Implications for eutrophication management of deep-water ecosystems. J. Environ. Manag. 2022, 319, 10. [Google Scholar] [CrossRef] [PubMed]
  4. Rydin, E. Potentially mobile phosphorus in Lake Erken sediment. Water Res. 2000, 34, 2037–2042. [Google Scholar] [CrossRef]
  5. Wang, S.; Hu, Z.; Zhang, J.; Wu, H.; Xie, H.; Liang, S.; Hu, H.; Jin, F. Formation of phosphine and its effect on phosphorus retention in constructed wetlands: Characteristic and mechanism. Environ. Technol. Innov. 2022, 28, 102653. [Google Scholar] [CrossRef]
  6. Liu, Z.-P.; Shao, M.-A.; Wang, Y.-Q. Spatial patterns of soil total nitrogen and soil total phosphorus across the entire Loess Plateau region of China. Geoderma 2013, 197–198, 67–78. [Google Scholar] [CrossRef]
  7. Shao, W.; Zhu, J.; Teng, Z.; Zhang, K.; Liu, S.; Li, M. Distribution of inorganic phosphorus and its response to the physicochemical characteristics of soil in Yeyahu Wetland, China. Process Saf. Environ. Prot. 2019, 125, 1–8. [Google Scholar] [CrossRef]
  8. Tu, C.; Jin, Z.; Che, F.; Cao, X.; Song, X.; Lu, C.; Huang, W. Characterization of phosphorus sorption and microbial community in lake sediments during overwinter and recruitment periods of cyanobacteria. Chemosphere 2022, 307, 11. [Google Scholar] [CrossRef]
  9. Enebe, M.C.; Babalola, O.O. The Influence of Soil Fertilization on the Distribution and Diversity of Phosphorus Cycling Genes and Microbes Community of Maize Rhizosphere Using Shotgun Metagenomics. Genes 2021, 12, 1022. [Google Scholar] [CrossRef]
  10. Pastore, G.; Kernchen, S.; Spohn, M. Microbial solubilization of silicon and phosphorus from bedrock in relation to abundance of phosphorus-solubilizing bacteria in temperate forest soils. Soil Biol. Biochem. 2020, 151, 108050. [Google Scholar] [CrossRef]
  11. Alori, E.T.; Glick, B.R.; Babalola, O.O. Microbial Phosphorus Solubilization and Its Potential for Use in Sustainable Agriculture. Front. Microbiol. 2017, 8, 8. [Google Scholar] [CrossRef] [PubMed]
  12. Bergkemper, F.; Schöler, A.; Engel, M.; Lang, F.; Krüger, J.; Schloter, M.; Schulz, S. Phosphorus depletion in forest soils shapes bacterial communities towards phosphorus recycling systems (vol 18, pg 1988, 2016). Environ. Microbiol. 2016, 18, 2767. [Google Scholar] [CrossRef] [PubMed]
  13. Santalahti, M.; Sun, H.; Jumpponen, A.; Pennanen, T.; Heinonsalo, J.; Baldrian, P. Vertical and seasonal dynamics of fungal communities in boreal Scots pine forest soil. FEMS Microbiol. Ecol. 2016, 92, 12. [Google Scholar] [CrossRef] [PubMed]
  14. Lin, J.; Zhou, X.; Lu, X.; Xu, Y.; Wei, Z.; Ruan, A. Grain size distribution drives microbial communities vertically assemble in nascent lake sediments. Environ. Res. 2023, 227, 10. [Google Scholar] [CrossRef]
  15. He, L.; Sun, X.; Li, S.; Zhou, W.; Chen, Z.; Bai, X. The vertical distribution and control factor of microbial biomass and bacterial community at macroecological scales. Sci. Total Environ. 2023, 869, 10. [Google Scholar] [CrossRef]
  16. Sun, T.; Wang, Y.; Lucas-Borja, M.E.; Jing, X.; Feng, W. Divergent vertical distributions of microbial biomass with soil depth among groups and land uses. J. Environ. Manag. 2021, 292, 9. [Google Scholar] [CrossRef]
  17. Pardo, P.; Rauret, G.; López-Sánchez, J.F. Shortened screening method for phosphorus fractionation in sediments. Anal. Chim. Acta 2004, 508, 201–206. [Google Scholar] [CrossRef]
  18. Murphy, J.; Riley, J.P. Citation-Classic-A Modified Single Solution Method for The Determination of Phosphate in Natural-Waters. Curr. Contents Agric. Biol. Environ. Sci. 1986, 12, 16. [Google Scholar]
  19. Sundaram, C.S.; Viswanathan, N.; Meenakshi, S. Uptake of fluoride by nano-hydroxyapatite/chitosan, a bioinorganic composite. Bioresour. Technol. 2008, 99, 8226–8230. [Google Scholar] [CrossRef]
  20. Zhou, A.M.; Tang, H.X.; Wang, D.S. Phosphorus adsorption on natural sediments: Modeling and effects of pH and sediment composition. Water Res. 2005, 39, 1245–1254. [Google Scholar] [CrossRef]
  21. Ockenden, M.C.; Deasy, C.; Quinton, J.N.; Surridge, B.; Stoate, C. Keeping agricultural soil out of rivers: Evidence of sediment and nutrient accumulation within field wetlands in the UK. J. Environ. Manag. 2014, 135, 54–62. [Google Scholar] [CrossRef]
  22. Wang, Y.; Ma, R.; Li, J. Study on influential factors of surface water quality using geographic detector- A case of Lvliang City, Shanxi Province. Acta Sci. Circumstantiae 2023, 43, 212–222. [Google Scholar]
  23. Li, D.-P.; Huang, Y.; Yuan, Y.; Fan, C.-X. Mechanism of phosphorus adsorption and immobility by sediments in innercity heavily polluted canal. Huan Jing Ke Xue Huanjing Kexue 2011, 32, 96–101. [Google Scholar]
  24. Ni, Z.; Li, Y.; Wang, S. Cognizing and characterizing the organic phosphorus in lake sediments: Advances and challenges. Water Res. 2022, 220, 118663. [Google Scholar] [CrossRef] [PubMed]
  25. Du, C.; Li, G.; Xia, R.; Li, C.; Zhu, Q.; Li, X.; Li, J.; Zhao, C.; Tian, Z.; Zhang, L. New insights into cyanobacterial blooms and the response of associated microbial communities in freshwater ecosystems. Environ. Pollut. 2022, 309, 11. [Google Scholar] [CrossRef] [PubMed]
  26. Yin, H.; Zhang, M.; Yin, P.; Li, J. Characterization of internal phosphorus loading in the sediment of a large eutrophic lake (Lake Taihu, China). Water Res. 2022, 225, 119125. [Google Scholar] [CrossRef] [PubMed]
  27. Zhu, M.; Zhu, G.; Li, W.; Zhang, Y.; Zhao, L.; Gu, Z. Estimation of the algal-available phosphorus pool in sediments of a large, shallow eutrophic lake (Taihu, China) using profiled SMT fractional analysis. Environ. Pollut. 2013, 173, 216–223. [Google Scholar] [CrossRef]
  28. Wang, Y.T.; Zhang, T.Q.; Zhao, Y.C.; Ciborowski, J.J.; Zhao, Y.M.; O’Halloran, I.P.; Qi, Z.M.; Tan, C.S. Characterization of sedimentary phosphorus in Lake Erie and on-site quantification of internal phosphorus loading. Water Res. 2021, 188, 116525. [Google Scholar] [CrossRef]
  29. Hupfer, M.; Jordan, S.; Herzog, C.; Ebeling, C.; Ladwig, R.; Rothe, M.; Lewandowski, J. Chironomid larvae enhance phosphorus burial in lake sediments: Insights from long-term and short-term experiments. Sci. Total Environ. 2019, 663, 254–264. [Google Scholar] [CrossRef]
  30. Li, L.; Liu, L.; Wang, S.; Liu, W.; Jiao, L.; Yang, Y.; Yang, R. Spatial distribution of phosphorus fractions in sediment and the potential mobility of phosphorus in Dianchi Lake. Environ. Earth Sci. 2015, 74, 3721–3731. [Google Scholar] [CrossRef]
  31. Yang, C.; Li, J.; Yin, H. Phosphorus internal loading and sediment diagenesis in a large eutrophic lake (Lake Chaohu, China). Environ. Pollut. 2022, 292, 118471. [Google Scholar] [CrossRef]
  32. Wang, X.; Wei, J.; Bai, N.; Cha, H.; Cao, C.; Zheng, K.; Liu, Y. The phosphorus fractions and adsorption-desorption characteristics in the Wuliangsuhai Lake, China. Environ. Sci. Pollut. Res. 2018, 25, 20648–20661. [Google Scholar] [CrossRef] [PubMed]
  33. Huang, W.; Dong, X.; Tu, C.; Yang, H.; Chang, Y.; Yang, X.; Chen, H.; Che, F. Response mechanism of sediment endogenous phosphorus release to functional microorganisms and its cyanobacterial growth and disappearance effects. Sci. Total Environ. 2024, 906, 167676. [Google Scholar] [CrossRef] [PubMed]
  34. Meng, J.; Yao, Q.; Yu, Z. Particulate phosphorus speciation and phosphate adsorption characteristics associated with sediment grain size. Ecol. Eng. 2014, 70, 140–145. [Google Scholar] [CrossRef]
  35. Tian, J.R.; Zhou, P.J. Phosphorus fractions of floodplain sediments and phosphorus exchange on the sediment-water interface in the lower reaches of the Han River in China. Ecol. Eng. 2007, 30, 264–270. [Google Scholar] [CrossRef]
  36. Zhang, J.Z.; Huang, X.L. Effect of Temperature and Salinity on Phosphate Sorption on Marine Sediments. Environ. Sci. Technol. 2011, 45, 6831. [Google Scholar] [CrossRef]
  37. Milowska, K.; Szwed, A.; Zablocka, M.; Caminade, A.M.; Majoral, J.P.; Mignani, S.; Gabryelak, T.; Bryszewska, M. In vitro PAMAM, phosphorus and viologen-phosphorus dendrimers prevent rotenone-induced cell damage. Int. J. Pharm. 2014, 474, 42–49. [Google Scholar] [CrossRef]
  38. Chaudhry, V.; Rehman, A.; Mishra, A.; Chauhan, P.S.; Nautiyal, C.S. Changes in Bacterial Community Structure of Agricultural Land Due to Long-Term Organic and Chemical Amendments. Microb. Ecol. 2012, 64, 450–460. [Google Scholar] [CrossRef]
  39. Zhou, J.; Li, D.; Zhao, Z.; Huang, Y. Phosphorus bioavailability and the diversity of microbial community in sediment in response to modified calcium peroxide ceramsite capping. Environ. Res. 2021, 195, 9. [Google Scholar] [CrossRef]
  40. Fierer, N.; Bradford, M.A.; Jackson, R.B. Toward an Ecological Classification of Soil Bacteria. Ecology 2007, 88, 1354–1364. [Google Scholar] [CrossRef]
  41. Hamdali, H.; Hafidi, M.; Virolle, M.J.; Ouhdouch, Y. Rock phosphate-solubilizing Actinomycetes: Screening for plant growth-promoting activities. World J. Microbiol. Biotechnol. 2008, 24, 2565–2575. [Google Scholar] [CrossRef]
  42. Li, S.; Li, L.; Gao, Q.; Dong, S.; Shi, S. Deep-sea cage culture altered microbial community composition in the sediments of the Yellow Sea Cold Water Mass. Mar. Pollut. Bull. 2022, 183, 10. [Google Scholar] [CrossRef] [PubMed]
  43. Flieder, M.; Buongiorno, J.; Herbold, C.W.; Hausmann, B.; Rattei, T.; Lloyd, K.G.; Loy, A.; Wasmund, K. Novel taxa of Acidobacteriota implicated in seafloor sulfur cycling. ISME J. 2021, 15, 3159–3180. [Google Scholar] [CrossRef] [PubMed]
  44. Chen, Y.; Chen, G.; Robinson, D.; Yang, Z.; Guo, J.; Xie, J.; Fu, S.; Zhou, L.; Yang, Y. Large amounts of easily decomposable carbon stored in subtropical forest subsoil are associated with r-strategy-dominated soil microbes. Soil Biol. Biochem. 2016, 95, 233–242. [Google Scholar] [CrossRef]
  45. Kour, D.; Rana, K.L.; Kaur, T.; Yadav, N.; Yadav, A.N.; Kumar, M.; Kumar, V.; Dhaliwal, H.S.; Saxena, A.K. Biodiversity, current developments and potential biotechnological applications of phosphorus-solubilizing and -mobilizing microbes: A review. Pedosphere 2021, 31, 43–75. [Google Scholar] [CrossRef]
  46. Wang, Y.; Gu, W.; Liu, X.; Liu, H.; Tang, G.; Yang, C. Combined impacts of algae-induced variations in water soluble organic matter and heavy metals on bacterial community structure in sediment from Chaohu Lake, a eutrophic shallow lake. Sci. Total Environ. 2023, 874, 162481. [Google Scholar] [CrossRef]
  47. Zhang, H.; Ma, B.; Huang, T.; Shi, Y. Nitrate reduction by the aerobic denitrifying actinomycete Streptomyces sp. XD-11-6-2: Performance, metabolic activity, and micro-polluted water treatment. Bioresour. Technol. 2021, 326, 9. [Google Scholar] [CrossRef]
  48. Tammeorg, O.; Nürnberg, G.K.; Nõges, P.; Niemistö, J. The role of humic substances in sediment phosphorus release in northern lakes. Sci. Total Environ. 2022, 833, 10. [Google Scholar] [CrossRef]
  49. Xiao, W.J.; Song, C.L.; Cao, X.Y.; Zhou, Y.Y. Effects of Air-Drying on Phosphorus Sorption in Shallow Lake Sediment, China. Fresenius Environ. Bull. 2012, 21, 672–678. [Google Scholar]
  50. Jensen, H.S.; Mortensen, P.B.; Andersen, F.Ø.; Rasmussen, E.; Jensen, A. PHOSPHORUS CYCLING IN A COASTAL MARINE SEDIMENT, AARHUS BAY, DENMARK. Limnol. Oceanogr. 1995, 40, 908–917. [Google Scholar] [CrossRef]
  51. Li, Y.; Zhang, J.; Zhang, J.; Xu, W.; Mou, Z. Characteristics of Inorganic Phosphate-Solubilizing Bacteria from the Sediments of a Eutrophic Lake. Int. J. Environ. Res. Public Health 2019, 16, 15. [Google Scholar] [CrossRef]
  52. Andrade, G.R.P.; de Azevedo, A.C.; Cuadros, J.; Souza, V.S.; Furquim, S.A.C.; Kiyohara, P.K.; Vidal-Torrado, P. Transformation of Kaolinite into Smectite and Iron-Illite in Brazilian Mangrove Soils. Soil Sci. Soc. Am. J. 2014, 78, 655–672. [Google Scholar] [CrossRef]
Figure 1. Sampling points. The numbers marked in red are the priority sampling points for this study.
Water 17 02196 g001
Figure 2. Phosphorus content in all forms.
Water 17 02196 g002
Figure 3. Percentage of each form of phosphorus.
Water 17 02196 g003
Figure 4. Adsorption resolution parameters (A) and source-sink status (B).
Water 17 02196 g004
Figure 5. Plots of microbial abundance at each site (A) and changes in abundance of four important dephosphorylating bacteria (B). S refers to sediment, W refers to overlying water.
Water 17 02196 g005
Figure 6. RDA analysis between microorganisms (A) and each form of phosphorus and heat map of correlation between indicators (B).
Water 17 02196 g006
Disclaimer/Publisher’s Note: The statements, opinions and data contained in all publications are solely those of the individual author(s) and contributor(s) and not of MDPI and/or the editor(s). MDPI and/or the editor(s) disclaim responsibility for any injury to people or property resulting from any ideas, methods, instructions or products referred to in the content.

