Article

Could the Presence of Ferrihydrite in a Riverbed Impacted by Mining Leachates Be Linked to a Reduction in Contamination and Health Indexes?

by
Asunción Guadalupe Morales-Mendoza
1,
Ana Karen Ivanna Flores-Trujillo
2,
Luz María Del-Razo
3,
Betsy Anaid Peña-Ocaña
4,
Fanis Missirlis
5 and
Refugio Rodríguez-Vázquez
1,2,*
1
Doctoral Program in Nanosciences and Nanotechnology, Center for Research and Advanced Studies of the National Polytechnic Institute (Cinvestav), Instituto Politécnico Nacional Avenue, No. 2508, Zacatenco, Mexico City 07360, Mexico
2
Department of Biotechnology and Bioengineering, Center for Research and Advanced Studies of the National Polytechnic Institute (Cinvestav), Instituto Politécnico Nacional Avenue, No. 2508, Zacatenco, Mexico City 07360, Mexico
3
Department of Toxicology, Center for Research and Advanced Studies of the National Polytechnic Institute (Cinvestav), Instituto Politécnico Nacional Avenue, No. 2508, Zacatenco, Mexico City 07360, Mexico
4
Department of Biochemistry, Instituto Nacional de Cardiología, Juan Badiano, Colonia Sección XVI, Tlalpan, Mexico City 14080, Mexico
5
Department of Physiology, Biophysics and Neurosciences, Center for Research and Advanced Studies of the National Polytechnic Institute (Cinvestav), Instituto Politécnico Nacional Avenue, No. 2508, Zacatenco, Mexico City 07360, Mexico
*
Author to whom correspondence should be addressed.
Water 2025, 17(15), 2167; https://doi.org/10.3390/w17152167
Submission received: 19 May 2025 / Revised: 30 June 2025 / Accepted: 2 July 2025 / Published: 22 July 2025
(This article belongs to the Section Water Quality and Contamination)

Abstract

Taxco de Alarcón (Mexico) has been affected by mining activities and the presence of potentially toxic elements (PTEs). In this study, water samples from the Acamixtla, Taxco, and San Juan rivers were analyzed using Inductively Coupled Plasma Optical Emission Spectroscopy (ICP-OES) to determine PTE concentrations. Statistical analyses included principal component analysis, Pearson’s correlation, the Pollution Index, and a Health Risk Assessment. Additionally, solid samples from the San Juan River with leachate from the “La Guadalupana” Mine (RSJMG S2.3) were characterized using Fourier Transform Infrared Spectroscopy (FTIR) and Scanning Electron Microscopy (SEM). Identified PTEs included As, Cr, Ni, Zn, Fe, Mn, Cu, Cd, Pb, Se, and Li. Principal component analysis explained 94.8% of the data variance, and Pearson’s correlation revealed significant associations (p < 0.05) among Fe, As, Cu, Cd, Pb, and Zn. The RSJMG S2.3 site exhibited the highest Pollution Index value (8491.56) and the highest health exposure risks. Lower contamination levels at other sites may be attributed to the complexation of PTEs with ferrihydrite, which was identified in the RSJMG S2.3 site through microscopy and infrared analyses. These findings suggest that the in situ formation of ferrihydrite may enhance the adsorption of PTEs, thereby mitigating environmental contamination and potential health risks.

1. Introduction

Water, a vital resource supporting life on Earth, is crucial for both human activities and ecosystems [1]. Despite covering about 71% of the Earth’s surface, with oceans containing approximately 97% of the total water, only a small fraction, about 2.5–3%, is suitable for human consumption [2]. Compounding this limited availability, population growth has exacerbated water scarcity, with approximately two-thirds of the global population facing water availability issues [3]. The water crisis, leading to a decline in water quality, stems from various factors, including climate change, natural sources, and human activities [4]. Additionally, inadequate water treatment systems contribute to this crisis, with the disposal of untreated water into bodies of water intended for human consumption [5]. Consequently, these activities introduce pathogens, pesticides, microplastics [6], endocrine disruptors, and metals into water sources [7].
Metals and metalloids are of concern, because they can absorb and bioaccumulate in a living organism to levels sufficient to become toxic. Bioaccumulation can be described as a process in which the accumulation of contaminants occurs by trophic transfer and interactions with the abiotic environment [8,9].
Metallic and metalloids elements, such as, Cr, Mn, Fe, Co, Ni Cu, Zn, As, Cd, and Pb, often referred to as Potentially Toxic Elements (PTEs) [10,11], are associated with genotoxic effects, neuronal disorders, and organ problems, due to their ability to generate reactive oxygen species (ROS) [12,13]. The toxicity of these pollutants is influenced by various factors, including the exposure dose and their physicochemical properties [14]. This type of pollution has emerged as a significant global environmental concern, posing threats to both aquatic ecosystems and human health [7]. PTEs have the capacity to travel long distances in the water, which allows them to lodge in different matrices, such as soil, air and water, the latter being (on most of the occasions) the final disposal sites for PTEs [15,16,17]. It is important to point out that PTEs can meet the population through numerous activities, such as vegetable irrigation, food preparation, livestock and domestic activities, which are dependent on water resources and, unfortunately, on several occasions the products are contaminated with PTEs. This is how these elements can enter the human body through oral intake, inhalation, and dermal contact [18].
Health risk assessments have been conducted at different mining sites in Mexico. It has been reported that every year mining activity affects the health of a significant number of people [19]. Exposure to PTEs has been evidenced by different studies. In particular, in the mining area of Querétaro, an exposure study was conducted and it was found that a high percentage of workers in the mining area had diabetes and kidney disorders (17.6% and 17.6%, respectively) and concentrations of As (50 µg/L) and Pb (4.7 µg/L) were also found in the blood of mine workers [20]. On the other hand, according to [21], PTEs can reach farms in areas close to mining zones; this was reflected in the accumulation of PTEs in dairy products. Due to the nature of PTEs, there is a cumulative risk of chronic exposure.
Industrial and mining activities stand out as primary sources of PTE pollution, contributing to numerous environmental challenges globally [22]. Mining has been identified as a significant contributor to PTE pollution in countries like Chile, Australia, and Mexico, primarily due to the substantial generation of waste [23]. The peril of mining activities lies in the production of tailings, residual materials resulting from the processes of crushing, grinding, and pulverizing rocks using physical and chemical methods to extract ores [22,24]. Typically situated near processing sites, these tailings, when exposed to environmental or geological factors, can undergo oxidation and release PTEs, thereby compromising the quality of soil and water bodies [22]. Furthermore, both active and abandoned mines contribute to water quality degradation, often leading to the formation of acid mine drainage when minerals rich in sulphides, such as pyrite (FeS2), react with oxygen and water, resulting in oxidation and dissolution [25]. Open-pit discharges represent a prominent route for mine tailing disposal globally, with over 700,000 tons of PTEs contained in mine tailings estimated to be disposed of onshore annually worldwide [26].
In Mexico, mining operations have led to the presence of PTEs in states such as Sonora, Zacatecas, San Luis Potosí, and Guerrero, resulting in the accumulation of PTEs in both soil and water bodies [27,28,29]. More specifically, the municipality of Taxco de Alarcón in Guerrero is renowned as a former mining district [30,31], with mining activities historically targeting metals such as Pb, Cu, Zn, Au, and Ag. However, this extensive mining activity has generated substantial waste in the vicinity, often near human settlements [12,28,32]. Additionally, during the extraction process of these PTEs, As and other elements are released into the environment [28].
In this context, various strategies have been proposed [33,34] to mitigate the retention of different pollutants. These strategies are mainly based on biological methods using microorganisms (bacteria, fungi and algae) and agricultural wastes [35,36,37,38]. Likewise, physicochemical methods have been evaluated, through coagulation, ion exchange, adsorption and ultrafiltration [39]. Among the physicochemical methods, the following methods are used: the formation of mineral complexes, notably iron, which is often present in high concentrations at sites with mining activities [40]. One such mineral is ferrihydrite, which significantly influences the geochemistry of PTEs due to its highly reactive surface capable of binding metals [41]. Ferrihydrite formation occurs through oxide-reduction reactions mediated by various microorganisms [42,43], or by the hydroxylation of Fe [44]. Moreover, it is considered a metastable mineral, as it can spontaneously transform into crystalline iron oxides, thereby influencing the adsorption/desorption processes of PTEs [43,45,46]. These characteristics render ferrihydrite one of the most promising absorbents across different environmental matrices, given its high efficiency in capturing elements, such as As (18.38 mg/g), Cr (41.47 mg/g), Pb (34.32 mg/g), Cd (18.18 mg/g), and Cu (14.39 mg/g) [47,48,49,50,51], alongside its widespread occurrence in natural environments.
It is notable that extensive research has been conducted on ferrihydrite’s metal-sorbing capabilities, but its in situ formation in the riverbeds of mining-affected areas and its relationship with decreasing health and pollution indices remain largely overlooked. This work is the first to combine the geochemical characterization of naturally formed ferrihydrite with the contamination index in a river system heavily affected by mining leachates in Taxco de Alarcón, Mexico. This study offers further proof for the passive geochemical attenuation of natural waters by establishing a strong spatial correlation between the presence of ferrihydrite and reduced bioavailable PTEs.
Consequently, this study aimed to evaluate pollution and its impact using the PTE Pollution Index of water and Health Risk Assessment (non-carcinogenic and carcinogenic), as well as identify and characterize the ferrihydrite complexes that are possibly responsible for the reduction in the indices recorded in the area.

2. Materials and Methods
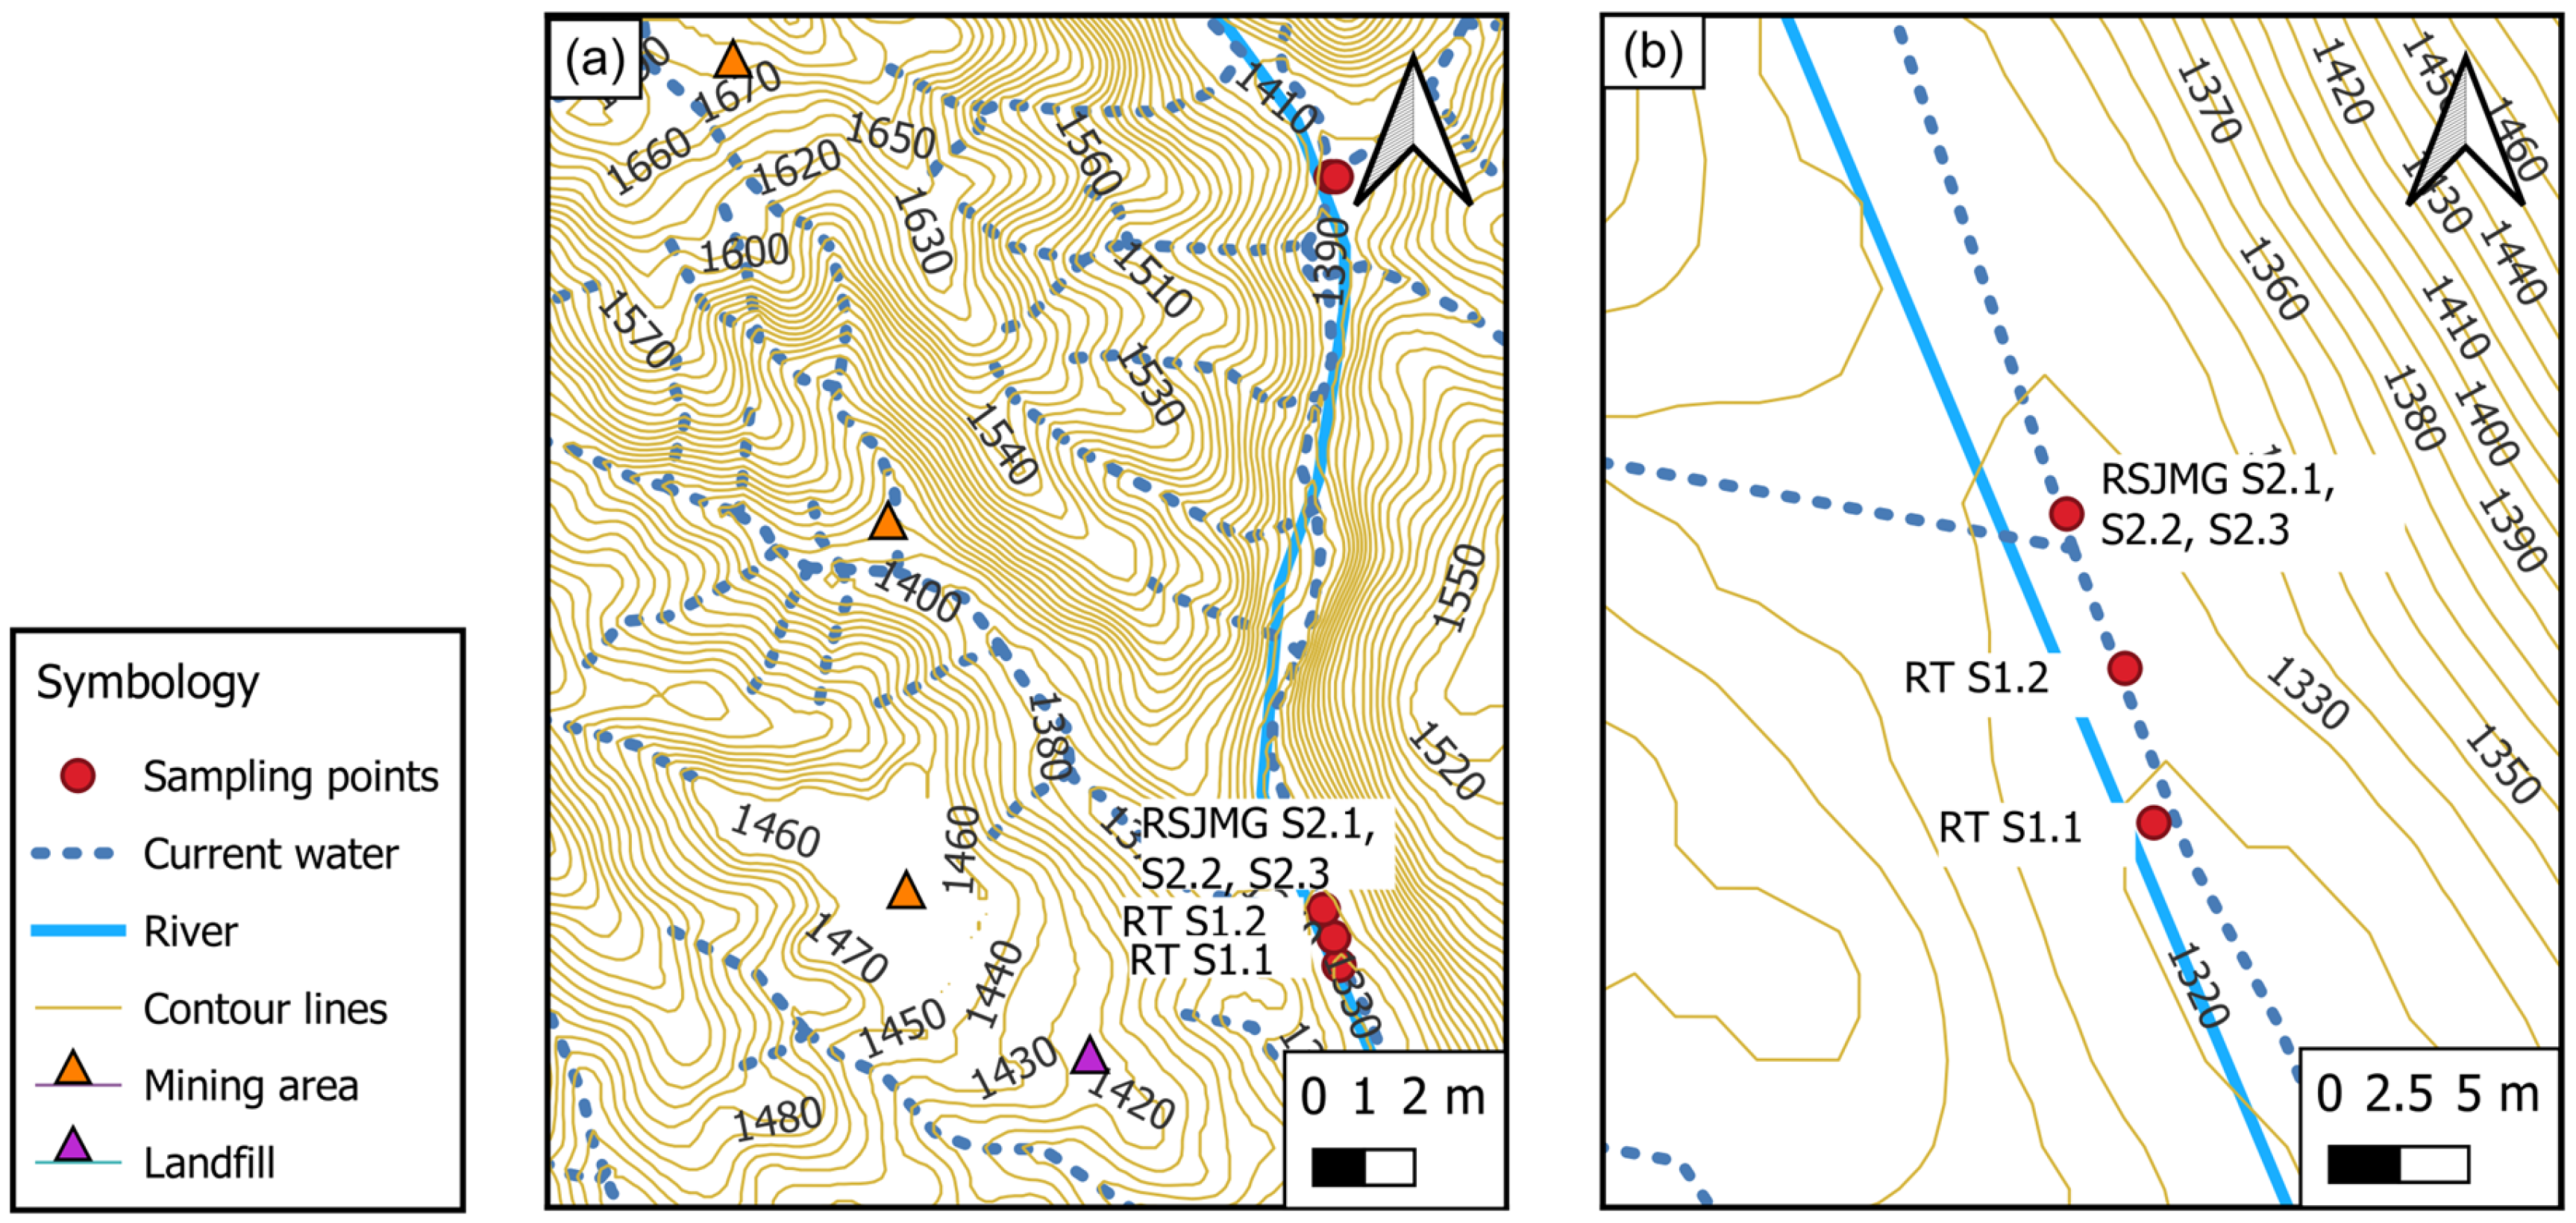
2.1. Study Area

The study area was the municipality of Taxco de Alarcón, which is found in the northern part of the State of Guerrero (Figure 1). This mining district is listed as one of the oldest in America; its mining deposits are located around the mines, where these tailings dams were built as backfill for ravines [29]. The water samples were taken along the Taxco River, which runs through the municipality of Taxco de Alarcón and joins the San Juan and Acamixtla Rivers. Likewise, the Taxco River is the recipient of water contaminated with leachate from the mine and wastewater discharged from a wastewater treatment plant. The samples were named according to the following keys: Taxco River (RT S1.1, 18°31′33.9996″ N, −99° 35′13.38″ W; RT S1.2, 18°31′ 35.871″ N, −99° 35′14.0994″ W; RT S1.3, 18°32′24.7194″ N, −99°35′14.2794″ W), San Juan River with leachate from the “La Guadalupana” Mine (RSJMG S2.1, S2.2, S2.3, 18°31′37.56″ N, −99°35′16.7994″ W), San Juan River (RSJ S3.1, 18°32′24.7194″ N, −99°35′13.9194″ W, RSJ S3.2, 18°33′29.865″N, −99°33′31.1034″ W), and other samples were collected upstream of the rivers, in the Acamixtla River (ACA S4.1, 18°33′31.4094″ N, −99°33′36.63″ W; ACA S4.2, ACA S4.3, 18°33′13.9278″ N, −99°33′40.4886″ W) (Figure 1). This river is not impacted by PTEs of the mining leachates and landfill.
The water samples from each sampling site were taken in triplicate in 500 mL glass vials, washed continuously with water. Samples were filtered through 0.45 µm membranes and stored at 4 °C (APHA, 2012) [52].

2.2. Analysis of Physicochemical Parameters of Water Samples

At the collection sites, various physicochemical parameters were measured from the collected samples, including electrical conductivity, pH, and temperature. These data were collected using a multiparametric HANNA-COMBO pH and EC WATERPROOF.

2.3. Digestion of the Sample

For the element analysis, the samples were filtered using a 0.45 µm membrane (APHA, 2012) [52] and were prepared by acid digestion. For this, an aliquot of 18 mL was taken, and 2 mL of concentrated nitric acid (Meyer brand) was added and further placed in the Teflon tubes of the Accelerated Reaction Microwave Equipment (MARS Xpress). The EPA-3015 program was used, which is preloaded in the equipment. Once the samples had been digested, they were stored in polypropylene bottles for further elemental analysis in the ICP-OES equipment.

2.4. Elemental Analysis

The samples were analyzed using Inductively Coupled Plasma Optical Emission Spectroscopy (ICP-OES) equipment, model Perkin Elmer Optima 8300 (Shelton, CT, USA). Three replicates were taken and the mean value of the analysis was reported. Calibration with Perkin Elmer standards and blank analysis were also performed. The calibration consisted of using the multi-elemental standard (Perkin Elmer brand) of As, Cr, Ni, Zn, Fe, Mn, Cu, Cd, Pb, Se and Li to calibrate the ICP-OES equipment (Perkin Elmer brand) and obtain the concentrations of the elements. The detection limits (mg/L) were as follows: As 0.001, Cr 0.0002, Ni 0.0005, Zn 0.0002, Fe 0.0001, Mn 0.0001, Cu 0.0004, Cd 0.0001, Pb 0.001, Se 0.0002 and Li 0.0003.

2.5. Statistical Analysis

A principal component analysis reduces the dimensions of a data set with many correlated variables. The reduction is performed by transforming the original variables into a new set of variables called principal components [53]. Also, Pearson’s correlation was used. The principal component analysis and Pearson’s correlation were used to identify possible sources of PTE contamination in the water bodies. The variables considered included the elements quantified by ICP-OES. The data were analyzed using the Infostat 2020 version and GraphPad Prism software 8.0.2 version.

2.6. Pollution Index

In this work, indices were determined in sampled areas to evaluate contamination by PTEs. The Pollution Index provides an estimate to evaluate the viability of the water body to be used for human activities, as well as to establish whether the surrounding population could be at risk.
This indicator allows the determination of water quality based on Potentially Toxic Element (PTE) concentrations. The Pollution Index is described as a rating that reflects the combined impact of various PTEs on water quality, modified from Moldovan et al. (2022) [54].
P I = Q i W i W i
where
Q i = C a C i × 100 ( C s C i )
In the equation, Ca (mg/L) represents the concentration of the element in the water sampled, Ci denotes the ideal value of this parameter in water for human consumption, with the ideal value assumed to be zero for all parameters except for Zn (0.200 mg/L) and Cu (0.05 mg/L) [55], and Cs signifies the standard concentration of the element in water (Table 1).
W i = 1 C s
W i is inversely proportional to the maximum permissible concentration.
Table 1. Permissible standard concentration according to NOM-127-SSA1-2021 [56].
ElementPermissible Standard Concentration (mg/L)
As0.025
Cr0.05
Ni0.07
Zn5
Fe0.3
Mn0.15
Cu2
Cd0.005
Pb0.01
To evaluate the contamination level, PI values are classified as low (PI value < 15), medium (PI value = 15–30) and high (PI value > 30) [57]. The critical value of PI is 100, and it is known that PI values above 100 cause greater damage to health [54].

2.7. Health Risk Assessment

In this work, indices were determined in sampled areas to evaluate the health risk; assessment was performed due to the proximity to human settlements related to agriculture and livestock activities. The estimation of the indices predicts the behavior of contaminants in the future. The oral and dermal routes were selected, because the inhabitants come into dermal contact through domestic activities (food preparation, cleaning of domestic areas), irrigation of vegetables, and handling of contaminated water. Likewise, in the sampled area, people consume vegetables and meat products from animals that consume contaminated water, without being aware of the presence of PTEs in the area.

Chronic Daily Intake

This methodology is characterized by the identification and analysis of toxic elements and their adverse effects at a specific time and the estimation of their risk level. The calculation of Chronic Daily Intake (CDI) is based on Equations (4) and (5), as the two primary routes of pollutant entry through ingestion or dermal absorption. Table 2 shows the values used for the determination of the Chronic Daily Intake [58].
C D I   i n g e s t i o n w a t e r = E C · I R · F E · E D B W · A T
C D I   d e r m a l = E C · S A · A F · A B D S d · E T · E D · C F B W · A T

2.8. Non-Carcinogenic Risk

2.8.1. Risk Quotient for Ingestion and Dermal Route

Equations (6) and (7) are used to estimate the Risk Quotient for ingestion and dermal (HQ) and Hazard Index (HI), respectively [58].
H Q   i n g e s t i o n   =   C D I   i n g e s t i o n R f D   i n g e s t i o n
H Q   d e r m a l   =   C D I   d e r m a l R f D   d e r m a l
where
C D I = Chronic Daily Intake (mg kg/day);
R f D = reference dose (ingestion and dermal) (Table 3).

2.8.2. Hazard Index

The Hazard Index (HI) represents the cumulative non-carcinogenic risk, encompassing the summation of hazard quotients for both ingestion and dermal absorption. This indicator is expressed by the following equation:
H I   =   H Q i   =   H Q   i n g e s t i o n + H Q   d e r m a l
where
i = the value of each element.
Regarding human health, an HI value < 1 indicates a low risk, while values > 1 indicate a high risk in terms of long-term health risk assessment.

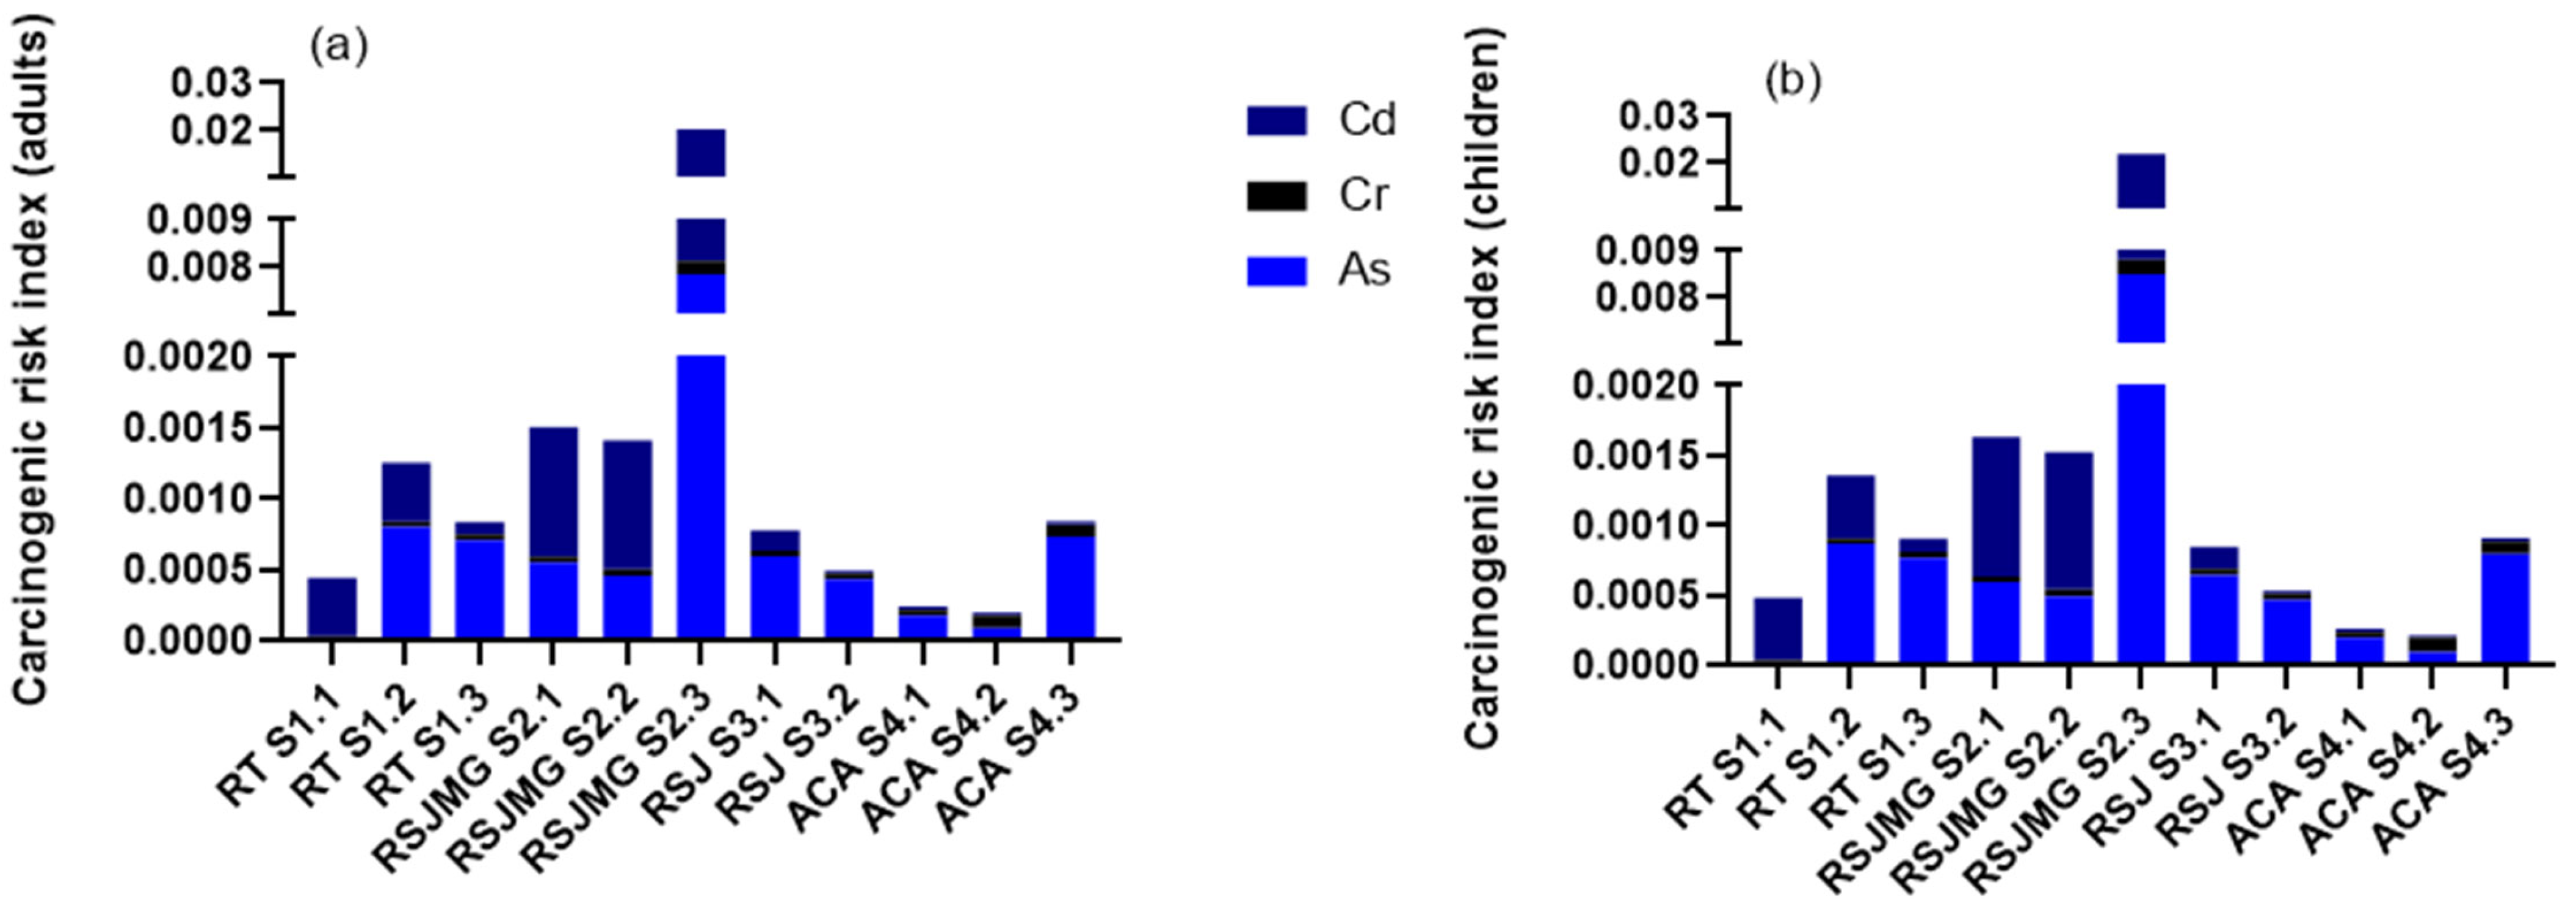
2.9. Carcinogenic Risk Index

However, the carcinogenic risk index (Rc) will also be used, since there are elements such as As, Cr and Cd, which are identified as possible precursors to the appearance of cancer in humans.
For this, the following equation was used [72]:
Rc = CDI × SF
where
CDI = Chronic Daily Intake;
SF = slope factor of As (1.5) [73], Cr (0.5) [74] and Cd (0.38) [75] contamination slope (in terms of mg/kg per day) through oral ingestion for each element. For the determination of the carcinogenic risk index, the values previously obtained for As, Cr and Cd were taken by determining the daily chronic intake considering oral route:
LCR =∑ Rc
where if the value of Rc and LCR exceeds 1 × 10⁻⁴ it represents a carcinogenic risk for the human body for life [76].

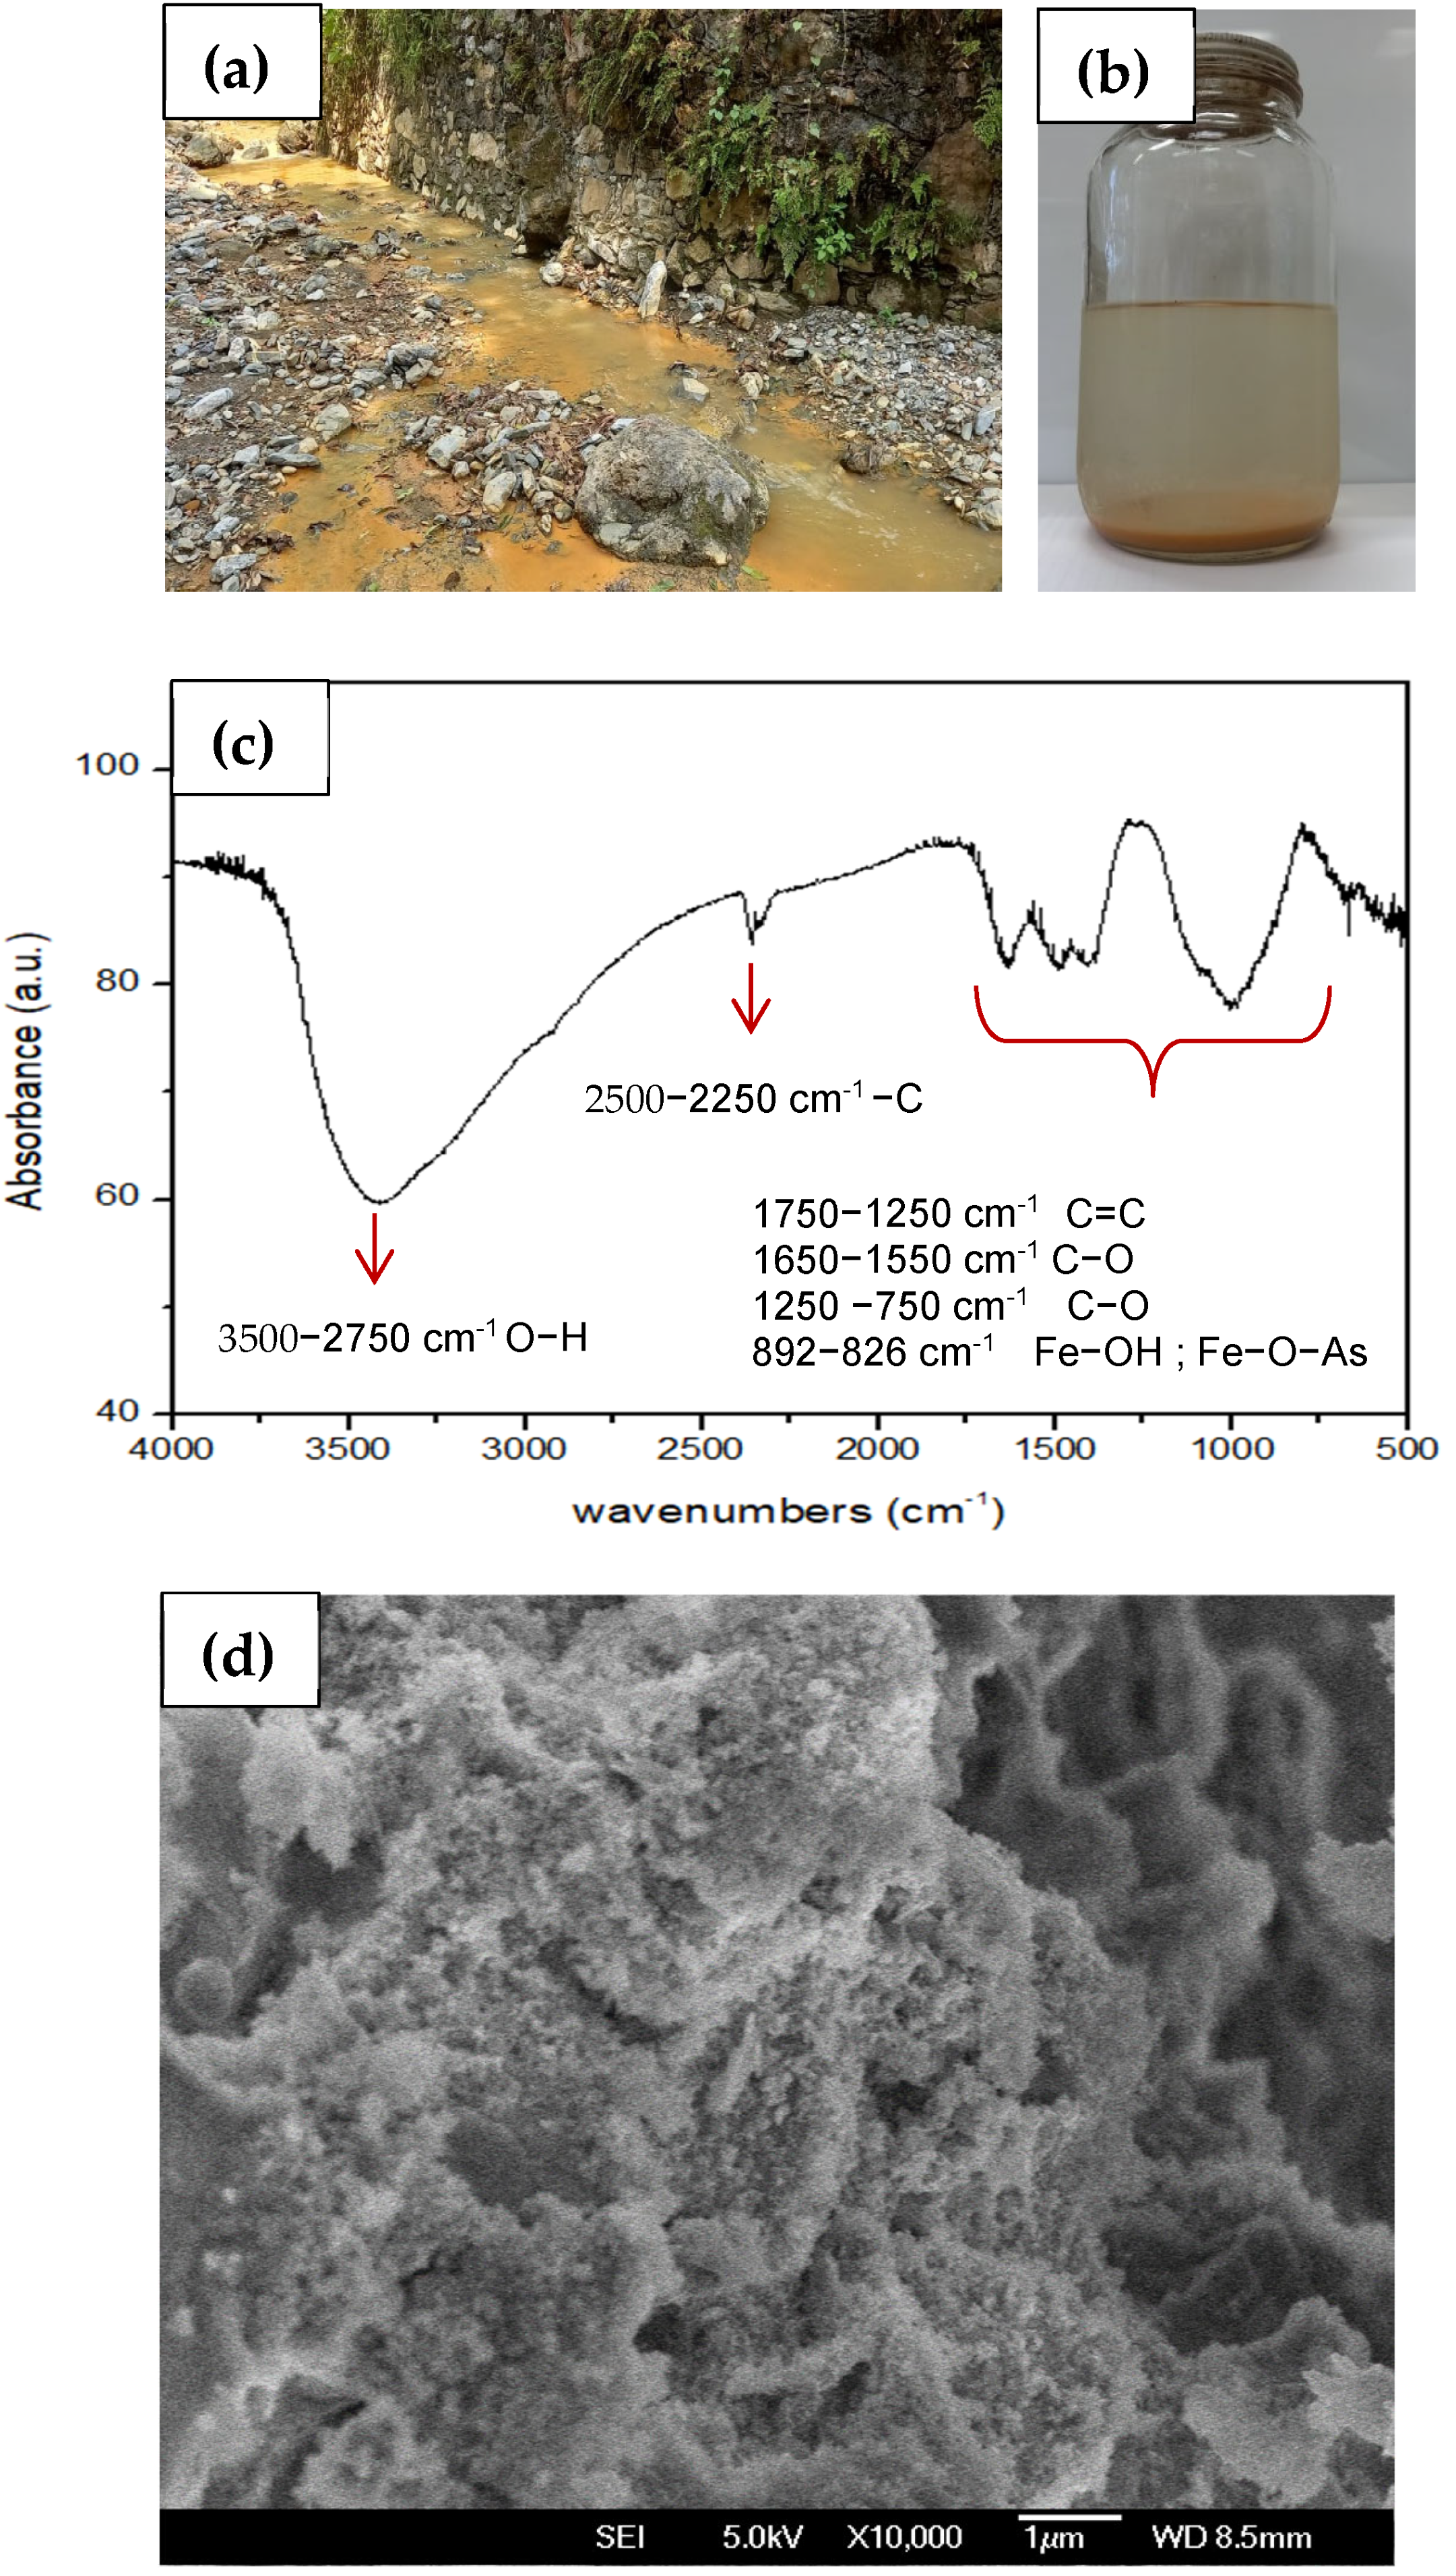
2.10. Analysis of Sedimented Solids in the Sampled Water from Point RSJMG S2.3

Sedimented water samples were vacuum-filtered using Whatman No. 40 filter paper. The sediment retained in the paper was dried in an oven at 30 °C for 24 h, and then characterized.

2.10.1. Scanning Electron Microscopy of Sediment

The analysis was performed by Scanning Electron Microscopy (SEM) with a JEOL JSM 7401F model (JEOL, Tokyo, Japan) instrument. Samples were examined under high-vacuum conditions at 5 kV, with magnifications set to ×10,000.

2.10.2. Fourier Transformation Infrared Spectroscopy

The samples were analyzed using Fourier Transform Infrared Spectroscopy (FTIR) in a Nicolet 6700 instrument to determine the functional groups present in the sediments. Spectral scanning was performed in the 4000–400 cm−1 range with a resolution of 2 cm−1. The data were analyzed from the signals obtained.

3. Results

The analyzed areas are depicted in Figure 2, with contour lines delineating the sampled regions. This figure includes topographic elevation data corresponding to the mining zone and landfill near the San Juan and Taxco Rivers (Figure 2a), as well as RSJMG and RT sampling sites (Figure 2b). Notably, the points sampled at lower altitudes correspond to the Xochula areas. This geographical visualization facilitates the observation that regions at lower altitudes exhibit higher concentrations of PTEs compared to those at higher altitudes.
The municipality of Taxco is characterized by topographic elevations, which can lead to the accumulation of PTEs in some areas. In addition, due to the area’s mining history, impacts continue to be observed due to the uncontrolled release of PTEs. Likewise, the high concentrations of PTEs in the lower altitude areas could allow leaching in the area, coming from the old mines and the landfill adjacent to the mentioned points.

3.1. Analyses of Physicochemical Parameters of River Water Samples

The physicochemical parameters, temperature, electrical conductivity, and pH, were determined from the collected samples with the multiparameter probe; the results are shown in Table 4.
According to the Mexican NOM-127-SSA1-2021 and NOM-001-SEMARNAT-2021, in terms of physicochemical specifications, it can be observed that the pH range indicated as a permissible limit is from 6.5 to 8.5 and from 6 to 9 (respectively); therefore, the samples collected are within this range. Likewise, the temperature parameter is within the permissible range. On the other hand, in NOM-127 and NOM-001, no limits are established for conductivity; however, the Environmental Protection Agency has established 50 and 1500 μS/cm as the maximum permissible limit in rivers, while in streams it is 150 and 500 μS/cm [78]. From this, it can be observed that the sites corresponding to RT S1.1, RSJMG S2.1, S2.2 and S2.3 are outside this range, and, in turn, this could compromise water quality. Electric conductivity is affected by the presence of ions, i.e., high concentrations of some PTEs cause high conductivity values. Therefore, it is considered an important parameter because it indicates the quality of water bodies, even if a site does not show apparent effects of contamination. Likewise, pH can influence the mobilization or solubilization of PTEs.

3.2. Analysis of Elements

The elements analyzed in the water samples were As, Cr, Ni, Zn, Fe, Mn, Cu, Cd, Pb, Se and Li. Table 5 shows the average concentrations of the elements determined in the water samples and compared with national and international standard regulations for water for human use and consumption.
The sampling sites are located near human settlements. In addition, water from the San Juan River and Taxco River is used for crop irrigation in the area and domestic water supply. For this reason, national and international standards are norms that regulate the maximum permissible limits for contaminants in water for human use and consumption. It is also compared with NOM-001, since this also establishes the parameter limits for treated water.
According to the concentrations determined at the sampling sites, Fe > Zn > Mn > Li > Cu > Cd > Ni > Se > As > Pb> Cr were found for the Taxco River (RT), the latter not being detected at that point. In the samples from the San Juan River with leachate from “La Guadalupana” tailings “(RSJMG), the concentration order was Fe > Zn > Mn > Cu > Cd > Pb > Li >As > Ni > Cr; the only element that was not detected at this point was Se. On the other hand, in the San Juan River (RSJ), the concentrations followed the order of Fe > Zn > Se > Li > As > Cd > Mn > Pb > Cu > Ni. Finally, in the locality of Acamixtla (ACA), which is not impacted by mining and landfill leachates, and where the San Juan River crosses through, the concentrations detected were as follows: Fe > Zn > Mn > Cu > Li > Se > Ni > Cr > As > Pb > Cd. The element found in the highest concentration at all sampling points was Fe.
When comparing the results obtained from the samples taken at the different sites, it is observed that the place with the highest concentration of elements is in the discharge to the San Juan River of water contaminated with leachate from the “La Guadalupana” tailings; it contains highly toxic elements, such as As, Cd and Pb. In particular, the RSJMG S2.3 sampling point, where the discharge of mining leachate and the landfill are located, is the place where the largest number of elements were identified. Likewise, Cd concentrations for this site were higher than NOM-001, which establishes the permissible limits for contaminants in wastewater discharges into receiving bodies such as rivers, streams, canals and drains.
The RSJMG site exhibited the highest number of elements, with concentrations exceeding the maximum permissible limits set by NOM 127, the World Health Organization and the Environmental Protection Agency. At this sampling point, the elements that exceeded the limits of the previously mentioned norms were As, Mn, Cd, and Pb, as well as Fe and Mn. Conversely, at the RT and RSJ sites, Cd concentrations exceeded those specified in the above-mentioned standards, and As only exceeded the Environmental Protection Agency limit at the RT S1.2 point. This sampling point was conducted at the location where leachate from the mine and a landfill is discharged, several meters above the river, and mixed with the water of the Taxco River. This water supports several vegetable crops and grazing cattle that are exposed to PTEs, which could accumulate through the food chain.

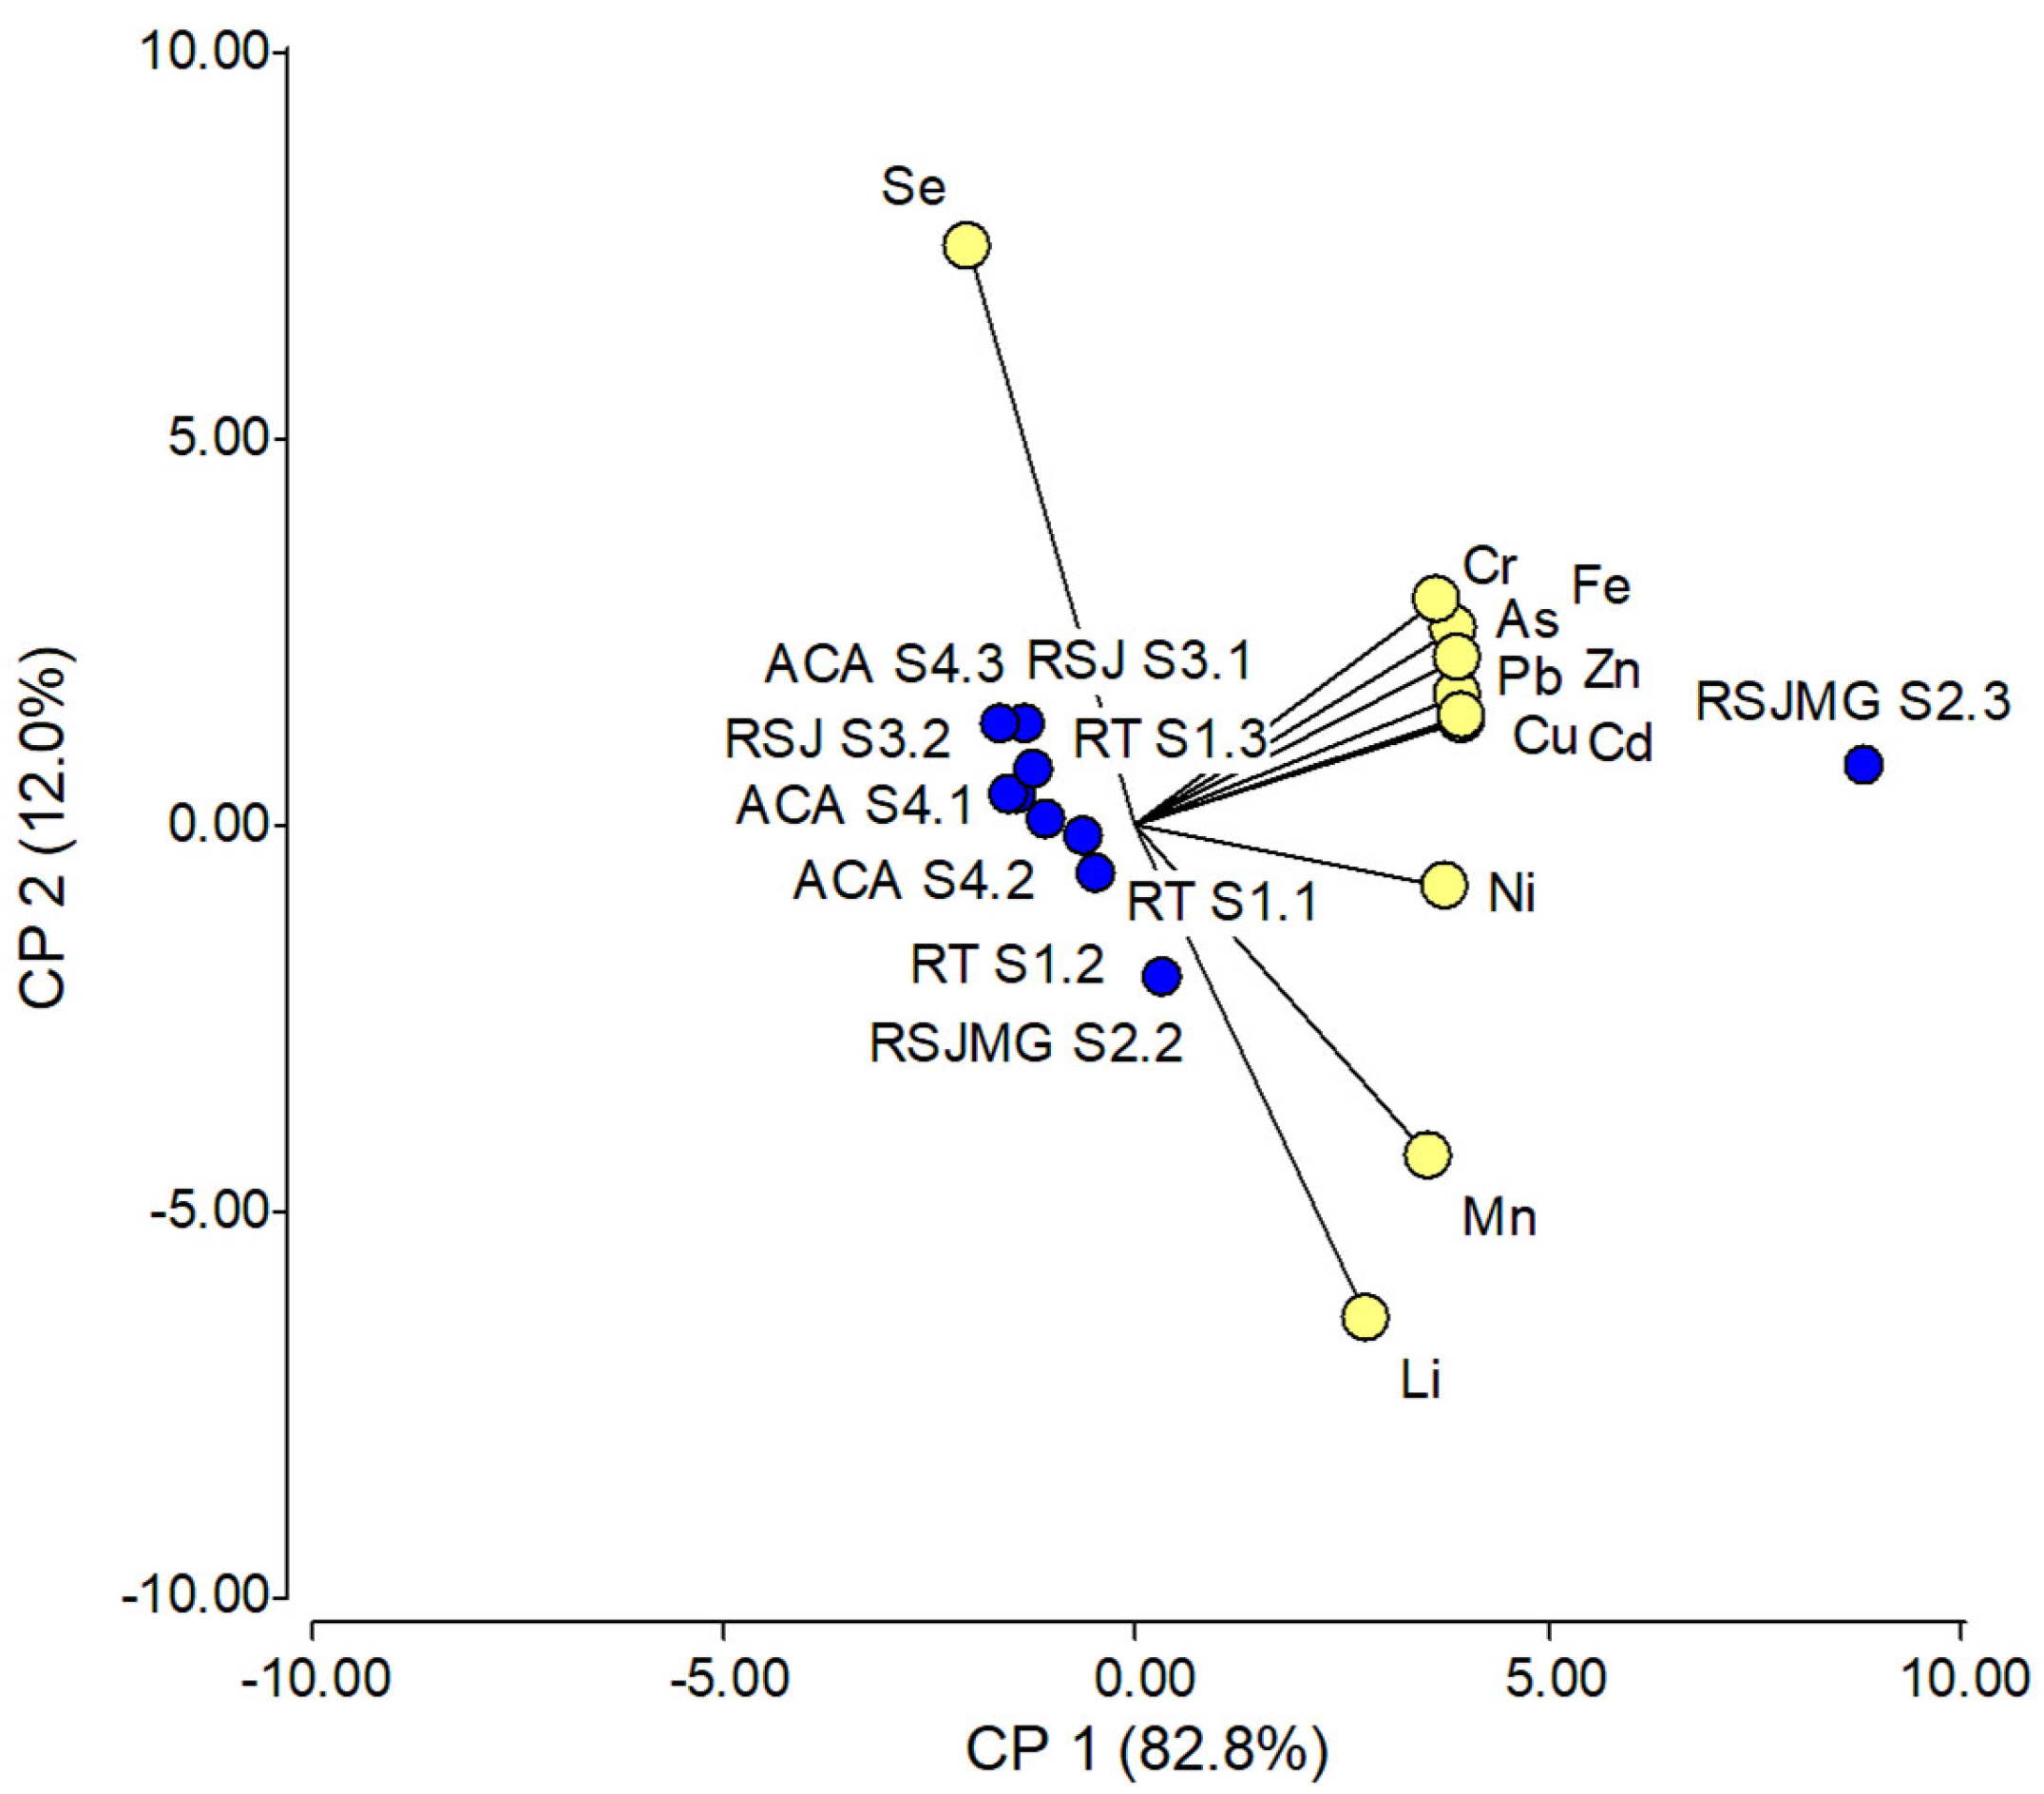
3.3. Principal Component Analysis

Statistical analysis describes the relationship between the elements and the sampled sites. This type of analysis is important, because the interactions make it possible to illustrate the sources of elements present in the environment. The biplot (Figure 3) shows the relationships between the elements determined and the sites sampled. The San Juan-La Guadalupana Mine River (RSJMG S2.1, S2.2, S2.3) is the area with the greatest exposure to Cr, As, Fe, Pb, Zn, Cu and Cd. In particular, the site known as RSJMG S2.3 is closely related to and exposed to the previously mentioned elements.
Likewise, the positioning of the vectors would indicate that the elements maintain a close relationship with the RSJMG S2.3 site, which receives mining leachates; therefore, at this point, the contamination can be attributed mainly to mining activity. This could explain the closeness between the elements and the mentioned site.
The evaluated system explains 94.8% of the total variance through its principal components. Principal Component 1 accounts for 82.8% of the variability, while Principal Component 2 explains 12%. The elements with the highest loadings in PC1 site were Zn, Fe, Cu, and Cd, indicating a strong association with anthropogenic activities such as mining. In contrast, Principal Component 2 site is primarily influenced by Se, Li, Mn, and Cr, elements typically linked to the improper disposal of electronic components and agricultural practices. Given the significant contribution of both components, the contamination in the system can be characterized as multi-elemental in nature.

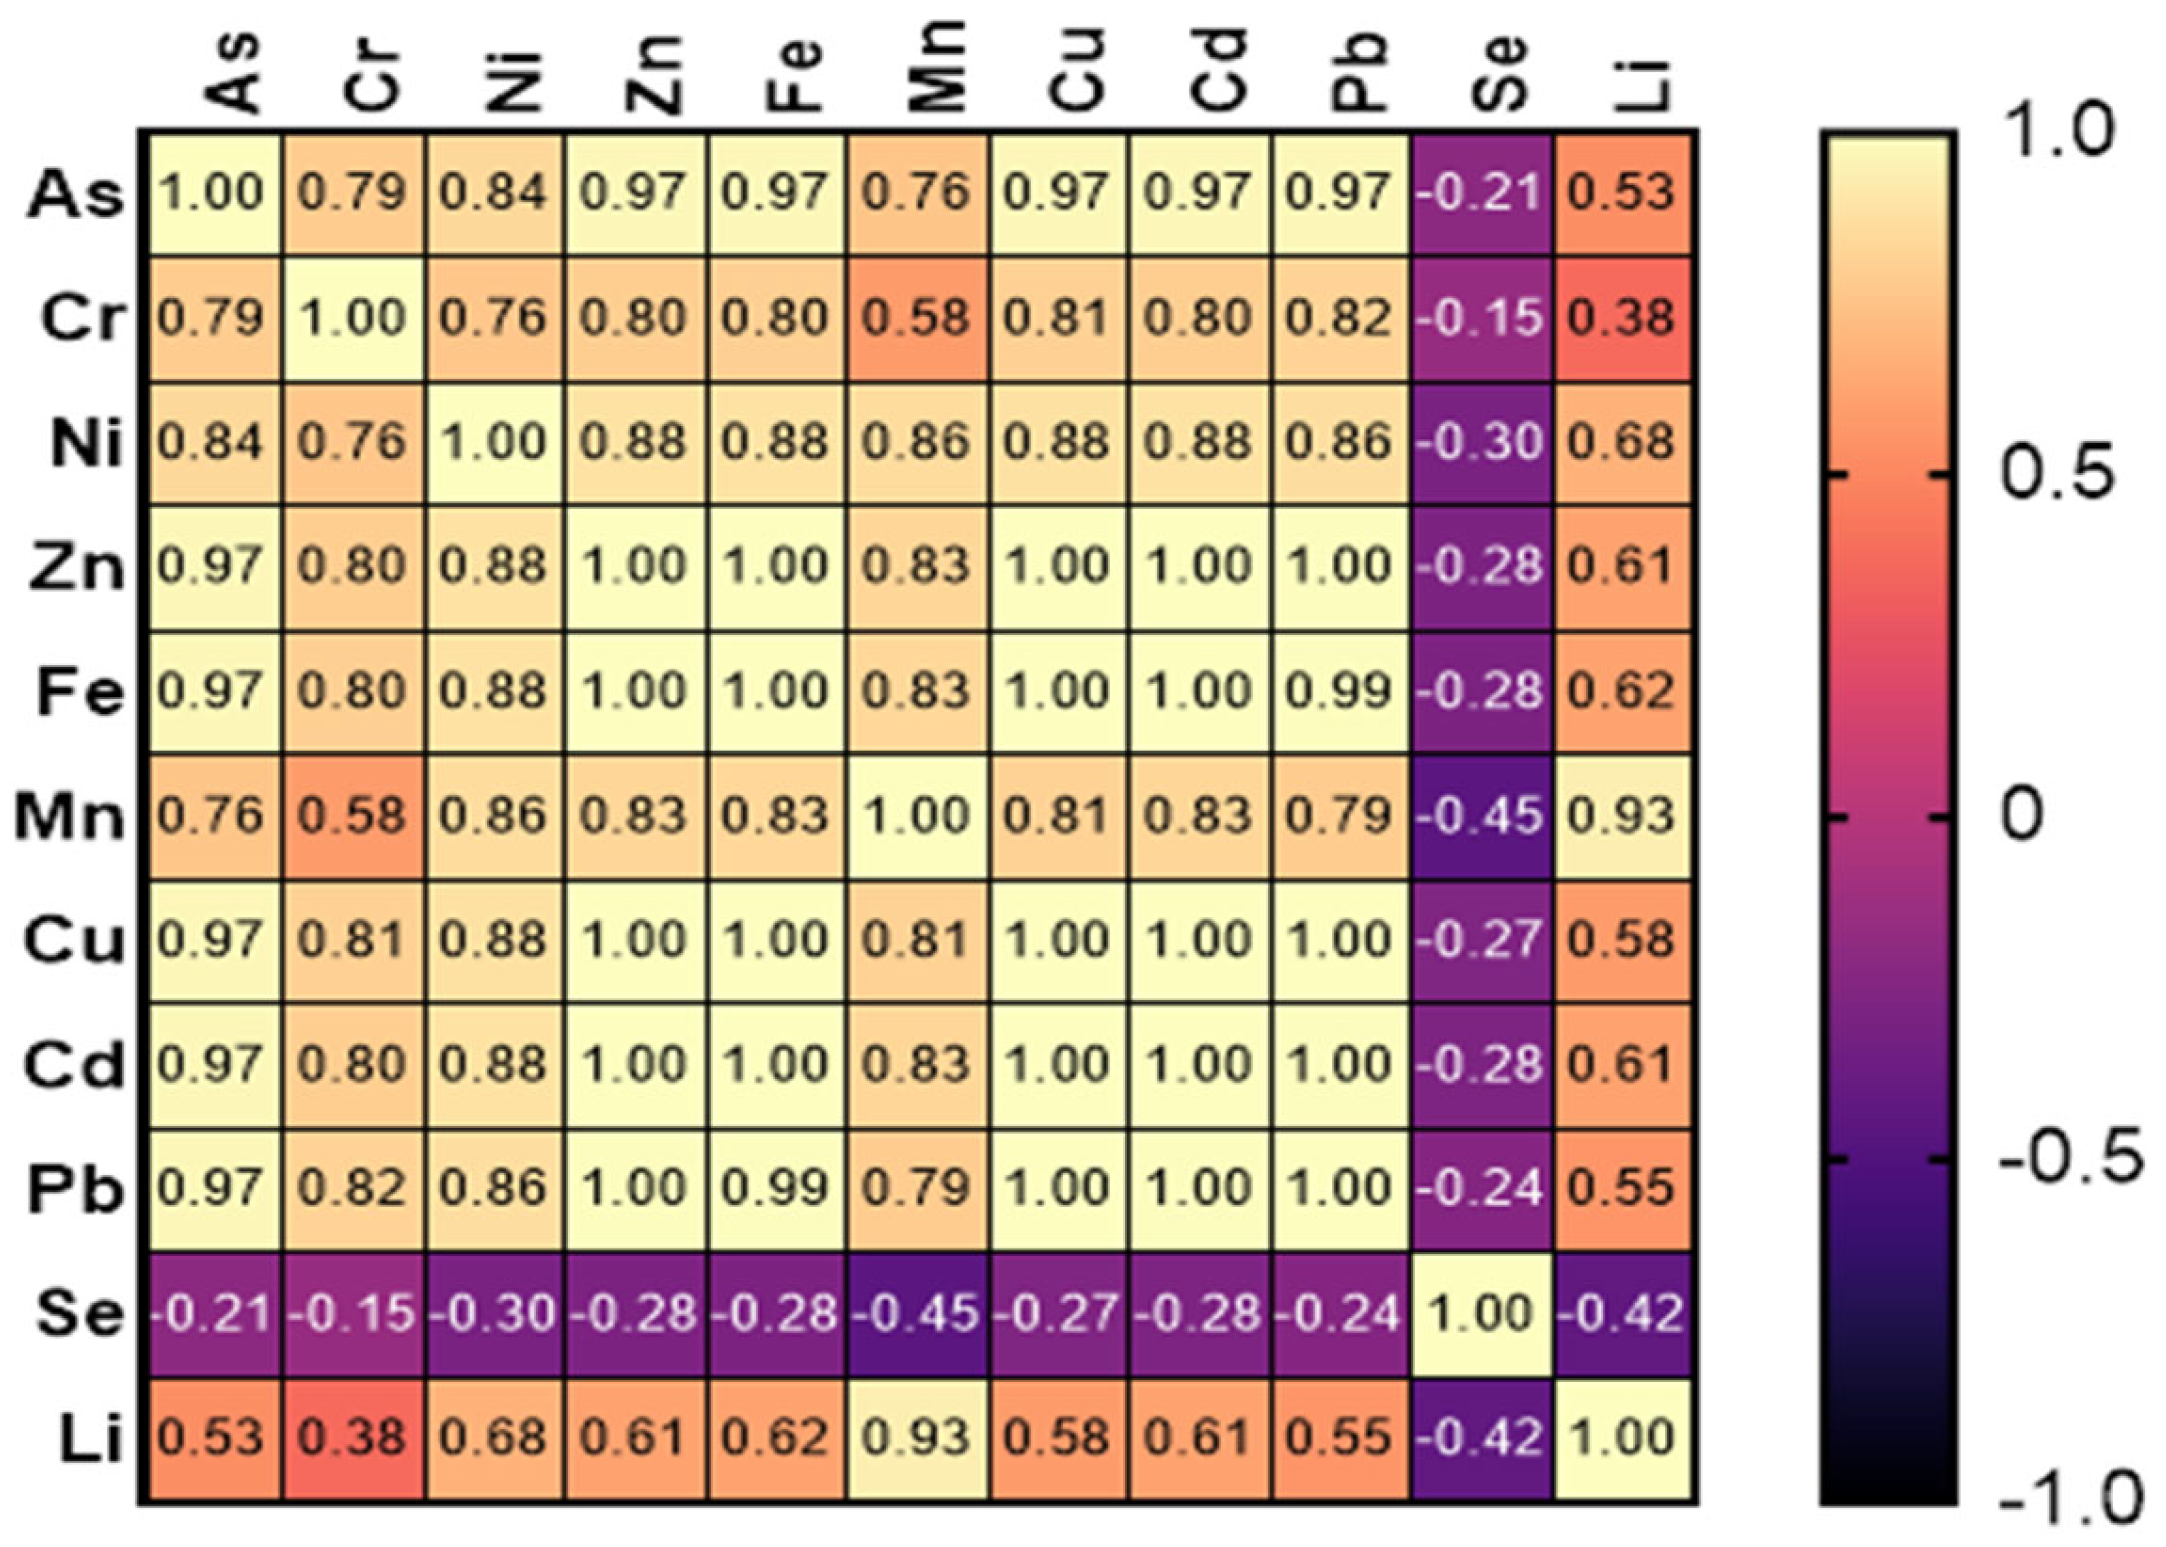
3.4. Pearson’s Correlation

In addition, Pearson’s correlation analysis (Figure 4) revealed significant positive highly correlations (p < 0.05) among Zn, Fe, Cu, Cd, and Pb, indicating that these elements tend to increase together in concentration. Similarly, As exhibited a significant positive correlation with these elements. The high correlation in the analysis indicates that the elements analyzed come from the same source of contamination and may even have the same source of migration. That is, the elements may have their origin from activities, such as mining, agriculture and poor disposal of electronic products; the latter is attributed to the proximity of the impacted rivers to the waste disposal site. Therefore, the dispersion of elements, such as Zn, Fe, Cu, Cd and Pb, can occur by leaching into water bodies. On the other hand, when correlations are negative, this could indicate that the concentration of some elements is diminished in the presence of others, as is the case with the elements.

3.5. Pollution Index

Table 6 displays the Pollution Index (PI), which allowed us to evaluate and classify the level of contamination in the sampled areas. It is estimated that values above 100 in the Pollution Index must be sites with a “high” level of contamination. From what was obtained, the site with the highest Pollution Index values—and, therefore, that with the highest contamination—corresponds to the area belonging to the San Juan River with leachate from the “La Guadalupana” Mine (RSJMG).
The high content of contamination in the aforementioned area is because the San Juan River receives tailings from the “La Guadalupana” mine; likewise, the sampling area is adjacent to a sanitary landfill, which receives urban solid waste from the Municipality of Taxco. In turn, this could contribute to the leaching of pollutants until they reach the soil and/or bodies of water. Other sites with a high level of contamination are RT S1.1, RT S1.2 and RT S1.3, which correspond to the Taxco River, in addition to site RSJ S3.1, which is located in the San Juan River. It has previously been reported that sites with Pollution Index values above 100 are not suitable for use for drinking water or agriculture [57], because the danger of these sites lies in the fact that they can cause significant damage to human health [54]. On the other hand, Acamixtla (Aca S4.1, S4.2 and S4.3) and the San Juan River (RSJ S3.2) were the only areas with a medium level of contamination. This can be explained by the fact that this site is not impacted by mining leachates.

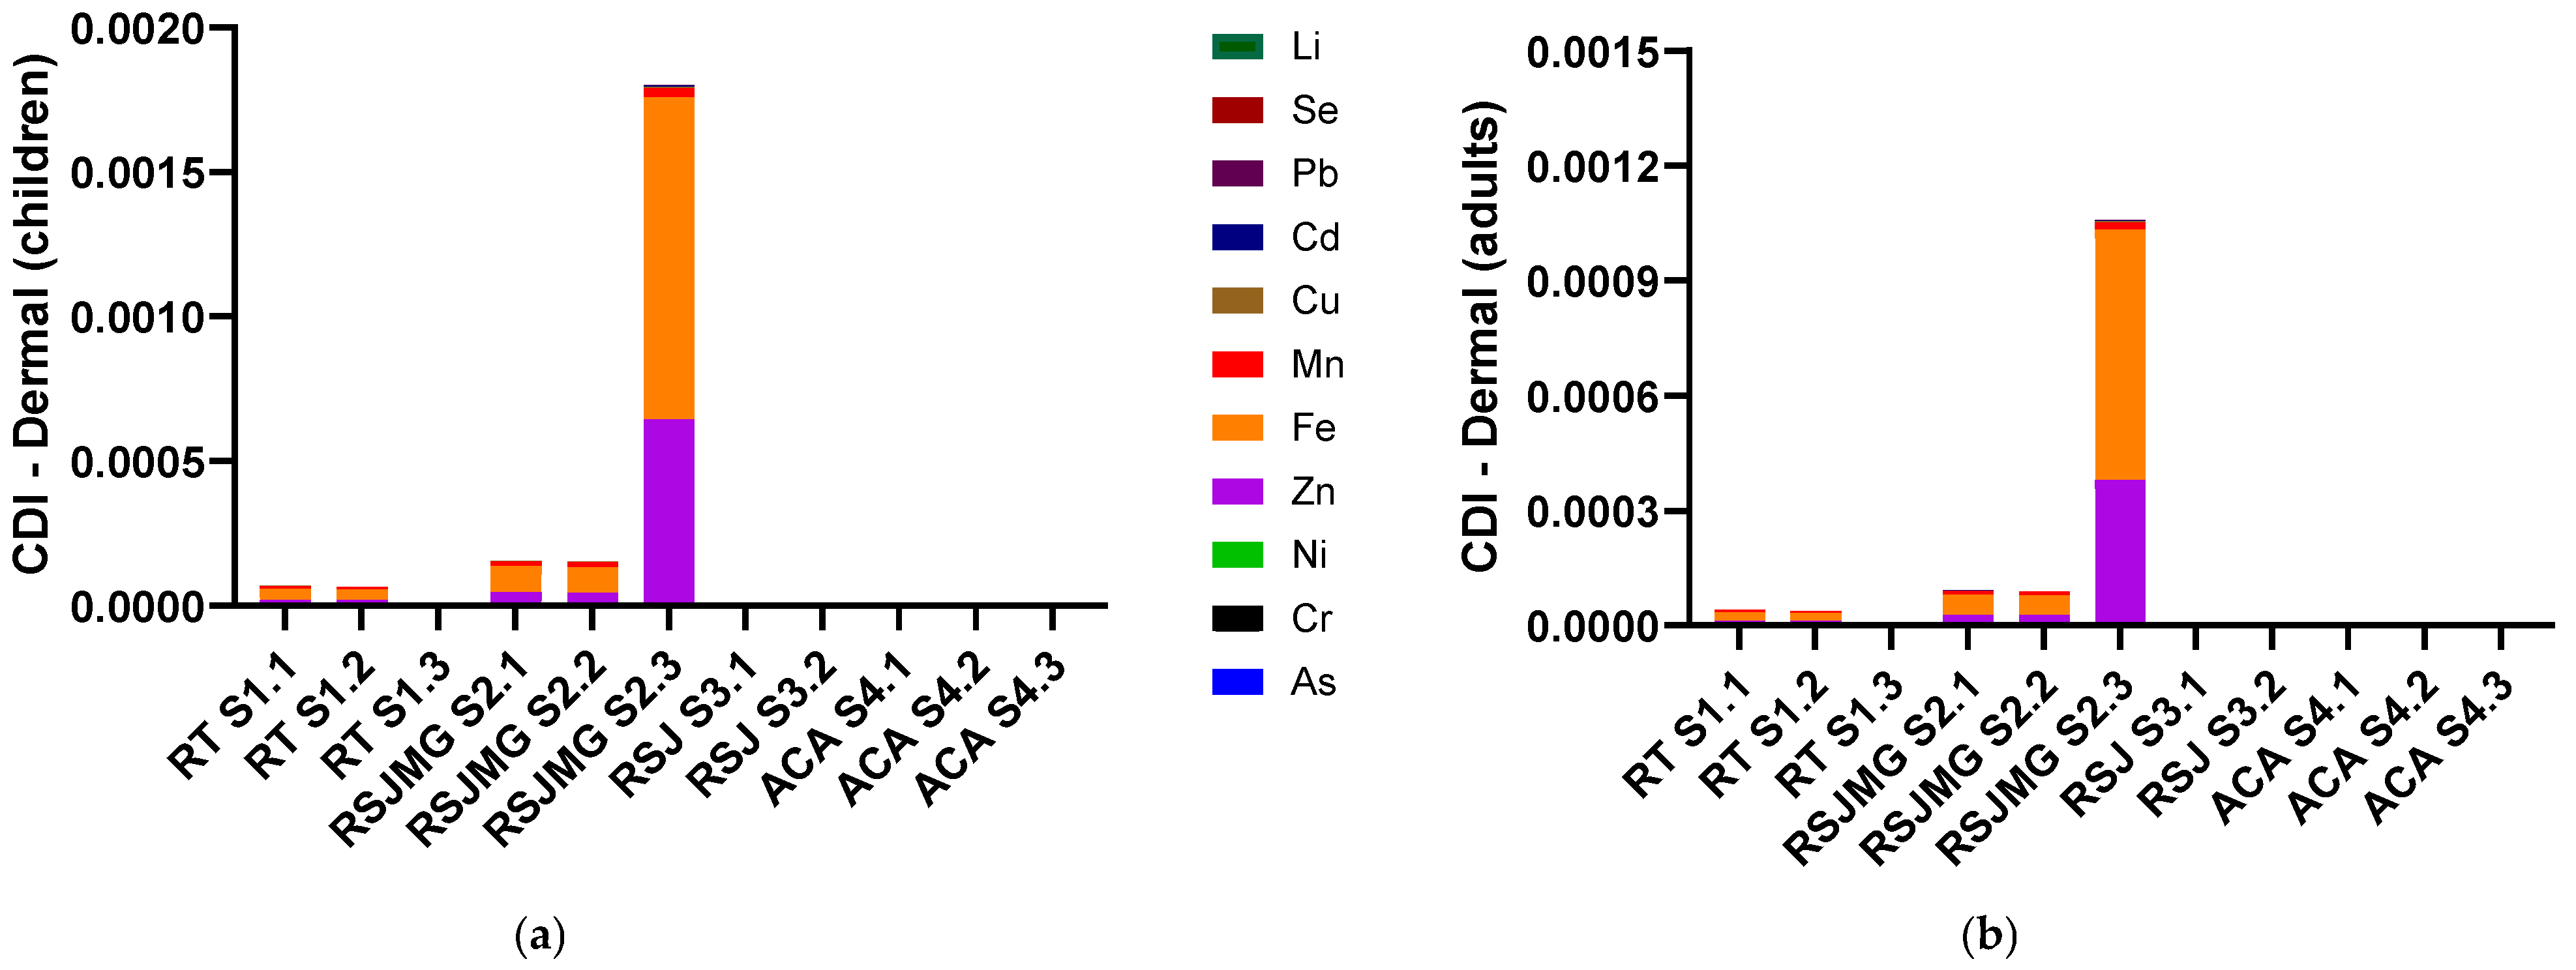
3.6. Chronic Daily Intake

The exposure indexes were established due to the proximity of human settlements in the sampling areas and because it has been reported that the population near mining areas is often exposed to PTEs, particularly in “El Fraile”, located in the northern area of Taxco de Alarcón, where PTEs in human urine have been recorded [12]. Figure 5 and Figure 6 show the determination of the Daily Chronic Intake (CDI) of PTEs found at the sampling sites. Based on the equations shown above, it was observed that oral and dermal exposure is predominant in the areas corresponding to the San Juan River with leachate from the “La Guadalupana” Mine sites (RSJMG S2.1, S2.2 and S2.3). Chronic Daily Intake values greater than 1 represent a significant danger; therefore, in this study, it is reported that the Chronic Daily Intake by oral ingestion route in children and adults is significant. Ingestion of contaminated water is the main route to PTE exposure.

3.7. Risk Quotient for Oral and Dermal Ingestion

Table 7 shows the calculations obtained for the Risk Quotient for ingestion (HQ) of all sampled sites. From this, it was observed that in the adult population and children, elements such as As, Zn, Fe and Cd showed coefficients whose values were higher than 1 by the oral route, which represents a risk; Cd presented the highest average Risk Quotient for ingestion value, followed by As, Zn and Fe. However, via the dermal route, these elements did not present a significant risk.

3.8. Hazard Index

On the other hand, the Hazard Index (HI) was determined (Table 8), which represents the accumulated non-carcinogenic risk and is the result of the sum of the Risk Quotients by both oral and dermal routes. A Hazard Index value < 1 represents a low risk, while values >1 indicate high long-term risk in terms of health risk assessment. As can be seen in Table 8, Cd is the element with the highest danger index, both in the adult and child groups. Likewise, the elements As, Zn, Fe, Mn, Cd and Pb also presented values higher than 1 in the two population groups evaluated. In particular, As and Cd were elements that presented values higher than 1 in seven and five sites, respectively. However, when considering the sum of the elements evaluated, all the sites and groups presented a Hazard Index greater than 1. The highest danger indices correspond to the San Juan River with leachate from the “La Guadalupana” Mine points (RSJM S2.1, S2.2 and S2.3).
It is important to note that, in the case of the concentrations of As, Cd, Zn, Fe, Mn and Pb, they present a health risk, according to the methods and indices used for the assessment of health risk in two of the populations (children and adults) through two routes (oral and dermal ingestion). In the work carried out by Salcedo et al. (2022) [58], it was determined that the concentrations of elements such as Mn, Pb and As present a health risk based on the determination of Chronic Daily Intake, Risk Quotient for oral and dermal ingestion and Hazard Index, establishing danger indices for children of 3.6249 (oral) and 1.6163 (dermal), and 4.6963 (oral) and 9.3773 (dermal) for adults. In the present work, these indices were evaluated from the concentrations determined in the water samples collected; however, when compared with the results referred to above, the indices reported in this work exceed those reported by Salcedo. We found, in the RSJMG S2.3 site, the highest indices of danger for adults with values of 17.471 (As), 15.918 (Zn), 11.771 (Fe), 1.689 (Mn), 64.489 (Cd) and 3.185 (Pb), while in children the values are 18.898 (As), 17.221 (Zn), 12.735 (Fe), 1.833 (Mn), 69.610 (Cd) and 3.446 (Pb). These results show the need to address this problem that not only affects the places surrounding the sampling sites but also the population in general, due to the toxicity that these pollutants present to human health.

3.9. Carcinogenic Risk Index

Figure 7 shows the carcinogenic risk of Cd, Cr and As, which have been identified as cancer precursors, as evaluated in two population groups: adults and children. In this context, it was observed that As and Cd have a higher carcinogenic risk compared to Cr. However, all elements evaluated are above the established limit of 1 × 10⁻⁴; therefore, there is a significant risk that the population groups evaluated, throughout their lives, will develop some type of cancer when exposed to the concentrations found in the sampled areas. The zones impacted with mining leachates (RSJMG S2.1, S2.2 and S2.3) have the highest carcinogenic risk indexes, followed by the corresponding zone of the samples collected from the Taxco River. On the other hand, the samples from Acamixtla (ACA S4.1 and ACA S4.2) had the lowest value compared to the rest of the sampled zones. In addition, it can be seen that, in all sites, Cd is the element that presents a higher carcinogenic risk index, surpassing As and Cr. It is important to note that there was no value for As in the RT S1.1 sites, while the ACA S4.2 and ACA S4.3 sites presented higher values for Cr compared to the other samples.

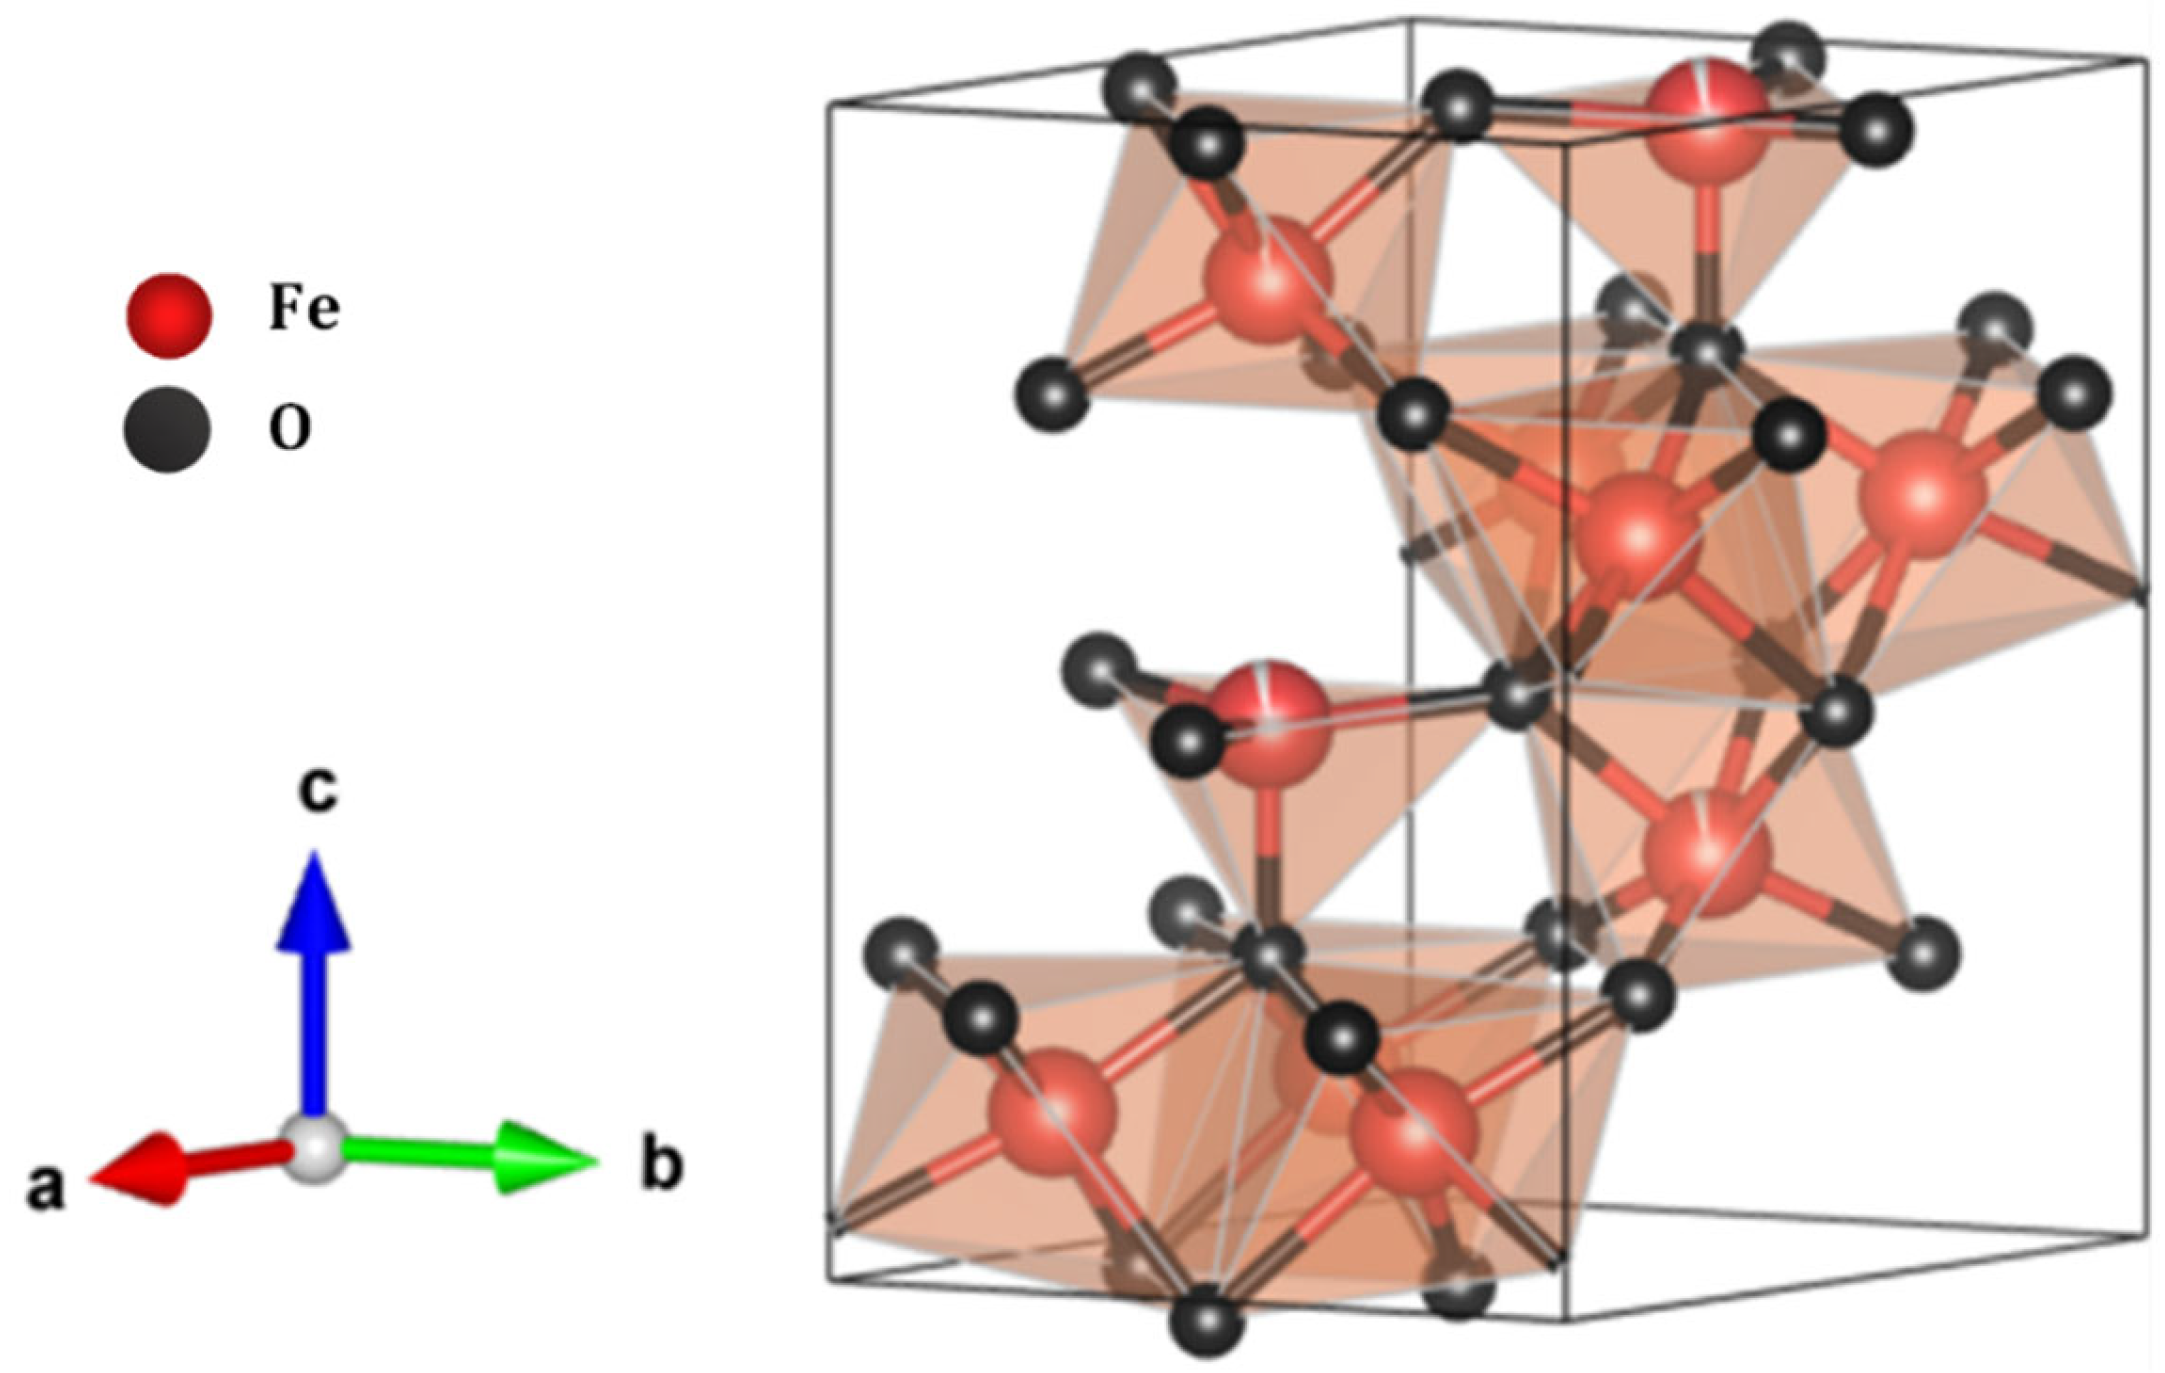
3.10. Analysis of Solids in Leachate-Contaminated Water and Proposal for PTE Reduction Through Ferrihydrite Generation

Scanning Electron Microscope and Fourier Transform Infrared Spectroscopy characterization analyses were performed only at sampling point RSJMG S2.3 (Figure 8). This is because high Fe concentrations were recorded at this point (Table 5), and a high amount of red suspended solids was found.
The Fourier Transform Infrared Spectroscopy analysis of reddish solids from leachate-contaminated water showed pikes reported for ferrihydrite (Figure 8c) [80,81,82,83]. In particular, bands at 3500–2750 cm−1 allocated for O–H stretching and 2500–2250 cm−1 for C bond stretching; 1750–1250 cm−1 corresponds to the bonds of C=O and C–O, where carboxylate ions generate two bands. An asymmetrical stretch band is usually close to 1650–1550 cm−1, while a symmetrical stretch band is close to 1400 cm−1. Even the band at 1630 cm−1 is assigned to the H–O–H deformation and vibration of water molecules, indicating the presence of physiosorbed water in ferrihydrite and amorphous ferric arsenate [84,85,86]. On the other hand, at 1250−750 cm−1, the peak can be attributed to the stretching of C–O; however, the width of the band may be due to an overlap of signals, since the bands corresponding to Fe–OH and Fe–O−As range between 892−826 cm−1 approximately, which are characteristic patterns of the As–ferrihydrite complex, as reported by Wang et al. (2018) [81]. Likewise, the Scanning Electron Microscope analysis (Figure 8d) showed isomorphic agglomerates, like the ferrihydrite reported previously [87]. In this work, the particles showed different sizes; these small particles were observed to be randomly arranged, forming irregular regions and furrows. This amorphous structure is similar to the biogenic ferrihydrite produced by the bacteria Klebsiella oxytoca [88].

4. Discussion

The municipality of Taxco de Alarcón has been the focus of numerous studies investigating the presence of PTEs in both soil and nearby water bodies, particularly around abandoned mines and landfills. These studies have revealed a concerning level of PTE contamination, indicating a potential high level of exposure for the local population, as evidenced by the elevated concentrations detected in human urine [12]. In Taxco de Alarcón, it has been reported that, due to the numerous mining tailings in the region, up to 55 million tons of mining waste has been generated, with high concentrations of Pb, Ni, Cd, Cu, Mn and Zn in their composition, facilitating their dispersion in bodies of water, through the air and in soil [89].
In particular, the Taxco River, a significant water body in the region, plays a crucial role. It receives wastewater (0.15 m3/s) from the municipal capital and surrounding areas with human settlements, along with solids and liquids discharged from mining tailings [24]. It is known that, in the vicinity of the Taxco River, there are three mining tailings, which have a high degree of oxidation, and their leachate is discharged directly into it, which suggests that the presence of these elements is due to the presence of such residues in the vicinity of the river [31]. This is in addition to the fact that, in the community of Xochula, there is a sanitary landfill, which could be presenting leachate to the bodies of water, including in the area where there are wastewater discharges that directly impact riverbeds.
Furthermore, reports indicate that the tailings in the municipality of Taxco possess a significant capacity to disperse PTEs in chemically accessible forms, which poses a risk to the flora and fauna inhabiting areas adjacent to these sites [29]. The migration of contaminants from mining occurs through the erosion of waste materials that are usually deposited in piles and exposed to the effects of wind and rain; as such, these toxic loads are often spread out over years [15]. In addition, it has been reported that particles from mining areas can be found up to 6 km away [16]. On the other hand, agricultural activity, through the application of fertilizers, can contribute to the presence of Cd, Cr, As, and Pb [90,91]. Likewise, PTEs have been reported to enter water bodies through the weathering of rocks or through mining or smelting sites [17].
Among the various studies conducted in the area is that of Méndez–Ramírez and Armienta–Hernández (2012) [24], in which they determined the concentrations of EPTs in the Taxco River. Comparing the concentrations obtained with those reported in this work, some similarities are observed; some of the PTEs concentrations found were up to 54.5 mg/L (Fe), 0.017 mg/L (As), 3.94 mg/L (Cu), 0.210 mg/L (Pb), 245 mg/L (Zn) and 1.73 mg/L (Cd) in the dry season, while in the rainy season, the concentrations were 28.10 mg/L (Fe), 0.047 mg/L (As), 0.027 mg/L (Pb), 26.30 mg/L (Zn) and 0.2 mg/L (Cd). In this sense, the concentrations of some of the PTEs exceed the maximum permissible limits established by the Official Mexican Standards (NOM–127–SSA1–2021). In 2019, Sánchez Montoya et al. pointed to the presence of PTEs in Taxco’s water from the Chacuhalco spring, one of the bodies of water that supplies the city. The maximum concentrations reported by the authors for the different PTEs found were 0.808 mg/L for Fe, Zn with 1.064 mg/L, Mn 0.088 with mg/L, As with 0.034 mg/L and Cu with 0.229 mg/L. The maximum reported concentrations of Fe and As are higher than the maximum permissible limits established by NOM-127-SSA1-2021. However, these data could not be comparable to what was reported in this study because the sampling points are different; nevertheless, it is important to mention their evidence that these contaminants are present in the water.
Additionally, Salcedo et al. (2022) [58] reported the presence of PTEs in various aquifers belonging to the municipality of Taxco, among which are the San Juan River, Taxco River and Cacalotenango River. In these waters, the concentrations of nine elements were determined, among which were As (≤0.0725 mg/L), Cu (≤0.0078 mg/L), Fe (≤0.3164 mg/L), Mn (≤1.4482 mg/L), Ni (≤0.0181 mg/L), Pb (≤0.0182 mg/L) and Zn (≤0.2335). These concentrations could be comparable to those of the present study because the samples are in the same area; however, some changes are noted, such as the presence of Cd and Cr, in addition to the fact that the concentrations of Fe, Mn and Zn exceed the concentration reported by the authors.
On the other hand, concentrations of Li were determined in this work; this element is not considered to be within the maximum permissible limits established by NOM-127-SSA1-2021. However, the EPA establishes that this element is classified as an unregulated pollutant, with its permitted concentration being 9 μg/L; as such, the levels in all the sampled sites exceed the permitted concentration [92]. The finding of the presence of Li in the area highlights its excessive use in different areas; in 2021, it was reported that the production of Li worldwide was 100,000 tons/year, which represented an increase of 256% compared to 2010 (28,100 tons) [93]. In turn, the disposal methods turned out to be inadequate, causing the accumulation of this element in the environment [94]. In this case, it is important to mention that the sampling area is adjacent to a landfill, which could contribute significantly to the accumulation of Li. The concern of this registry is that this element can cause numerous detrimental effects at the different levels of the organs and mental health in humans [94]. Similarly, Li causes physiological and biochemical alterations in plant species [95,96].
The sample sites are highly exposed to PTEs such as Mn, Fe, and Zn, which are considered essential micronutrients in physiological processes; however, overexposure to these elements can cause neurological symptoms such as cognitive, behavioral, and motor deficits [97]. It has been reported that Mn can cause skeletal defects, infertility, heart disease, and hypertension [98]. It is also associated with harmful effects on the central nervous system, as Mn accumulates in the brain, which is why exposure has been associated with Parkinson’s in adults and other neurodegenerative conditions [99]. On the other hand, exposure to Fe is closely related to hemochromatosis, heart disease, central nervous system diseases, liver cirrhosis, diabetes, nausea, and skin blemishes [100]. Zn has been reported as a disruptive element for the thyroid; it combines with the thyroid hormone receptor and thereby disrupts the thyroid hormonal system [101]. The general mechanism of toxicity of PTEs is through the production of reactive oxygen species (ROS), causing, in turn, the occurrence of oxidative damage with further adverse health effects [102]. They affect cellular activity, such as cell differentiation, proliferation and cell death [103]. The carcinogenic process is initiated because of DNA damage in cells, which is caused by ROS, which play an important role in metal-induced cellular responses [104]. It is important to note that, based on the values of Chronic Daily Intake and Ingestion Risk Coefficient, as well as the Hazard Index and Carcinogenic Risk, a greater susceptibility to exposure was observed in children compared to adults. This can be attributed to the differences in physiological and behavior characteristics between the two populations [105]. The oral route is the main source of exposure for the Chronic Daily Intake and Ingestion Risk Coefficient, due to the consumption of contaminated food or drinking water, while dermal exposure occurs to a lesser extent [97]. When PTEs are ingested or inhaled into our body, they are accumulated in our system. Therefore, this accumulation causes biological and physiological complications at a cellular level; the damage can reach mitochondria, nuclei, lysosomes, and cell membranes [106].
On the other hand, it was observed that As, Cr, and Cd have a higher carcinogenic risk. According to the work carried out by Cai et al. (2019) [107], there are three elements that represent a high risk for contracting cancer: Cd, As and Cr. In the work carried out by the authors, it was shown that Cd was the element that showed greater relevance because the risk value obtained was higher with respect to As and Cr; it has been found in wheat and in groundwater in a locality in China.
As exposure increases the risk of several cancers, including skin, lung, bladder, and kidney cancers. Also, it is associated to skin lesions, including hyperpigmentation, hyperkeratosis, and the development of small warts or nodules [108]. Cr can be absorbed through the gastrointestinal tract, skin, and lungs [109]. It induces epigenetic alterations, leading to somatic changes in gene expression that are independent of changes in DNA sequences [110]. It is important to highlight that Cd has been identified as one of the elements that is a precursor to different types of cancer, including kidney, lung, pancreas, nasopharyngeal, gastrointestinal, breast and prostate cancer [111,112]; this is due to exposure to chemical agents that contaminate water, air and soil and that lead to the ingestion of contaminated food and water or their inhalation [113].
For this reason, strategies have been sought to mitigate contamination and, consequently, the effects of EPTs. According to the findings in the sediments, ferrihydrite can mitigate and complicate EPTs.
Ferrihydrite can form under a wide range of pH conditions in water environments and through the rapid oxidation of Fe (II) in the presence of crystal inhibitors such as organic matter, silicate, and phosphate [114,115]. Possessing a high surface area with abundant reactive sites, ferrihydrite is a significant source of Fe and is plentiful in nature [116,117,118]. Ferrihydrite, the primary product of induced ferric hydrolysis, typically initiates phase formation in natural aqueous environments [119]. The hydrolysis of ferric iron and the subsequent precipitation of ferrihydrite from a solution have been extensively studied [120,121,122]. According to the classical model, the formation proceeds through successive polymerization steps: solvated Fe(III) ions undergo hydrolysis to produce low-molecular-weight hydrated Fe(III) species (dimers, trimers) [123].
These species further interact via olation and oxolation to generate ferric species of higher nuclearity, ultimately leading to the nucleation (i.e., formation) of ferrihydrite nanoparticles in a solution [123]. However, the mechanisms of ferric hydrolysis are complex, and despite the extensive available literature on the topic, a unified view of ferrihydrite formation remains elusive. Due to the high charge density of Fe(III), the hydrolysis reactions occur rapidly, making the isolation and characterization of intermediate hydrolysis products challenging. Consequently, the pathways from monomer to ferrihydrite and the structure of any intermediate species remain unclear. Recently, an alternative mechanism for ferrihydrite formation was proposed, involving a monophase model consisting of a tetramer surrounded by an octahedral phase (Figure 9) [114].
The significance of ferrihydrite lies in its ability to immobilize highly toxic elements such as As [125] (Figure 10). It has been noted that 2–line ferrihydrite exhibits similarities with the most As-rich natural hydrous ferric oxide material [126]. Ferrihydrite also demonstrates the capacity to adsorb heavy metals, including Cd (II), Pb (II), Cu (II), and Zn (II), through the formation of robust surface complexes with its hydroxyl groups [127,128,129]. The principal mechanisms of adsorption involve ligand exchange, electrostatic interactions, and surface precipitation [130]. The adsorption of metals onto ferrihydrite is influenced by various factors, such as competing ion heterogeneity and ferrihydrite’s morphology [41,127]. EPT adsorption to ferric oxyhydroxide minerals can contribute to the reduction in the concentration of As in downstream sampling points, given their strong affinity for elements such as As [131]. The diverse PTEs, as well as the solids identified as ferrihydrite, allow us to propose the in situ generation of this mineral, which apparently decreased the concentration of PTEs downstream of the river, as shown in the results.

5. Conclusions

Contamination in water bodies of sites impacted by mining activity is one of the most rapidly growing problems in different areas of the Mexican territory. An example of this is the municipality of Taxco de Alarcón, where there are reports of PTE contamination in water. In the present work, the presence of these contaminants in the water of two of the main rivers of Taxco was determined, which are close to an inactive mine and a landfill.
San Juan and Taxco rivers showed concentrations of PTEs, of which Fe, Zn and Mn were found at high concentrations (>1 mg/L); however, in RSJMG S2.1, S2.2 and S2.3, concentrations of As, Ni, Zn, Fe, Mn, Cu, Cd, Pb and Li were determined to exceed the maximum permissible limits established by the different national and international regulations. It is at these points where the San Juan River receives the discharges of water contaminated with leachate from the mining tailings, as well as leachate from the sanitary landfill located in the upper part of the river in the community of Xochula, which could be contributing greatly to the increase in the concentration of pollutants.
The RSJMG S2.3 site exhibited high concentrations of PI and Fe, as well as elevated reddish dissolved solids. Analysis via a Scanning Electron Microscope and Fourier Transform Infrared Spectroscopy identified the mineral ferrihydrite, which could be attributed to the reduction in the Pollution Index due to the formation of metal complexes. This observation aligned with principal component analysis and Pearson’s correlation, indicating group correlations among Fe, Cu, Cd, and Pb, likely due to their affinity with ferrihydrite.
It was evidenced that most of the sites sampled a high Pollution Index, which suggests that the water of the Taxco Rivers is not suitable for human consumption or irrigation, due to the danger these elements pose to human health. For this reason, and in addition to identifying naturally generated ferrihydrite and its potential relationship with the reduction in Pollution Index, we recommend implementing remediation strategies. These strategies may include improving ferrihydrite generation to immobilize PTEs in water bodies, thereby facilitating reductions in the Pollution Index and Health Risk Assessment.

Author Contributions

Conceptualization, methodology, software, validation formal analysis, investigation, data curation, writing—original draft preparation, visualization, A.G.M.-M., A.K.I.F.-T. and R.R.-V.; writing—review and editing, A.G.M.-M., A.K.I.F.-T., R.R.-V., L.M.D.-R., B.A.P.-O. and F.M.; resources, supervision, project administration, funding acquisition, R.R.-V. All authors have read and agreed to the published version of the manuscript.

Funding

This research was funded by the Secretaría de Ciencia, Humanidades, Tecnología e Innovación (SECIHTI) under the project, “Ciencia Basica y de Frontera” (CBF2023-2024-4441), a doctoral scholarship awarded to A.G.M.M (No.998228), and a postdoctoral scholarship awarded to A.K.I.F.T. (No. 592589).

Data Availability Statement

The original contributions presented in this study are included in the article. Further inquiries can be directed to the corresponding author.

Acknowledgments

The authors are grateful for the technical support provided by Marcela Guerrero, particularly her support in the FT-IR analyses, and Ángel Guillen, from the Physics Department of Cinvestav, for his support in the SEM analyses. The authors also acknowledge LEC and Alan Gabriel García Pérez, Director of Ecology of the Municipality of Taxco, Guerrero, for his attention and willingness during the sampling of the study.

Conflicts of Interest

The authors declare that they have no known competing financial interests or personal relationships that could have appeared to influence the work reported in this paper.

References

  1. Zamora-Ledezma, C.; Negrete-Bolagay, D.; Figueroa, F.; Zamora-Ledezma, E.; Ni, M.; Alexis, F.; Guerrero, V.H. Heavy metal water pollution: A fresh look about hazards, novel and conventional remediation methods. Environ. Technol. Innov. 2021, 22, 101504. [Google Scholar] [CrossRef]
  2. Issac, M.N.; Kandasubramanian, B. Effect of microplastics in water and aquatic systems. Environ. Sci. Pollut. Res. 2021, 28, 19544–19562. [Google Scholar] [CrossRef] [PubMed]
  3. Hasan, M.K.; Shahriar, A.; Ullah Jim, K. Water pollution in Bangladesh and its impact on public health. Heliyon 2019, 5, e02145. [Google Scholar] [CrossRef] [PubMed]
  4. Tomaszewska, B.; Akkurt, G.G.; Kaczmarczyk, M.; Bujakowski, W.; Keles, N.; Jarma, Y.A.; Baba, A.; Bryjak, M.; Kabay, N. Utilization of renewable energy sources in desalination of geothermal water for agriculture. Desalination 2021, 513, 115151. [Google Scholar] [CrossRef]
  5. Sikiru, S.; Abiodun, O.J.A.; Sanusi, Y.K.; Sikiru, Y.A.; Soleimani, H.; Yekeen, N.; Haslija, A.B.A. A comprehensive review on nanotechnology application in wastewater treatment a case study of metal-based using green synthesis. J. Environ. Chem. Eng. 2022, 10, 108065. [Google Scholar] [CrossRef]
  6. Liu, F.; Nord, N.B.; Bester, K.; Vollertsen, J. Microplastics removal from treated wastewater by a biofilter. Water 2020, 12, 1085. [Google Scholar] [CrossRef]
  7. Hama Aziz, K.H.; Mustafa, F.S.; Omer, K.M.; Hama, S.; Hamarawf, R.F.; Rahman, K.O. Heavy metal pollution in the aquatic environment: Efficient and low-cost removal approaches to eliminate their toxicity: A review. RSC Adv. 2023, 13, 17595–17610. [Google Scholar] [CrossRef]
  8. Nnaji, N.D.; Onyeaka, H.; Miri, T.; Ugwa, C. Bioaccumulation for heavy metal removal: A review. SN Appl. Sci. 2023, 5, 125. [Google Scholar] [CrossRef]
  9. Jyoti, D.; Sinha, R.; Faggio, C. Advances in biological methods for the sequestration of heavy metals from water bodies: A review. Environ. Toxicol. Pharmacol. 2022, 94, 103927. [Google Scholar] [CrossRef]
  10. Zhang, X.; Barceló, D.; Clougherty, R.J.; Gao, B.; Harms, H.; Tefsen, B.; Vithanage, M.; Wang, H.; Wang, Z.; Wells, M. “Potentially toxic element”—Something that means everything means nothing. Environ. Sci. Technol. 2022, 56, 11922–11925. [Google Scholar] [CrossRef]
  11. Nieder, R.; Benbi, D.K. Potentially toxic elements in the environment—A review of sources, sinks, pathways and mitigation measures. Rev. Environ. Health 2023, 39, 561–575. [Google Scholar] [CrossRef]
  12. Calderón-Segura, M.E.; Ramírez-Guzmán, A.; Talavera-Mendoza, O.; Carbajal-López, Y.; Martínez-Valenzuela, M.C.; Mora-Herrera, M.E.; Salinas-Alcántara, L.; Hurtado-Brito, P. Genotoxic biomonitoring in children living near the El Fraile mine tailings in northern Guerrero State, Mexico. Toxics 2022, 10, 674. [Google Scholar] [CrossRef]
  13. Tovar-Sánchez, E.; Cervantes-Ramírez, T.; Castañeda-Bautista, J.; Gómez-Arroyo, S.; Ortiz-Hernández, L.; Sánchez-Salinas, E.; Mussali-Galante, P. Response of Zea mays to multimetal contaminated soils: A multibiomarker approach. Ecotoxicology 2018, 27, 1161–1177. [Google Scholar] [CrossRef]
  14. Landin-Sandoval, V.J.; Mendoza-Castillo, D.I.; Bonilla-Petriciolet, A.; Aguayo-Villarreal, I.A.; Reynel-Avila, H.E.; Gonzalez-Ponce, H.A. Valorization of agri-food industry wastes to prepare adsorbents for heavy metal removal from water. J. Environ. Chem. Eng. 2020, 8, 104067. [Google Scholar] [CrossRef]
  15. Morales, J.; Del Sol Hernández Bernal, M.; Rodríguez, N.P.; Goguitchaichvili, A. Magnetic susceptibility prospecting and Geochemical Characterization of Taxco’s Mining Waste Dam Guerrero I (Mexico). Quaternary 2023, 6, 40. [Google Scholar] [CrossRef]
  16. Castillo, S.; De la Rosa, J.D.; De la Campa, A.M.S.; González-Castanedo, Y.; Fernández-Caliani, J.C.; Gonzalez, I.; Romero, A. Contribution of mine wastes to atmospheric metal deposition in the surrounding area of an abandoned heavily polluted mining district (Rio Tinto mines, Spain). Sci. Total Environ. 2013, 449, 363–372. [Google Scholar] [CrossRef]
  17. Fetter, C.W.; Boving, T.; Kreamer, D. Contaminant Hydrogeology, 3rd ed.; Waveland Press, Inc.: Long Grove, IL, USA, 2018; Available online: https://books.google.com.mx/books?hl=es&lr=&id=ZXE8DwAAQBAJ&oi=fnd&pg=PR1&ots=RCSYdENYum&sig=FBwJ4hHgaKu53BL_zPGs13IWvBo&redir_esc=y#v=onepage&q&f=false (accessed on 15 June 2023).
  18. Liu, J.; Hou, K.; Tao, W.; Li, H.; He, D.; Ma, L.; Tang, H.; Wu, S.; Yang, K.; Li, X. A spatial distribution—Principal component analysis (SD-PCA) model to assess pollution of heavy metals in soil. Sci. Total Environ. 2023, 859, 160112. [Google Scholar] [CrossRef] [PubMed]
  19. Aparicio, E.M. The risks of mining pollution and its impact on children. Thinkazos 2009, 12, 83–101. Available online: http://www.scielo.org.bo/scielo.php?script=sci_arttext&pid=S1990-74512009000200005 (accessed on 3 April 2023).
  20. Saldaña-Villanueva, K.; Pérez-Vázquez, F.J.; Ávila-García, I.P.; Méndez-Rodríguez, K.B.; Carrizalez-Yáñez, L.; Gavilán-García, A.; Vargas-Morales, J.M.; Van-Brussel, E.; Diaz-Barriga, F. A preliminary study on health impacts of Mexican mercury mining workers in a context of precarious employment. J. Trace Elem. Med. Biol. 2022, 71, 126925. [Google Scholar] [CrossRef] [PubMed]
  21. Archundia, D.; Prado-Pano, B.; Molina-Freaner, F. Potentially toxic elements in soil–plant–water-animal continuum in a mining area from Northwestern Mexico: Animal exposure pathways and health risks for children. Environ. Geochem. Health 2024, 46, 99. [Google Scholar] [CrossRef]
  22. Gómez-Bernal, J.M.; Ruiz-Huerta, E.A.; Armienta-Hernández, M.A.; Luna-Pabello, V.M. Evaluation of the removal of heavy metals in a natural wetland impacted by mining activities in Mexico. Environ. Earth Sci. 2017, 76, 801. [Google Scholar] [CrossRef]
  23. Villa Gomez, D.; Sáez Salgado, E.; Mejías, O.; Pat-Espadas, A.M.; Pinedo Torres, L.A.; Jackson, L.; Parbhakar-Fox, A. Data integration of Critical Elements from mine waste in Mexico, Chile and Australia. Minerals 2022, 12, 122. [Google Scholar] [CrossRef]
  24. Méndez-Ramírez, M.; Armienta-Hernández, M.A. Distribución de Fe, Zn, Pb, Cu, Cd y As originada por residuos mineros y aguas residuales en un transecto del Río Taxco en Guerrero. Rev. Mex. Cienc. Geológicas 2012, 29, 450–462. [Google Scholar]
  25. Jones, M.M.; Runkel, R.L.; McKnight, D.M. To Remediate or not? source identification in an acid mine drainage stream, Warden Gulch, Colorado. Mine Water Environ. 2023, 42, 383–398. [Google Scholar] [CrossRef]
  26. Yi, X.; Liang, J.L.; Su, J.Q.; Jia, P.; Lu, J.L.; Zheng, J.; Wang, Z.; Feng, S.W.; Luo, Z.H.; Ai, H.X.; et al. Globally distributed mining-impacted environments are underexplored hotspots of multidrug resistance genes. ISME J. 2022, 16, 2099–2113. [Google Scholar] [CrossRef]
  27. He, X.; Yuhua, Z.; Qaidi, S.; Isleem, H.F.; Zaid, O.; Althoey, F.; Ahmad, J. Mine tailings-based geopolymers: A comprehensive review. Ceram. Int. 2022, 48, 24192–24212. [Google Scholar] [CrossRef]
  28. Sánchez-Montoya, G.; Talavera-Mendoza, O.; Hernández-Flores, G.; Díaz-Villaseñor, E.; Ramírez-Guzmán, A.H.; Galarza-Brito, Z. Potentially toxic elements determination and chemical-microbiological analysis of potable water in Taxco de Alarcón, Guerrero. Rev. Mex. Cienc. Geológicas 2019, 36, 147–158. [Google Scholar] [CrossRef]
  29. Quevedo-Castañon, N.M.; Talavera-Mendoza, O.; Ramírez-Guzmán, A.H.; Dótor-Almazán, A.; Chávez-González, J.D.; Sampedro-Rosas, M.L.; Rosas-Acevedo, J.L. Fraccionamiento geoquímico de elementos potencialmente tóxicos en los jales mineros del Depósito Guerrero I de Taxco de Alarcón, Guerrero, México. Tlamati 2019, 10, 5–21. [Google Scholar]
  30. Pi-Puig, T.; Solé, J.; Gómez Cruz, A. Mineralogical study and genetic model of efflorescent salts and crusts from two abandoned tailings in the Taxco Mining District, Guerrero (Mexico). Minerals 2020, 10, 871. [Google Scholar] [CrossRef]
  31. Dótor Almazán, A.; Armienta Hernández, M.A.; Árcega Cabrera, F.; Talavera Mendoza, O. Procesos de transporte de arsénico y metales en aguas superficiales del distrito minero de Taxco, México: Aplicación de isótopos estables. Hidrobiológica 2014, 24, 245–256. [Google Scholar]
  32. Espinoza, E.; Armienta, M.A. Mobility and fractionation of Fe, Pb and Zn in river sediments from a silver and base-metals mining area: Taxco, México. J. Environ. Sci. Health Part A 2007, 42, 1391–1401. [Google Scholar] [CrossRef]
  33. Wang, Y.; Ai, Y.; Zhou, J.; Xu, X.; Zhang, C.; Li, X.; Zhou, S. Effects of biochar on heavy metal speciation and microbial activity in red soil at a mining area. Int. J. Environ. Sci. Technol. 2023, 20, 13491–13502. [Google Scholar] [CrossRef]
  34. Singh, A.; Chauhan, S.; Varjani, S.; Pandey, A.; Bhargava, P.C. Integrated approaches to mitigate threats from emerging potentially toxic elements: A way forward for sustainable environmental management. Environ. Res. 2022, 209, 112844. [Google Scholar] [CrossRef]
  35. Pham, V.H.T.; Kim, J.; Chang, S.; Chung, W. Bacterial biosorbents, an efficient heavy metals green clean-up strategy: Prospects, Challenges, and Opportunities. Microorganisms 2022, 10, 610. [Google Scholar] [CrossRef]
  36. Morales-Mendoza, A.G.; Flores-Trujillo, A.K.I.; Ramírez-Castillo, J.A.; Gallardo-Hernández, S.; Rodríguez-Vázquez, R. Effect of micro-nanobubbles on arsenic removal by Trichoderma atroviride for bioscorodite generation. J. Fungi 2023, 9, 857. [Google Scholar] [CrossRef] [PubMed]
  37. Chen, Z.; Osman, A.I.; Rooney, D.W.; Oh, W.; Yap, P. Remediation of heavy metals in polluted water by immobilized algae: Current Applications and Future Perspectives. Sustainability 2023, 15, 5128. [Google Scholar] [CrossRef]
  38. Flores-Trujillo, A.K.I.; Morales-Mendoza, A.G.; Rodríguez-Vázquez, R. Behavior of a mixture of metals for competiting adsorption sites of untreated and alkali-treated rice husk. Processes 2024, 12, 1299. [Google Scholar] [CrossRef]
  39. Rafique, M.; Hajra, S.; Tahir, M.B.; Gillani, S.S.A.; Irshad, M. A review on sources of heavy metals, their toxicity and removal technique using physico-chemical processes from wastewater. Environ. Sci. Pollut. Res. 2022, 29, 16772–16781. [Google Scholar] [CrossRef]
  40. Zhao, W.; Gu, C.; Hong, Y.; Feng, X.; Zhu, M.; Wang, M.; Tan, W.; Wang, X. Fraction distribution of heavy metals and its relationship with iron in polluted farmland soils around distinct mining areas. Appl. Geochem. 2021, 130, 104969. [Google Scholar] [CrossRef]
  41. Engel, M.; Pacheco, J.S.L.; Noël, V.; Boye, K.; Fendorf, S. Organic compounds alter the preference and rates of heavy metal adsorption on ferrihydrite. Sci. Total Environ. 2021, 750, 141485. [Google Scholar] [CrossRef]
  42. ThomasArrigo, L.K.; Kaegi, R.; Kretzschmar, R. Ferrihydrite growth and transformation in the presence of ferrous iron and model organic ligands. Environ. Sci. Technol. 2019, 53, 13636–13647. [Google Scholar] [CrossRef]
  43. Scheinost, A.C.; Abend, S.; Pandya, K.I.; Sparks, D.L. Kinetic controls on Cu and Pb sorption by ferrihydrite. Environ. Sci. Technol. 2001, 35, 1090–1096. [Google Scholar] [CrossRef]
  44. Schulz, K.H.; ThomasArrigo, L.K.; Kaegi, R.; Kretzschmar, R. Stabilization of ferrihydrite and lepidocrocite by silicate during Fe(II)-catalyzed mineral transformation: Impact on Particle Morphology and Silicate Distribution. Sci. Technol. 2022, 56, 5929–5938. [Google Scholar] [CrossRef] [PubMed]
  45. Chen, M.; Xie, Z.; Yang, Y.; Gao, B.; Wang, J. Effects of calcium on arsenate adsorption and arsenate/iron bioreduction of ferrihydrite in stimulated groundwater. Int. J. Environ. Res. Public Health 2022, 19, 3465. [Google Scholar] [CrossRef] [PubMed]
  46. Shi, M.; Min, X.; Ke, Y.; Lin, Z.; Yang, Z.; Wang, S.; Peng, N.; Yan, X.; Luo, S.; Wu, J.; et al. Recent progress in understanding the mechanism of heavy metals retention by iron (oxyhydr) oxides. Sci. Total Environ. 2021, 752, 141930. [Google Scholar] [CrossRef] [PubMed]
  47. Mao, X.O.; Liu, H.; Chu, Z.; Chen, T.; Zou, X.; Chen, D.; Zhang, X.; Hu, J. Adsorption of lead by kaolinite, montmorillonite, goethite and ferrihydrite: Performance and mechanisms based on quantitative analysis. Clay Miner. 2022, 57, 230–240. [Google Scholar] [CrossRef]
  48. Tian, X.; Xie, Q.; Chai, G.; Li, G. Simultaneous adsorption of As(III) and Cd(II) by ferrihydrite-modified biochar in aqueous solution and their mutual effects. Sci. Rep. 2022, 12, 5918. [Google Scholar] [CrossRef]
  49. Zhang, W.; Li, Q.; Li, R.; Shen, N.; Li, J.; Shen, J.; Sun, X.; Han, W. Enhanced sequestration of chelated Cr (III) from aqueous by Al-containing ferrihydrite: New expectation of overall removal of various heavy metal complexes. Sep. Purif. Technol. 2022, 282, 120151. [Google Scholar] [CrossRef]
  50. Meng, K.; Wu, X.; Zhang, X.; Su, S.; Huang, Z.; Min, X.; Liu, Y.; Fang, M. Efficient adsorption of the Cd (II) and As (V) using novel adsorbent ferrihydrite/manganese dioxide composites. ACS Omega 2019, 4, 18627–18636. [Google Scholar] [CrossRef]
  51. Meng, S.; Wang, H.; Liu, H.; Yang, C.; Wei, Y.; Hou, D. Evaluation of the ability of ferrihydrite to bind heavy metal ions: Based on formation environment, adsorption reversibility and ageing. Appl. Geochem. 2014, 45, 114–119. [Google Scholar] [CrossRef]
  52. American Public Health Association (APHA). Standard Methods for the Examination of Water and Wastewater, 22nd ed.; Rice, E.W., Baird, R.B., Eaton, A.D., Clesceri, L.S., Eds.; American Water Works Association (AWWA) and Water Environment Federation (WEF): Washington, DC, USA, 2012. [Google Scholar]
  53. Kumar, V.; Sharma, A.; Kumar, R.; Bhardwaj, R.; Thukral, A.K.; Rodrigo-Comino, J. Assessment of heavy-metal pollution in three different Indian water bodies by combination of multivariate analysis and water pollution indices. Hum. Ecol. Risk Assess. 2018, 26, 1–16. [Google Scholar] [CrossRef]
  54. Moldovan, A.; Török, A.I.; Kovacs, E.; Cadar, O.; Mirea, I.C.; Micle, V. Metal contents and pollution indices assessment of surface water, soil, and sediment from the Arieș River Basin Mining Area, Romania. Sustainability 2022, 14, 8024. [Google Scholar] [CrossRef]
  55. Mohan, S.V.; Nithila, P.; Reddy, S.J. Estimation of heavy metals in drinking water and development of heavy metal pollution index. J. Environ. Sci. Health Part A Environ. Sci. Eng. Toxicol. 1996, 31, 283–289. [Google Scholar] [CrossRef]
  56. NOM-127-SSA1-2021; Agua para uUo y Consumo Humano. Límites Permisibles de la Calidad del Agua. Norma Oficial Mexicana. Secretaría de Salud (SSA): Mexico City, Mexico, 2021.
  57. Zakir, H.M.; Sharmin, S.; Akter, A.; Rahman, M.S. Assessment of health risk of heavy metals and water quality indices for irrigation and drinking suitability of waters: A case study of Jamalpur Sadar area, Bangladesh. Environ. Adv. 2020, 2, 100005. [Google Scholar] [CrossRef]
  58. Salcedo Sánchez, E.R.; Martínez, J.M.E.; Morales, M.M.; Talavera Mendoza, O.; Alberich, M.V.E. Ecological and health risk assessment of potential toxic elements from a mining area (water and sediments): The San Juan-Taxco River System, Guerrero, Mexico. Water 2022, 14, 518. [Google Scholar] [CrossRef]
  59. U.S. Environmental Protection Agency. Arsenic, Inorganic (CASRN 7440-38-2); Integrated Risk Information System (IRIS); U.S. Environmental Protection Agency: Washington, DC, USA, 1991. Available online: https://iris.epa.gov/ (accessed on 19 May 2025).
  60. Tashakor, M.; Modabberi, S. Human health risks associated with potentially harmful elements from urban soils of Hamedan City, Iran. Pollution 2021, 7, 709–722. [Google Scholar] [CrossRef]
  61. U.S. Environmental Protection Agency. Chromium VI (CASRN 18540-29-9); IRIS; U.S. Environmental Protection Agency: Washington, DC, USA, 2008. [Google Scholar]
  62. U.S. Environmental Protection Agency. Nickel, Soluble Salts (CASRN 7440-02-0); IRIS; U.S. Environmental Protection Agency: Washington, DC, USA, 1991. [Google Scholar]
  63. U.S. Environmental Protection Agency. Zinc (CASRN 7440-66-6); IRIS; U.S. Environmental Protection Agency: Washington, DC, USA, 2005. [Google Scholar]
  64. World Health Organization. Iron in Drinking-Water: Background Document for Development of WHO Guidelines for Drinking-Water Quality; WHO: Geneva, Switzerland, 2001; Available online: https://www.who.int/water_sanitation_health/dwq/chemicals/iron.pdf (accessed on 19 May 2025).
  65. U.S. Environmental Protection Agency. Manganese (CASRN 7439-96-5); IRIS; U.S. Environmental Protection Agency: Washington, DC, USA, 1996. [Google Scholar]
  66. Faiz, Y.; Siddique, N.; Tufail, M. Pollution level and health risk assessment of road dust from an expressway. J. Environ. Sci. Health Part A 2012, 47, 818–829. [Google Scholar] [CrossRef]
  67. U.S. Environmental Protection Agency. Copper (CASRN 7440-50-8); IRIS; U.S. Environmental Protection Agency: Washington, DC, USA, 1991. [Google Scholar]
  68. U.S. Environmental Protection Agency. Cadmium; IRIS; U.S. Environmental Protection Agency: Washington, DC, USA, 1994. [Google Scholar]
  69. U.S. Environmental Protection Agency. Integrated Science Assessment for Lead (EPA/600/R-10/075F); U.S. Environmental Protection Agency: Washington, DC, USA, 2012. [Google Scholar]
  70. U.S. Environmental Protection Agency. Selenium; IRIS; U.S. Environmental Protection Agency: Washington, DC, USA, 1991. [Google Scholar]
  71. U.S. Environmental Protection Agency. Selenium; IRIS; U.S. Environmental Protection Agency: Washington, DC, USA, 2008. [Google Scholar]
  72. Saleh, H.N.; Panahande, M.; Yousefi, M.; Asghari, F.B.; Oliveri Conti, G.; Talaee, E.; Mohammadi, A.A. Carcinogenic and non-carcinogenic risk assessment of heavy metals in groundwater wells in Neyshabur Plain, Iran. Biol. Trace Elem. Res. 2019, 190, 251–261. [Google Scholar] [CrossRef]
  73. U.S. Environmental Protection Agency (EPA). Toxicological Review of Inorganic arsenic (CAS No. 7440-38-2) in Support of Summary Information on the Integrated Risk Information System (IRIS); U.S. Environmental Protection Agency: Washington, DC, USA, 1998. Available online: https://iris.epa.gov/ChemicalLanding/&substance_nmbr=0278 (accessed on 19 May 2025).
  74. Office of Environmental Health Hazard Assessment (OEHHA). Public Health Goal for Cadmium in Drinking Water; California Environmental Protection Agency: Sacramento, CA, USA, 2001. Available online: https://oehha.ca.gov/water/chemicals/cadmium (accessed on 19 May 2025).
  75. Office of Environmental Health Hazard Assessment (OEHHA). Public Health Goal for Hexavalent Chromium in Drinking Water; California Environmental Protection Agency: Sacramento, CA, USA, 2001. Available online: https://oehha.ca.gov/water/chemicals/hexavalent-chromium-cr-vi (accessed on 19 May 2025).
  76. Aendo, P.; Netvichian, R.; Thiendedsakul, P.; Khaodhiar, S.; Tulayakul, P. Carcinogenic risk of Pb, Cd, Ni, and Cr and critical ecological risk of Cd and Cu in soil and groundwater around the municipal solid waste open dump in central Thailand. J. Environ. Public Health 2022, 1, 3062215. [Google Scholar] [CrossRef]
  77. Secretaría de Medio Ambiente y Recursos Naturales (SEMARNAT). Norma Oficial Mexicana, NOM-001-SEMARNAT-2021, Que Establece los Límites Permisibles de Contaminantes en las Descargas de Aguas Residuales en Cuerpos Receptores Propiedad de la Nación; Secretaría de Medio Ambiente y Recursos Naturales: Mexico City, Mexico, 2021. [Google Scholar]
  78. United States Environmental Protection Ambiental (USEPA). Water: Monitoring & Assessment. 2012. Available online: https://archive.epa.gov/water/archive/web/html/vms59.html (accessed on 19 May 2025).
  79. World Health Organization. Guidelines for Drinking-Water Quality, 4th ed.; WHO: Geneva, Switzerland, 2017; Available online: https://iris.who.int/bitstream/handle/10665/254637/9789241549950-eng.pdf?sequence=1 (accessed on 14 November 2024).
  80. Wei, Q.; Chen, J.; Zhang, Q.; Lu, T.; Farooq, U.; Chen, W.; Qi, Z. Insight into the effect of phosphate on ferrihydrite colloid-mediated transport of tetracycline in saturated porous media. Environ. Sci. Pollut. Res. 2022, 29, 80693–80704. [Google Scholar] [CrossRef]
  81. Wang, H.; Tsang, Y.F.; Wang, Y.; Sun, Y.; Zhang, D.; Pan, X. Adsorption capacities of poorly crystalline Fe minerals for antimonate and arsenate removal from water: Adsorption properties and effects of environmental and chemical conditions. Clean Technol. Environ. Policy 2018, 20, 2169–2179. [Google Scholar] [CrossRef]
  82. Colombo, C.; Palumbo, G.; Sellitto, V.M.; Rizzardo, C.; Tomasi, N.; Pinton, R.; Cesco, S. Characteristics of insoluble, high molecular weight iron-humic substances used as plant iron sources. Soil Sci. Soc. Am. J. 2012, 76, 1246–1256. [Google Scholar] [CrossRef]
  83. Jia, Y.; Xu, L.; Wang, X.; Demopoulos, G.P. Infrared spectroscopic and X-ray diffraction characterization of the nature of adsorbed arsenate on ferrihydrite. Geochim. Cosmochim. Acta 2007, 71, 1643–1654. [Google Scholar] [CrossRef]
  84. Li, Y.; Zhu, X.; Qi, X.; Shu, B.; Zhang, X.; Li, K.; Wei, Y.; Wang, H. Removal and immobilization of arsenic from copper smelting wastewater using copper slag by in situ encapsulation with silica gel. Chem. Eng. J. 2020, 394, 124833. [Google Scholar] [CrossRef]
  85. Qi, P.; Pichler, T. Competitive adsorption of As(III) and As(V) by ferrihydrite: Equilibrium, kinetics, and surface complexation. Water Air Soil Pollut. 2016, 227, 387. [Google Scholar] [CrossRef]
  86. Silvertstein, R.; Bassler, C.; Morrill, T. Spectrometric Identification of Organic Compounds, 4th ed.; Wiley: Hoboken, NJ, USA, 1980. [Google Scholar]
  87. Rong, Z.; Tang, X.; Wu, L.; Chen, X.; Dang, W. A novel method to synthesize scorodite using ferrihydrite and its role in removal and immobilization of arsenic. J. Mater. Res. Technol. 2020, 9, 5848–5857. [Google Scholar] [CrossRef]
  88. Cazacu, N.; Chilom, C.G.; Iftimie, S.; Bălășoiu, M.; Ladygina, V.P.; Stolyar, S.V.; Orelovich, O.L.; Kovalev, Y.S.; Rogachev, A.V. Biogenic ferrihydrite nanoparticles produced by Klebsiella oxytoca: Characterization, physicochemical properties and bovine serum albumin interactions. Nanomaterials 2022, 12, 249. [Google Scholar] [CrossRef]
  89. Ruiz-Huerta, E.A.; Armienta-Hernández, M.A.; Dubrovsky, J.G.; Gómez-Bernal, J.M. Bioaccumulation of heavy metals and As in maize (Zea mays L.) grown close to mine tailings strongly impacts plant development. Ecotoxicology 2022, 31, 447–467. [Google Scholar] [CrossRef]
  90. Rashmi, I.; Roy, T.; Kartika, K.S.; Pal, R.; Coumar, V.; Kala, S.; Shinoji, K.C. Organic and Inorganic Fertilizer Contaminants in Agriculture: Impact on Soil and Water Resources; Springer: Cham, Switzerland, 2020; pp. 3–41. [Google Scholar] [CrossRef]
  91. Mahmood, Q.; Asif, M.; Shaheen, S.; Hayat, M.T.; Ali, S. Cadmium Contamination in Water and Soil. In Cadmium Toxicity and Tolerance in Plants; Academic Press: Cambridge, MA, USA, 2019; pp. 141–161. [Google Scholar] [CrossRef]
  92. United States Environmental Protection Ambiental (USEPA). National Primary Drinking Water Regulations; USEPA: Washington, DC, USA, 2024. Available online: https://www.epa.gov/ground-water-and-drinking-water/national-primary-drinking-water-regulations (accessed on 14 November 2024).
  93. USGS. Mineral Commodity Summaries, Lithium. 2022. Available online: https://pubs.usgs.gov/periodicals/mcs2022/mcs2022-lithium.pdf (accessed on 10 October 2024).
  94. Tanveer, M.; Hasanuzzaman, M.; Wang, L. Lithium in environment and potential targets to reduce lithium toxicity in plants. J. Plant Growth Regul. 2019, 38, 1574–1586. [Google Scholar] [CrossRef]
  95. Shakoor, N.; Adeel, M.; Azeem, I.; Ahmad, M.A.; Zain, M.; Abbas, A.; Hussain, M.; Jiang, Y.; Zhou, P.; Li, Y.; et al. Interplay of higher plants with lithium pollution: Global trends, meta-analysis, and perspectives. Chemosphere 2023, 310, 136663. [Google Scholar] [CrossRef]
  96. Xu, Z.; Peng, S.; Pei, L.; Zhou, K.; Wang, X. Integrated analysis of pollution characteristic and ecotoxicological effect reveals the fate of lithium in soil-plant systems: A Challenge to global sustainability. Environ. Sci. Technol. 2024, 58, 15755–15765. [Google Scholar] [CrossRef] [PubMed]
  97. Kim, H.; Harrison, F.E.; Aschner, M.; Bowman, A.B. Exposing the role of metals in neurological disorders: A focus on manganese. Trends Mol. Med. 2022, 28, 555–568. [Google Scholar] [CrossRef] [PubMed]
  98. Dey, S.; Tripathy, B.; Kumar, M.S.; Das, A.P. Ecotoxicological consequences of manganese mining pollutants and their biological remediation. Environ. Chem. Ecotoxicol. 2023, 5, 55–61. [Google Scholar] [CrossRef]
  99. Lindner, S.; Lucchini, R.; Broberg, K. Genetics and epigenetics of manganese toxicity. Curr. Environ. Health Rep. 2022, 9, 697–713. [Google Scholar] [CrossRef]
  100. Das, S.; Mishra, S.; Sahu, H. A review of activated carbon to counteract the effect of iron toxicity on the environment. Environ. Chem. Ecotoxicol. 2023, 5, 55–61. [Google Scholar] [CrossRef]
  101. Li, J.; Liu, Y.; Zuo, R.; Teng, Y.; Ai, Y.; Yang, J. Influences of dissolved humic acid on Zn bioavailability and its consequences for thyroid toxicity. Ecotoxicol. Environ. Saf. 2018, 166, 132–137. [Google Scholar] [CrossRef]
  102. Fu, Z.; Xi, S. The effects of heavy metals on human metabolism. Toxicol. Mech. Methods 2019, 30, 167–176. [Google Scholar] [CrossRef]
  103. Mitra, S.; Chakraborty, A.J.; Tareq, A.M.; Emran, T.B.; Nainu, F.; Khusro, A.; Idris, A.M.; Khandaker, M.U.; Osman, H.; Alhumaydhi, F.A.; et al. Impact of heavy metals on the environment and human health: Novel therapeutic insights to counter the toxicity. J. King Saud Univ. Sci./Maǧallaẗ Ǧāmiʹaẗ Al-Malik Saʹūd. Al-ʹUlūm 2022, 34, 101865. [Google Scholar] [CrossRef]
  104. Ahmad, W.; Alharthy, R.D.; Zubair, M.; Ahmed, M.; Hameed, A.; Rafique, S. Toxic and heavy metals contamination assessment in soil and water to evaluate human health risk. Sci. Rep. 2021, 11, 17006. [Google Scholar] [CrossRef]
  105. Gupta, S.; Gupta, S.K. Application of Monte Carlo simulation for carcinogenic and non-carcinogenic risks assessment through multi-exposure pathways of heavy metals of river water and sediment, India. Environ. Geochem. Health 2023, 45, 3465–3486. [Google Scholar] [CrossRef]
  106. Briffa, J.; Sinagra, E.; Blundell, R. Heavy metal pollution in the environment and their toxicological effects on humans. Heliyon 2020, 6, e04691. [Google Scholar] [CrossRef]
  107. Cai, K.; Yu, Y.; Zhang, M.; Kim, K. Concentration, source, and total health risks of cadmium in multiple media in densely populated areas, China. Int. J. Environ. Res. Public Health 2019, 16, 2269. [Google Scholar] [CrossRef]
  108. Kaur, R.; Garkal, A.; Sarode, L.; Bangar, P.; Mehta, T.; Singh, D.P.; Rawal, R. Understanding arsenic toxicity: Implications for environmental exposure and human health. J. Hazard. Mater. Lett. 2023, 5, 100090. [Google Scholar] [CrossRef]
  109. Hossini, H.; Shafie, B.; Niri, A.D.; Nazari, M.; Esfahlan, A.J.; Ahmadpour, M.; Nazmara, Z.; Ahmadimanesh, M.; Makhdoumi, P.; Mirzaei, N.; et al. A comprehensive review on human health effects of chromium: Insights on induced toxicity. Environ. Sci. Pollut. Res. 2022, 29, 70686–70705. [Google Scholar] [CrossRef] [PubMed]
  110. Iyer, M.; Anand, U.; Thiruvenkataswamy, S.; Babu, H.W.S.; Narayanasamy, A.; Prajapati, V.K.; Tiwari, C.K.; Gopalakrishnan, A.V.; Bontempi, E.; Sonne, C.; et al. A review of chromium (Cr) epigenetic toxicity and health hazards. Sci. Total Environ. 2023, 882, 163483. [Google Scholar] [CrossRef] [PubMed]
  111. Pirzaman, A.T.; Ebrahimi, P.; Niknezhad, S.; Vahidi, T.; Hosseinzadeh, D.; Akrami, S.; Ashrafi, A.M.; Velayatimehr, M.M.; Hosseinzadeh, R.; Kazemi, S. Toxic mechanisms of cadmium and exposure as a risk factor for oral and gastrointestinal carcinomas. Hum. Exp. Toxicol. 2023, 42, 9603271231210262. [Google Scholar] [CrossRef] [PubMed]
  112. Genchi, G.; Sinicropi, M.S.; Lauria, G.; Carocci, A.; Catalano, A. The Effects of Cadmium Toxicity. Int. J. Environ. Res. Public Health 2020, 17, 3782. [Google Scholar] [CrossRef]
  113. Iwasaki, M.; Itoh, H.; Sawada, N.; Tsugane, S. Exposure to environmental chemicals and cancer risk: Epidemiological evidence from Japanese studies. Genes Environ. 2023, 45, 10. [Google Scholar] [CrossRef]
  114. Meng, D.; Nabi, F.; Kama, R.; Li, S.; Wang, W.; Guo, Y.; Li, Z.M.; Li, H. The interaction between ferrihydrite and arsenic: A review of environmental behavior, mechanism and applied in remediation. J. Hazard. Mater. Adv. 2024, 13, 100398. [Google Scholar] [CrossRef]
  115. Jambor, J.L.; Dutrizac, J.E. Occurrence and constitution of natural and synthetic ferrihydrite, a widespread iron oxyhydroxide. Chem. Rev. 1998, 98, 2549–2586. [Google Scholar] [CrossRef]
  116. Tripathi, P.; Singh, P.C.; Mishra, A.; Chauhan, P.S.; Dwivedi, S.; Bais, R.T.; Tripathi, R.D. Trichoderma: A potential bioremediator for environmental clean up. Clean Technol. Environ. Policy 2013, 15, 541–550. [Google Scholar] [CrossRef]
  117. Srivastava, P.K.; Vaish, A.; Dwivedi, S.; Chakrabarty, D.; Singh, N.; Tripathi, R.D. Biological removal of arsenic pollution by soil fungi. Sci. Total Environ. 2011, 409, 2430–2442. [Google Scholar] [CrossRef] [PubMed]
  118. Granchinho, S.C.R.; Franz, C.M.; Polishchuk, E.; Cullen, W.R.; Reimer, K.J. Transformation of arsenic(V) by the fungus Fusarium oxysporum melonis isolated from the alga Fucus gardneri. Appl. Organomet. Chem. 2002, 16, 721–726. [Google Scholar] [CrossRef]
  119. Zhang, Q.; Qin, Z.; Xiahou, J.; Li, Y.; Yan, Y.; Feng, X.; Li, W.; Lan, S. Effects and mechanisms of Al substitution on the catalytic ability of ferrihydrite for Mn(II) oxidation and the subsequent oxidation and immobilization of coexisting Cr(III). J. Hazard. Mater. 2023, 452, 131351. [Google Scholar] [CrossRef] [PubMed]
  120. Li, L.; Yang, Z.; Yang, W.; Jiang, W.; Liao, Q.; Si, M.; Zhao, F. Ferrihydrite transformation impacted by coprecipitation of lignin: Inhibition or facilitation? J. Environ. Sci. 2024, 139, 23–33. [Google Scholar] [CrossRef] [PubMed]
  121. Zhu, M.; Frandsen, C.; Wallace, A.F.; Legg, B.A.; Khalid, S.; Zhang, H.; Mørup, S.; Banfield, J.F.; Waychunas, G.A. Precipitation pathways for ferrihydrite formation in acidic solutions. Geochim. Cosmochim. Acta 2016, 172, 247–264. [Google Scholar] [CrossRef]
  122. Wang, X.; Zhu, M.; Lan, S.; Ginder-Vogel, M.; Fan, L.; Feng, X. Formation and secondary mineralization of ferrihydrite in the presence of silicate and Mn(II). Chem. Geol. 2015, 415, 37–46. [Google Scholar] [CrossRef]
  123. Weatherill, J.S.; Morris, K.; Bots, P.; Stawski, T.M.; Janssen, A.; Abrahamsen, L.; Blackham, R.; Shaw, S. Ferrihydrite formation: The Role of Fe13 Keggin Clusters. Environ. Sci. Technol. 2016, 50, 9333–9342. [Google Scholar] [CrossRef]
  124. Michel, F.M.; Ehm, L.; Antao, S.M.; Lee, P.L.; Chupas, P.J.; Liu, G.; Strongin, D.R.; Schoonen, M.A.A.; Phillips, B.L.; Parise, J.B. The structure of ferrihydrite, a nanocrystalline material. Science 2007, 316, 1726–1729. [Google Scholar] [CrossRef]
  125. Zhang, T.; Zeng, X.; Zhang, H.; Lin, Q.; Su, S.; Wang, Y.; Bai, L.; Wu, C. The effect of the ferrihydrite dissolution/transformation process on mobility of arsenic in soils: Investigated by coupling a two-step sequential extraction with the diffusive gradient in the thin films (DGT) technique. Geoderma 2019, 352, 22–32. [Google Scholar] [CrossRef]
  126. Rancourt, D.; Fortin, D.; Pichler, T.; Thibault, P.; Lamarche, G.; Morris, R.V.; Mercier, P.H.J. Mineralogy of a natural As-rich hydrous ferric oxide coprecipitate formed by mixing of hydrothermal fluid and seawater: Implications regarding surface complexation and color banding in ferrihydrite deposits. Am. Mineral. 2001, 86, 834–851. [Google Scholar] [CrossRef]
  127. Tian, L.; Yao, L.; Lu, Y.; Peng, L.; Wu, P.; Shi, Z. Pb(II) and Cu(II) Adsorption and desorption kinetics on ferrihydrite with different morphologies. Soil Sci. Soc. Am. J. 2018, 82, 96–105. [Google Scholar] [CrossRef]
  128. Yao, L.; Tian, L.; Lu, Y.; Peng, L.; Wang, P.; Lin, J.; Cheng, T.; Dang, Z.; Shi, Z. Kinetics of Cd(ii) adsorption and desorption on ferrihydrite: Experiments and modeling. Environmental Science. Process. Impacts 2018, 20, 934–942. [Google Scholar] [CrossRef]
  129. Karapınar, N. Removal of heavy metal ions by ferrihydrite: An opportunity to the treatment of acid mine drainage. Water Air Soil Pollut. 2016, 227, 193. [Google Scholar] [CrossRef]
  130. Liu, J.; Zhu, R.; Xu, T.; Xu, Y.; Ge, F.; Xi, Y.; Zhu, J.; He, H. Co-adsorption of phosphate and zinc(II) on the surface of ferrihydrite. Chemosphere 2016, 144, 1148–1155. [Google Scholar] [CrossRef]
  131. Vala, A.K. Tolerance and removal of arsenic by a facultative marine fungus Aspergillus candidus. Bioresour. Technol. 2010, 101, 2565–2567. [Google Scholar] [CrossRef]
  132. Gao, X.; Root, R.A.; Farrell, J.; Ela, W.P.; Chorove, J. Effect of silicic acid on arsenate and arsenite retention mechanisms on 6-L ferrihydrite: A spectroscopic and batch adsorption approach. Appl. Geochem. 2013, 38, 110–120. [Google Scholar] [CrossRef]
Figure 1. Sampling was conducted in the water bodies of Taxco de Alarcón municipality, Guerrero. Taxco River (RT S1.1, S1.2, S1.3); San Juan River with leachate from the “La Guadalupana” mine and the sanitary fill (RSJMG S2.1, S2.2, S2.3); San Juan River (RSJ S3.1. S3.2) and Acamixtla River (ACA S4.1, S4.2, S4.3).
Water 17 02167 g001
Figure 2. Map illustrating the flow patterns of the municipality’s rivers affected by mining leachate. San Juan and Taxco Rivers (a); RSJMG and RT sites (b). The contour lines indicate elevation in meters above sea level.
Water 17 02167 g002
Figure 3. Analysis of the principal components of Potentially Toxic Elements. Vectors and sampling sites represent the ratio of PTEs determined in Taxco, Guerrero.
Water 17 02167 g003
Figure 4. Pearson’s correlation analysis of quantified elements of water samples from the municipality of Taxco, Guerrero. Notes: Values close to 1 represent high correlation, while values far from 0 represent low or no correlation between the evaluated parameters (p < 0.05). The colors represent the correlation coefficients, which increase from purple (negative) to yellow (positive).
Water 17 02167 g004
Figure 5. Chronic Daily Intake (CDI) oral ingestion values according to the data collected: (a) CDI for adults, (b) CDI for children. CDI values greater than 1 represent a significant danger.
Water 17 02167 g005
Figure 6. Chronic Daily Intake (CDI) dermal absorption values according to the data collected: (a) CDI for adults, (b) CDI for children. CDI values greater than 1 represent a significant danger.
Water 17 02167 g006
Figure 7. Carcinogenic risk index of Cd, Cr and As by ingestion of polluted water: (a) for adults and (b) children. If the value of carcinogenic risk index exceeds 1 × 10⁻⁴, this represents a carcinogenic risk to the human body for life.
Water 17 02167 g007
Figure 8. Site monitoring: (a) San Juan River with leachate from the “La Guadalupana” Mine (Point RSJMG S2.3), (b) sediment from the site, (c) characterization via Fourier Transform Infrared Spectroscopy and (d) a Scanning Electron Microscope from Point RSJMG S2.3.
Water 17 02167 g008
Figure 9. Monophase model of ferrihydrite (Fe5(OH)8·4H2O3) made using VESTA program Version 4.6.0; file 9011571 from Crystallography Open Database [124].
Water 17 02167 g009
Figure 10. Monophasic model of As–ferrihydrite. The formation of a metal complex occurs through the formation of robust surface complexes with its hydroxyl group. Modified by Gao et al. (2013) [132].
Water 17 02167 g010
Table 2. Parameters and values for Chronic Daily Intake.
ParameterAsigned Value
AdultsChildren
EC = Concentration of the element in water (mg/L)
IR = Ingestion rate (L/day)2.50.78
FE = Frequency of exposure (day/year)350350
ED = Total duration of exposure (years)306
BW = Average weight (kg)5215
AT = Average Exposure Time (Days)10,9502190
SA = Skin contact surface area (cm2)57002800
AF = Skin adhesion factor0.070.07
ABDSd = Dermal Adsorption Factor0.030.03
ET = Exposure time (hour/day)0.580.58
CF = Conversion factor (kg/mg)0.010.01
Table 3. Value reference dose (ingestion and dermal).
ElementReference Dose (RfD) (mg/Kg·Day)
IngestionDermal
As0.0003 [59]0.000123 [60]
Cr0.003 [61]0.000006 [60]
Ni0.02 [62]0.00540 [60]
Zn0.3 [63]0.06 [60]
Fe0.7 [64]0.14 [58]
Mn0.14 [65]0.00184 [66]
Cu0.04 [67]0.0120 [60]
Cd0.0005 [68]0.00001 [60]
Pb0.0035 [69]0.000525 [60]
Se0.005 [70]0.005 [71]
Table 4. Physicochemical parameters obtained in the different in situ sampling sites of the water of Taxco de Alarcón, Guerrero.
SampleTemperature
(°C)
Electrical Conductivity
(μS/cm)
pH
RT S1.123.216407.90
RT S1.223.713307.84
RT S1.321.97108.15
RSJMG S2.125.820107.83
RSJMG S2.225.820107.83
RSJMG S2.325.820107.83
RSJ S3.121.18807.88
RSJ S3.224.37507.34
ACA S4.123.210107.52
ACA S4.223.410707.52
ACA S4.324.38807.52
Note: The results obtained were compared to Mexican standards NOM-127-SSA1-2021 [56] and NOM-001-SEMARNAT-2021 [77].
Table 5. Concentrations of elements at different sampling points in the municipality of Taxco de Alarcón, Guerrero.
SampleElement (mg/L)
AsCrNiZnFeMnCuCdPbSeLi
RT S1.1<L.D
± 0.00
<L.D
± 0.00
0.011
± 0.004
3.396
± 0.132
6.158
± 0.263
1.394
± 0.038
0.026
± 0.002
0.023
± 0.0005
0.002
± 0.00
0.008
± 0.014
0.041
± 0.001
RT S1.20.012
± 0.008
<L.D
± 0.00
0.008
± 0.002
3.216
± 0.025
5.940
± 0.104
1.279
± 0.012
0.021
± 0.001
0.024
± 0.00
0.006
± 0.001
0.014
± 0.013
0.039
± 0.00
RT S1.30.010
± 0.011
<L.D
± 0.00
0.007
± 0.001
0.220
± 0.009
0.326
± 0.036
0.199
± 0.005
0.015
± 0.008
0.005
± 0.00
0.001
± 0.002
0.018
± 0.015
0.015
± 0.00
RSJMG S2.10.008
±0.008
<L.D
± 0.00
0.008
± 0.005
7.651
± 0.026
14.500
± 0.302
2.712
± 0.011
0.045
± 0.003
0.052
± 0.005
0.006
± 0.002
<L.D
± 0.00
0.080
± 0.005
RSJMG S2.20.007
± 0.008
0.001
± 0.001
0.008
± 0.001
7.448
± 0.565
14.190
± 0.930
2.658
± 0.093
0.040
± 0.002
0.052
± 0.001
0.006
± 0.002
<L.D
± 0.00
0.080
± 0.002
RSJMG S2.30.114
± 0.003
0.012
± 0.002
0.024
± 0.002
103.547
± 6.840
178.667
± 10.351
5.097
± 0.283
0.724
± 0.035
0.697
± 0.043
0.242
0.026
<L.D
± 0.00
0.087
± 0.003
RSJ S3.10.009
± 0.006
<L.D
± 0.00
0.002
± 0.001
0.253
± 0.010
0.584
± 0.688
0.008
± 0.003
0.003
± 0.001
0.008
± 0.005
0.005
± 0.004
0.029
±0.025
0.029
± 0.00
RSJ S3.20.006
± 0.007
<L.D
± 0.00
0.002
± 0.002
0.049
± 0.008
0.236
± 0.268
0.002
± 0.001
0.001
± 0.001
0.001
± 0.00
0.002
± 0.001
0.009
± 0.008
0.007
± 0.00
ACA S4.10.001
± 0.002
0.003
± 0.002
0.004
± 0.001
0.161
± 0.027
0.721
± 0.267
0.030
± 0.001
0.017
± 0.005
0.001
± 0.0005
0.002
± 0.005
0.005
± 0.010
0.013
± 0.00
ACA S4.20.011
± 0.002
0.001
± 0.002
0.004
± 0.002
0.071
± 0.058
1.409
± 0.498
0.037
± 0.009
0.006
± 0.003
0.001
± 0.001
0.001
± 0.004
0.022
± 0.004
0.012
± 0.001
ACA S4.30.003
± 0.007
0.002
± 0.003
0.003
± 0.003
0.145
± 0.024
0.453
± 1.24
0.037
± 0.004
0.020
± 0.002
0.001
± 0.0005
0.001
± 0.001
0.011
± 0.015
0.0130
± 0.00
NOM 127 a0.0100.0500.070-0.3000.1502.0000.0030.0100.04-
WHO b0.0100.0500.070--0.08020.0030.010.04-
USEPA c0.0100.1000.10050.3000.051.3000.0050.0150.05-
NOM-001 d0.4001.5004.00020--60.4000.400--
Notes: Maximum permissible limit value established in the Official Mexican Norm NOM-127-SSA1-2021 a [56], World Health Organization b [79], United Stated Environmental Protection Agency c [78], and Norma Official Mexicana NOM-001-SEMARNAT-2021 d [77]. Bold indicates values higher than the maximum permissible limits. The <LD indicates values lower than the detection limit. The standard deviation is indicated as ±.
Table 6. Pollution Index by sampling site.
SamplePollution IndexLevel of Contamination
RSJMG S2.38491.56H
RSJMG S2.1635.60H
RSJMG S2.2626.66H
RT S1.2301.45H
RT S1.1282.27H
RSJ S3.1104.37H
RT S1.363.52H
ACA S4.225.99M
ACA S4.120.07M
ACA S4.317.92M
RSJ S3.215.74M
Note: Letters were determined from the Pollution Index, where values are classified as low (<15); medium (15–30) and high (>30).
Table 7. Risk Quotient for ingestion of each element in water samples from Taxco, Guerrero.
OralDermal
ElementHQ AverageMaxMinHQ
Average
MaxMin
Adults
As2.51517.4670.0000.00050.0030.000
Cr0.0460.1890.0200.00020.00078.1 × 10−5
Ni0.0170.0560.0045.0 × 10−61.6 × 10−51.3 × 10−6
Zn1.76215.9120.0080.00070.0062.9 × 10−6
Fe1.33611.7670.0160.00050.0046.1 × 10−6
Mn0.4031.6790.00050.00240.0103.3 × 10−6
Cu0.0960.8340.0012.5 × 10−50.00023.0 × 10−7
Cd7.25964.2340.0920.02880.2540.0003
Pb0.3253.1830.0040.00020.0012.3 × 10−6
Se0.0970.2640.0007.7 × 10−62.0 × 10−50.000
Children
As2.72018.8930.0000.00080.0050.000
Cr0.0500.2050.0270.00030.0010.0001
Ni0.0190.0610.0058.5 × 10−62.8 × 10−52.3 × 10−6
Zn1.90617.2100.0080.0010.0105.0 × 10−6
Fe1.44512.7270.0170.00090.0081.0 × 10−5
Mn0.4361.8150.00050.0040.0175.6 × 10−6
Cu0.1040.9020.0044.3 × 10−50.00045.1 × 10−7
Cd7.85169.4760.1000.0490.4330.0006
Pb0.0353.4420.0040.00020.0033.9 × 10−6
Se0.1050.2860.0471.3 × 10−53.5 × 10−50.000
Note: Values greater than 1 represent a significant risk via oral or dermal ingestion.
Table 8. Hazard Index for each element in water samples from Taxco, Guerrero.
Element
SampleAsCrNiZnFeMnCuCdPbSeHI
Adults
RT S1.10.0000.0260.0250.5220.4060.4620.0302.1600.0260.0773.733
RT S1.21.7930.0260.0190.4940.3910.4240.0242.2220.0750.1265.594
RT S1.31.5880.0310.0170.0340.0220.0660.0170.4630.0180.1632.418
RSJMG S2.11.2300.1900.0181.1760.9550.8980.0514.8440.0750.0009.438
RSJMG S2.21.0250.0210.0181.1450.9350.8810.0464.7830.0750.0008.928
RSJMG S2.317.4710.0260.05615.91811.7711.6890.83564.4893.1850.000115.440
RSJ S3.11.3320.0260.0050.0390.0380.0030.0040.7710.0620.2642.543
RSJ S3.20.9730.0260.0050.0080.0160.0010.0010.0930.0090.0861.216
ACA S4.10.4100.0260.0080.0220.0300.0120.0230.1230.0040.1050.763
ACA S4.20.2050.0620.0090.0250.0480.0100.0190.0930.0310.0430.544
ACA S4.31.6390.0570.0100.0110.0930.0120.0070.1230.0130.2062.171
Children
RT S1.10.0000.0280.0270.5650.4390.5010.0322.3410.0290.0834.044
RT S1.21.9400.0280.0210.5350.4230.4600.0262.4080.0810.1366.058
RT S1.31.7180.0330.0180.0370.0230.0720.0180.5020.0190.1762.617
RSJMG S2.11.3300.2060.0191.2721.0340.9750.0565.2520.0810.00010.225
RSJMG S2.21.1080.0220.0201.2391.0110.9560.0505.1850.0810.0009.672
RSJMG S2.318.8980.0280.06117.22112.7351.8330.90369.9103.4460.000125.034
RSJ S3.11.4410.0280.0050.0420.0420.0030.0040.8360.0670.2862.753
RSJ S3.21.0530.0280.0050.0080.0170.0010.0010.1000.0100.0931.316
ACA S4.10.4430.0280.0080.0240.0320.0130.0250.1340.0050.1130.826
ACA S4.20.2220.0670.0100.0270.0510.0110.0210.1000.0330.0470.589
ACA S4.31.7730.0610.0110.0120.1000.0130.0070.1340.0140.2232.349
Notes: The Hazard Index (HI) represents the cumulative non-carcinogenic risk, encompassing the summation of hazard quotients for both ingestion and dermal absorption. HI value < 1 indicates a low risk, while values >1 indicate a high risk in terms of long-term health risk assessment.
Disclaimer/Publisher’s Note: The statements, opinions and data contained in all publications are solely those of the individual author(s) and contributor(s) and not of MDPI and/or the editor(s). MDPI and/or the editor(s) disclaim responsibility for any injury to people or property resulting from any ideas, methods, instructions or products referred to in the content.

