Abstract
This study evaluates the human health risks associated with exposure to arsenic in groundwater from a semi-arid region of Mexico, focusing on concentration levels and their temporal variation. Arsenic concentrations were analyzed using ordinary kriging for spatial interpolation, along with descriptive and inferential statistical methods. Human health risk was assessed through the following two key indicators: the Hazard Quotient (HQ), which estimates non-carcinogenic risk by comparing exposure levels to reference doses and carcinogenic risk (CR), which represents the estimated lifetime probability of developing cancer due to arsenic exposure. The mean arsenic concentration across both study years was 0.0200 mg/L, with median values of 0.0151 mg/L in 2015 and 0.0200 mg/L in 2020. The average HQ was 2.13 in 2015 and 2.17 in 2020, both exceeding the safety threshold of one. Mean CR values were 0.00096 and 0.00097 for 2015 and 2020, respectively, with a consistent median of 0.00072 across both years. A t-test was applied to compare the distributions between years. Both HQ and CR values significantly exceeded the recommended safety limits (p < 0.05), indicating that groundwater in the study area poses a potential carcinogenic and non-carcinogenic health risk. These findings underscore the urgent need for water quality monitoring and the implementation of mitigation measures to safeguard public health in the region.
1. Introduction
Water is a primordial resource for the subsistence of living beings; for this reason, it is essential to maintain an adequate water quality in all the activities that human beings carry out [1,2,3,4].
There are several chemicals that can reach the water and affect its quality. In semi-arid regions, the main source of this resource is the aquifers, and as a natural consequence, different compounds reach these aquifers and alter their composition. One of the main elements that dissolves geogenically in groundwater is arsenic, which has been deposited for years by volcanic ash in the subsoil [4,5,6,7,8,9].
The mobility and speciation of arsenic in groundwater depend on many factors and are therefore highly variable. These factors include pH, the presence of iron oxides, and microbial activity, among others. Arsenic can be found in different aqueous species, such as arsenate (As V) and arsenite (As III), and these come from both natural processes (weathering, biological activity, and volcanic emissions) and human activities (mining, use of pesticides, and fossil fuels) [9,10,11,12,13]. Arsenite (As3+) is generally more toxic and mobile under reducing conditions, while arsenate (As5+) predominates in oxidizing environments and tends to be less bioavailable. Understanding the speciation of arsenic is essential, as it directly influences its transport in groundwater, its interaction with minerals and organic matter, and its potential health effects. Therefore, distinguishing between these valence states is crucial for accurate risk assessment and the development of effective water treatment strategies [14,15,16]. Because of all these processes, it is essential to constantly monitor and analyze the behavior of arsenic, and also other toxic compounds, as well as their interactions with each other in groundwater.
We used ordinary kriging, which is a geostatistical interpolation method to estimate the spatial distribution of a variable based on measured data at known locations. This method is particularly valuable in environmental studies like some recent [8], where sampling is limited, but accurate spatial estimation is essential for risk assessment and decision-making.
Arsenic is extremely toxic to humans, even in relatively low concentrations. Because of this, organizations such as the WHO (World Health Organization) and the USEPA (United States Environmental Protection Agency) have established strict limits for its content in drinking water, and countries have specific regulations for this purpose. Its greatest threat to public health lies in the consumption of contaminated water for drinking, food preparation, and irrigation of food crops. The USEPA has classified arsenic as a Group A carcinogen, which means it is a known human carcinogen [12,17,18,19,20].
Among the main health effects caused by this element are various types of cancer (skin, lung, bladder, and kidney), skin lesions (including the appearance of spots, ulcers, and skin changes), cardiovascular diseases, diabetes, and cognitive development issues when exposed at an early age [21,22,23,24,25].
The USEPA has established the HQ index, a tool used to evaluate the risk of exposure to contaminants in groundwater. This index evaluates that when HQ is less than 1, the risk is considered low; if it is equal or greater than 1, measures are required to reduce exposure to the contaminant. This is a crucial tool for assessing groundwater safety and taking preventive measures when necessary [22,23,24,26,27,28,29].
This research aimed to analyze the risk to human health related to exposure to concentration and temporal variation of arsenic in groundwater from a semiarid region of Mexico.
2. Materials and Methods
2.1. Study Area
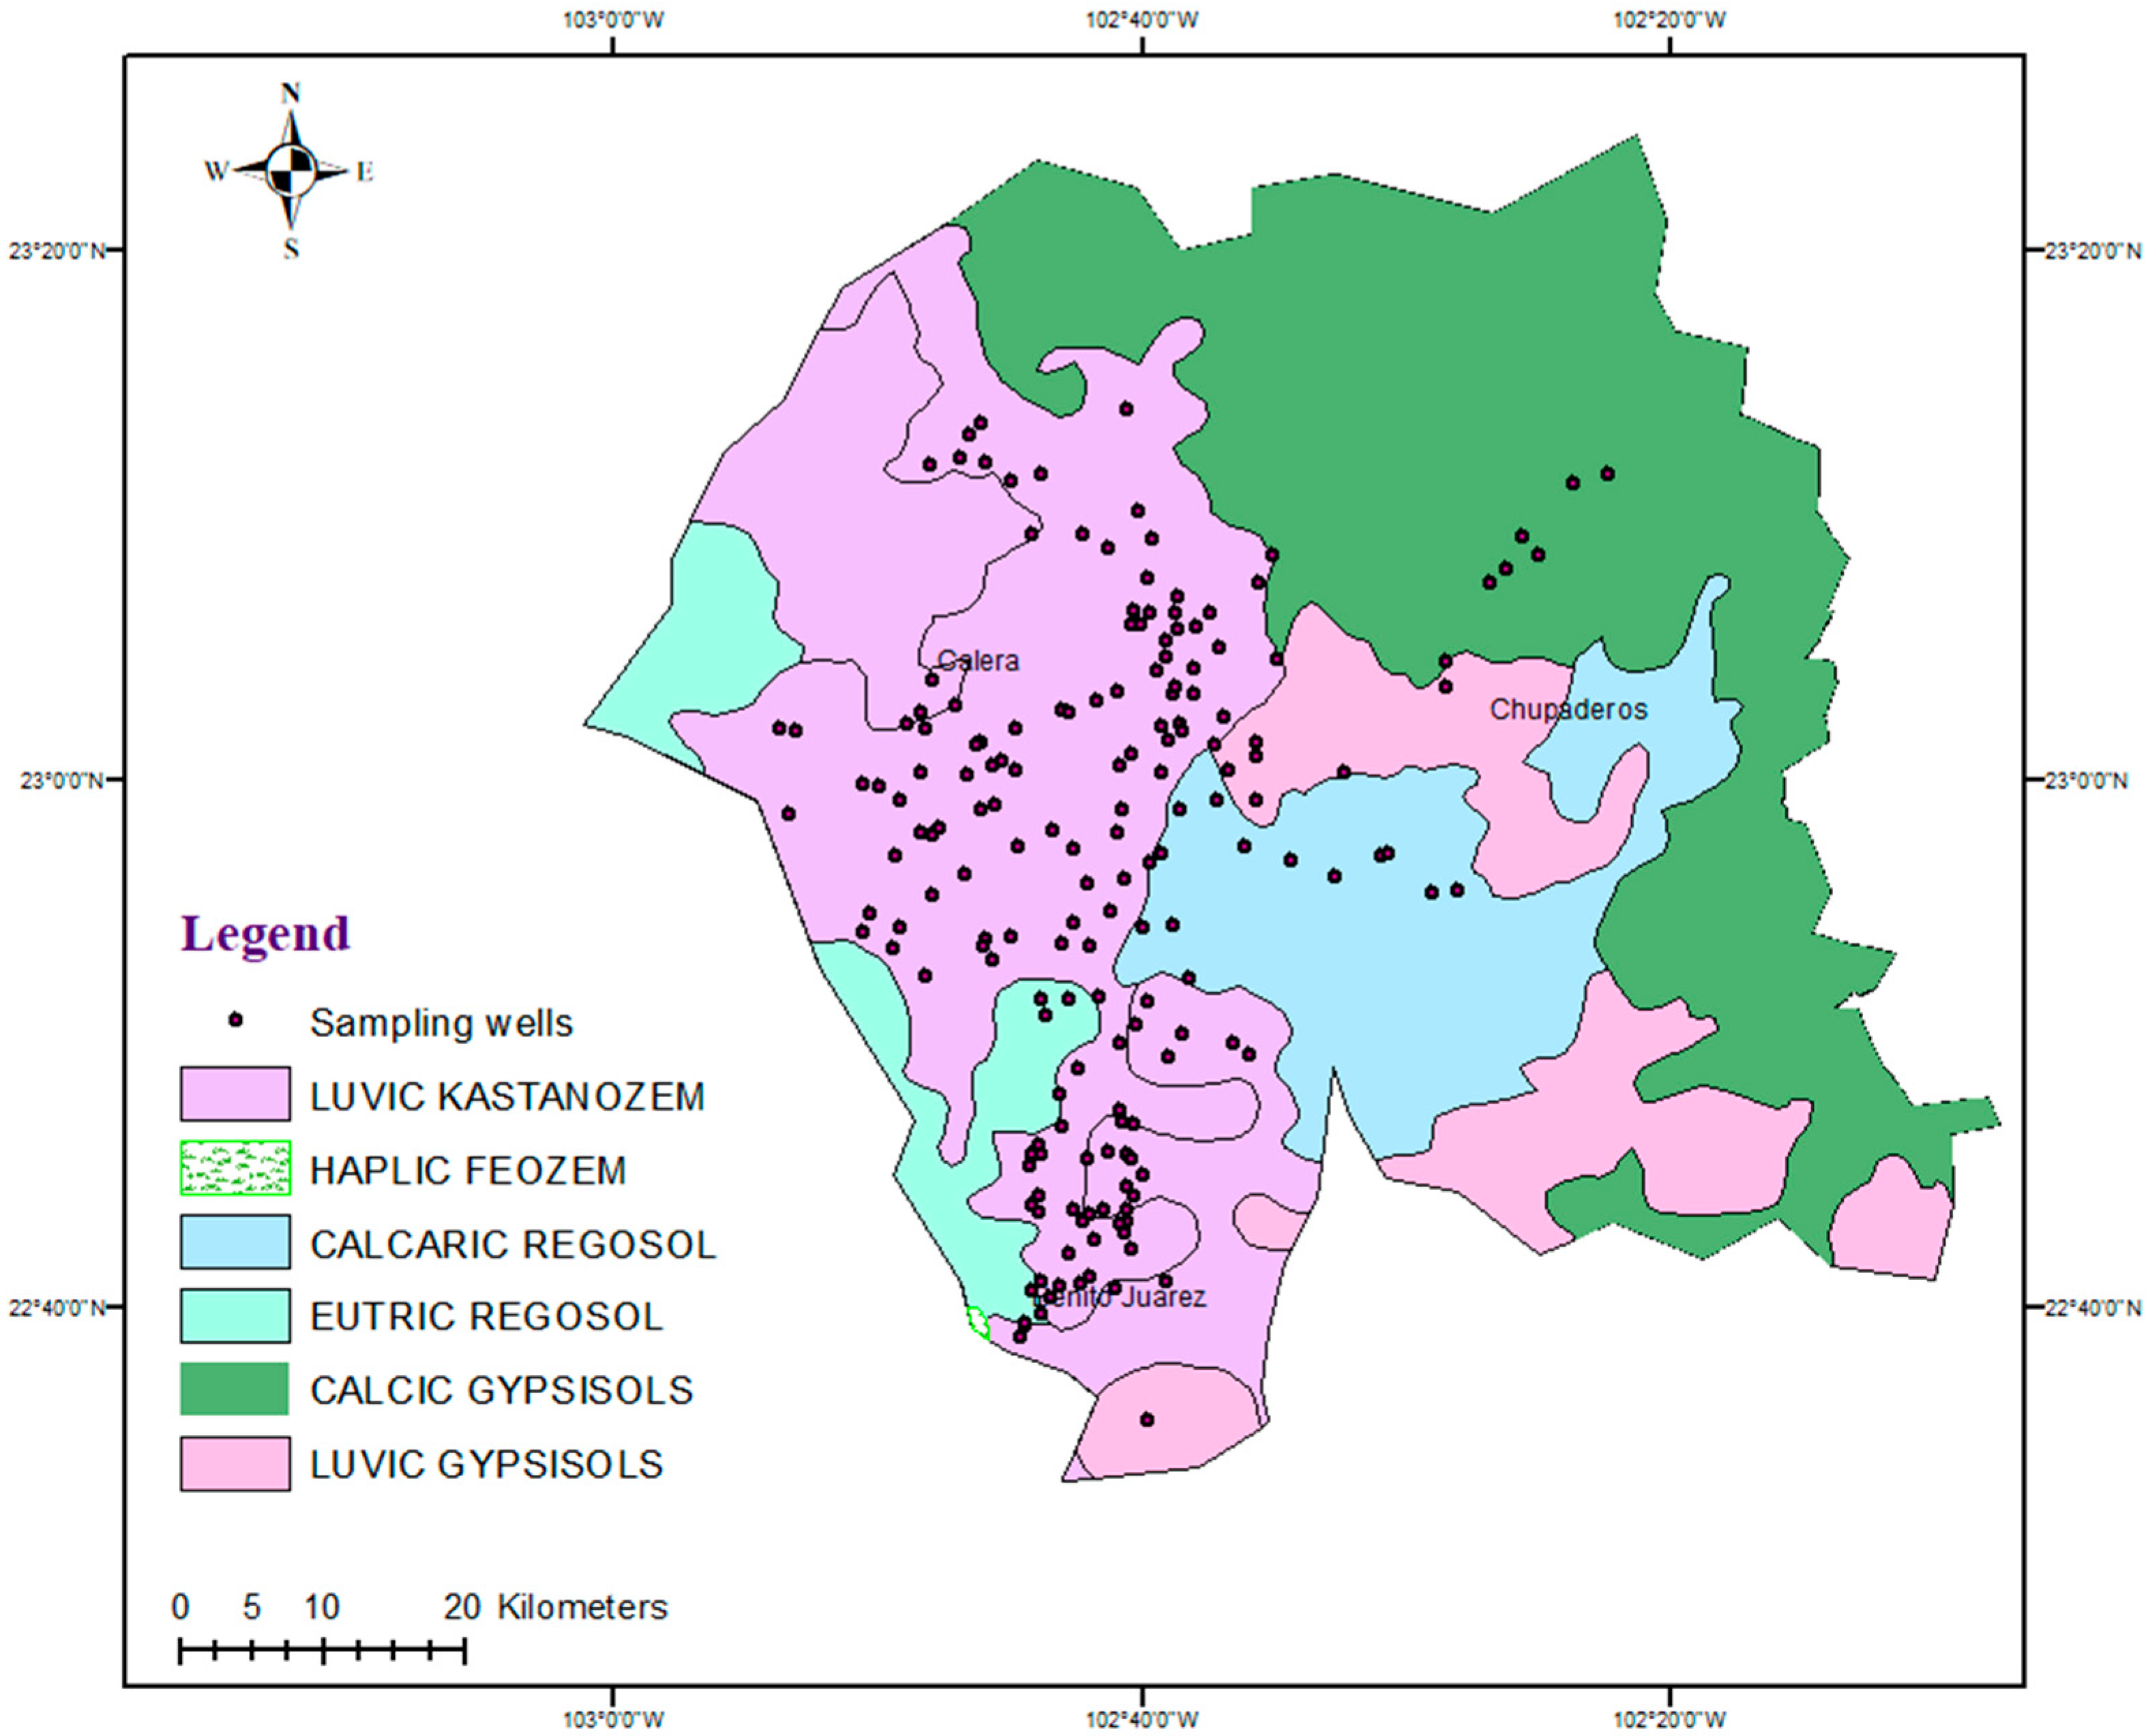
The study area is located in the volcanic terrain of the Mexican Sierra Madre Occidental and is called Zacatecas, which has a maximum altitude of 2700 m above sea level. Gypsisol soils predominate, and in the semi-arid areas, Litosol and Regosol soils are characteristic, with depths that vary between 10 and 200 cm. The climate is arid, with rainfall ranging between 100 and 600 mm (Figure 1). The Zacatecas-Guadalupe conurbation, with a population of approximately 500,000 inhabitants, has an important agricultural area mainly with garlic, chili, and onion crops. The water needed for the different sectors (industrial, agricultural, livestock, and urban) comes from the aquifers in this area, so we are interested in monitoring water quality to determine the health risk to the underlying populations [30,31,32].
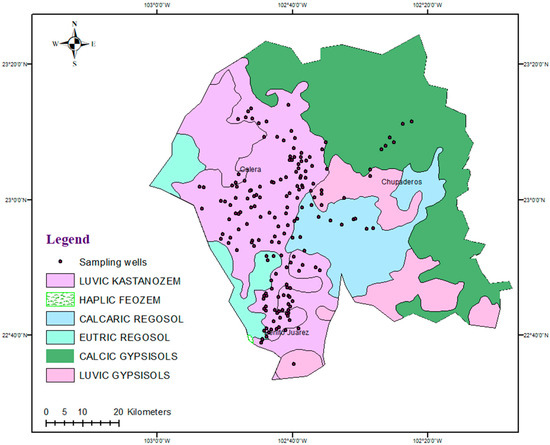
Figure 1.
Edaphology of the study site.
The National Water Commission (CONAGUA) defines 653 groundwater management units (called administrative aquifers (AAs)) throughout the country. Of these, 34 AAs were established in the state of Zacatecas. These regions are characterized by water scarcity, with a very irregular rainfall distribution and some torrential events [32].
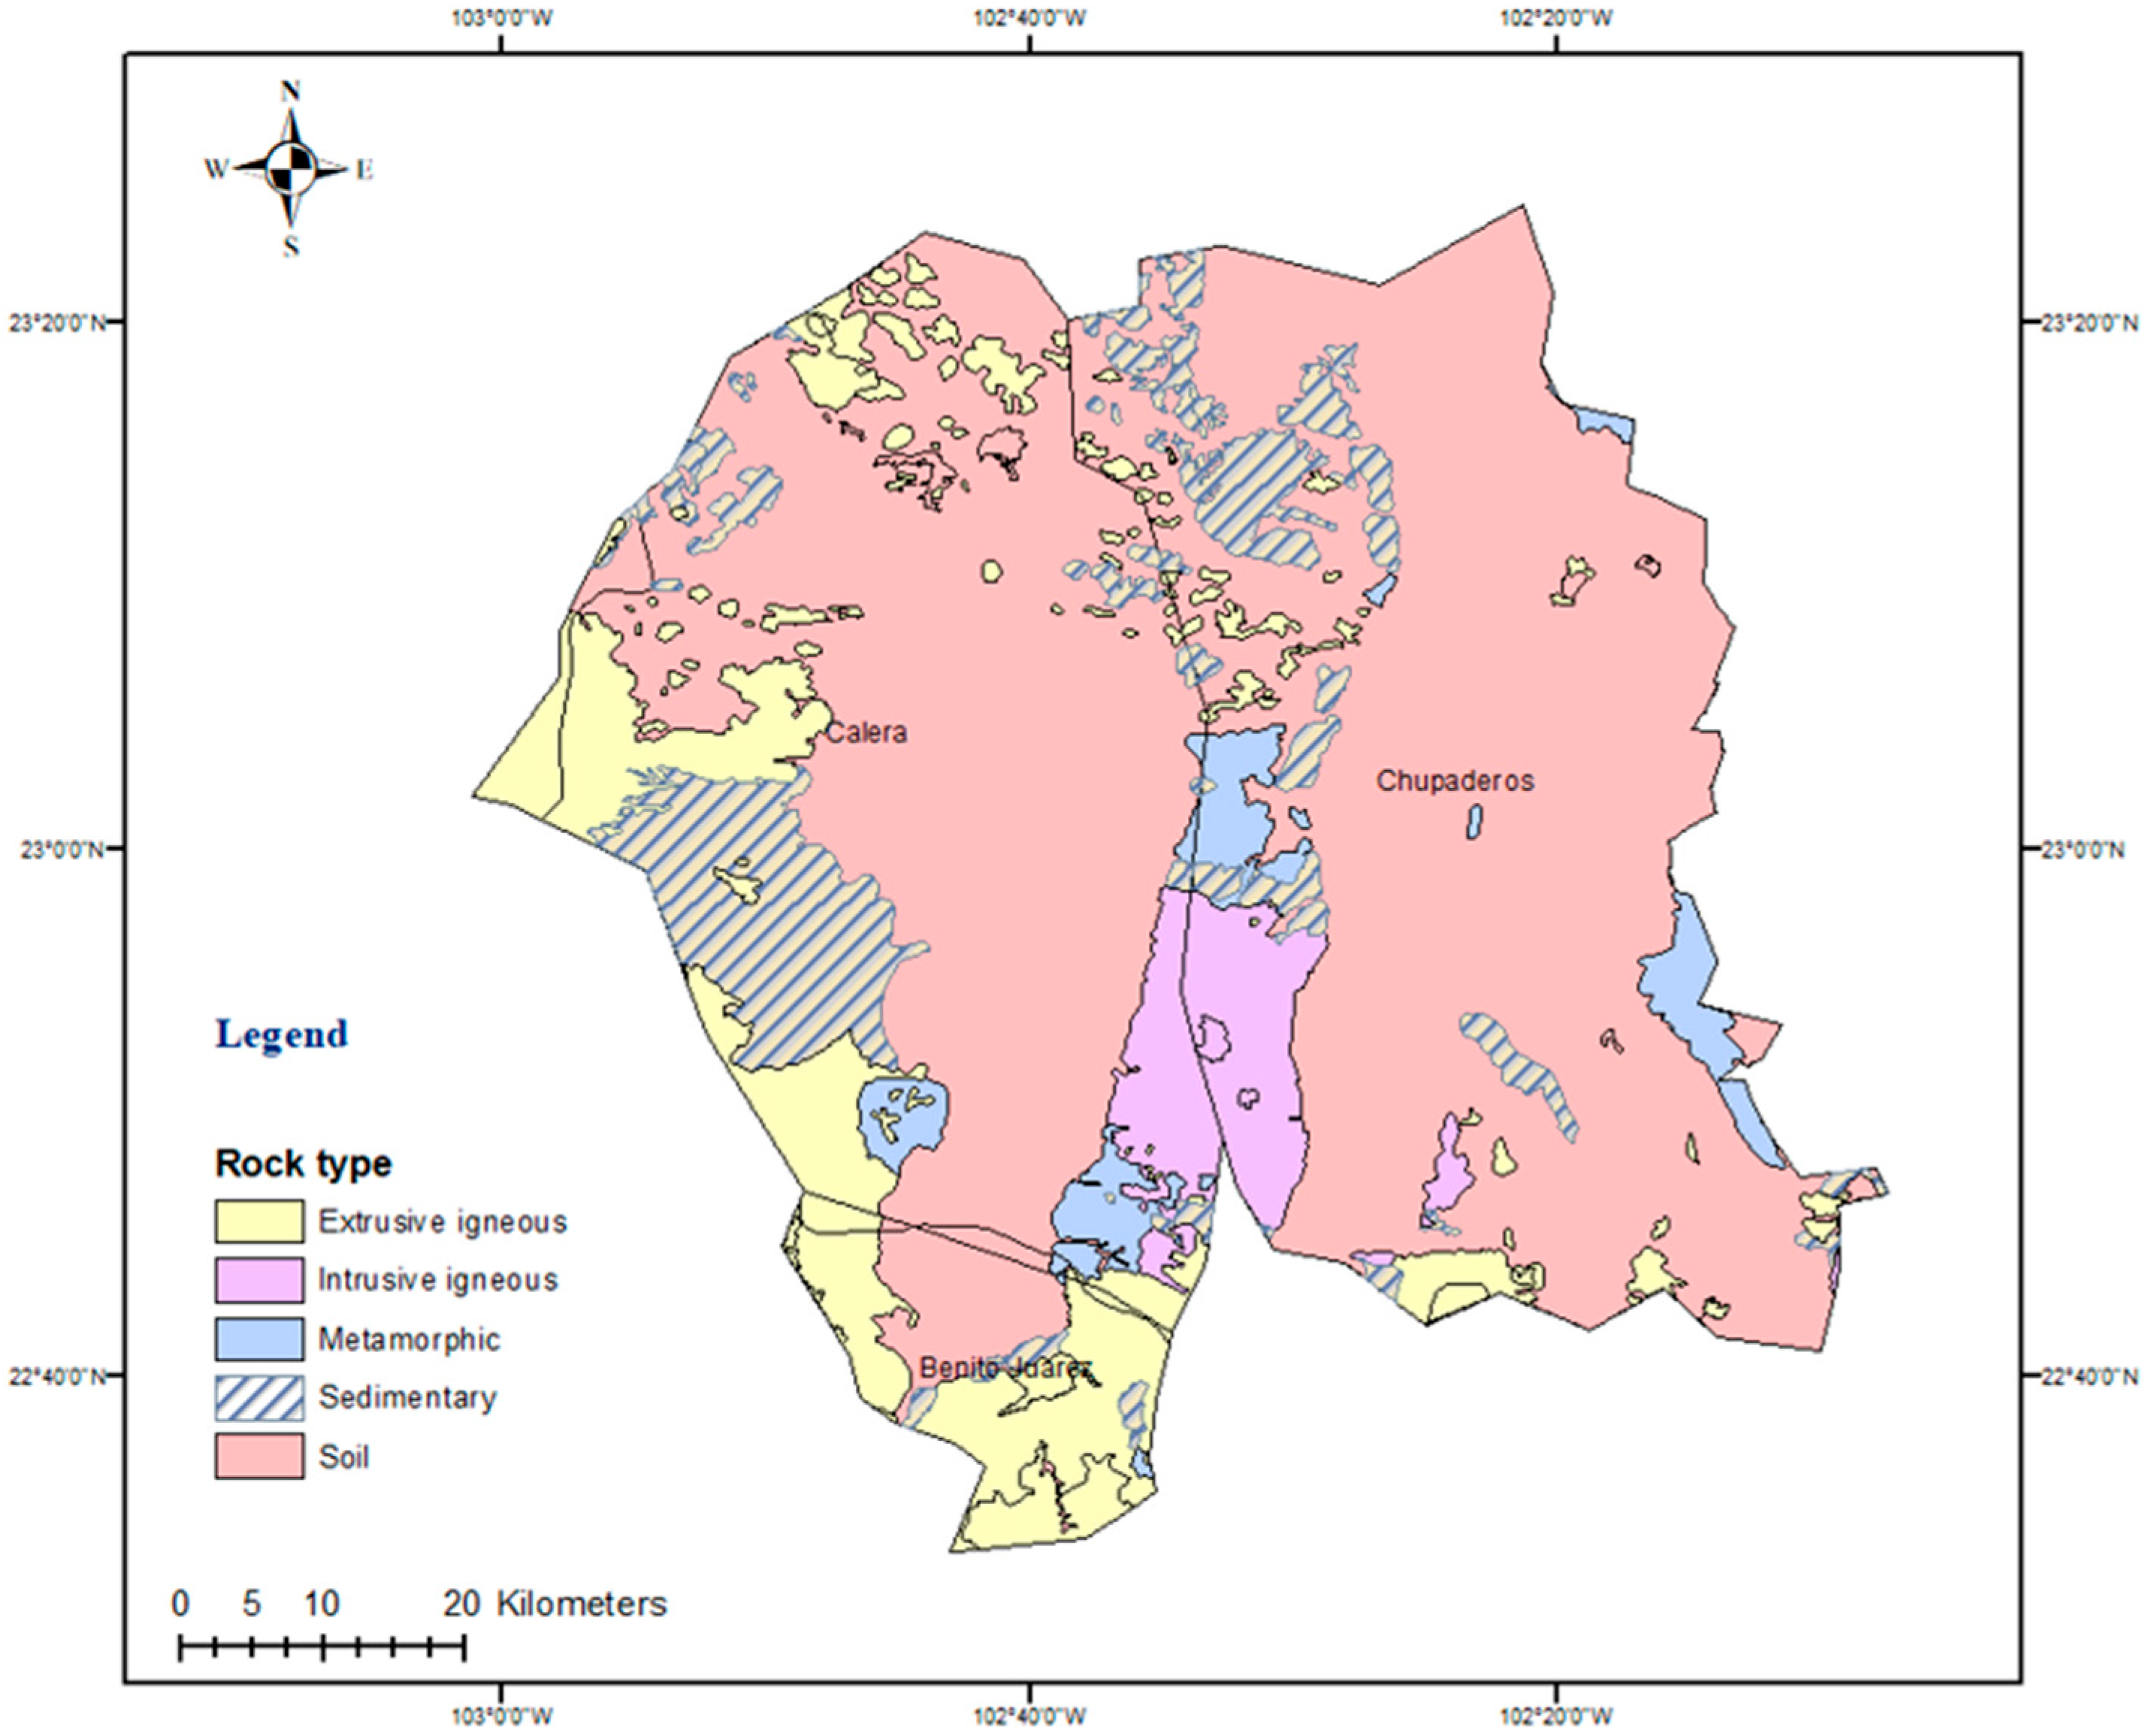
The aquifers considered in this research were those of Calera, Chupaderos, and Benito Juárez (Figure 2). They are located in the central part of Zacatecas, this state is located between parallels 22°47′ and 23°42′ north latitude and between meridians 102°39′ and 103°01′ west longitude, covering an approximate area of 5060 km2 [32].
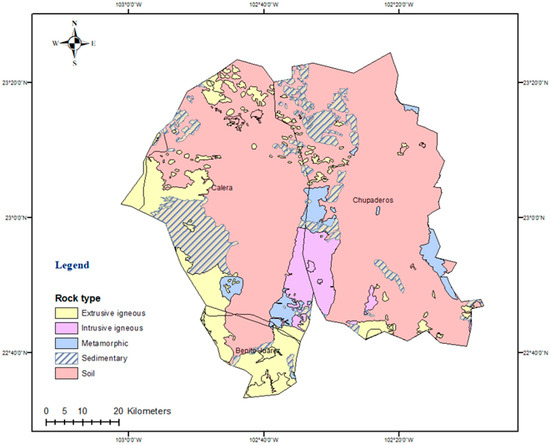
Figure 2.
Geology of the study site.
2.2. Sample Collection and Concentration Determination
For this research, 182 groundwater samples were taken in 2015 and 2020. The ideal would be to monitor all existing wells; however, this requires economic resources, and in underdeveloped countries, it is sometimes not possible to access them. For this reason, monitoring networks are created and allow us to study the state of the region and to establish this network.
Samples were acidified to pH < 2 with ultrapure nitric acid (HNO3) immediately after collection and stored at 4 °C until analysis. Before measurement, all samples were filtered using 0.45 µm membrane filters to remove suspended solids. No pre-concentration or chemical oxidation steps were employed, as our objective was to measure total dissolved inorganic arsenic.
In the field, electrical conductivity (EC), total dissolved solids (TDS), hydrogen potential (pH), and dissolved oxygen were measured. An isolation cell was used to prevent atmospheric interaction and achieve stability. An alkalinity test was performed with a HACH®® brand titration device (Hach Company, Loveland, CO, USA), which includes cartridges with H2SO4 at a normal concentration of 0.16 N. Concentrations of CO22− and HCO3− ions were obtained by equilibrium point determination with phenolphthalein and bromophenol blue indicators.
Analytical determinations of arsenic were performed at the Hydrogeochemistry Laboratory of the Universidad Autónoma de Zacatecas, and samples were analyzed by atomic absorption spectrophotometry (Thermo Scientific ICE AA 3300, Waltham, MA, USA) with hydride generation. The detection limit (LOD) and quantification limit (LOQ) for arsenic were 0.4 µg/L and 1.5 µg/L, respectively. This method, particularly when coupled with hydride generation, is sensitive and widely used for measuring total arsenic in water. However, AAS does not allow arsenic speciation—that is, it cannot differentiate between arsenite (As3+ or As III) and arsenate (As5+ or As V), the two most common oxidation states of arsenic in natural waters. This is an important limitation because As III is generally more toxic and more mobile in groundwater than As V. Speciation provides valuable insight into arsenic toxicity, behavior, and environmental fate, which is critical for risk assessment and remediation planning. Since AAS measures only the combined total concentration of As III and As V, the study’s findings must be interpreted accordingly. This limitation should be clearly acknowledged in the manuscript to ensure transparency and guide future research. The concentrations of the major ions Ca2+, Na+, K+, and Mg2+ were evaluated using the same equipment. Chloride was determined by titration using AgNO3 and K2CrO4 indicators. Calibrations for atomic absorption spectrophotometry and automated colorimetry were performed using an appropriate dilution standard. Additional control included ion balance below ±7%.
Arsenic determination was performed by the Mexican standard NOM-117-SSA1-1994, which outlines the method for the analysis of toxic metals in drinking water, including arsenic, using with hydride generation. This protocol is recognized by Mexican regulatory agencies and aligns with procedures established for public health monitoring.
2.3. Mapping of Parameters
Concentrations of arsenic were analyzed with ordinary Kriging (ArcMap 10.1, Esri’s ArcGIS, Redlands, CA, USA). This geostatistical method estimates the surface from a set of scattered points with z-values. It uses a mathematical function to some points within a specified radius and determines the output value for each location. Kriging is a multistep process, consisting of the following: exploratory statistical analysis of data, variogram modeling, surface creation, and variance surface exploration.
2.4. Human Health Risk Assessment
2.4.1. Non-Carcinogenic Risk
The non-carcinogenic risk for arsenic was calculated using HQ:
where ADD is the average daily dose, and RFD is the reference dose (µg Kg−1 day−1). HQ is unitless, and the value 1 indicates potential non-carcinogenic health risks due to overexposure [16,17,29,33,34,35,36,37].
2.4.2. Carcinogenic Risk (CR)
The CR is unit-less and defined as the increasing probability of developing cancer for an individual during a lifetime of exposure to carcinogens, which can be calculated by the US Environment Protection Agency [4,17,24].
The Cancer Slope Factor (CSF) for ingestion of inorganic arsenic in water is 1.5 per mg/kg/day, according to the USEPA. This value is used to estimate the CR associated with exposure to a specific level of arsenic concentration of As. As advised by USEPA, the exceedance of the CR value of 1 in 10,000 may lead to possible health hazards.
2.5. Statistical Data
Data processing was carried out using Microsoft Excel®® (commercial license) and R Studio®® (GPL license, 2023.06.1+524 “Mountain Hydrangea“) software, in order to calculate the indices, as well as to design graphs and diagrams.
The study of the data was performed with a descriptive statistical analysis using histograms, density graphs, measures of central tendency, and inferential tests to explore the normality of the variables. A t-test was applied to compare the mean of the data distribution, the non-parametric test applied was the Wilcoxon test, and the non-parametric Kruskal–Wallis test was applied to compare medians.
3. Results
The present study analyzed the human health risk related to the exposure of arsenic concentrations and its temporal variation in groundwater of a semi-arid region in Mexico.
Previous studies throughout history have shown that in several areas of the country, mainly arid regions in the north, arsenic in groundwater is elevated. However, there is a lack of information about its mobilization, its consequences, and the health risk that this problem causes. For this reason, we have considered it important to study the spatial and temporal variation in the health risk. We based the analysis on the Mexican standard limit (25 µg/L) suggested and the WHO (10 µg/L) in terms of arsenic. The graphs and analysis are shown below.
3.1. Arsenic Concentrations
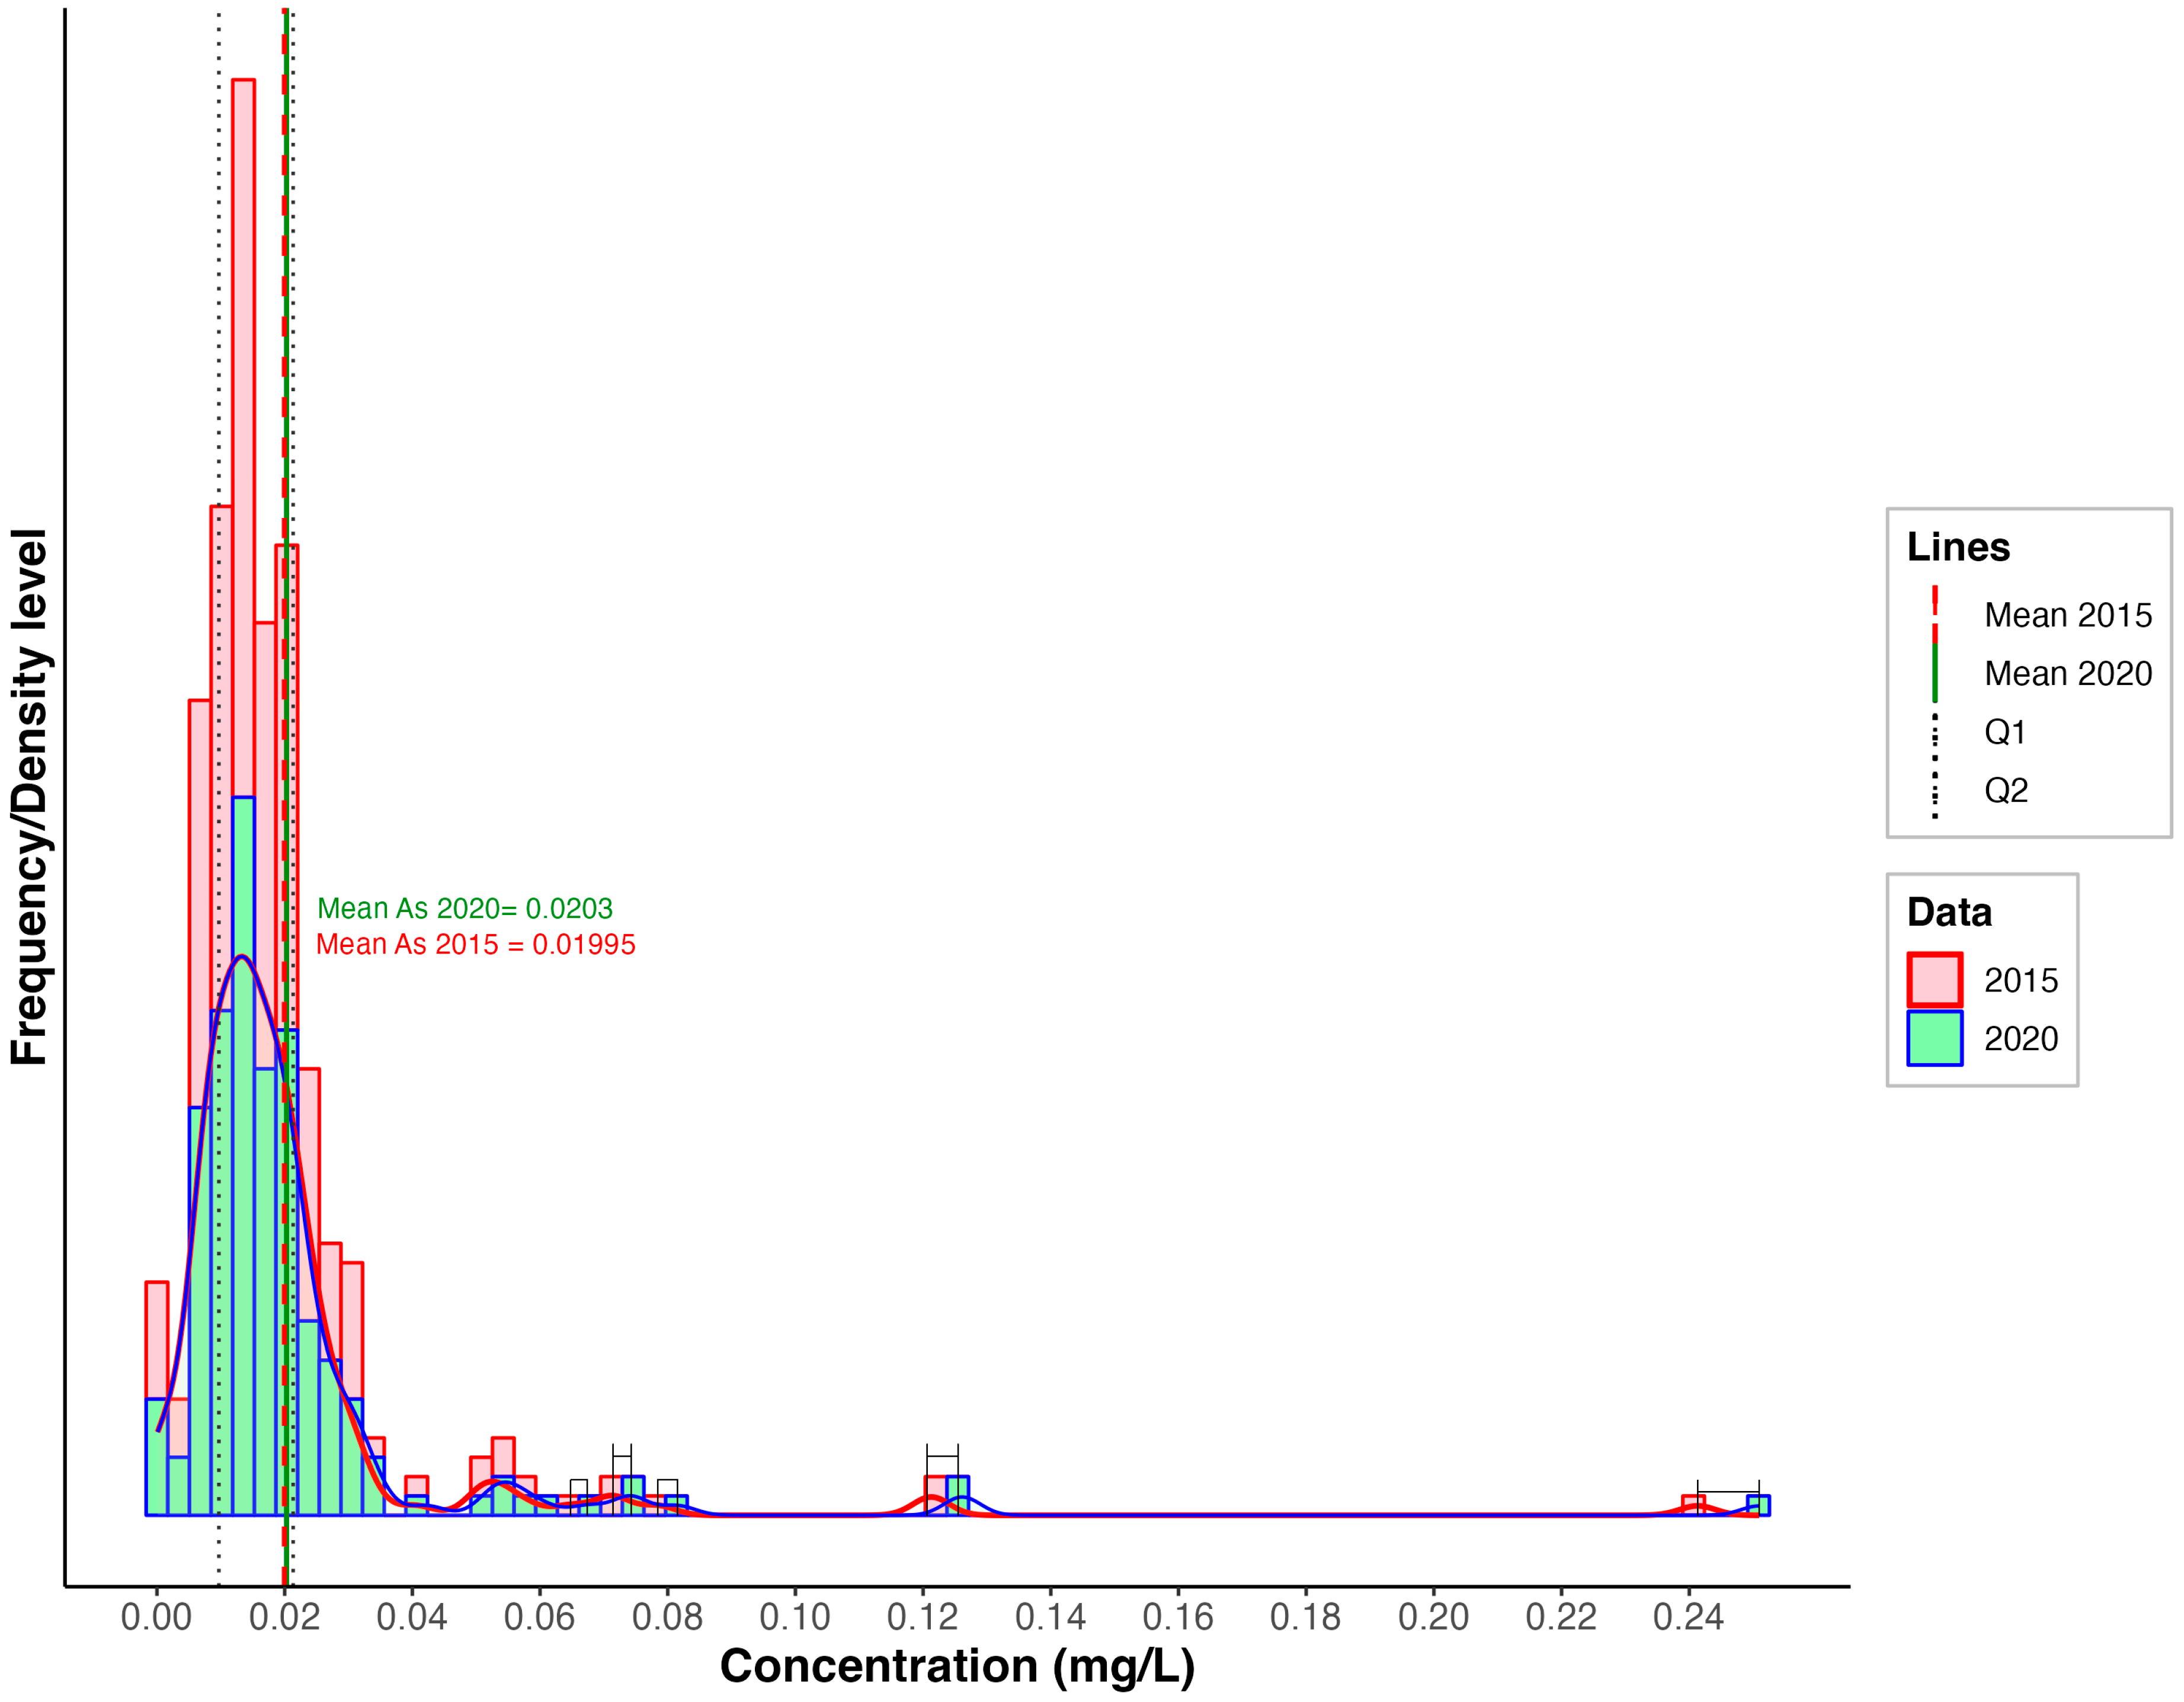
In all the wells analyzed, the arsenic concentration varies; we found regions with very low levels but also regions with very high levels. Figure 3 shows the histogram and the density graph of arsenic concentration in groundwater in the study area for 2015 and 2020. The mean concentration was 19.95 mg/L in 2015 and 20.29 mg/L in 2020, indicating a slight increase, while the median remained stable at 15.1 µg/L for both years.
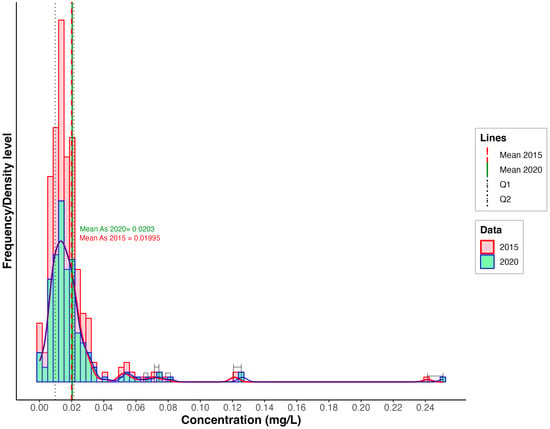
Figure 3.
Histogram and density graph of arsenic concentration.
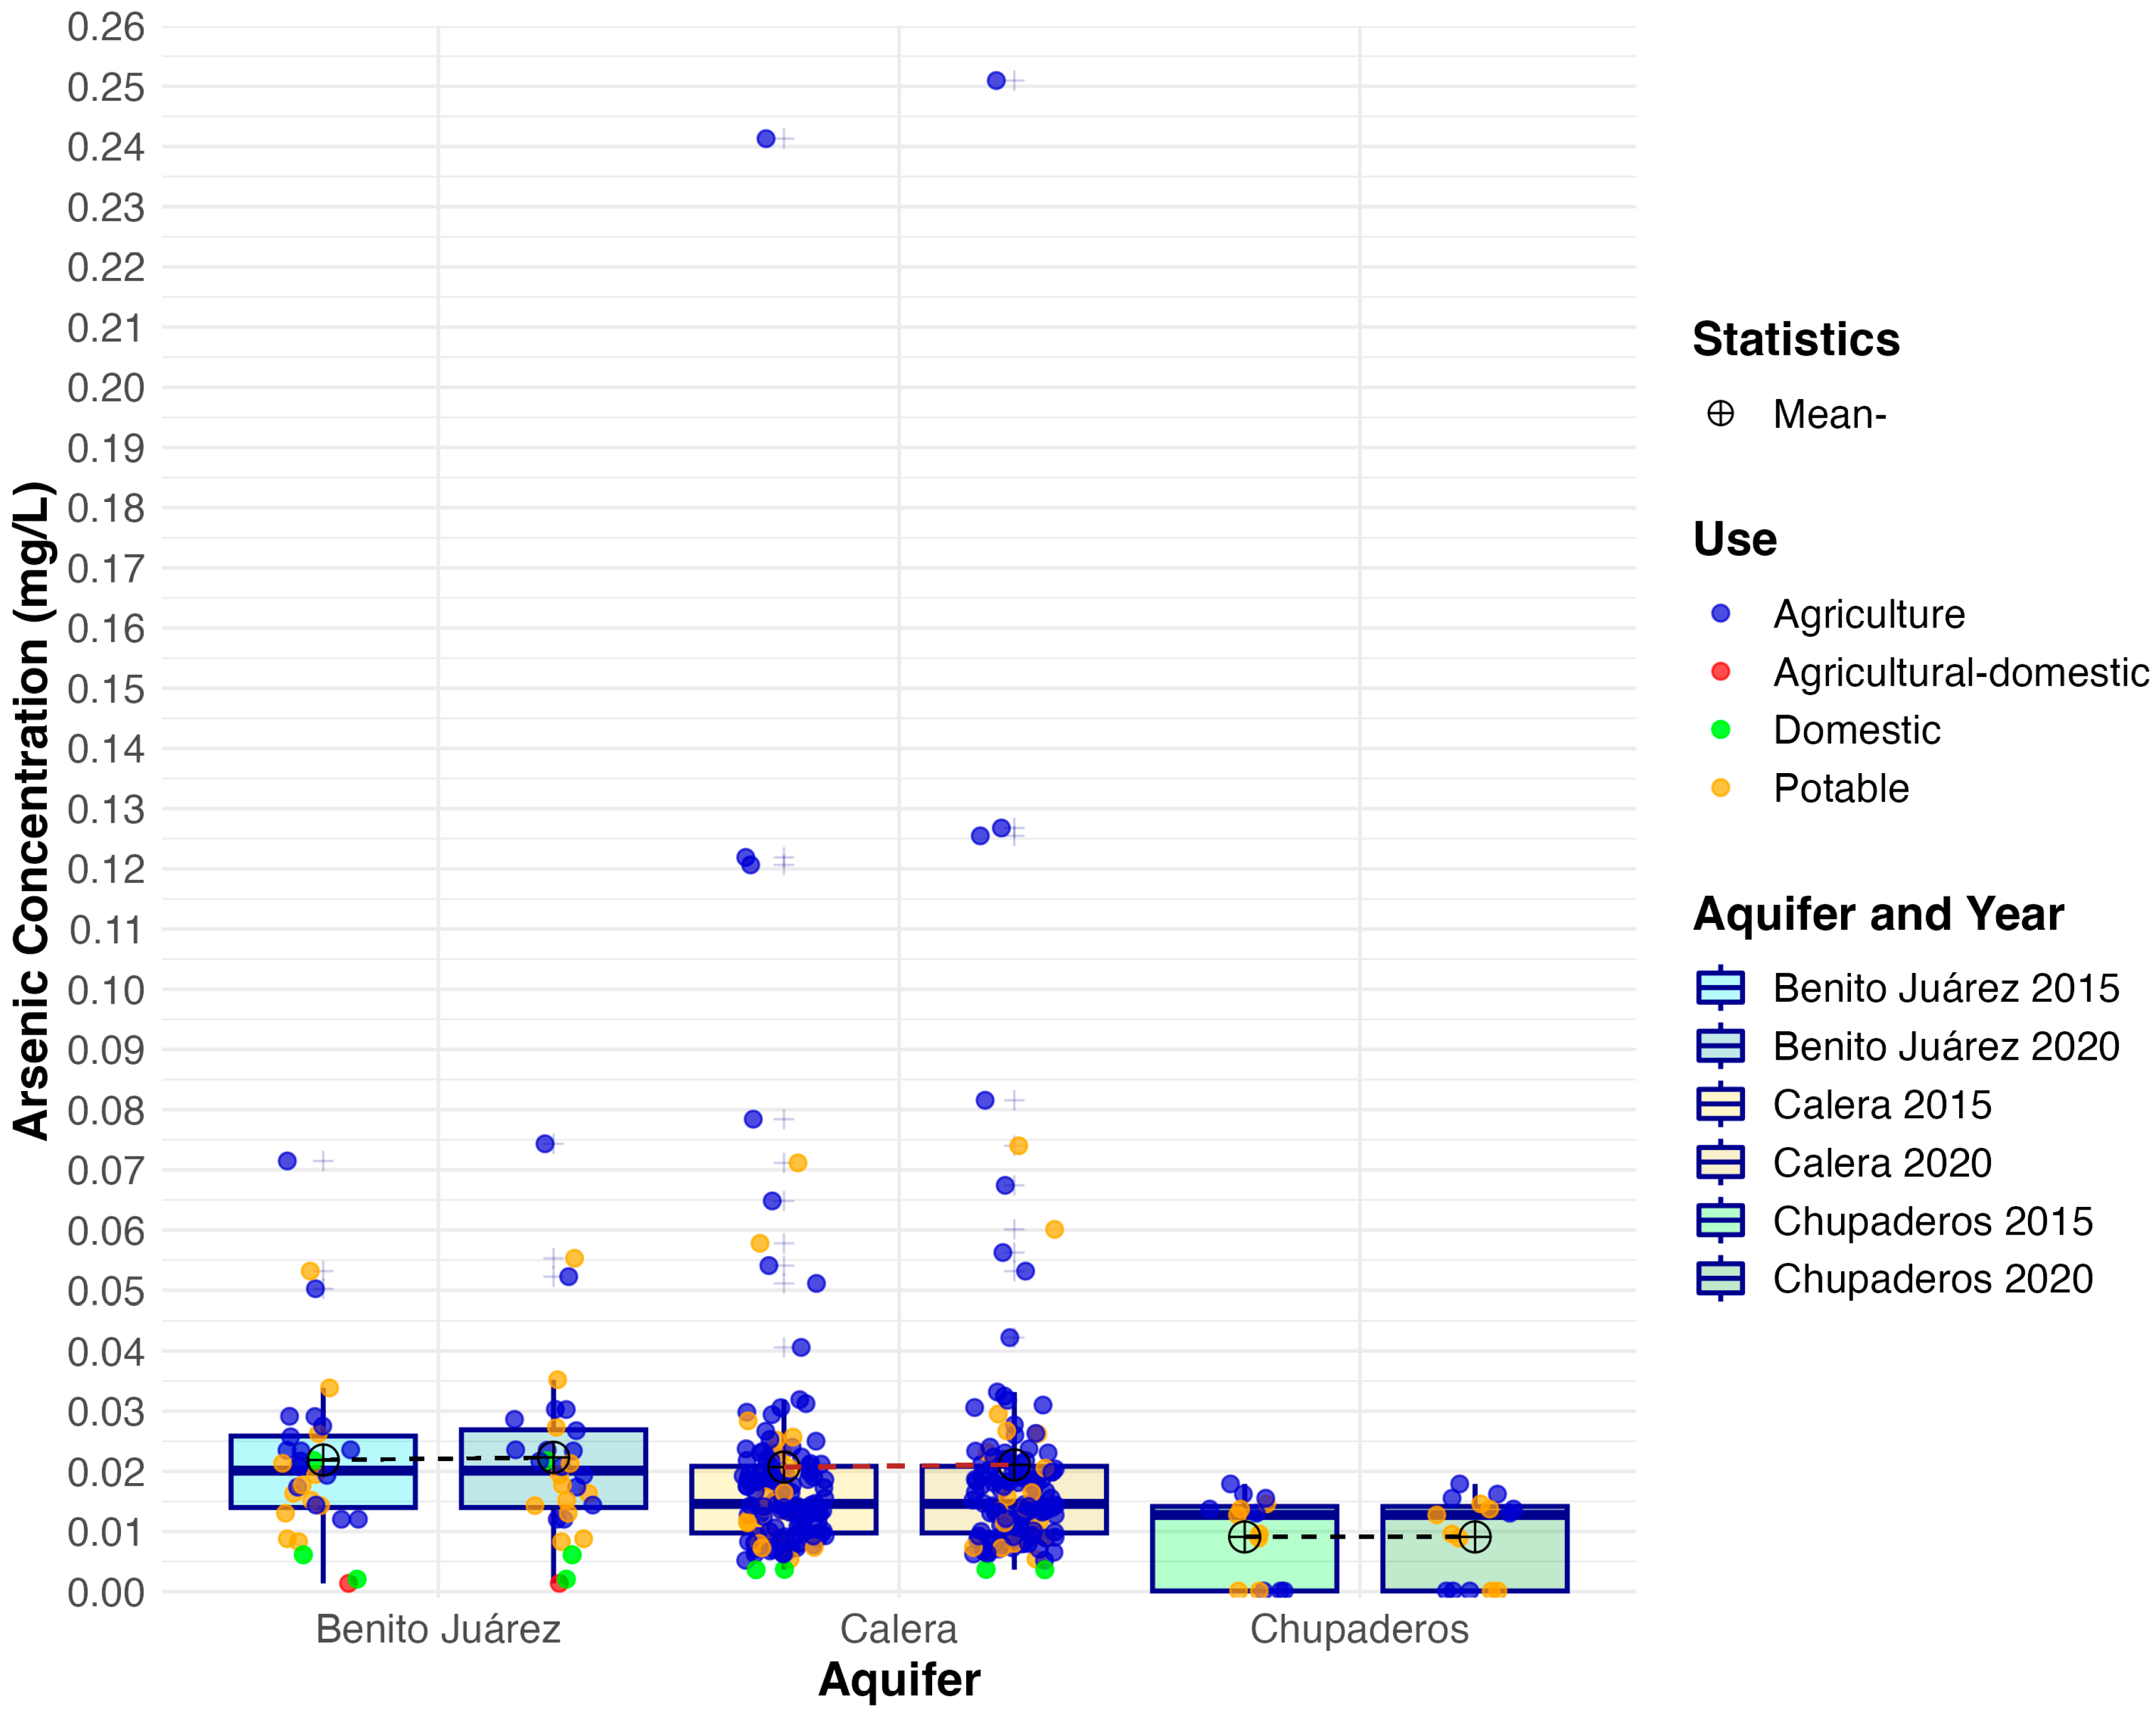
The water samples collected in 2015 showed an average arsenic concentration of 0.0199537 mg/L across all aquifers analyzed. The interquartile range was 0.0116332 mg/L, with the median at 0.0150932 mg/L and the first and third quartiles at 0.0096968 mg/L and 0.02133 mg/L, in the given order. Outliers were detected in the distribution, with a maximum arsenic concentration of 0.2413 mg/L found in the Calera aquifer, whose sample was taken in the municipality of Enrique Estrada.
In the analysis of samples collected in 2020, no significant differences in arsenic concentrations were observed compared to samples from 2015. In 2020, the interquartile range for arsenic concentration was 0.0116332 mg/L, with an average of 0.02029793 mg/L and a second quartile concentration of 0.0150932 mg/L. The maximum arsenic concentration (considered an outlier) was recorded in the same aquifer (Calera), from a sample collected in the municipality of Enrique Estrada, with a value of 0.250952 mg/L, showing a concentration differential of 0.0096 mg/L compared to 2015 (Figure 3).
The atypical concentrations of arsenic observed in the zone may be explained by a combination of natural and human-related factors. First, hydrogeological variability plays the following key role: groundwater flows through arsenic-rich volcanic rocks and sediments, which can release arsenic into the water through natural weathering and geochemical reactions. In certain areas, redox conditions, pH levels, and mineral composition favor the mobilization of arsenic. Second, the sampling locations can influence results. Wells located in deeper aquifers or in areas with limited recharge may show higher arsenic concentrations due to longer water–rock interaction times. Third, anthropogenic factors such as overexploitation of aquifers can lower the water table, disturb geochemical equilibrium, and increase arsenic solubility. Additionally, agricultural runoff or mining activity, both present in the region, may contribute to localized contamination. These factors together explain the spatial variability and occasional spikes in arsenic levels found in the study area.
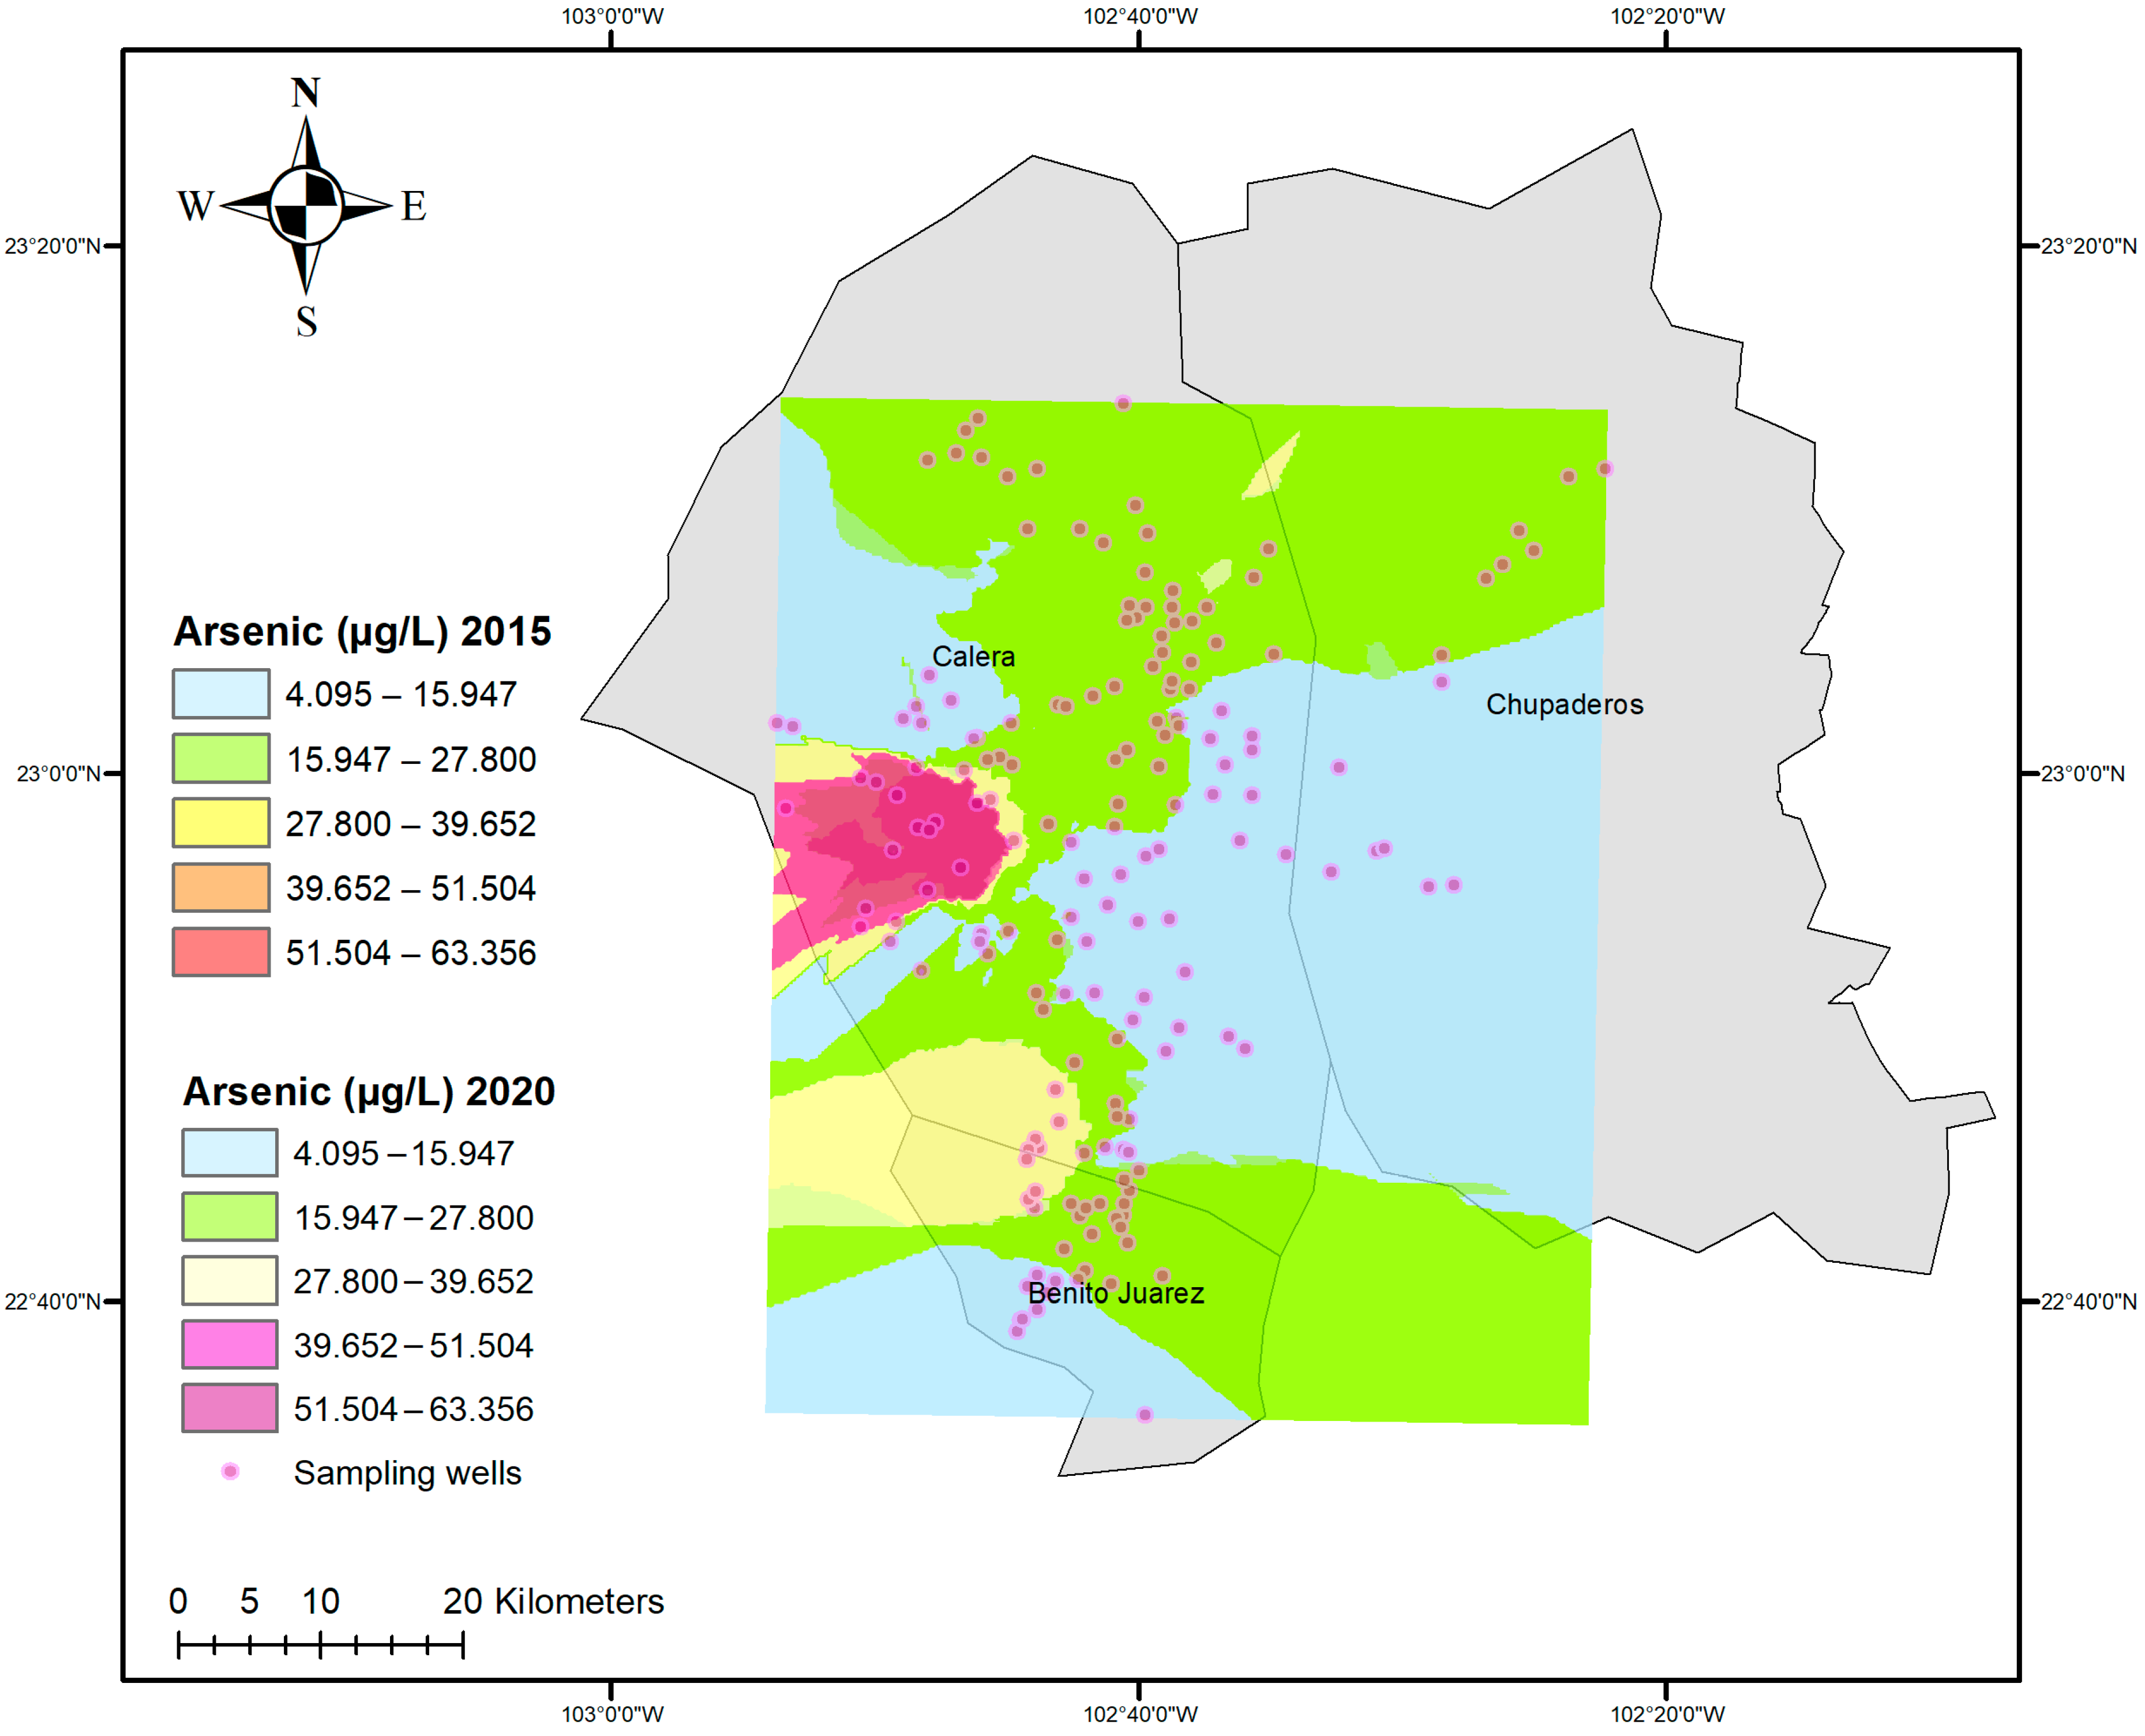
We can observe in Figure 4 that there is a spot west of the Calera aquifer where arsenic concentrations in groundwater are elevated. By 2015, this spot is smaller, and by 2020 it increased in size, indicating that the levels of this element increased over time. This change had already been reported earlier in other studies [38,39]. This figure shows the wells where the samples were taken. The ideal would be to monitor the entire area, but due to different circumstances, such as economic resources, it is not possible to do so. For this reason, a monitoring network was created where samples were taken at each of these points.
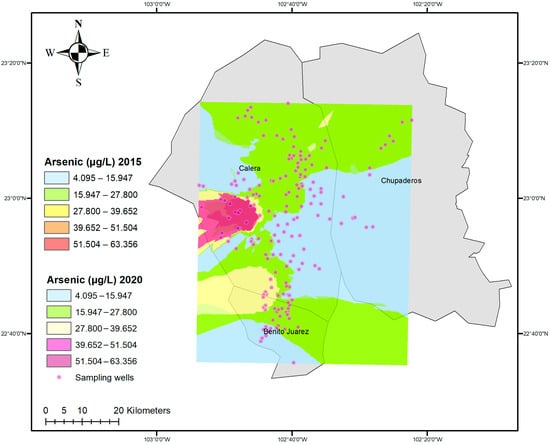
Figure 4.
Arsenic concentrations in 2015 and 2020.
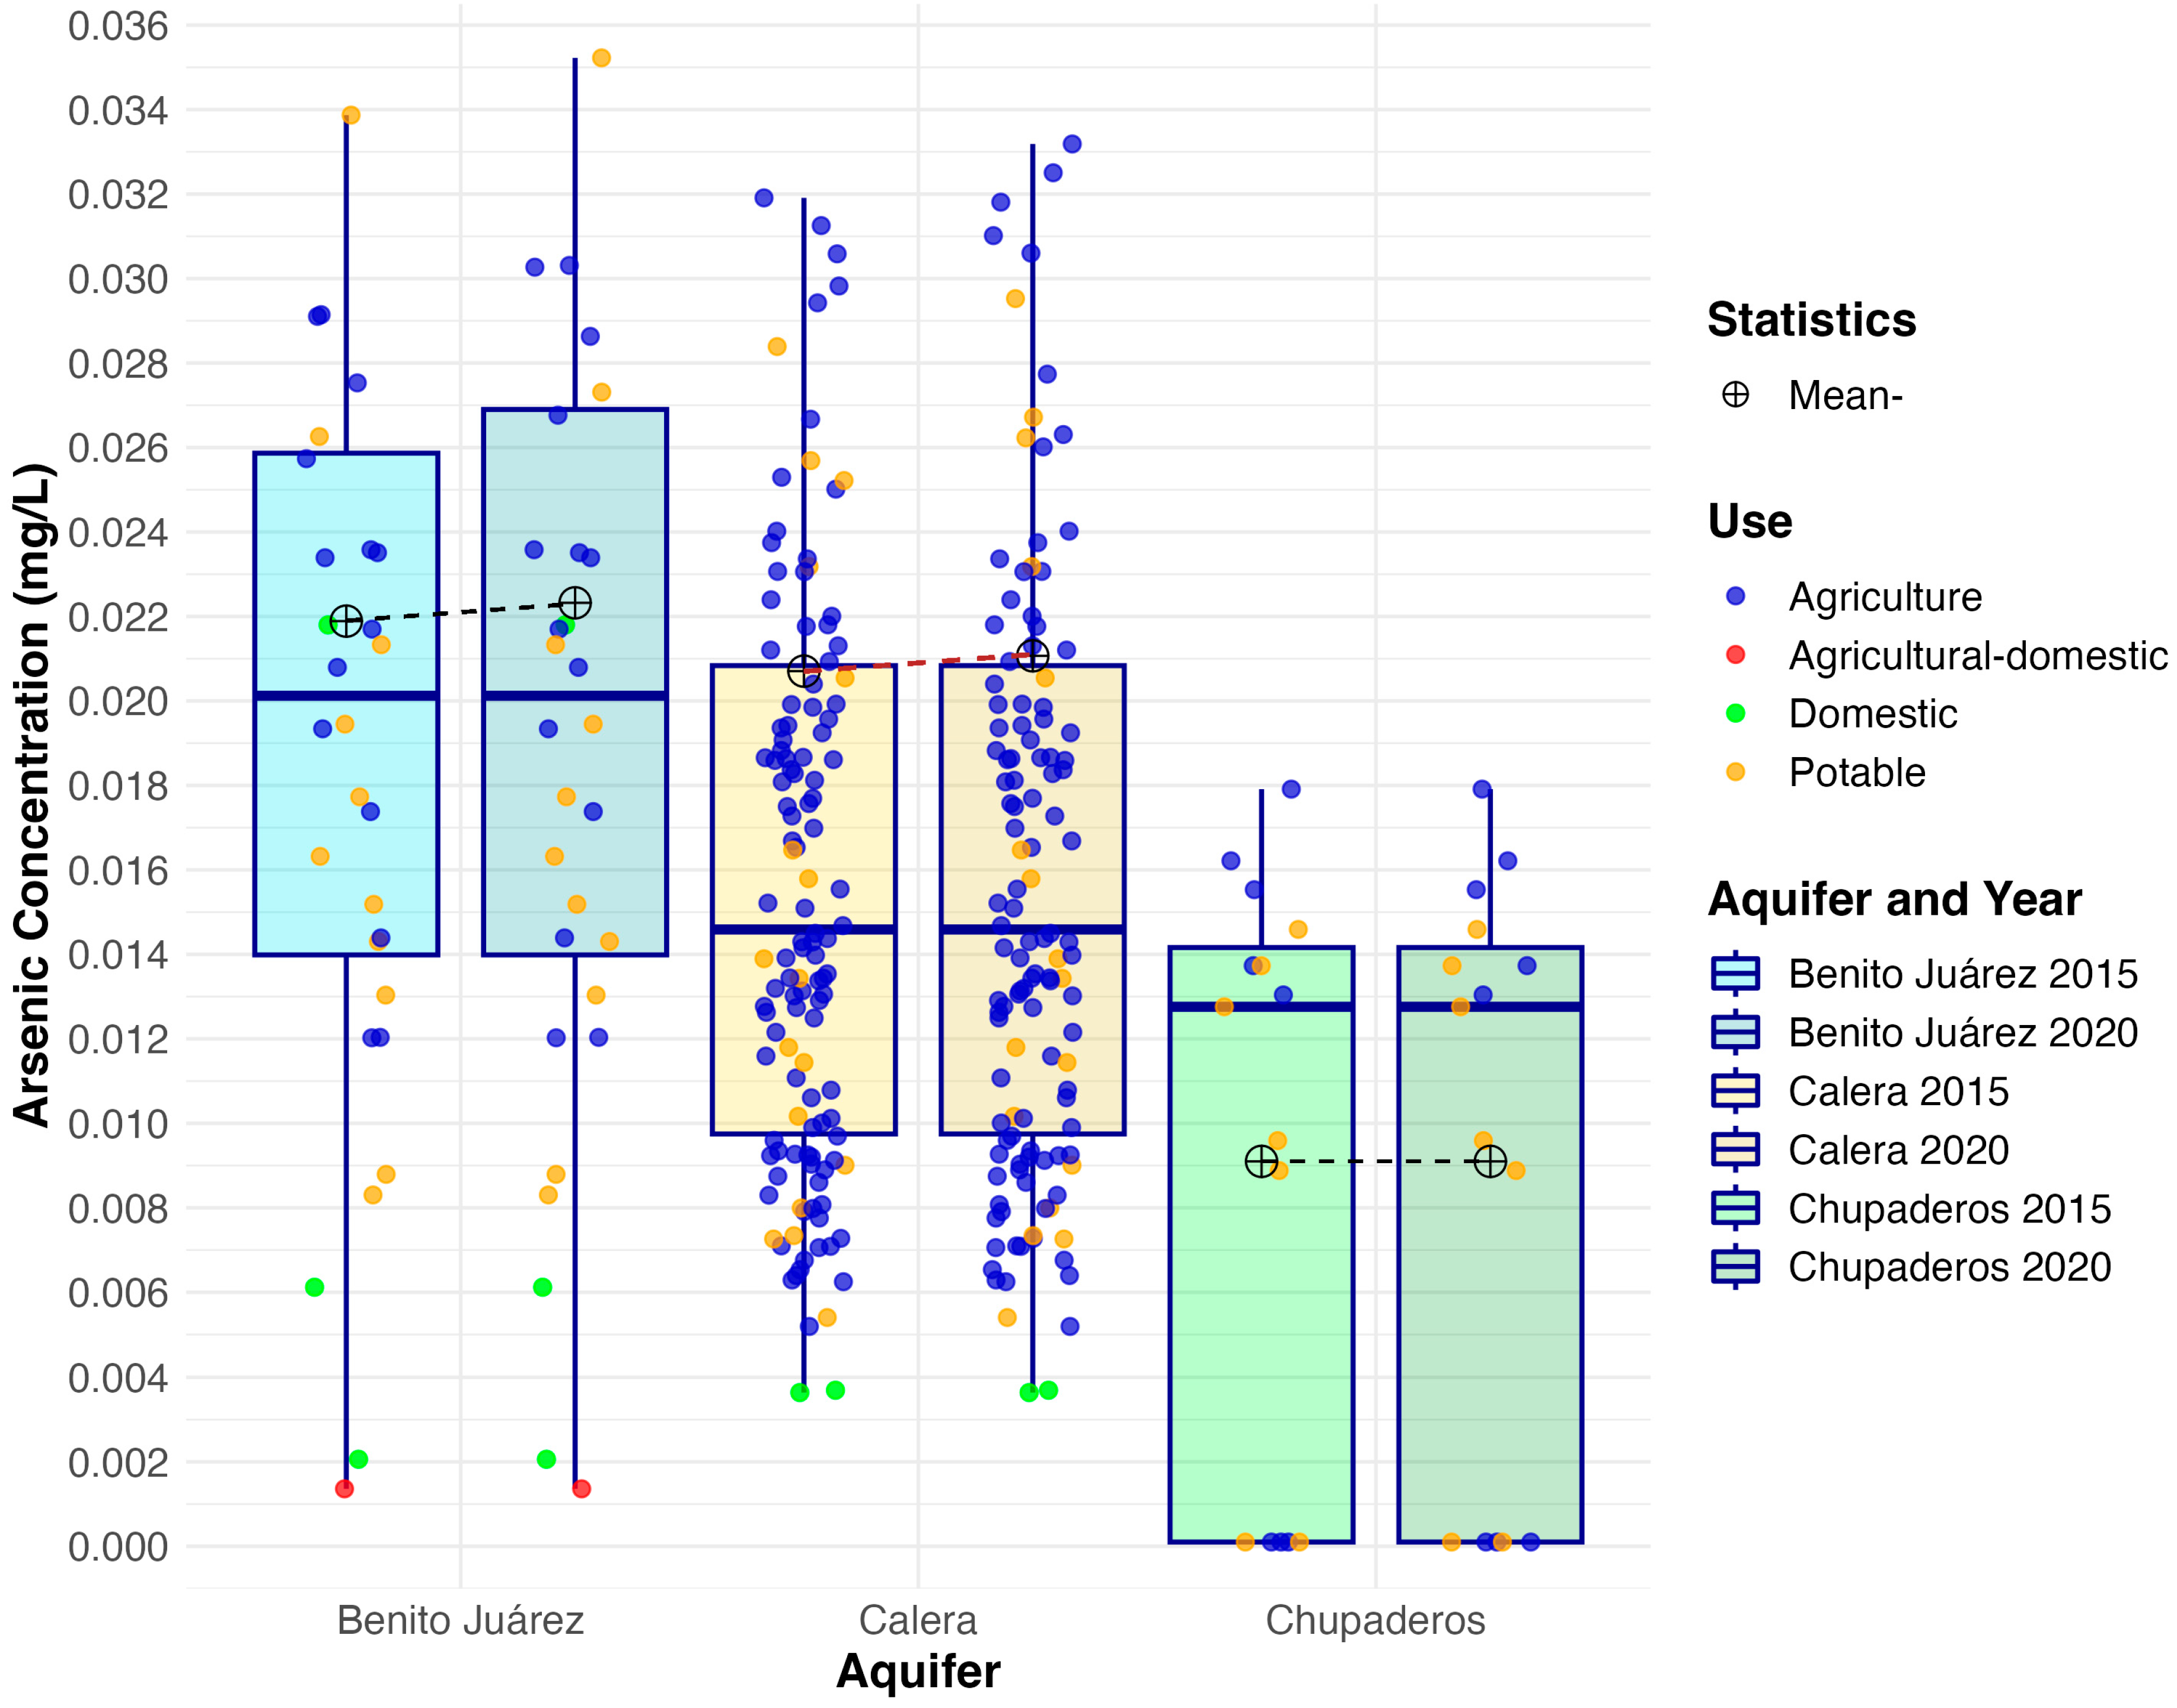
Figure 5 shows the boxplot diagram that summarizes the distribution and position of the arsenic concentration in the samples obtained in each of the three aquifers.
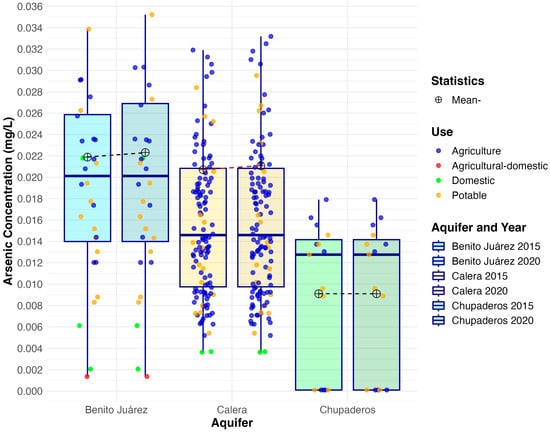
Figure 5.
As concentration by aquifer.
A boxplot was used to summarize the distribution of arsenic concentrations across sampling sites and to visually identify potential outliers. This type of plot effectively displays the median, interquartile range (IQR), and extreme values. These atypical values may reflect local hydrogeological anomalies, such as proximity to mineralized zones or deep wells with longer water–rock interaction times. One well-annotated boxplot with labeled sampling locations and concentration thresholds (WHO and NOM limits) provides a clear and concise visualization of the data distribution and the influence of extreme values.
This is important to highlight because it shows that the mobilization of arsenic is changing and that it is necessary to have constant monitoring. When categorizing arsenic concentrations by aquifer for the 2015 samples, the average concentrations were 0.0219 mg/L for the Benito Juarez aquifer, 0.0207 mg/L for Calera, and 0.0091 mg/L for Chupaderos. For the Benito Juarez aquifer, the interquartile range was 0.0119 mg/L, with a median of 0.0201 mg/L. Similarly, the Calera aquifer had an interquartile range of 0.0111 mg/L and a median of 0.0146 mg/L. Finally, the Chupaderos aquifer exhibited an interquartile range of 0.0141 mg/L and a median of 0.0128 mg/L.
Arsenic concentrations can vary between aquifers over time due to differences in their geological composition, depth, recharge rates, and hydrogeochemical conditions. Each aquifer has a unique combination of factors that influence arsenic mobility and accumulation. Over time, pumping practices—especially overextraction—can alter the flow paths and pressure conditions within an aquifer, potentially drawing in arsenic from different geological layers or neighboring aquifers. Seasonal changes (e.g., wet vs. dry season) can also shift groundwater levels and chemistry, temporarily changing arsenic concentrations. Finally, land use changes, such as increased agriculture or mining, may introduce new sources of arsenic or modify existing geochemical conditions. These dynamic interactions explain why arsenic levels can differ not only between aquifers but also within the same aquifer over time. In samples collected in 2020, the average arsenic concentrations by aquifer were 0.0223 mg/L for Benito Juarez, 0.0211 mg/L for Calera, and 0.0091 mg/L for Chupaderos. It is important to note that 74.03% of the samples were from the Calera aquifer, 17.67% from Benito Juarez, and the remaining 8.28% from the Chupaderos aquifer. Across all three aquifers, the interquartile range was approximately 0.01 mg/L too, with a maximum second-quartile concentration of 0.0201 mg/L observed in the Benito Juarez aquifer. A summary of the data for each aquifer across both time intervals is presented in the Table 1:

Table 1.
Summary of the data for each aquifer for both years.
Figure 6 shows the boxplot diagram that summarizes the distribution and position of the arsenic concentration in the samples with atypical values obtained in each of the three aquifers. In order to compare the descriptive data and given the conditions of the groups of the data frame, the non-parametric Kruskal–Wallis test was applied to compare medians Q2 by aquifers (p < 0.05).
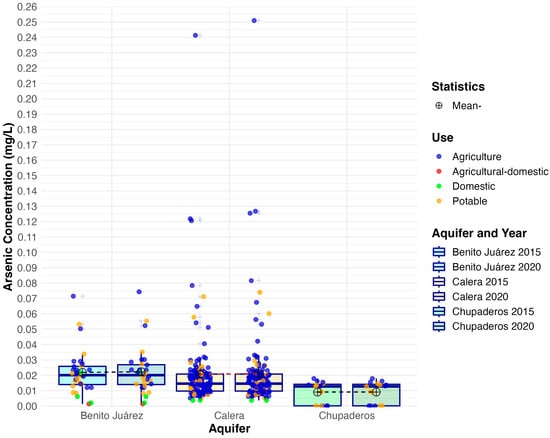
Figure 6.
As concentration without atypical values by aquifer.
Data analysis is accompanied by inferential tests to verify whether there is statistical evidence to support the existence of a representative temporal or spatial difference between the distributions. To compare these, as a function of time or with numerical values as a reference, it is common to apply Student’s t-test when the number of observations is much higher than 30, so it is used in this research. On the other hand, to compare the data set spatially (by aquifer), the Kruskal–Wallis non-parametric test was used. The purpose of this test is to determine the existence of global differences in the distributions classified into categories.
In the 2015 sample, there was no significant difference between the median arsenic concentrations recorded in the Benito Juarez and Calera aquifers (p = 0.1276). This means that the central values of the compared groups are statistically similar.However, the difference in medians between the Chupaderos and Benito Juarez aquifers was statistically significant (p < 0.05), as was the difference between the Chupaderos and Calera aquifers (p < 0.05). The test showed the same differences in both the 2015 and 2020 samples. Reporting arsenic concentrations, CR index and HQ, with and without outliers is important to ensure a balanced and reliable risk assessment. Outliers—extremely high or low concentration values—can significantly influence average exposure estimates, potentially leading to over- or underestimation of health risks. By analyzing results with and without these values, it becomes possible to distinguish between widespread contamination and isolated cases, identify localized high-risk areas, and avoid misleading generalizations. The elevated arsenic concentrations identified in this region are primarily of geogenic origin, linked to the area′s volcanic geology. Zacatecas lies within zones influenced by the Trans-Mexican Volcanic Belt. This zone is rich in arsenic-bearing minerals such as arsenopyrite, orpiment, and realgar, which occur naturally in the bedrock. Through weathering and mineral dissolution, arsenic is gradually released into the groundwater. This natural contamination is further intensified by the mismanagement and overexploitation of aquifers;particularly the deep extraction of groundwater for agricultural irrigation and urban supply. Excessive pumping alters the hydrogeochemical conditions—such as redox potential and pH—enhancing arsenic mobilization from the subsurface. Therefore, arsenic pollution in Zacatecas reflects a complex interplay between natural geological processes and human-induced hydrological stress, underscoring the urgent need for integrated groundwater management and targeted mitigation strategies [38,39,40,41,42,43,44].
3.2. Non-Carcinogenic Risk
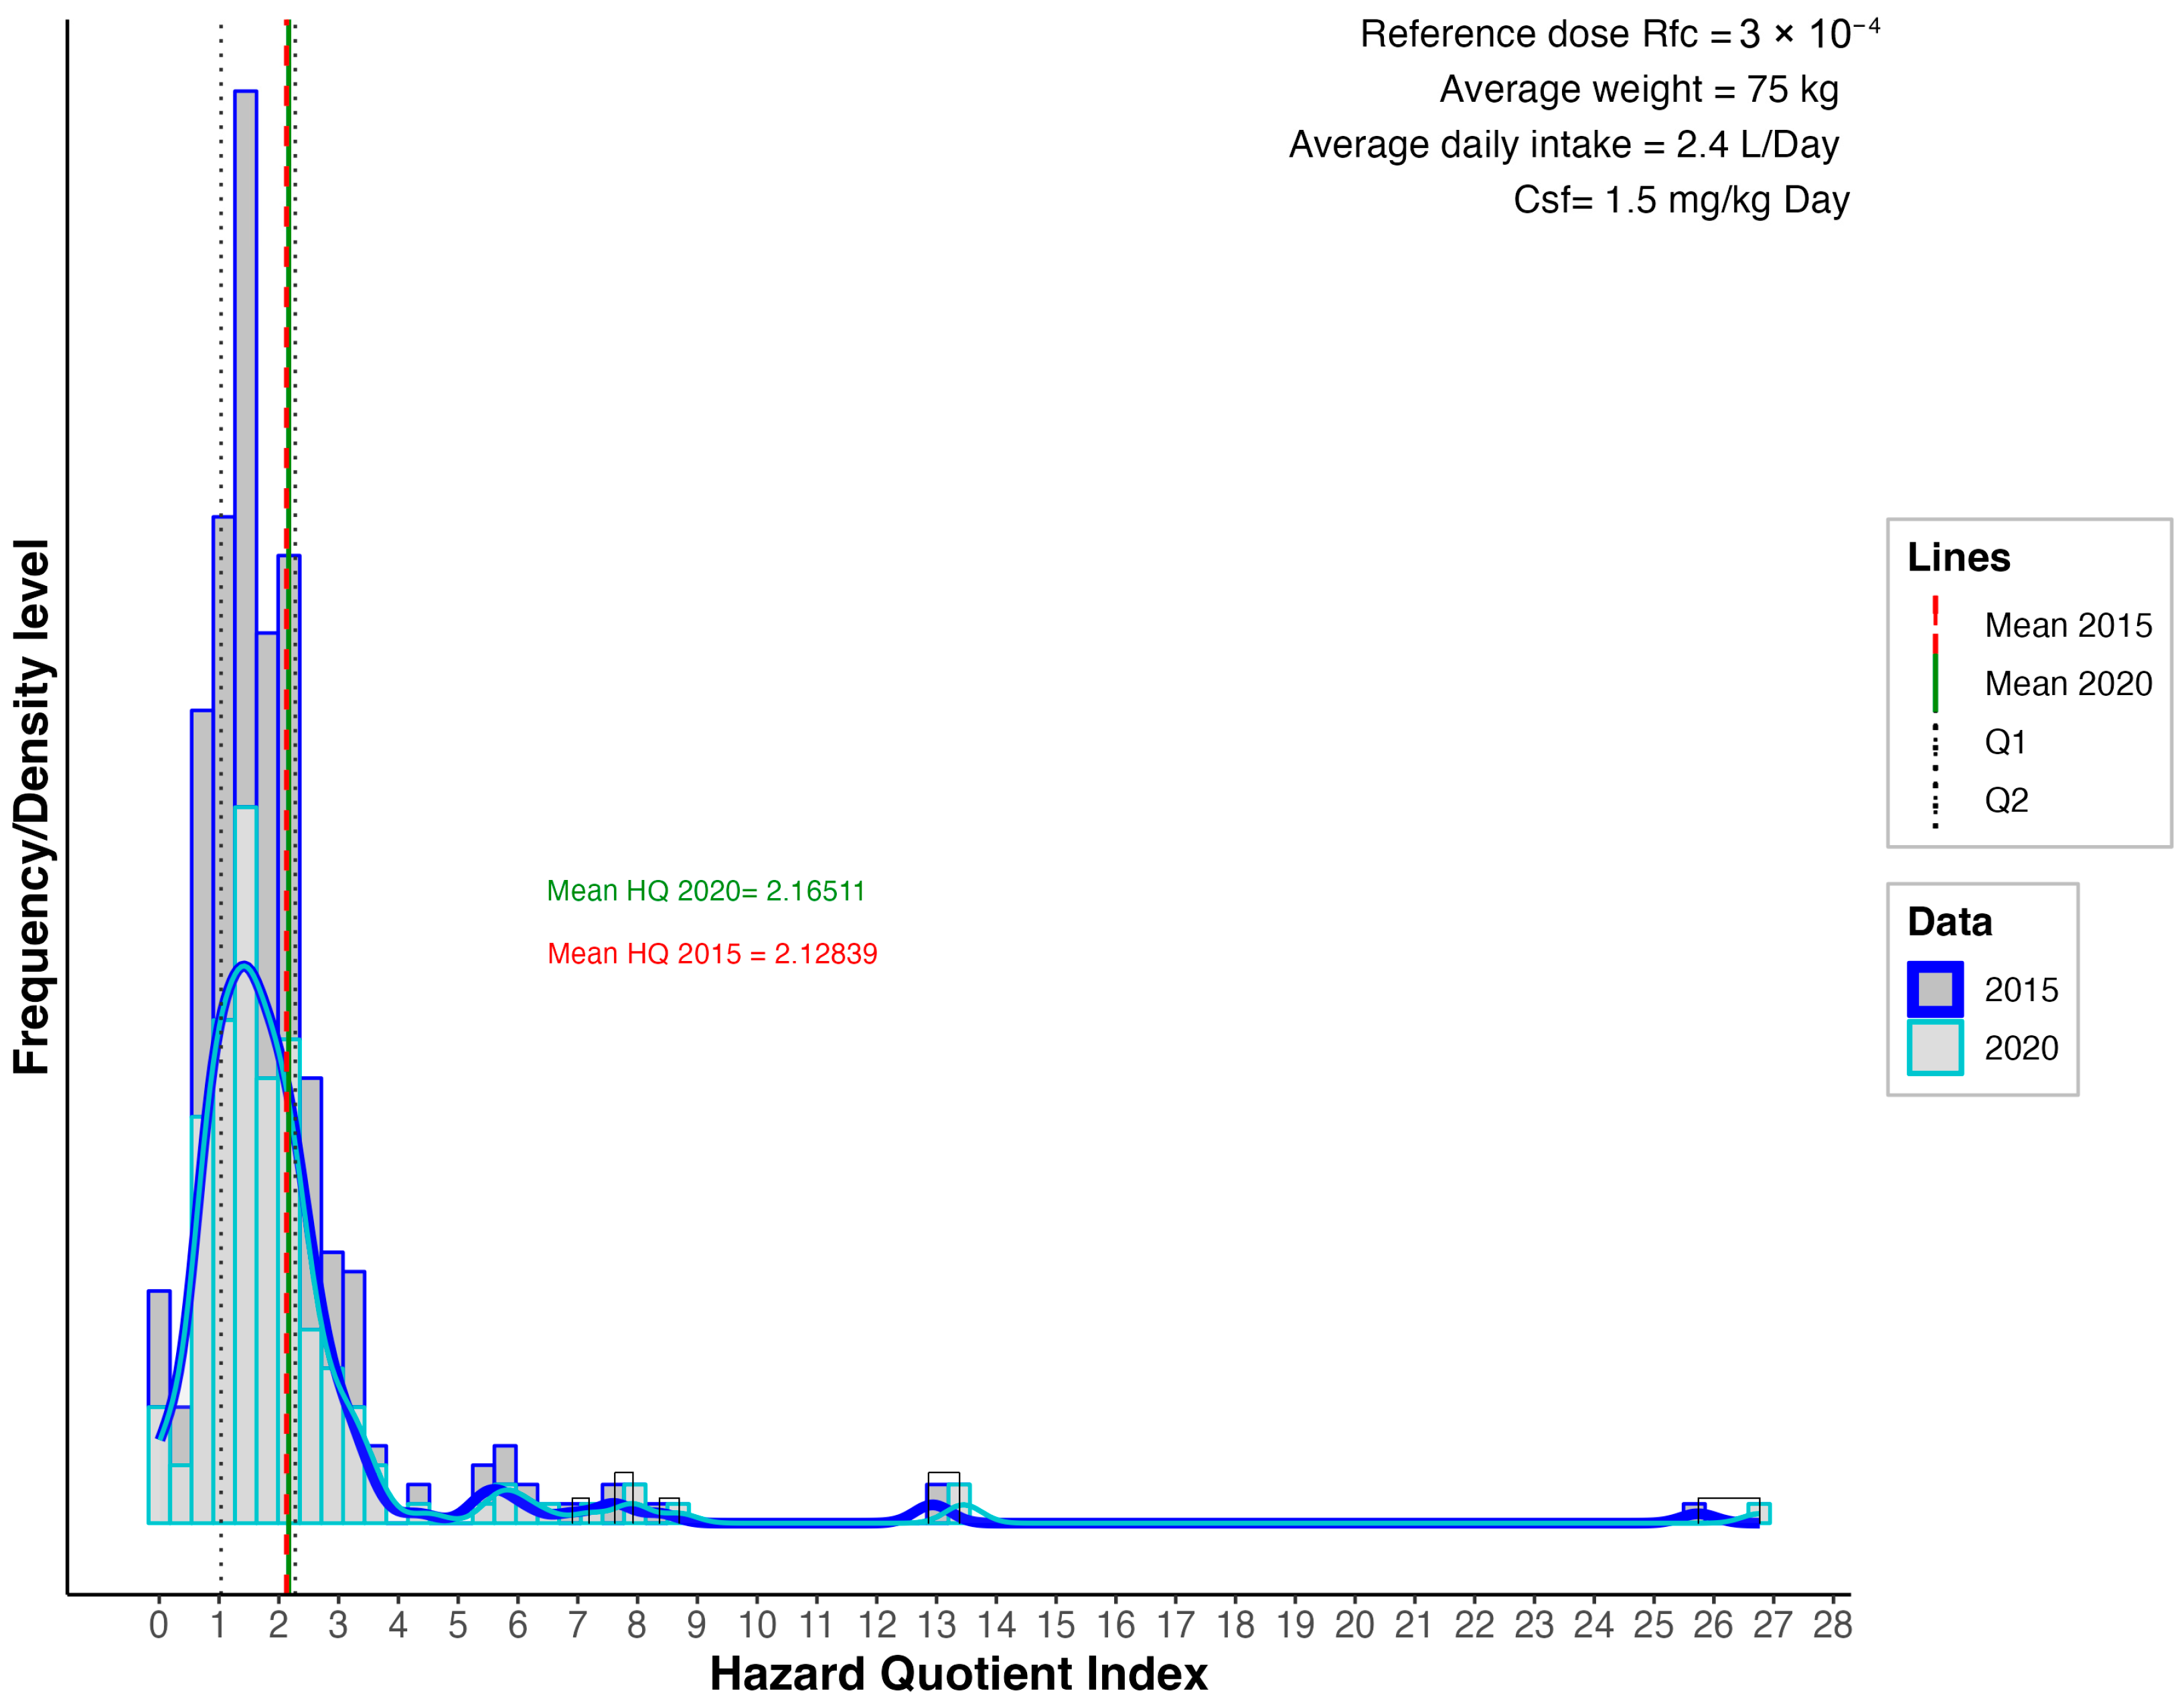
Arsenic is one of the most toxic and carcinogenic elements when ingested; for this reason, it is important to evaluate its potential to cause these damages to the organism. These effects are typically evaluated based on the exposure levels and the inherent toxicity of the substance. This assessment focuses on the potential health effects of substances that do not cause cancer but may cause other adverse health effects. In this section we present the results of HQ in this investigation. Figure 7 shows the distribution as a histogram of the different resulting HQ indexes in each water well. The descriptives of this data for 2015 are an average index of 2.13 and an index of 1.61 in the second quartile. The maximum and minimum were 0.01 and 25.74, respectively. It is important to highlight the presence of outliers that skew the distribution with an asymmetry whose value is 5.82. In 2020, the average index was 2.1651, with a differential of 0.0367 units compared to the average value observed in 2015. Despite this minimal difference, the second quartile was identical in both samples. The non-parametric test used to compare the distributions did not reveal any significant differences over the time interval considered (p > 0.05). Therefore, it is concluded that there is no statistical evidence of a significant variation in the HQ index, suggesting that this data remained stable over time. However, this does not mean that we should stop monitoring the evolution of these indexes over time, since there are areas that need special attention and implementation of measures for safe water intake.
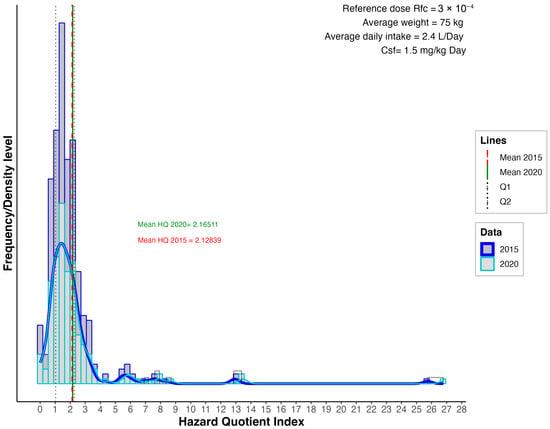
Figure 7.
Histogram of the HQ results in the study area.
The HQ is a numerical value that is used to estimate the risk associated with exposure to a particular substance. If the HQ is less than one, it indicates that the exposure is less than the reference dose. This suggests that the HQ is equal to or greater than one and indicates that the exposure exceeds the reference dose.
Since the sample size was greater than 30, the central limit theorem justifies the use of the “t-test” to compare the mean HQ index recorded in 2015 against a reference value of 1. The analysis showed that the mean HQ index was significantly greater than 1 (p < 0.05), indicating that it exceeded the reference dose.
The Reference Dose is a critical component in the calculation of HQ. It is derived from toxicological data, typically from animal studies, and includes safety factors to account for uncertainties. RfD is usually expressed in units of milligrams of substance per kilogram of body weight per day (mg/kg/day). For arsenic, the Reference Dose (RfD) for chronic oral exposure is a value established by the USEPA. This value (0.0003 mg/kg/day) represents the daily exposure level that is likely to be without appreciable risk of adverse health effects over a lifetime. This is based on studies of human exposure to arsenic and incorporates uncertainty factors to account for variability in human sensitivity and other uncertainties in the data.
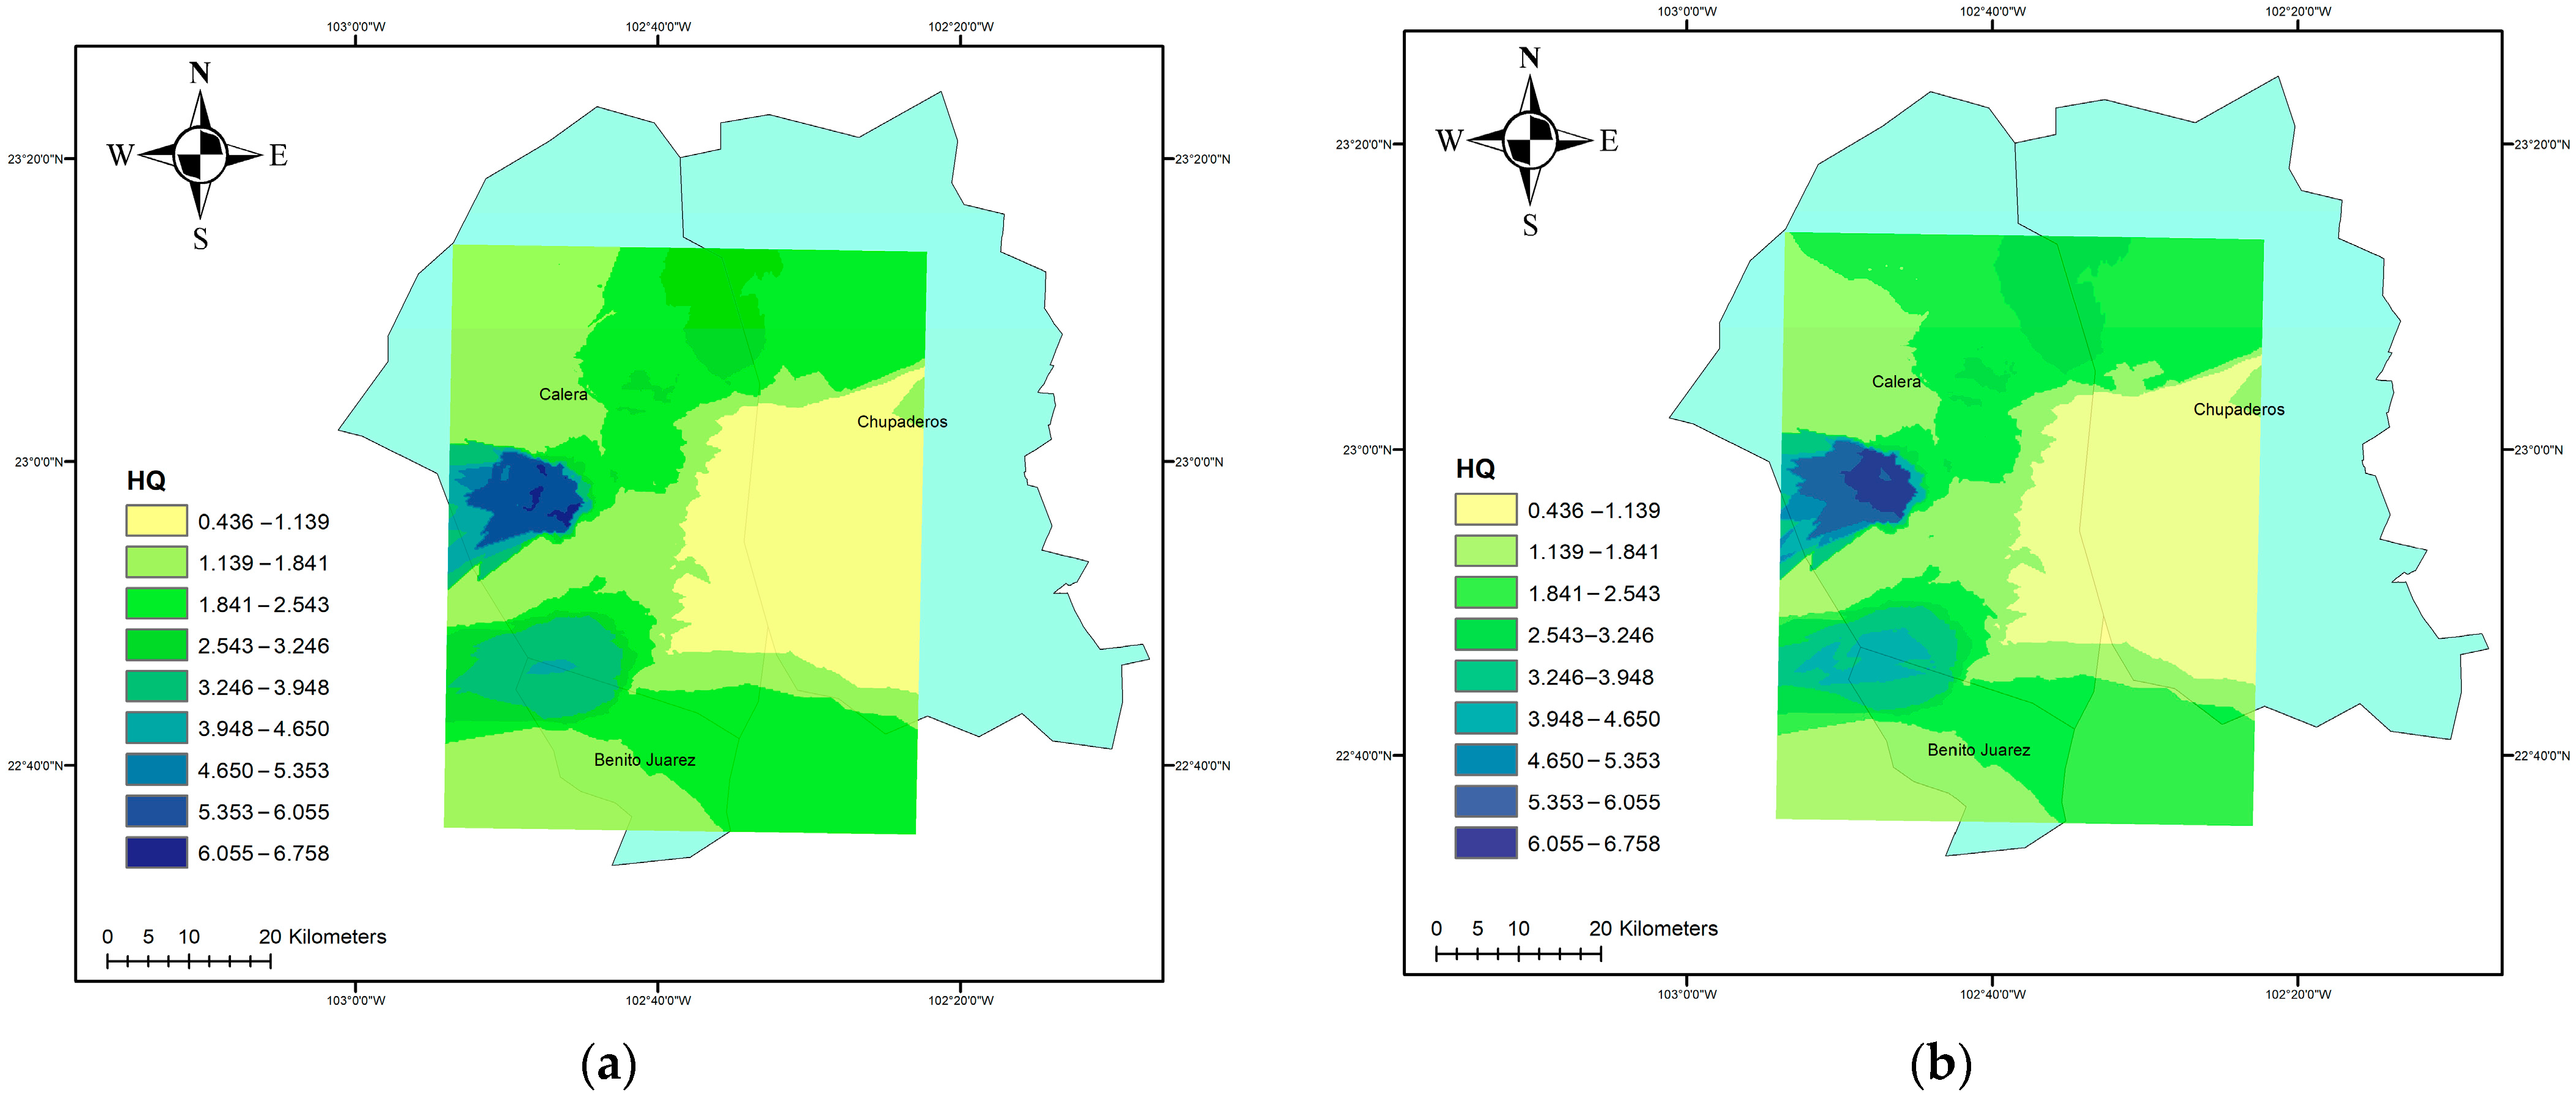
Figure 8 shows that the HQ is greater than 1 in the entire region except for the northern part for both years; only in the yellow area are no adverse health effects expected, so there is potential for health concern. This indicates that the exposure of arsenic in groundwater exceeds the reference dose and that health effects may occur. For this reason, a more detailed analysis is necessary. From the HQ of 1.13, the estimated exposure to a chemical is 13% higher than the level considered safe (the reference dose or RfD). According to the US EPA, an HQ less than 1 suggests that adverse non-cancer health effects are unlikely. However, an HQ greater than or equal to 1 indicates that there may be a potential risk for non-cancer health effects, especially in sensitive populations (such as children, the elderly, or people with preexisting conditions). While 1.13 does not confirm harm will occur, it signals that further evaluation or mitigation might be needed. The dark blue zones indicate exposure higher than the reference dose considered safe by the USEPA. This is a significantly elevated value, and it strongly suggests a potential risk of non-cancer health effects due to overexposure. The higher the HQ is above 1, the greater the concern. An HQ of 6.75, which is the greatest in our results, typically warrants urgent investigation, risk management, or remediation actions to reduce exposure and protect public health. We can also see in this figure that the HQ rises a little as the years go by; for this reason, it is important to keep a constant monitoring of these concentrations. The HQ is a crucial tool in the non-carcinogenic risk assessment process, helping to quantify the potential risk and guide decision-making regarding environmental health and safety.
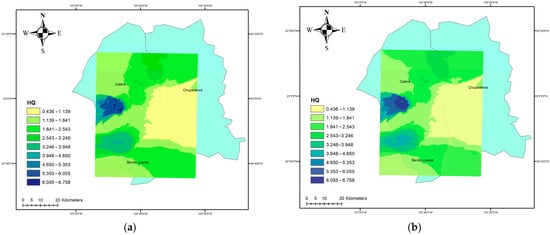
Figure 8.
(a) HQ in 2015; (b) HQ in 2020.
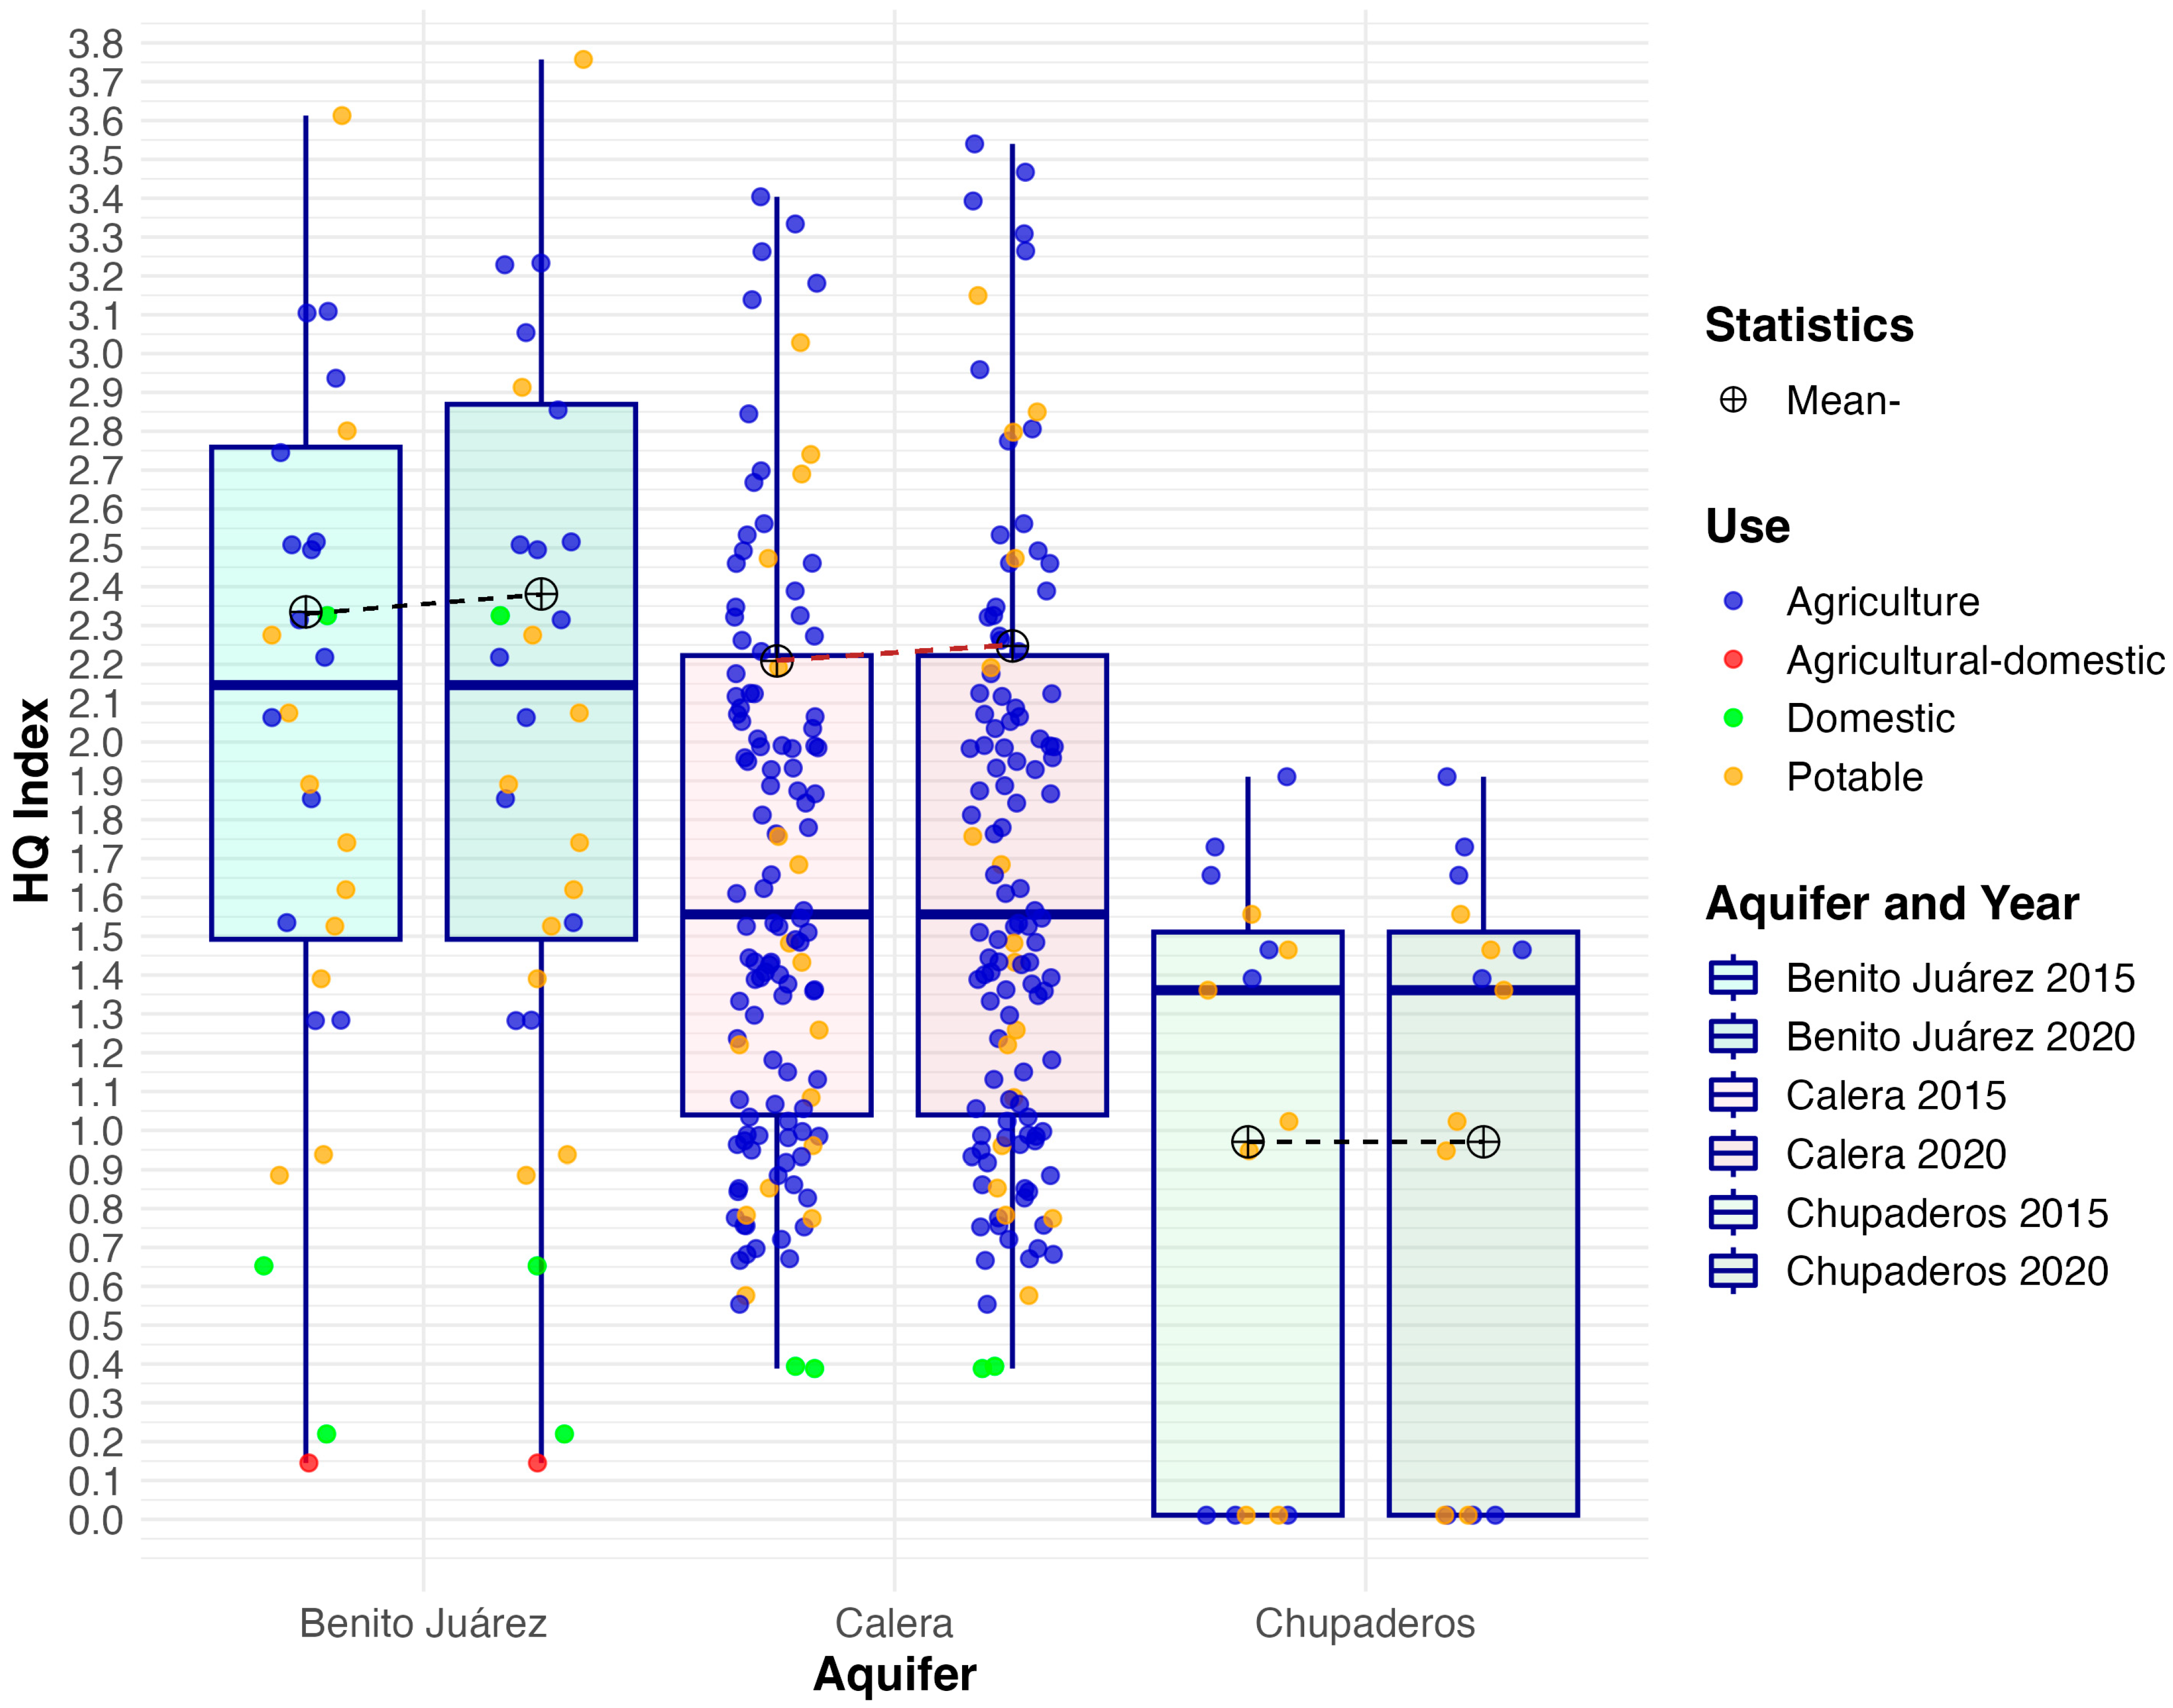
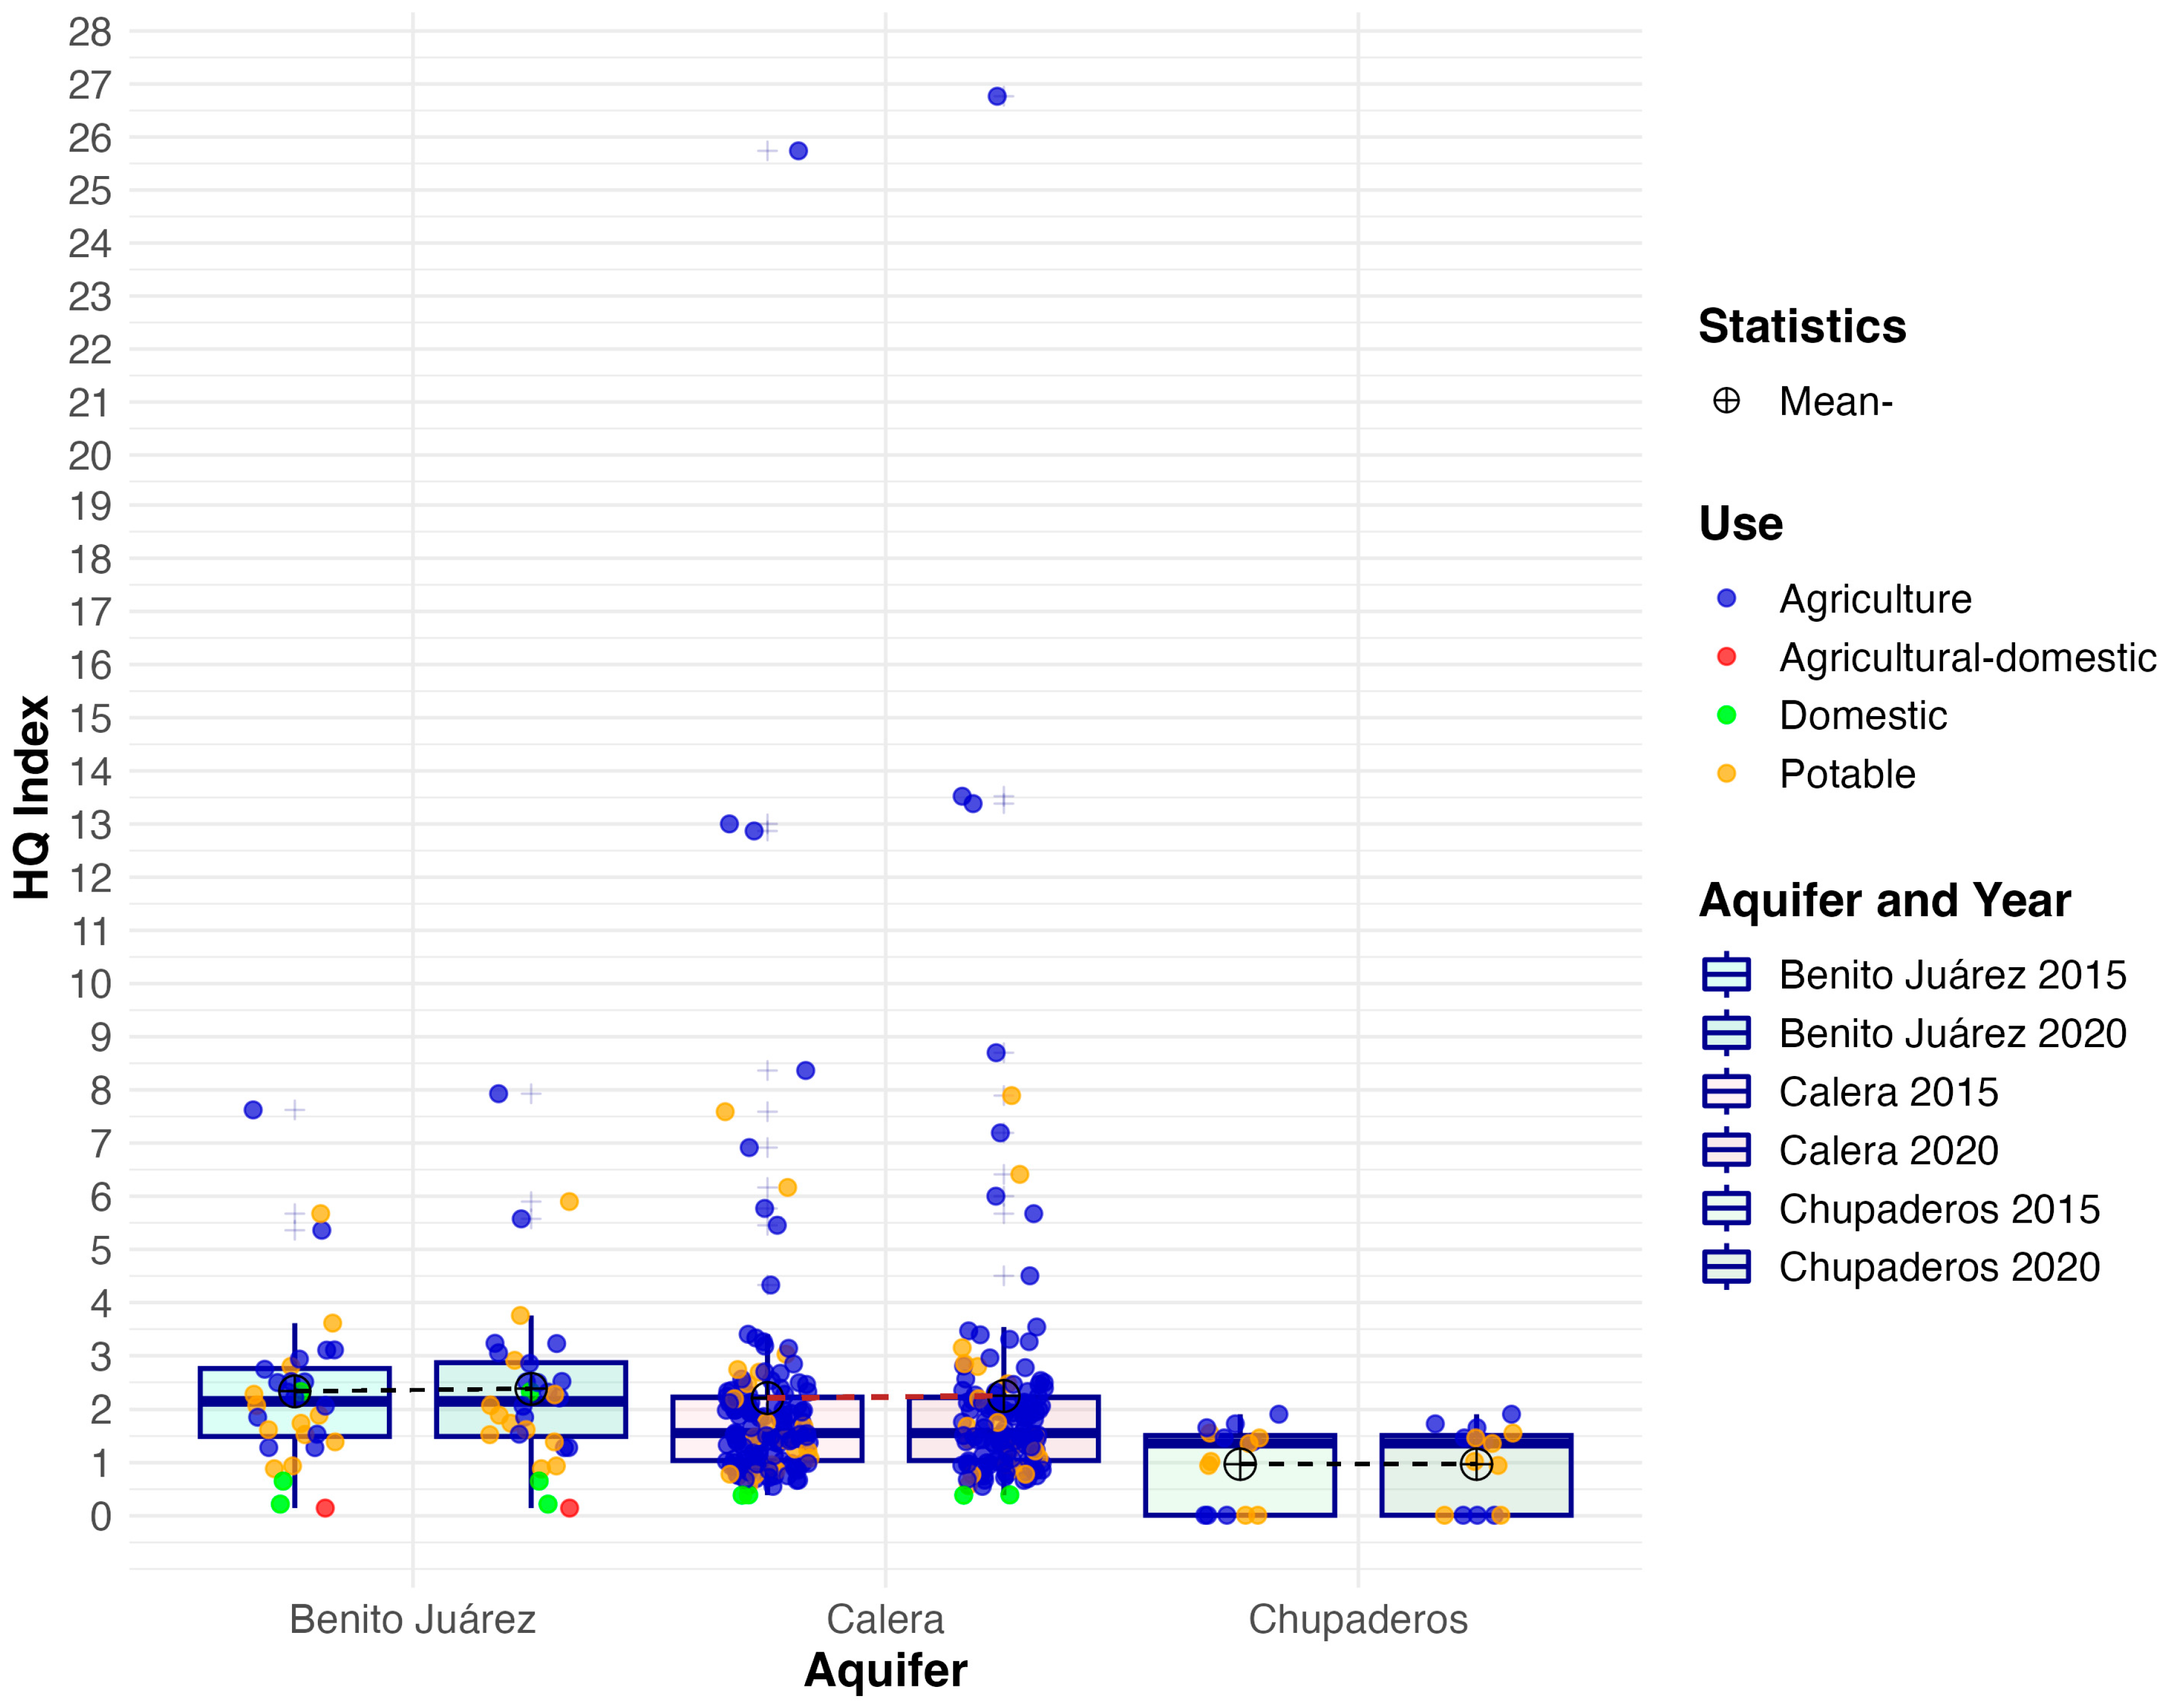
Figure 9 shows the non-atypical distribution of HQ by aquifer for both years, and the average HQ index was 2.33 for the Benito Juárez aquifer and 2.21 for the Calera aquifer, while the only aquifer with an average HQ index slightly below one was Chupaderos. The second quartile (Q2) of the HQ index was 2.15 for Benito Juárez, 1.56 for Calera, and 1.36 for Chupaderos; these descriptive data are relative to the index calculated with the samples from 2015 and for 2020.
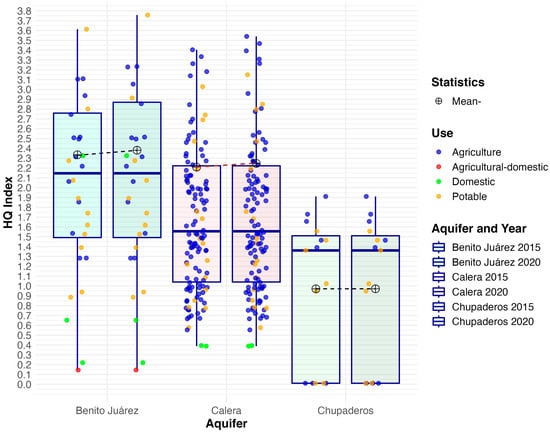
Figure 9.
Non atypical distribution of HQ by aquifer.
Figure 10 describes the atypical distribution of HQ. Regarding the descriptives, the interquartile range of the HQ index was 1.27, 1.18, and 1.5 for the Benito Juarez, Calera, and Chupaderos aquifers, respectively. The second quartile was highest in Benito Juarez, with a value of 2.15, followed by Calera at 1.56, and lowest in Chupaderos at 1.36. Similarly, when comparing the HQ index distributions by aquifer, there was no statistically significant difference between the data from the Benito Juárez and Calera aquifers (p > 0.05). However, when comparing the data from Chupaderos with those from Benito Juárez and Calera, the test showed significant differences (p < 0.05). The non-parametric test applied was the Wilcoxon test.
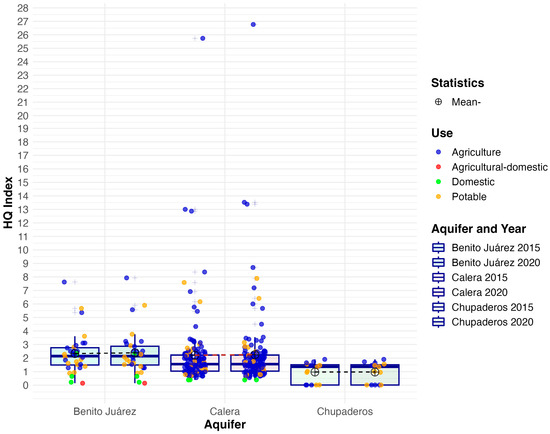
Figure 10.
Atypical distribution of HQ by aquifer.
There are no previous studies in the region to analyze the evolution of this index over the years, but we can compare this research with similar studies in other parts of the world. One of these are in Mezquital municipality, Durango, Mexico, where they found a mean HQ of 1.90 and concluded that the children are at risk to develop chronic systemic effects due to ingestion of As from water [29]. In an agricultural region of Nanganur, south India, they found Health risk caused by excessive intake of nitrate contaminated groundwater for children and infants were 1.15 and 1.75 times larger than that for adults, which suggested that health risk degree of infants have greater health risk than children and adults in the study region [45]. In Nanjing, China, where HQ values for single elements suggested potential non-carcinogenic health risk to children, but not to adults [46]. All of these studies concluded that they had a health risk zone calculated with HQ.
On the other hand, there are other investigations where the HQ is under one like in northeast Iran; the results of the HQ values of arsenic and heavy metals for combined pathways were below the safety level (HQ < 1) for adults [47].
3.3. Carcinogenic Risk (CR)
The CR is defined by the USEPA and refers to the probability of an individual developing cancer over a lifetime due to exposure to a particular carcinogenic substance. This risk assessment helps in understanding the potential impact of environmental pollutants and chemicals on public health. The calculation of the CR index was performed taking into account an average weight of an adult individual of 75 kg and a daily water intake of 2.4 L.
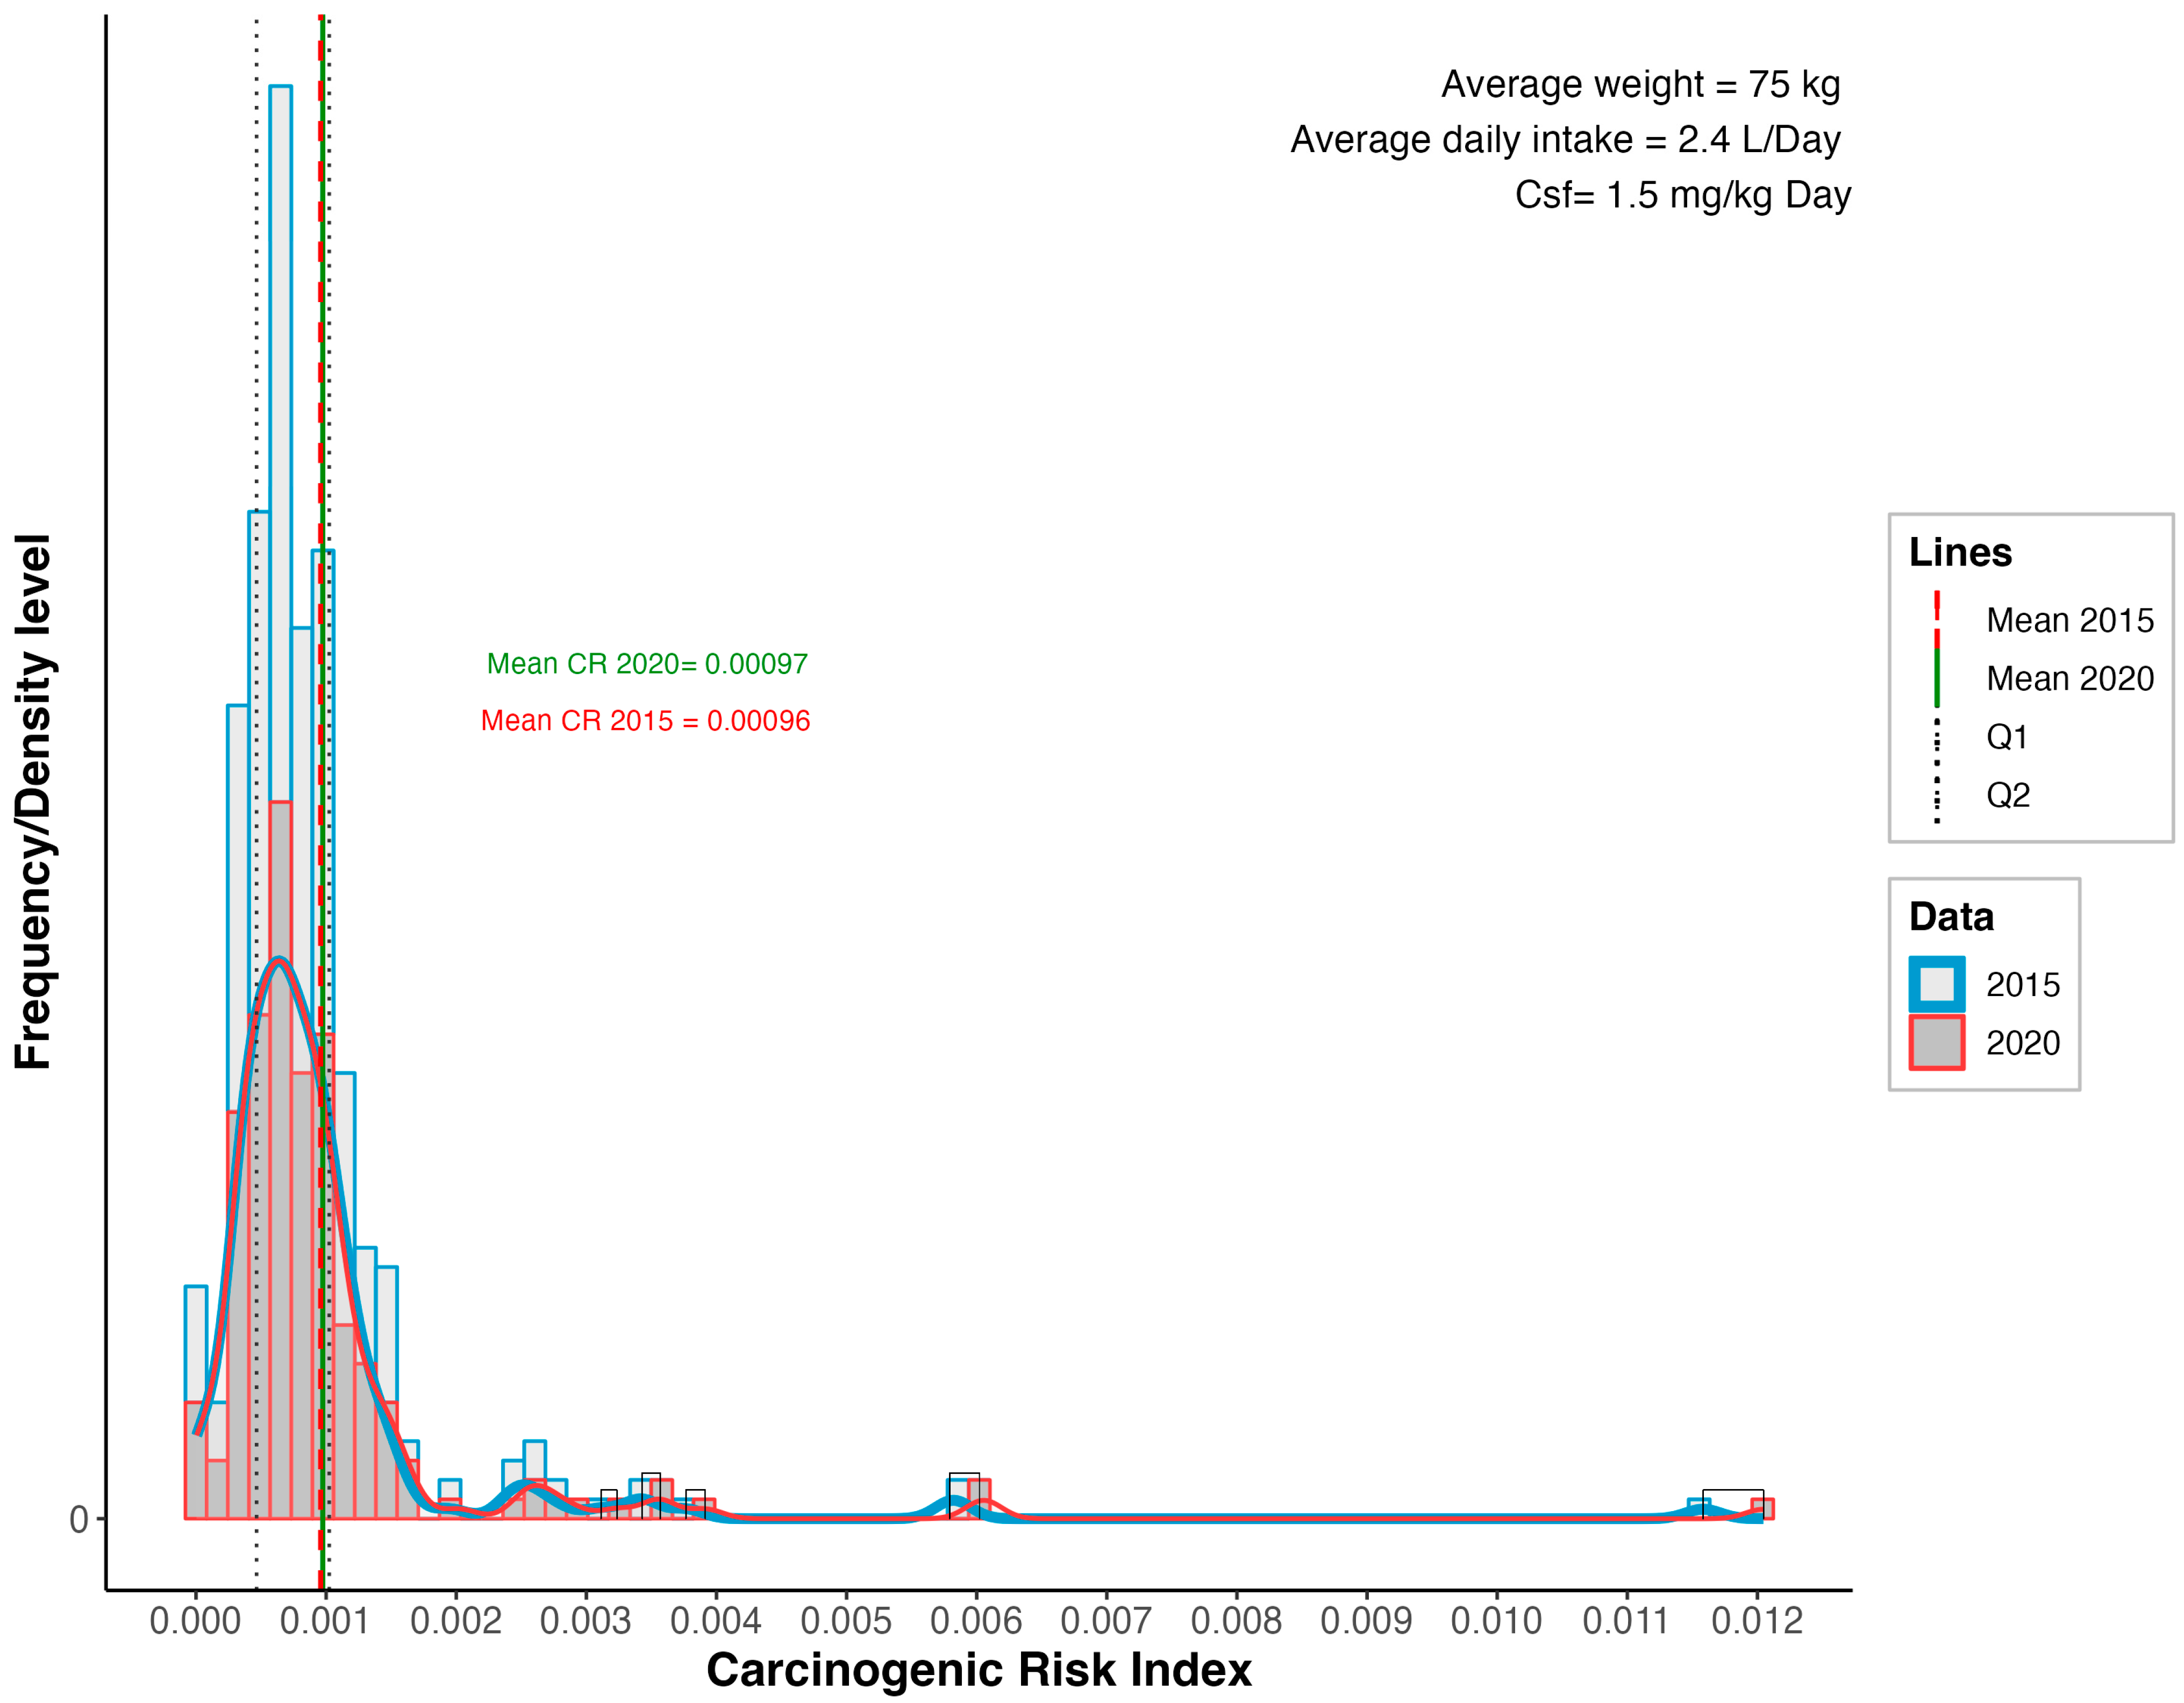
Ingestion of arsenic through drinking water is the primary exposure pathway. The USEPA has established a slope factor for arsenic. The slope factor for arsenic ingestion is typically around 1.5 (mg/kg-day)−1. This factor represents the increased CR per unit of arsenic exposure. The USEPA typically considers an excess CR of 1 in 1,000,000 (1 × 10⁻¹) as acceptable; values above 1 in 10,000 (1 × 10⁻⁴) are considered too high and potentially unsafe. The CR helps guide decisions about environmental safety and pollution control. If the calculated risk exceeds acceptable levels, regulatory measures such as setting maximum contaminant levels (MCLs), enforcing cleanup actions, and informing the public about the risks would be implemented. In Figure 11, it can be observed that the histogram of CR in the area, where the mean for 2015 and 2020 were 0.0009577 and 0.0009743, respectively, with an arithmetic ratio of 0.0000166 between both periods, and a median of 0.00072 for both years. The interquantile range was 0.0005583936, with values of 0.0004654464 and 0.00102384 in the second and third quartiles. The t-test was applied to compare the mean of the data distribution with the reference value of 1 × 10⁻⁶. The calculated indices were significantly higher than the reference value (p < 0.05), suggesting that the water from the aquifers may have a potential CR and therefore is not recommended for human consumption.
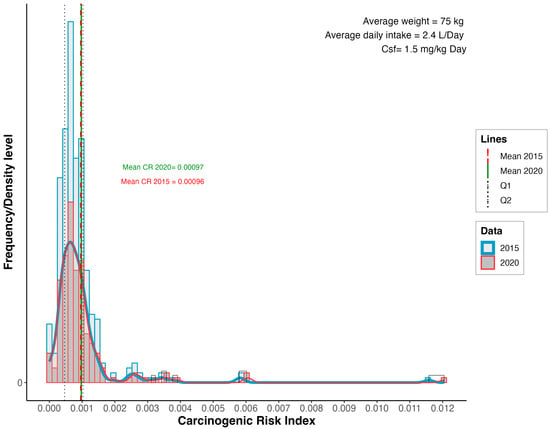
Figure 11.
Histogram of CR results in the study area.
By assessing the CR of arsenic in drinking water, regulatory agencies can ensure that drinking water supplies are safe and take necessary actions to mitigate risks, ultimately protecting public health from the adverse effects of arsenic exposure.
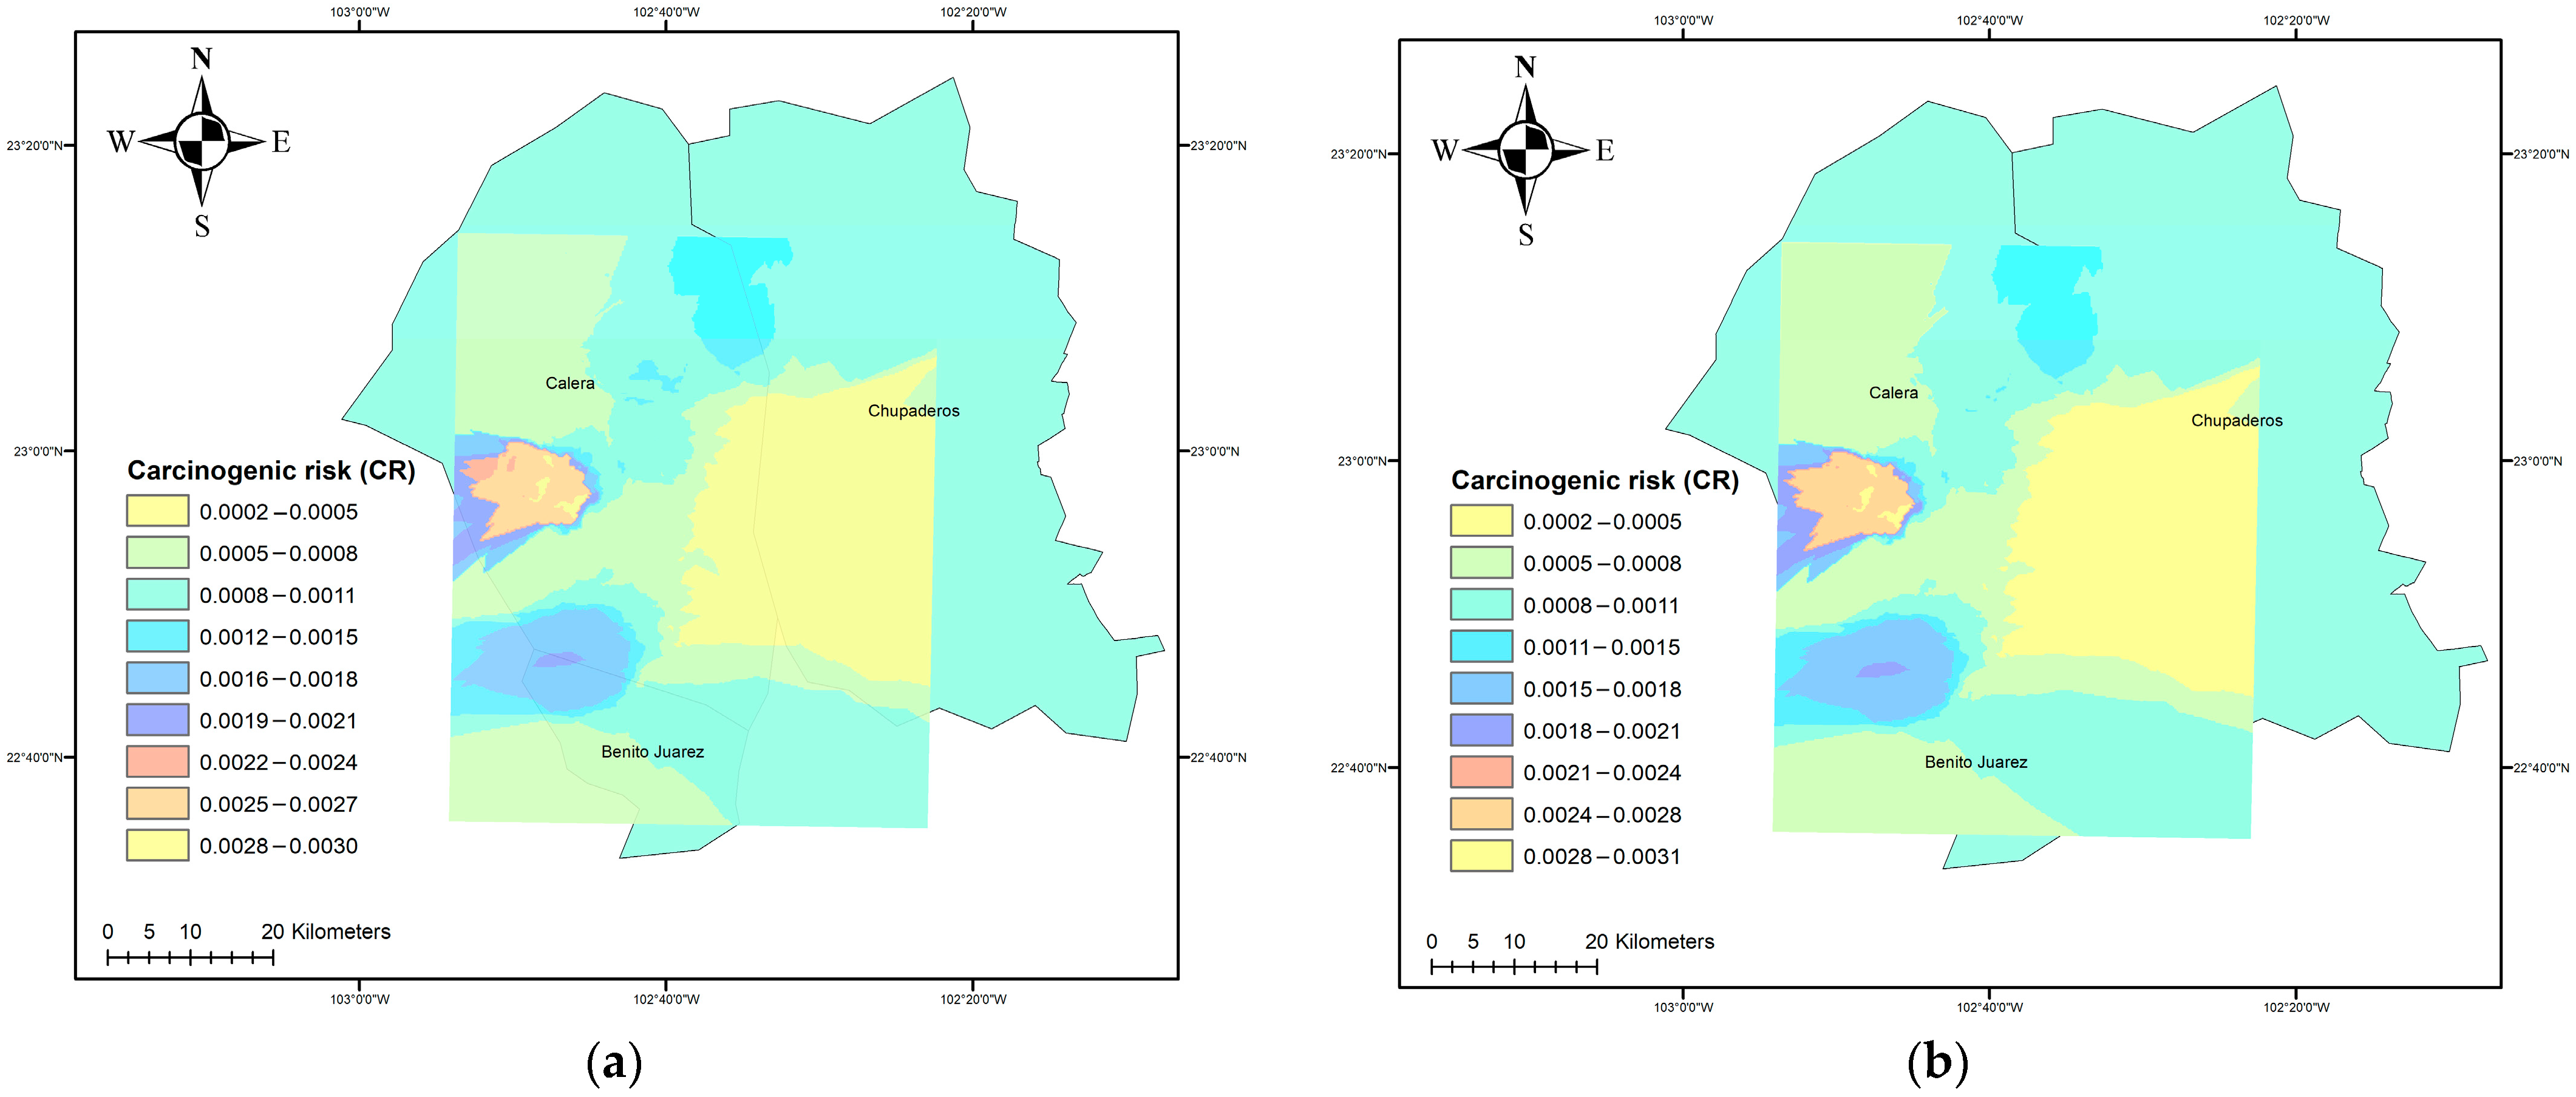
Figure 12 shows the spatial distribution of the CR index in the study area. The CR were above 0.0002, so it means there is an estimated chance of 2 in 10,000 that a person exposed to the chemical over a lifetime could develop cancer. According to the USEPA, acceptable cancer risks typically range from 1 in 1,000,000 (1 × 10⁻⁶) to 1 in 10,000 (1 × 10⁻⁴). Since 0.0002 equals 2 × 10⁻⁴, which is much higher than the acceptable limit, this level of risk is considered unacceptable and may require regulatory action or risk reduction measures to protect public health. It can be seen that this index increases for the year 2020, and, as mentioned above, a stain is created towards the west where the situation worsens. So attention should be paid to these places. Long-term exposure to carcinogens, even at low levels, can significantly increase the risk of developing cancer. Monitoring the CR index helps in identifying and mitigating these risks, thereby protecting the public from potential health hazards. Continuous monitoring allows the early detection of rising carcinogenic levels in drinking water, enabling timely interventions to reduce exposure and prevent health issues. Regular monitoring supports the enforcement of regulations and policies aimed at limiting carcinogen levels in the environment. This ensures that industries and other potential sources of contamination adhere to legal requirements.
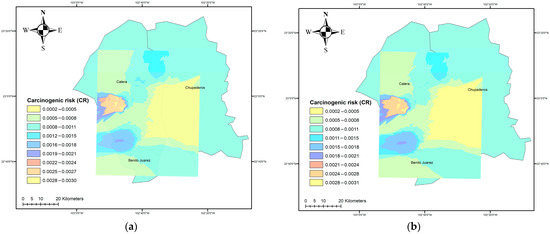
Figure 12.
Carcinogenic risk; (a) 2015 and (b) 2020.
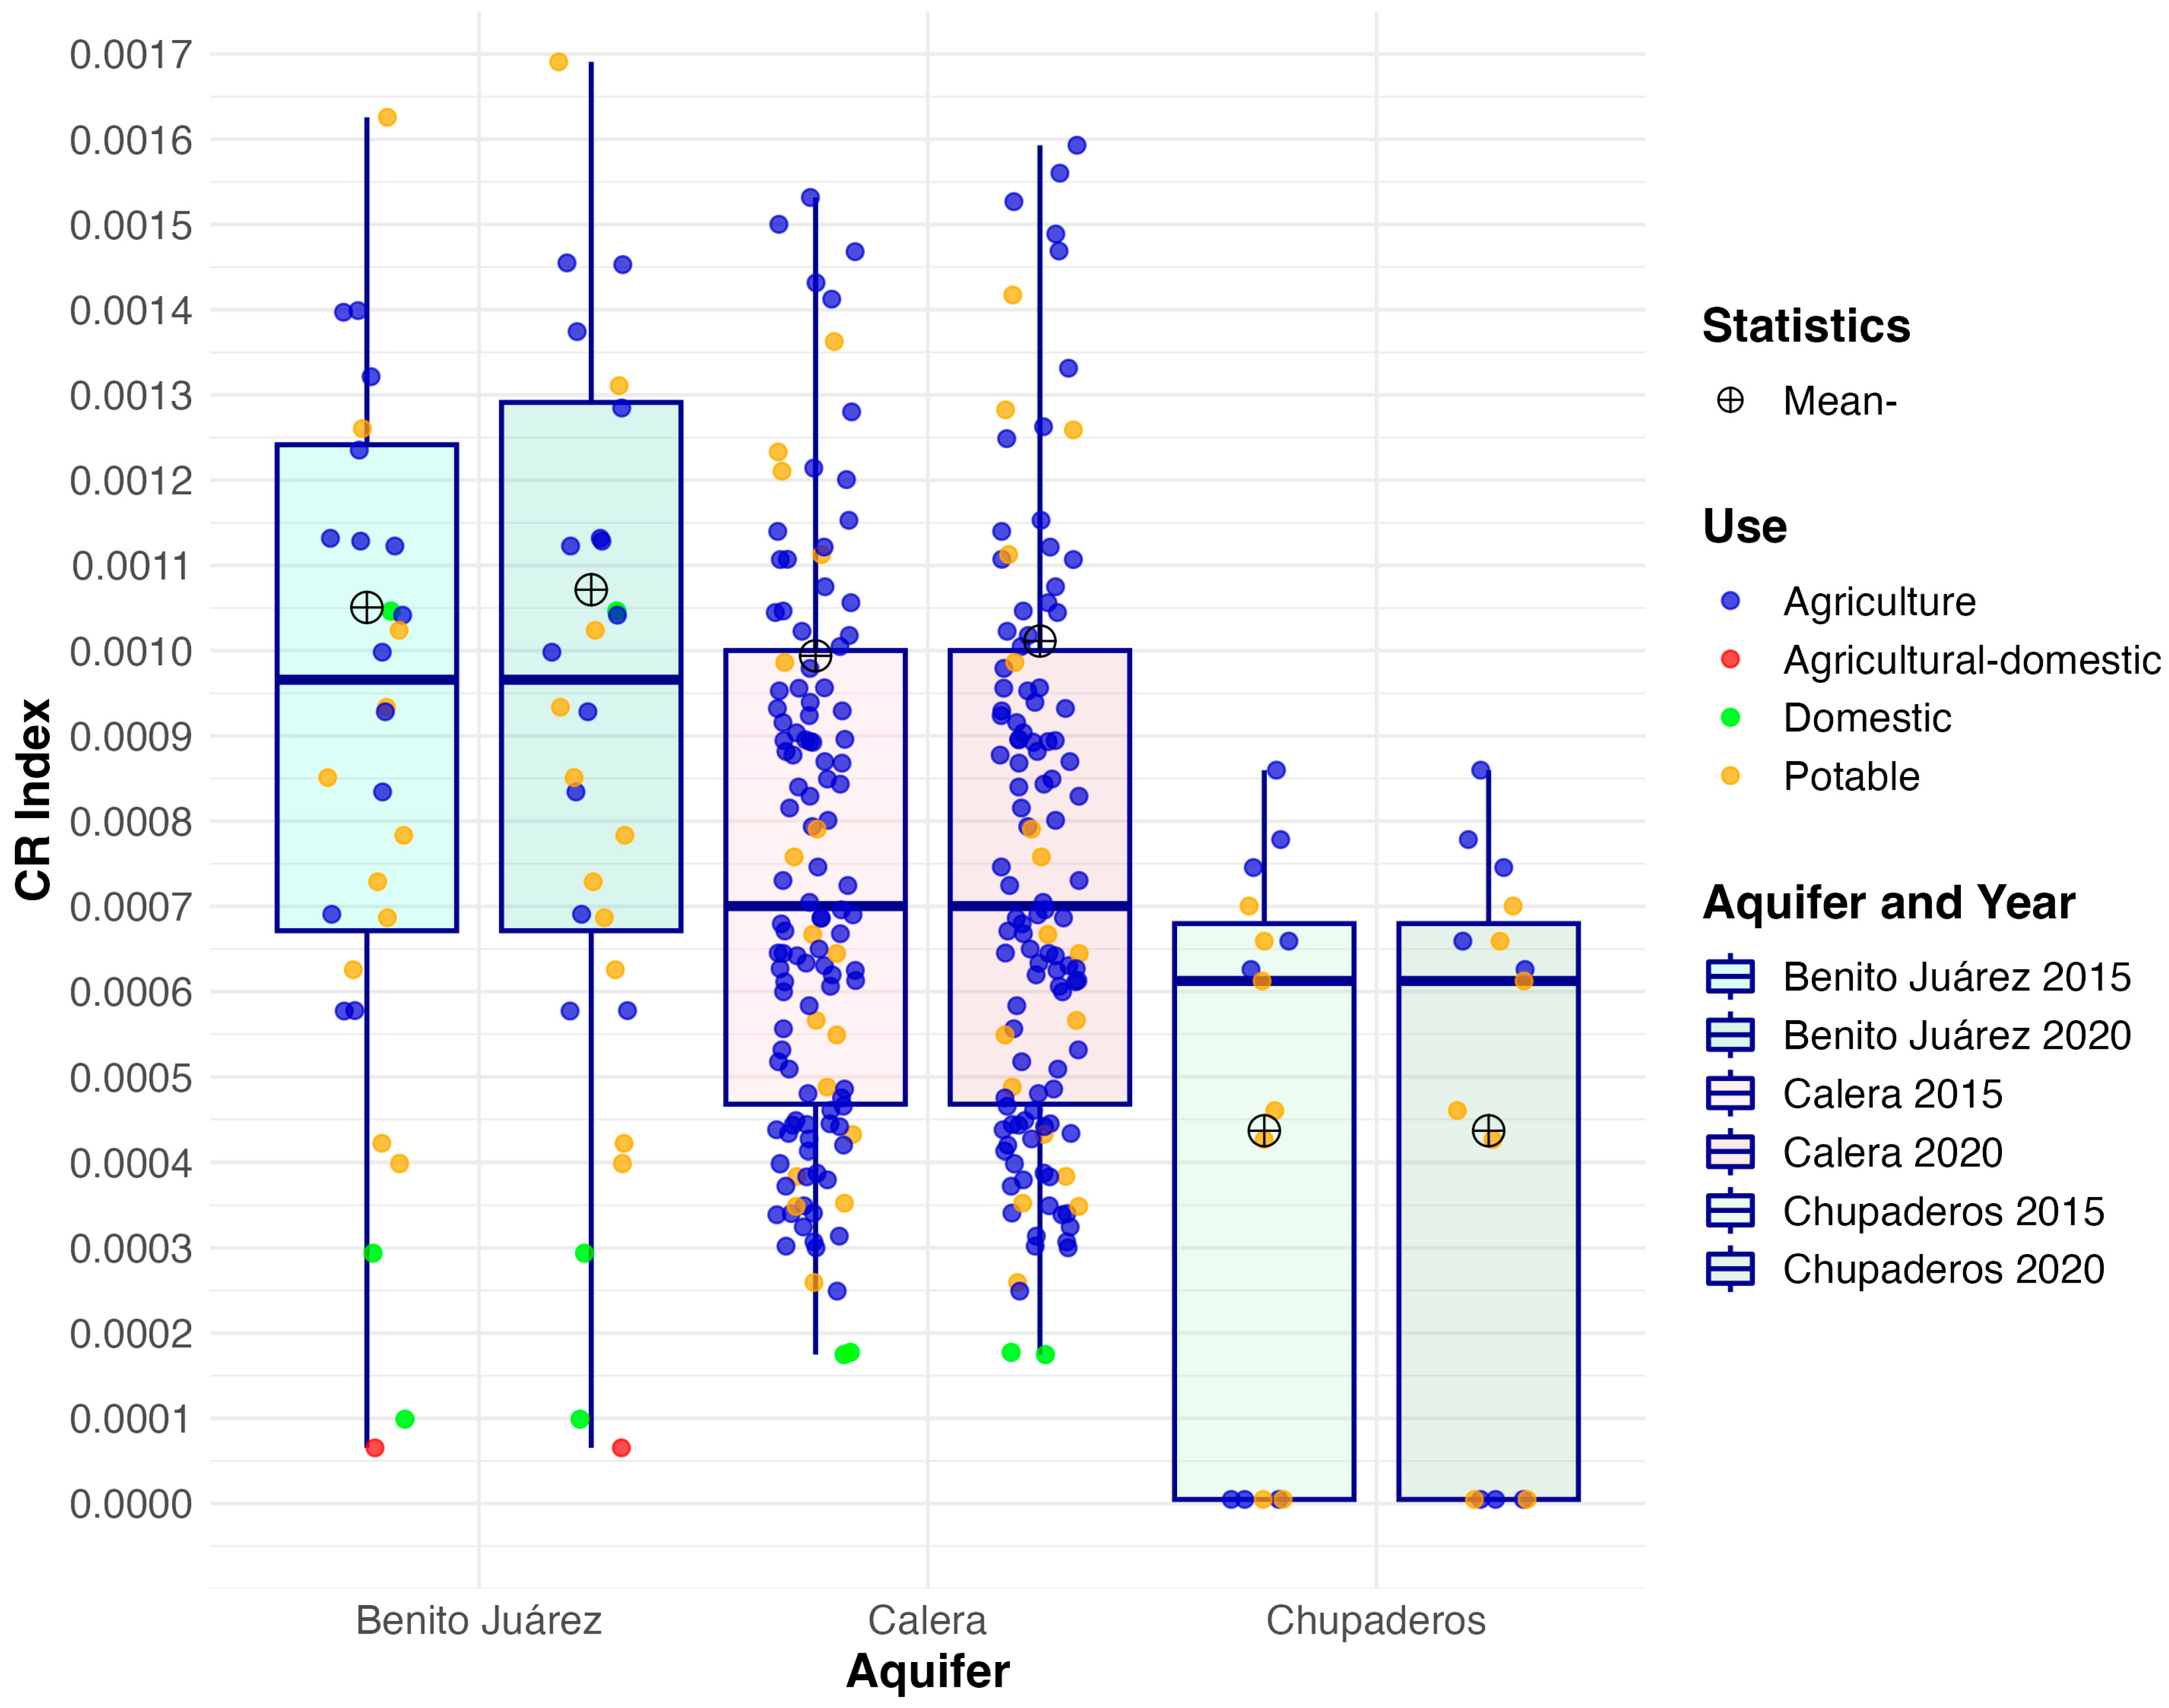
The average index per aquifer was 0.00105 in the Benito Juárez aquifer, 0.000994 in the Calera aquifer, and 0.000437 in the Chupaderos aquifer. In Benito Juárez, the highest index, in the second quartile (Q2), was observed with a value of 0.000966, while in Calera, the index in Q2 was 0.000700, and in Chupaderos, it was 0.000612, also in Q2. These values are further illustrated in the box-and-whisker plot (Figure 13), which shows the distribution of the index for each aquifer and highlights the Q2 values for both 2015 and 2020 samples. The distribution of CR indices remained consistent over the 2015–2020 time period, showing no significant changes.
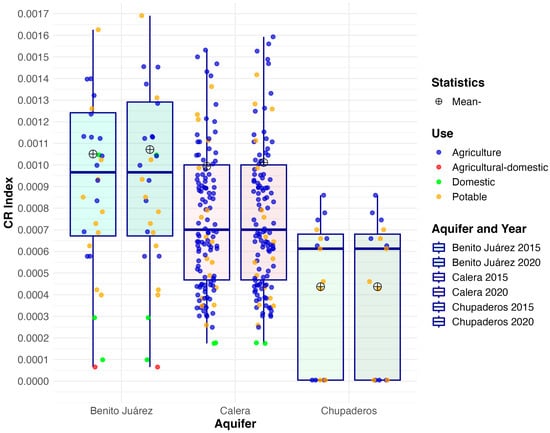
Figure 13.
Non atypical distribution of CR index by aquifer.
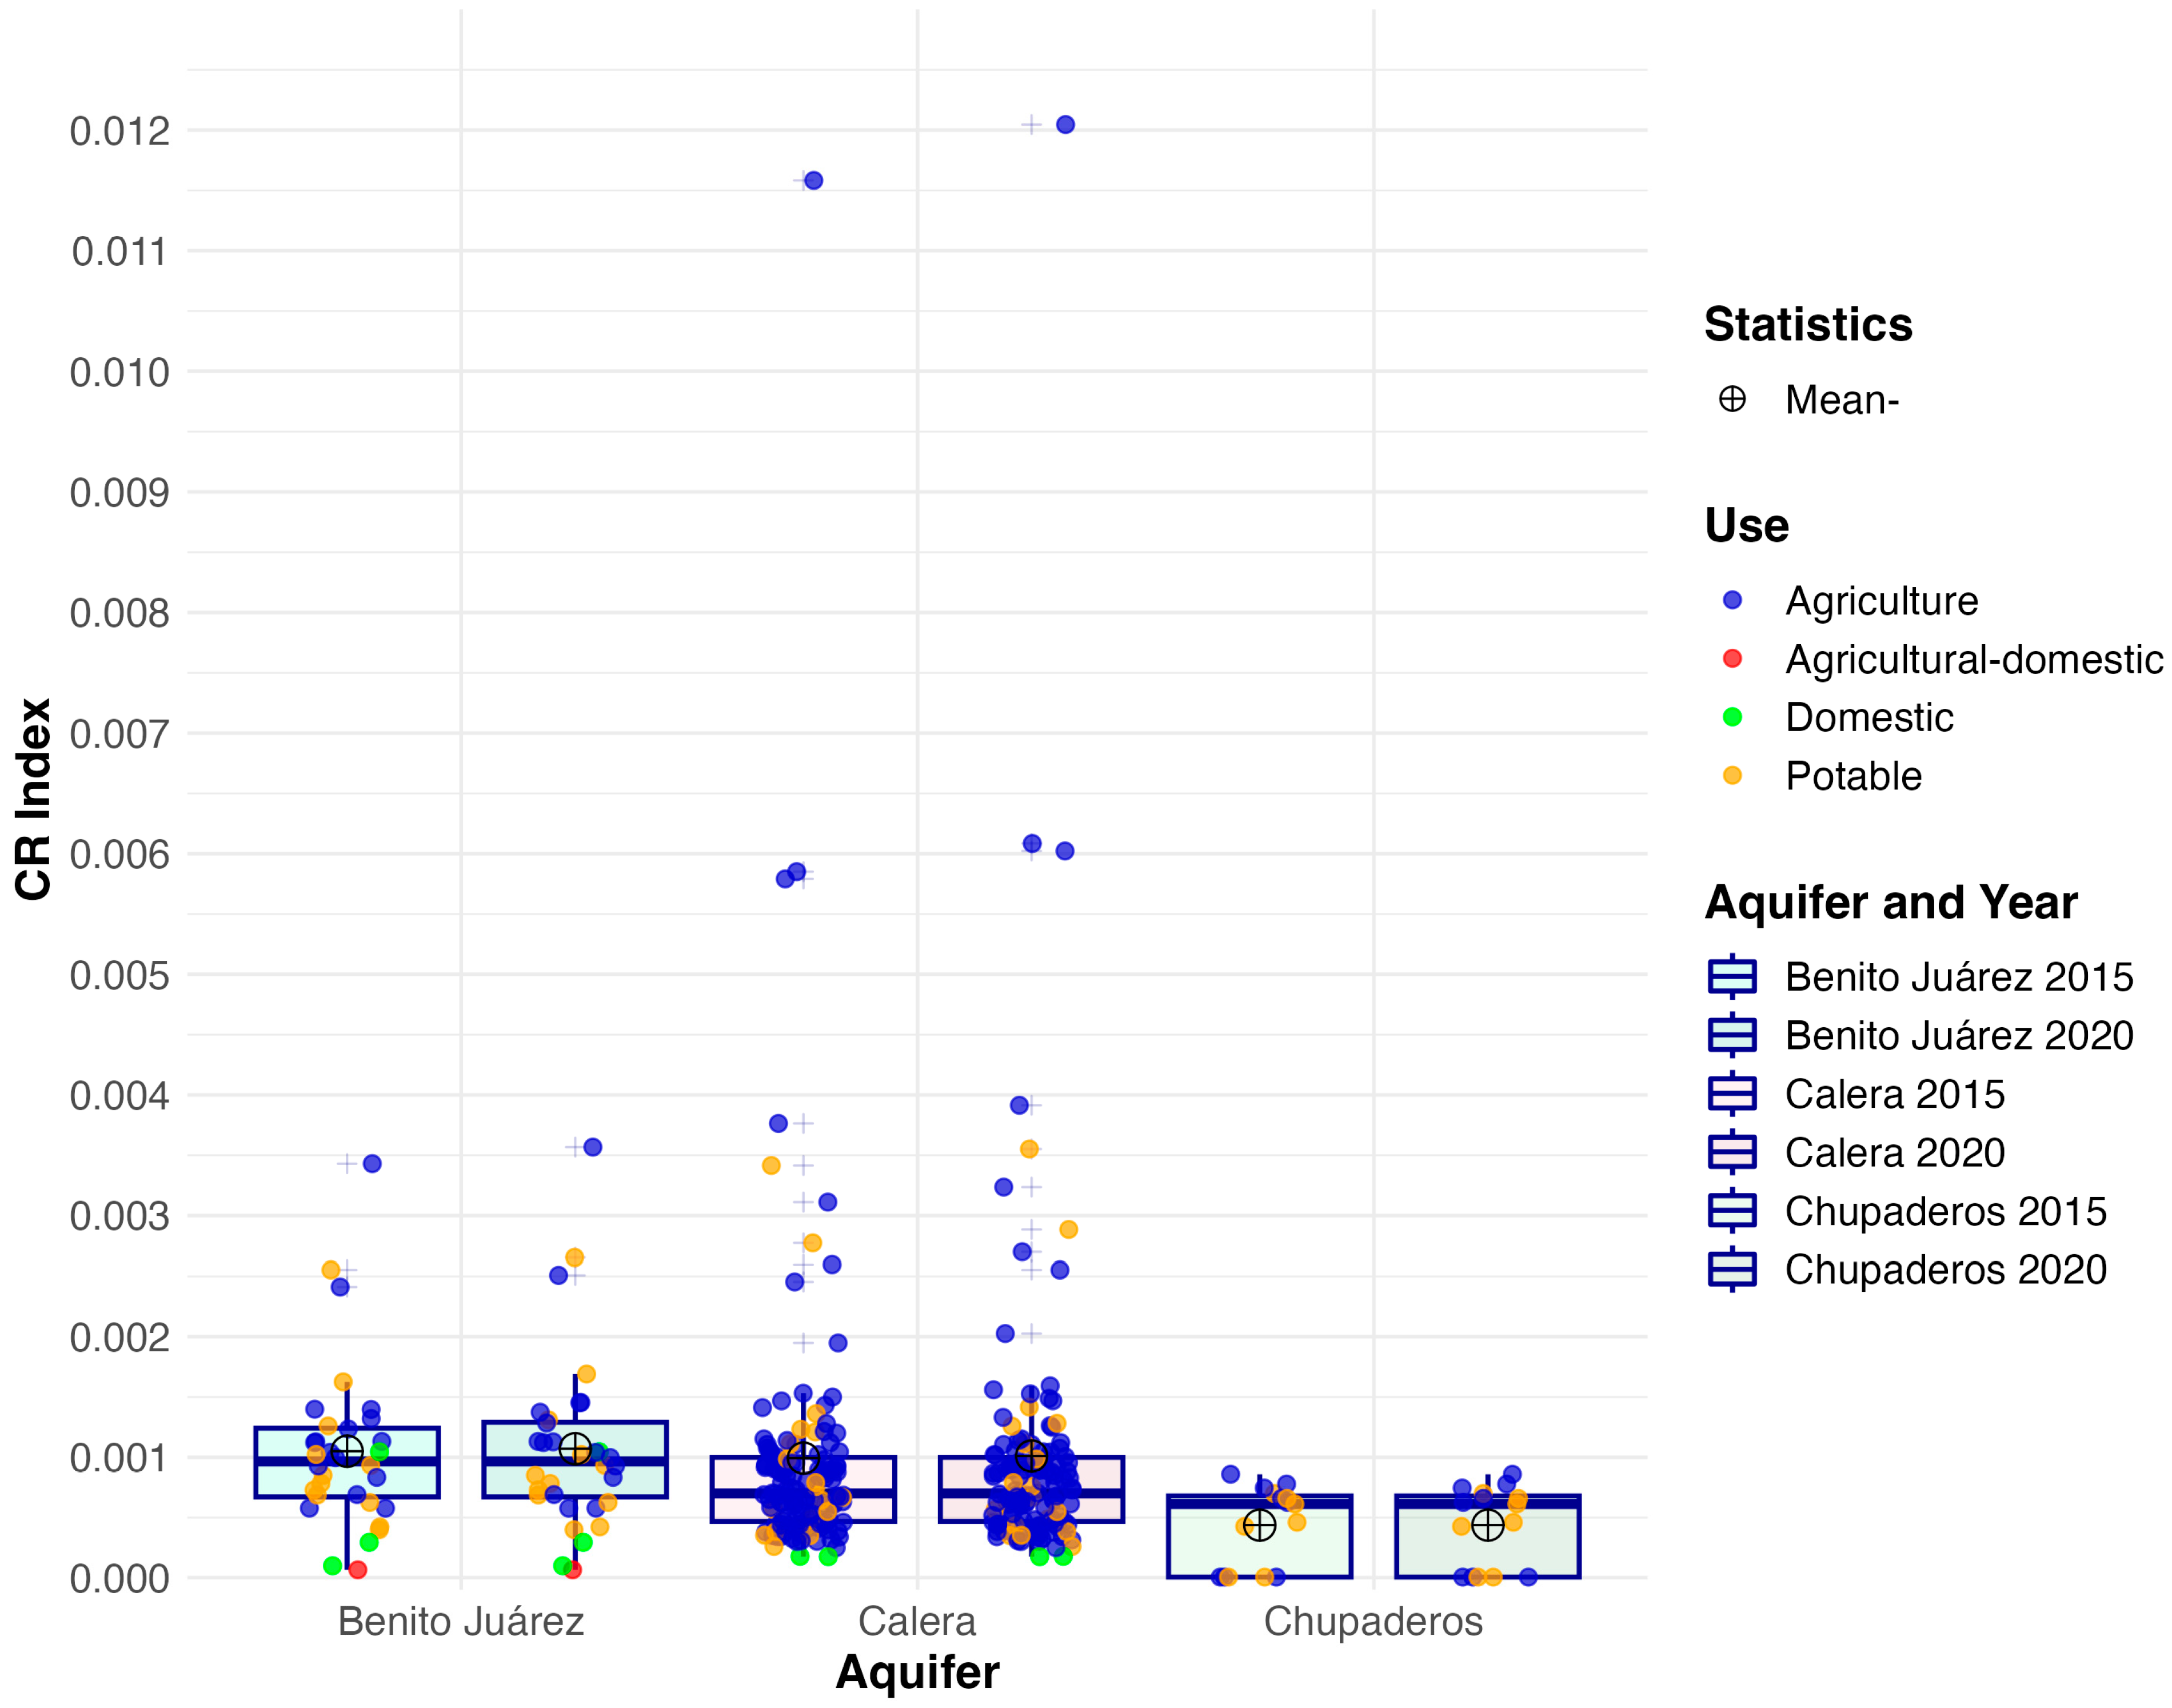
The distribution of the CR index by aquifer, including atypical values, is shown in Figure 14. Notably, the highest index corresponds to the aquifer with the highest arsenic concentration. For the 2015 sample, the maximum CR index was 0.0116 in the Calera aquifer, which was also the highest in the 2020 sample at 0.0120, as illustrated in this figure. This sample was one of the few to show an increase in value over time. Given that this peak was recorded in the same aquifer, it is important to mention that it indicates the well with the greatest risk for human consumption. This underscores the importance of continuous monitoring.
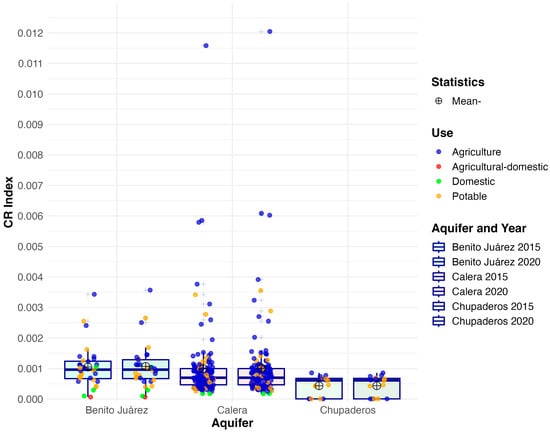
Figure 14.
Atypical distribution of CR index by aquifer.
The non-atypical distribution of CR index by aquifer for both years is shown in Figure 13, and the atypical distribution of CR index in Figure 14.
Monitoring the CR index for substances like arsenic in drinking water is crucial for the following reasons: public health protection, regulatory compliance, environmental protection, public awareness and trust, economic benefits, and scientific and technological advancements.
Several studies analyze the CR index as follows: in Slovak territory where CR levels (medium to high) were documented in approximately 0.2 and 11% of the total area [48]; in Jinghui irrigation district, China, where the CR of arsenic-affected adults reached 3.50 × 10⁻⁴ [49]; in peri-urban areas of Vehari, Pakistan, where the risk assessment parameters (mean CR: 0.0018) also showed possible CRs associated with ingestion of As-contaminated groundwater [50]; and in Sari city, Iran, where the CR values of Cr and As in the groundwater sources for children, teenagers, and adults were 0.0001, 0.00009, 0.00007, 0.0003, 0.0002, and 0.0001, respectively, causing a total CR value higher than the acceptable range [51].
Reducing exposure to carcinogens can decrease the incidence of cancer and other related diseases, ultimately lowering healthcare costs for individuals and the healthcare system.
While this study primarily focuses on quantifying arsenic levels and evaluating associated health risks, a comprehensive risk assessment should also consider potential mitigation and management strategies. All of this to guide decision-making and public health policy. Several remediation techniques are available to reduce arsenic concentrations in drinking water, including activated alumina adsorption, reverse osmosis, and ion exchange resins. All of which have demonstrated effectiveness in various rural and urban contexts. In parallel, integrated water management practices, such as well-switching, blending of low- and high-arsenic sources, and regular monitoring, can help minimize long-term exposure in affected communities. From a public health perspective, interventions should prioritize the identification and promotion of safe alternative water sources, community education on arsenic risks, and support for infrastructure development in vulnerable regions. Including these strategies enhances the practical relevance of our findings and aligns with best practices for risk communication and mitigation, as highlighted by recent literature [52,53,54,55,56].
This is a relevant investigation in both fields: scientifically and from a public health perspective. It addresses a critical issue—arsenic contamination in groundwater—which poses serious health risks. Focusing on a semiarid region in Mexico, it contributes important regional data. By including risk assessments (HQ and CR), methodological transparency, and practical mitigation strategies, our work not only advances scientific understanding but also supports real-world decision-making for safer water management. This type of research is essential for guiding public health interventions and can serve as a model for similar regions facing groundwater contamination.
4. Conclusions
In this research, the risk to human health related to exposure to concentration and temporal variation of arsenic in groundwater from a semiarid region of Mexico was analyzed.
The mean concentration for both years was of 0.02 mg/L of arsenic levels in groundwater and the median was 0.0151 and 0.02 mg/L, for 2015 and 2020, respectively. The average HQ for 2015 was 2.13 and for 2020 was 2.17. The HQ suggests that in a specific region it is urgent to make an investigation of risk management or remediation actions to reduce exposure and protect public health. Means of CR for 2015 and 2020 were 0.00096 and 0.00097, respectively, and a median of 0.00072 for both years. The level of CR is considered unacceptable and may require regulatory action or risk reduction measures to protect public health. The non-parametric test used to compare the distributions did not reveal any significant differences over the time interval considered (p > 0.05).
There is a specific zone where arsenic concentrations in groundwater increase, as well as HQ and CR. Consequently, it worsens over time, so we must pay close attention to this region to implement the necessary measures to improve public health and the quality of life of the population.
Arsenic concentrations remained stable during the 2015–2020 period, with no significant changes observed. However, it is important to highlight that the calculated HQ and CR indices consistently exceeded the reference values. For this reason, continuous monitoring of this chemical element’s concentrations is essential due to its varied uses. Such as agriculture, human consumption, and domestic applications. Therefore, ongoing studies on the water quality from different locations in the state of Zacatecas, focusing on the presence of chemical elements and their temporal variations, remain of significant importance, as this water continues to be utilized in various ways.
Measuring HQ and CR is important because they help assess whether exposure to chemical substances in the environment poses a threat to human health. HQ helps identify the potential for non-cancer health effects, such as respiratory or neurological damage, by comparing exposure levels to known safe limits. CR estimates the probability of developing cancer over a lifetime due to long-term exposure to carcinogenic substances. These indicators guide governments, industries, and public health agencies in making informed decisions about environmental safety, pollution control, and risk management, ensuring that people are not exposed to harmful levels of toxic chemicals in air, water, soil, or food.
Continuous monitoring provides valuable data for scientific research, helping to improve our understanding of the effects of carcinogens and the development of better mitigation strategies. Monitoring programs drive innovation in detection and purification technologies, leading to more efficient and effective ways to manage water quality.
Author Contributions
Conceptualization, J.O.L. and J.G.T.; methodology, J.O.L., M.E.P.V. and J.G.T.; formal analysis, J.O.L., A.R.C.R. and M.E.P.V.; investigation, J.O.L.; data curation, J.O.L., A.I.V.G. and M.E.P.V.; writing—original draft preparation, J.O.L., M.E.P.V. and J.G.T.; writing—review and editing, J.O.L., M.E.P.V., H.E.J.-F., S.D.H. and J.G.T.; project administration, H.E.J.-F., C.O.R.R. and J.G.T. All authors have read and agreed to the published version of the manuscript.
Funding
This research received no funding.
Data Availability Statement
No new data were created or analyzed in this study. Data sharing is not applicable to this article. The data supporting the findings of this study are not publicly available due to privacy restrictions.
Acknowledgments
We deeply appreciate the recommendation and professional comments from the reviewers and the editor. The authors have reviewed and edited the output and take full responsibility for the content of this publication.
Conflicts of Interest
The authors declare no competing interests associated with this research. Competing interests may include financial relationships, employment, or personal affiliations that could potentially bias the study’s findings or interpretation. The funders had no role in the design of the study, in the collection, analyses, or interpretation of data, in the writing of the manuscript, or in the decision to publish the results.
Abbreviations
The following abbreviations are used in this manuscript:
| As | Arsenic |
| AAS | Administrative Aquifers |
| HQ | Hazard Quotient |
| ADD | Daily Dose |
| RFD | Reference Dose |
| CR | Carcinogenic Risk |
| CFS | Cancer Slope Factor |
References
- Boonkaewwan, S.; Sonthiphand, P.; Chotpantarat, S. Mechanisms of arsenic contamination associated with hydrochemical characteristics in coastal alluvial aquifers using multivariate statistical technique and hydrogeochemical modeling: A case study in Rayong province, eastern Thailand. Environ. Geochem. Health 2021, 43, 537–566. [Google Scholar] [CrossRef] [PubMed]
- Foust, R.D.; Mohapatra, P.; Compton-O’Brien, A.M.; Reifel, J. Groundwater arsenic in the Verde Valley in central Arizona, USA. Appl. Geochem. 2004, 19, 251–255. [Google Scholar] [CrossRef]
- Powers, M.; Yracheta, J.; Harvey, D.; O’Leary, M.; Best, L.G.; Black Bear, A.; MacDonald, L.; Susan, J.; Hasan, K.; Thomas, E.; et al. Arsenic in groundwater in private wells in rural North Dakota and South Dakota: Water quality assessment for an intervention trial. Environ. Res. 2019, 168, 41–47. [Google Scholar] [CrossRef] [PubMed]
- Alipour, E.; Aghapour, A.A.; Bahrami Asl, F. Concentration, spatial distribution, and non-carcinogenic risk assessment of arsenic, cadmium, chromium, and lead in drinking water in rural areas of eight cities of West Azarbaijan province, Iran. Environ. Sci. Pollut. Res. 2024, 31, 20222–20233. [Google Scholar] [CrossRef] [PubMed]
- Camacho, L.M.; Gutiérrez, M.; Alarcón-Herrera, M.T.; Villalba, M.d.L.; Deng, S. Occurrence and treatment of arsenic in groundwater and soil in northern Mexico and southwestern USA. Chemosphere 2011, 83, 211–225. [Google Scholar] [CrossRef] [PubMed]
- Alarcón-Herrera, M.T.; Bundschuh, J.; Nath, B.; Nicolli, H.B.; Gutierrez, M.; Reyes-Gomez, V.M.; Nuñez, D.; Martín-Dominguez, I.R.; Sracek, O. Co-occurrence of arsenic and fluoride in groundwater of semi-arid regions in Latin America: Genesis, mobility and remediation. J. Hazard. Mater. 2013, 262, 960–969. [Google Scholar] [CrossRef] [PubMed]
- Kumarathilaka, P.; Seneweera, S.; Meharg, A.; Bundschuh, J. Arsenic speciation dynamics in paddy rice soil-water environment: Sources, physico-chemical, and biological factors—A review. Water Res. 2018, 140, 403–414. [Google Scholar] [CrossRef] [PubMed]
- Tume, P.; Melipichún, T.; Ferraro, F.; Sepúlveda, B.; Roca, N.; Bech, J. Contamination of As, Cd, Cr, Hg and Pb in soils in Arica commune (Chile). Environ. Geochem. Health 2023, 45, 9199–9213. [Google Scholar] [CrossRef] [PubMed]
- Patel, K.S.; Pandey, P.K.; Martín-Ramos, P.; Corns, W.T.; Varol, S.; Bhattacharya, P.; Zhu, Y. A review on arsenic in the environment: Contamination, mobility, sources, and exposure. RSC Adv. 2023, 13, 8803–8821. [Google Scholar] [CrossRef] [PubMed]
- Raju, N.J. Arsenic in the geo-environment: A review of sources, geochemical processes, toxicity and removal technologies. Environ. Res. 2022, 203, 111782. [Google Scholar] [CrossRef] [PubMed]
- Fazi, S.; Amalfitano, S.; Casentini, B.; Davolos, D.; Pietrangeli, B.; Crognale, S.; Lotti, F.; Rossetti, S. Arsenic removal from naturally contaminated waters: A review of methods combining chemical and biological treatments. Rend. Lincei 2016, 27, 51–58. [Google Scholar] [CrossRef]
- Chen, Y.f.; He, M.x.; Feng, H.m.; Liu, Q.; Chen, J.x.; Li, T. Health risk study of cadmium, chromium, lead and arsenic in reservoir water of Changzhou, China. J. Environ. Sci. Health Part A 2023, 58, 680–693. [Google Scholar] [CrossRef] [PubMed]
- Kanel, S.R.; Das, T.K.; Varma, R.S.; Kurwadkar, S.; Chakraborty, S.; Joshi, T.P.; Bezbaruah, A.N.; Nadagouda, M.N. Arsenic Contamination in Groundwater: Geochemical Basis of Treatment Technologies. ACS Environ. Au 2023, 3, 135–152. [Google Scholar] [CrossRef] [PubMed]
- Planer-Friedrich, B.; Armienta, M.A.; Merkel, B.J. Origin of arsenic in the groundwater of the Rioverde basin, Mexico. Environ. Geol. 2001, 40, 1290–1298. [Google Scholar] [CrossRef]
- Costa, M. Review of arsenic toxicity, speciation and polyadenylation of canonical histones. Toxicol. Appl. Pharmacol. 2019, 375, 1–4. [Google Scholar] [CrossRef] [PubMed]
- Rasheed, H.; Kay, P.; Slack, R.; Gong, Y.Y.; Carter, A. Human exposure assessment of different arsenic species in household water sources in a high risk arsenic area. Sci. Total Environ. 2017, 584–585, 631–641. [Google Scholar] [CrossRef] [PubMed]
- U.S. EPA. 2010 U.S. Environmental Protection Agency (EPA) Decontamination Research and Development Conference; U.S. Environmental Protection Agency: Washington, DC, USA, 2011.
- Basu, A.; Saha, D.; Saha, R.; Ghosh, T.; Saha, B. A review on sources, toxicity and remediation technologies for removing arsenic from drinking water. Res. Chem. Intermed. 2014, 40, 447–485. [Google Scholar] [CrossRef]
- Lapworth, D.; Boving, T.; Brauns, B.; Dottridge, J.; Hynds, P.; Kebede, S.; Kreamer, D.; Misstear, B.; Mukherjee, A.; Re, V.; et al. Groundwater quality: Global challenges, emerging threats and novel approaches. Hydrogeol. J. 2023, 31, 15–18. [Google Scholar] [CrossRef]
- World Health Organization (WHO). Guidelines for Drinking-Water Quality, 4th ed.; World Health Organization: Geneva, Switzerland, 2011; Available online: https://www.who.int/publications/i/item/9789241548151 (accessed on 26 June 2025).
- Nickson, R.; McArthur, J.; Burgess, W.; Matin Ahmed, K.; Ravenscroft, P.; Rahman, M. Arsenic poisoning of Bangladesh groundwater. Nature 1998, 395, 338. [Google Scholar] [CrossRef] [PubMed]
- Ullah, Z.; Rashid, A.; Ghani, J.; Talib, M.A.; Shahab, A.; Lun, L. Arsenic Contamination, Water Toxicity, Source Apportionment, and Potential Health Risk in Groundwater of Jhelum Basin, Punjab, Pakistan. Biol. Trace Elem. Res. 2022, 201, 514–524. [Google Scholar] [CrossRef] [PubMed]
- Liu, B.; Kim, K.H.; Kumar, V.; Kim, S. A review of functional sorbents for adsorptive removal of arsenic ions in aqueous systems. J. Hazard. Mater. 2020, 388, 121815. [Google Scholar] [CrossRef] [PubMed]
- Kim, D.Y.; Jeon, H.; Shin, H.S. Risk Assessment and Determination of Arsenic and Heavy Metals in Fishery Products in Korea. Foods 2023, 12, 3750. [Google Scholar] [CrossRef] [PubMed]
- Jaafarzadeh, N.; Poormohammadi, A.; Almasi, H.; Ghaedrahmat, Z.; Rahim, F.; Zahedi, A. Arsenic in drinking water and kidney cancer: A systematic review. Rev. Environ. Health 2023, 38, 255–263. [Google Scholar] [CrossRef] [PubMed]
- Samiee, F.; Leili, M.; Faradmal, J.; Torkshavand, Z.; Asadi, G. Exposure to arsenic through breast milk from mothers exposed to high levels of arsenic in drinking water: Infant risk assessment. Food Control 2019, 106, 106–669. [Google Scholar] [CrossRef]
- Zhao, C.; Yang, J.; Zheng, Y.; Yang, J.; Guo, G.; Wang, J.; Chen, T. Effects of environmental governance in mining areas: The trend of arsenic concentration in the environmental media of a typical mining area in 25 years. Chemosphere 2019, 235, 849–857. [Google Scholar] [CrossRef] [PubMed]
- Zhao, X.; Guo, H.; Wang, Y.; Wang, G.; Wang, H.; Zang, X.; Zhu, J. Groundwater hydrogeochemical characteristics and quality suitability assessment for irrigation and drinking purposes in an agricultural region of the North China plain. Environ. Earth Sci. 2021, 80, 162. [Google Scholar] [CrossRef]
- Molina-Frechero, N.; Nevarez-Rascón, M.; Tremillo-Maldonado, O.; Vergara-Onofre, M.; Gutiérrez-Tolentino, R.; Gaona, E.; Castañeda, E.; Jarquin-Yañez, L.; Bologna-Molina, R. Environmental exposure of arsenic in groundwater associated to carcinogenic risk in underweight children exposed to fluorides. Int. J. Environ. Res. Public Health 2020, 17, 724. [Google Scholar] [CrossRef] [PubMed]
- Alejandro, I.; Guerrero, P. Evaluación de las Pérdidas de Transmisión y su Efecto en la Recarga de Agua Subterránea. Ph.D. Thesis, Universidad Autónoma de Zacatecas, Zacatecas, Mexico, 2020. [Google Scholar]
- Anuard, P.-G.; Julián, G.-T.; Hugo, J.-F.; Carlos, B.-C.; Arturo, H.-A.; Edith, O.-T.; Claudia, Á.-S. Integration of Isotopic (2H and 18O) and Geophysical Applications to Define a Groundwater Conceptual Model in Semiarid Regions. Water 2019, 11, 488. [Google Scholar] [CrossRef]
- Comisión Nacional del Agua. Actualización de la Disponibilidad Media Anual de Agua en el Acuífero Calera (3225), Estado de Zacatecas; Diario Oficial de la Federación: Mexico City, Mexico, 2018.
- Varsányi, I. Arsenic in Deep Groundwater. In Water-Rock Interaction (WRI-6), Proceedings of the 6th International Symposium, Malvern, UK, 3–6 August 1989; Miles, D.L., Ed.; CRC Press: Boca Raton, FL, USA, 1989; pp. 715–718. ISBN 9789061919704. [Google Scholar]
- Tyagi, S.; Sharma, B.; Singh, P.; Dobhal, R. Water Quality Assessment in Terms of Water Quality Index. Am. J. Water Resour. 2020, 1, 34–38. [Google Scholar] [CrossRef]
- Litter, M.I.; Ingallinella, A.M.; Olmos, V.; Savio, M.; Difeo, G.; Botto, L.; Torres, E.M.F.; Taylor, S.; Frangie, S.; Herkovits, J.; et al. Arsenic in Argentina: Technologies for arsenic removal from groundwater sources, investment costs and waste management practices. Sci. Total Environ. 2019, 690, 778–789. [Google Scholar] [CrossRef] [PubMed]
- Sohrabi, N.; Kalantari, N.; Amiri, V.; Saha, N.; Berndtsson, R.; Bhattacharya, P.; Ahmad, A. A probabilistic-deterministic analysis of human health risk related to the exposure to potentially toxic elements in groundwater of Urmia coastal aquifer (NW of Iran) with a special focus on arsenic speciation and temporal variation. Stoch. Environ. Res. Risk Assess. 2021, 35, 1509–1528. [Google Scholar] [CrossRef]
- Fadel, M.; Courcot, D.; Afif, C.; Ledoux, F. Methods for the assessment of health risk induced by contaminants in atmospheric particulate matter: A review. Environ. Chem. Lett. 2022, 20, 3289–3311. [Google Scholar] [CrossRef]
- Letechipia, J.O.; González-Trinidad, J.; Júnez-Ferreira, H.E.; Bautista-Capetillo, C.; Robles-Rovelo, C.O.; Rodríguez, A.R.C.; Dávila-Hernández, S. Aqueous Arsenic Speciation with Hydrogeochemical Modeling and Correlation with Fluorine in Groundwater in a Semiarid Region of Mexico. Water 2022, 14, 519. [Google Scholar] [CrossRef]
- Ortiz-Letechipia, J.; González-Trinidad, J.; Júnez-Ferreira, H.E.; Bautista-Capetillo, C.; Dávila-Hernández, S. Evaluation of groundwater quality for human consumption and irrigation in relation to arsenic concentration in flow systems in a semi-arid mexican region. Int. J. Environ. Res. Public Health 2021, 18, 8045. [Google Scholar] [CrossRef] [PubMed]
- Bundschuh, J.; Litter, M.I.; Parvez, F.; Román-Ross, G.; Nicolli, H.B.; Jean, J.S.; Liu, C.W.; López, D.; Armienta, M.A.; Guilherme, L.R.G.; et al. One century of arsenic exposure in Latin America: A review of history and occurrence from 14 countries. Sci. Total Environ. 2012, 429, 2–35. [Google Scholar] [CrossRef] [PubMed]
- Litter, M.I.; Armienta, M.A.; Villanueva Estrada, R.E.; Villaamil Lepori, E.C.; Olmos, V. Arsenic in Latin America: Part II BT—Arsenic in Drinking Water and Food; Srivastava, S., Ed.; Springer: Singapore, 2020; pp. 113–182. ISBN 978-981-13-8587-2. [Google Scholar]
- Navarro, O.; González, J.; Júnez-Ferreira, H.E.; Bautista, C.-F.; Cardona, A. Correlation of Arsenic and Fluoride in the Groundwater for Human Consumption in a Semiarid Region of Mexico. Procedia Eng. 2017, 186, 333–340. [Google Scholar] [CrossRef]
- García-Rico, L.; Valenzuela-Rodríguez, M.P.; Meza-Montenegro, M.M.; Lopez-Duarte, A.L. Arsenic in rice and rice products in Northwestern Mexico and health risk assessment. Food Addit. Contam. Part B Surveill. 2020, 13, 25–33. [Google Scholar] [CrossRef] [PubMed]
- Cruz-Ayala, M.B.; Megdal, S.B. An Overview of Managed Aquifer Recharge in Mexico and Its Legal Framework. Water 2020, 12, 474. [Google Scholar] [CrossRef]
- Adimalla, N.; Qian, H. Groundwater quality evaluation using water quality index (WQI) for drinking purposes and human health risk (HHR) assessment in an agricultural region of Nanganur, south India. Ecotoxicol. Environ. Saf. 2019, 176, 153–161. [Google Scholar] [CrossRef] [PubMed]
- Hu, X.; Zhang, Y.; Luo, J.; Wang, T.; Lian, H.; Ding, Z. Bioaccessibility and health risk of arsenic, mercury and other metals in urban street dusts from a mega-city, Nanjing, China. Environ. Pollut. 2011, 159, 1215–1221. [Google Scholar] [CrossRef] [PubMed]
- Alidadi, H.; Tavakoly Sany, S.B.; Zarif Garaati Oftadeh, B.; Mohamad, T.; Shamszade, H.; Fakhari, M. Health risk assessments of arsenic and toxic heavy metal exposure in drinking water in northeast Iran. Environ. Health Prev. Med. 2019, 24. [Google Scholar] [CrossRef] [PubMed]
- Rapant, S.; Krěmová, K. Health risk assessment maps for arsenic groundwater content: Application of national geochemical databases. Environ. Geochem. Health 2007, 29, 131–141. [Google Scholar] [CrossRef] [PubMed]
- Hamidian, A.H.; Razeghi, N.; Zhang, Y.; Yang, M. Spatial distribution of arsenic in groundwater of Iran, a review. J. Geochemical Explor. 2019, 201, 88–98. [Google Scholar] [CrossRef]
- Shah, A.H.; Shahid, M.; Khalid, S.; Natasha; Shabbir, Z.; Bakhat, H.F.; Murtaza, B.; Farooq, A.; Akram, M.; Shah, G.M. Assessment of arsenic exposure by drinking well water and associated carcinogenic risk in peri-urban areas of Vehari, Pakistan. Environ. Geochem. Health 2020, 42, 121–133. [Google Scholar] [CrossRef] [PubMed]
- Niknejad, H.; Ala, A.; Ahmadi, F.; Mahmoodi, H.; Saeedi, R.; Gholami-Borujeni, F.; Abtahi, M. Carcinogenic and non-carcinogenic risk assessment of exposure to trace elements in groundwater resources of Sari city, Iran. J. Water Health 2023, 21, 501–513. [Google Scholar] [CrossRef] [PubMed]
- Asere, T.G.; Stevens, C.V.; Du Laing, G. Use of (modified) natural adsorbents for arsenic remediation: A review. Sci. Total Environ. 2019, 676, 706–720. [Google Scholar] [CrossRef] [PubMed]
- Siddiqui, S.I.; Naushad, M.; Chaudhry, S.A. Promising prospects of nanomaterials for arsenic water remediation: A comprehensive review. Process Saf. Environ. Prot. 2019, 126, 60–97. [Google Scholar] [CrossRef]
- Abejón, A.; Garea, A.; Irabien, A. Arsenic removal from drinking water by reverse osmosis: Minimization of costs and energy consumption. Sep. Purif. Technol. 2015, 144, 46–53. [Google Scholar] [CrossRef]
- Weerasundara, L.; Ok, Y.-S.; Bundschuh, J. Selective removal of arsenic in water: A critical review. Environ. Pollut. 2021, 268, 115668. [Google Scholar] [CrossRef] [PubMed]
- Biedunkova, O.; Kuznietsov, P. Integration of water management in the assessment of the impact of heavy metals discharge from the power plant with mitigation strategies. Ecol. Indic. 2025, 175, 113618. [Google Scholar] [CrossRef]
Disclaimer/Publisher’s Note: The statements, opinions and data contained in all publications are solely those of the individual author(s) and contributor(s) and not of MDPI and/or the editor(s). MDPI and/or the editor(s) disclaim responsibility for any injury to people or property resulting from any ideas, methods, instructions or products referred to in the content. |
© 2025 by the authors. Licensee MDPI, Basel, Switzerland. This article is an open access article distributed under the terms and conditions of the Creative Commons Attribution (CC BY) license (https://creativecommons.org/licenses/by/4.0/).

