1. Introduction
The research on geohazard prevention of expansive soils has a history of 70 years, but the problem remains yet to be fundamentally solved, posing a global technical challenge [
1,
2]. The instability of expansive soil slopes is mainly controlled by both intrinsic and external factors [
3]. Intrinsic factors refer to the inherent crack-proneness, over-consolidation, and swell-shrink characteristics of expansive soils [
4]. Many scholars [
5] have extensively discussed the causes and mechanisms of slope instability from the perspective of these “three characteristics.” It is generally believed that slope instability is caused by the development of internal cracks or discontinuities in the soil [
6], and therefore, any factor that causes the opening, extension, expansion, and penetration of cracks is a contributing factor to landslides [
7].
Researchers [
8] have summarized and emphasized that the swell-shrink characteristic, crack susceptibility, and over-consolidation of expansive soils are interrelated and mutually reinforcing, pointing out that the swell-shrink characteristic is the fundamental factor, crack susceptibility is the controlling factor, and over-consolidation is a promoting factor. External factors refer to excavation, unloading, and changes in climatic conditions, which lead to variations in the water content of the slope and are the main factors triggering landslides.
According to the theory of unsaturated soils, as the water content increases, the suction of unsaturated expansive soils rapidly decreases, leading to a softening of the soil’s strength, weakening of over-consolidation, and the decomposition of soil blocks into fragmented particles due to internal swelling-induced cracking, causing large deformations [
9,
10]. Under the combined action of self-weight stress, swelling stress, and seepage force, the slope becomes unstable [
11]. For different types of expansive soil slopes, the dominant conditions for instability are generally the two internal and external factors mentioned above. However, due to differences in slope, soil conditions, and structural features, the modes and mechanisms of instability and failure also vary [
12]. The instability of expansive soil slopes may be classified into shallow sliding and deep sliding [
13,
14].
Deep sliding failure in expansive soils is primarily caused by the opening, extension, development, and penetration of large internal crack-like structural discontinuities (referred to in some studies as fissures) in the soil, in combination with water infiltration [
15]. Such landslides are controlled by structural planes and typically exhibit distinct sliding surfaces. Tan et al. [
16] believe that the development of secondary crack-induced structural planes is one of the main causes of expansive soil slope instability. These structural planes, formed under the influence of water absorption and swelling, commonly lead to slope sliding and collapse along these planes.
Hu et al. [
17] analyzed expansive soil canal slope stability in the South-to-North Water Diversion Project, identifying groundwater fluctuations and ineffective cement treatment as key factors. Weak interlayer structural planes, tension cracks in the canal slope, and continuous rainfall are the main factors controlling the occurrence of the landslide. Lu et al. [
18] believe that the stability of expansive soil slopes is controlled by vertical joints in the middle and upper parts of the soil and large, gently inclined expansion-prone cracks filled with highly expansive soil at the foot of the slope. The sliding surface is composed of steeply inclined cracks at the rear edge and gently inclined, large fracture zones at the front edge. Tao et al. [
19], using the example of expansive soil shoulder slope instability controlled by structural planes, proposed a simple mechanical model considering water absorption and swelling and analyzed its instability mechanism using catastrophe theory.
Shallow failure in expansive soil slopes is widespread and mainly related to the depth of crack development and the influence of atmospheric conditions, generally occurring within a depth of 2 to 3 m [
20]. The most widely accepted theory for shallow failure of expansive soils is the progressive failure theory [
21]. Bjerrum [
22] suggests that the failure of expansive soil slopes is not a sudden event but a gradual process, with varying shear strengths that do not act simultaneously along the sliding surface. When slope excavation releases stress, combined with the presence of pre-existing cracks or planes of weakness within the soil, stress differences and strength inconsistencies develop inside the slope body. When shear stress at a certain location exceeds the shear strength, shear failure occurs at that point, leading to the overall slope sliding through the propagation of the failure. This failure theory could be elaborated in detail: progressive failure refers to the failure of weak crack surface planes in the soil, which then develops into connected ruptured sliding surfaces. Researchers have pointed out two important features of the progressive failure model: the sliding surface develops from crack surfaces, and the failure process involves traction failure. Thus, shallow failure is summarized as two forms: one is multi-stage traction-type sliding starting from the slope toe, and the other is multi-stage sliding caused by the upper layers of a layered slope pulling down on the underlying soil.
Researchers [
23,
24] also have analyzed shallow failure in expansive soil slopes from various aspects, such as the dense crack networks in the shallow layers, local stress concentrations, and weathering effects. Based on the stress-strain state of the slope, they analyzed the impact of expansive soil’s over-consolidation, swell-shrink characteristics, and crack-prone nature on slope stability. They concluded that crack zone moisture absorption would increase the stress levels in the shallow layer, promoting shallow sliding, and that the root cause of progressive failure is the hygroscopic softening and strain-softening characteristics of expansive soils. Yin et al. [
25] discussed the generation mechanism and development process of cracks in expansive soils, pointing out that the depth of shallow cracking generally reaches 3 to 4 m, which is also the range of sliding surface development. They explored the role of shallow slope crack zones and explained the connection between crack development and the instability characteristics of expansive soil slopes. The presence of cracks can clearly explain the shallow, traction, gentle, long-term, seasonal, and directional characteristics of expansive soil landslides. Zhou et al. [
26] pointed out that the instability of expansive soil slopes is significantly influenced by water action. After water infiltration, failure mainly occurs in the shallow layers of the slope, and the stability of the slope is controlled by the hygroscopic effect of the water, with deeper water infiltration leading to lower slope stability.
This study focuses on the analysis of shallow landslides, using model testing to simulate the deformation patterns of expansive soil slopes under cyclic wetting and drying conditions. The special geotechnical properties of expansive soils, such as permeability, expansiveness, and crack susceptibility, are considered in the analysis. The influence of atmospheric conditions and wet-dry cycles is incorporated to simulate the effects of repeated moisture absorption and evaporation on the deformation of the shallow layers of expansive soil slopes. Expansive soils exhibit significant swelling and shrinkage characteristics under varying moisture conditions, which can greatly impact the stability and deformation behavior of the slope [
27].
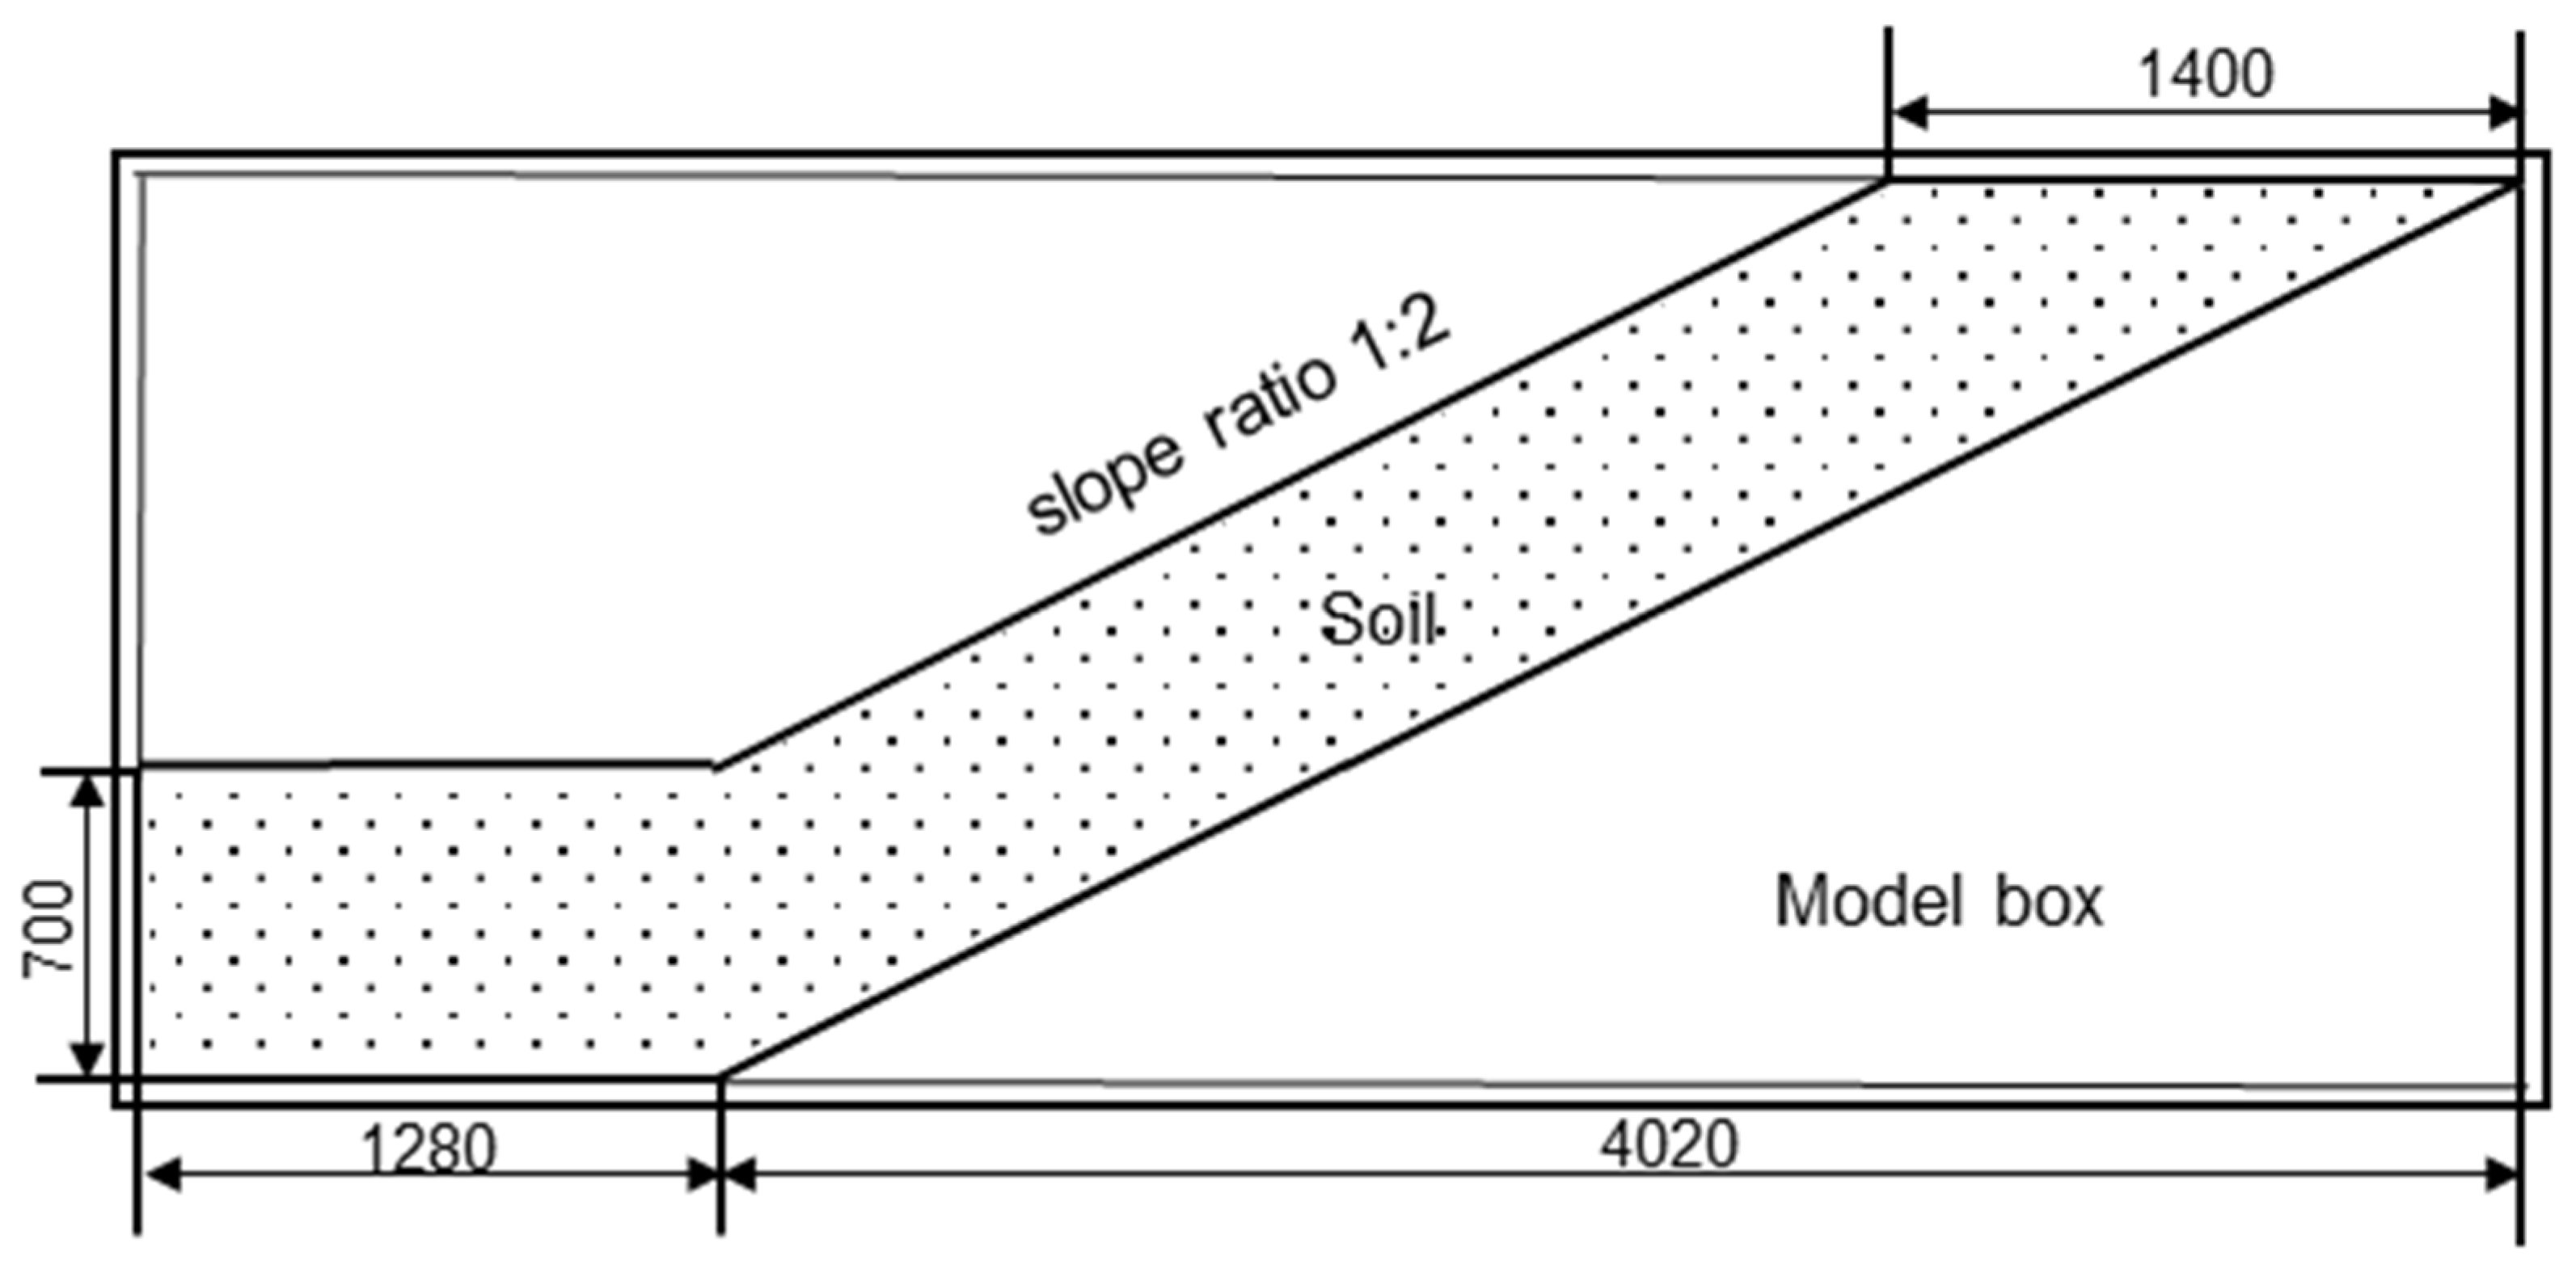
The model tests aim to reveal the mechanical behavior and failure mechanisms of expansive soil slopes under these natural environmental conditions. According to the principle of similarity, the model tests must meet the requirements of spatial, physical, boundary, and operational conditions similar to those of the actual soil to ensure the validity and comparability of the experimental results. This approach provides an effective experimental platform for studying the deformation patterns of expansive soil slopes and offers valuable insights for the stability analysis of slopes in practical engineering applications.
3. Monitoring Components
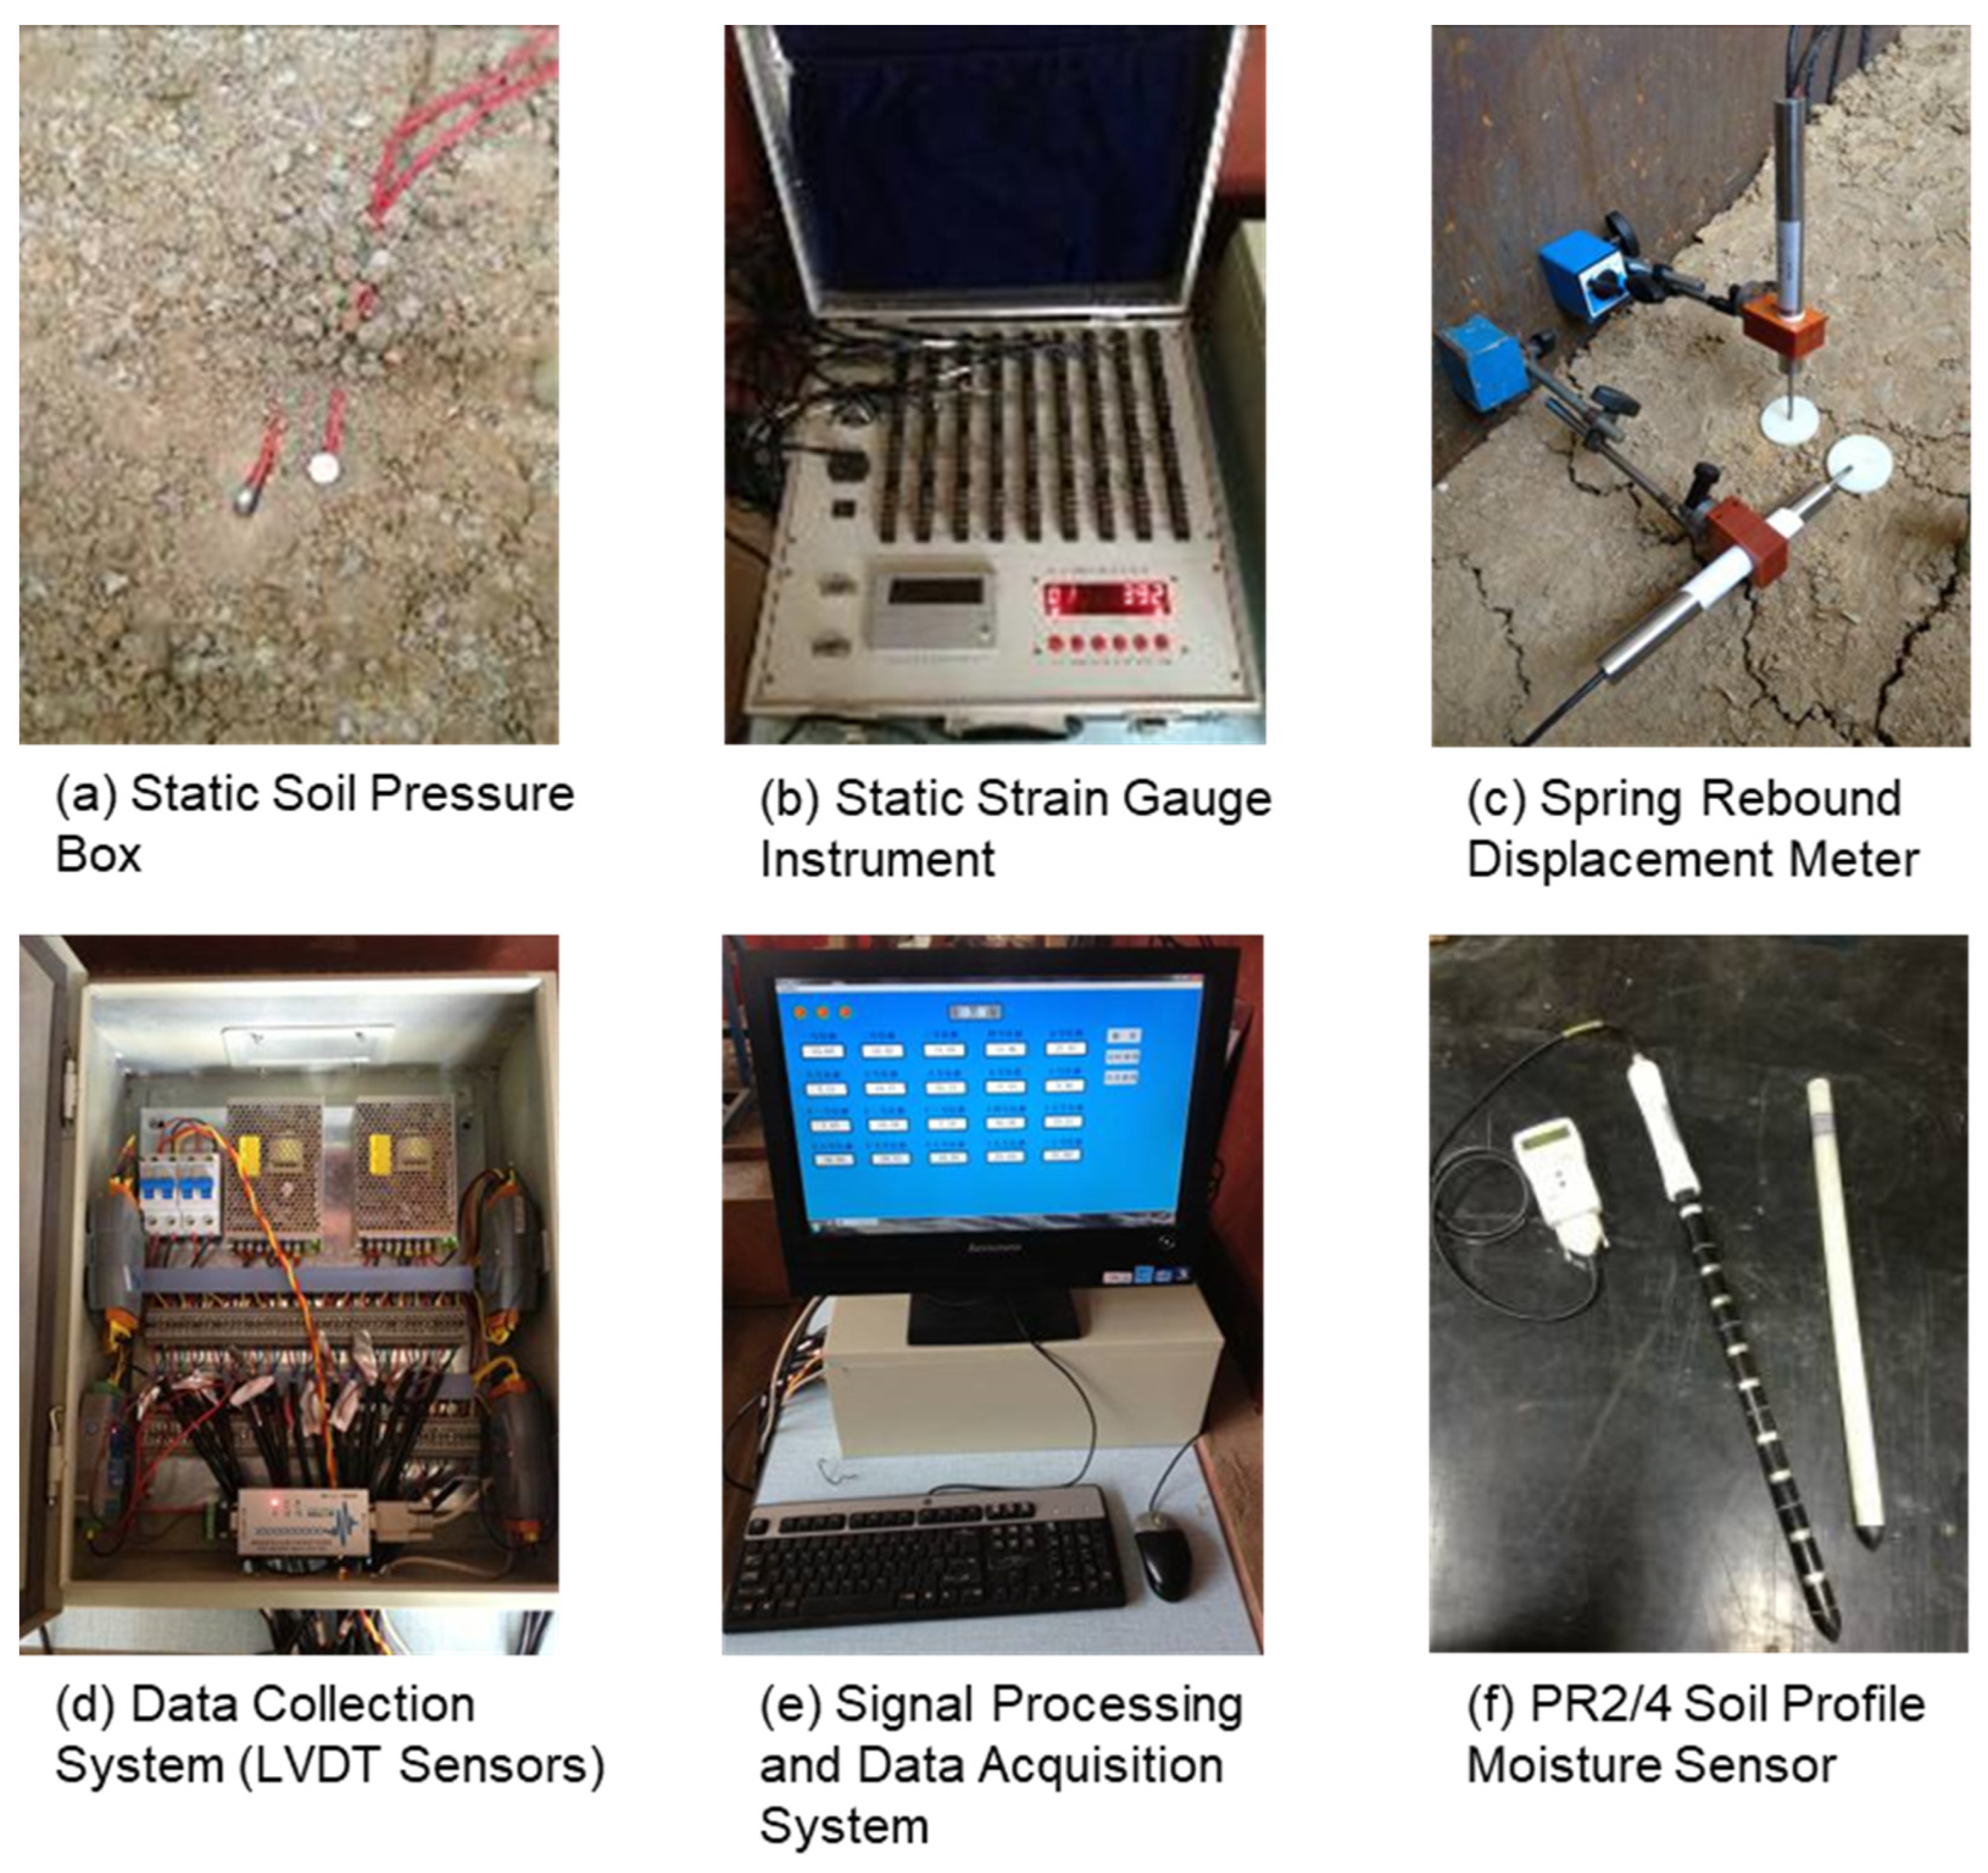
During the experiment, various monitoring devices were used to measure the deformation, moisture content, and expansive force of the soil on the slope. Profile soil moisture measurement system is designed to measure the moisture content at different depths of the slope, providing real-time data on the variation in water content throughout the test. A static soil pressure transducer is used to measure the horizontal and vertical expansive forces acting on the soil, giving insight into the swelling pressure as the soil absorbs moisture. Displacement sensors are placed on the slope surface to track the horizontal and vertical deformations due to swelling and shrinkage under varying moisture conditions. Settlement plates and displacement sensors are installed at various depths within the soil to measure vertical deformation. A camera is used to visually capture the deformation process on the slope surface over time, providing a visual record of changes and helping to analyze the development of the slope’s deformation. Detailed specifications of monitoring devices are explained as follows.
The experiment uses a BW foil-type micro pressure transducer (
Figure 4a) suitable for indoor model tests, with a range of 100 kPa, diameter of 16 mm, thickness of 4.8 mm, and an accuracy error of ≤0.5% FS. The pressure box features high output sensitivity, stable performance, a compact size, a lightweight, and good sealing. The measurement principle is based on the strain value of the foil strain gauge, which determines the external force acting on the pressure box. The general calculation equation is as follows:
where
h is the thickness of the deformation membrane (cm);
q is the maximum design pressure applied to the membrane (kg/cm
2), assuming uniform load distribution;
r is the effective radius of the deformation membrane (cm);
E is the elastic modulus of the deformation membrane material (kg/cm
2); and
U is the Poisson’s ratio of the material. Data acquisition is carried out using an XL2101B5+ 32-channel static strain gauge instrument (
Figure 4b).
A custom-made small settlement plate is used for the experiment, with a diameter of 80 mm and a height of 600 mm, as shown in
Figure 4c. The experiment employs a spring rebound displacement meter, as shown in
Figure 4c, with a range of 50 mm and an accuracy of 5/1000. Its output current is 4–20 mA, powered by a 24 V DC supply. The full spring extension corresponds to an output current of 4 mA, and the fully retracted state corresponds to 20 mA.
The displacement sensor data collection system was developed in-house, as shown in
Figure 4d,e. A total of 20 LVDT displacement sensors are used, with data collection done through three 8-channel modules from Honge, connected to a control box for power and signal processing. RS232 signals are converted to RS485 signals and then transmitted via an RS485/USB converter to a computer, where data acquisition is managed through Windows-based configuration software.
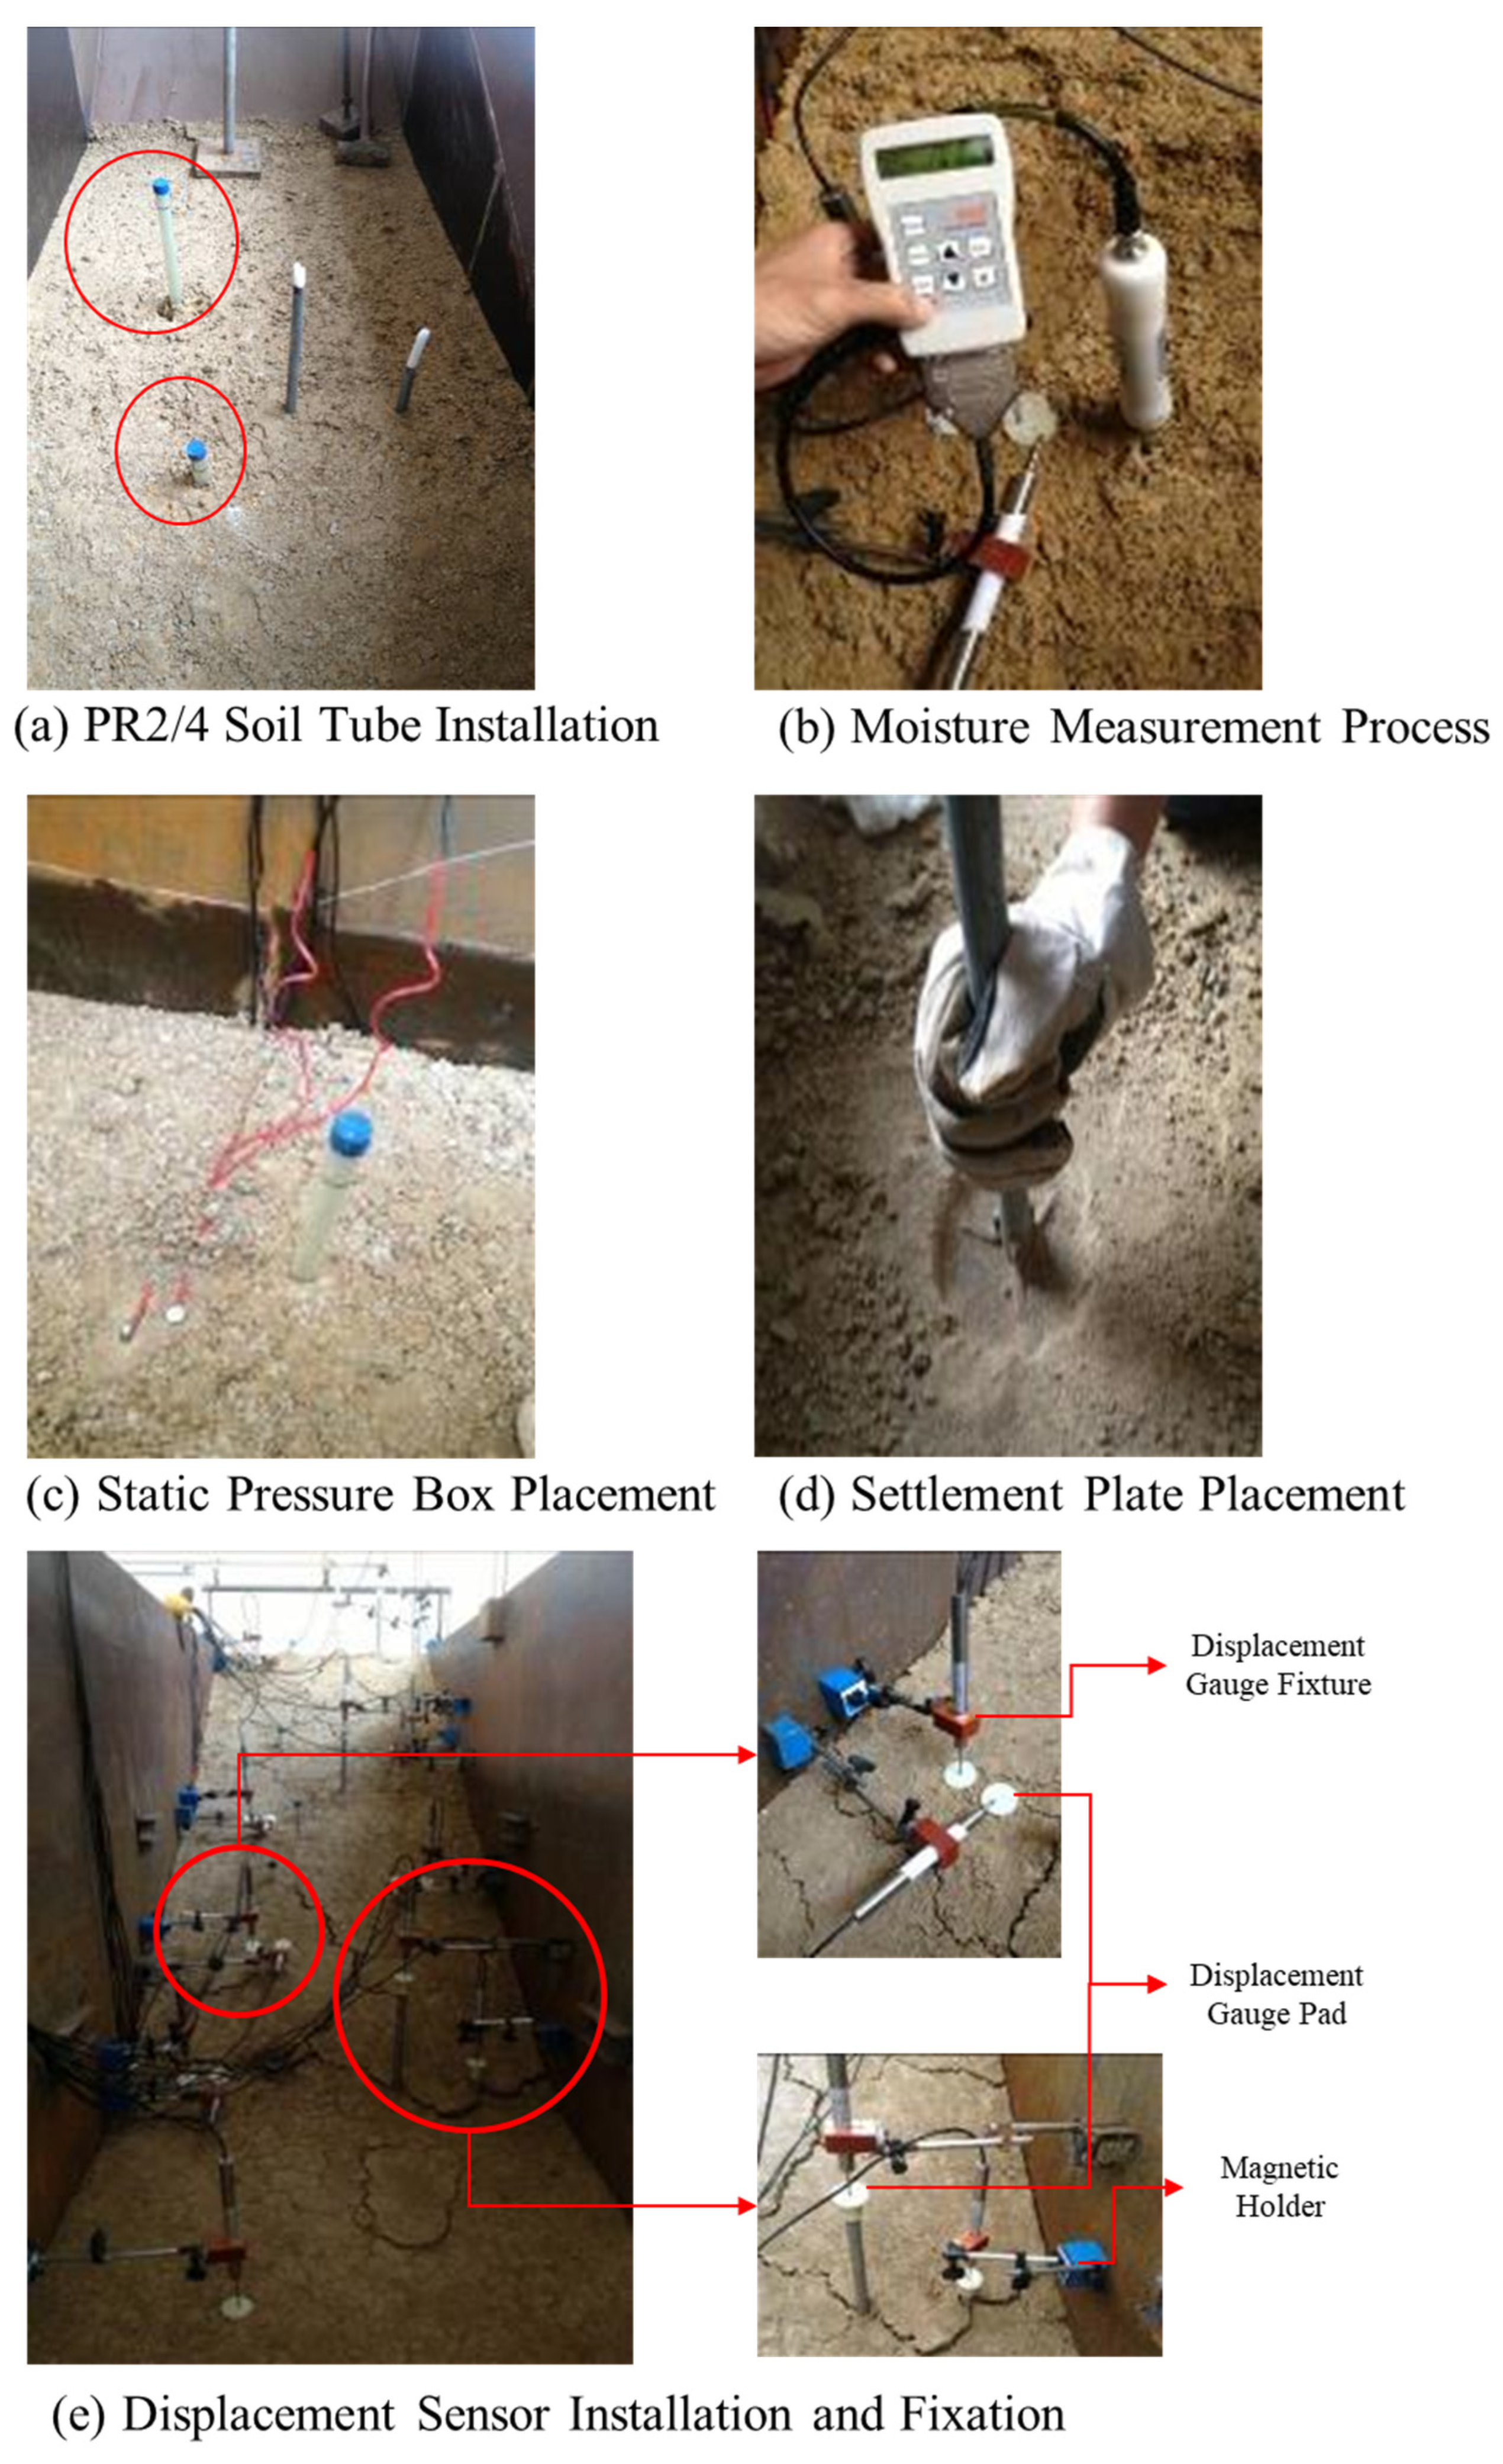
The PR2/4 Soil Profile Moisture Sensor produced by Delta-T, Cambridge, UK, is used for soil moisture measurement, as shown in
Figure 4f. The sensor consists of four probe points, measuring moisture at depths of 10 cm, 20 cm, 30 cm, and 40 cm. The sensor’s maximum measurement depth is 40 cm. Data acquisition is done via the HH2 handheld soil moisture meter, which connects to the PR2/4 sensor via an RS232 communication cable, providing real-time volumetric water content measurements
in m
3/m
3. The system is fast, easy to operate, and can transmit real-time data.
The PR2/4 soil profile moisture sensor has a measurement range of 0% to 100%, with an accuracy of ±3% (following special calibration) and a repeatability of ±1%. It operates within a temperature range of −20 °C to 70 °C and comes with a standard cable length of 2 m. The probe dimensions are 637 mm in length, 28 mm in diameter, and 0.55 kg in weight. Designed for in-situ measurements, the sensor includes specialized probe tubes that can be embedded into the soil. During experiments, the sensor is fully inserted into these tubes to provide accurate and reliable moisture readings.
4. Monitoring Device and Layout
The layout plan for monitoring devices is designed to ensure comprehensive data collection and accurate representation of the slope’s behavior under test conditions. The key considerations for device placement include the characteristics and performance of the devices, the primary monitoring objectives, the specific monitoring locations and depths, and the frequency and timing of data collection.
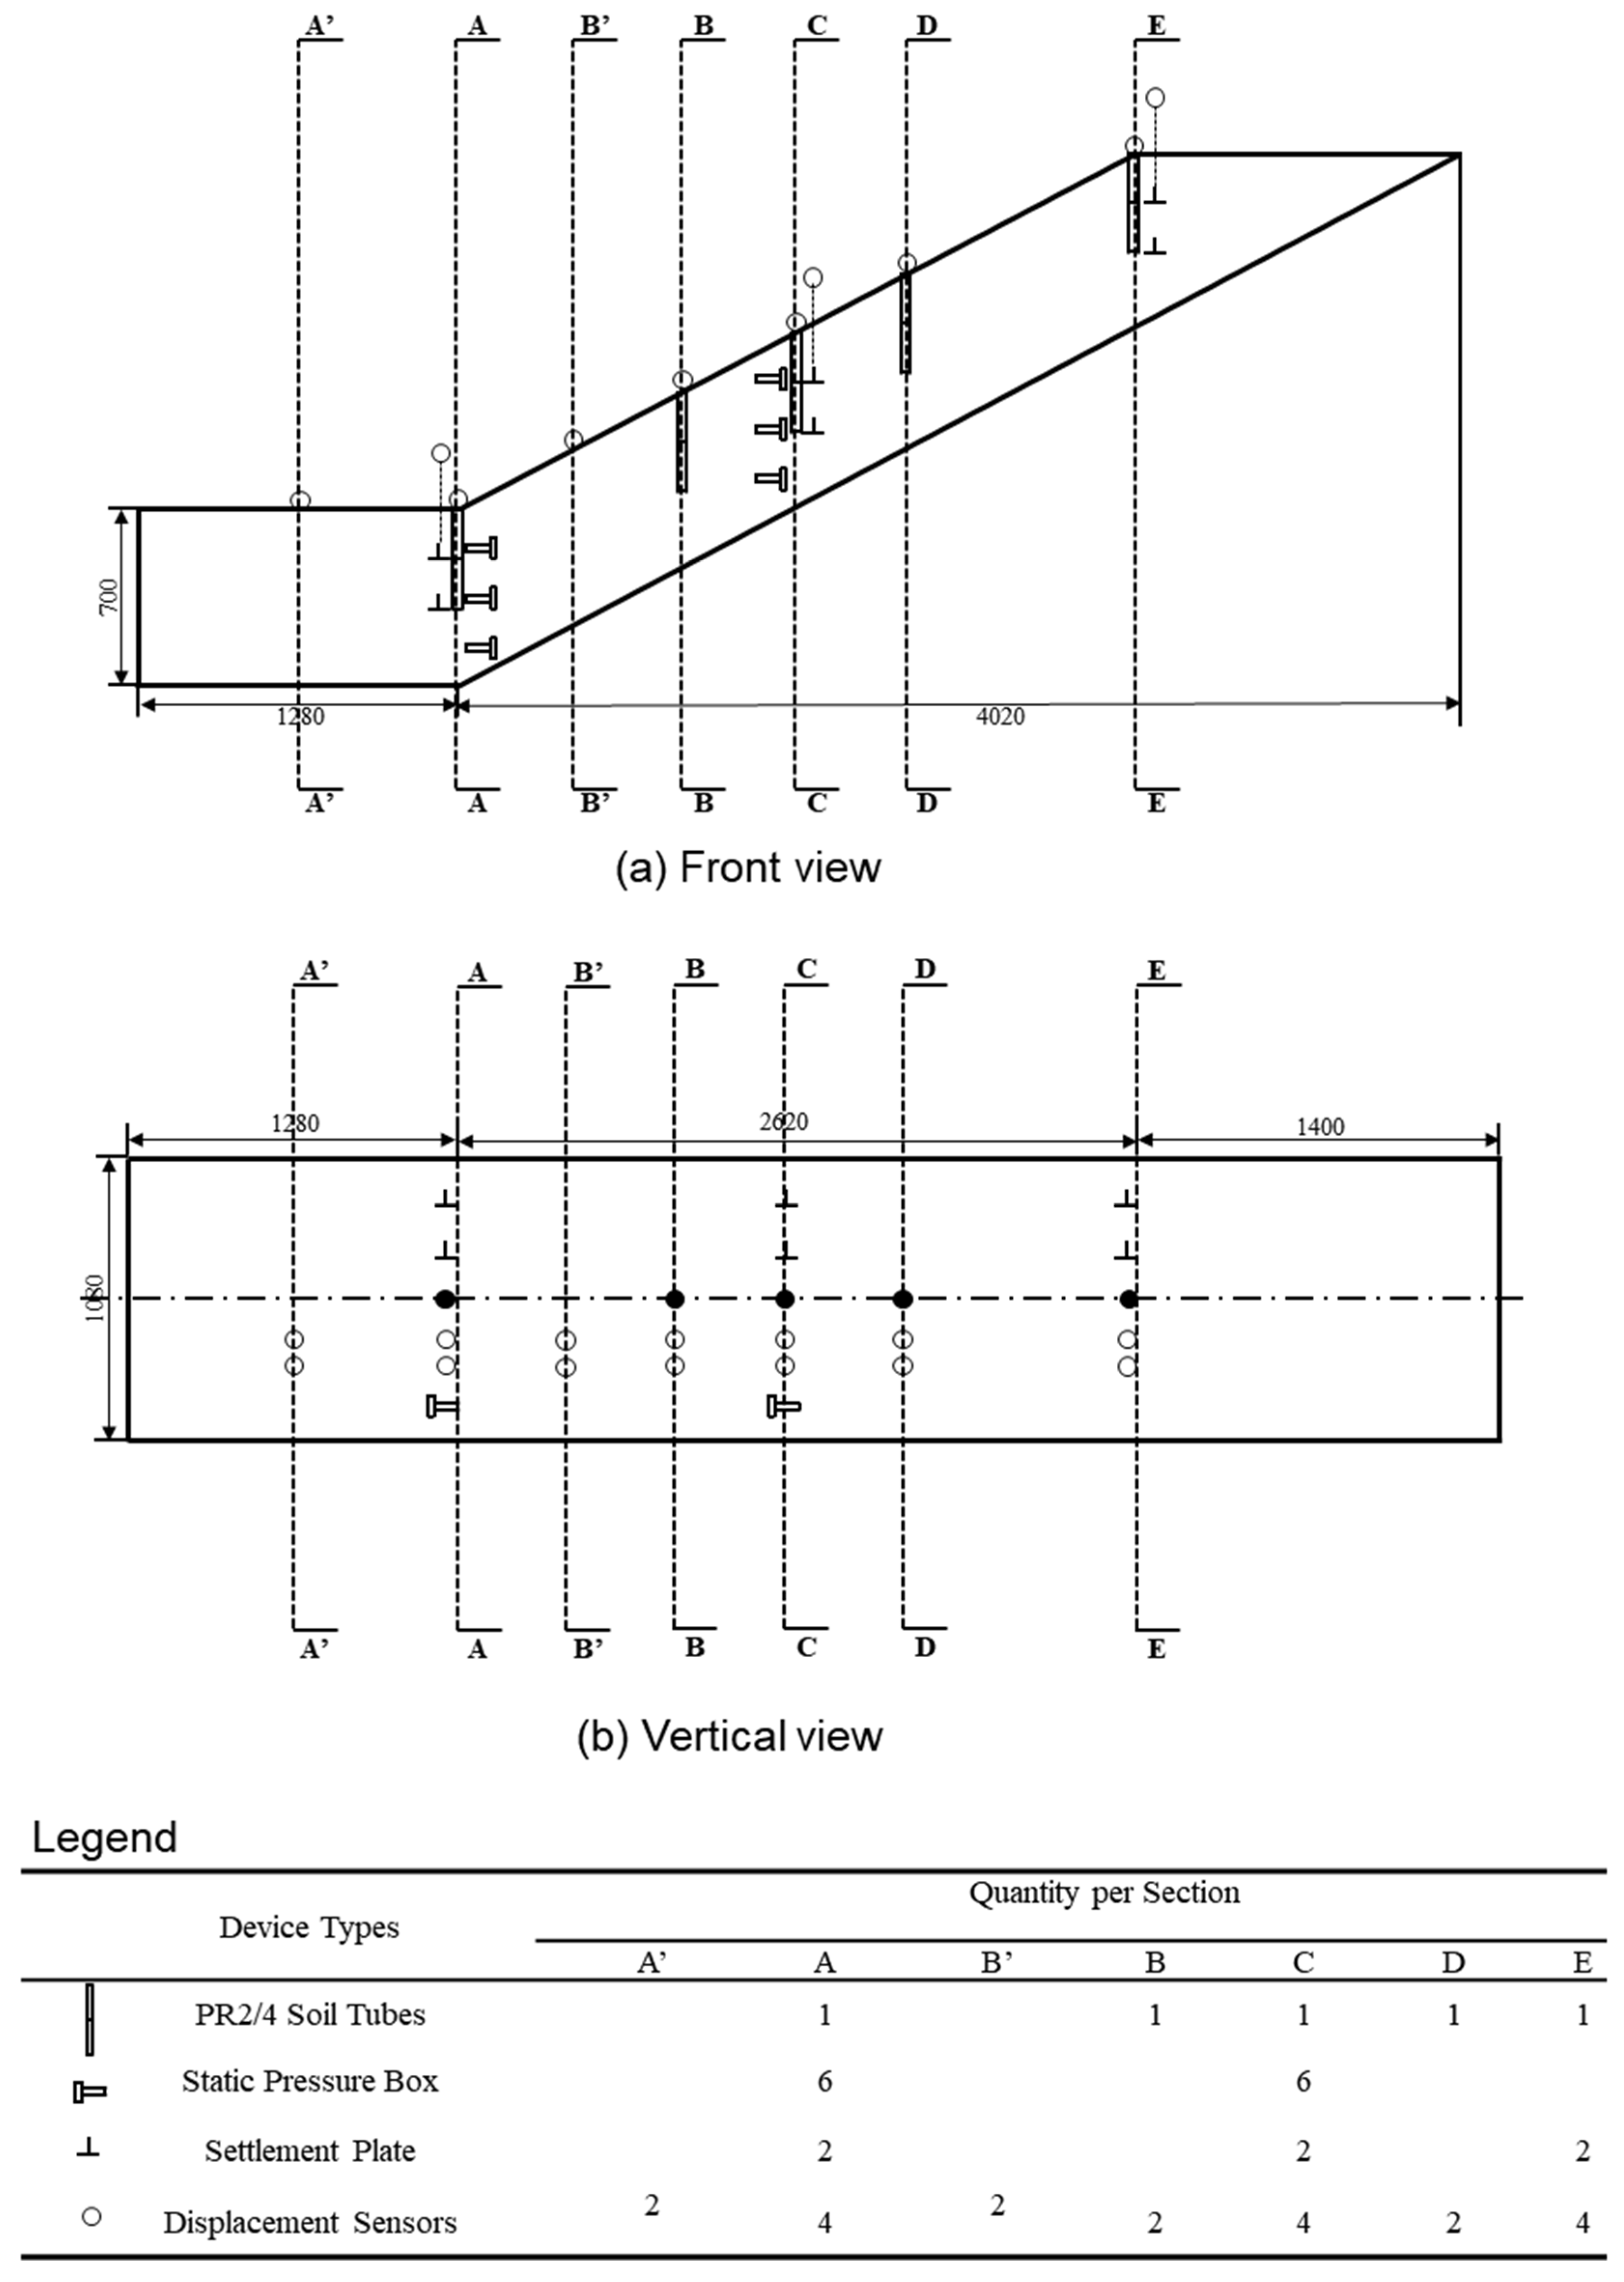
In
Figure 5a,b, A’, A, B’, B, C, D, and E represent seven typical sections of the slope: the bottom center section (A’), the foot section (A), the 1/6 slope height section (B’), the 1/3 slope height section (B), the mid-slope section (1/2 slope height) (C), the 2/3 slope height section (D), and the shoulder section (E). Among these, A, C, and E are the key monitoring sections, with monitoring content including surface and subsurface soil displacement, soil stress, and moisture content changes. B and D are comparison monitoring sections, mainly monitoring changes in soil moisture content and surface displacement. A’ and B’ are auxiliary comparison sections, primarily monitoring surface displacement in areas where significant slope displacement occurs. The types and numbers of monitoring components for each section are listed in
Figure 5 Legend.
The PR2/4 soil profile moisture sensor was utilized to measure soil moisture content at different depths within the slope. A total of five probe tubes were embedded at the following sections: slope toe, 1/3 slope height, mid-slope, 2/3 slope height, and slope shoulder. During the soil filling process, hollow tubes were installed and reinforced with solid inserts to prevent damage caused by soil compaction. During the infiltration phase, the PR2/4 sensor was sequentially inserted into the tubes to obtain moisture measurements at depths of 10 cm, 20 cm, 30 cm, and 40 cm. This method ensured accurate and undisturbed data collection across different sections of the slope, as shown in
Figure 6a,b.
Twelve static soil pressure boxes were deployed to measure soil stress at different depths and orientations. These devices were placed at depths of 0.20 m, 0.35 m, and 0.50 m within the soil at specified sections. Each depth position was equipped with two pressure boxes: one oriented to measure horizontal stress and the other to measure vertical stress. This configuration allowed for a detailed assessment of stress distribution across the slope and provided insight into the mechanical behavior of the soil under varying conditions, as shown in
Figure 6c.
A total of six settlement plates were installed to monitor vertical deformation within the soil. These plates were strategically positioned at the slope toe, mid-slope, and slope shoulder, with placement depths of 0.2 m and 0.4 m. Each settlement plate was topped with a circular thin plate (80 mm diameter) to serve as a base for displacement sensors. The plates featured a central hole for precise alignment with the settlement plates. This setup enabled accurate tracking of soil deformation at various depths and sections of the slope, as shown in
Figure 6d.
Twenty displacement sensors were used to monitor both surface and vertical deformations. For surface displacement, two sensors were installed at each of the seven cross-sections, measuring horizontal and vertical movements. Additionally, six sensors were integrated with the settlement plates to record vertical displacement. The sensors were mounted on magnetic holders fixed to the model box sidewall, with soil surface bases (80 mm diameter) used for sensor alignment. The setup allowed for sufficient extension and compression of the sensors, ensuring reliable measurements throughout the experiment, as shown in
Figure 6e.
5. Experimental Methods and Process Control
This model experiment simulates rainfall infiltration to study the behavior of a strongly expansive soil slope. The experiment monitors changes in soil moisture, surface and internal deformation, and stress states of the slope. Based on the observed macroscopic phenomena and monitoring results, the stress-strain characteristics of the slope under swelling conditions caused by infiltration are analyzed. The failure modes and evolutionary patterns of the slope are summarized.
5.1. Slope Condition and Material Preparation
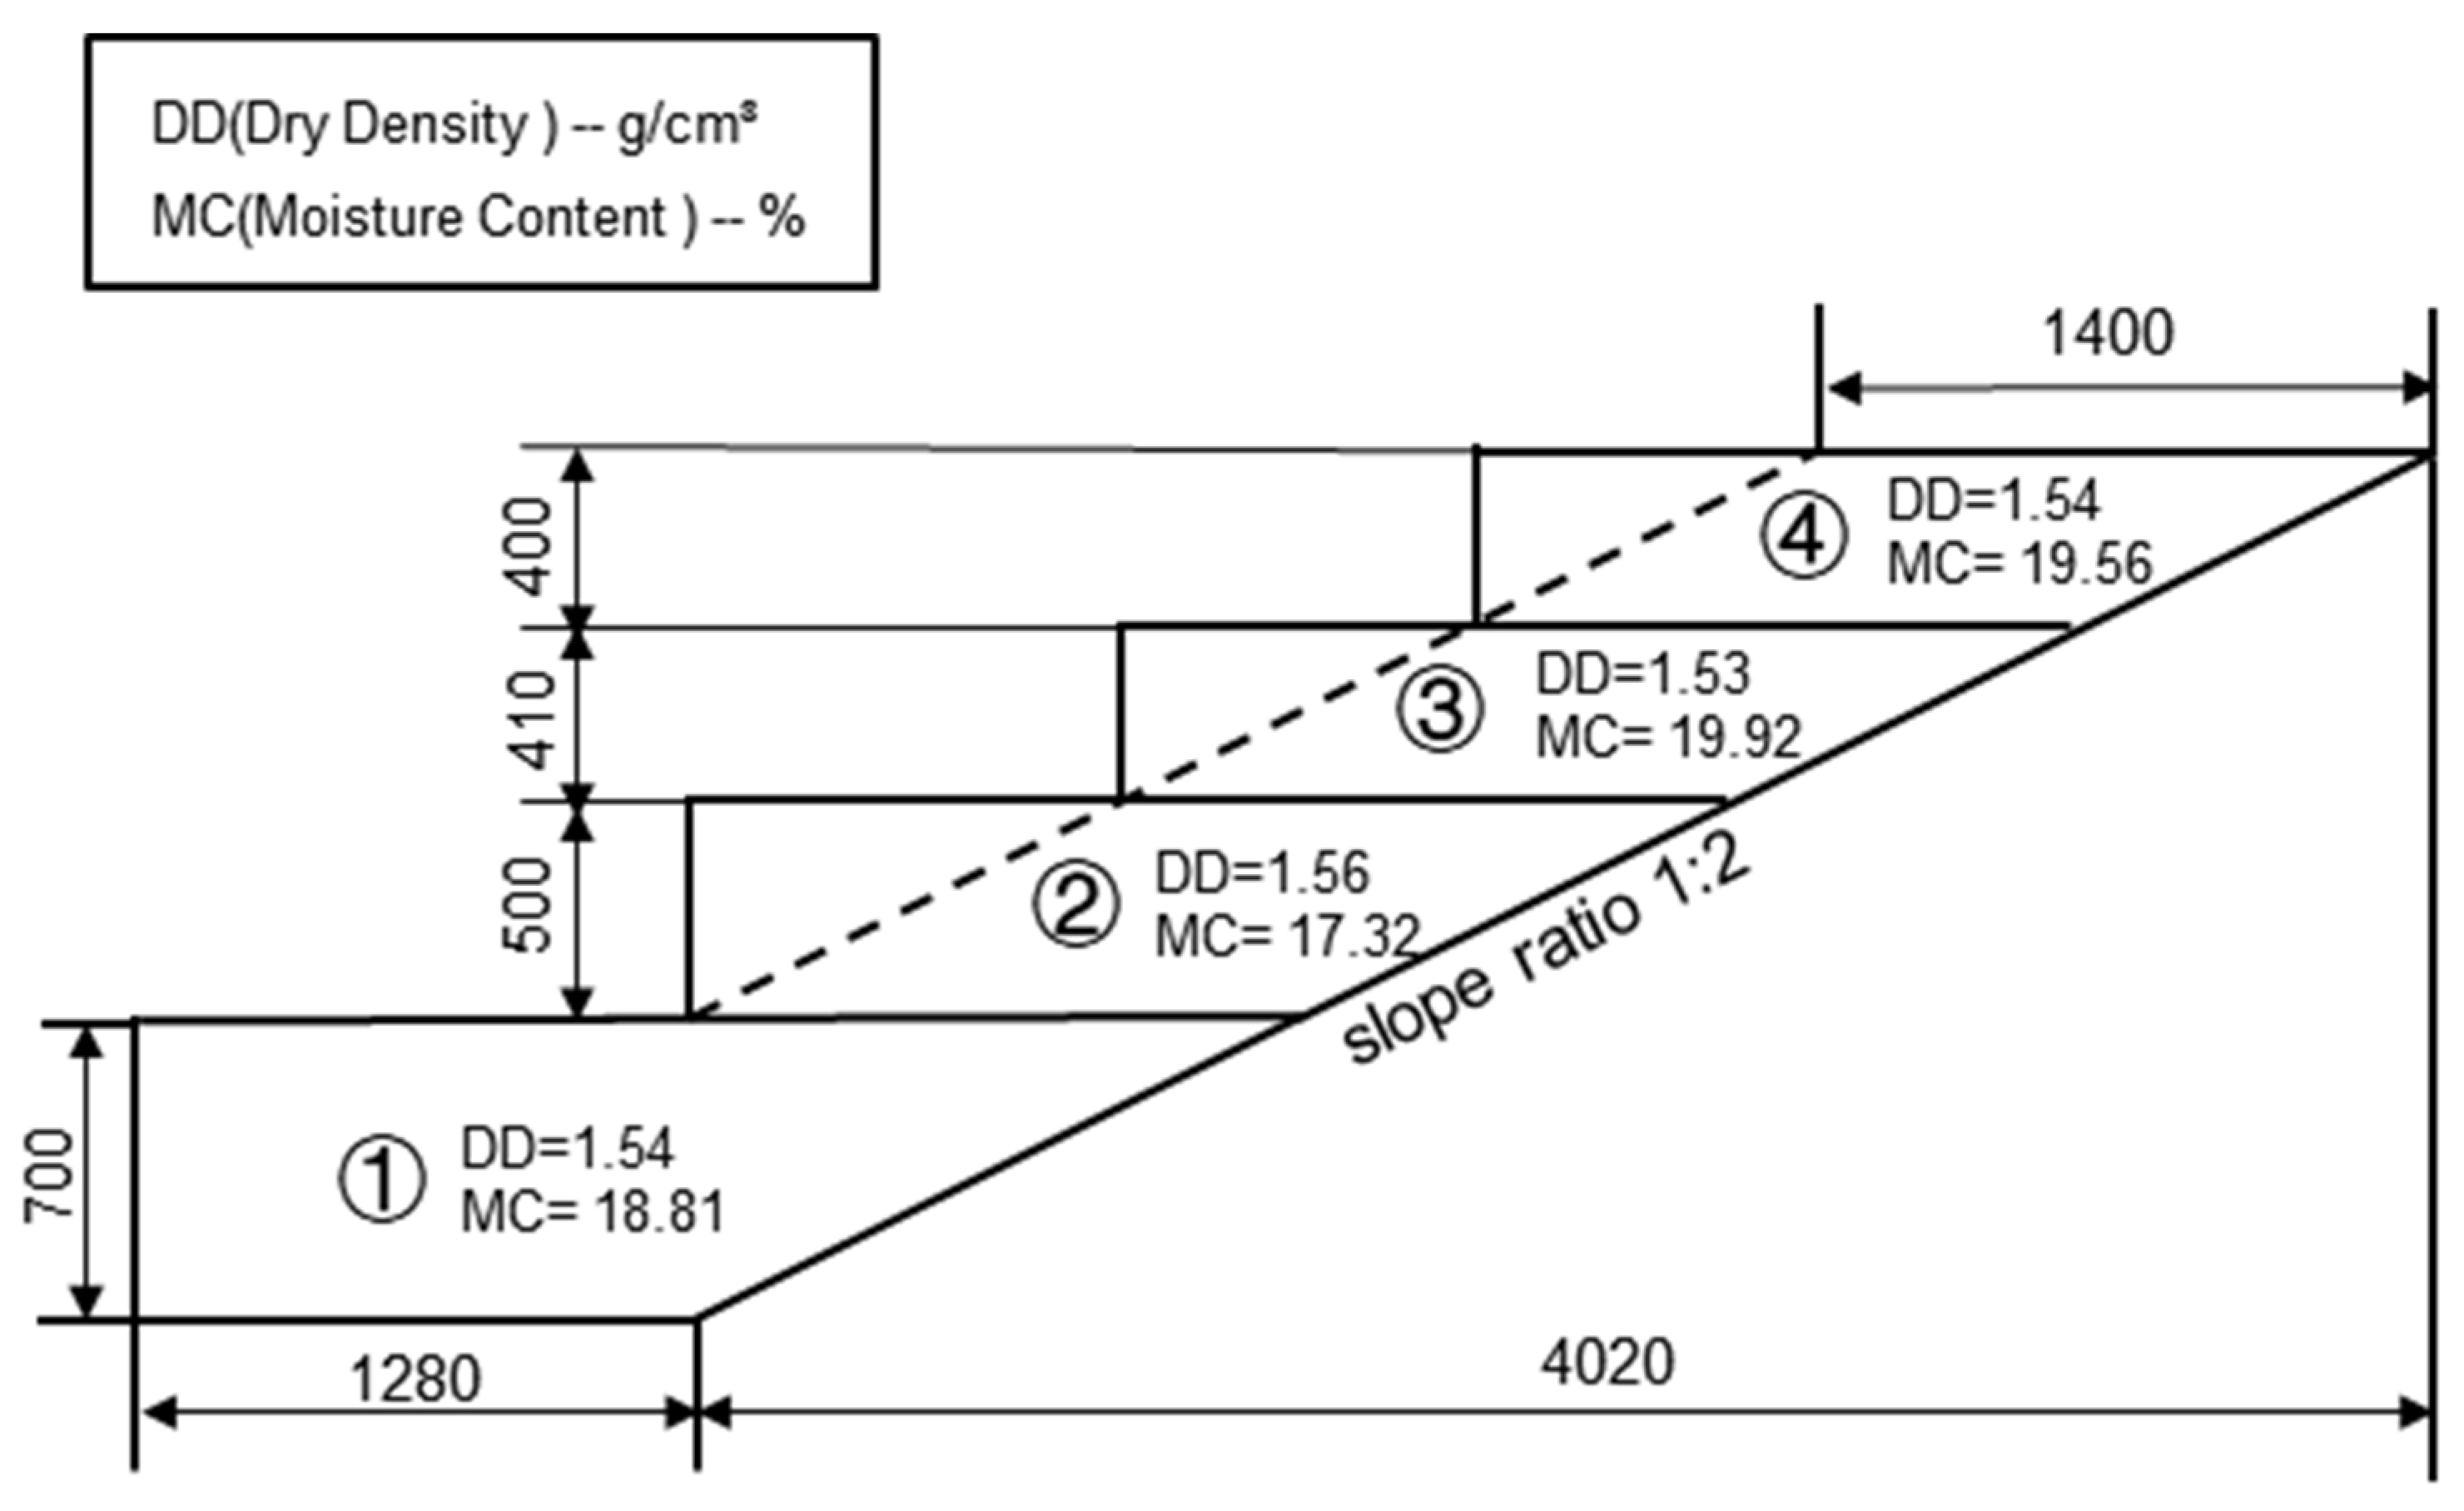
During the filling process, the moisture content and dry density of each soil layer were strictly controlled to ensure uniform infiltration and to represent realistic swelling deformation. Cracks play a critical role in determining the properties of expansive soil slopes, giving the slope its unique structural characteristics. In actual slopes, cracks exist primarily in two forms. Vertical surface cracks develop near the surface at the slope top due to cyclic wetting and drying. They are typically wider at the top and narrower at the bottom, forming as a result of lateral support loss during slope excavation. Subsurface or structural cracks are inherent or shrinkage cracks formed during soil layering or lithification processes. These include bedding planes, stratification surfaces, unconformity interfaces, and primary crack planes, which are widely distributed on both the surface and interior of the slope.
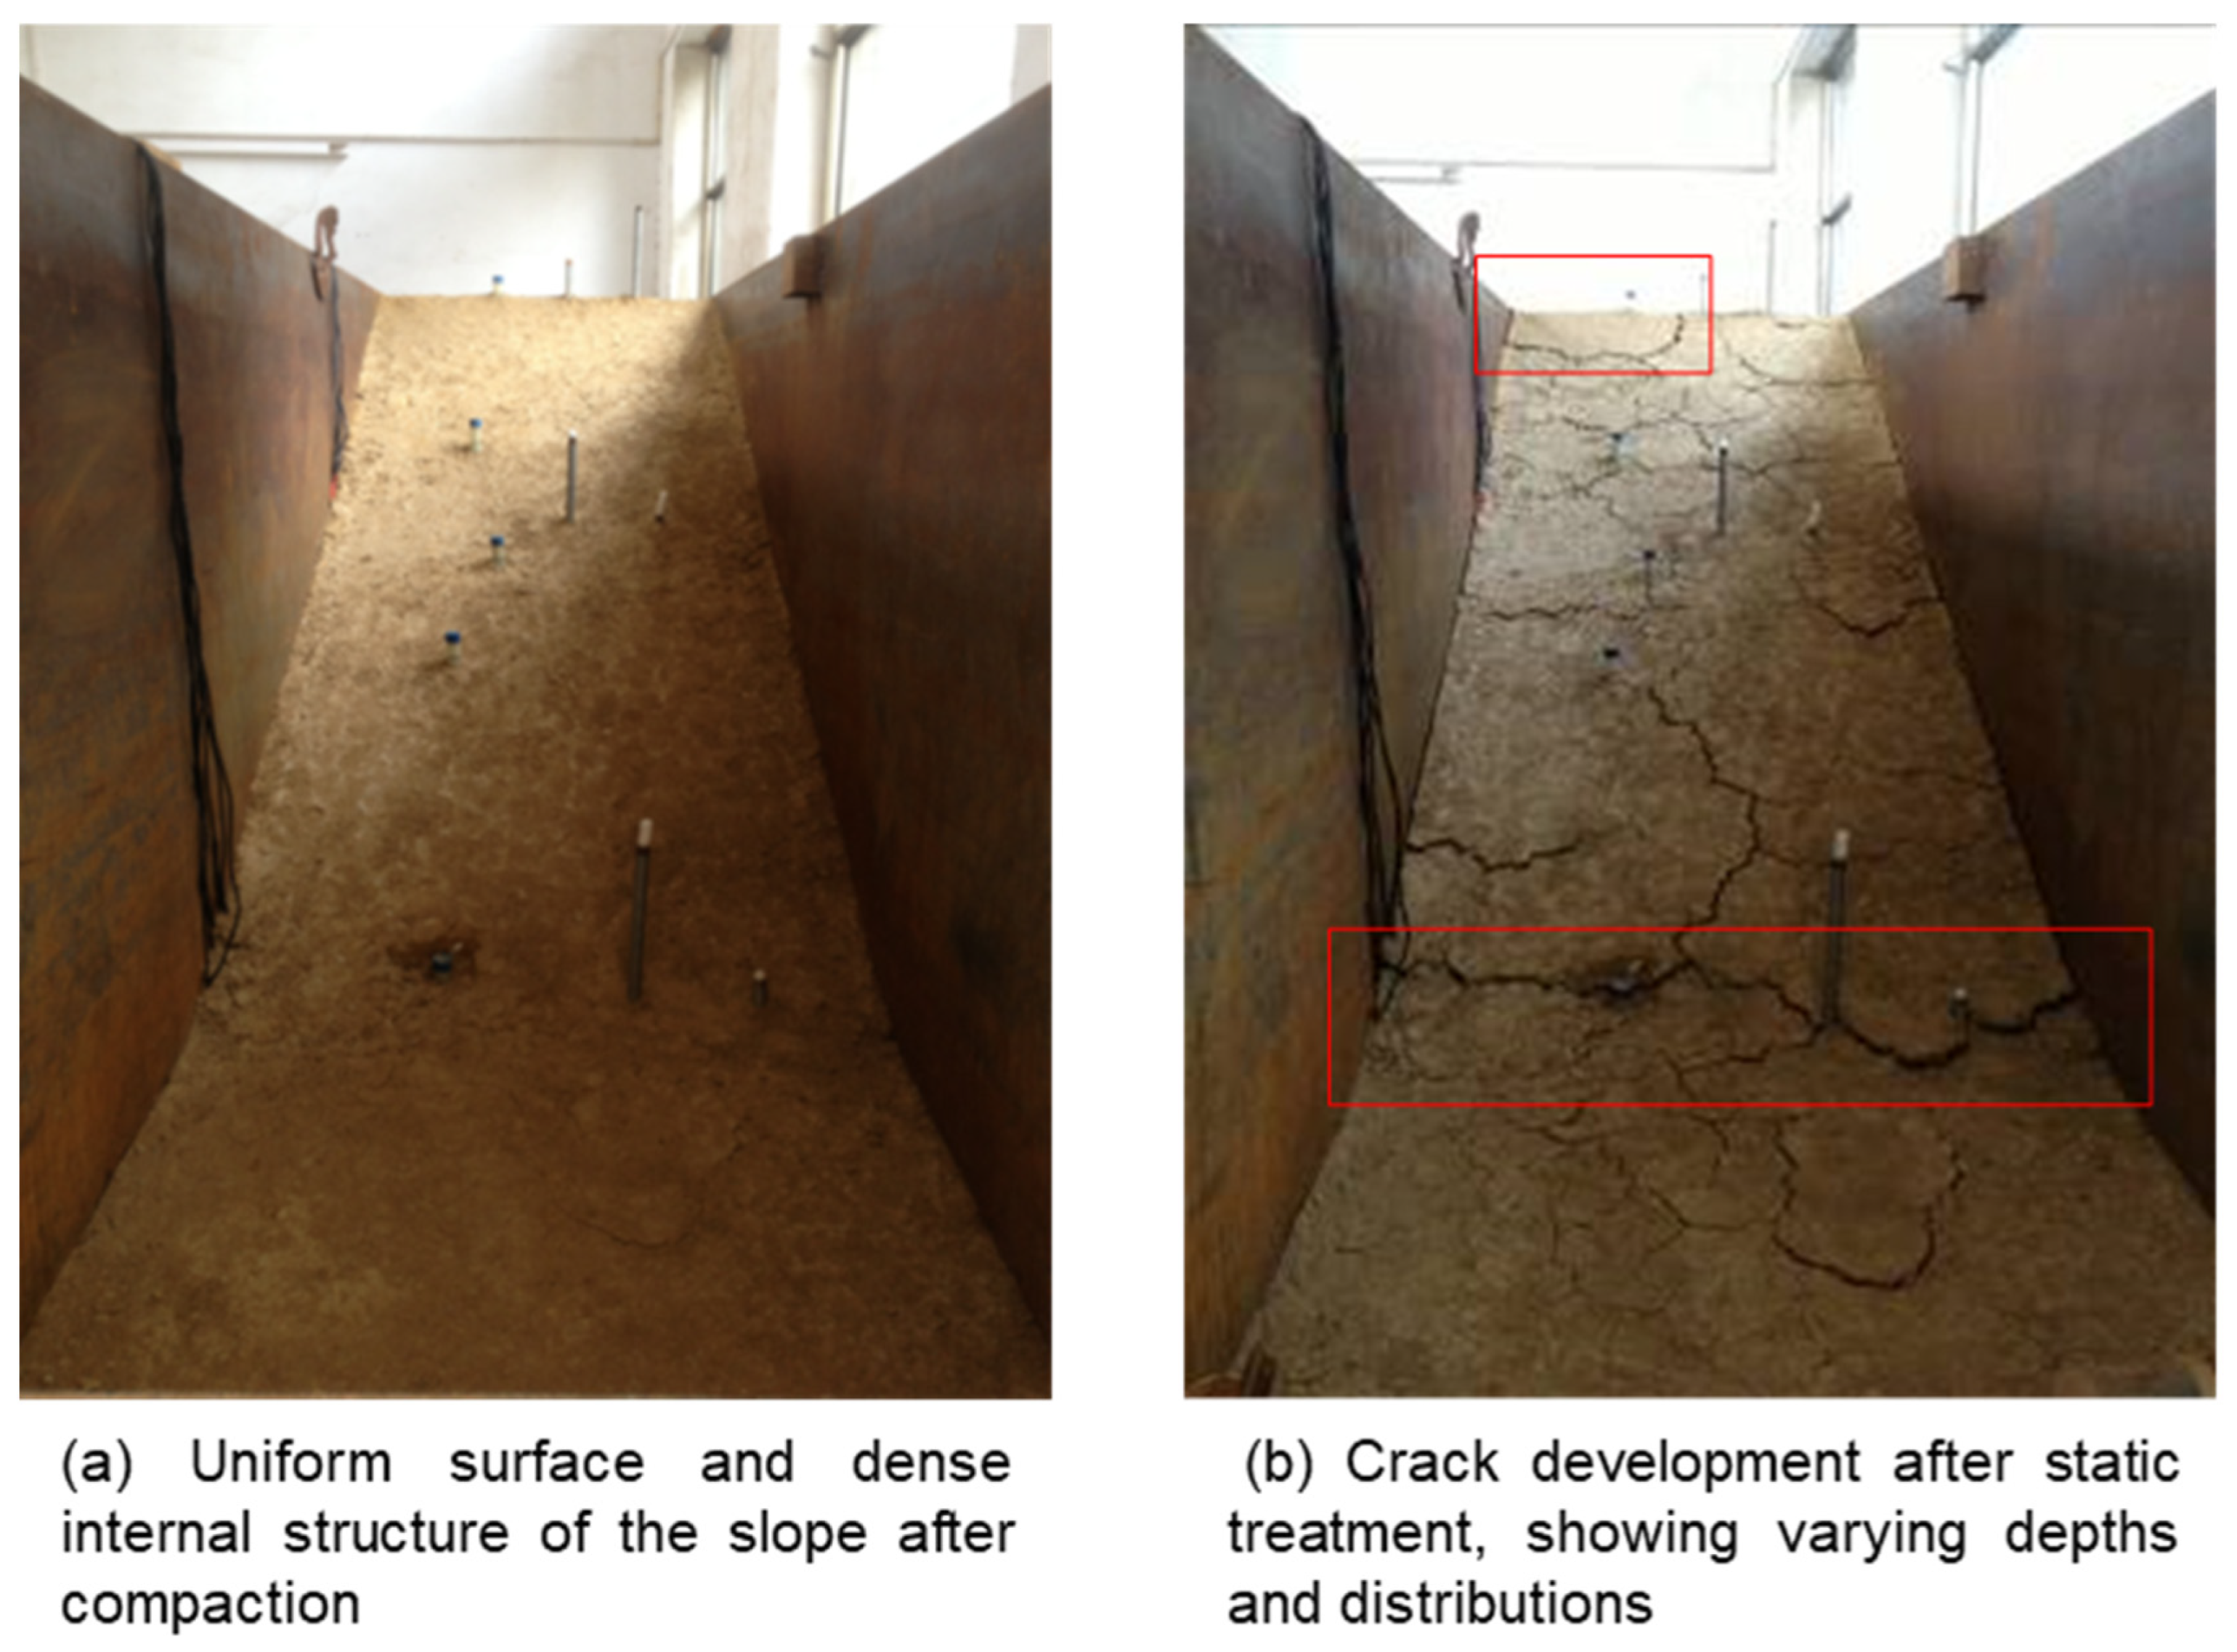
After the soil filling was completed, the slope surface appeared flat and smooth due to artificial compaction. The internal soil showed high uniformity and density, as shown in
Figure 7a. However, this differed significantly from actual highly expansive soil slopes, where cracks are extensively developed. To address this, the filled soil was left to rest (static treatment) for 20 days to ensure uniform moisture distribution throughout the soil mass and to allow the gradual development of cracks, simulating natural slope conditions.
After 20 days of static treatment, cracks developed in the expansive soil slope, displaying distinct characteristics as shown in
Figure 7b. The average crack depth ranged from 2 to 5 cm, with larger cracks, measuring 8 to 12 cm deep, forming at the slope shoulder and foot. Additionally, smaller cracks, less than 1 cm deep, were widely distributed across the slope surface, creating a network of fractures that closely resembled those found in natural expansive soil slopes.
The static treatment and crack development process helped reproduce the structural characteristics of strongly expansive soil slopes, with widespread surface and subsurface cracking. This preparation ensured that the experimental slope closely resembled actual expansive soil slopes, allowing for the accurate study of infiltration, swelling deformation, and stress redistribution. The precise control of moisture content and dry density during the filling phase further enhanced the reliability of the experimental results.
5.2. Evaporation Experiment on Highly Expansive Soil
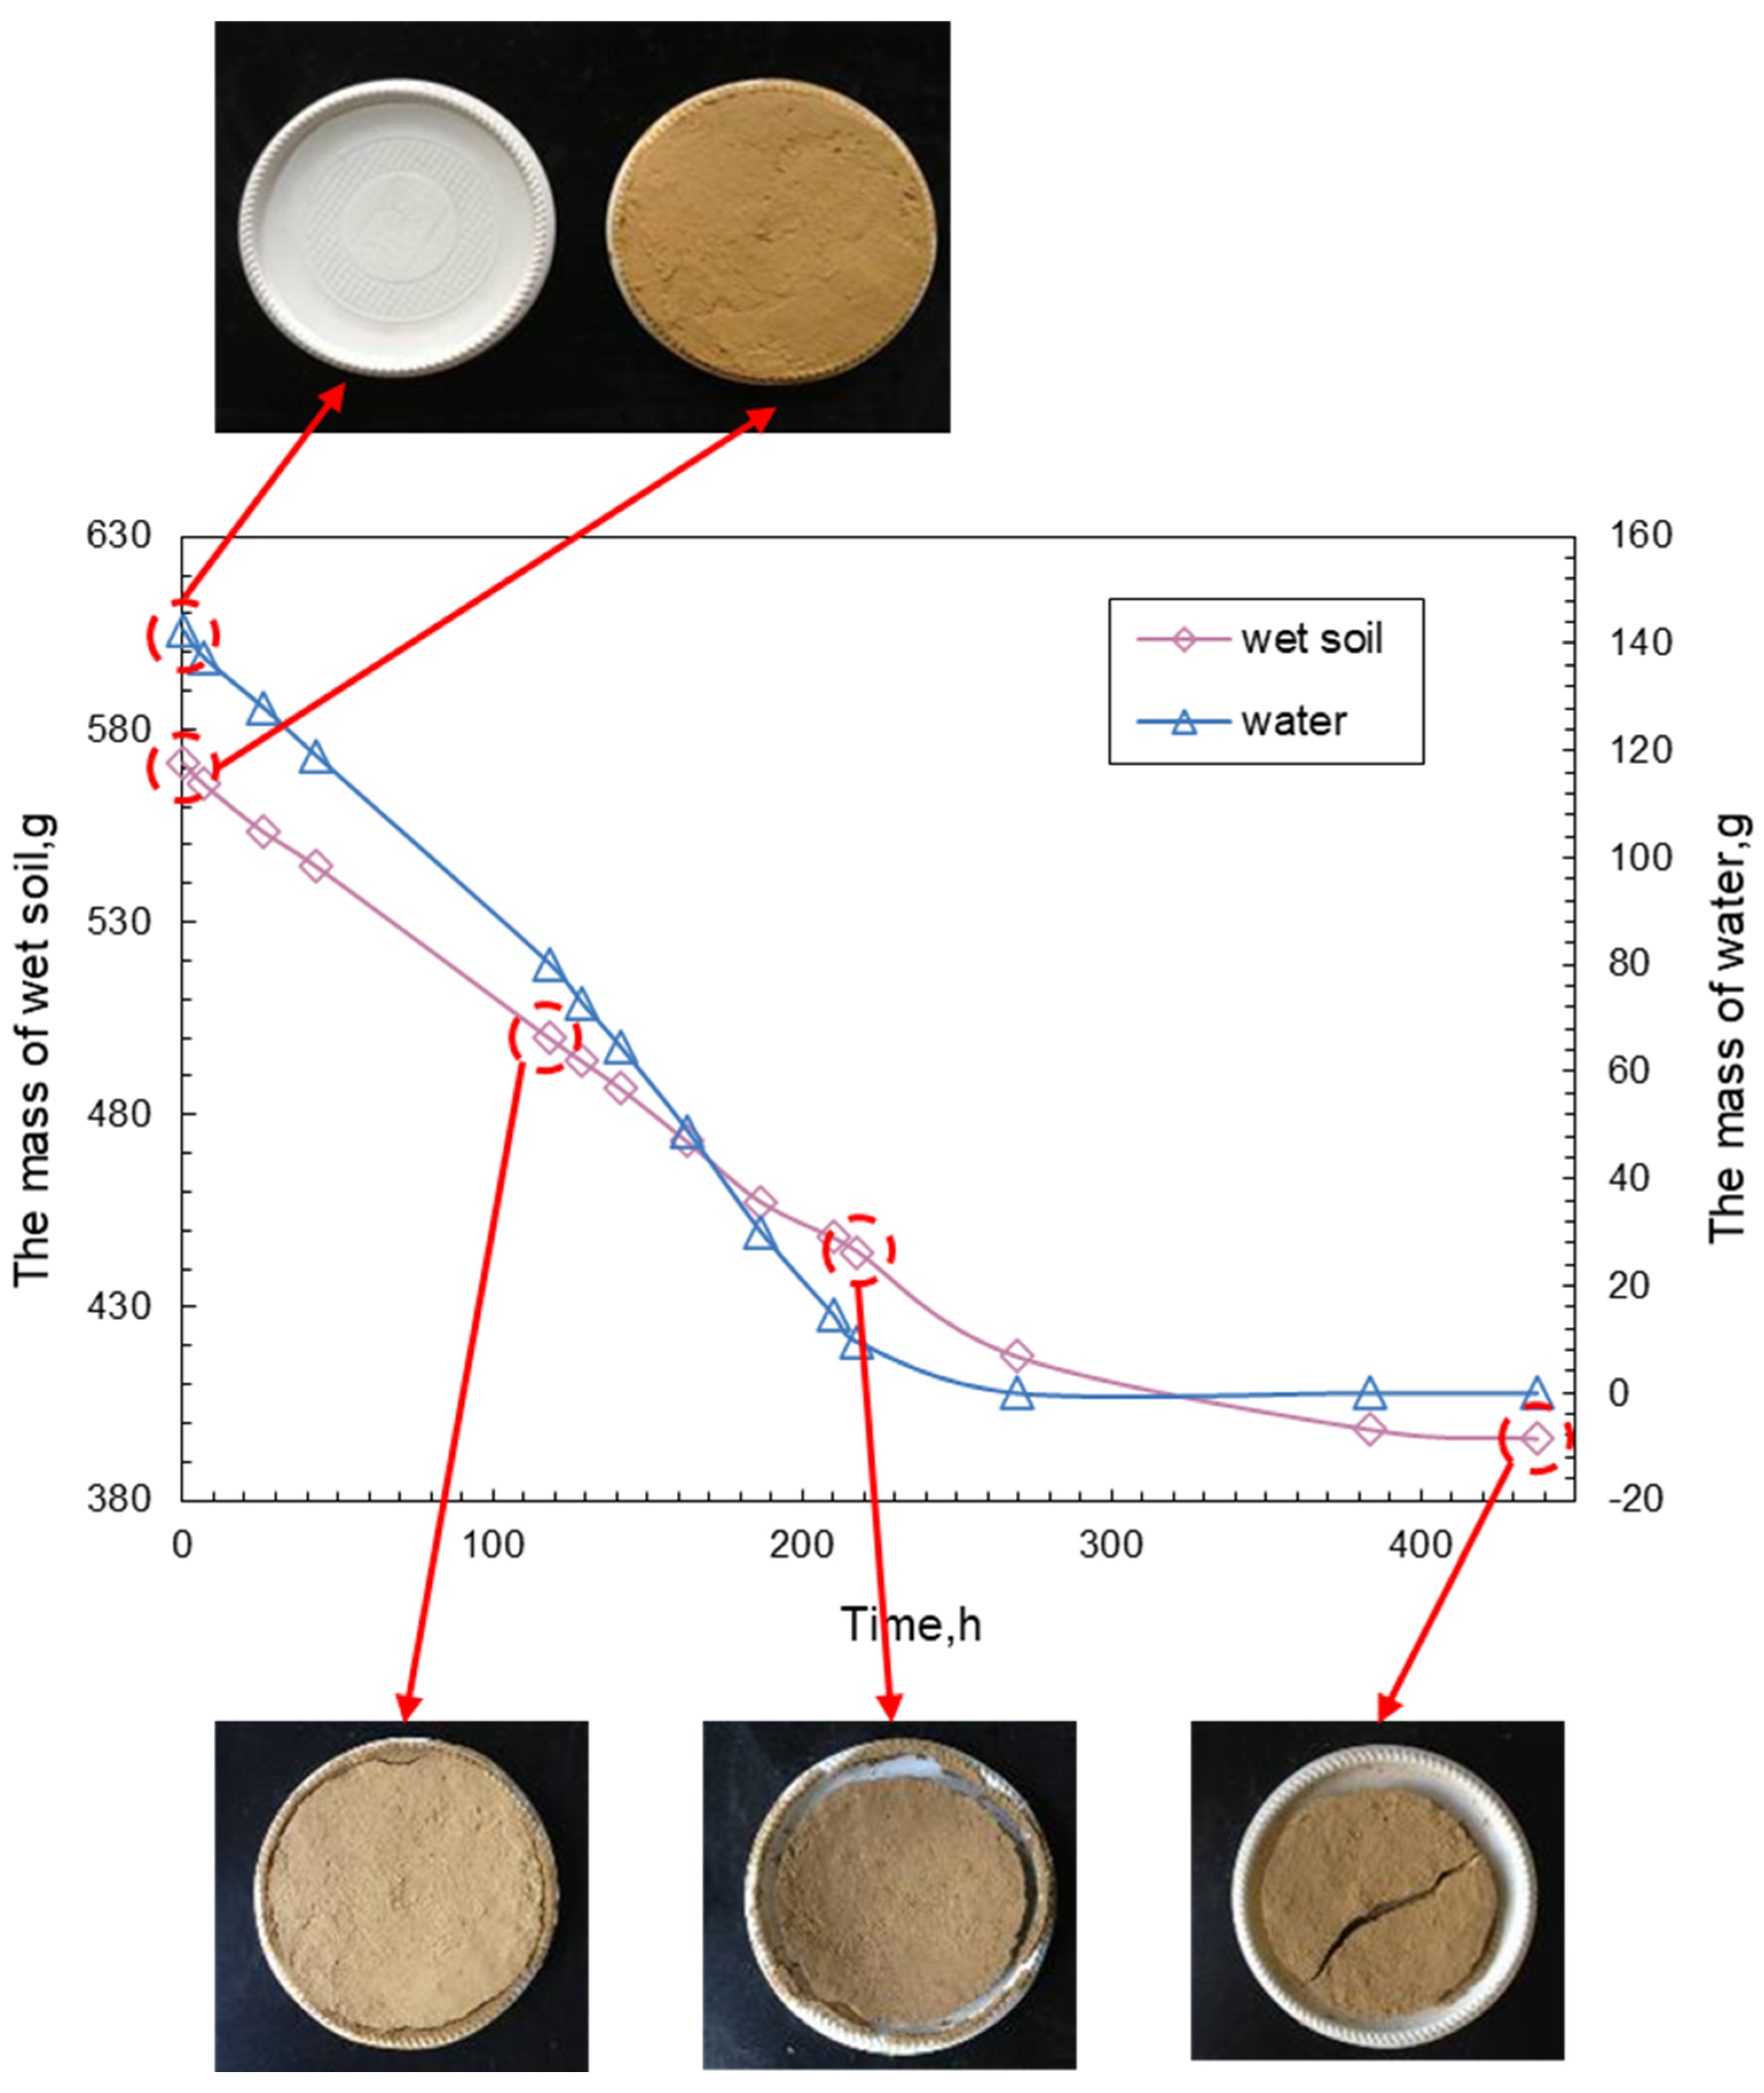
An indoor evaporation model was used to measure the evaporation rate of highly expansive soil. The test samples consisted of the same material as the model experiment, prepared with high moisture content. The initial soil sample had a dry density of 0.98 g/cm
3, a water content of 61.14%, and a saturation degree of 0.94. The soil was compacted into a disc with a diameter of 16 cm and a depth of approximately 6 mm, and then placed in a circular tray. A similar tray containing a fixed amount of room-temperature pure water was prepared as a control, as shown in
Figure 8. The soil disc was sufficiently thin to ensure uniform moisture migration and surface evaporation across the sample. Since the test aimed to monitor cumulative mass loss over time under ambient conditions, the exact thickness was considered less critical than the control of initial water content and total sample weight. This setup reasonably simulates surface-layer evaporation behavior typically observed in field conditions.
At the beginning of the evaporation test, the disc containing water and soil samples is placed in a cool, ventilated indoor area, with environmental conditions consistent with those of the model test. The water is allowed to evaporate naturally. Timing begins, and the mass of the soil sample and water is measured at regular intervals. Evaporation test curves are plotted, and the changes in the state of the soil sample and the development of cracks during the evaporation process are observed. The test is concluded when the results of two consecutive measurements within 48 h show negligible variation.
During the evaporation process, the water surface exhibited a consistent evaporation rate until complete evaporation, as shown by its linear evaporation curve. The evaporation rate can be linearly fitted using the equation:
where
mw represents the mass of water (g),
t represents time (h), and
w represents the soil moisture content. Based on the slope
k of the evaporation curve, the daily evaporation rate E (mm) can be calculated by −
k/
S × 24 × 10, where
S is the evaporation area (cm
2), and 24 and 10 are time and scale conversion parameters, respectively.
For soil surface evaporation, when the moisture content is w, the evaporation curve slope k1 = −0.5775 corresponds to a daily evaporation rate of approximately 0.69 mm, while at another moisture content w, the slope k2 = −0.1334 corresponds to a daily evaporation rate of approximately 0.16 mm. For water surface evaporation, the slope k3 = −0.5992 yields a daily evaporation rate of approximately 0.72 mm. These results indicate that under the given environmental conditions, evaporation progresses relatively slowly, and the soil’s moisture state significantly influences its evaporation rate.
5.3. Rainfall Control
The rainfall simulation was conducted using drip irrigation-style devices at different locations on the slope, allowing water to flow naturally along the slope under gravity. This method offers several advantages, including precise control over the rainfall area and intensity, ensuring that the rainfall amount closely matches the infiltration volume. It also minimizes potential damage to monitoring components and provides operational convenience for manual monitoring and data collection.
The experiment simulated low-intensity continuous rainfall, designed to mimic natural light rain conditions. Rainfall occurred for 4–8 h daily, with a controlled daily rainfall amount of approximately 10 mm. This approach ensures that the soil absorbs water gradually and avoids excessive surface runoff, thereby creating realistic conditions for studying slope infiltration.
Rainfall was conducted in stages, with each stage limited to 120 mm of total rainfall. During each daily rainfall session, intervals were introduced based on the slope’s infiltration and runoff conditions. The aim was to avoid excessively short or concentrated rainfall sessions, ensuring maximum water infiltration without causing significant surface runoff.
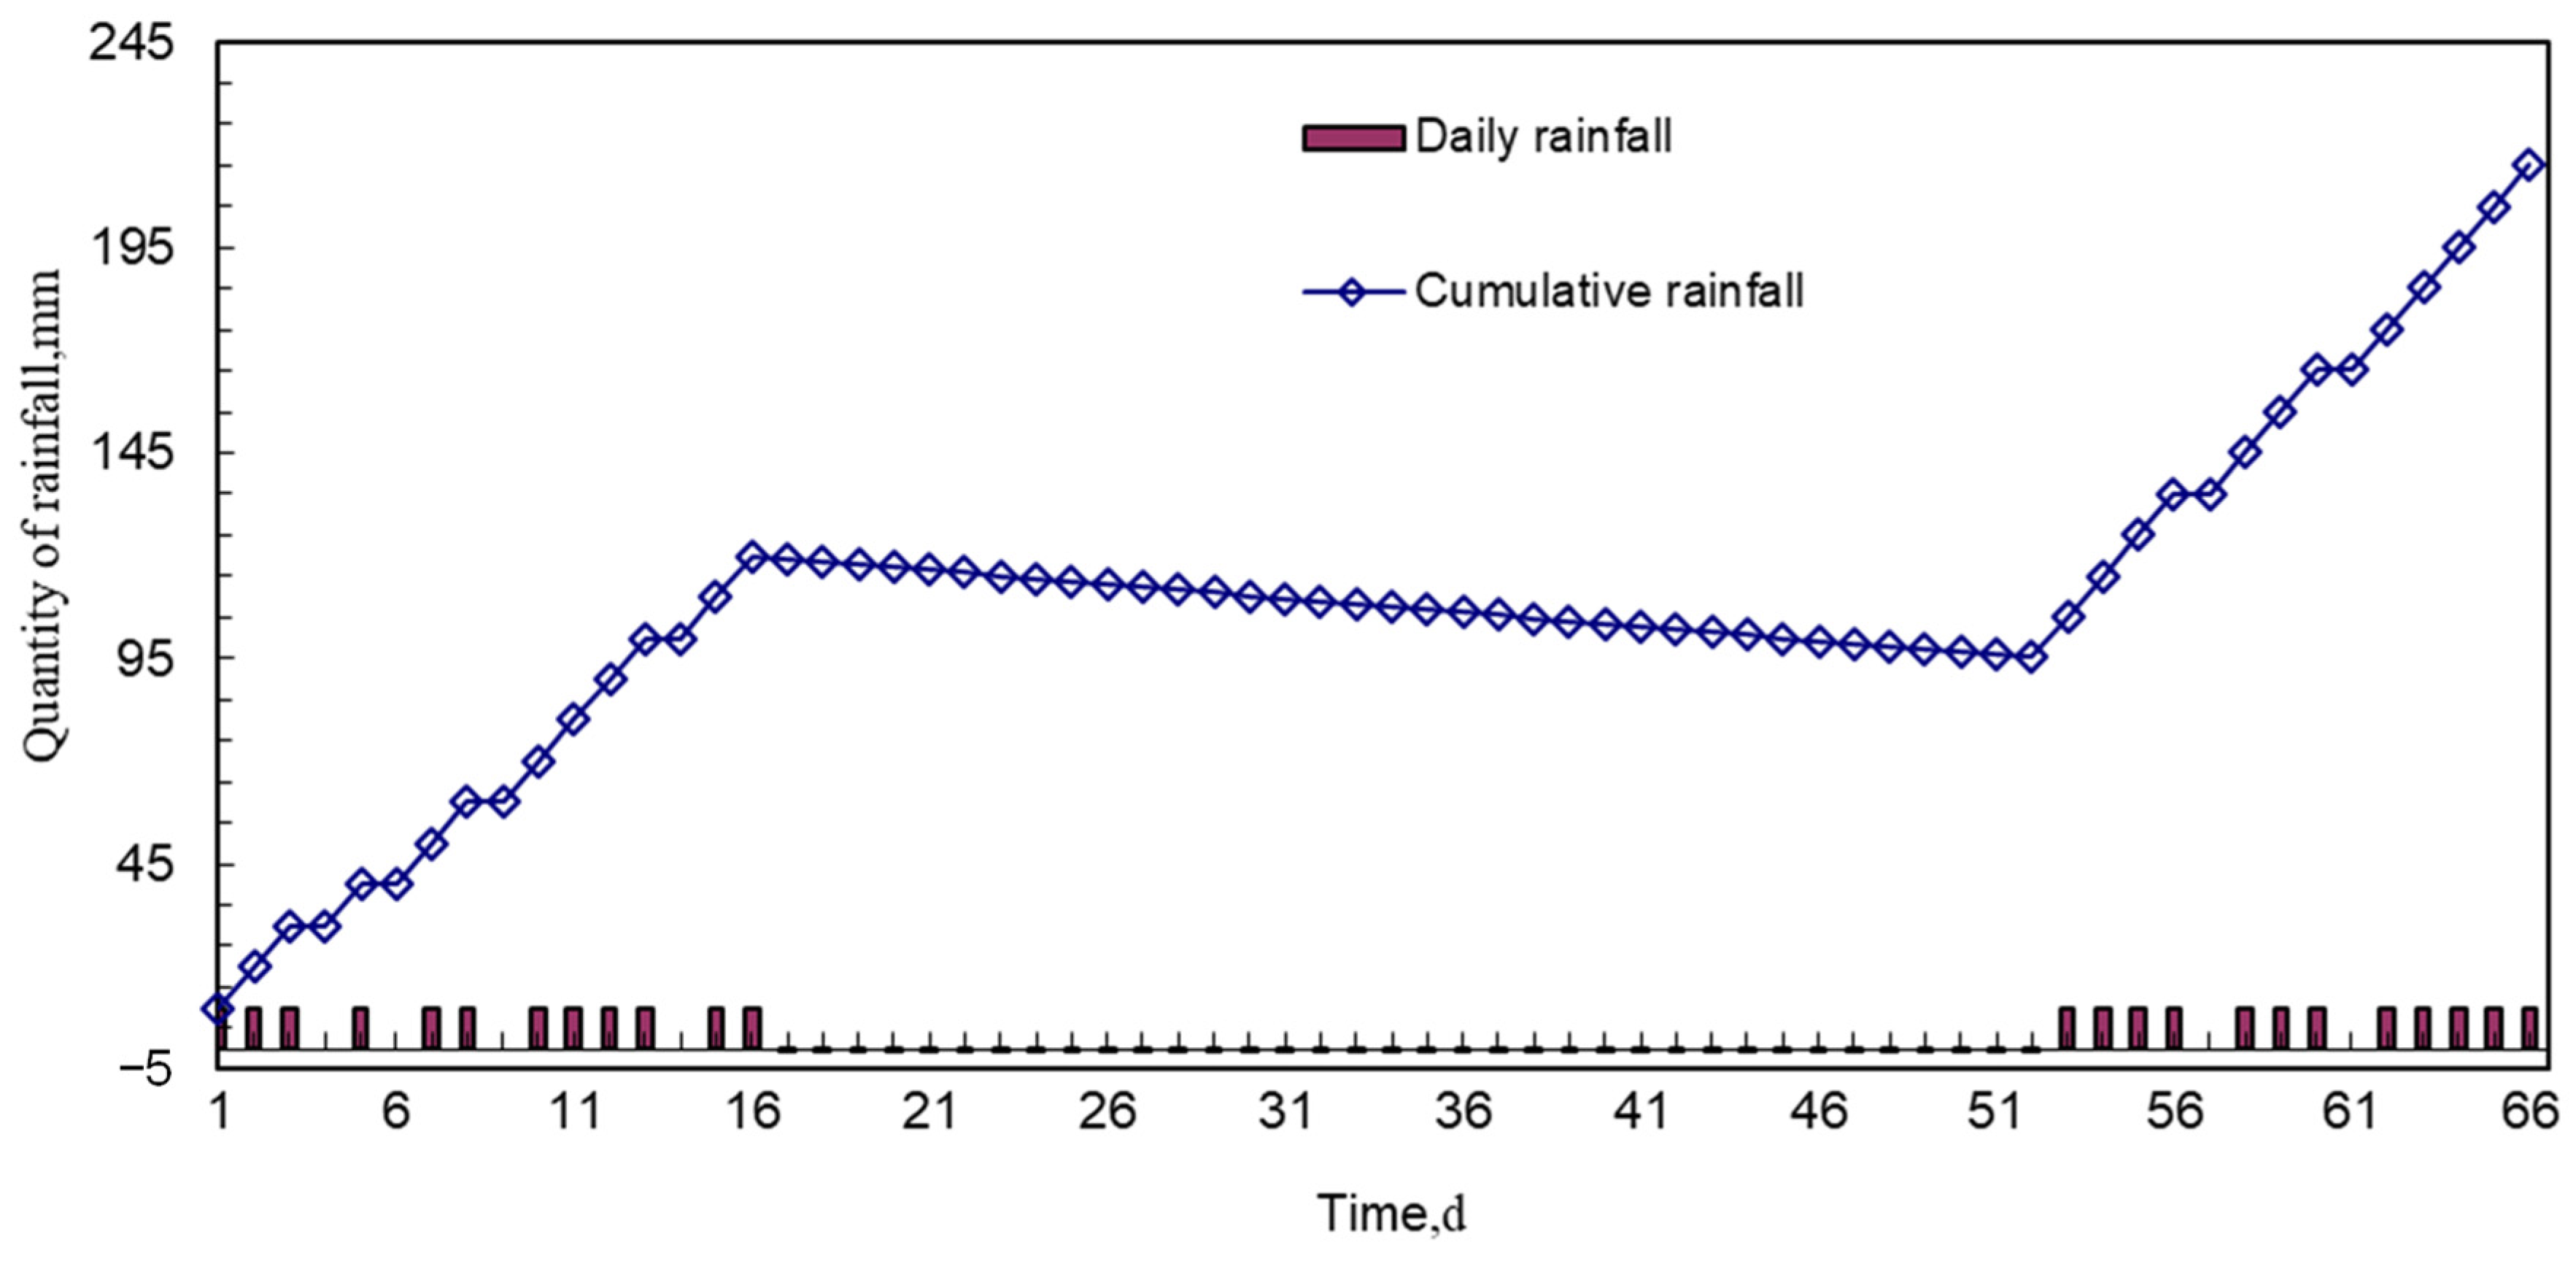
The experiment included three phases: an initial rainfall phase lasting 16 days (120 mm rainfall), a natural evaporation phase lasting 36 days (24.84 mm evaporation), and a second rainfall phase lasting 14 days (120 mm rainfall). Evaporation effects were considered minimal during concentrated rainfall periods, as the daily evaporation rate (0.69 mm) was far lower than the daily rainfall. The total rainfall over the experiment, accounting for evaporation, was calculated to be 215.16 mm, as shown in
Figure 9.
5.4. Monitoring and Control
Before rainfall begins, the initial values of all monitored physical parameters should be recorded to establish the slope’s initial moisture content and stress-strain state distribution. During the initial phase of rainfall, intensive monitoring of all physical parameters is required. In the first two days of each rainfall stage, measurements should be taken 2–3 times daily, with each measurement conducted during rainfall intervals. The cumulative rainfall at the time of each measurement should also be recorded. In the later stages of rainfall, measurements can be reduced to 1–2 times daily, ensuring cumulative rainfall is recorded during each monitoring session.
The monitoring of soil moisture content changes combines measurements from moisture sensors and soil sampling. PR2/4 moisture sensors can directly measure soil moisture at depths of 10, 20, 30, and 40 cm below the slope surface. For surface soil moisture, sampling should be conducted daily after rainfall ends to determine the moisture content. This ensures accurate monitoring of both surface and subsurface moisture conditions.
Throughout the experiment, slope deformation characteristics should be observed and recorded at irregular intervals. If landslides occur, the number of occurrences, specific locations, scales, and forms of the landslides should be documented in detail. This will provide comprehensive data for analyzing slope stability under simulated rainfall conditions.
6. Result Analysis
6.1. Fracture Characteristics and Surface Morphology
After a compacted and filled slope undergoes a period of static treatment, fractures gradually develop. As moisture is lost, matric suction increases, leading to the formation of wide primary fractures in areas of stress concentration. Smaller secondary fractures branch out from these wide fractures, and the process continues, forming layers of fractures that eventually develop into numerous microfractures. Meanwhile, various small fractures gradually extend and widen, eventually connecting to form larger fractures. Through these repeated processes, a large number of fractures develop on the slope surface and within the slope body, reducing the overall integrity of the slope and maintaining a high degree of consistency with actual engineering conditions. During different stages of continuous rainfall, slope deformation presents in various forms.
In the early stages of rainfall, soil deformation is characterized by the shrinkage and closure of fractures. As water is supplied, some of it gradually infiltrates through the soil surface, while a significant amount rapidly moves through the fractures. The water flows through the connected fractures into the interior of the slope, causing the soil to swell as it absorbs water, leading to deformation. During this process, noticeable changes occur in both the morphology and quantity of the fractures.
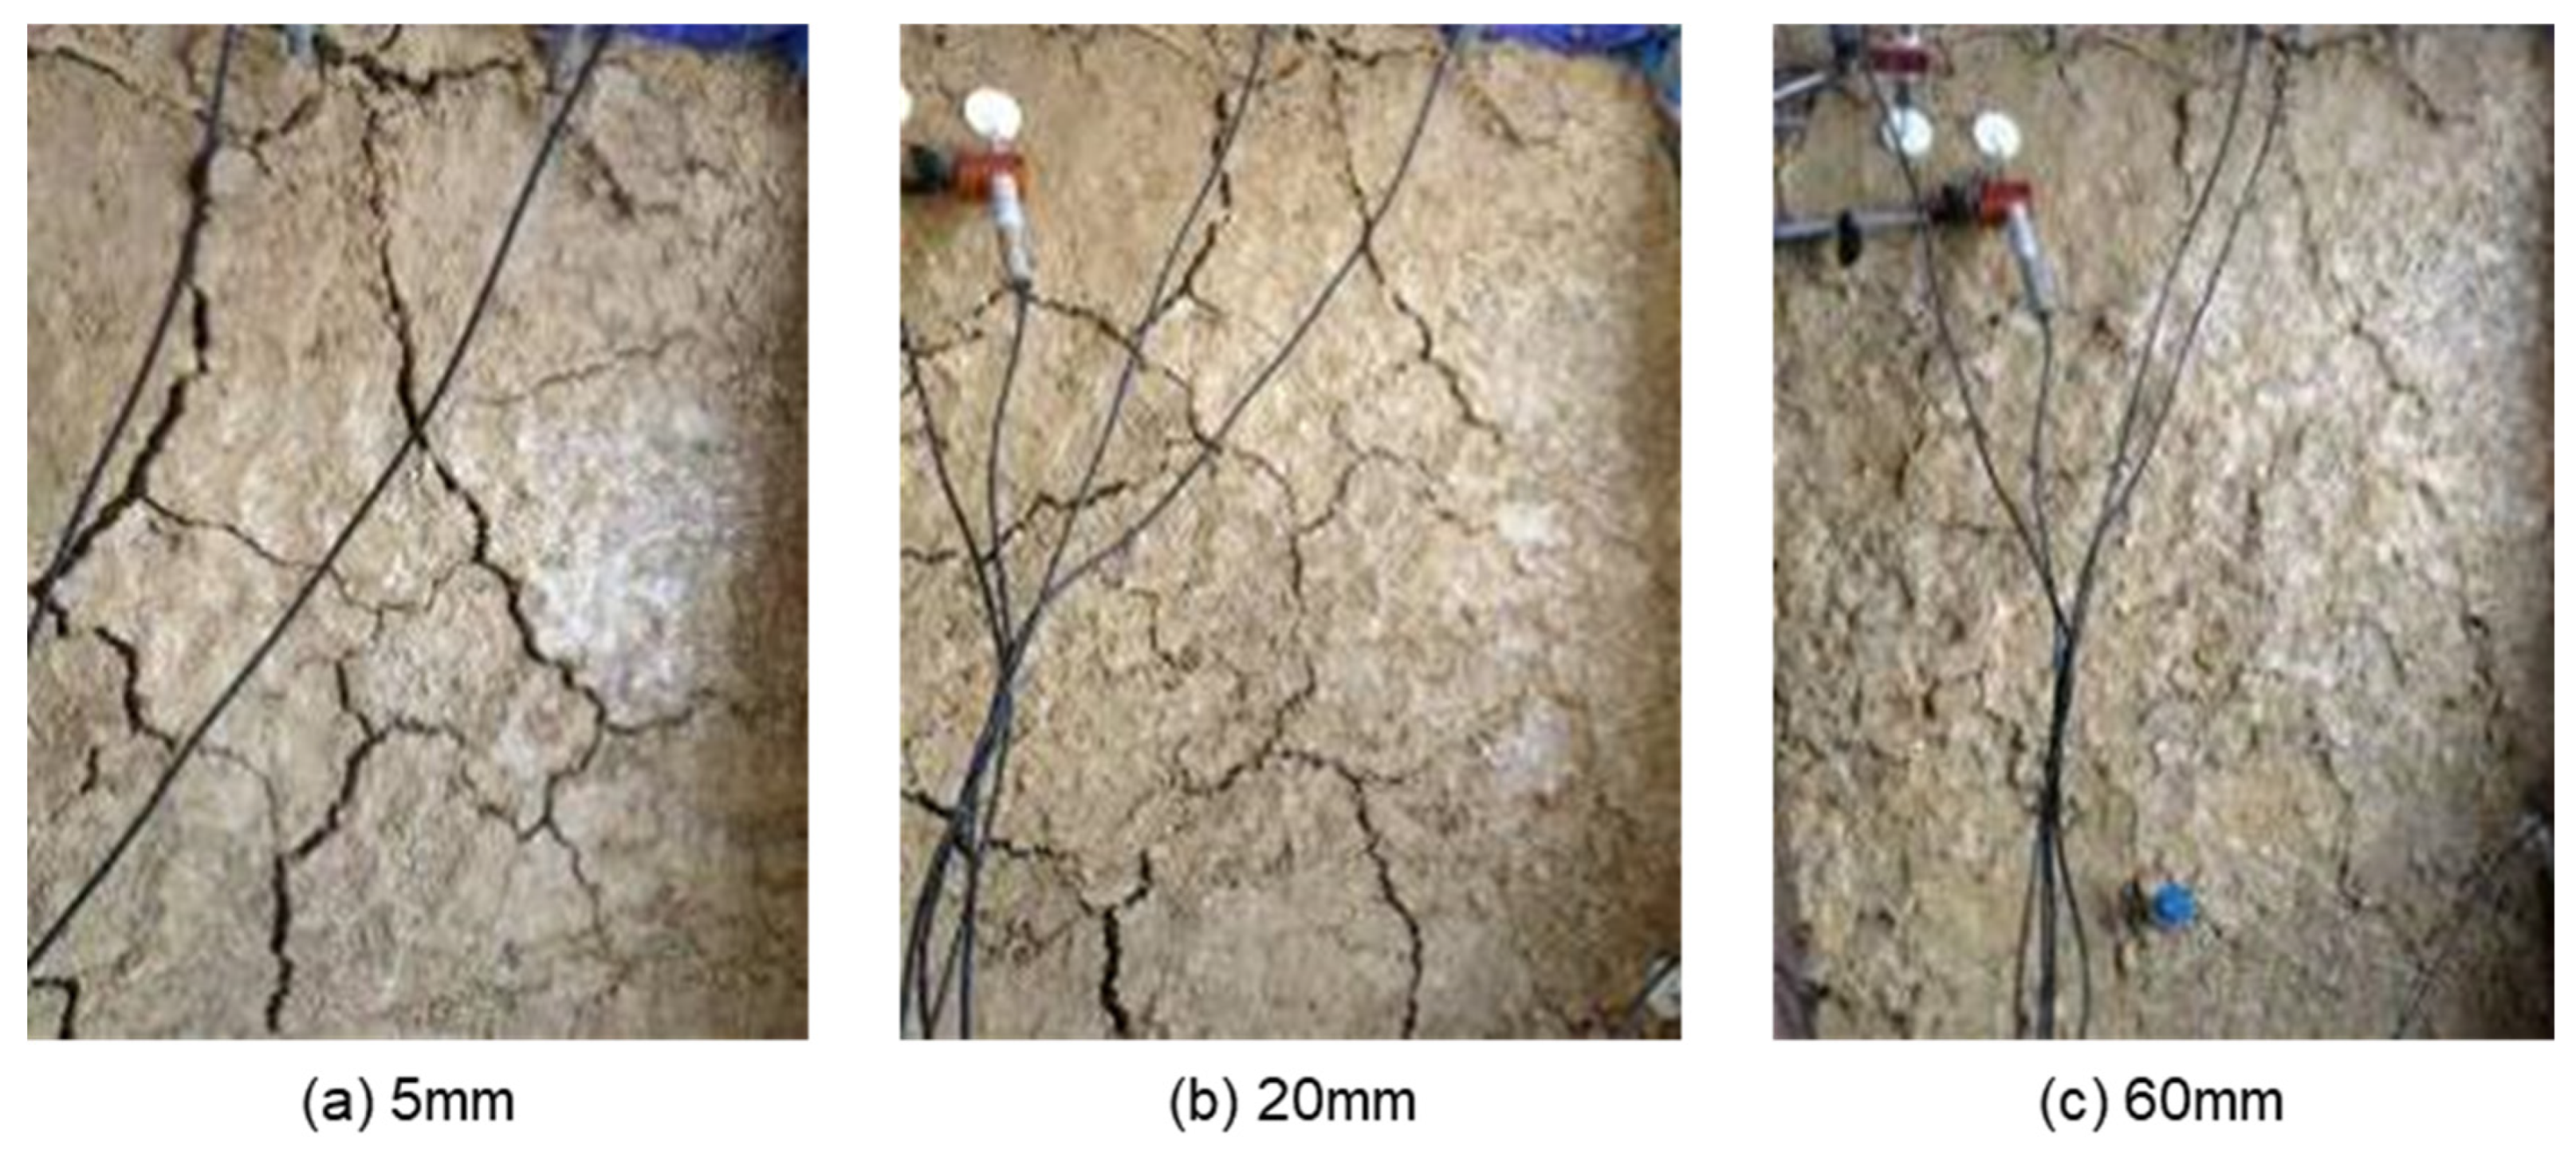
Figure 10 illustrates the changes in the local fracture morphology below the slope crest during different stages of rainfall.
From
Figure 10, it can be observed that during the initial stage of rainfall, changes in fractures are not significant. When the rainfall reaches 20 mm, the fracture width is significantly reduced compared to the 5 mm rainfall stage, with noticeable shrinkage of wider fractures. This phase is identified as the fracture shrinkage stage, during which the number of fractures does not change significantly. At 60 mm of rainfall, most major fractures have disappeared, and the number of fractures is greatly reduced. This phase is referred to as the fracture closure stage, during which the fractures in the soil have essentially closed.
As water continues to be supplied, the soil absorbs more moisture and undergoes swelling deformation, which manifests in a different way, specifically as localized and overall uplift. Due to the swelling effect of expansive soil, deformation continues to develop in an unconfined direction. The soil surface exhibits irregular uplift, becoming uneven. At different positions along the same section, surface deformation varies due to stress unevenness. In areas with higher compaction and fewer fractures, the swelling deformation is less pronounced because the expansive soil has poorer permeability, making it difficult for water to infiltrate. However, overall, the deformation characteristics of different parts of the slope are relatively distinct.
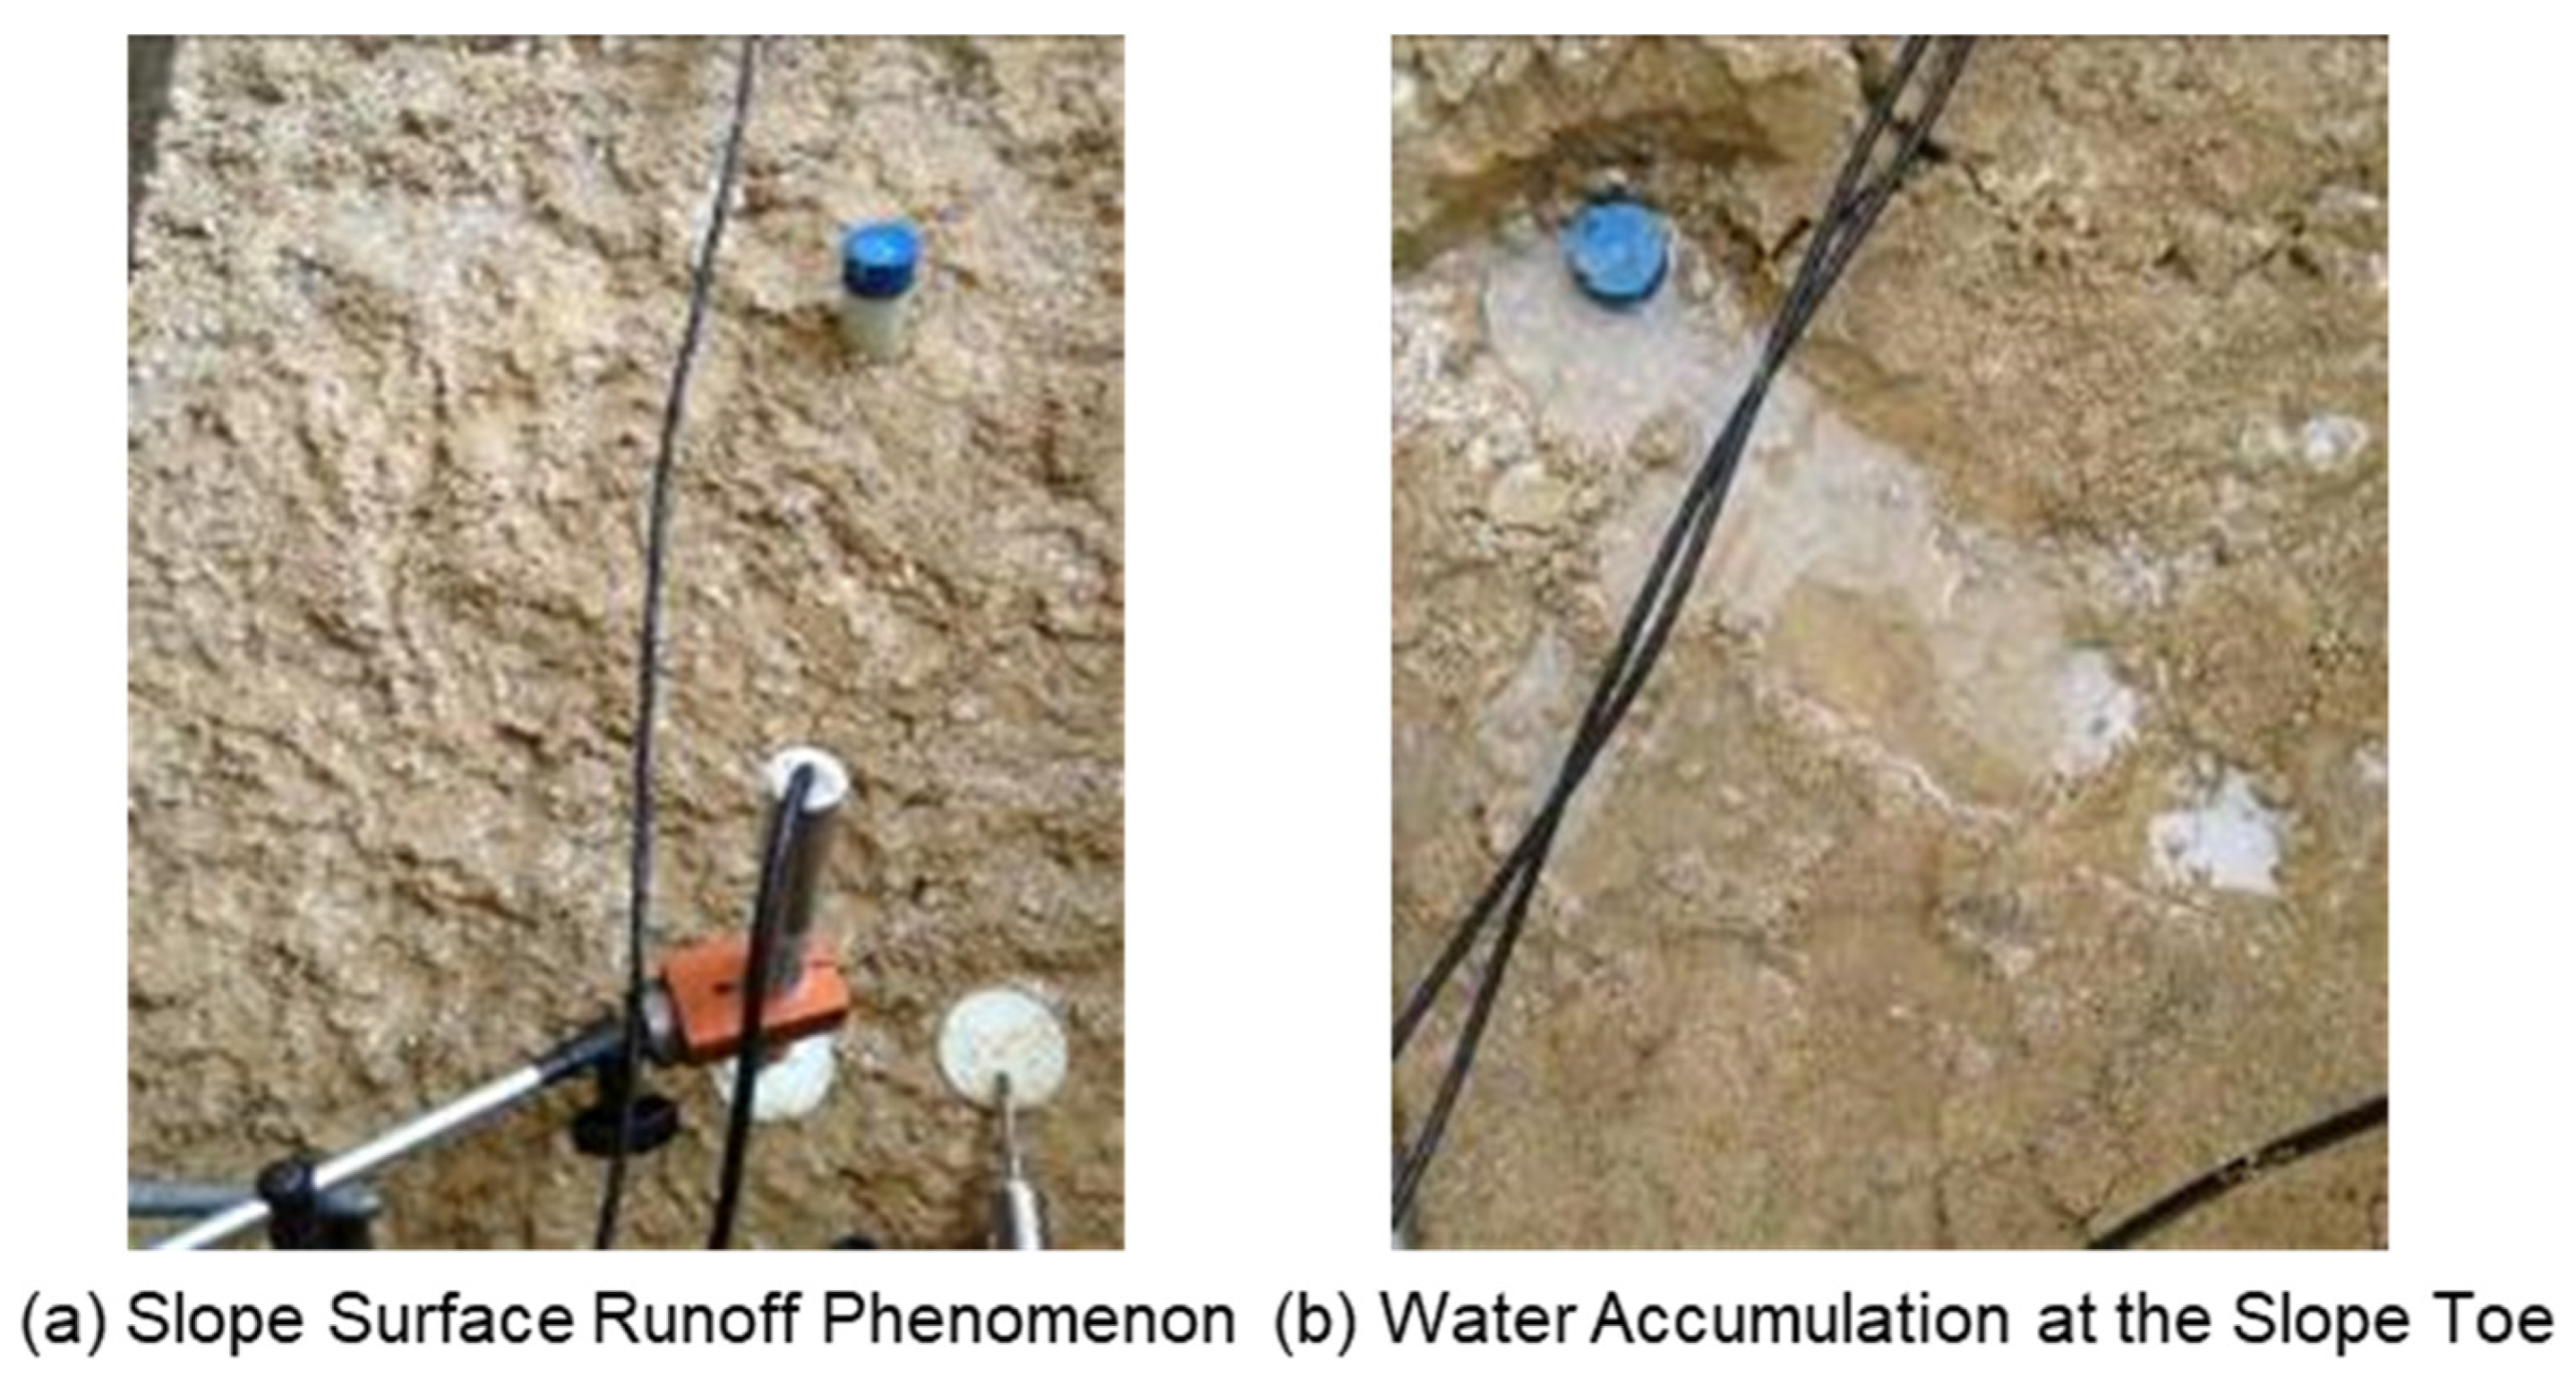
Expansive soils, especially highly expansive soils, have very poor permeability, with hydraulic conductivity often below 10
−6 m/s. As a result, in the absence of significant fractures, water infiltration is extremely difficult. In this model experiment, a self-designed small-scale low-flux dripping rainfall system was employed to ensure a low-speed continuous water supply, matching the seepage characteristics of expansive soil slopes. However, after rainfall reaches a certain stage and fractures have fully closed, water infiltration depends solely on the permeability of the expansive soil itself. At this point, the slope surface still exhibits the typical runoff characteristics of expansive soil slopes (see
Figure 11a). Water accumulation occurs at the slope toe and channel bottom (see
Figure 11b), which aligns well with the actual field conditions.
6.2. Characteristics of Seepage Field Changes in Slopes
As simulated rainfall progresses, water flows down along the slope surface and gradually infiltrates into the soil. At different stages of rainfall, the distribution of the seepage field within the slope exhibits varying states. At different times, the volumetric water content of the soil at various depths was measured using a profile moisture meter and surface sampling tests. Using these values, seepage field contour maps were generated through Kriging interpolation in Surfer 20.1 software.
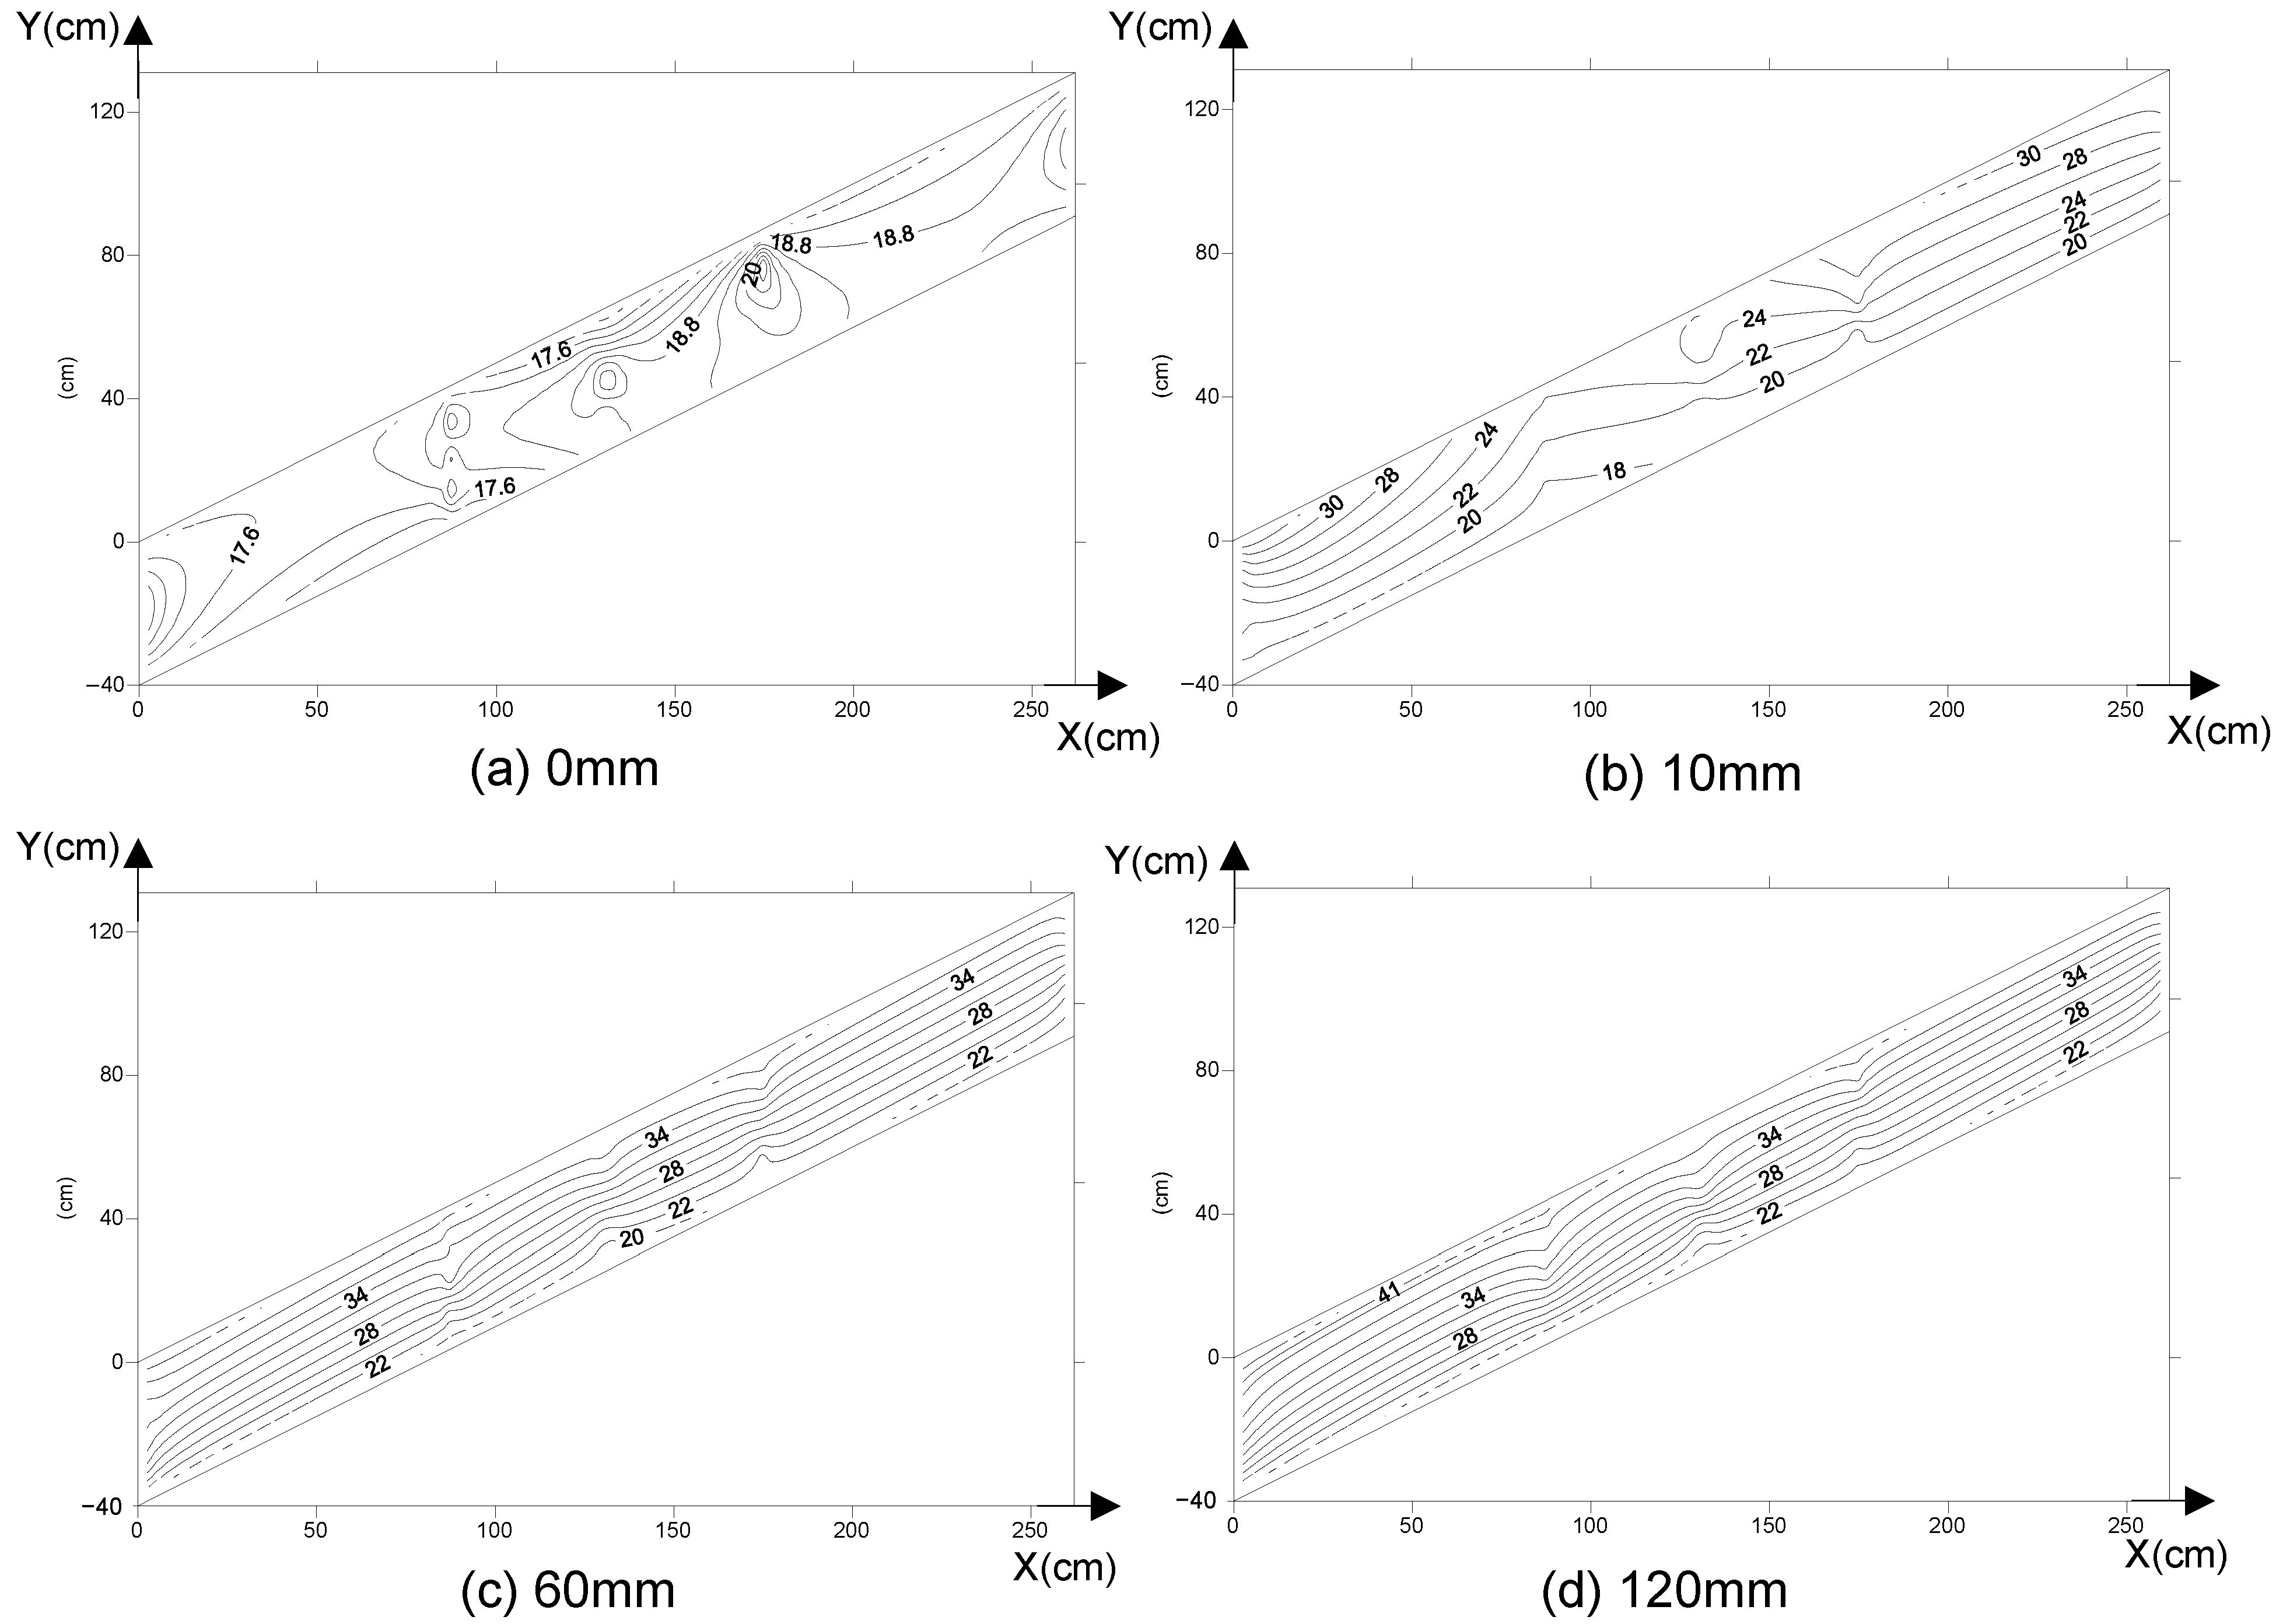
Figure 12 shows the transient seepage field distribution within a depth of 40 cm before rainfall and at rainfall levels of 10 mm, 60 mm, and 120 mm. The distribution state of the moisture content field, when the rainfall reaches 120 mm, is presented as the instantaneous distribution.
It can be observed that, after the slope has been left static for some time, the soil moisture content at the start of the experiment is relatively uniform, ranging between 17% and 20%. As infiltration begins, the presence of numerous fractures causes significant changes in the seepage field even at a rainfall level of 10 mm. The soil moisture content exhibits a stratified distribution, decreasing from shallow to deeper layers. The moisture content of the topmost soil layer increases to 24–30%, while the deeper soil layers show no significant change.
When the rainfall reaches 60 mm, the moisture content contours become roughly parallel to the slope surface and slightly inclined toward the slope toe. The stratification of soil moisture content becomes more pronounced, with each layer exhibiting relatively uniform moisture content. By the end of the staged rainfall, the seepage field contour shape is similar to that observed at 60 mm of rainfall, with only an increase in the numerical values of soil moisture content. This indicates that the seepage field has approached a state of equilibrium at this stage of rainfall, with infiltration becoming stable and uniform.
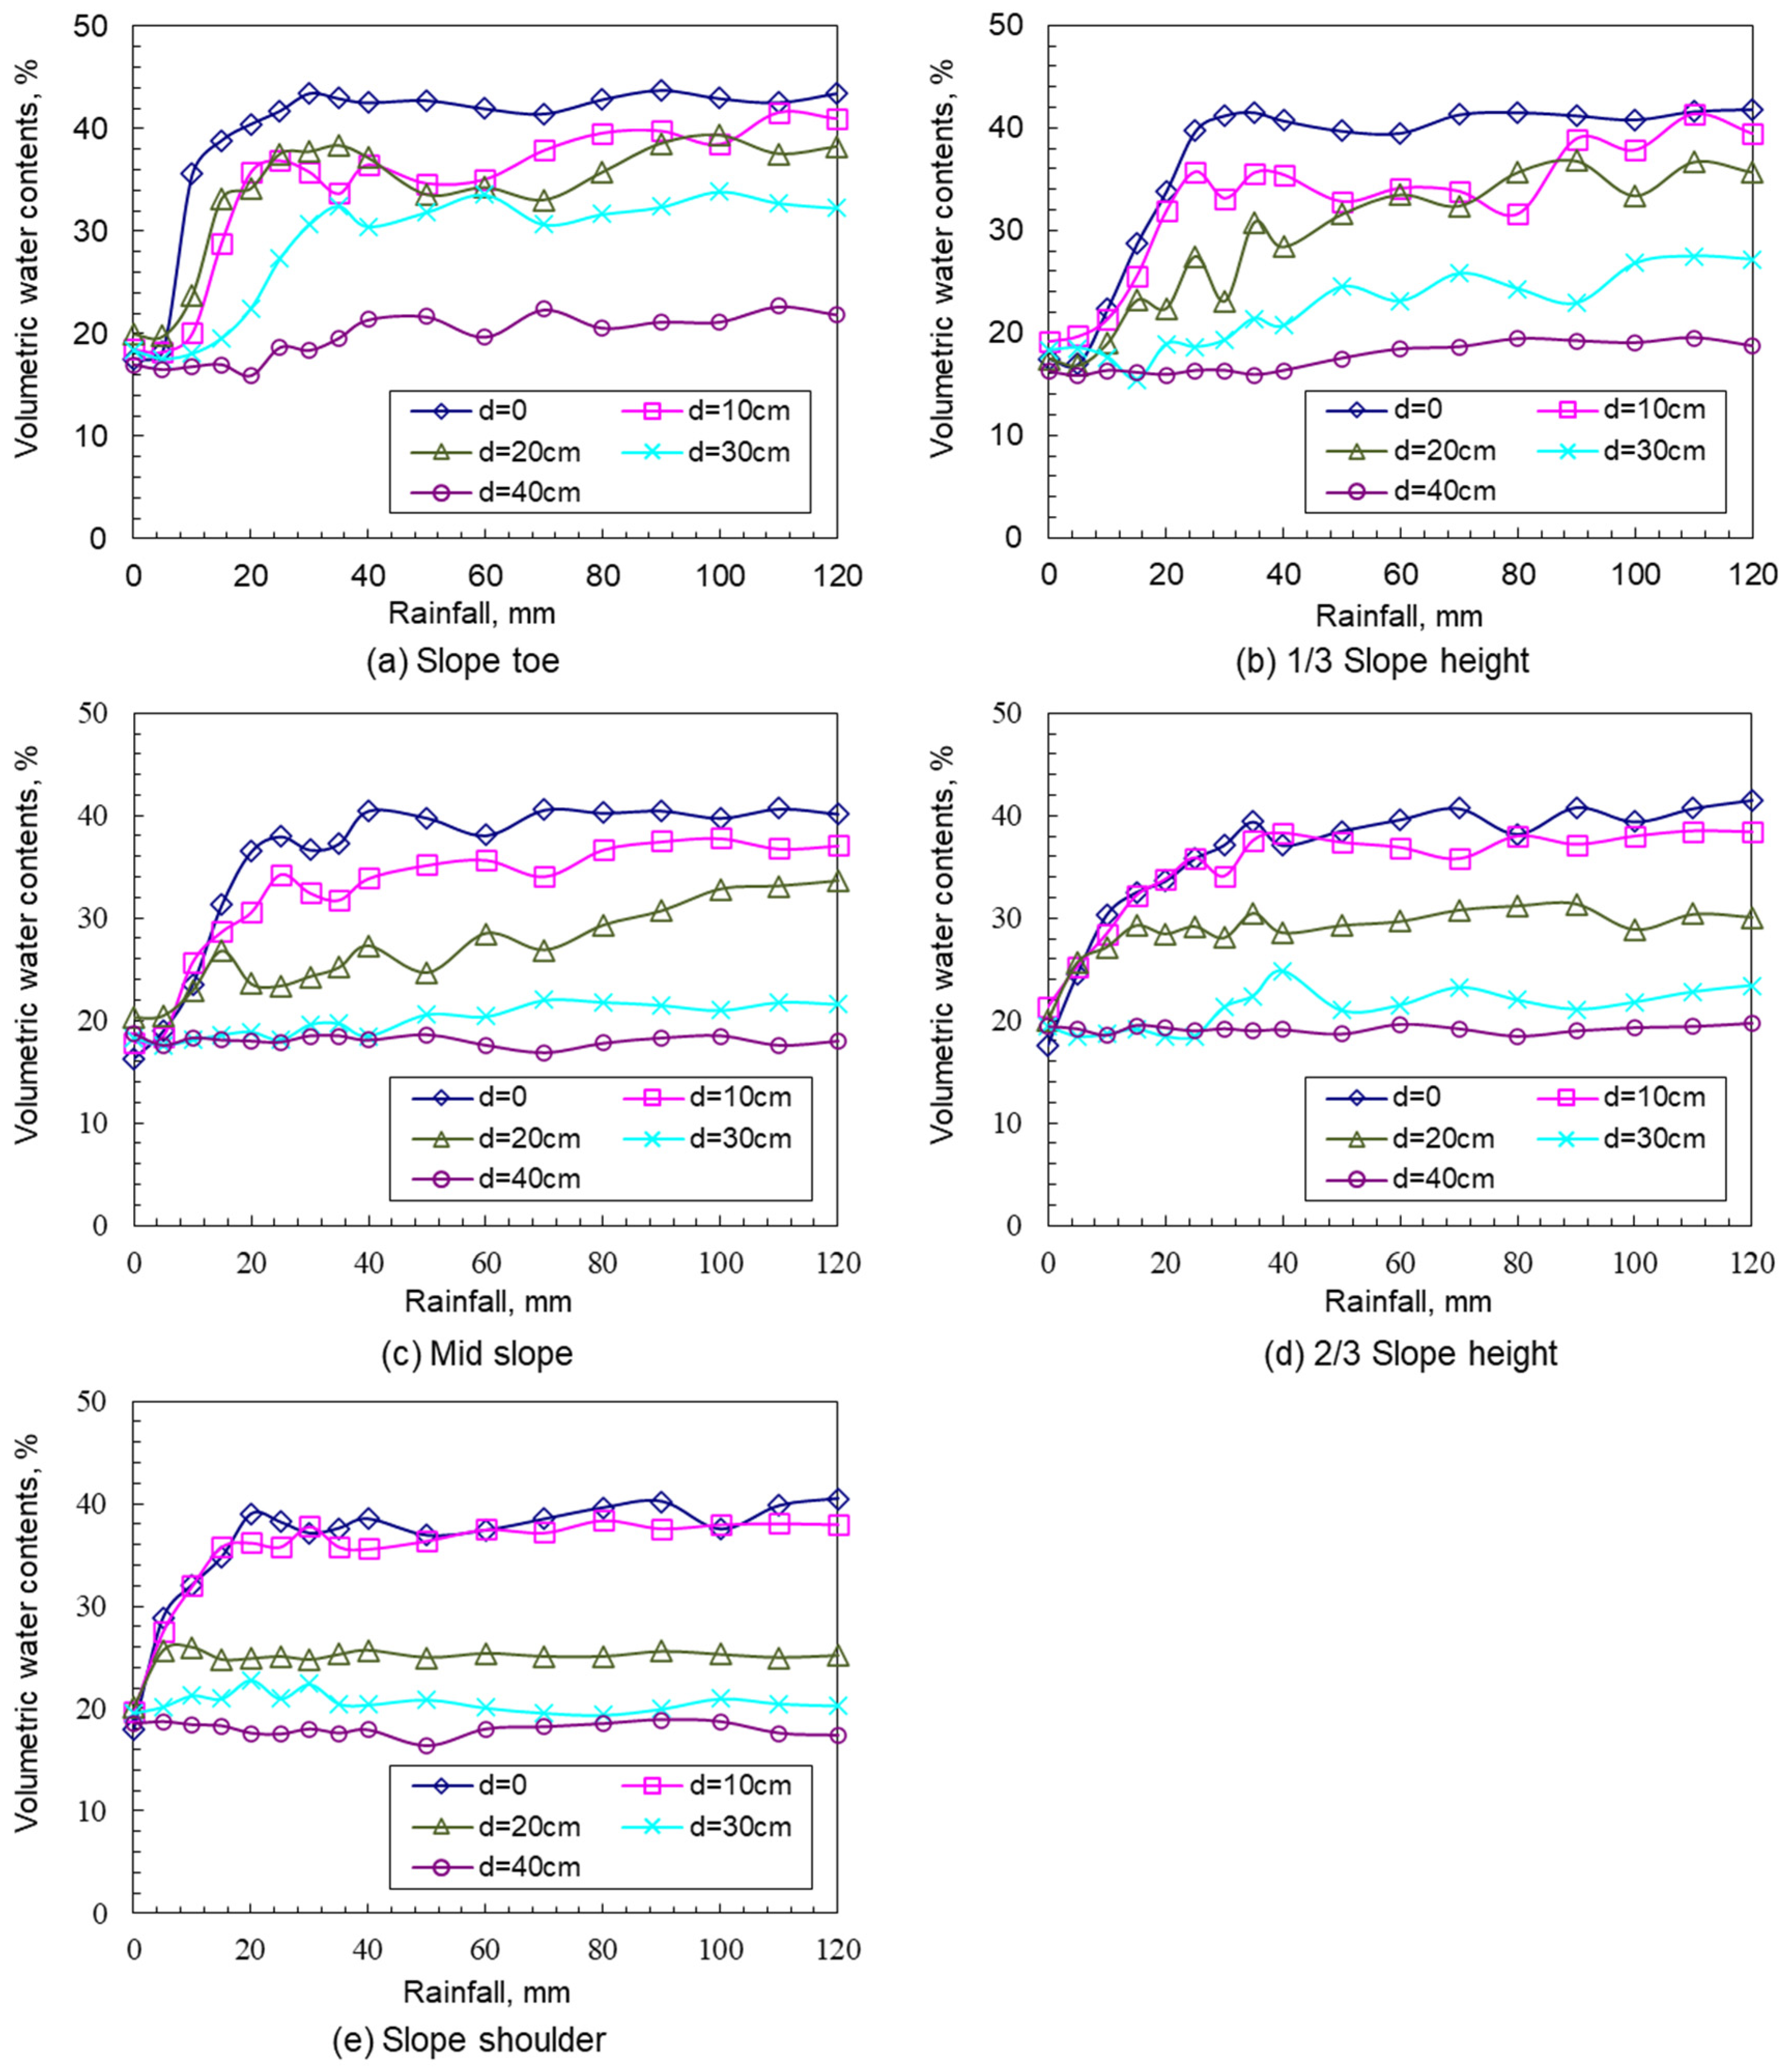
Five sections were selected for observing the seepage field: the slope toe, 1/3 slope height, the middle of the slope, 2/3 slope height, and the slope crest.
Figure 13 presents the time-history curves of soil moisture content at various depths within these five sections. From the figure, it can be observed that due to the specific characteristics of the rainfall system and the unique rainfall pattern, the typical time-history curves of the seepage field exhibit four stages: “initiation phase–rapid growth phase–slow growth phase–stable phase.” The moisture content changes over time for soils at different depths, and sections show distinct patterns, with some sections missing certain characteristic stages.
At the same section, soil closer to the surface experiences faster moisture content growth during the initial infiltration phase. The surface soil’s moisture content generally increases rapidly at first and then remains constant for most of the time. As depth increases, the changes in soil moisture content display noticeable lag, with a gradual transition to a slow increase until it stabilizes. Taking the middle of the slope as an example, the moisture content of soil within the top 10 cm increases the fastest at the beginning, stabilizing after reaching a certain value. At 20 cm depth, the initial growth rate is relatively fast. For soil at 20–30 cm depth, the moisture content grows slowly throughout the infiltration process, while at 40 cm depth, there is no significant change in moisture content.
Across different sections, from the slope toe to the slope crest, the surface soil moisture content growth rate in the initial stage decreases as slope height increases, and the variation in deep soil moisture content becomes less pronounced. At the middle of the slope, the moisture content at 20 cm depth shows a slow increase over time, while at 30–40 cm depth, it remains almost unchanged throughout infiltration. At the slope crest, the depth of soil where moisture content does not change reduces to 20 cm.
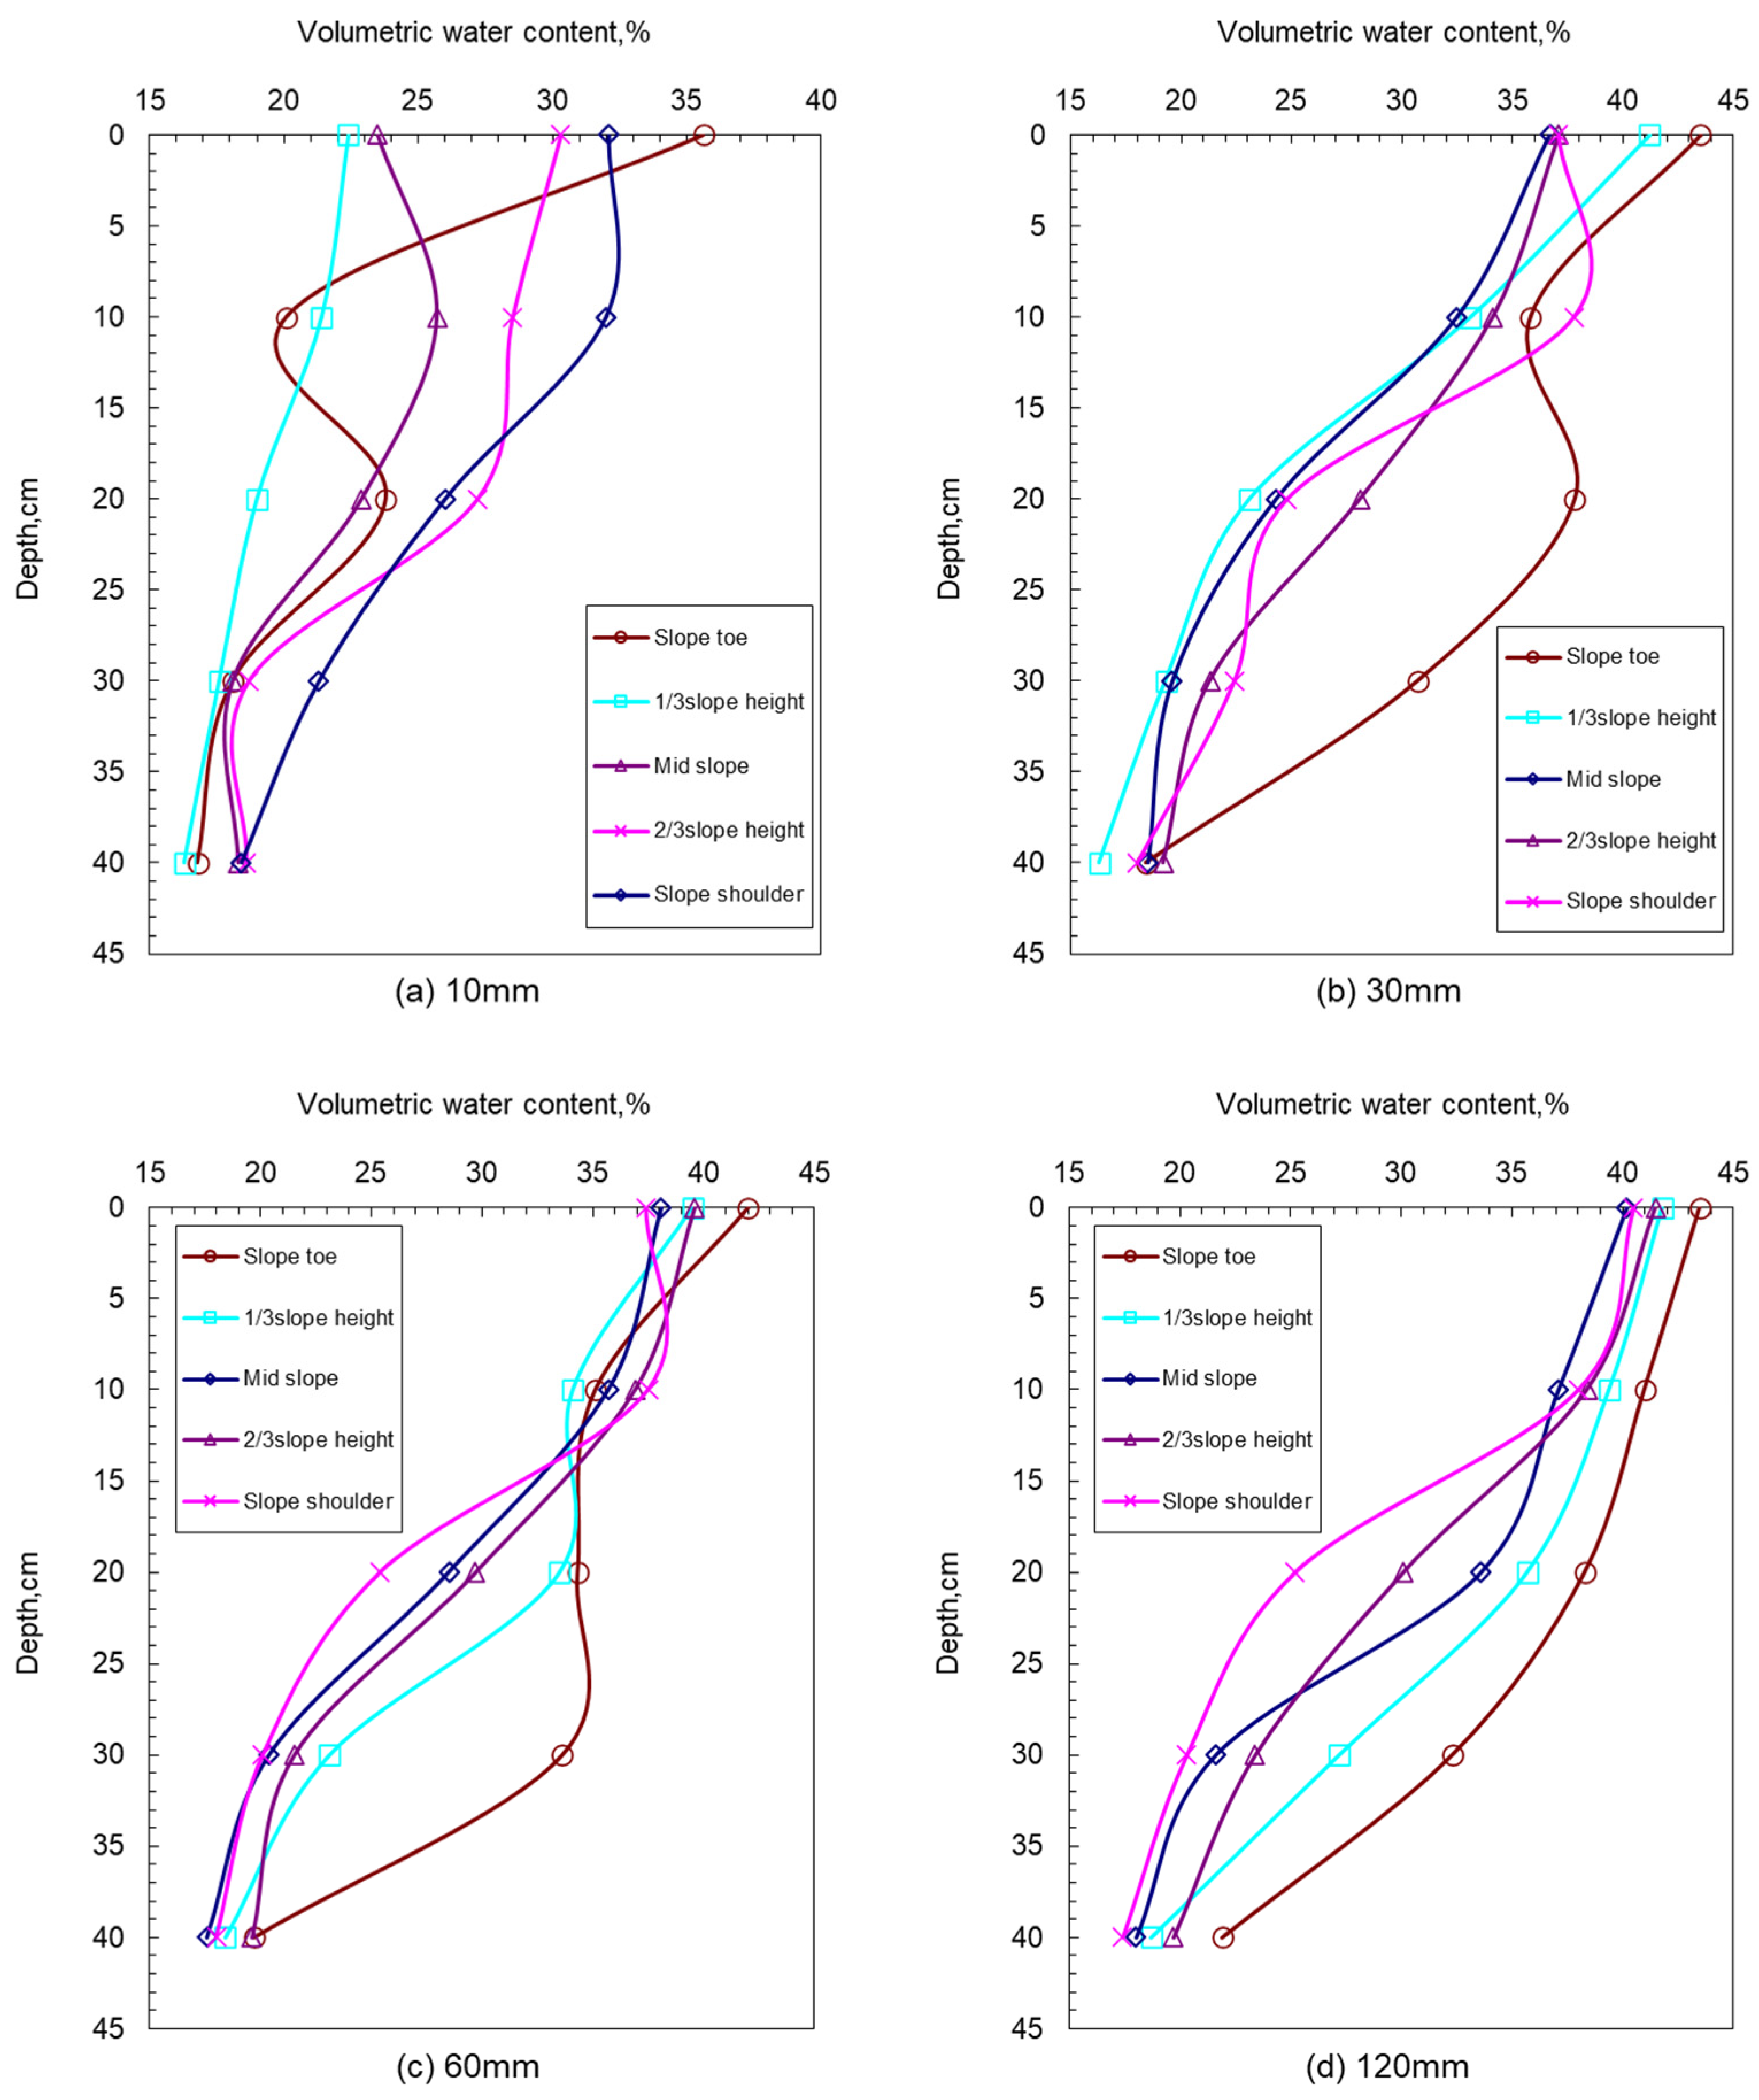
Figure 14 shows the spatial distribution of moisture content at various typical sections of the slope during different moments of rainfall infiltration. It can be observed that during all stages of infiltration, the moisture content of the surface soil on the slope remains the highest, while the moisture content below 40 cm depth shows little variation. In the initial infiltration stage, there is a clear stratification in moisture content: the top 10 cm of soil exhibits high moisture content, followed by the 20 cm depth, while below 30 cm, the moisture content is low with minimal variation across different locations.
As infiltration progresses, the moisture content within the top 15 cm of soil approaches or reaches saturation, with minimal differences across locations. At depths of 20–30 cm, moisture content varies with the slope position, showing a trend of lower values at the upper slope and higher values at the lower slope. However, at greater depths, the soil moisture content remains close to its initial value. Towards the later stages of rainfall, the gradient distribution of soil moisture content becomes increasingly pronounced.
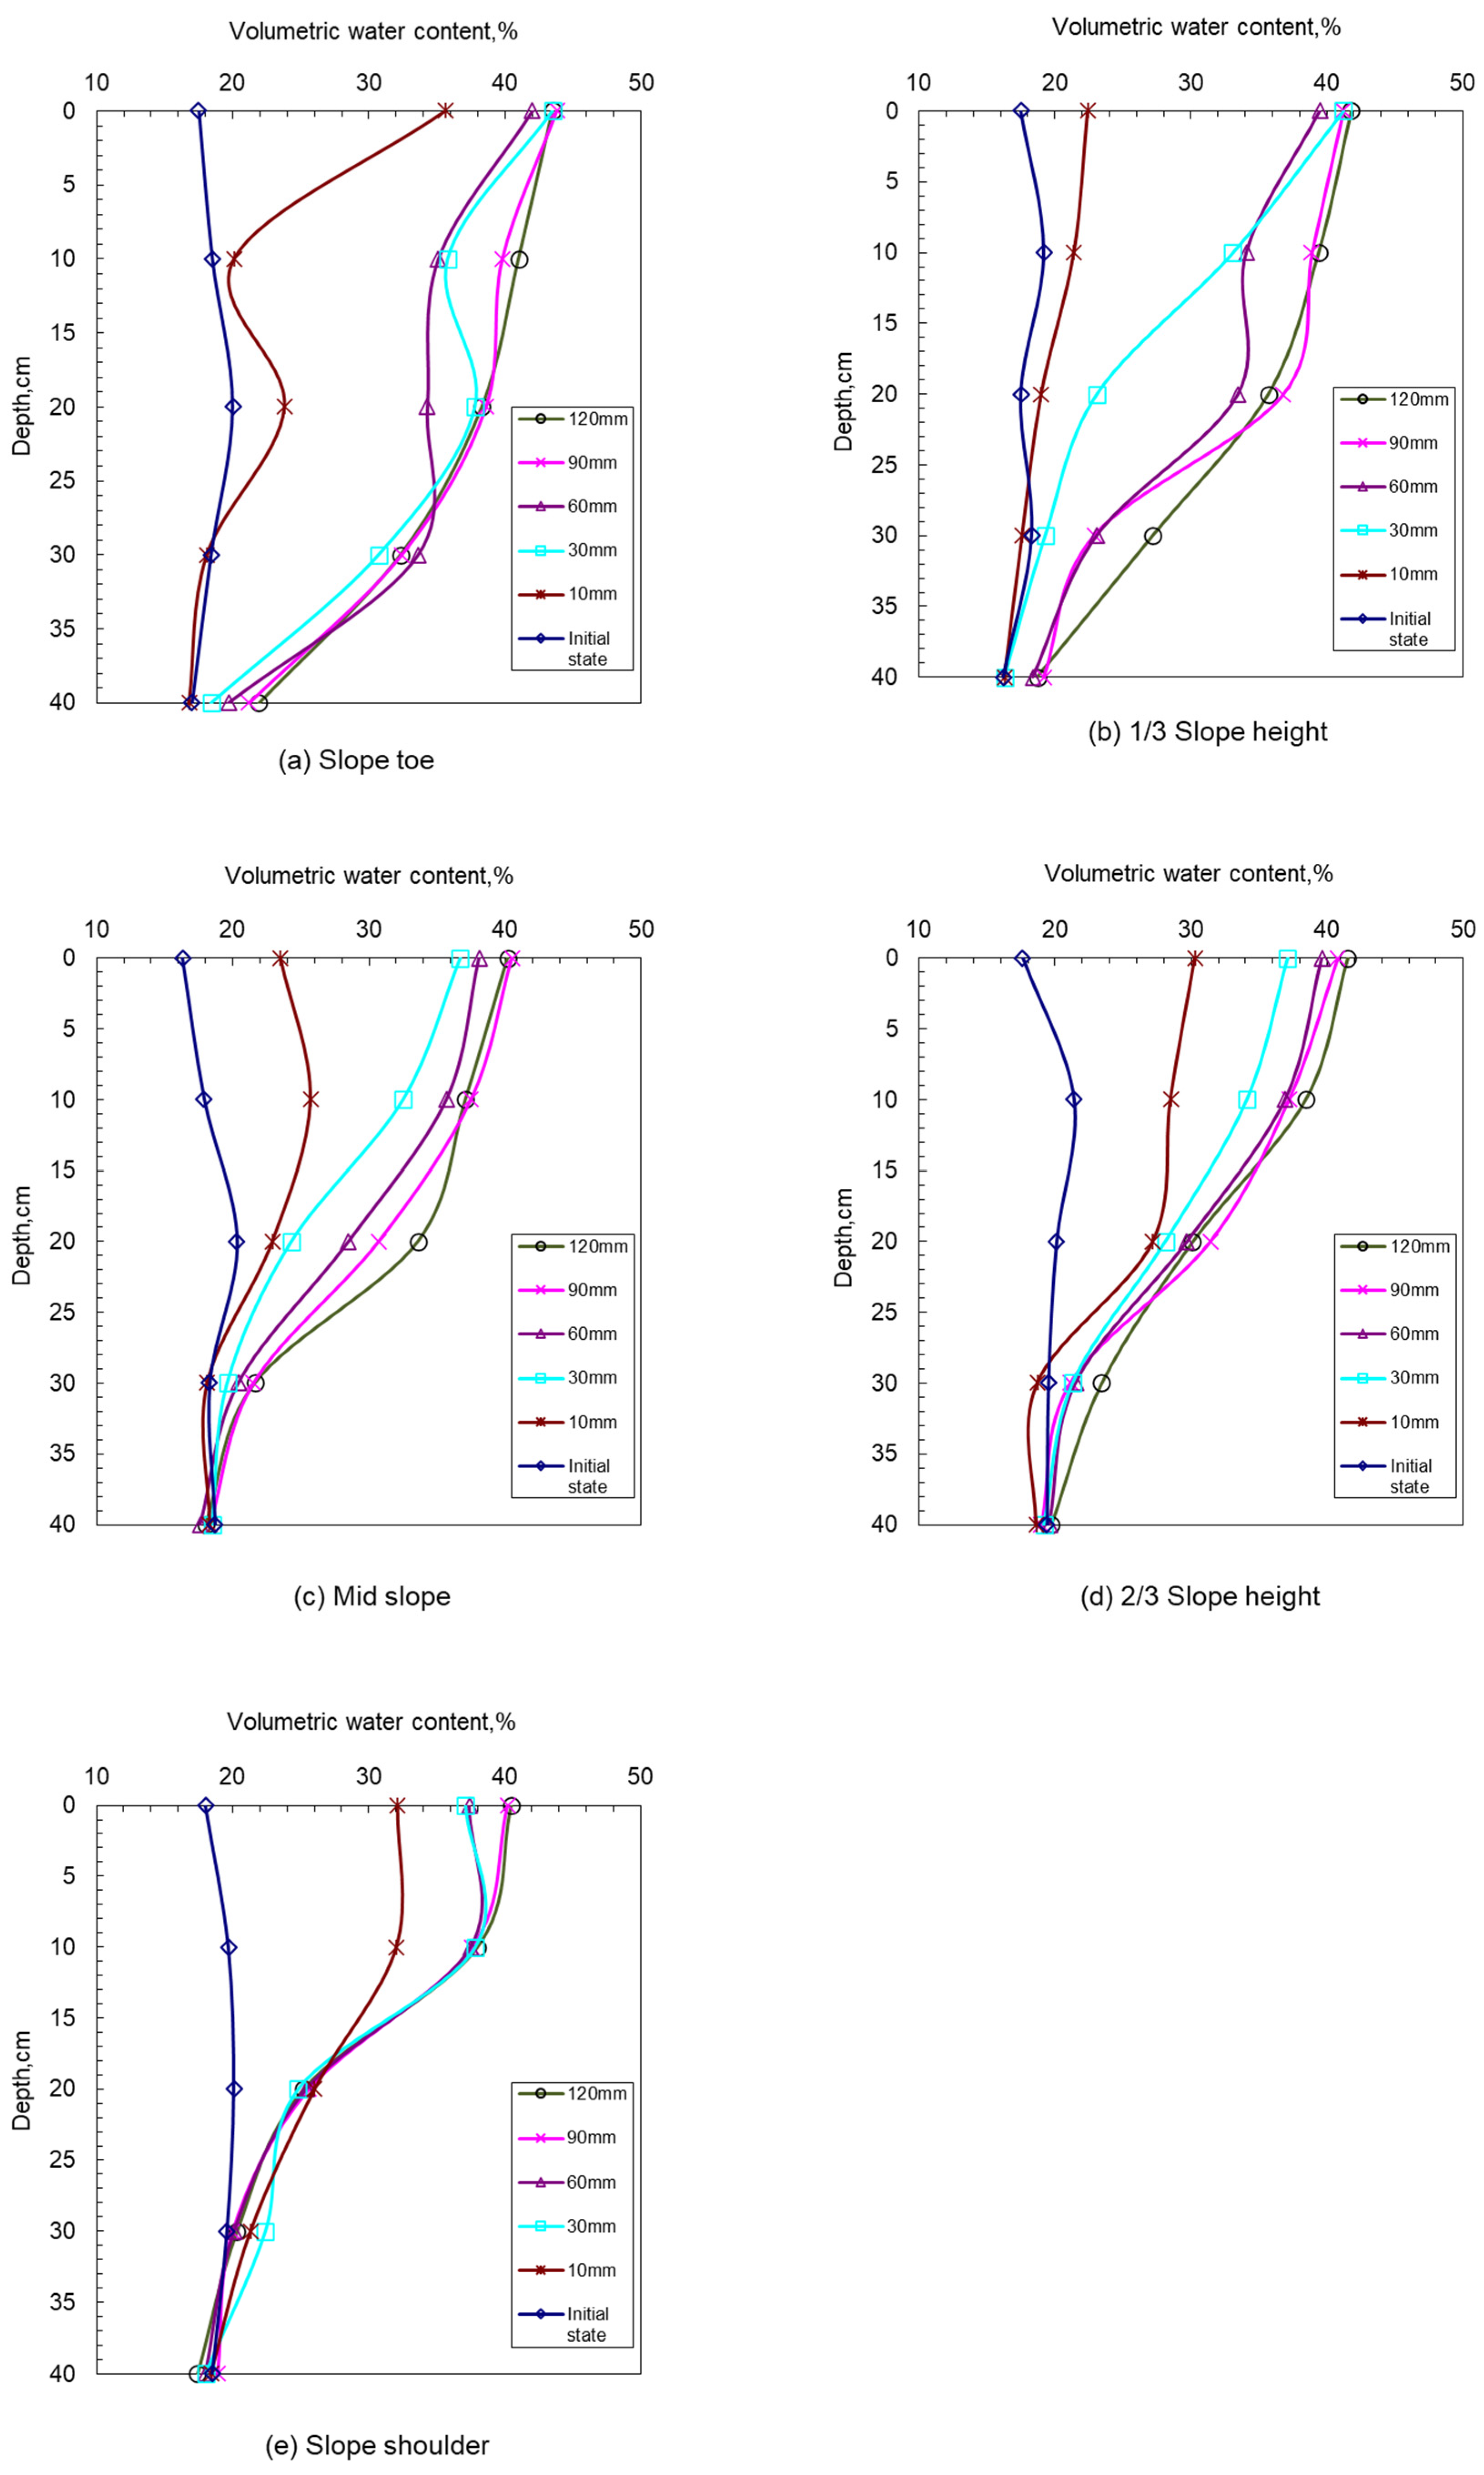
Figure 15 illustrates the relationship between rainfall and the distribution of soil moisture content at different sections of the slope. At the slope toe, moisture content changes are the most significant. When rainfall reaches 10 mm, the surface soil saturation reaches approximately 80% (here, the surface soil was considered saturated when its moisture content reached approximately 43%, since further rainfall no longer increased the measured value), and at 20 mm, the soil within a 30 cm depth is nearly saturated. With continued infiltration, the moisture content within this depth stabilizes at a highly saturated state, while at 40 cm depth, it increases slowly, eventually stabilizing at about 50% saturation. Above the slope toe and below the slope crest, the moisture content exhibits a similar pattern. The surface soil approaches saturation at 30 mm of rainfall and remains at 80–90% saturation, while the moisture content at depths of 15–25 cm continues to increase over time, with higher saturation levels near the slope toe. At greater depths, the moisture content remains largely unchanged, staying near its initial value. At the slope crest, moisture content changes are limited to the top 20 cm of soil, while below 20 cm, it remains stable near the initial value. No gradual increase in moisture content is observed; instead, it stabilizes after reaching a certain value. The surface saturation stabilizes at approximately 80–85%, at 20 cm depth at around 55%, and below 20 cm at approximately 45%.
Based on the above analysis, it can be concluded that the soil moisture content in the slope increases slowly during infiltration and generally reaches a stable value. This stable value is influenced by both depth and rainfall amount. According to the results of this model experiment, for highly expansive soil with poor permeability under a continuous light rainfall pattern, the surface soil moisture content reaches saturation and stabilizes when the rainfall amount reaches approximately 30 mm. When the rainfall amount reaches about 90 mm, the overall moisture content of the slope achieves a stable state.
6.3. Surface Deformation
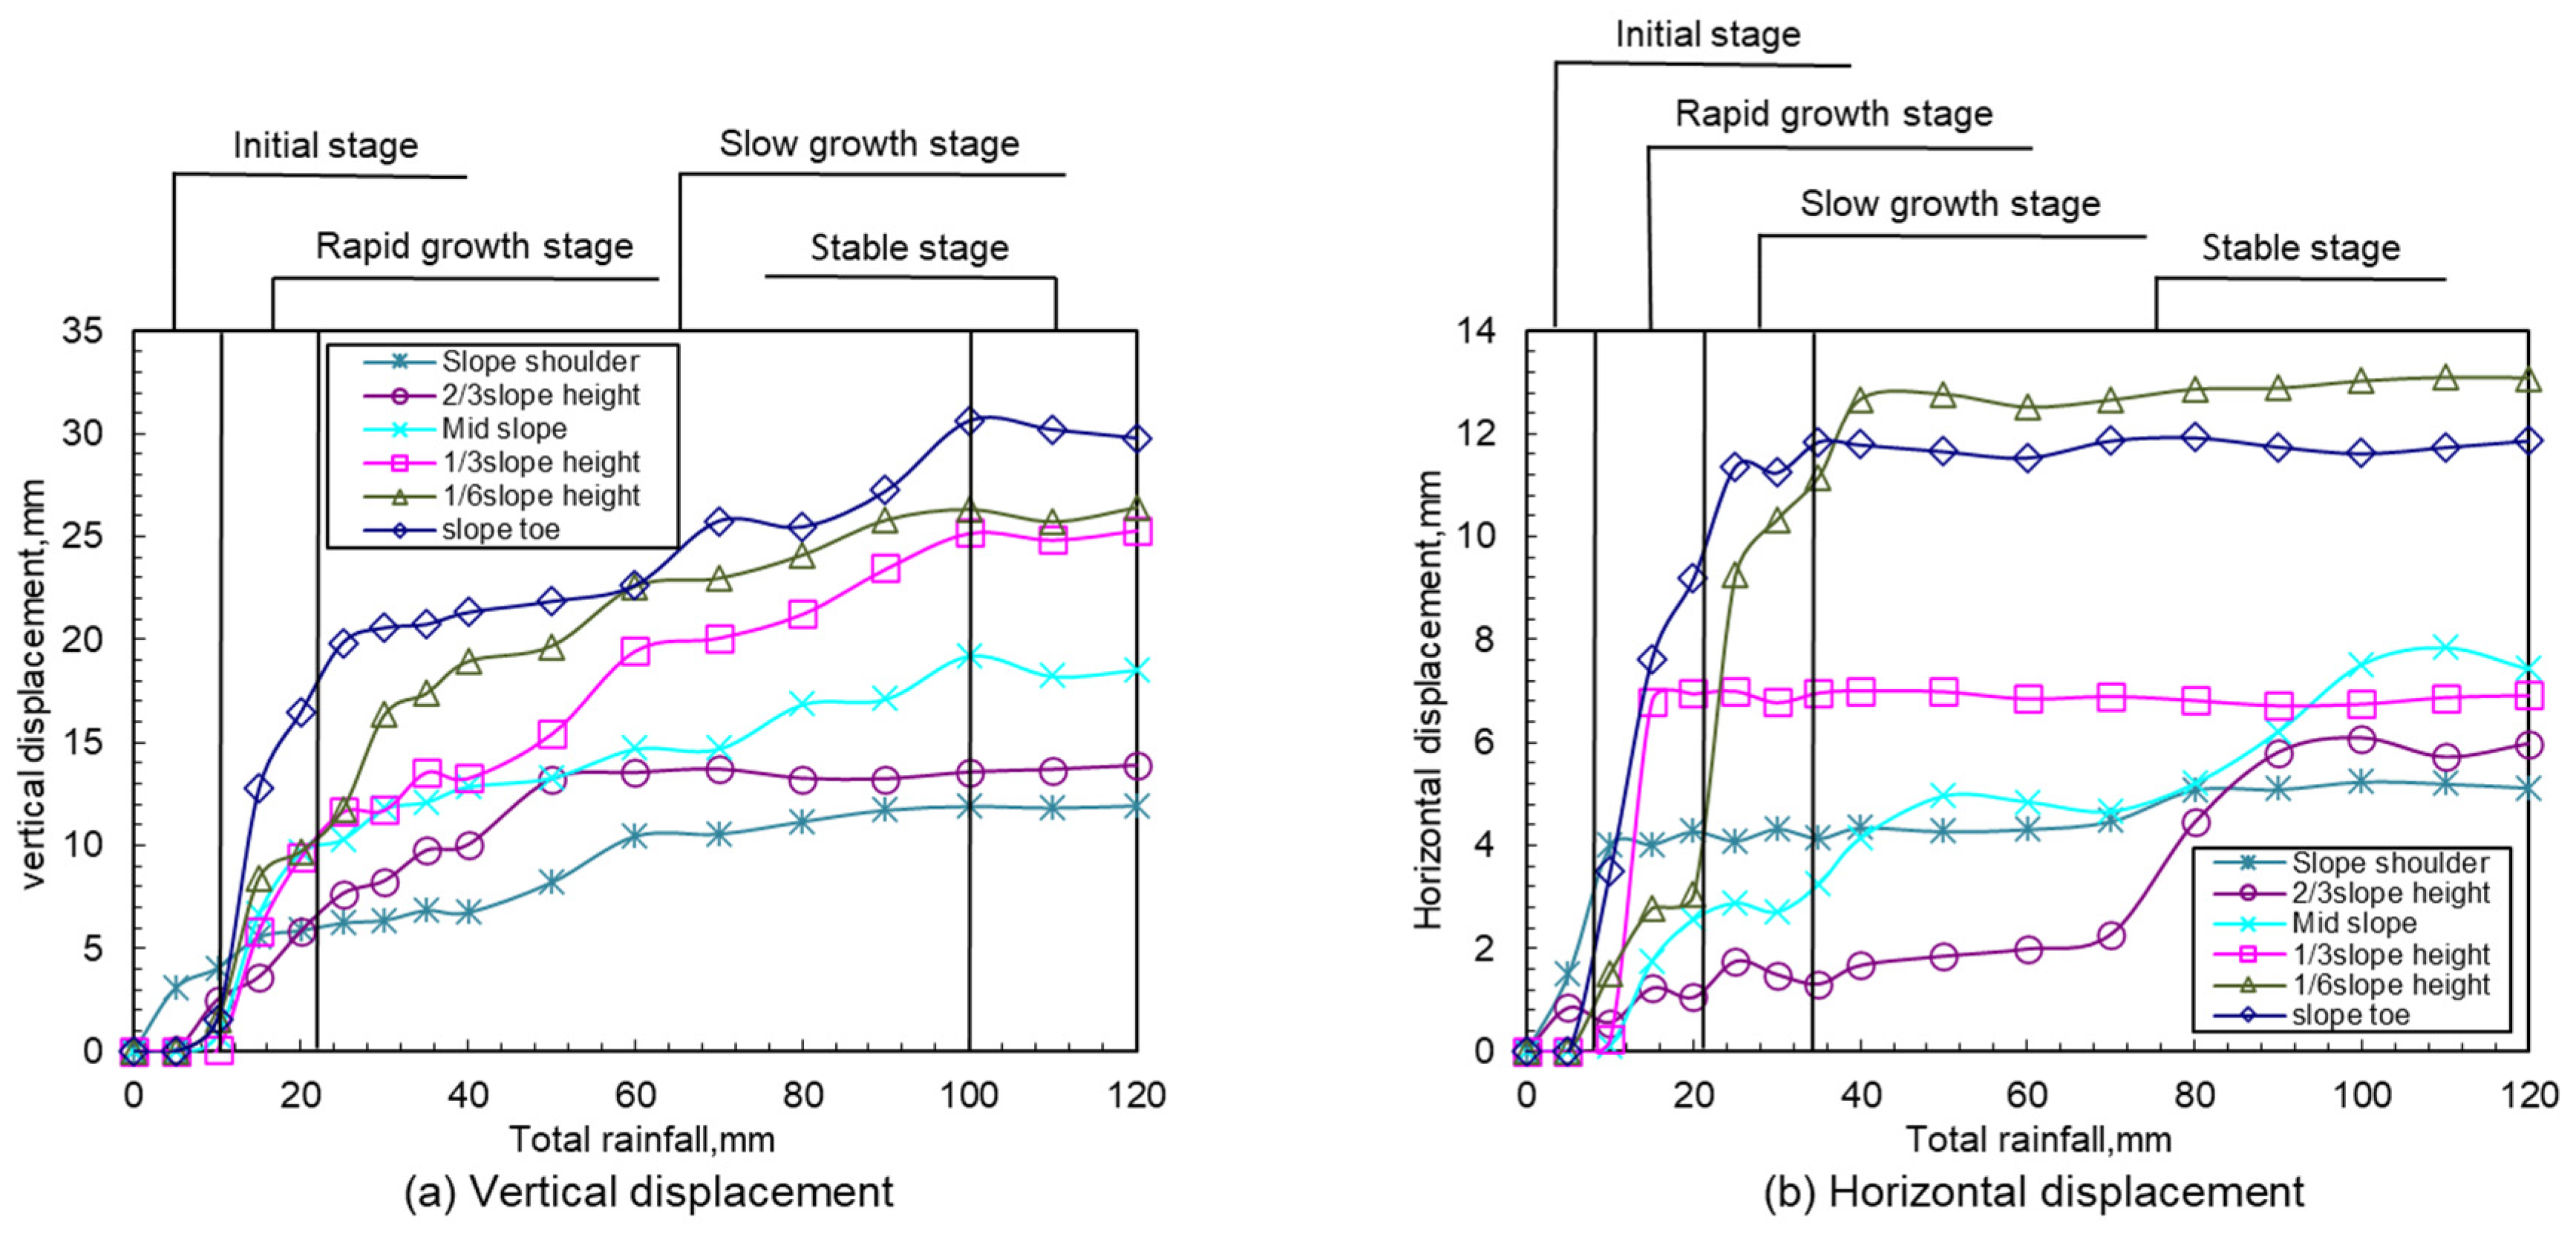
During continuous rainfall, slope deformation exhibits similar states and variation patterns. For instance, during the first rainfall stage with 120 mm of rainfall, the surface deformation of different slope positions monitored by displacement sensors is shown in
Figure 16. Analysis indicates that slope surface displacement undergoes four stages: initial stage, rapid growth stage, slow growth stage, and stable stage, each with distinct deformation patterns and mechanisms.
The initial stage corresponds to the water infiltration process. At the beginning of rainfall, as the surface soil moisture content increases, the surface experiences hygro-expansive deformation. However, deformation lags behind moisture changes, requiring time to develop. Additionally, water rapidly infiltrates through numerous cracks in the surface soil during this phase, causing deformation mainly around the crack matrix. Most deformation is attributed to crack shrinkage and closure, resulting in minimal expansion deformation and a slow deformation rate. This phase is brief, ending when rainfall reaches approximately 10 mm, and is primarily influenced by crack development.
In the rapid growth stage, as infiltration progresses and cracks close, water penetrates both through the cracks and into the soil matrix. Crack closure constrains soil block deformation laterally, driving deformation toward the free surface. During this stage, expansive soil exhibits significant hygro-expansive effects, with noticeable vertical and horizontal displacements. This phase continues until rainfall reaches 30–40 mm and is primarily influenced by soil swelling-shrinkage and permeability characteristics.
Notably, the slope toe and lower slope sections (e.g., 1/6 slope height) exhibited the largest vertical and horizontal displacements throughout the rainfall process (see
Figure 16). This can be attributed to the combined effects of stress concentration and water accumulation in these regions. The overlying soil layers impose additional load at the slope toe, and the geometry of the slope promotes convergence of infiltrated water. These factors jointly accelerate the loss of matric suction and amplify hygro-expansive deformation at the toe. Such displacement patterns are consistent with observations in actual shallow landslides, where failure commonly initiates at the slope toe and propagates upward, reinforcing the progressive failure mechanism discussed earlier.
In the slow growth stage, deformation slows, and displacement increases gradually. Water infiltration into deeper soil continues but is constrained by the soil’s permeability and surface runoff, leading to reduced infiltration. The soil approaches saturation, limiting further deformation. This phase represents the main deformation stage, characterized by a long duration but limited deformation magnitude, governed by soil swelling-shrinkage and permeability.
In the stable stage, the slope’s seepage field stabilizes, and water content at different locations becomes consistent. Consequently, hygro-expansive deformation caused by moisture changes ceases, and slope deformation stabilizes.
This pattern of surface deformation is further complemented by subsurface displacement behavior discussed in
Section 6.4.
6.4. Subsurface Deformation
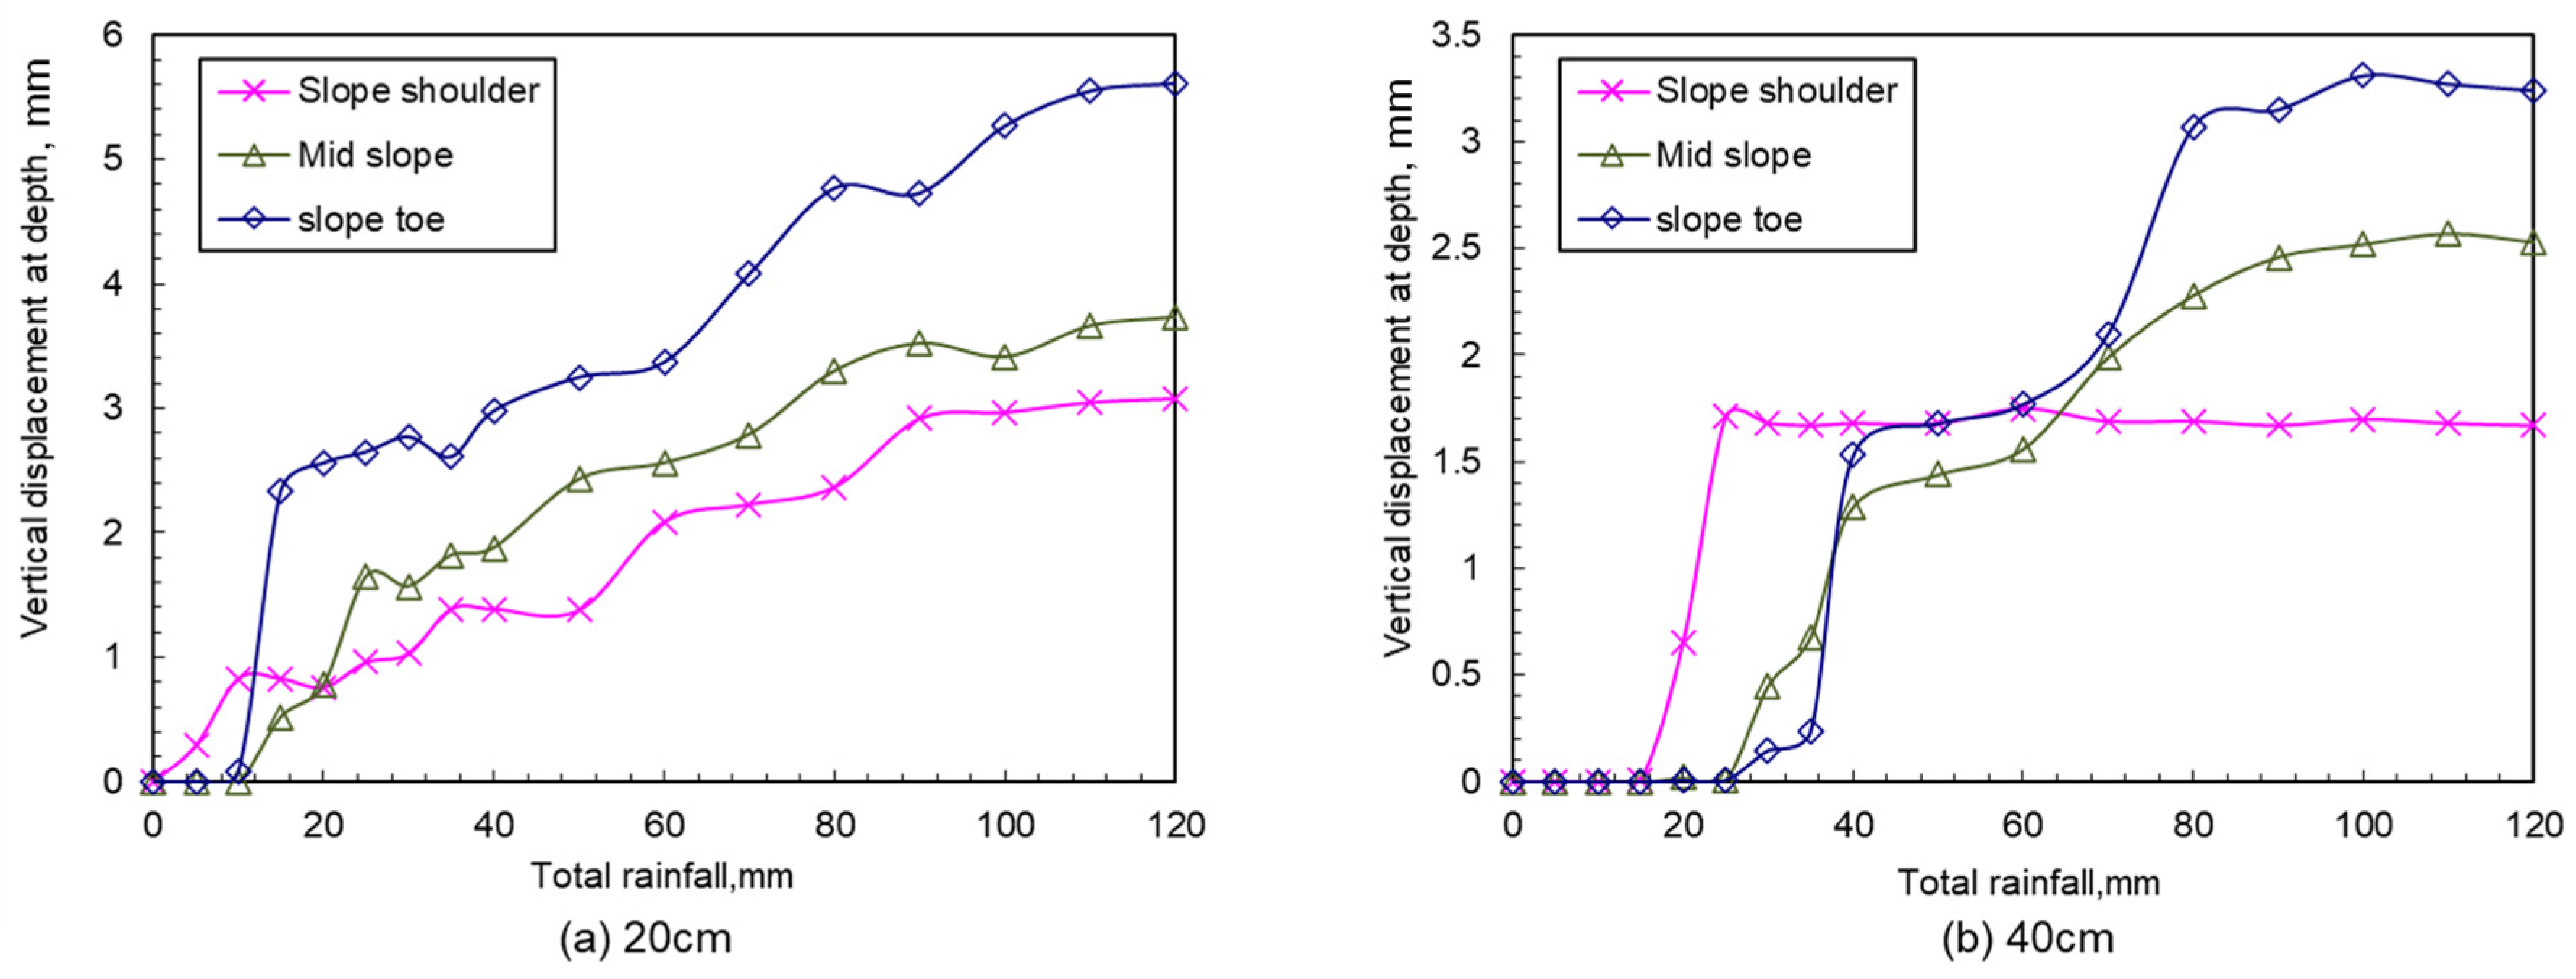
Subsurface displacement development was monitored during the continuous rainfall stage, focusing on 20 cm and 40 cm depths. The vertical deformation time curves at these depths are shown in
Figure 17. Deep deformation exhibits significant lag, increasing with depth. At 20 cm depth, deformation begins when rainfall reaches 10 mm, while at 40 cm, it starts at approximately 20 mm. The subsurface deformation pattern mirrors surface deformation, progressing through the same stages. However, the initial stage primarily reflects lag effects due to depth, the rapid growth phase is shorter, and the slow growth and stable phases are longer, often alternating. Subsurface soil deformation is primarily driven by hygro-expansion and is closely related to infiltration.
The deformation evolution of expansive soil slopes is influenced by a combination of soil properties, crack conditions, and environmental factors. Hygro-expansion due to water infiltration is the primary deformation mechanism. Cracks facilitate water infiltration, promoting deformation. Soil permeability determines infiltration intensity, while swelling-shrinkage properties influence deformation magnitude and rate.
6.5. Spatial Distribution of Hygro-Expansive Deformation
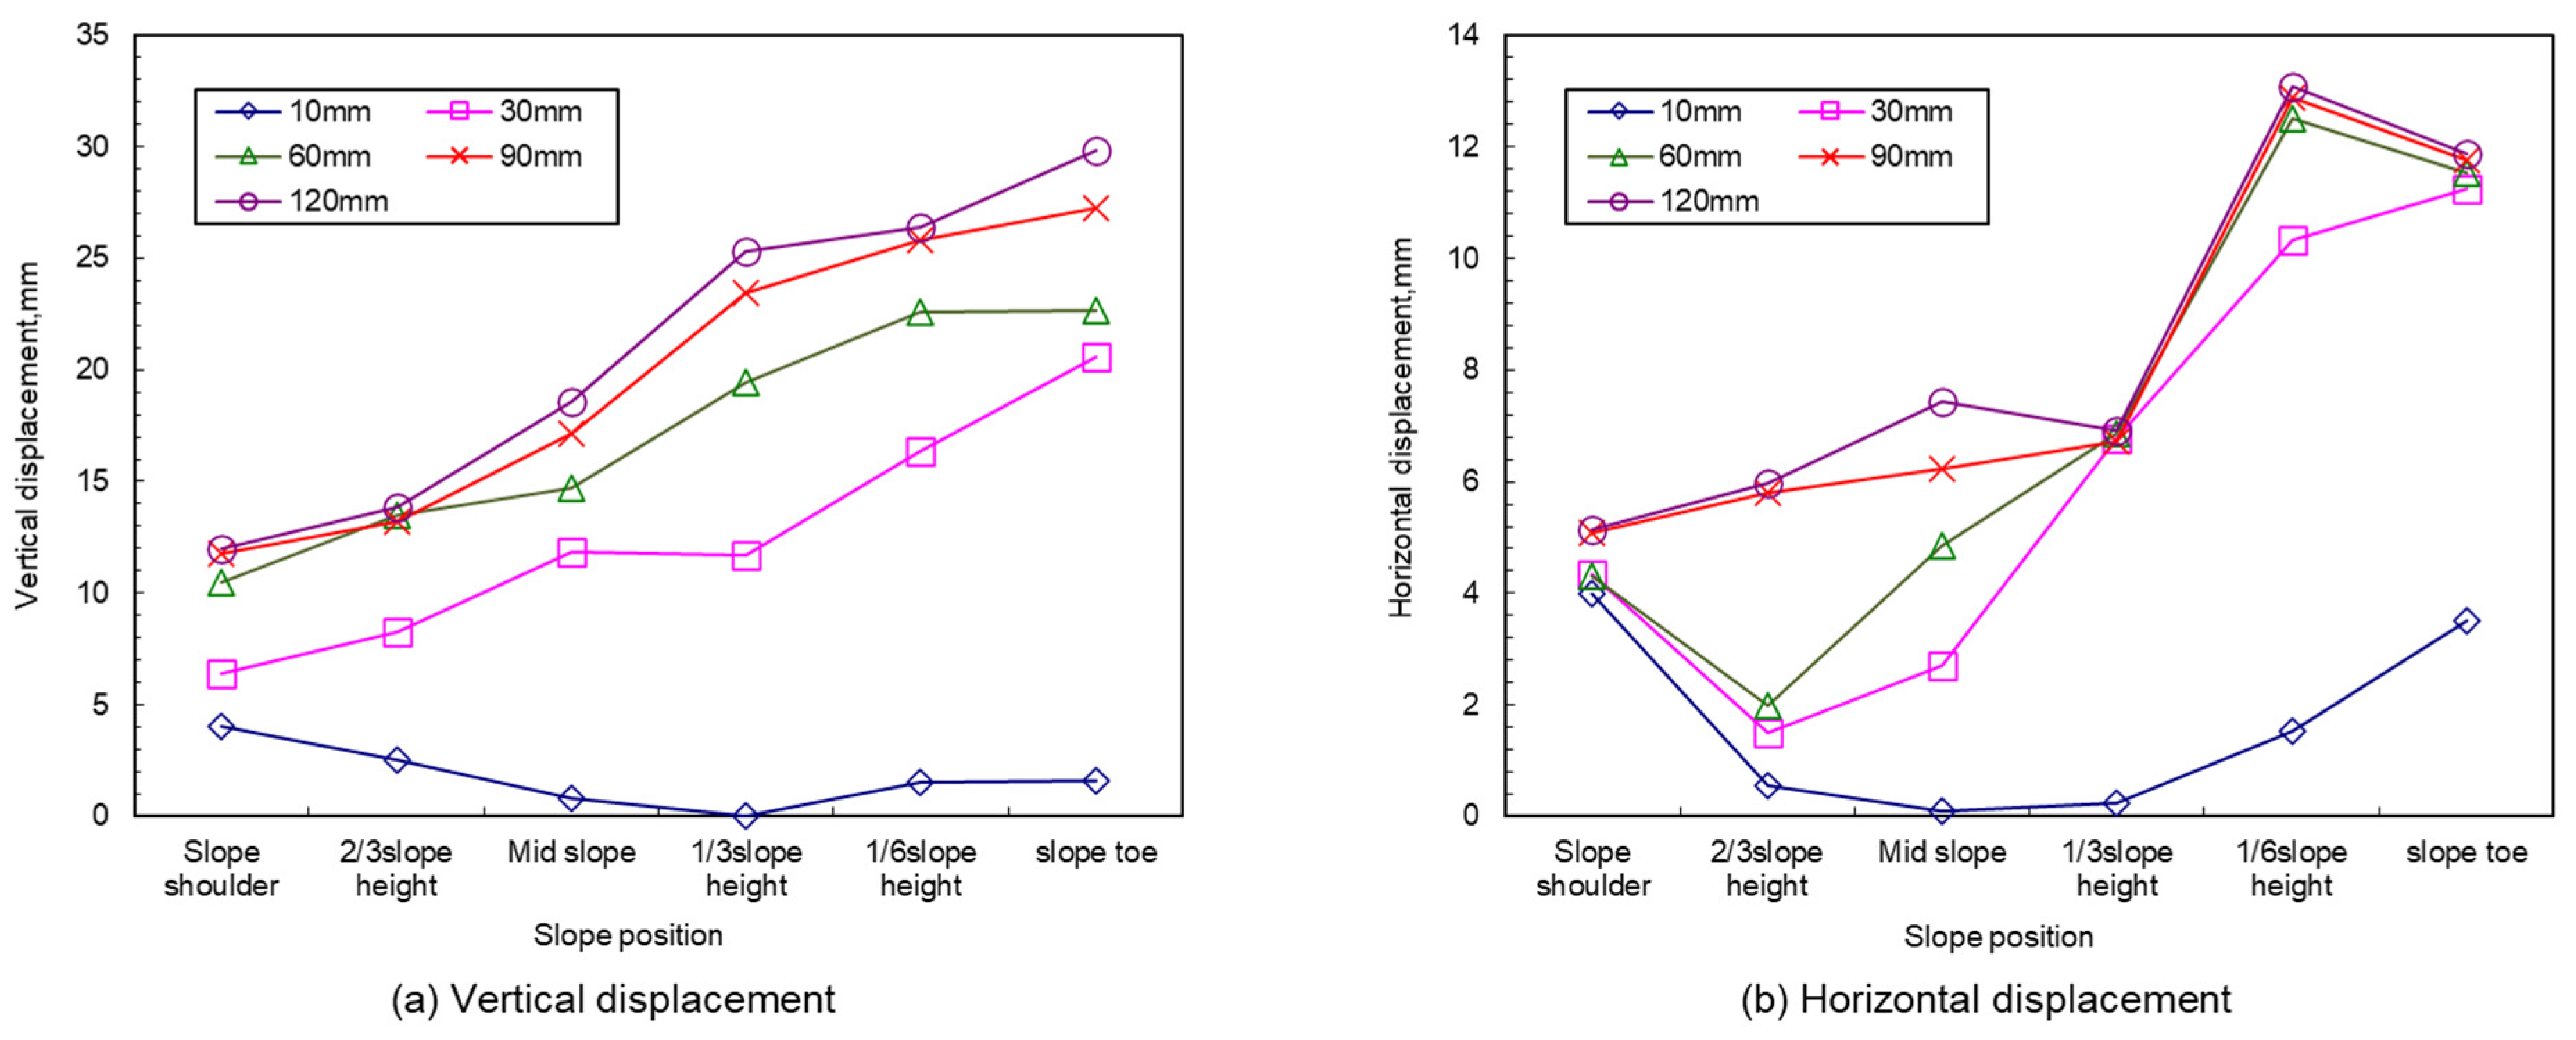
After absorbing moisture, expansive soil slopes exhibit hygro-expansion within the wetting front. Deformation progresses downward as the wetting front advances, with surface deformation reflecting the cumulative deformation within the affected zone. Surface deformation is greatest at the slope toe and diminishes toward the slope crest, as shown in
Figure 18.
At 10 mm rainfall, vertical displacement is minimal across the slope, generally below 5 mm. After 30 mm of rainfall, vertical displacement increases linearly from the slope toe to the crest. At 120 mm rainfall, vertical displacement reaches 30 mm at the toe and 12 mm at the crest. Horizontal displacement is greater at lower elevations. By the end of the rainfall stage, with 120 mm of rainfall, maximum horizontal displacement occurs at 1/6 of the slope height near the toe, approximately 13 mm. In contrast, the crest exhibits 5–8 mm of horizontal displacement, about one-third to one-half of the vertical displacement.
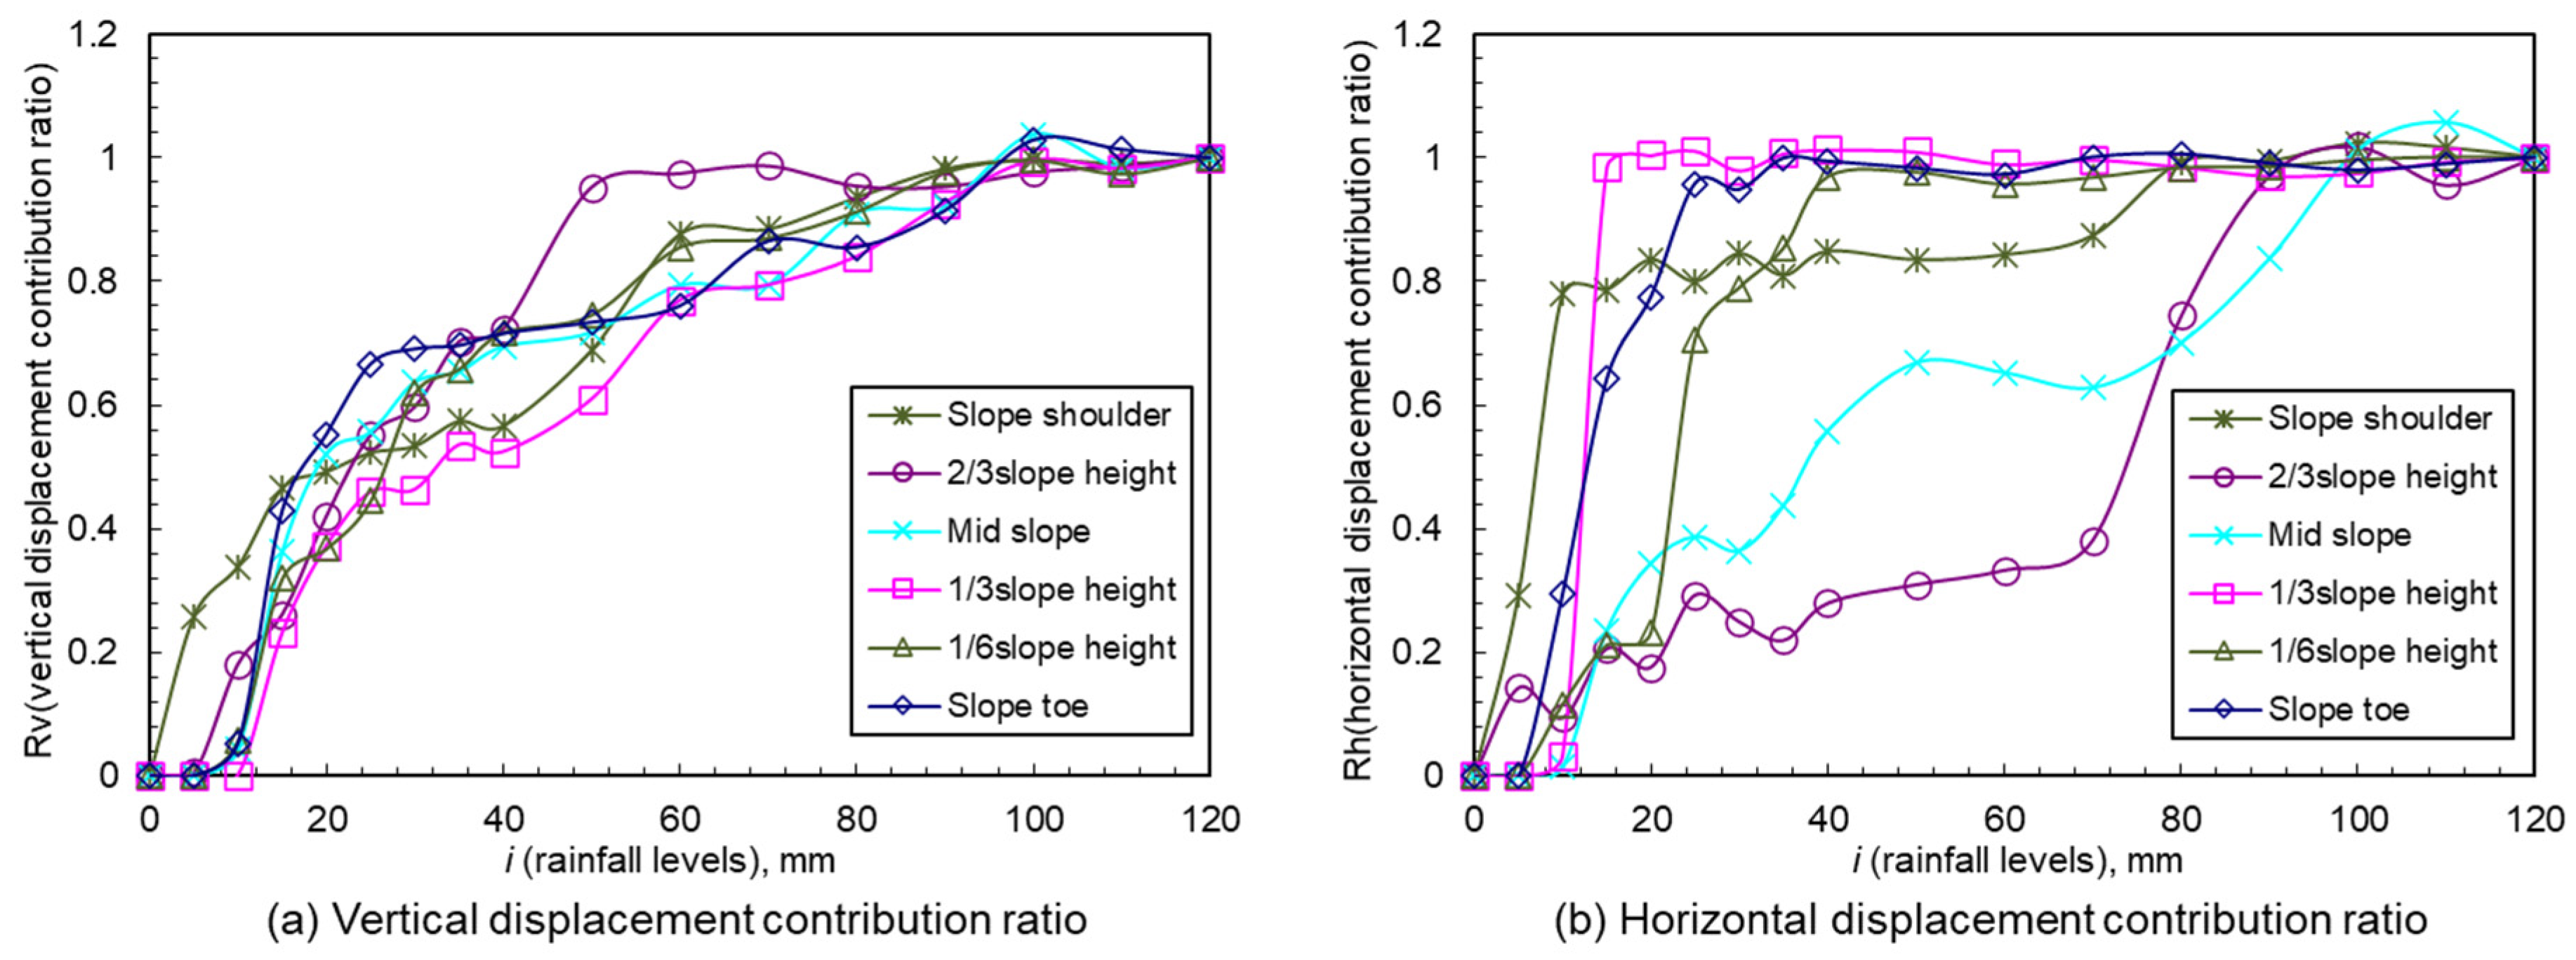
If the displacement contribution ratio during rainfall is defined as follows:
where
sri (
i = 0, 10, 20…120) represents the vertical displacement (mm) of the soil corresponding to rainfall levels of
i mm. The displacement contribution ratios at various moments, as shown in
Figure 19, indicate consistent vertical displacement trends across the slope. In contrast, horizontal displacement varies significantly, with lower slope regions completing most horizontal deformation by 40 mm rainfall, while upper regions show a stepwise response influenced by later rainfall.
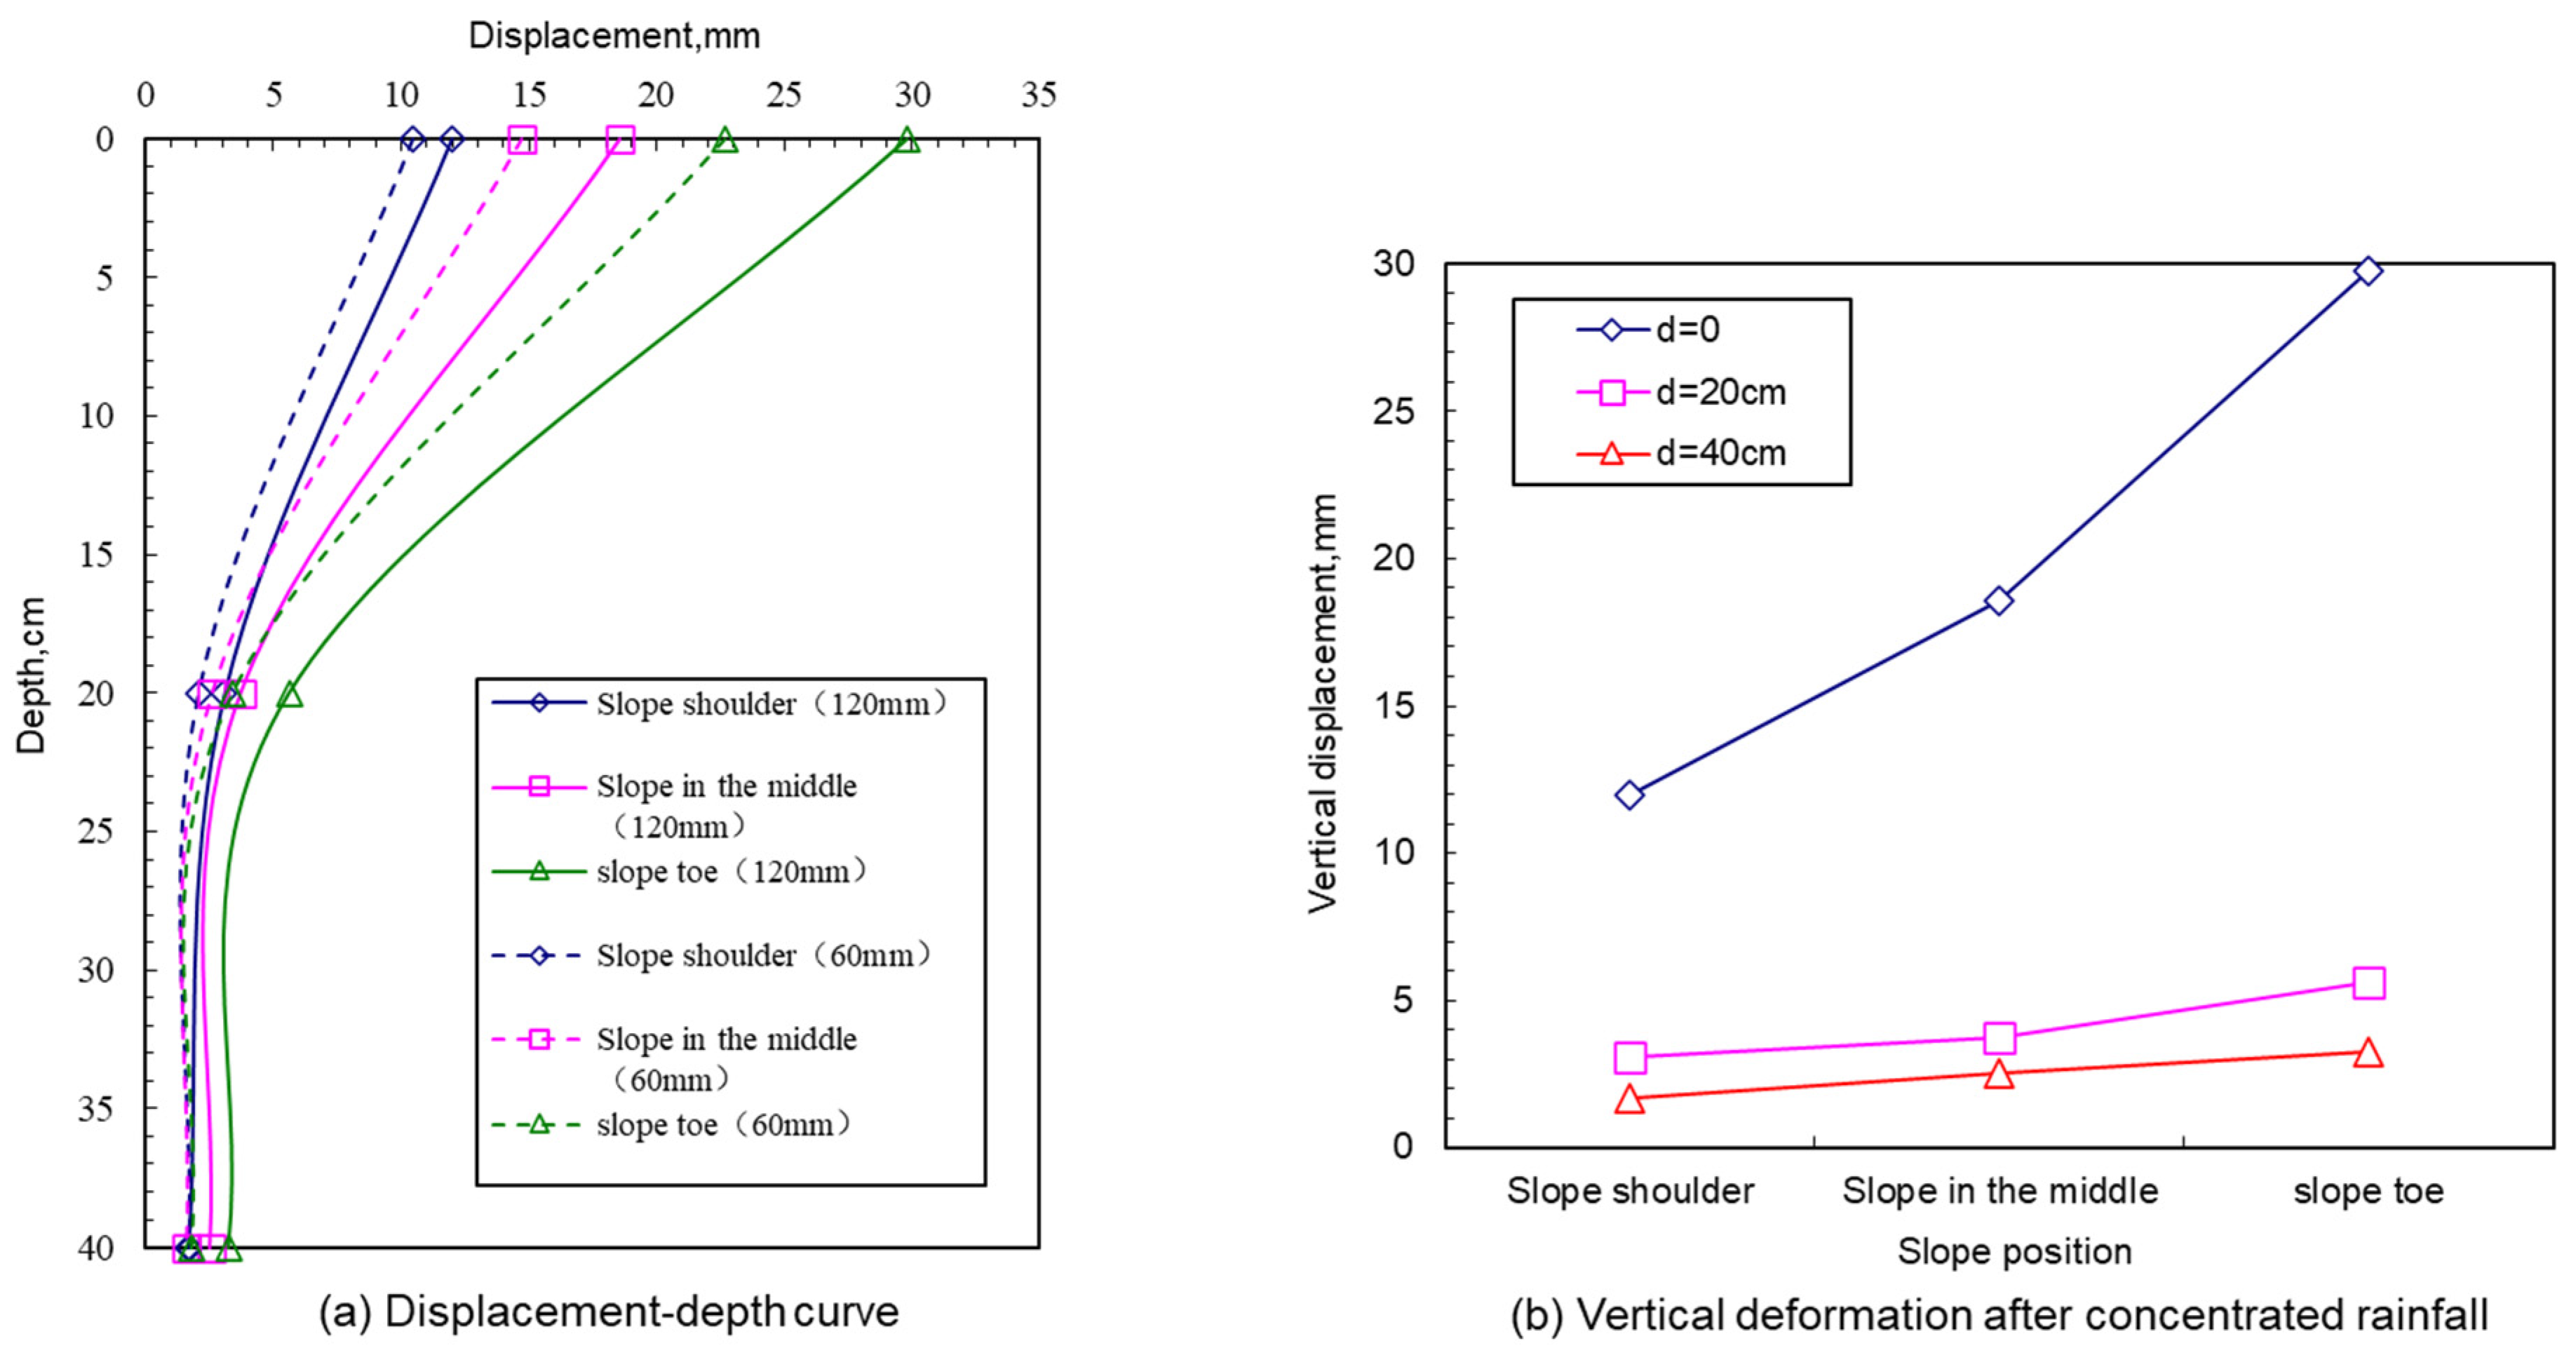
Figure 20a shows the deep vertical displacement curves at the crest, middle, and toe of the slope at different time intervals.
Figure 20b compares the surface vertical displacement with the deep vertical displacement at various locations after the concentrated rainfall ends. From the figures, it can be observed that vertical displacement decreases rapidly with depth. The closer to the slope toe, the more pronounced the attenuation effect of vertical displacement with depth. At the slope toe, the surface vertical displacement is approximately 6 times that at a depth of 20 cm and 7–8 times that at a depth of 40 cm. At the slope crest, the surface vertical displacement is approximately 4 times that at a depth of 20 cm and about 6 times that at a depth of 40 cm.
6.6. Correlation Between Deformation Field and Seepage Field
Due to the sensitivity of expansive soils to moisture, hygro-expansive deformation is their most prominent characteristic. This deformation is induced by moisture absorption, which alters the molecular structure both between and within the soil particles, resulting in expansion. Thus, for expansive soil slopes, there exists a causal and interactive relationship between the seepage field and the deformation field. Based on monitoring results from moisture sensors and displacement sensors, a coupled experimental analysis of the seepage and deformation fields was conducted to study the deformation patterns induced by hygro-expansive effects and their correlation.
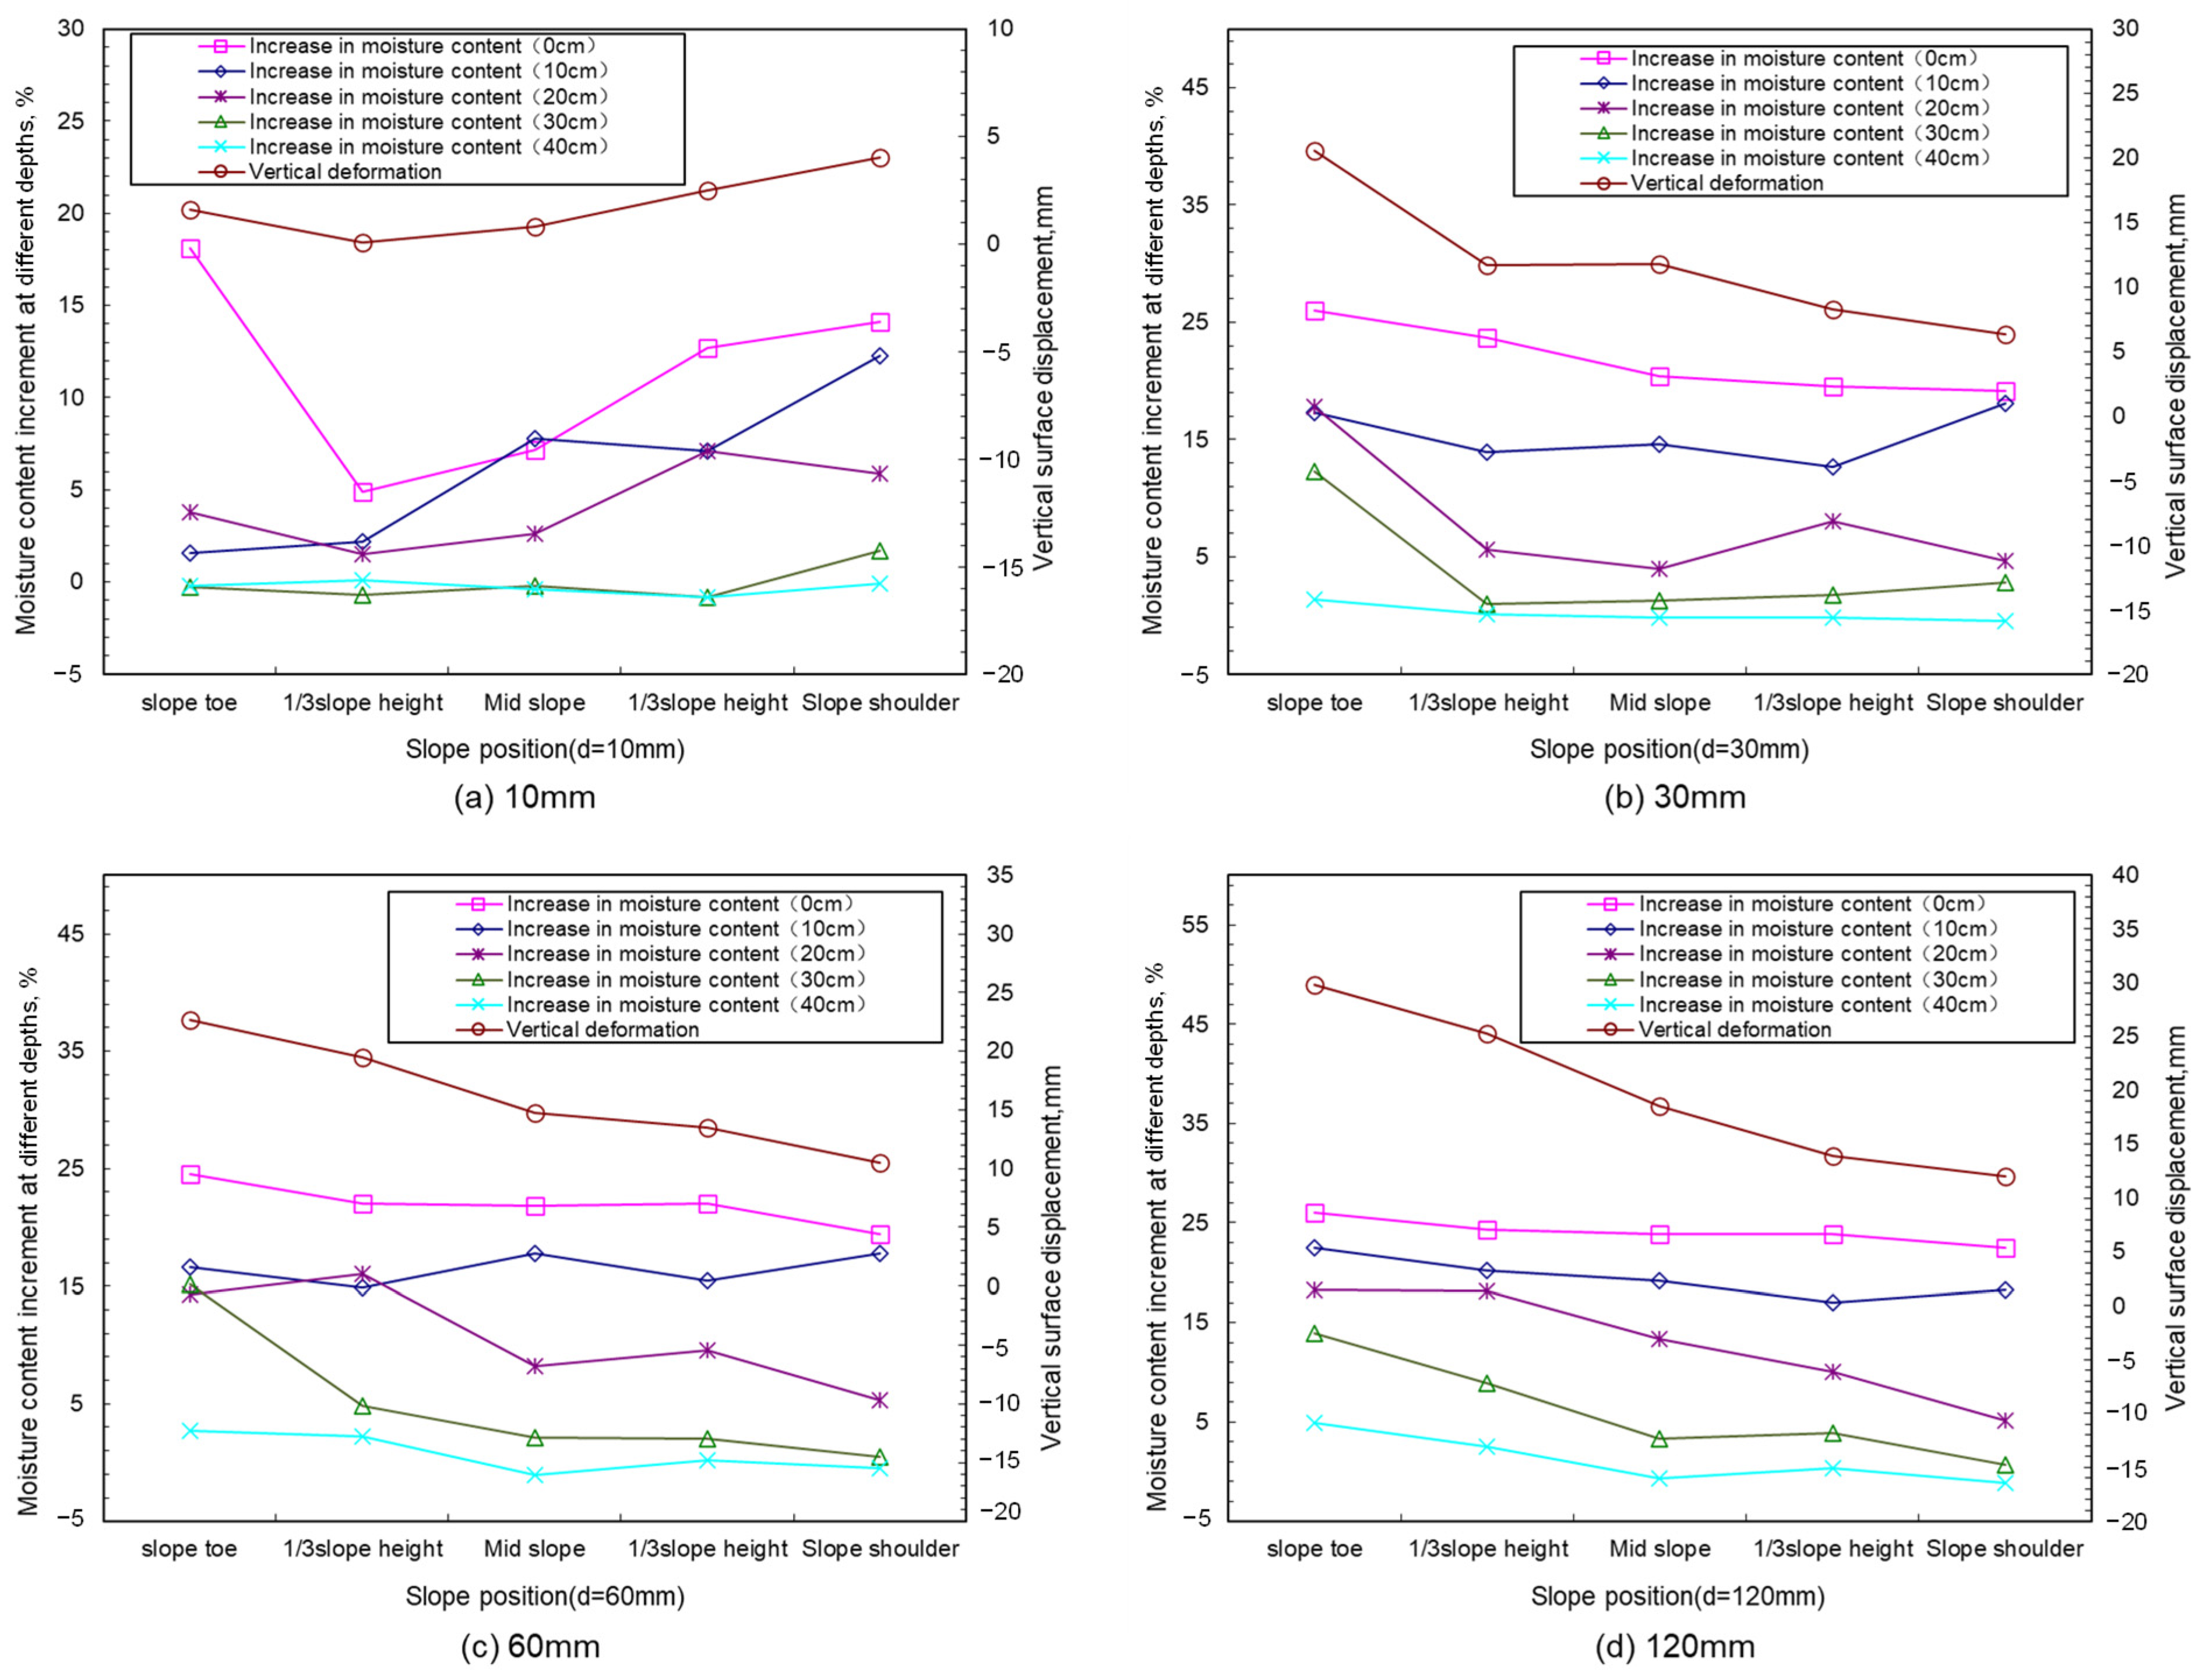
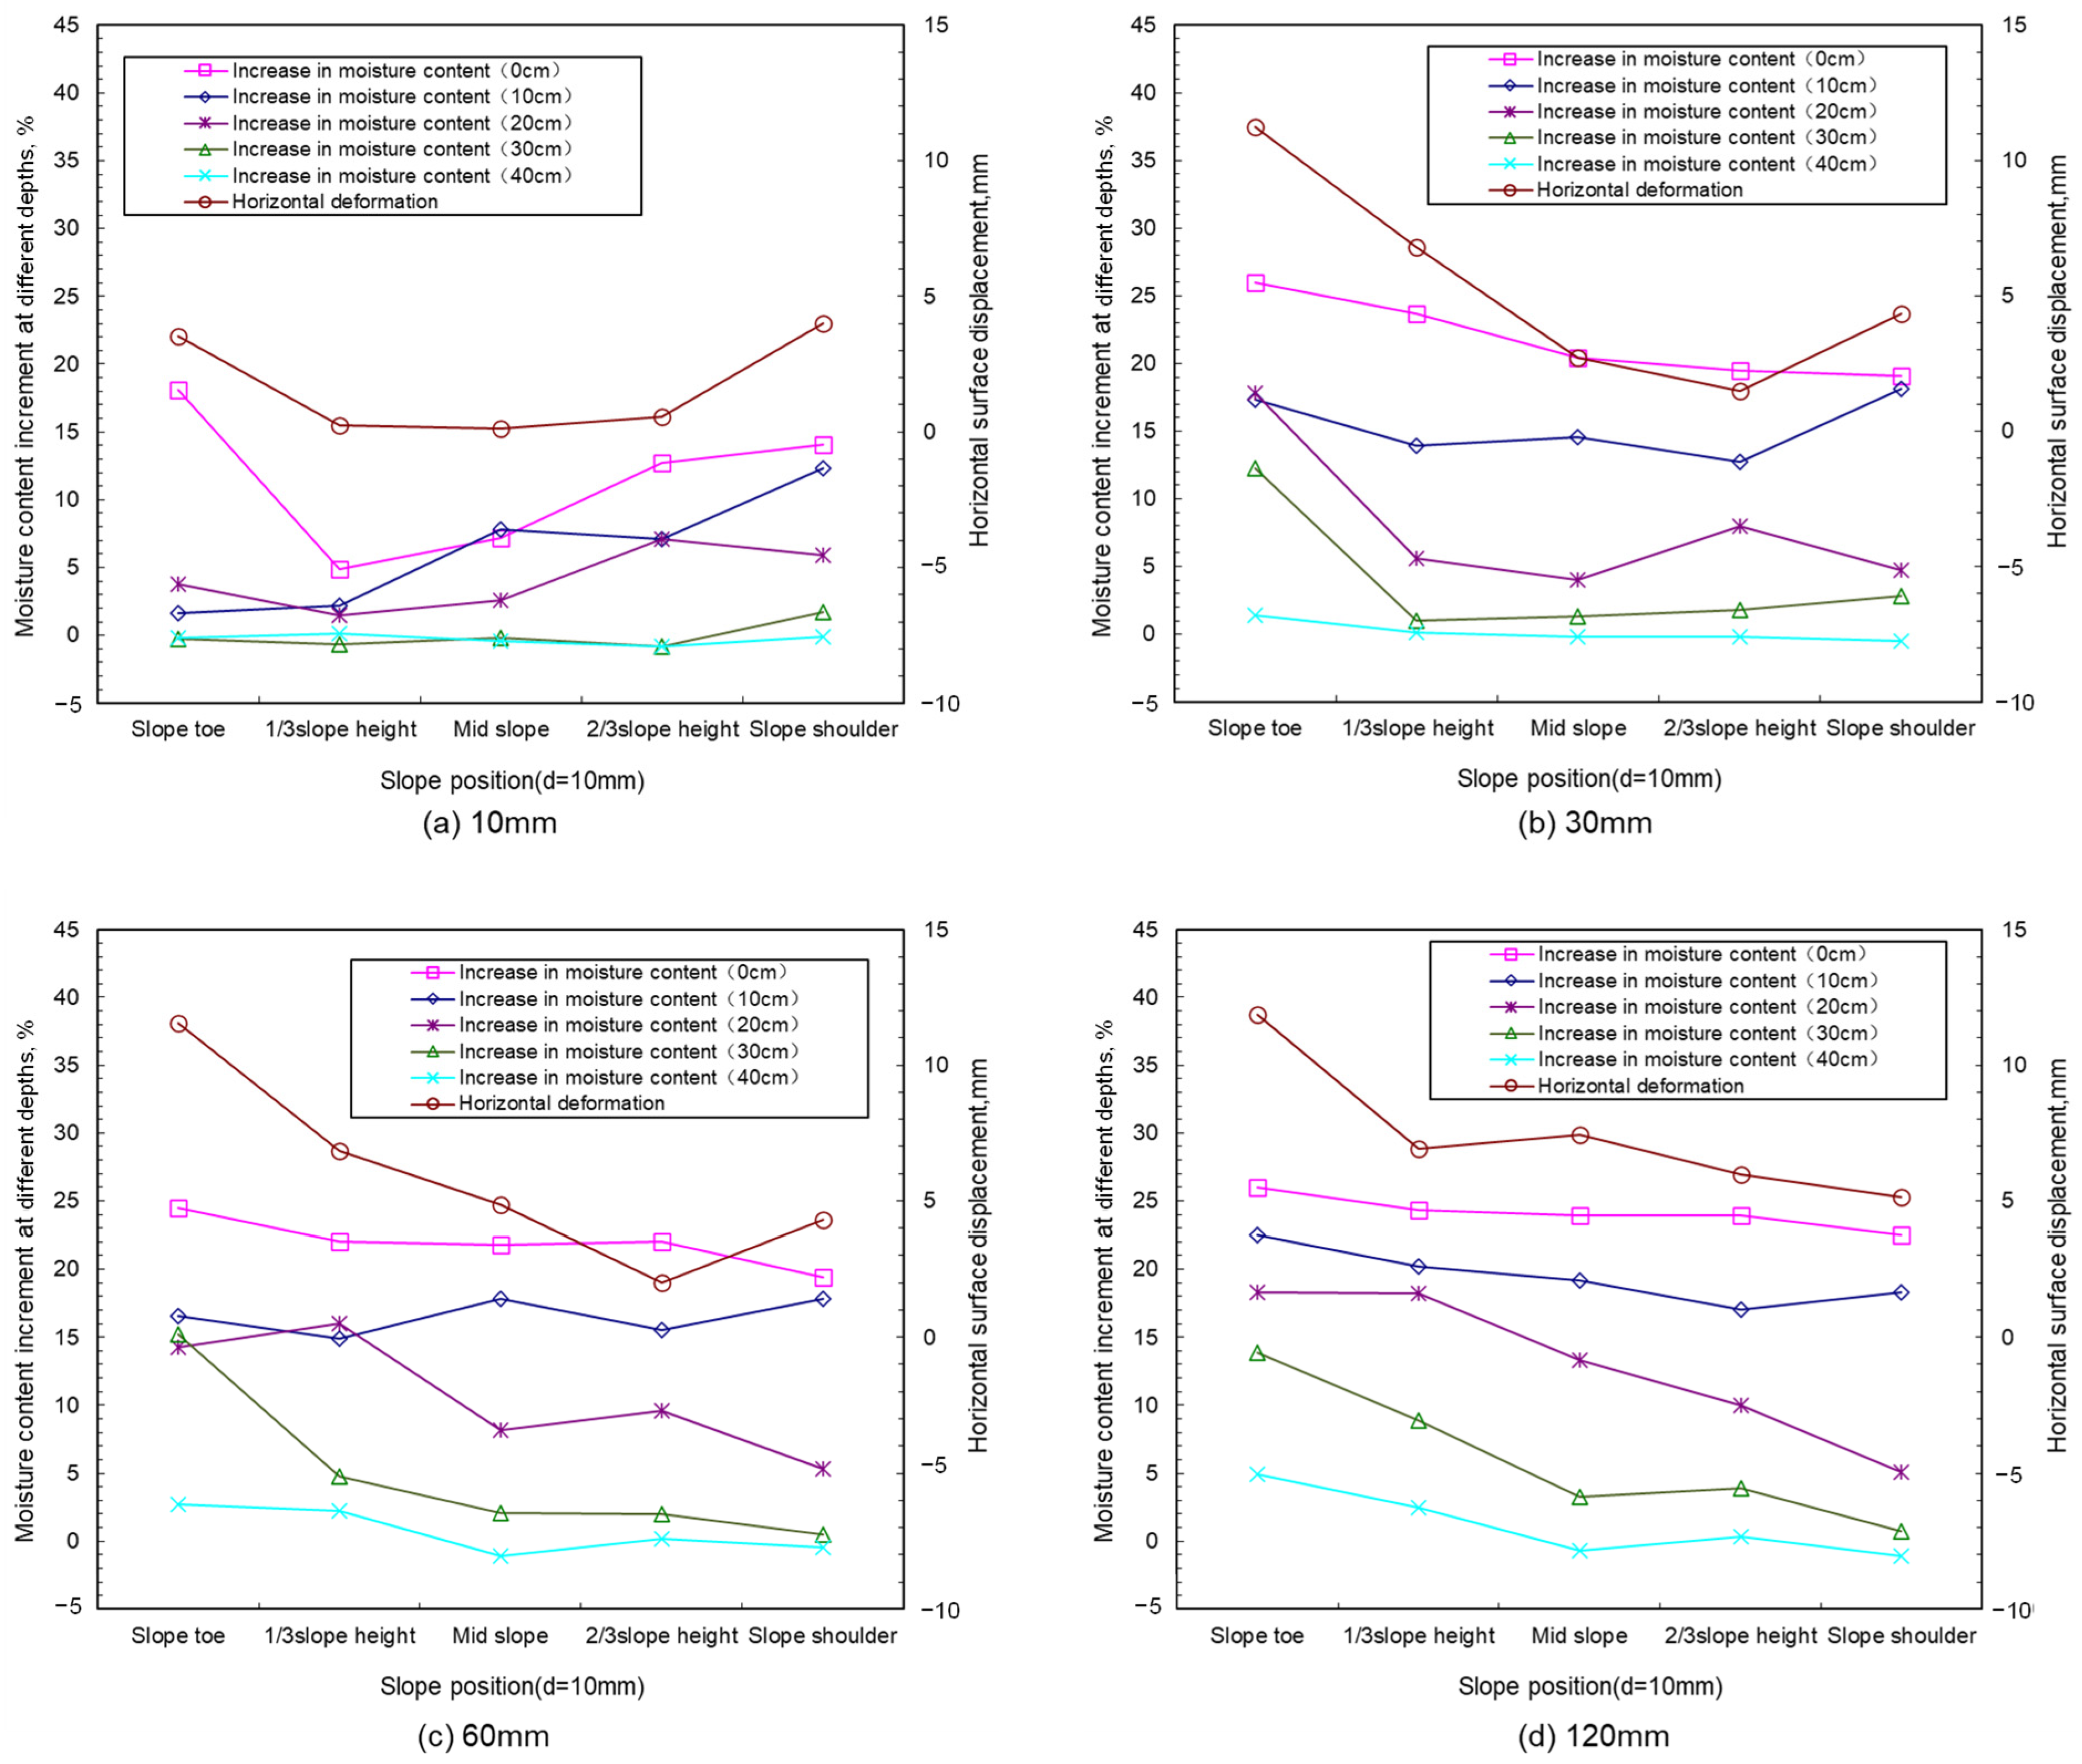
Using the volumetric water content increment (Δθ) as the seepage variable, the initial soil moisture content of the slope was set as the baseline at time zero. During different stages of rainfall, the water content increments at various depths of typical cross-sections were extracted and compared with surface deformation on the same cross-sections, as shown in
Figure 21 and
Figure 22. In an unconstrained condition, surface deformation develops freely, and the increase in water content is the dominant factor causing soil deformation. Surface deformation represents the cumulative macro-effect of internal soil deformation at various depths. Therefore, surface deformation correlates with the cumulative water content increment across all depths of the slope, with vertical deformation being more significantly affected by this pattern.
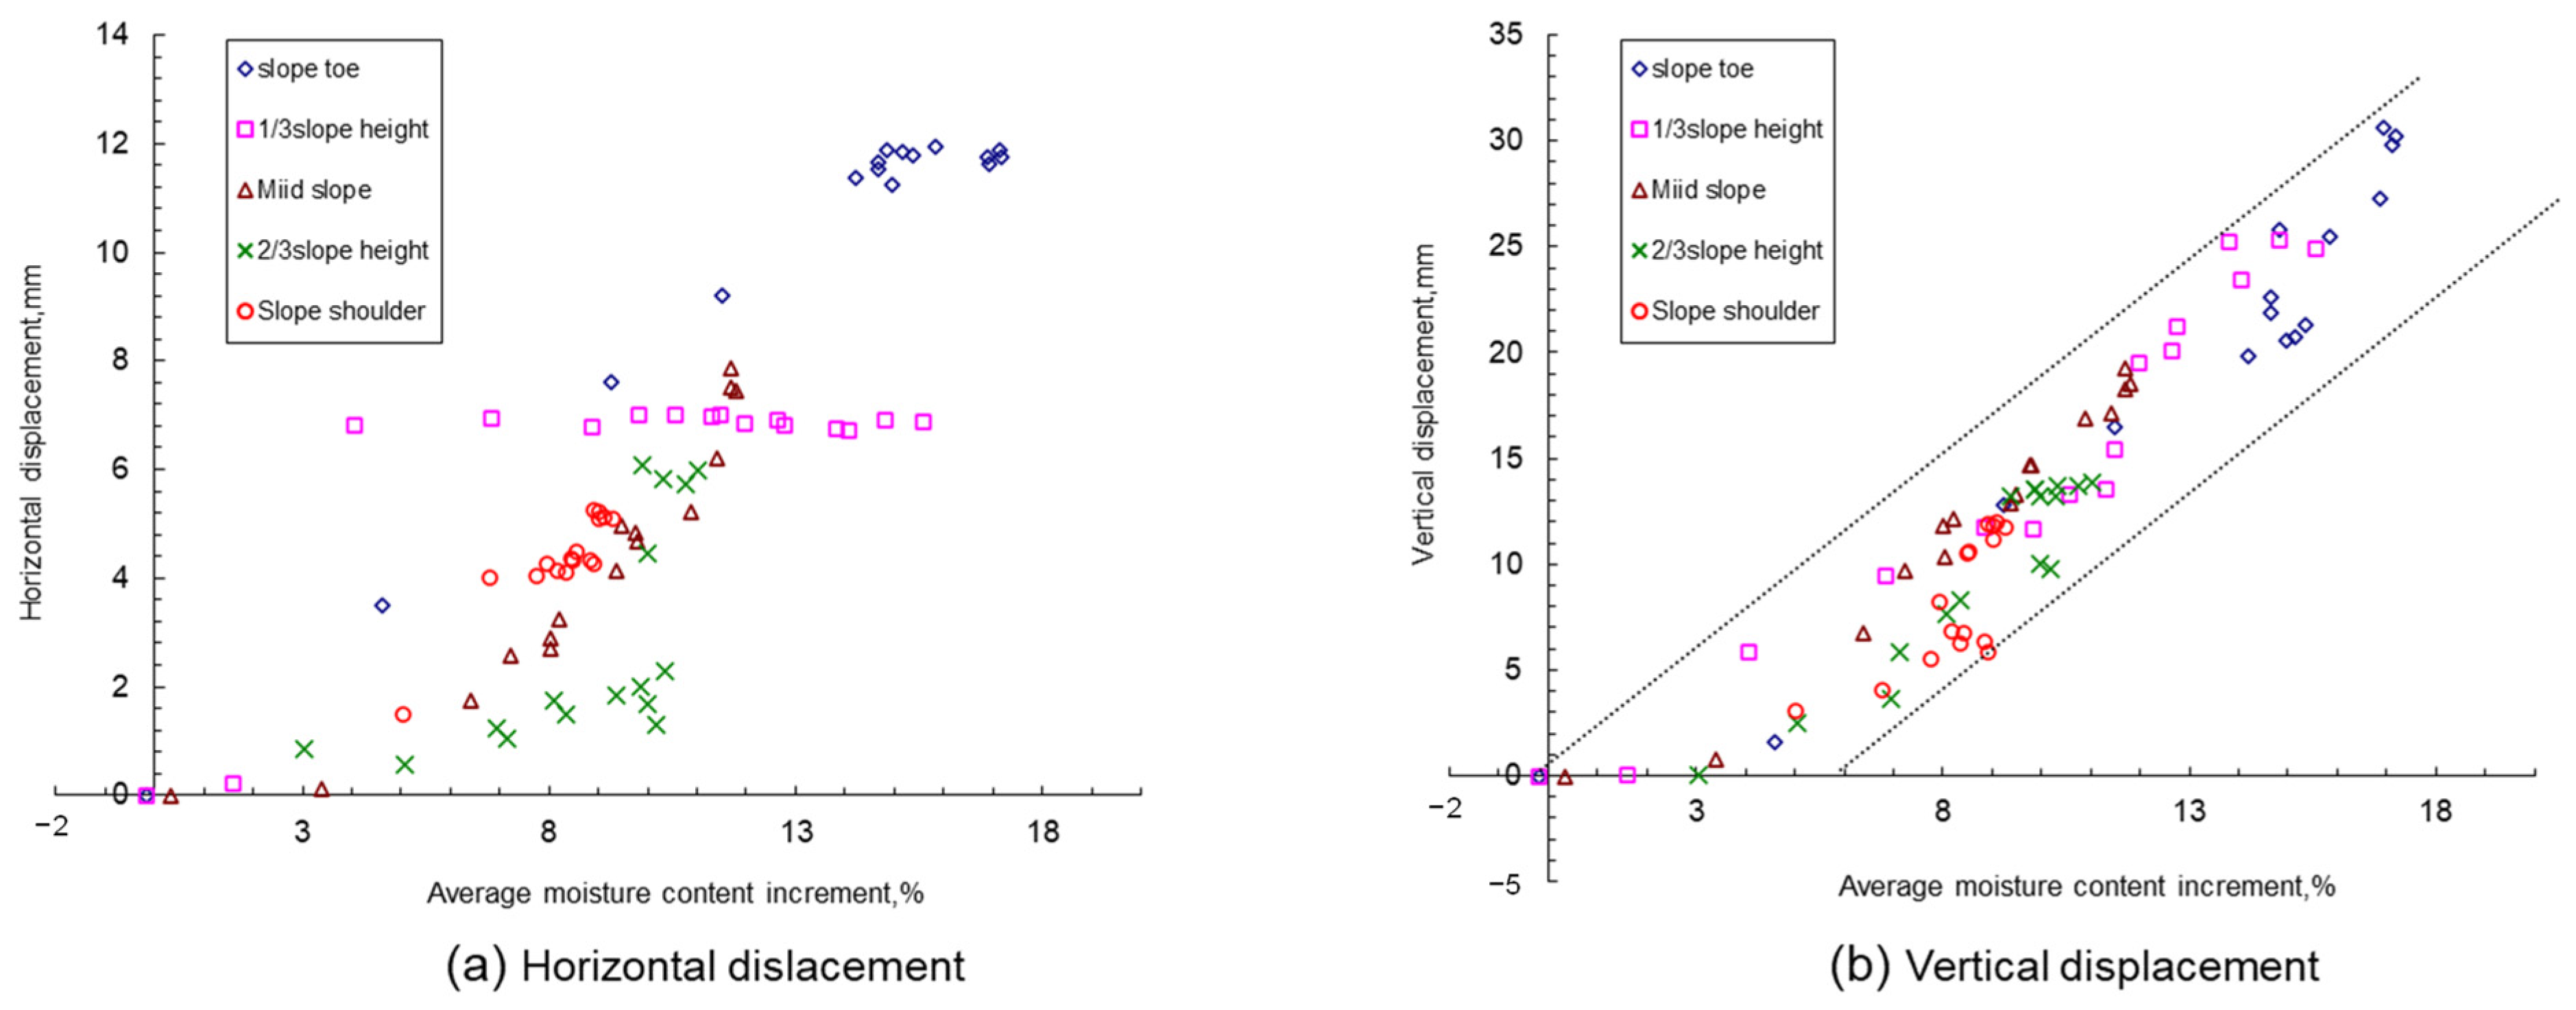
At a specific moment during the experiment, the instantaneous increments of water content (Δθ) at depths of 0 cm, 10 cm, 20 cm, 30 cm, and 40 cm along various slope cross-sections were averaged arithmetically. The average water content increment was then compared with the surface vertical and horizontal displacements of the slope at the same moment. The results are presented in
Figure 23.
Horizontal deformation generally increases with the average water content increment (Δθ), with significant effects observed in the middle and upper parts of the slope. However, at the slope base, horizontal deformation is constrained laterally. Within a certain range, as the water content increases, the deformation is suppressed, resulting in slow or negligible growth.
For vertical deformation, a near-linear relationship with the average water content increment is evident. Across different cross-sections, vertical displacements under the same average water content increment are roughly similar and concentrated within a specific range. Linear fitting between the vertical deformation (s1) and the average water content increment for each cross-section yields the following equations:
The strong linear correlations (high
R values) suggest that the relationship between
s1 and Δθ is consistent across sections. By calculating the weighted averages of the slopes and intercepts of these equations, a general predictive equation is derived for estimating vertical deformation (
s1) of expansive soil slopes under known seepage field changes:
These equations provide empirical relationships for estimating vertical surface deformation under conditions comparable to those in this study. Their applicability beyond the tested configurations should be validated with additional field or numerical data.
6.7. Variation Laws of Stress Field in Slopes
Based on the hygro-expansive deformation experiments of highly expansive soil slopes under rainfall infiltration conditions, monitoring of the stress field revealed that stress variations are closely related to the depth of water infiltration, which defines the range of hygro-expansive deformation.
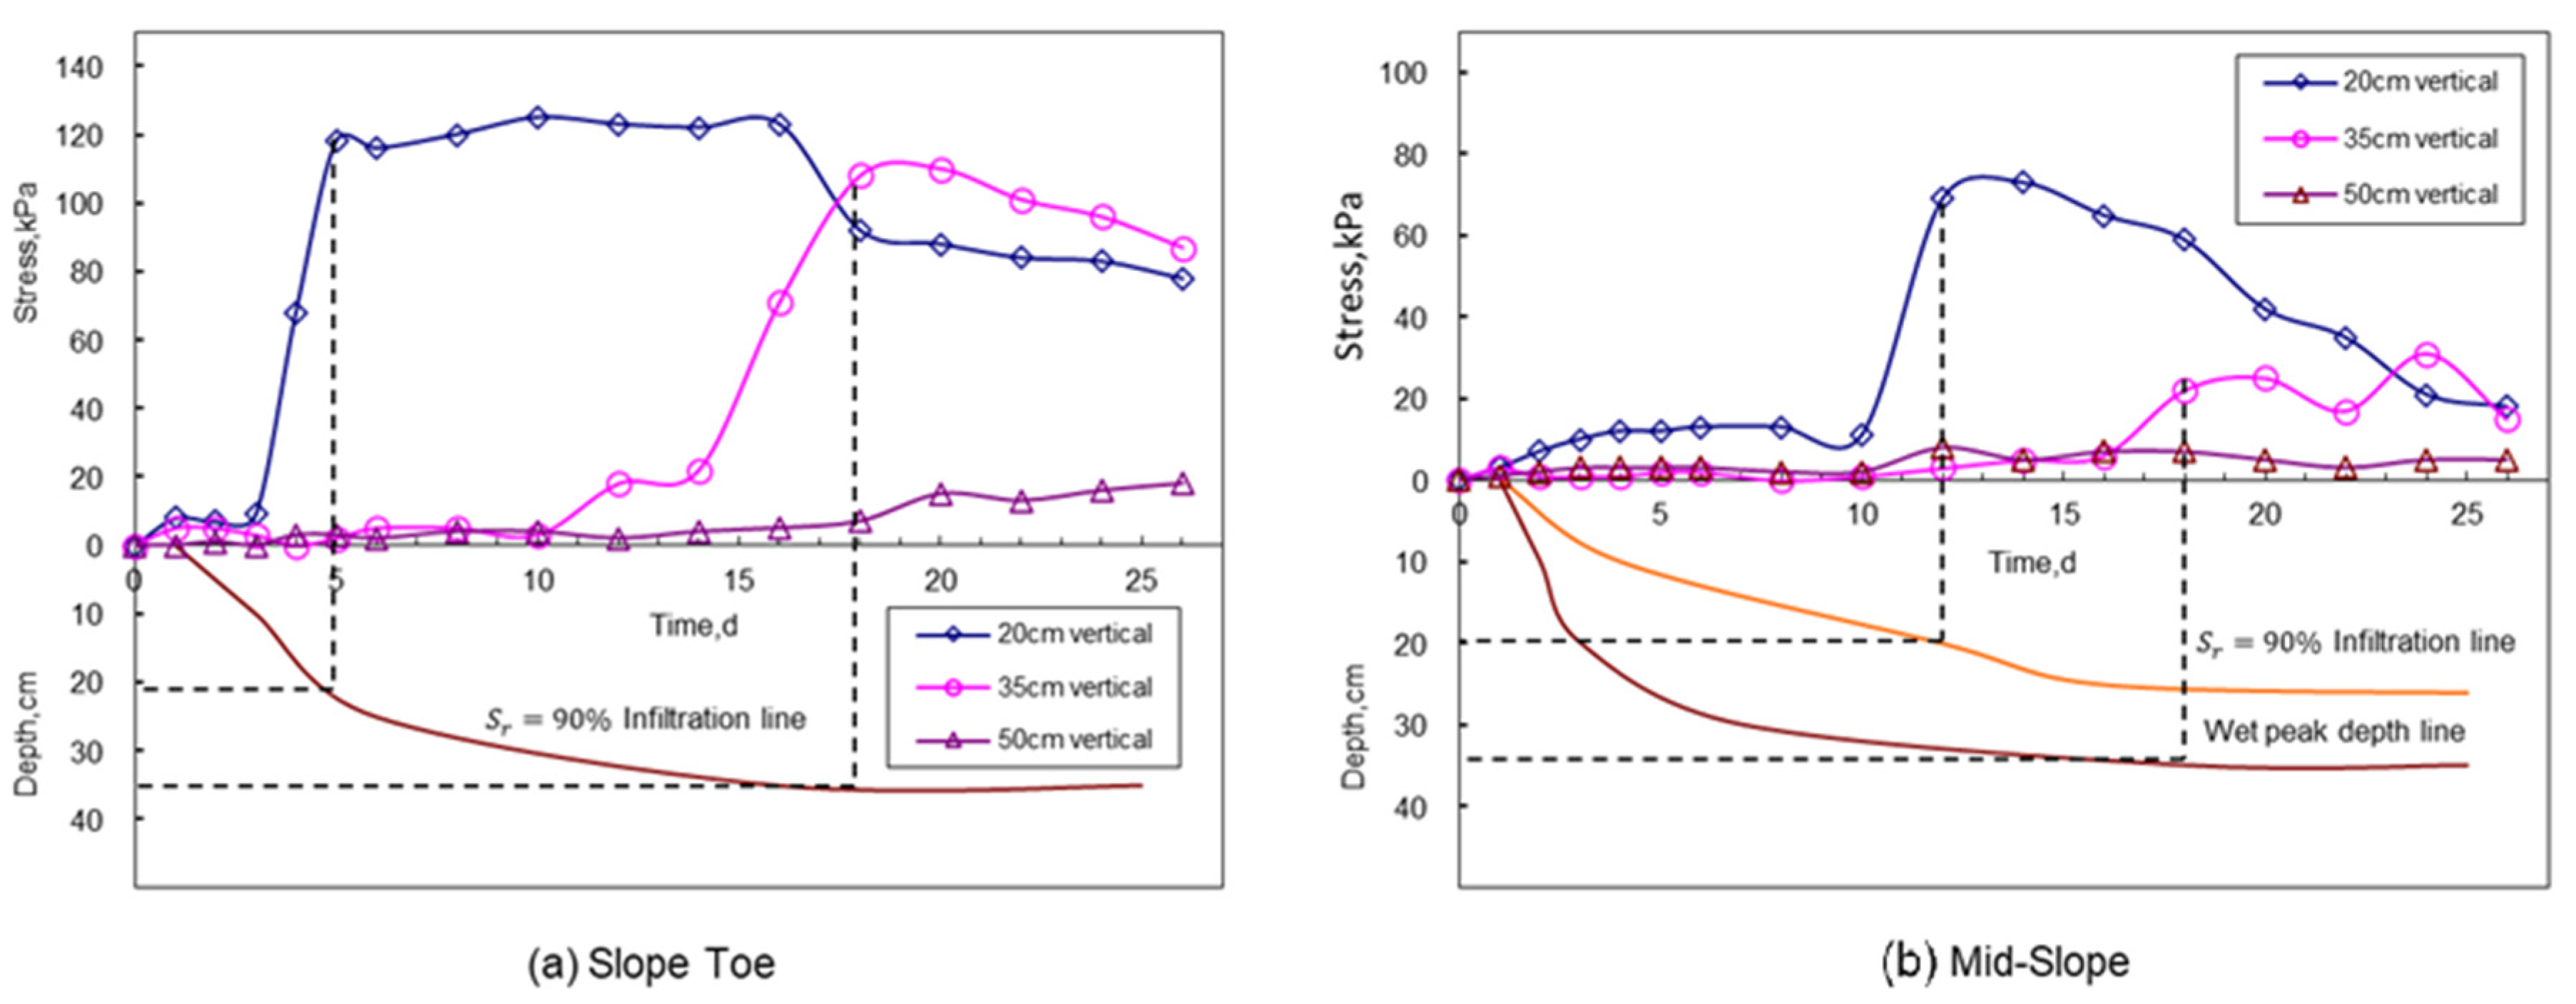
Figure 24a,b present the relationships between stress and infiltration depth at the slope toe and mid-slope at various depths, respectively.
Before water infiltration reaches a certain depth, soil stress exhibits small fluctuations. When the wetting front reaches a particular depth and the soil approaches saturation, the stress in the soil increases sharply, showing a sudden change. As infiltration progresses deeper, the stress reaches a peak at the depth where soil saturation is approximately 90%. This indicates that the stress peak corresponds to the transition zone between saturated and unsaturated soil.
As shown in
Figure 24a, at the depth reached by the wetting front, the stress also increases to some extent, suggesting that the interface between dry and wet zones is another area of significant stress concentration. As water infiltration advances, as shown in
Figure 24b, the transient saturated zone gradually moves deeper, and the original saturated-unsaturated soil interface transitions into saturated soil. This results in a certain degree of stress attenuation over time.
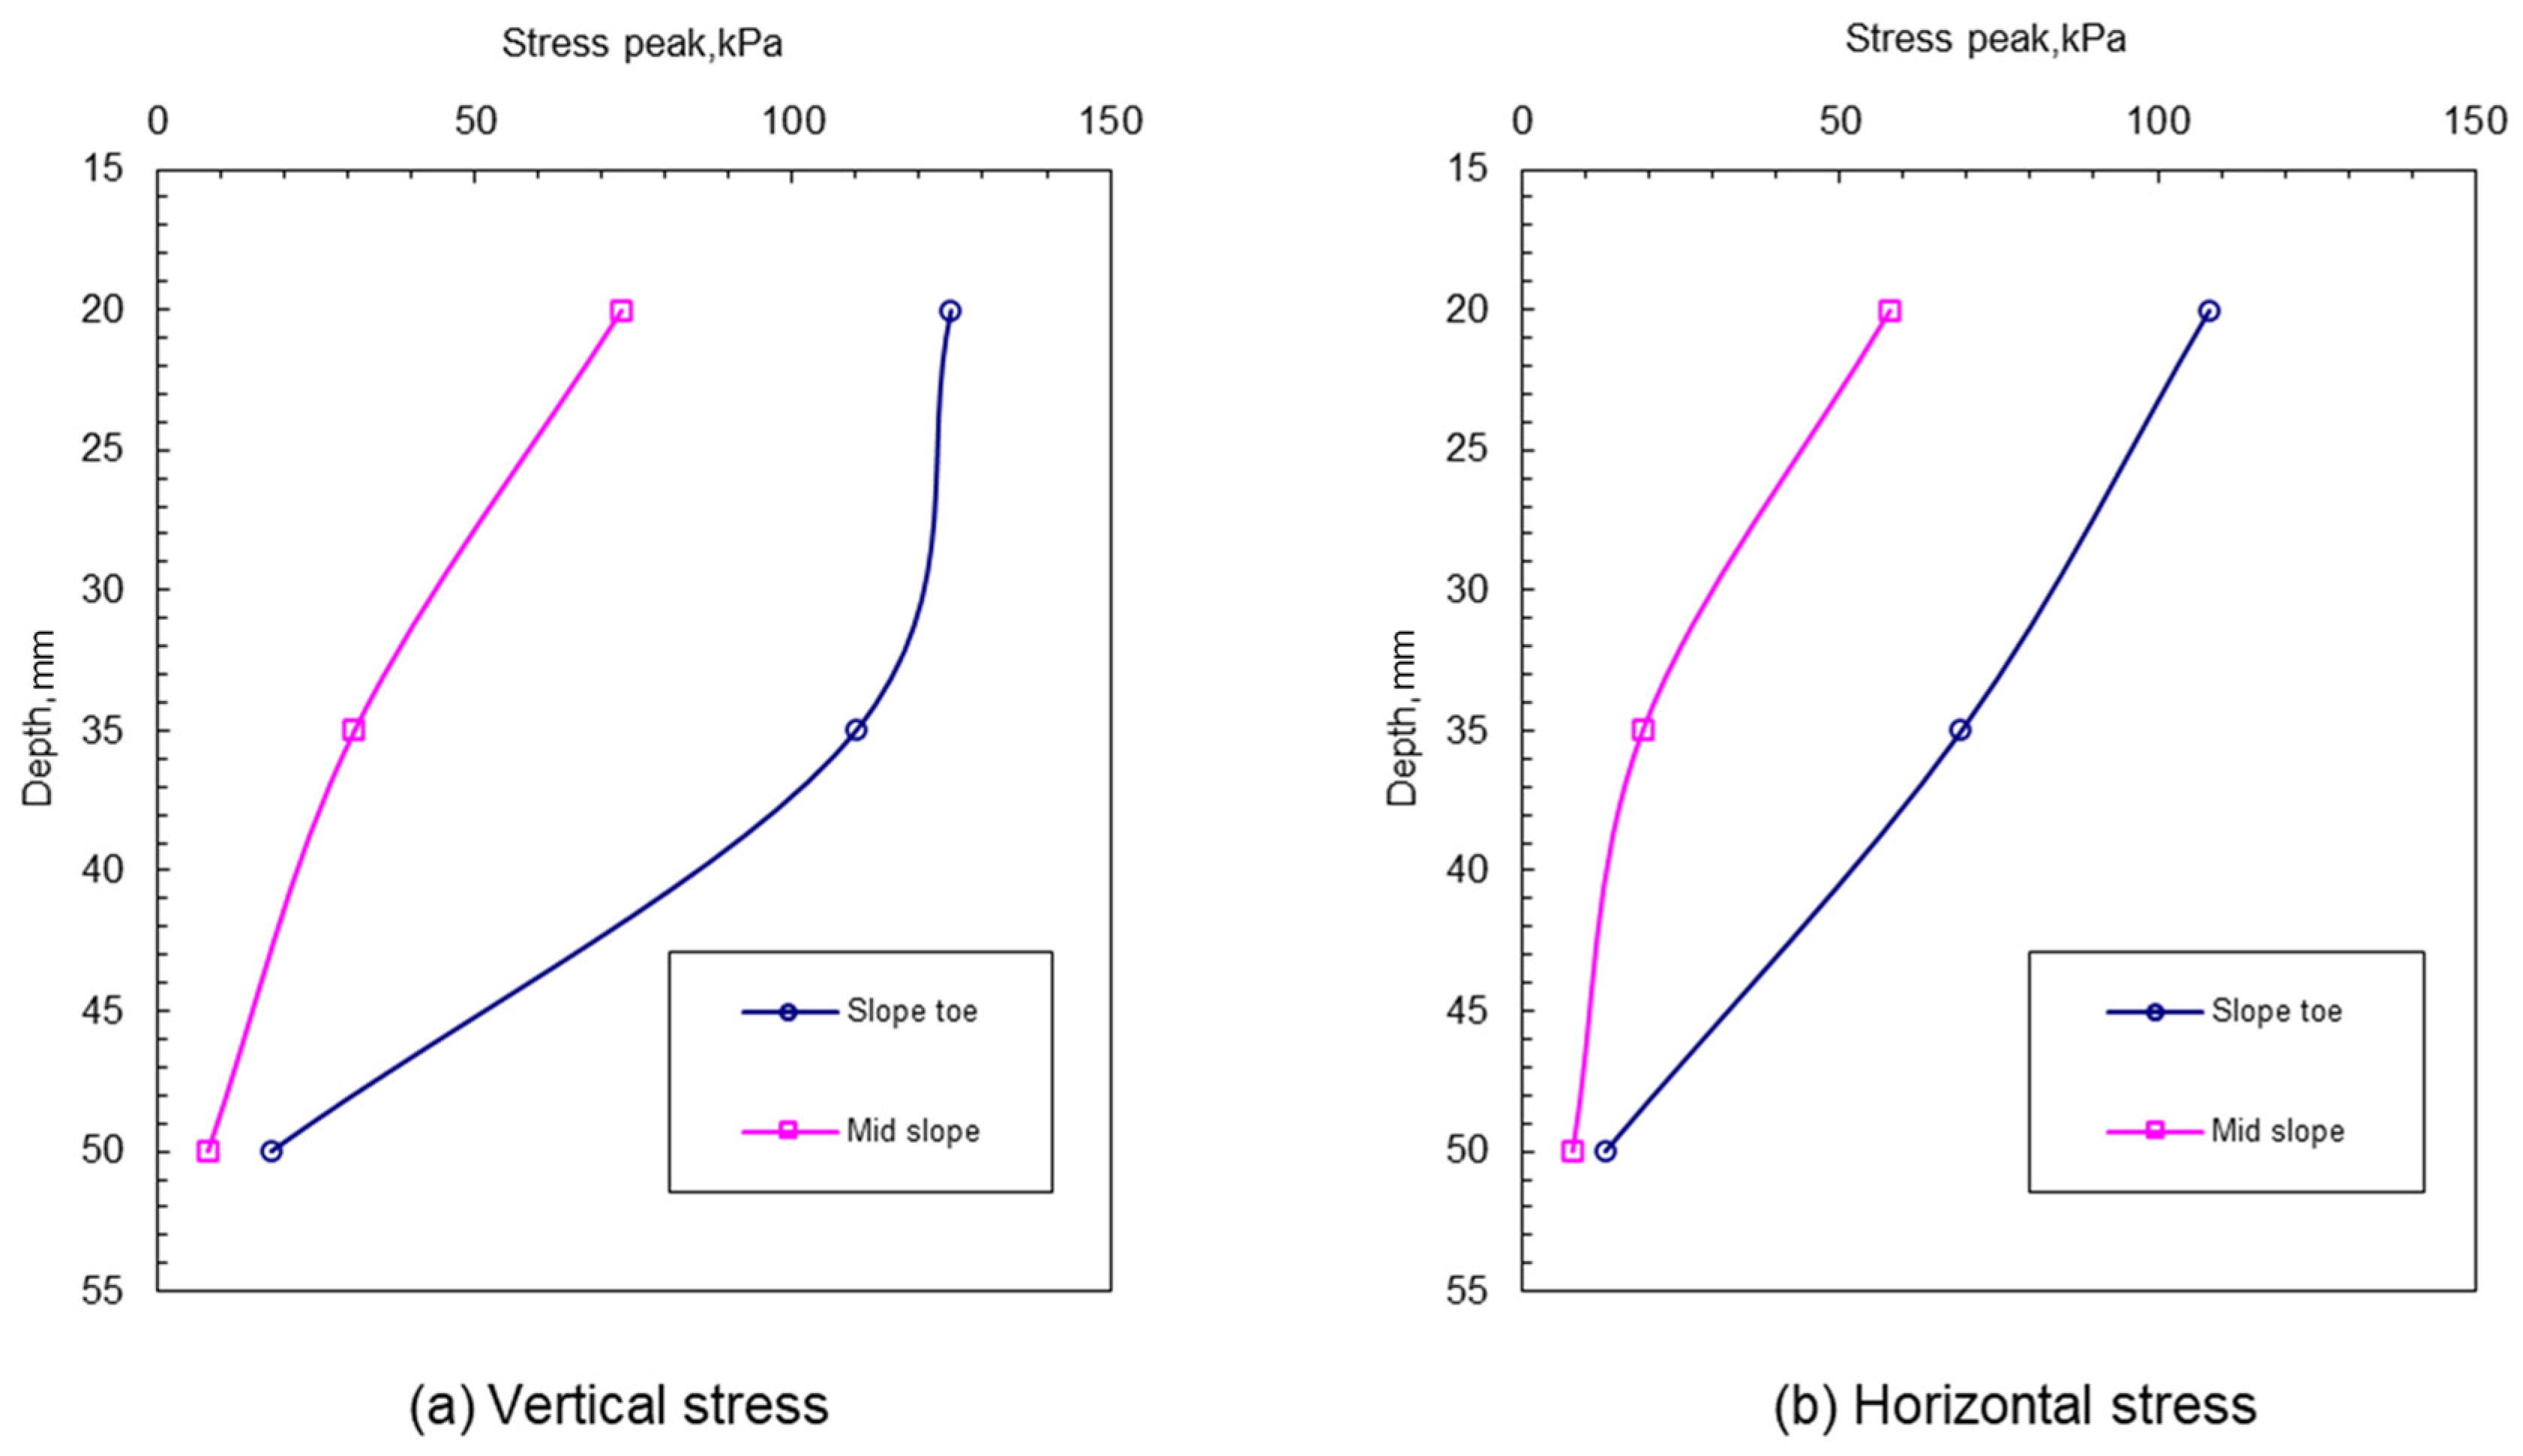
Figure 25a,b illustrate the variation in peak horizontal and vertical stress with depth at the slope toe and mid-slope. Stress levels decrease with depth.
Analysis of the experimental results and observations suggests the following mechanism for stress field evolution. Expansive soil undergoes swelling deformation and volume increase upon absorbing water. However, in a semi-infinite state, the overall stress remains balanced, and no significant shear stress develops within the soil, minimizing the likelihood of instability or failure.
After slope excavation, horizontal stress is released. Factors such as atmospheric conditions and rainfall infiltration introduce seepage forces into the soil, increasing moisture content and triggering notable hygro-expansive effects. Due to the sloped geometry, the internal stress field becomes unbalanced, resulting in the development of substantial shear stress within the slope body.
The hygro-expansive effect manifests as deformation when unconstrained and as stress when constrained. Near the slope toe, the absence of a free surface in the horizontal direction constrains deformation development, causing stress to become more pronounced. The closer to the slope toe, the more significant the stress concentration, particularly in the horizontal direction.
The stress field of expansive soil slopes evolves dynamically under infiltration conditions, influenced by the depth of water penetration and the hygro-expansive response of the soil. The interactions between seepage, deformation, and stress provide insights into potential areas of stress concentration, with critical implications for slope stability analysis and design.
6.8. Fracture Evolution Pattern During Slope Drying
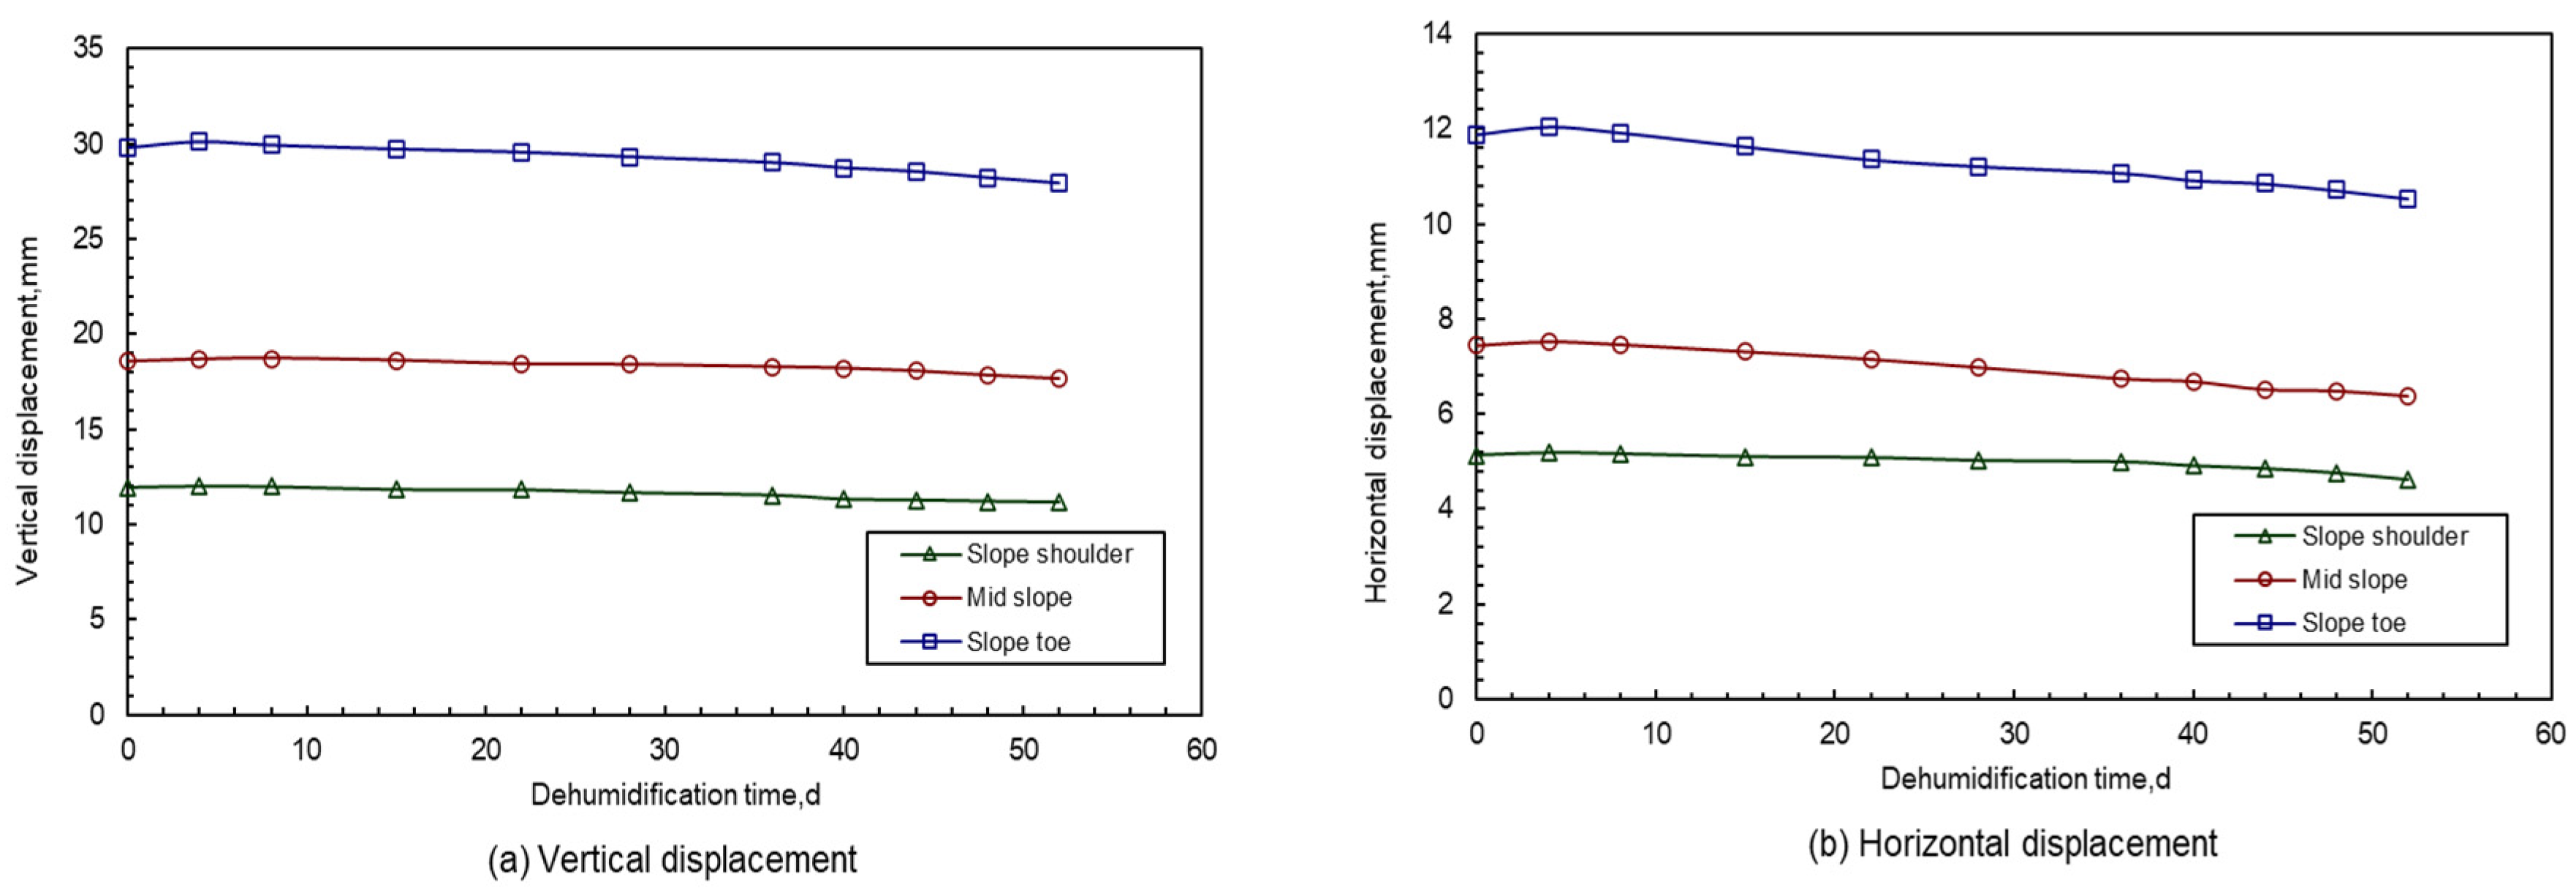
After the cessation of concentrated rainfall, the slope transitions to a natural evaporation state, initiating the soil-drying process. Under a daily evaporation rate of 0.69 mm, this process was maintained for 52 days. Surface deformation in different parts of the slope was monitored during this period, with the results shown in
Figure 26.
The monitoring results indicate that during the evaporation process, while moisture dissipated from the slope, no significant vertical or horizontal displacement occurred on the slope surface based on deformation observations at key locations. The maximum displacement reduction at the slope toe was only about 2 mm. However, the shrinkage effect of expansive soil was highly evident, as moisture loss led to rapid volume reduction and shrinkage. This shrinkage effect manifested through the formation and propagation of cracks. Taking the slope surface as the reference plane, no normal deformation was observed at any point, but significant tangential deformation was evident. This caused a reduction in the surface area of the slope soil and a contraction in soil volume.
6.9. Comparison with Previous Studies
The model test results presented in this study demonstrate a rainfall-induced shallow sliding process characterized by progressive deformation from the slope toe upward, accompanied by increased moisture content and localized crack expansion. These findings are in strong agreement with field-based investigations of rainfall-induced shallow landslides in expansive soils, where analogous failure initiation and progression patterns have been documented [
20,
27].
Specifically, Liang et al. [
20] reported that rainfall-induced failures in expansive soil slopes often initiate at the lower slope and propagate upward as water infiltrates through cracks, softening the soil and reducing shear strength. Zhao et al. [
27] further emphasized that moisture infiltration accelerates strength softening and expansion deformation, contributing to the loss of slope stability. Our results corroborate these observations by showing early-stage moisture accumulation at the toe and a gradual upward migration of the wetting front, leading to progressive failure.
The experimental observation of crack initiation prior to large-scale displacement is also in agreement with previous laboratory and numerical studies. Zhang et al. [
3] found that the development of tension cracks and their connectivity play a decisive role in determining the failure pattern of expansive soil slopes. Kong et al. [
7] quantitatively demonstrated the extension behavior of cracks using fracture mechanics approaches, supporting the interpretation that crack evolution precedes and facilitates failure.
Furthermore, our interpretation of suction reduction and strength degradation due to increased water content is consistent with the constitutive understanding of unsaturated expansive soils. Ng et al. [
9] highlighted the significance of state-dependent behavior in such soils, where loss of matric suction during wetting leads to notable softening and deformation.
Taken together, the observed failure sequence in this study aligns well with prior findings on expansive soil behavior while also providing new insights through detailed moisture-displacement correlation and crack evolution tracking under controlled conditions.
7. Conclusions
This study provides a comprehensive analysis of the shallow sliding failure of expansive soil slopes induced by rainfall, emphasizing the importance of both intrinsic soil properties and external environmental factors. The model tests conducted using Nanyang expansive clay demonstrated that the progressive failure theory, driven by the development and propagation of cracks, is a key mechanism in shallow sliding. The presence of vertical surface cracks and subsurface structural cracks played a crucial role in facilitating water infiltration, leading to localized stress concentrations and significant deformations. The study also underscored the impact of atmospheric conditions, particularly wet-dry cycles, on the stability of expansive soil slopes. As moisture content increased, the suction of unsaturated soils decreased, causing softening of the soil and weakening of its strength.
The experimental findings have important implications for the prevention and mitigation of geohazards associated with expansive soil slopes. The data collected from the model tests offer a detailed understanding of the mechanical behavior and failure mechanisms of these slopes, which can inform the design of more effective stabilization techniques. Future research should focus on developing predictive models that account for the complex interactions between soil properties, crack development, and environmental factors. Additionally, further investigation into the long-term effects of repeated wetting and drying cycles on slope stability is warranted. The insights gained from this study contribute to the broader field of geotechnical engineering and provide a foundation for addressing the ongoing challenges posed by expansive soils in various regions worldwide.
Although this study followed the principle of similarity in terms of geometry, material properties, boundary conditions, and loading protocols, the validation of these criteria was primarily qualitative. Future studies will focus on incorporating parameter sensitivity analysis and statistical validation to quantitatively assess the influence of key factors such as crack distribution, initial matric suction, and infiltration rates. This will further enhance the scientific rigor of the model test and its applicability to real-world slope conditions.


 ,
, 
