1. Introduction
Groundwater is an essential source of fresh water, crucial for sustaining household activities, industrial and agricultural operations, and ecological systems [
1]. Globally, more than 1.5 billion people depend on groundwater as their main source for drinking, irrigation, and industrial purposes [
2]. In addition to the amount of water needed, the quality of water is extremely important, especially for drinking water [
3]. Contamination of groundwater from a range of pollutants, whether occurring naturally or resulting from human activities, has heightened concern about potential future water scarcity [
4].
To improve the production processes, industries have exacerbated contamination by releasing numerous chemicals and organic compounds into the environment, and spills or inadequate disposal can lead to infiltration into the soil and groundwater. Volatile organic compounds (VOCs) in groundwater are a major environmental concern, with intervention essential to address with the risk of pervasive a VOC plume caused by anthropogenic activities [
5]. Volatile organic compounds (VOCs), widely recognized for their toxicity and carcinogenic properties, pose significant risks to both the environment and human health [
6]. Their prevalent production, usage, and inadequate disposal practices have led to their frequent presence as contaminants in soil and groundwater [
7]. Once absorbed into the subsurface, dissolved VOCs interact with soil and sediment through various sorption processes. The most significant mechanism is hydrophobic partitioning into soil organic matter, which is determined by the organic carbon partition coefficient (Koc) and is strongly linked to the compound’s octanol–water partition coefficient (Kow). Soil with a higher organic content exhibits a greater adsorption capacity, which reduces the migration of VOCs in groundwater. Additionally, adsorption onto mineral surfaces (e.g., clays and oxides) and under varying redox conditions can also influence the VOC fate, though to a lesser extent.
Addressing the contamination of volatile organic compounds, such as trichloroethylene,
cis-1,2-dichloroethylene, and vinyl chloride, in shallow groundwater aquifers presents considerable challenges, as traditional remediation methods are costly and complex. Natural attenuation is recognized as an effective remediation technique in various environmental remediation strategies [
8,
9]. Monitored natural attenuation (MNA) relies on natural processes such as biodegradation, dispersion, advection, sorption, and dilution to minimize the contaminant level in groundwater. In practical terms, natural attenuation may require months or even decades to completely purify a contaminated aquifer depending on the concentration of the contaminants. In industrial areas, regulatory frameworks, public health awareness, and technological resources enable more proactive and science-based remediation efforts, often including advanced monitoring and modeling tools. In contrast, developing countries may face constraints such as a limited institutional capacity, inadequate environmental regulations, and competing economic priorities, which delay or even prevent the remediation of contaminated aquifers. Moreover, geopolitical issues such as transboundary aquifer management or water conflicts can hinder collaborative efforts in data sharing and policy enforcement. As a result, the effectiveness of natural attenuation strategies and engineered remediation approaches may vary significantly across regions, emphasizing the need to integrate hydrogeological assessments with socio-political realities when developing groundwater protection policies.
Numerical groundwater and transport models have proven to be an effective tool to address a variety of groundwater-related problems. Simulation of groundwater is divided into flow modeling and contaminant transport modeling. The most commonly used groundwater flow model is MODFLOW, which solves the governing equation of groundwater flow through the finite difference method [
10]. In the past three decades, reactive transport simulations have drawn enormous amounts of attention in recognizing the behavior of transport and transformation of chlorinated ethenes in aquifers under microbial processes [
11]. As an extension of MODFLOW, RT3D incorporates chemical reactions and processes into the simulation, which is essential for understanding the degradation of contaminants, transformations, or interactions with the environment. One of the simpler models commonly used for natural attenuation is BIOSCREEN [
12], which can simulate solute transport and degradation processes, incorporating advection, dispersion, and biodegradation mechanisms to predict contaminant attenuation over time and space, respectively. Although comprehensive numerical modeling tools have been utilized in previous studies to simulate key subsurface processes such as advection–dispersion, adsorption, and biodegradation, the use of BIOSCREEN is justified as a complementary tool to support preliminary screening-level analysis and model validation. BIOSCREEN provides a simplified approach to contaminant transport in groundwater along the flow path under a set of well-defined assumptions. By utilizing first-order decay and instantaneous reaction models, BIOSCREEN provides a robust framework for assessing the natural attenuation potential of both dissolved hydrocarbons and chlorinated solvents, respectively. This tool is particularly useful for sensitivity analysis and for comparing the output of more complex numerical simulations.
Despite extensive research on natural attenuation of chlorinated ethenes, a significant gap remains in understanding the long-term behavior of these compounds within groundwater aquifers exposed to persistent contamination over multiple decades. Previous studies often rely on short-term laboratory experiments, like batch and column tests, which fall short of capturing the complexity of in situ hydrogeochemical reactions at the field scale. Additionally, the relationship between site-specific microbial populations and VOC degradation pathways remains underexplored, despite the widespread use of numerical models for groundwater systems. In particular, the function of metabolic processes is in varying redox conditions and the transition from aerobic to anaerobic zones during prolonged attenuation. Thus, this study bridges the gap by merging real-world aquifer data, microbial interactions, predictive modeling, future contamination levels, and plume movement. This approach will offer novel perspectives on the viability and efficacy of natural attenuation of a VOC-contaminated shallow aquifer remediation strategy, as well as the potential for enhanced bioremediation in industrially impacted aquifers.
This study aims to assess the natural attenuation processes of volatile organic compounds within a shallow groundwater aquifer contaminated for over 30 years by industrial activities, focusing on the transport patterns, degradation rates over time, and future behavior of the contamination of plume using numerical models. The industrial site affected by the long-term discharge of chlorinated ethenes provides an opportunity to evaluate real-world hydrogeochemical changes under natural conditions. This study ensures a more accurate understanding of the processes occurring at the field scale by eliminating errors associated with laboratory-scale analyses and by applying models.
2. Materials and Methods
2.1. Site Description and History
An industrial site in Thailand has been affected by a historical TCE leakage incident that occurred over 30 years ago. The improper storage and disposal practices resulted in the percolation of TCE and its degradation by-products such as
cis-1,2-Dichloroethylene (
cis-DCE) and vinyl chloride (VC) into the shallow aquifer. This contamination has expanded over the past few years, creating a plume that poses a threat to surrounding water consumers and ecosystems. An aerial digitized map of the industrial area is shown in
Figure S1.
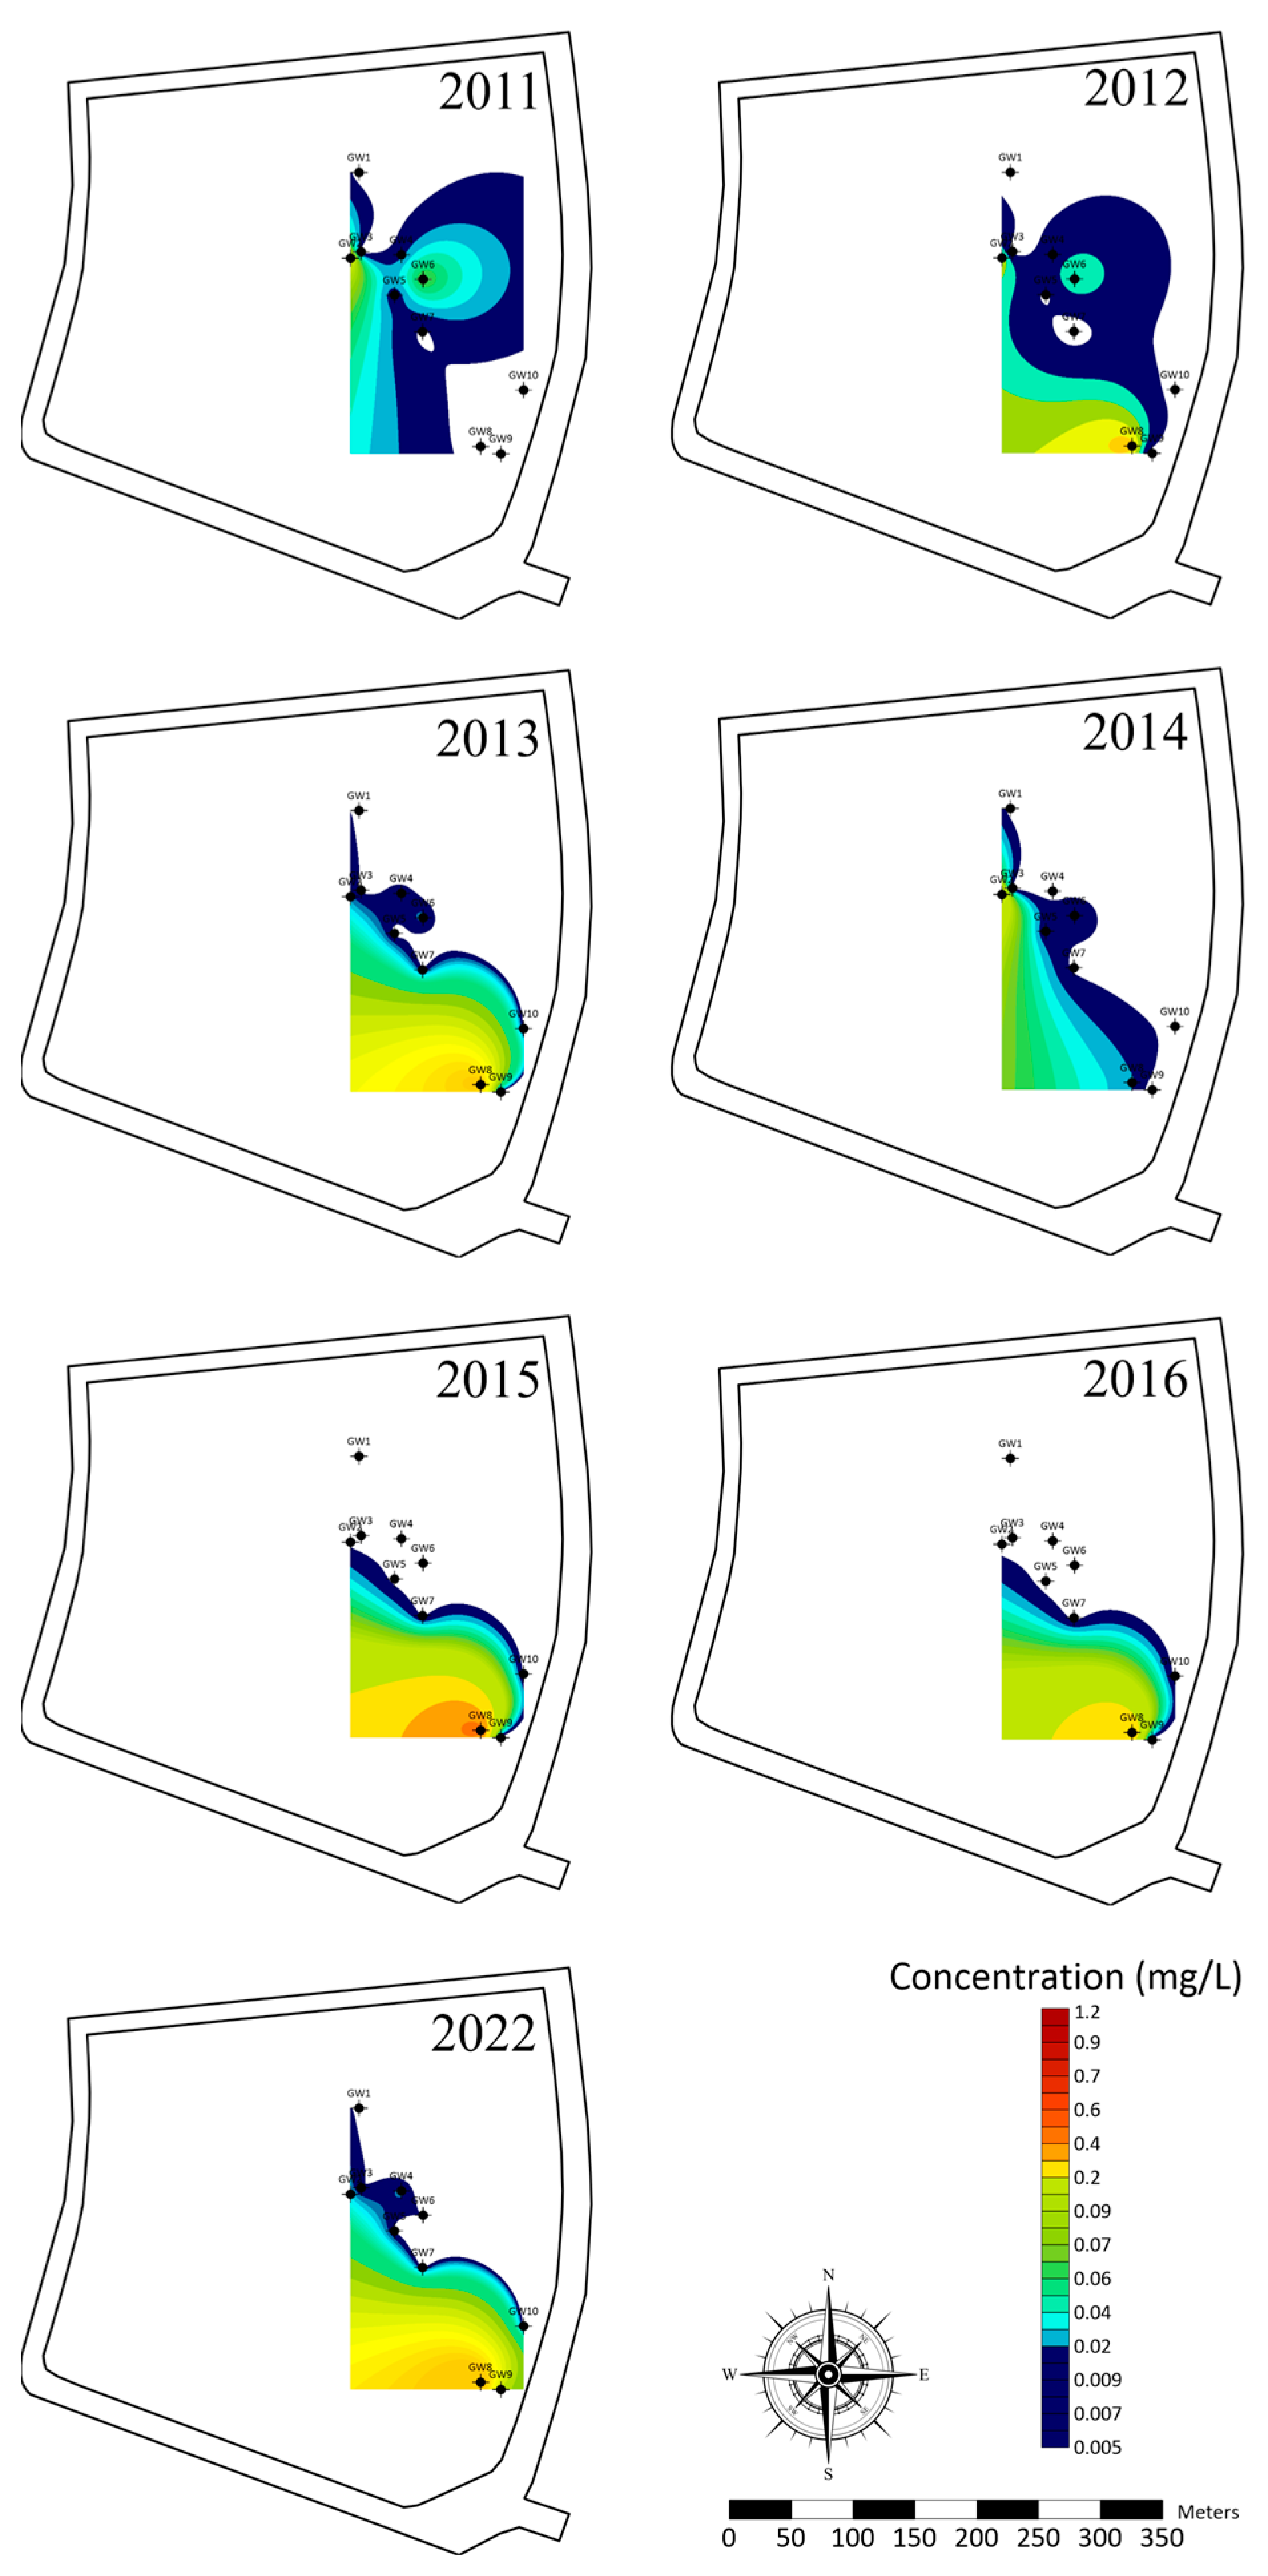
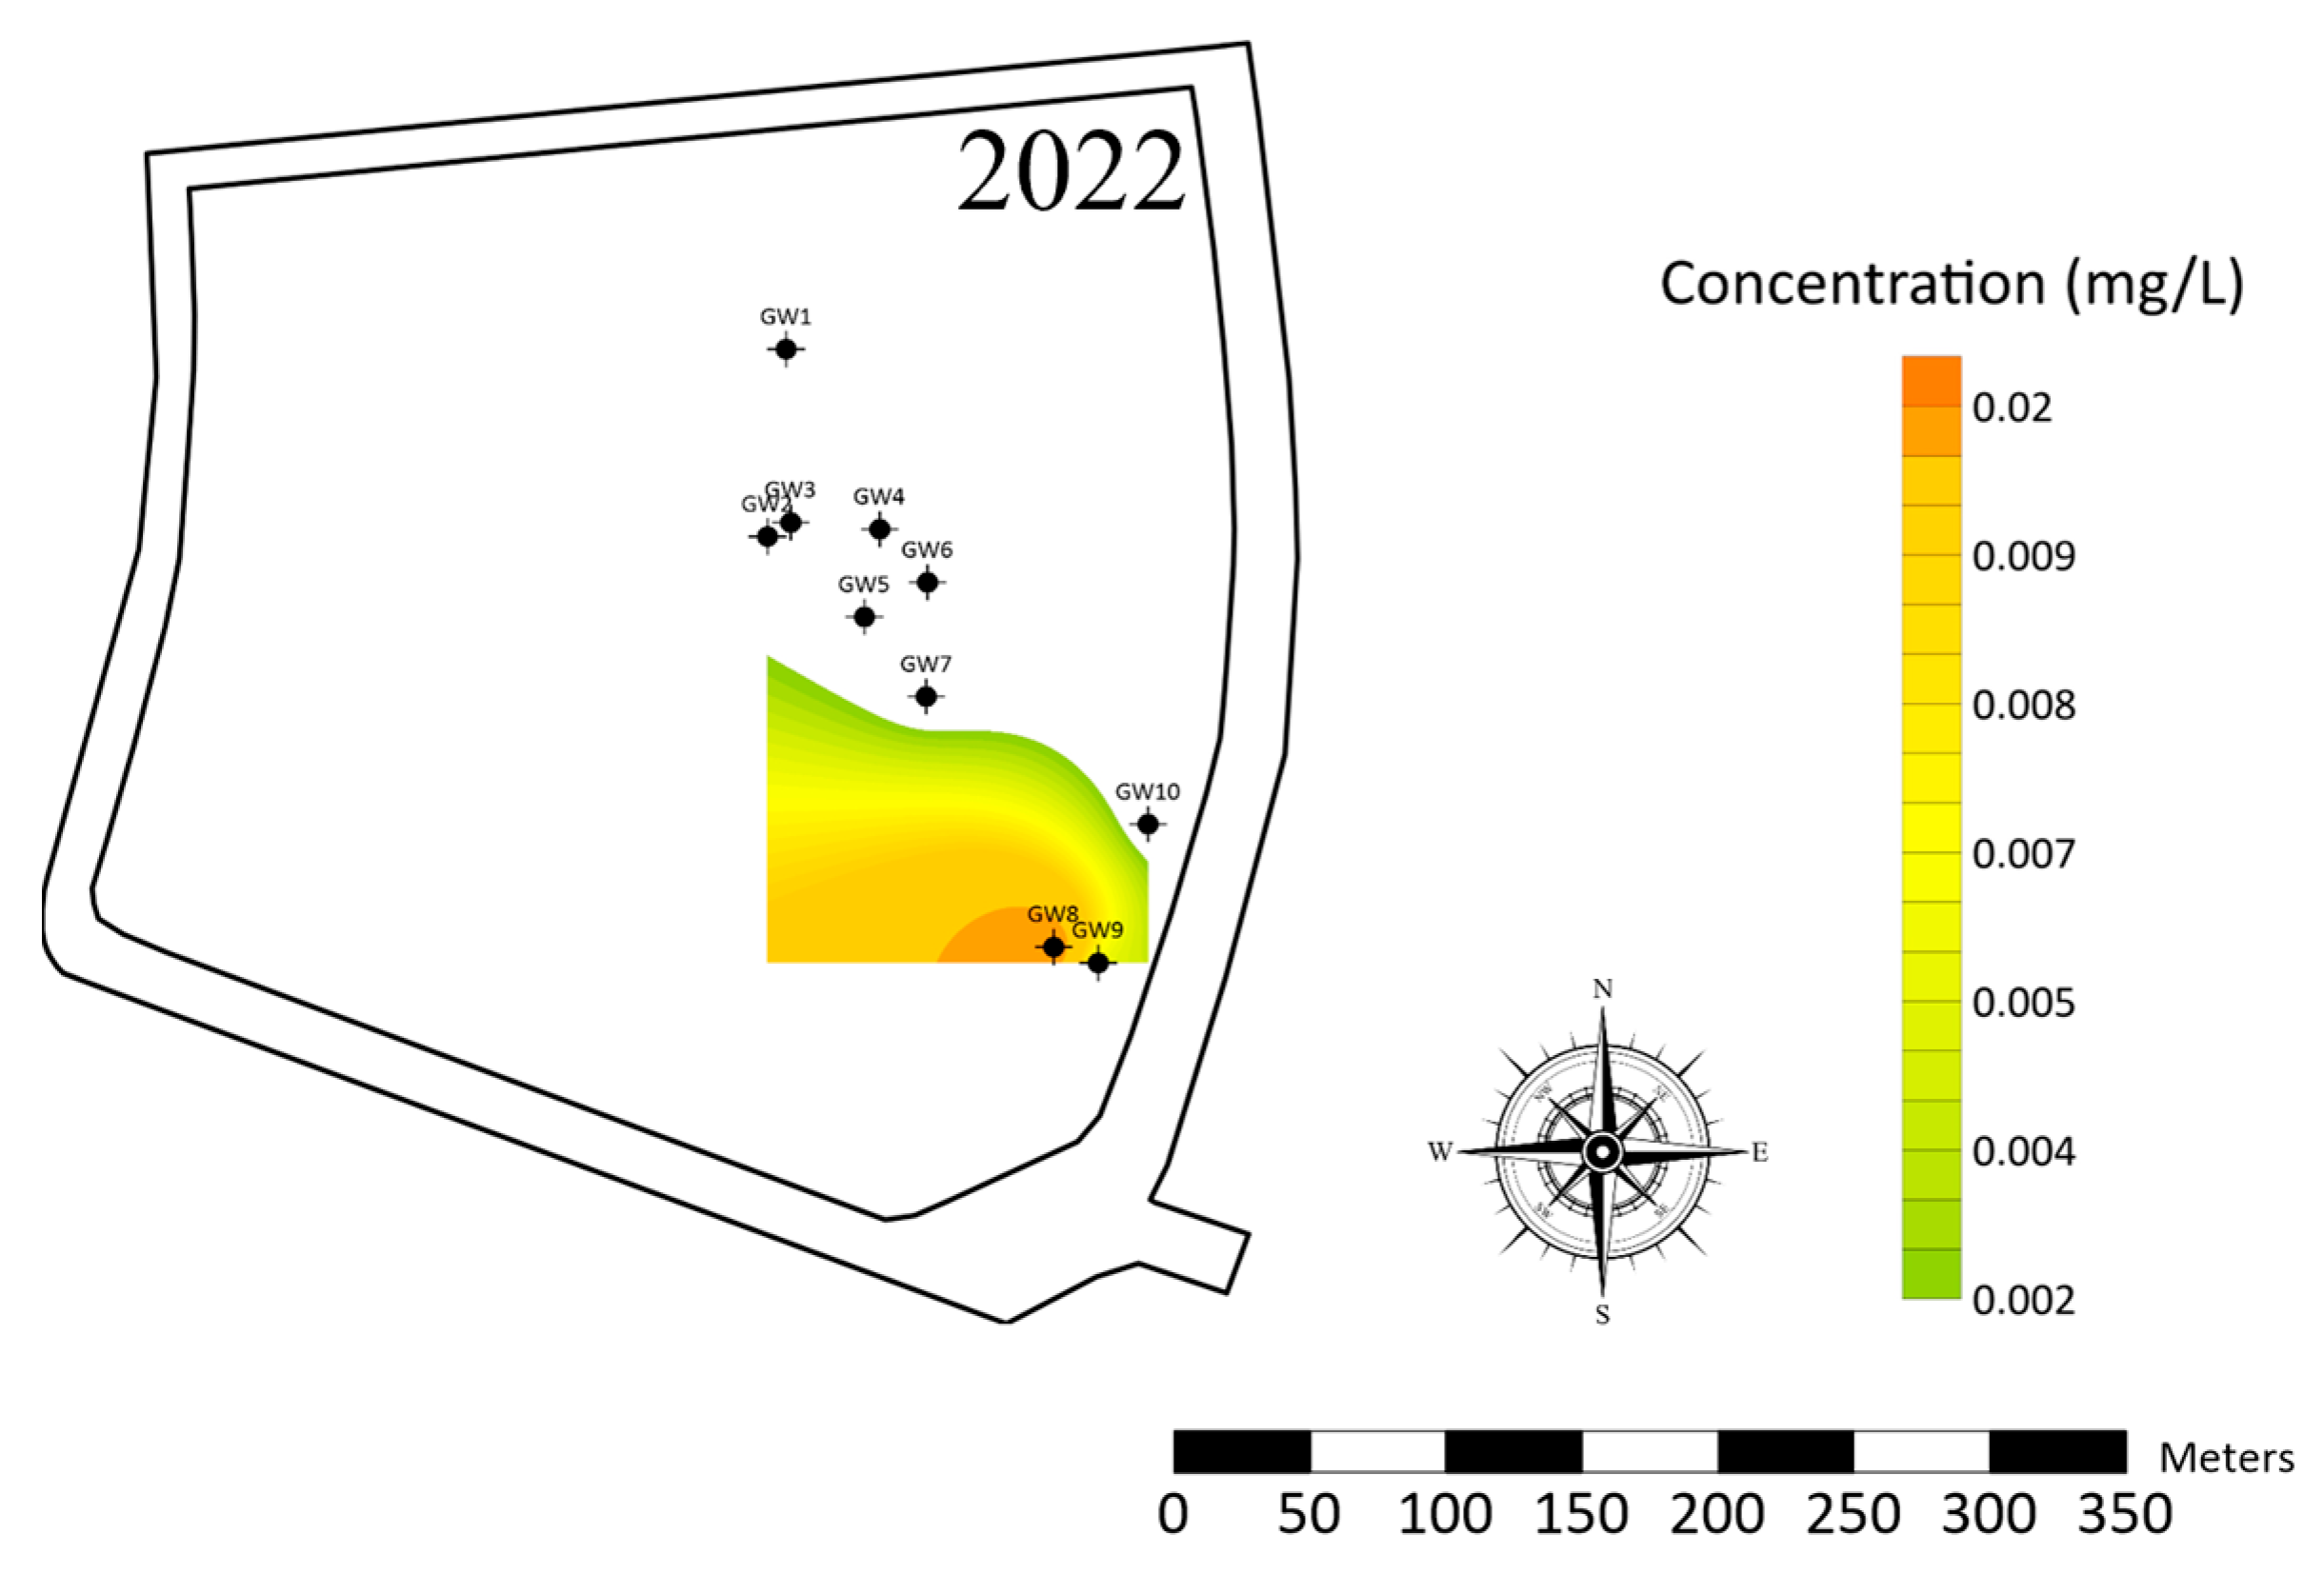
TCE,
cis-DCE, and VC in shallow aquifers were monitored in the study area from 2011 to 2016 and, again, in 2022, demonstrating temporal and spatial variations in contaminant distribution using a cut-off value that exceeded the maximum contaminant level, as shown in
Figure 1,
Figure 2 and
Figure 3. The TCE concentration ranged from 0 to 1.4 mg/L,
cis-DCE from 0 to 2.7 mg/L, and vinyl chloride from 0 to 0.02 mg/L. The maximum contaminant levels (MCLs) of TCE,
cis-DCE, and VC are 0.005, 0.07, and 0.002 mg/L, respectively [
13].
The concentration of VOCs in the industrial area is exceeding the maximum contaminant level and poses a significant risk of cancer. The estimated cancer prevalence for TCE at its maximum concentration of 1.4 mg/L is 0.2337 (23.37%) from a lifetime exposure, and a concentration of 2.7 mg/L of
cis-DCE is associated with a 0.4326 (43.26%) cancer risk [
14]. These high risks emphasize the urgent need for remedial measures to address these contaminants in the shallow aquifer, as they pose significant public health threats.
2.2. Soil Sampling
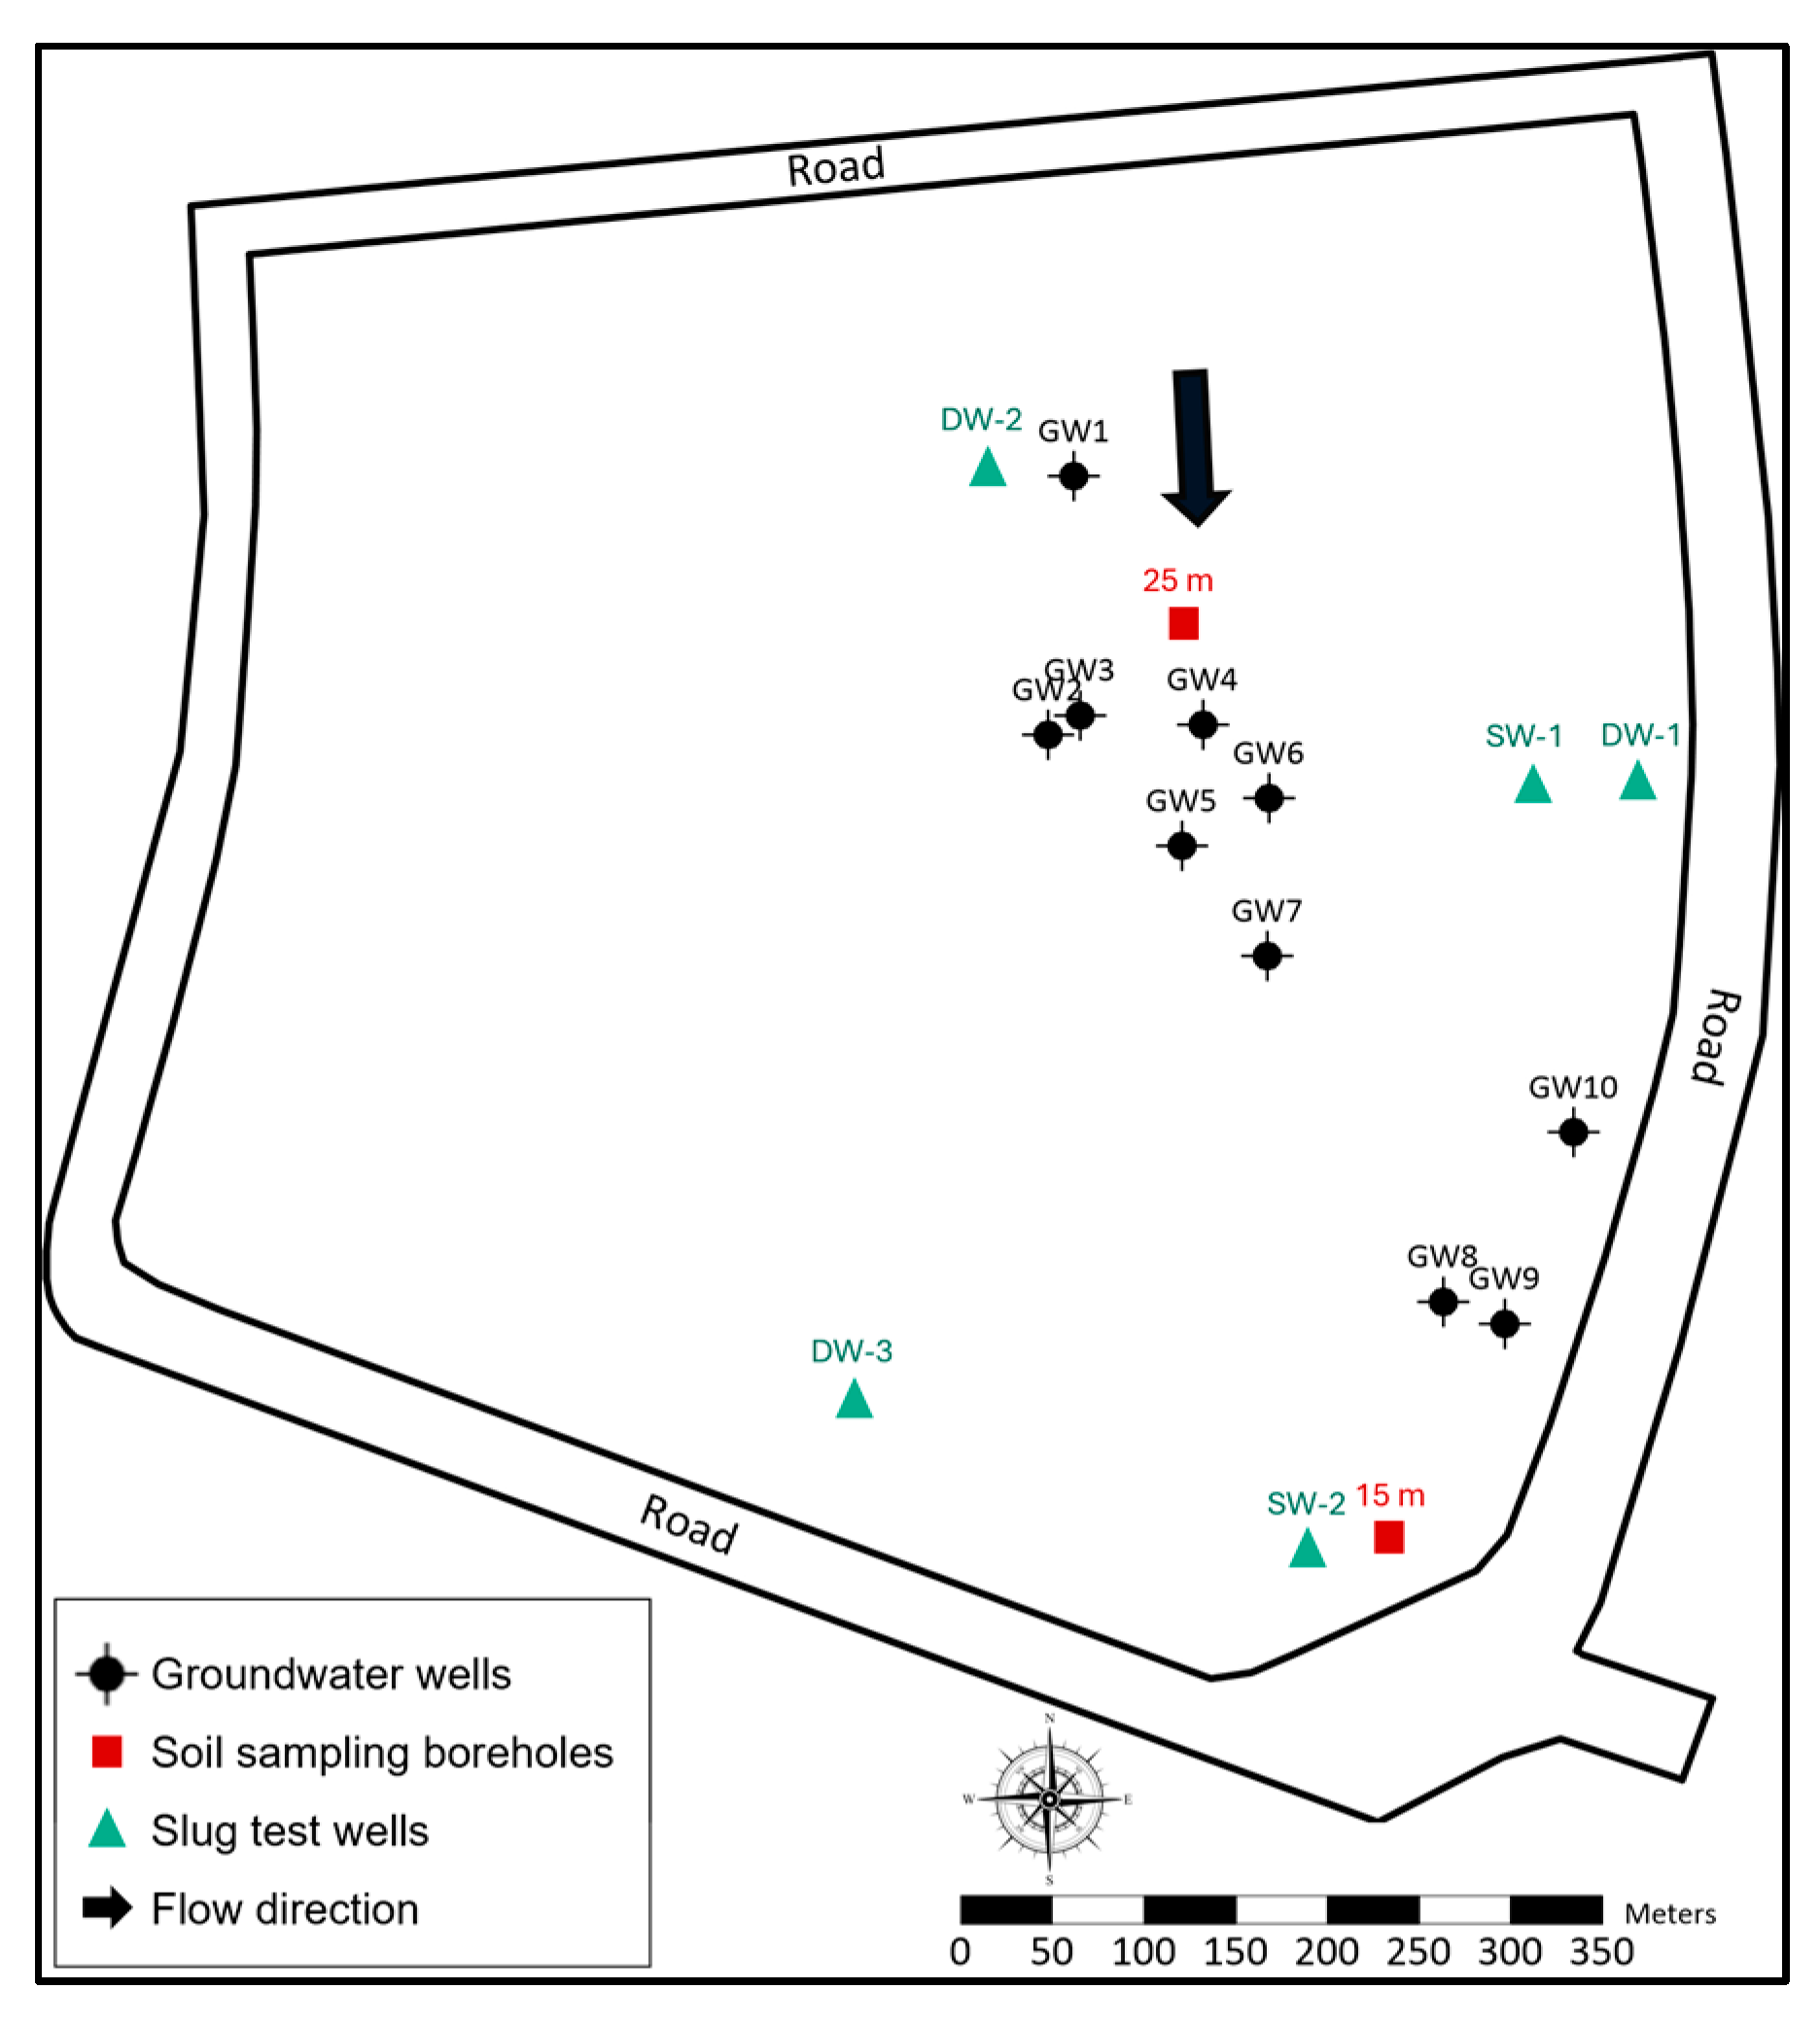
The soil samples were collected from two boreholes with depths of 15 and 25 m to assess the physical and chemical properties of the soil layers, as shown in
Figure 4. A chemical analysis of soil was performed to evaluate organic matter and total organic carbon, as evidence of potential microbial activity and ability to retain contaminants. Soil samples were analyzed to determine the moisture content, grain size distribution, specific gravity, and porosity using standard geotechnical methods.
Table 1 provides a list of methods for studying chemical and physical properties of the soil.
2.3. Groundwater Sampling and Chemical Analysis
Groundwater samples were collected quarterly, spanning the period from 2011 to 2016 and 2022, from 10 groundwater wells using low-flow pumps. The locations of groundwater sampling wells and groundwater flow direction are shown in
Figure 4. Water levels in the existing groundwater wells were measured once a month using a water measuring tape device. The chemical analysis of collected groundwater samples for volatile organic compounds (TCE, DCE, and VC) was conducted using gas chromatography coupled with mass spectrometry (GC-MS) to ensure a high sensitivity and precision. In addition to VOC analysis, anions such as nitrate, phosphate, sulfate, and chloride were analyzed using ion chromatography (IC). The concentration of metals such as manganese, iron, sodium, calcium, potassium, and magnesium was analyzed using inductively coupled plasma optical emission spectrometry (ICP-OES). Finally, the alkalinity was measured using an on-site titration test kit, allowing for immediate evaluation.
2.4. Slug Tests
The slug test [
18,
19] was conducted in five of the wells (deep and shallow) in the study area to measure the permeability coefficient of the shallow aquifer by using the Hvorslev technique (
Figure 4). Groundwater was pumped out from the shallow and deep wells, and the water level was measured every minute until the water level returned to the normal level before pumping. The test results were determined as hydraulic conductivity (
K).
Hvorslev’s Equations (1) and (2) for a partially penetrating well not in contact with an impermeable boundary are as follows:
where
H is displacement at time
t,
is initial displacement at t = 0,
is radial (horizontal) hydraulic conductivity,
is vertical hydraulic conductivity,
L is screen length,
is nominal casing radius,
is well radius,
t is elapsed time since the initiation of the test, and
is effective well radius or equivalent well radius.
2.5. Pail Test
In this study, two observation wells (OB-1 and OB-2) with a depth of 25 m were selected for the pail test due to the availability of a specific strain, fair permeability, and highest concentration of VOCs. During the pail test, groundwater (80–200 L) was pumped out from these observation wells into a container. Carbon sources, nutrients, and electron acceptors, with a ratio of 100:10:1, were then added to the water to enhance the biodegradation process. The solution was thoroughly mixed and circulated to ensure adequate oxygen and solution were injected slowly back into the aquifer. For the addition of nutrients, the C:N:P ratio was calculated as 200:16.9:3.4 g for glucose, urea, and di-ammonium phosphate (DAP). This bioremediation process underwent regular monitoring between 3 and 6 months while groundwater was sampled once a month.
2.6. BIOSCREEN
BIOSCREEN intends to simulate transport and degradation using analytical solutions of advection–dispersion, as shown in Equation (3). BIOSCREEN has been widely used in site investigations and remediation planning due to its reliability and ease of use, particularly for sites contaminated by petroleum spills and leaking underground storage tanks. BIOSCREEN utilizes the Domenico solution to model one-dimensional solute transport with biodegradation, enabling it to be effective in assessing groundwater contamination.
where
C(
x) is contaminant concentration at distance
x (mg/L),
is initial contaminant concentration (mg/L),
is groundwater velocity (m/d),
is longitudinal dispersion coefficient (m),
is a first-order decay coefficient (per year),
R is retardation factor, and erfc (
x) is complementary error function. A summary of the BIOSCREEN input parameters is provided in
Table 2.
The contaminated zone was designed as a thickness of 25 m in the saturated zone, divided into five zones over widths of 13, 21, 16, 21, 21, and 13 m, with input concentrations ranging from 0.022 to 0.03 mg/L based on field data. The modeled area dimensions were constructed at 166 m length and 100 m width, with a 30-year simulation period to show the long-term natural attenuation potential. The estimated plume length was 140 m, and field data, such as concentrations at different distances from the source (0, 16, 33, 50, 66, 83, 100, 116, 133, 150, and 166 m), were used to validate the model. BIOSCREEN used centerline and array modes to generate contaminant concentration profiles along the flow centerline. The findings, including plume extent, concentration profiles, and attenuation rates, were compared to field data to determine the natural attenuation potential of the groundwater aquifer accurately.
2.7. Numerical Model Setup
2.7.1. Groundwater Flow Model
This section outlines the methods used to build a groundwater flow simulation model. A model helps to combine different data types, such as hydrogeological conditions and hydrologic stresses that influence groundwater systems. MODFLOW [
10,
18,
20] was used in this study. A steady-state groundwater flow was assumed to observe long-term average hydrogeological conditions in the study area. This assumption is confirmed due to the relatively stable water table and absence of significant seasonal or transient pumping influences during the modeled period. Steady-state conditions allow for a simplified simulation of groundwater flow while maintaining sufficient accuracy in assessing contaminant transport behavior over an extended time scale. The groundwater flow equation in which MODFLOW estimates the hydraulic head,
h, is shown in Equation (4). The general governing equation for three-dimensional groundwater flow under steady-state conditions is given by
where
h is hydraulic head (m),
Kx,
Ky,
Kz is hydraulic conductivity in the
x,
y, and
z directions (m/d), and
W is volumetric flux per unit volume representing sources and sinks.
2.7.2. Conceptual Model
The model conceptualization incorporates key parameters such as the measured groundwater heads, hydraulic conductivity, and well depth values derived from field measurements. The northern and southern boundaries of the model domain were replaced with specified head boundaries to indicate lateral inflow and outflow of groundwater. Boundary conditions were assigned based on observed hydraulic head data and hydrogeological characteristics of the industrial area. A specified head of 259.0 m was applied on the upgradient, representing the horizontal inflow zone, while a head of 258.3 m was assigned to the downgradient to simulate discharge conditions. Furthermore, a new coverage setup was added to the model named a groundwater well. The model utilized accurate data, such as depth, coordinates, and measured hydraulic head, to enhance accuracy and ensure a more accurate representation of groundwater flow. The K values from the slug test were interpolated into a finite-difference grid, which was used as an initial parameter value for subsequent simulation.
2.7.3. Model Setup
In the numerical model, the model domain was arranged in a 3D grid with 40 rows and 40 columns in the x and y directions (a uniform model grid size of approximately 10 × 10 m2), with two layers in the z direction. This resolution was chosen as a compromise between computational efficiency, inverse modeling run-time, and solution accuracy, based on preliminary simulations. It was found that repeated simulations with finer resolutions (e.g., 60 × 60 and 80 × 80 grids) did not significantly impact the results compared in terms of plume width, peak concentration, and gradient steepness. The results remain consistent across the grid, which indicates that the 40 × 40 resolution is sufficient.
The model included two layers to capture the vertical stratigraphy of the shallow aquifer. The first layer represented the upper portion of the aquifer, with a depth of 0 to 15 m, a top elevation of 259.6 m, and a bottom elevation of 244.6 m. The second layer represented the lower portion, with a depth of 15.5 to 25 m, a top elevation of 244.6 m, and a bottom elevation of 234.6 m. According to the field data, initial hydraulic conductivity values were set at 0.03 m/d for the first layer and 0.06 m/d for the second layer. The vertical anisotropy (
Kv/
Kh) for both layers was originally set as 0.1 and will be adjusted during the automatic model calibration process. This will ensure that our model simulation accounts for vertical heterogeneity. Steady-state simulations were conducted to determine groundwater flow patterns under constant conditions. A summary of the model discretization and some model parameters are shown in
Table 3.
2.7.4. Model Calibration
Model calibration is the process of systematically adjusting the model parameters within limits to determine the optimal fit between hydraulic heads and flows. A highly parameterized parameter estimation, the PEST [
21] tool, was used for model calibration to enhance model reliability and accuracy. PEST with the pilot point technique allows the model to simulate groundwater flow in aquifers with spatially variable hydraulic conductivity. A total of 100 pilot points were inputted to the model, as shown in
Figure S2, and PEST was used to estimate the values at each point. The hydraulic conductivity from the slug test remains unchanged when using the fixed pilot point technique. An interpolating technique that facilitates model heterogeneity will then be applied to spatially interpolate these pilot point values in the model. The vertical anisotropy (
Kv/
Kh) of the model for both layers was also calibrated using PEST to allow a vertical heterogeneity of hydraulic conductivity.
2.7.5. Contaminant Transport Model Simulation
The MODFLOW package utilized RT3D [
22] to simulate the transport of VOCs in the aquifer. The model was developed to simulate both advective and dispersive transport processes as well as the chemical reactions that lead to the degradation of contaminants. The advection–dispersion used in RT3D for contaminant transport in groundwater is shown in Equation (5).
where
C is contaminant concentration (mg/L), t is time (days),
,
, and
are hydrodynamic dispersion coefficients in
x,
y, and
z directions (m/d),
,
, and
are seepage velocities in
x,
y, and
z directions (m/d), and
R is source/sink term (including reactions such as degradation, adsorption, etc.).
Initially, the dispersion package used a longitudinal dispersivity of 30 m (manually calibrated) along the flow path, the ratio of transverse horizontal dispersivity to longitudinal dispersivity (or ) of 0.1, and the ratio of vertical horizontal dispersivity to longitudinal dispersivity (or ) of 0.01. These dispersivity values are essential for determining the spatial and temporal dynamics of the contaminant plume and its transport in a more realistic way.
A constant concentration boundary condition was applied over a localized area at the center of the model domain to represent a continuous point source, consistent with a leaking above-ground storage tank scenario. The contaminant source was assumed to remain active over a defined period, adequate to simulate the change and migration of the plume. This approach is widely employed in groundwater modeling when the historical source strength and timing are not known. The spatial extent of the source was determined based on observed VOC concentrations in nearby wells, and the duration of the source activity was altered during model calibration to match the observed plume length and concentration distribution. This parameterization provides a precise estimation of source behavior while enabling an effective evaluation of natural attenuation processes.
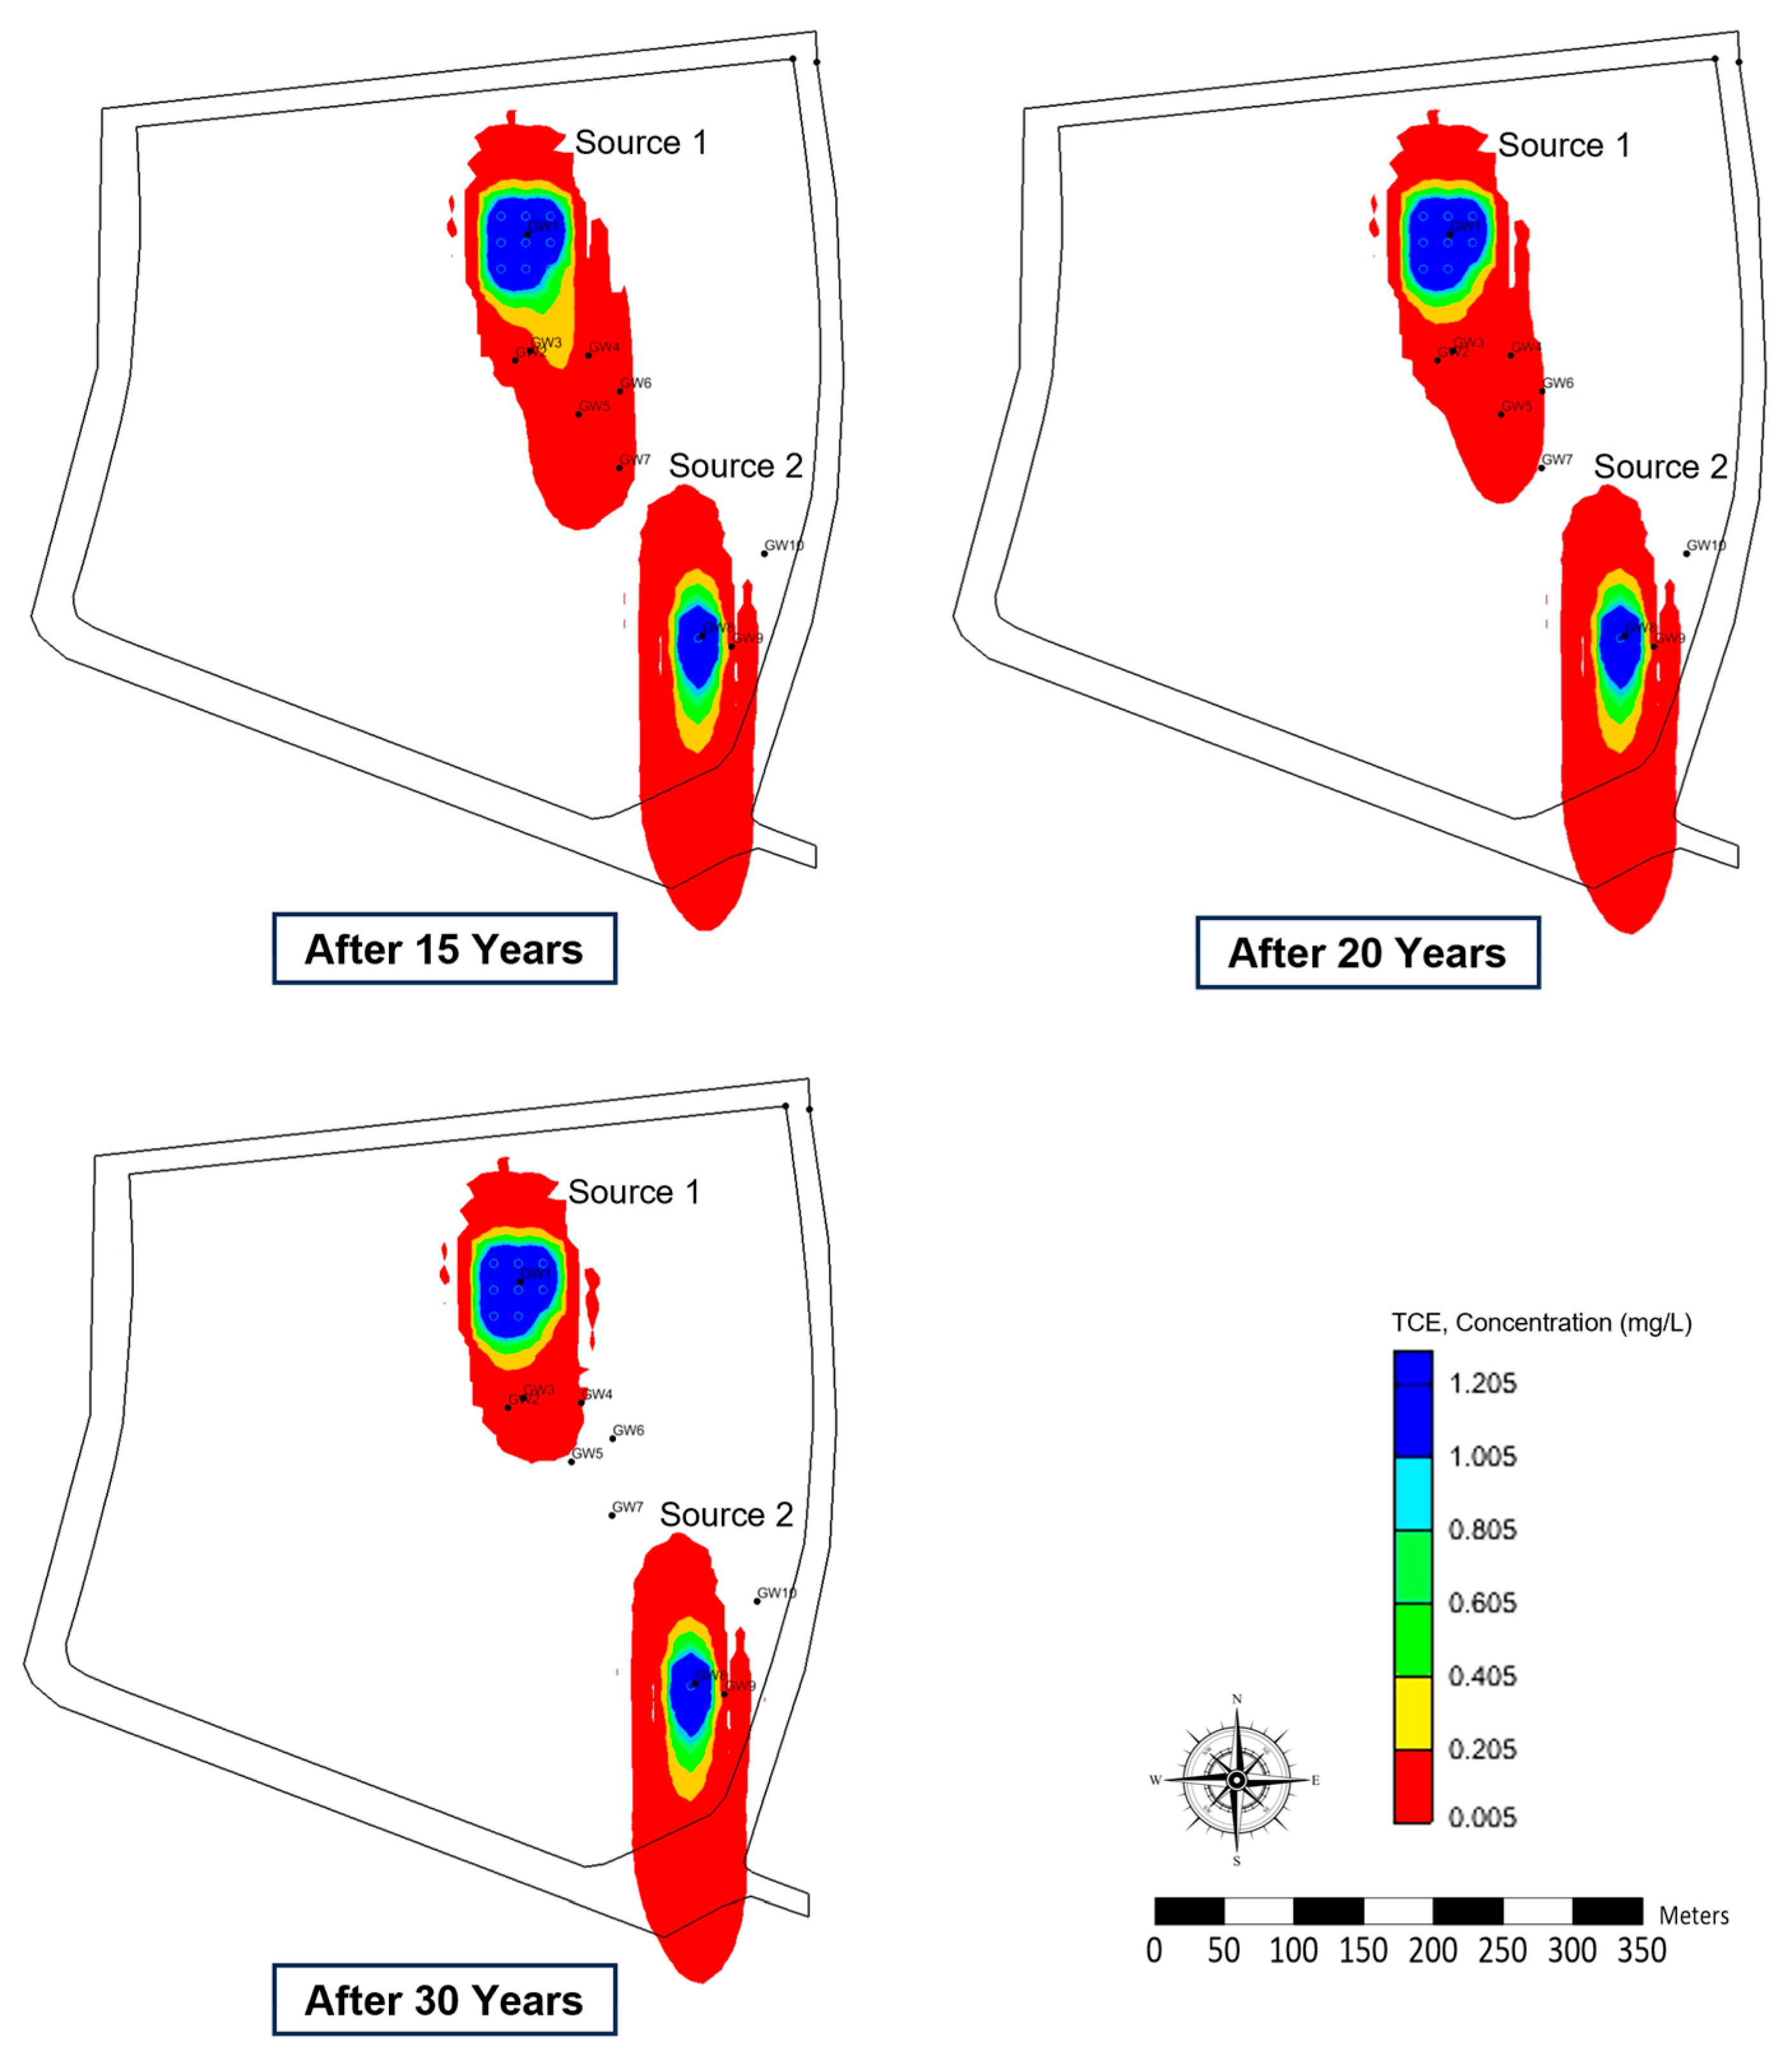
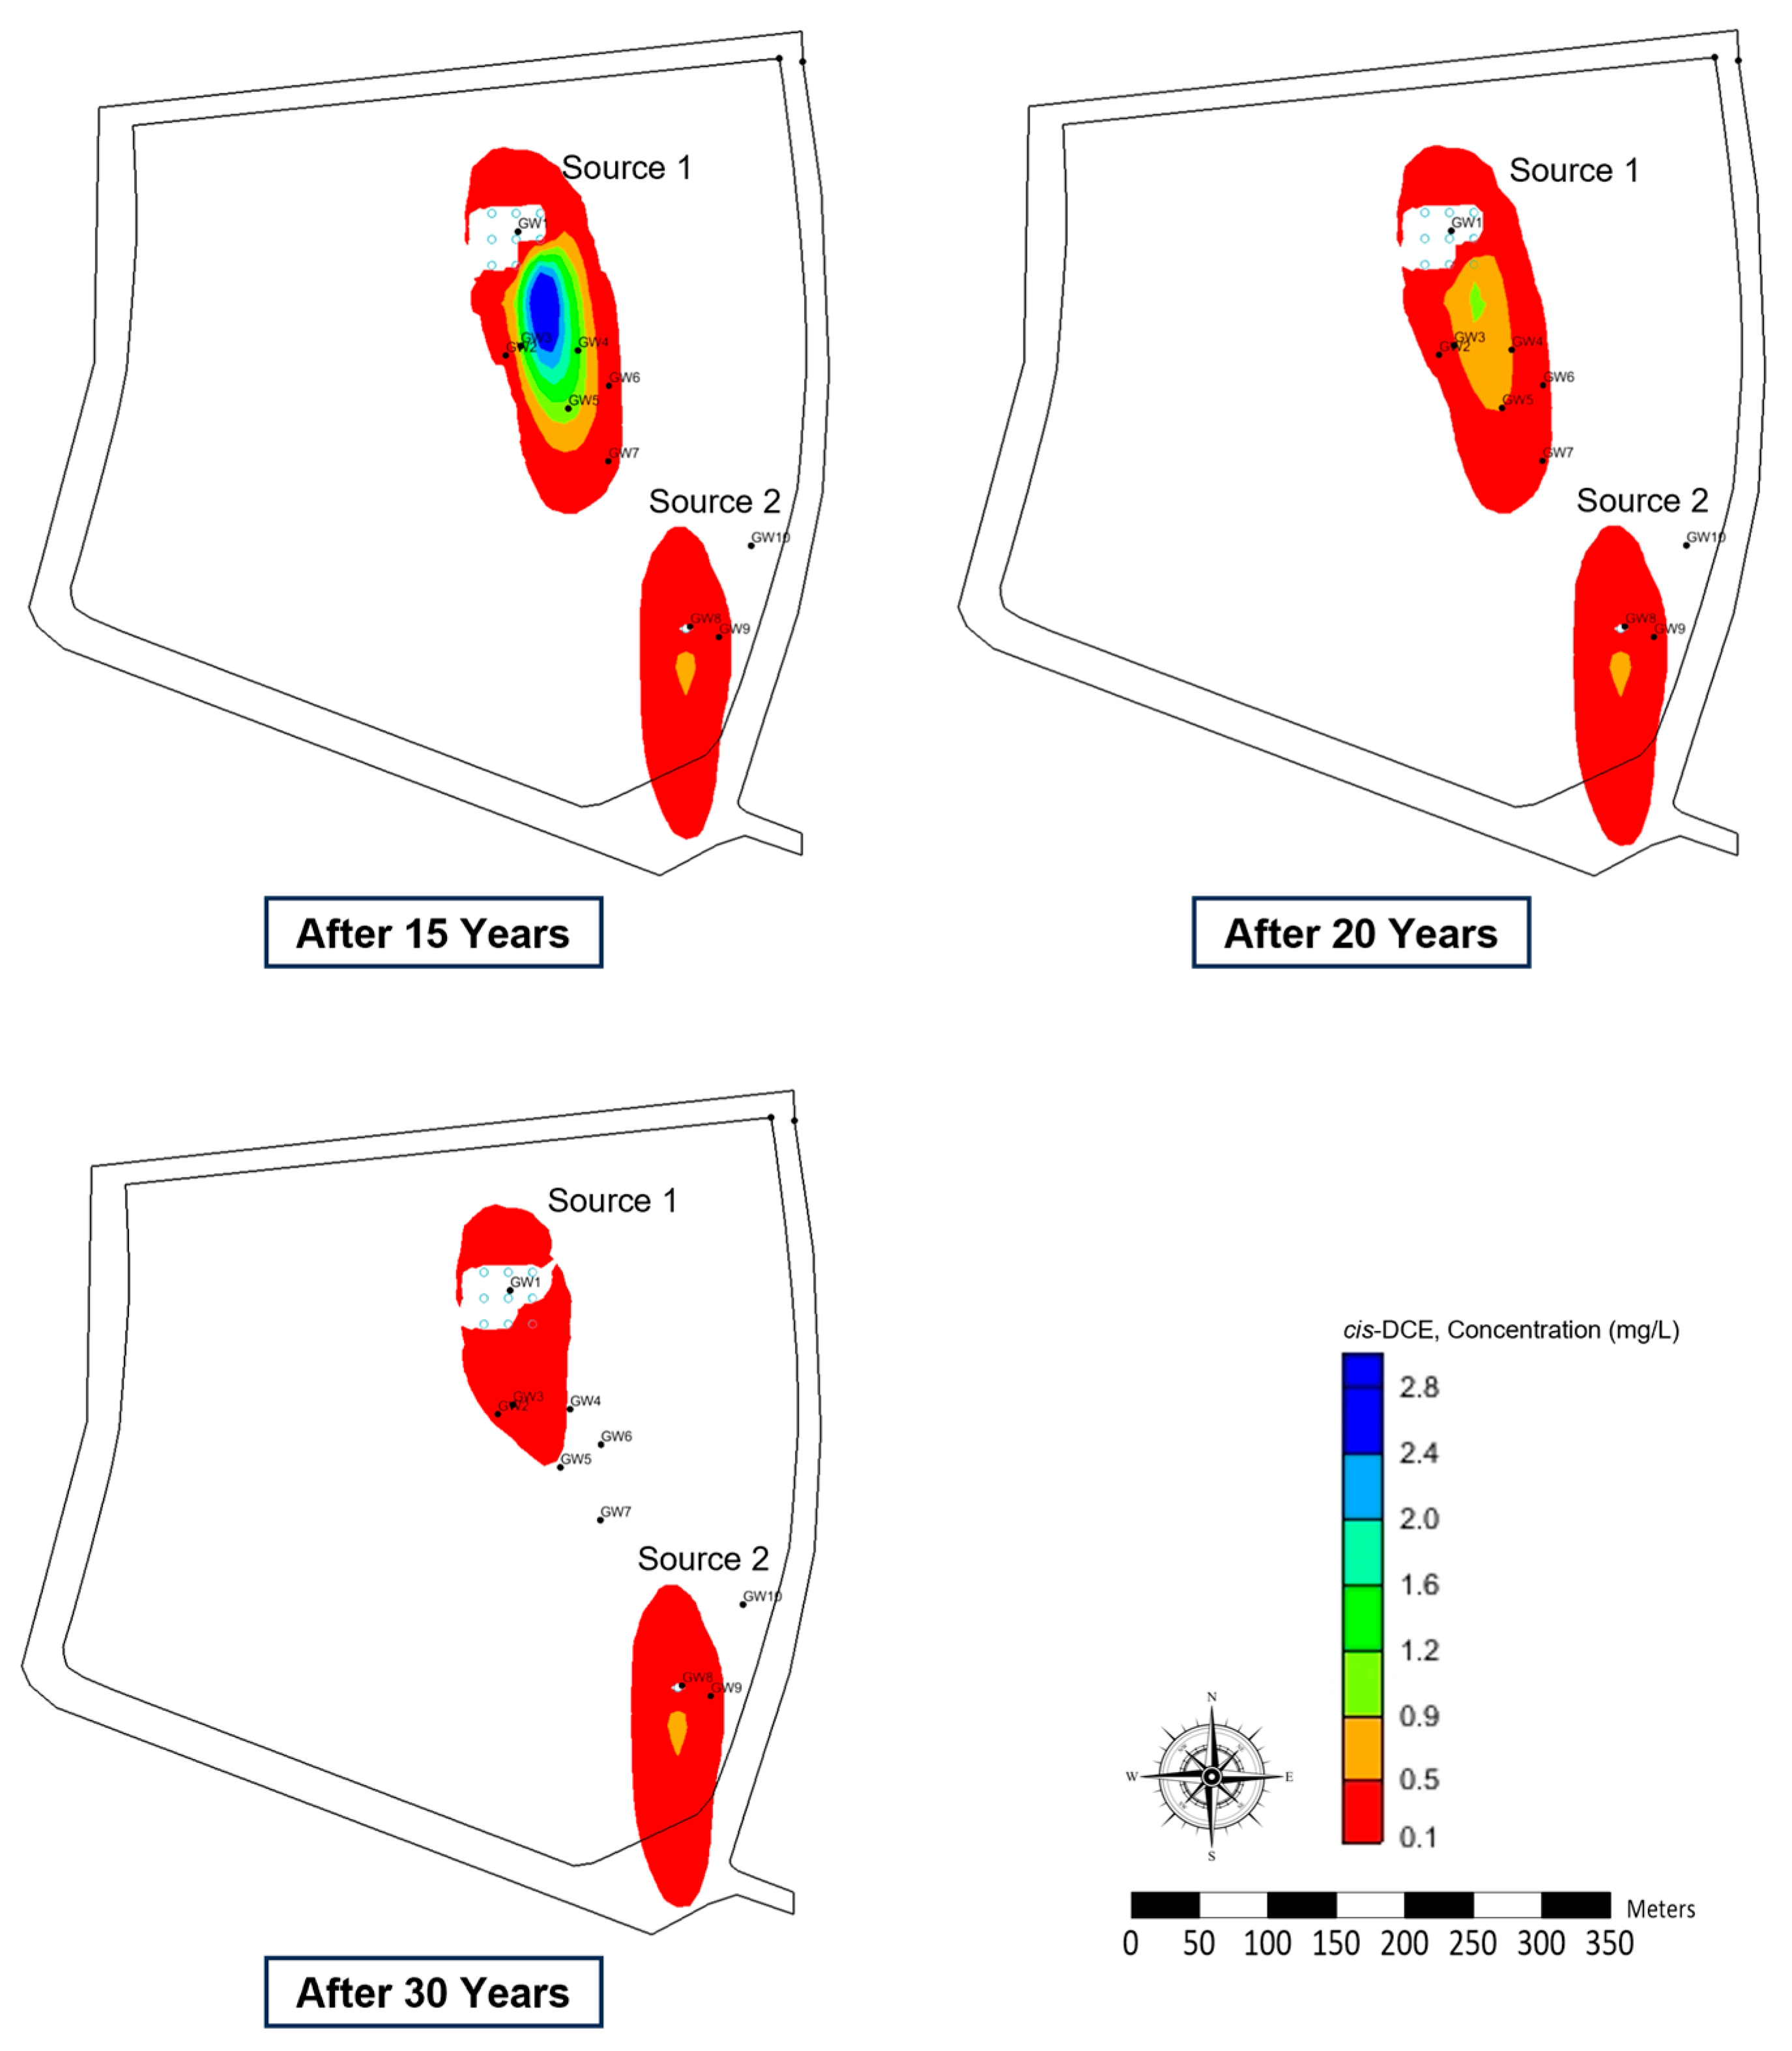
In the simulation, there are two source zones of TCE that contribute to the contamination. The source and sink section of the model was characterized by a constant concentration of TCE, which was initially set to 2 mg/L at source 1 and 4 mg/L at source 2, corresponding to the expected concentration at both source zones. It should be noted that TCE concentrations in observation wells at both source zones have been monitored intermittently, with observed values varying over time and ranging from approximately 0.3 to 3.4 mg/L. Unfortunately, the available temporal concentration data were not sufficiently detailed to support the development of a time-varying source concentration profile for the transport simulation. As a result, we adopted a simplified approach in the RT3D model by applying constant source concentrations of 2 mg/L and 4 mg/L for Source #1 and Source #2, respectively. This assumption may lead to an underestimation or overestimation of the mass flux from the source zones at certain times, and we have noted this as a limitation of the current modeling approach.
The simulation targeted numerous results for a 10,950-day (30-year) period, but this simulation period is sufficient to observe the significant degradation process and dispersion of TCE under natural groundwater conditions. The Generalized Gear solver in the chemical reaction package effectively solves the kinetic reactions that govern the biodegradation of TCE and DCE, and it is widely used to simulate the decay of organic contaminants in groundwater modeling.
After the model configurations were completed, the RT3D package was executed to simulate the transport and degradation of TCE over the 30-year timeframe. The simulation depicted advection, dispersion, and biodegradation, providing a comprehensive overview of the contaminant’s behavior in the aquifer under natural conditions.
2.8. Assessment of the Natural Attenuation of the Site
Historical contaminant trends, microbial analysis, and geochemical indicators will be used to assess the degree of natural attenuation at the study site. When the contaminant concentrations exhibit a consistent decline over multiple sampling periods due to advection, dispersion, and biodegradation, it will highlight the significance of natural attenuation. To identify the favorable conditions for natural attenuation, the presence of electron acceptors and redox indicators will also be evaluated to determine the degradation process at the study site. The microbial community analysis will be conducted through 16S rRNA sequencing to identify known dechlorinating bacteria, such as Dehalococcoides and Geobacter. Once these microorganisms are in a sufficient quantity, natural attenuation can be considered an effective long-term approach. Furthermore, the first-order decay will be calculated from BIOSCREEN using the half-lives of TCE through manual calibration. The calculated decay rate will be compared to literature data if the observed attenuation is within the expected ranges for the natural degradation process.
4. Discussion
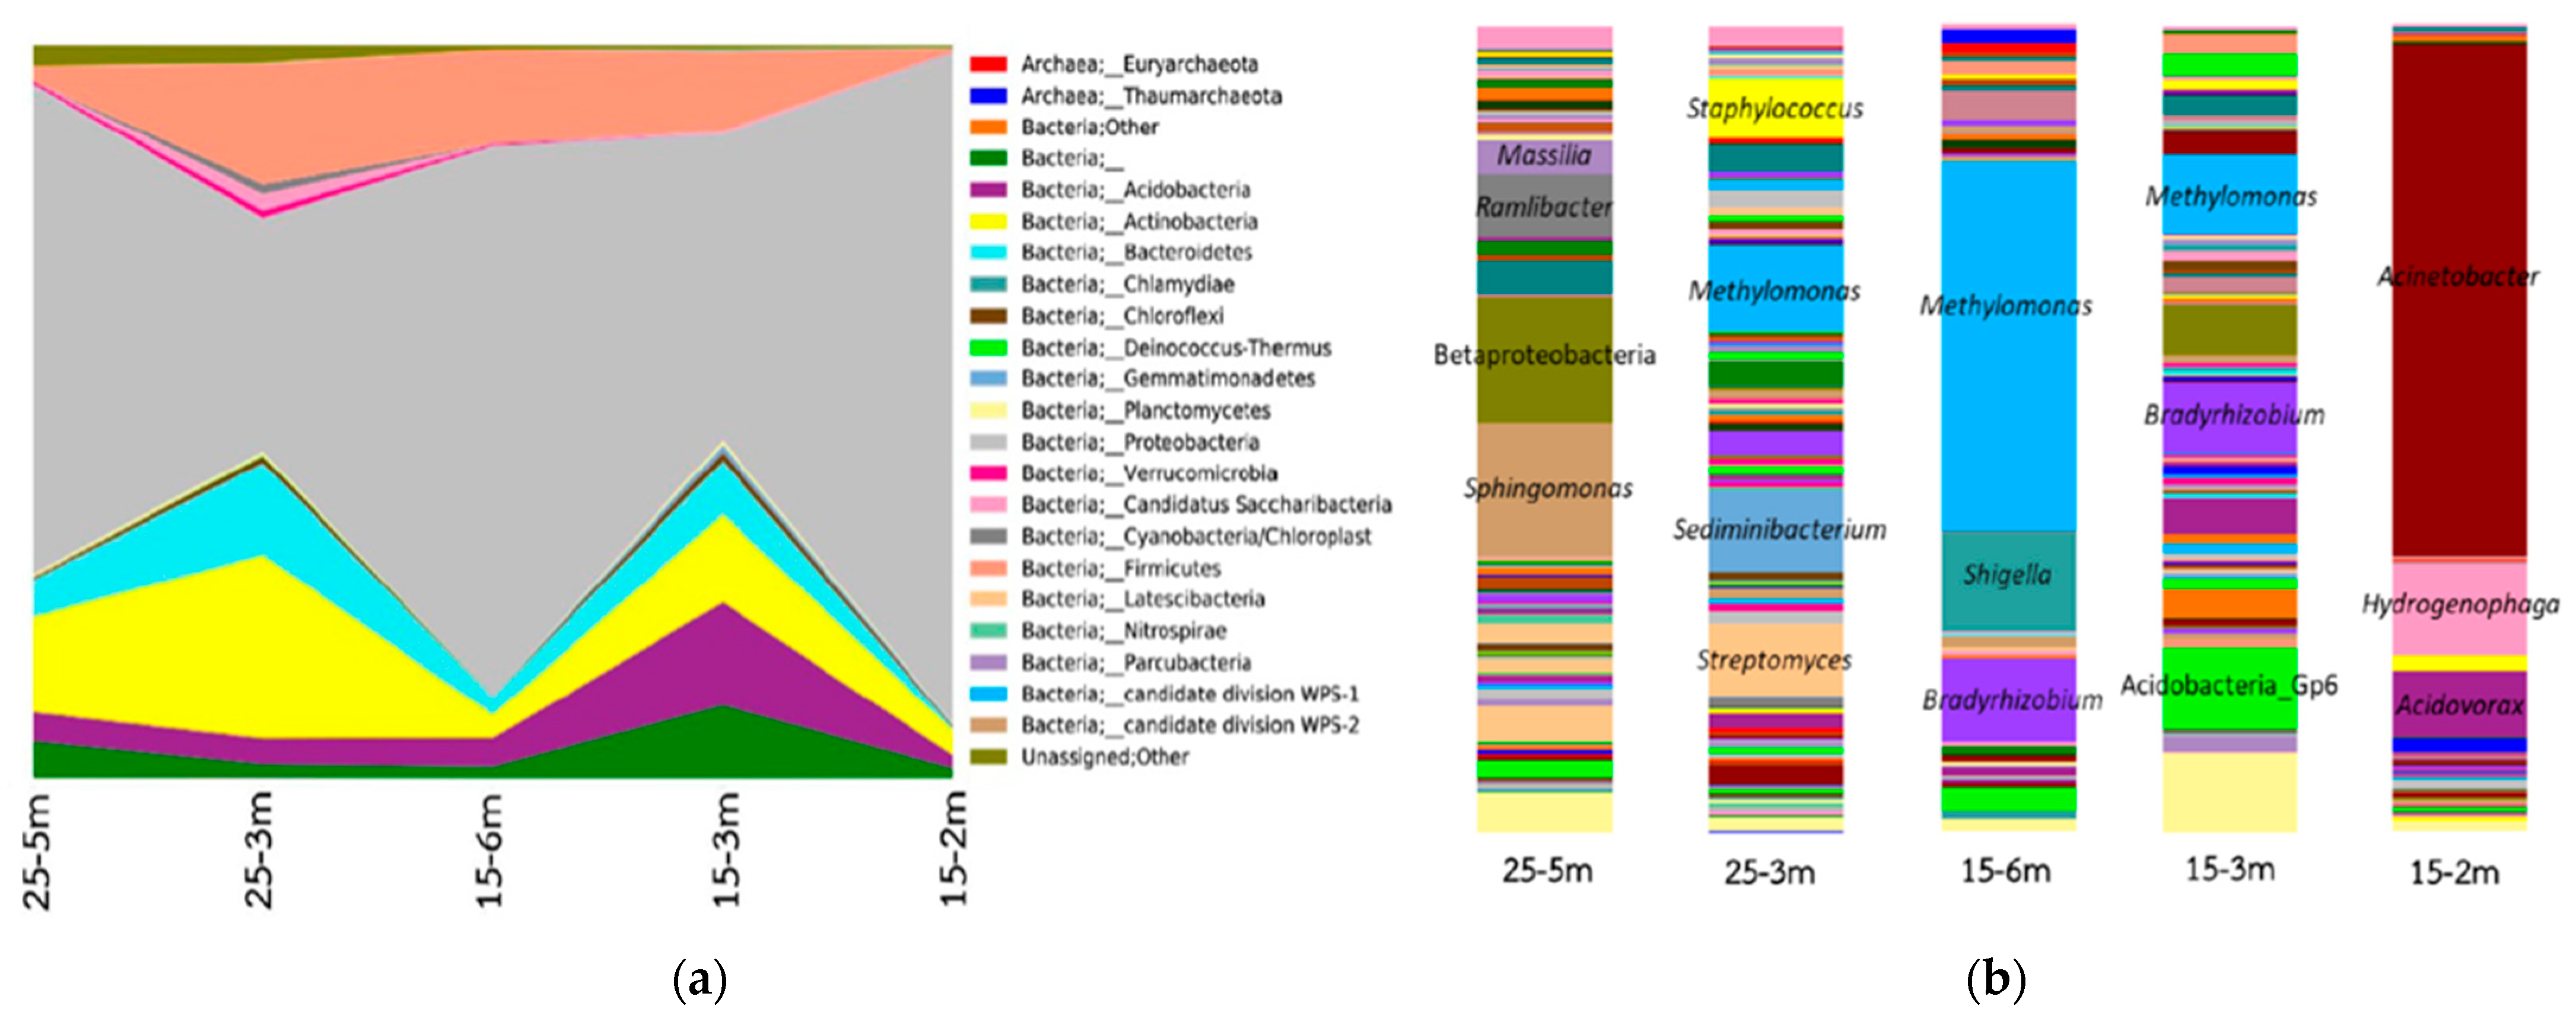
The analysis of soil properties in both of the wells (15 m and 25 m) demonstrated their significant influence on groundwater contamination dynamics and the process of natural attenuation. A slight variation in moisture content, bulk density, specific gravity, porosity, organic matter content, and total organic carbon impacted VOC mobility, adsorption, and biodegradation potential. Microbial analysis indicated that Proteobacteria were the predominant group in the industrial area, significantly contributing to the natural attenuation of VOCs. Key genera such as
Geobacter,
Burkholderia, and
Comamonas contributed to anaerobic and aerobic degradation pathways, facilitating the breakdown of TCE and
cis-DCE [
26]. The microbial community underscores the biological potential for intrinsic bioremediation, supporting the efficacy of natural attenuation processes in the shallow groundwater aquifer [
27]. The composition and functional activity of microbial communities in a shallow aquifer is highly sensitive to seasonal variations and anthropogenic activities, such as nutrient influx, agricultural runoff, or wastewater infiltration. Seasonal fluctuations in temperature, oxygen availability, and groundwater recharge can shift redox conditions, which in turn modulate the abundance and activity of key degraders. Higher groundwater recharge during wet seasons may increase oxygen levels and favor aerobic degradation pathways, while dry seasons can promote anaerobic consortia. Similarly, nutrient influx, particularly nitrate or organic carbon, may stimulate microbial growth but also induce competitive or inhibitory effects that alter VOC biodegradation efficiency. These dynamics can lead to temporal variability in attenuation rates, complicating predictions and requiring continuous monitoring to ensure model assumptions remain valid. The concentrations of groundwater key parameters indicate favorable conditions for natural attenuation, with redox conditions such as iron, manganese, and nitrate suggesting the presence of microbial processes leading to the degradation of the contaminant. The alkalinity and hardness values emphasize the buffering capacity of the aquifer, which influences metal solubility and contaminant mobility. These findings highlight the complex interplay between geochemical conditions and microbial activity, which collectively determine the effectiveness of natural attenuation in mitigating groundwater contamination.
In BIOSCREEN model simulation, TCE degradation did not occur through instantaneous reaction models that rely on electron acceptors such as oxygen, nitrate, sulfate, or observed ferrous iron and the electron acceptor did not change significantly due to the abundance of electron acceptors in the shallow aquifer. The first-order decay model improved this slower attenuation, as it accounts for continuous, steady reductions in TCE concentration over time rather than requiring instantaneous changes in geochemical conditions. The contaminant plume captures 0.092 Mm
3 of groundwater, with a flow rate of 0.00863 Mm
3/y, suggesting relatively slow groundwater movement. This low flow rate indicates that natural attenuation processes, including dilution, dispersion, and biodegradation, play a crucial role in controlling contaminant migration. The BIOSCREEN model inherently lacks the capability to capture spatial heterogeneities in hydraulic conductivity, porosity, or redox zones, which are often critical in complex field settings like the study site. Such simplifications may lead to under- or overestimation of contaminant plume dimensions, attenuation rates, and the influence of local geologic variability. In contrast, two- and three-dimensional numerical models (e.g., MODFLOW coupled with RT3D) provide a more realistic representation of flow and transport, especially in heterogeneous aquifers with multiple sources, varying boundary conditions, and stratified lithology [
28].
The groundwater flow model effectively simulates the movement of groundwater within the shallow aquifer, providing an understanding of hydraulic behavior and potential contaminant transport. The model results indicate a predominant flow direction from north to south, aligning with study site hydrogeology, and highlight variations in flow velocity across different zones. The higher hydraulic conductivity facilitates faster groundwater movement nearby the groundwater wells, which may enhance contaminant dispersion. The minor deviation occurs primarily due to the observed head values falling within a narrow range around 258 m, with only minor changes in the decimal digits. Due to the small study area, the hydraulic gradient is minimal, and the head distribution remains nearly uniform throughout all of the wells. Consequently, even minor discrepancies between measured and calculated hydraulic head values appear more noticeable, and the model accurately simulated the general groundwater flow within the study area [
29]. The accurate calibration indicates that the model can be used to predict future groundwater behavior and assess potential impacts on flow dynamics, providing a strong basis for further contaminant transport modeling.
The numerical model reveals spatial and temporal patterns of VOC natural attenuation consistent with field data. The retardation effect of adsorption was evident in the slower migration rates of hydrophobic compounds, as the plume’s leading edge progressed less rapidly than predicted by advection–dispersion alone. Furthermore, modeled biodegradation rates significantly reduced VOC concentrations, demonstrating the importance of microbial activity in attenuating contaminants over time. The integration of these processes in the model allowed the identification of zones within the aquifer where natural attenuation is most effective, such as areas with a higher organic carbon content or favorable redox conditions. This combined approach emphasizes the need to examine both physical and biological mechanisms when evaluating the potential of monitored natural attenuation as a remediation strategy.
During the simulation period, the contaminant plume has spread over time throughout the study area, with maximum concentrations observed nearby source zones. However, over time, the plume shows significant dilution and attenuation as it moves downgradient. The spatial distribution of the VOCs reveals that TCE and
cis-DCE undergo varying degrees of attenuation based on their interaction with microbial populations, particularly within the anaerobic zones where organohalide-respiring bacteria are active. The time evolution of contaminant concentrations indicates that while TCE persists longer in the study area,
cis-DCE is more readily reduced due to higher degradation rates. In some wells, the concentration from the field data shows occasional increases, which may be attributed to heterogeneous subsurface conditions, fluctuating groundwater flow patterns, or seasonal variations affecting contaminant migration. Additionally, desorption from soil particles, back-diffusion from low-permeability zones, or delayed arrival of contamination from upgradient sources can cause temporary concentration spikes [
30]. Variability in microbial activity, influencing degradation rates, and potential sampling inconsistencies could also contribute to these fluctuations. Future research should focus on enhancing the model calibration process with additional field data nearby source 2, and conducting sensitivity analysis to refine the model and enhance its predictive capabilities for groundwater management assessments.
While monitored natural attenuation (MNA) offers a passive, low-cost remediation strategy particularly well-suited for sites with stable plume conditions and evidence of active biodegradation, its effectiveness must be evaluated against alternative methods in terms of implementation complexity, timeframes, and long-term sustainability [
31]. Pump-and-treat systems, for instance, provide immediate plume containment and control, but are often energy-intensive, require long operational durations, and may require high maintenance costs, particularly in low-permeability areas [
32]. In situ chemical oxidation (ISCO) can rapidly reduce contaminant concentrations, yet it requires precise delivery control and may disrupt local microbial communities [
33]. Enhanced bioremediation, which involves injecting nutrients or electron donors to stimulate microbial activity, shows promising degradation rates in VOC-contaminated aquifers, but it requires detailed site characterization and careful dosing to avoid rebound effects or by-product accumulation. In contrast, MNA capitalizes on existing geochemical and microbial conditions, offering long-term efficacy with minimal disturbance, although its decadal timescale and dependence on favorable site conditions can limit its applicability where crucial risk reduction is required. Given the relatively low contaminant flux, microbial indication of VOC degradation, and stable hydrogeological setting at this study site, MNA appears to be a cost-effective and scientifically justifiable strategy, particularly when supplemented with long-term monitoring and contingency planning.
5. Conclusions
This work proposed to evaluate the potential of the natural attenuation process as a remediation strategy for volatile organic compounds (VOCs) in shallow groundwater aquifer at an industrial complex that has been contaminated for more than 30 years. The fate and transport of dissolved VOCs were simulated under site-specific conditions using a combination of numerical models such as MODFLOW for groundwater flow modeling, BIOSCREEN for preliminary screening of natural attenuation potential, and RT3D for reactive transport modeling.
BIOSCREEN results demonstrated that the contaminants are degrading gradually over time rather than being immediately removed, and the primary mechanism of degradation in this study was assumed to be initial-order decay. This finding is consistent with the study area’s conditions, where groundwater wells are located in a single industrial site. The BIOSCREEN analysis provided a reliable investigation of natural attenuation potential, which was further experienced using RT3D. The groundwater flow model was successfully calibrated using measured hydraulic heads, with a root mean square error (RMSE) of 0.08 m and correlation coefficient (r) of 0.81, indicating a suitable fit between simulated and measured data. The RT3D model indicates varying degrees of natural attenuation across the study area, with Source 1 showing a gradual decrease in TCE and cis-DCE concentrations, suggesting that natural attenuation processes, such as biodegradation, advection, and dispersion, are actively involved in mitigating VOCs. The plume is undergoing sequential degradation of VOCs (e.g., TCE → cis-DCE → VC → ethene), consistent with field observations. In contrast, Source 2 exhibits persistent contamination, with both TCE and DCE, likely due to limited groundwater wells and less favorable biodegradation conditions. Furthermore, data from 2017 to 2021 is missing or was not recorded, creating a gap in understanding the contamination trends throughout this time period. This data gap limits the ability to fully assess long-term natural attenuation processes and may have affected the accuracy of model predictions. This data gap restricts the ability to capture significant temporal trends in plume behavior, particularly potential changes in contaminant concentrations, redox conditions, and biodegradation rates that may have occurred during this period. Consequently, model calibration relies heavily on pre-2017 data, which may not accurately reflect the evolving site dynamics or the cumulative effects of attenuation processes. This increases the epistemic uncertainty associated with predictive simulations, particularly when extrapolating the future plume migration or estimating mass removal rates. The lack of continuous data also hinders accurate estimation of time-lagged responses to natural or anthropogenic influences such as changes in groundwater recharge, land use, or microbial adaptation. The model created discrepancies during the simulation process as it was not perfectly aligned with the field data. Models are simplifying reality, and uncertainties remain due to assumptions about the properties of the aquifer, degradation rates, and the availability of measured data. Future research could focus on incorporating more detailed geochemical data, examining the impact of aquifer heterogeneity, and conducting microbial studies to better recognize the role of bacteria in degrading VOCs.
This study has significant implications for the field of hydrogeology and environmental science as it demonstrates the value of integrating multiple numerical modeling tools such as BIOSCREEN, MODFLOW, and RT3D, to evaluate the natural attenuation process in a real-world scenario. Moreover, it provides a practical framework for evaluating natural attenuation as a remediation strategy at industrial sites contaminated with VOCs, highlighting the importance of site-specific data and calibration. This work also contributes to the growing body of evidence supporting natural attenuation as a sustainable and effective remediation strategy, particularly in cases where microbial activity and favorable hydrogeological conditions are present.
The natural attenuation process can take decades to effectively remediate a contaminated area. The industrial site has discovered bacteria that can degrade VOCs in shallow aquifers, and the enhanced bioremediation process can be implemented in the future to improve the remediation process. In Source 2, maintenance is required to ensure the process of bioremediation and potential changes in the concentration of contaminants or plume behavior. This could involve removing or treating the contaminated soil and groundwater in areas with high concentrations. Additionally, long-term monitoring is recommended to ensure that contaminant concentrations remain below regulatory thresholds and to detect any changes in groundwater conditions. The industrial site can effectively manage groundwater contamination by implanting these recommendations to reduce the environmental and human health risks.


 ,
, 


