Abstract
Effluents from wastewater treatment plants (WWTPs) represent a potential pollution risk to surface waters. Moreover, the growing practice of using treated wastewater for irrigation has recently received increased attention in terms of its suitability, raising concerns about its impact on soil health, agricultural productivity, and human well-being. The aim of this study is to apply a comprehensive approach to assess the impact of wastewater from a Romanian WWTP on surface water quality and its suitability for irrigation practices. For this purpose, a set of physico-chemical parameters were analyzed, and a Water Quality Index (WQI) was developed based on Principal Component Analysis (PCA). The irrigation suitability of the effluent was further assessed using key parameters (electrical conductivity—EC; total dissolved solids—TDSs; turbidity; Biochemical Oxygen Demand—BOD5) and specific irrigation indices (Sodium Adsorption Ratio—SAR; Permeability Index—PI; Residual Sodium Carbonate—RSC; Sodium percentage—%Na; Kelly’s ratio—KR). The results for the surface water quality indicated high contents of Na+ (10.2–42.5 mg/L), Cl− (11.9–48.4 mg/L), and SO42− (10.7–68.5 mg/L) downstream of the wastewater discharge point. The WQI, which reflects overall water quality for environmental health, showed excellent water quality, with a mean of 34 upstream and 47 downstream, suggesting the potential impact of treated wastewater discharge downstream. However, the irrigation indices revealed elevated sodium levels in the effluent, with %Na (up to 86%) categorizing 70% of the samples as unsuitable, while KR (up to 6.2) classified all samples as unsuitable. These findings suggest that despite a low impact on the river water, elevated sodium levels in effluent may limit suitability for irrigation, highlighting the importance of monitoring effluent water reuse.
1. Introduction
The problem of freshwater deficiency has become a critical global concern, especially within the context of economic expansion and population growth. Rapid urbanization limits the amount of water available per capita and weakens the local water supply, leading to more vulnerable urban communities. As the global population continues to grow, water demand is also rising due to several factors, such as household needs and expanding agricultural practices. This results in larger volumes of wastewater that need to be treated before being discharged into water bodies, as well as in increased water consumption by crops and livestock. Besides the high amount of water that is used in the agricultural sector (around 70% of freshwater withdrawals), another concern is the increasing use of pesticides and fertilizers, affecting water quality [1,2,3]. In this context, it can be stated that rapid urban development and population growth impact water resources in terms of quantity and quality. This highlights the necessity of effective water resource management. This involves comprehensive approaches, addressing aspects related to the efficiency of water usage, pollution prevention strategies, or water reuse solutions.
Moreover, the effluents discharged from wastewater treatment plants (WWTPs) can be a significant contributor to water body pollution, thereby influencing their overall quality [4]. The primary objective of WWTPs is to eliminate water contaminants through physical, biological, and chemical processes, ensuring that the discharged effluent meets stringent standards before entering surface waters, thereby preserving quality. However, ensuring consistent compliance with legal limits is often challenging for WWTPs, due to several factors such as the high volumes of wastewater that need to be treated, the quantitative and qualitative fluctuations of the effluent, severe contamination events, or outdated technologies [5,6]. Therefore, wastewater monitoring is an important task that must be carried out through the systematic assessment of various water parameters to evaluate the quality of the wastewater and to assess its potential impact on surface waters. At European level, the discharge conditions of the effluents are regulated by Directive 91/271/EEC concerning urban wastewater treatment, specifying the associated quality standards [7,8]. This Directive was transposed in Romania by the HG 188/2002 [9], approving certain norms for the discharge of wastewater into the aquatic environment: NTPA-011, NTPA-001, and NTPA-002 [10,11,12].
An alternative method that can be efficient in reducing the pressure on water resources is the reuse of treated water. Recognizing wastewater as a resource can have environmental, economic, and social benefits. The reuse of water is mentioned as a potential solution in the Water Framework Directive (2000/60/EC), with the objective of promoting sustainable water management strategies. However, the lack of harmonization among European states regarding standards and regulations for water reuse still represents a challenge [3,13,14]. To address this issue, Regulation (EU) 2020/741 was established on the minimum requirements for water reuse to provide guidelines for the safe and controlled use of reclaimed water, particularly for agricultural irrigation [15]. This regulation aims to facilitate the consistent implementation of water reuse practices across European member states, thereby promoting sustainable water management and enhancing water resource resilience [16]. In Romania, Emergency Ordinance no. 52/2023 amended water legislation, specifying that properly treated wastewater can be used in accordance with the requirements of Regulation (EU) 2020/74 [17], which the government committed to transpose at the national level in the foreseeable future.
In this context, wastewater quality and its impact on surface water and irrigation practices have been widely investigated in order to determine the pollution level in different areas, allowing researchers to identify the main pollutants and the actions and measures that can be taken, and also implement strategies of pollution control and resource recovery [5,18]. One of the most common methods used to assess water quality is the Water Quality Index (WQI), initially developed by Horton with the aim of simplifying the assessment process and enabling easy comparison between different water bodies by deriving a single composite value that indicates the overall water quality [19]. WQI is a comprehensive method that integrates multiple parameters, each of them contributing to the overall index, based on its significance in determining water quality. The contribution of each parameter is typically weighted based on its relative significance, considering factors such as regulatory standards, ecological sensitivity, and human health considerations [20,21]. Recently, more studies are employing statistical methods, such as Principal Component Analysis (PCA), in the weight assignment process [22,23,24,25,26,27]. Moreover, new approaches have integrated WQI with Geographic Information System (GIS) tools and remote sensing data for water quality monitoring [28,29].
The WQI was developed over time and applied for different purposes. One of these purposes was to determine the water suitability for irrigation, and therefore several Irrigation Water Quality Indices (IWQIs) were developed [30]. These indices are based on parameters that can influence crop health, soil fertility, or overall productivity [31,32]. Salem et al. (2023) [33] applied IWQIs to assess the groundwater quality for agricultural use, while Gad et al. (2023) [34] integrated IWQIs with artificial neural network (ANNs), partial least square regression (PLSR) models, and GIS tools to evaluate the suitability of surface water quality for irrigation. In another study, Elsayed et al. (2020) [35] applied multivariable statistical regression methods along with IWQIs for assessing surface water quality. Moreover, due to the widespread concerns regarding the fact that using treated wastewater for irrigation can contaminate food, more studies focus on determining the suitability of treated wastewater for irrigation [14]. Studies have increasingly investigated the potential impact of irrigating with treated wastewater on soil health [2,36], the health and economic impact of this practice [36], and the best strategies for optimizing wastewater reuse in agriculture [37]. However, there is limited research that comprehensively assesses the variation in water quality parameters and the impact of wastewater on surface water quality while also assessing its suitability for irrigation, providing a more holistic understanding of wastewater’s influence on both surface water quality and agricultural reuse potential. Moreover, the absence of a universally accepted, standardized methodology or set of parameters for evaluating the quality of treated wastewater for irrigation represents a challenge that must be addressed in order to develop a common framework across different regions.
Therefore, the purpose of this study is to investigate the impact of wastewater discharge on surface water bodies and to determine if the treated wastewater is appropriate for use in agricultural irrigation. In this context the specific objectives of this study were as follows:
- (i)
- To assess surface water quality based on Water Quality Index (WQI) using PCA.
- (ii)
- To assess the effectiveness of wastewater treatment processes at a designated wastewater treatment plant (WWTP). This involves assessing how well the treatment processes remove contaminants and pollutants from wastewater before it is discharged into the environment.
- (iii)
- To evaluate suitability for irrigation using a set of physico-chemical parameters—electrical conductivity (EC), total dissolved solids (TDSs), turbidity, and Biochemical Oxygen Demand (BOD5); and specific irrigation indices—Sodium Adsorption Ratio (SAR), Permeability Index (PI), Residual Sodium Carbonate (RSC), Sodium Percentage (%Na), and Kelly’s ratio (KR).
2. Materials and Methods
2.1. Case Study and Methodological Framework
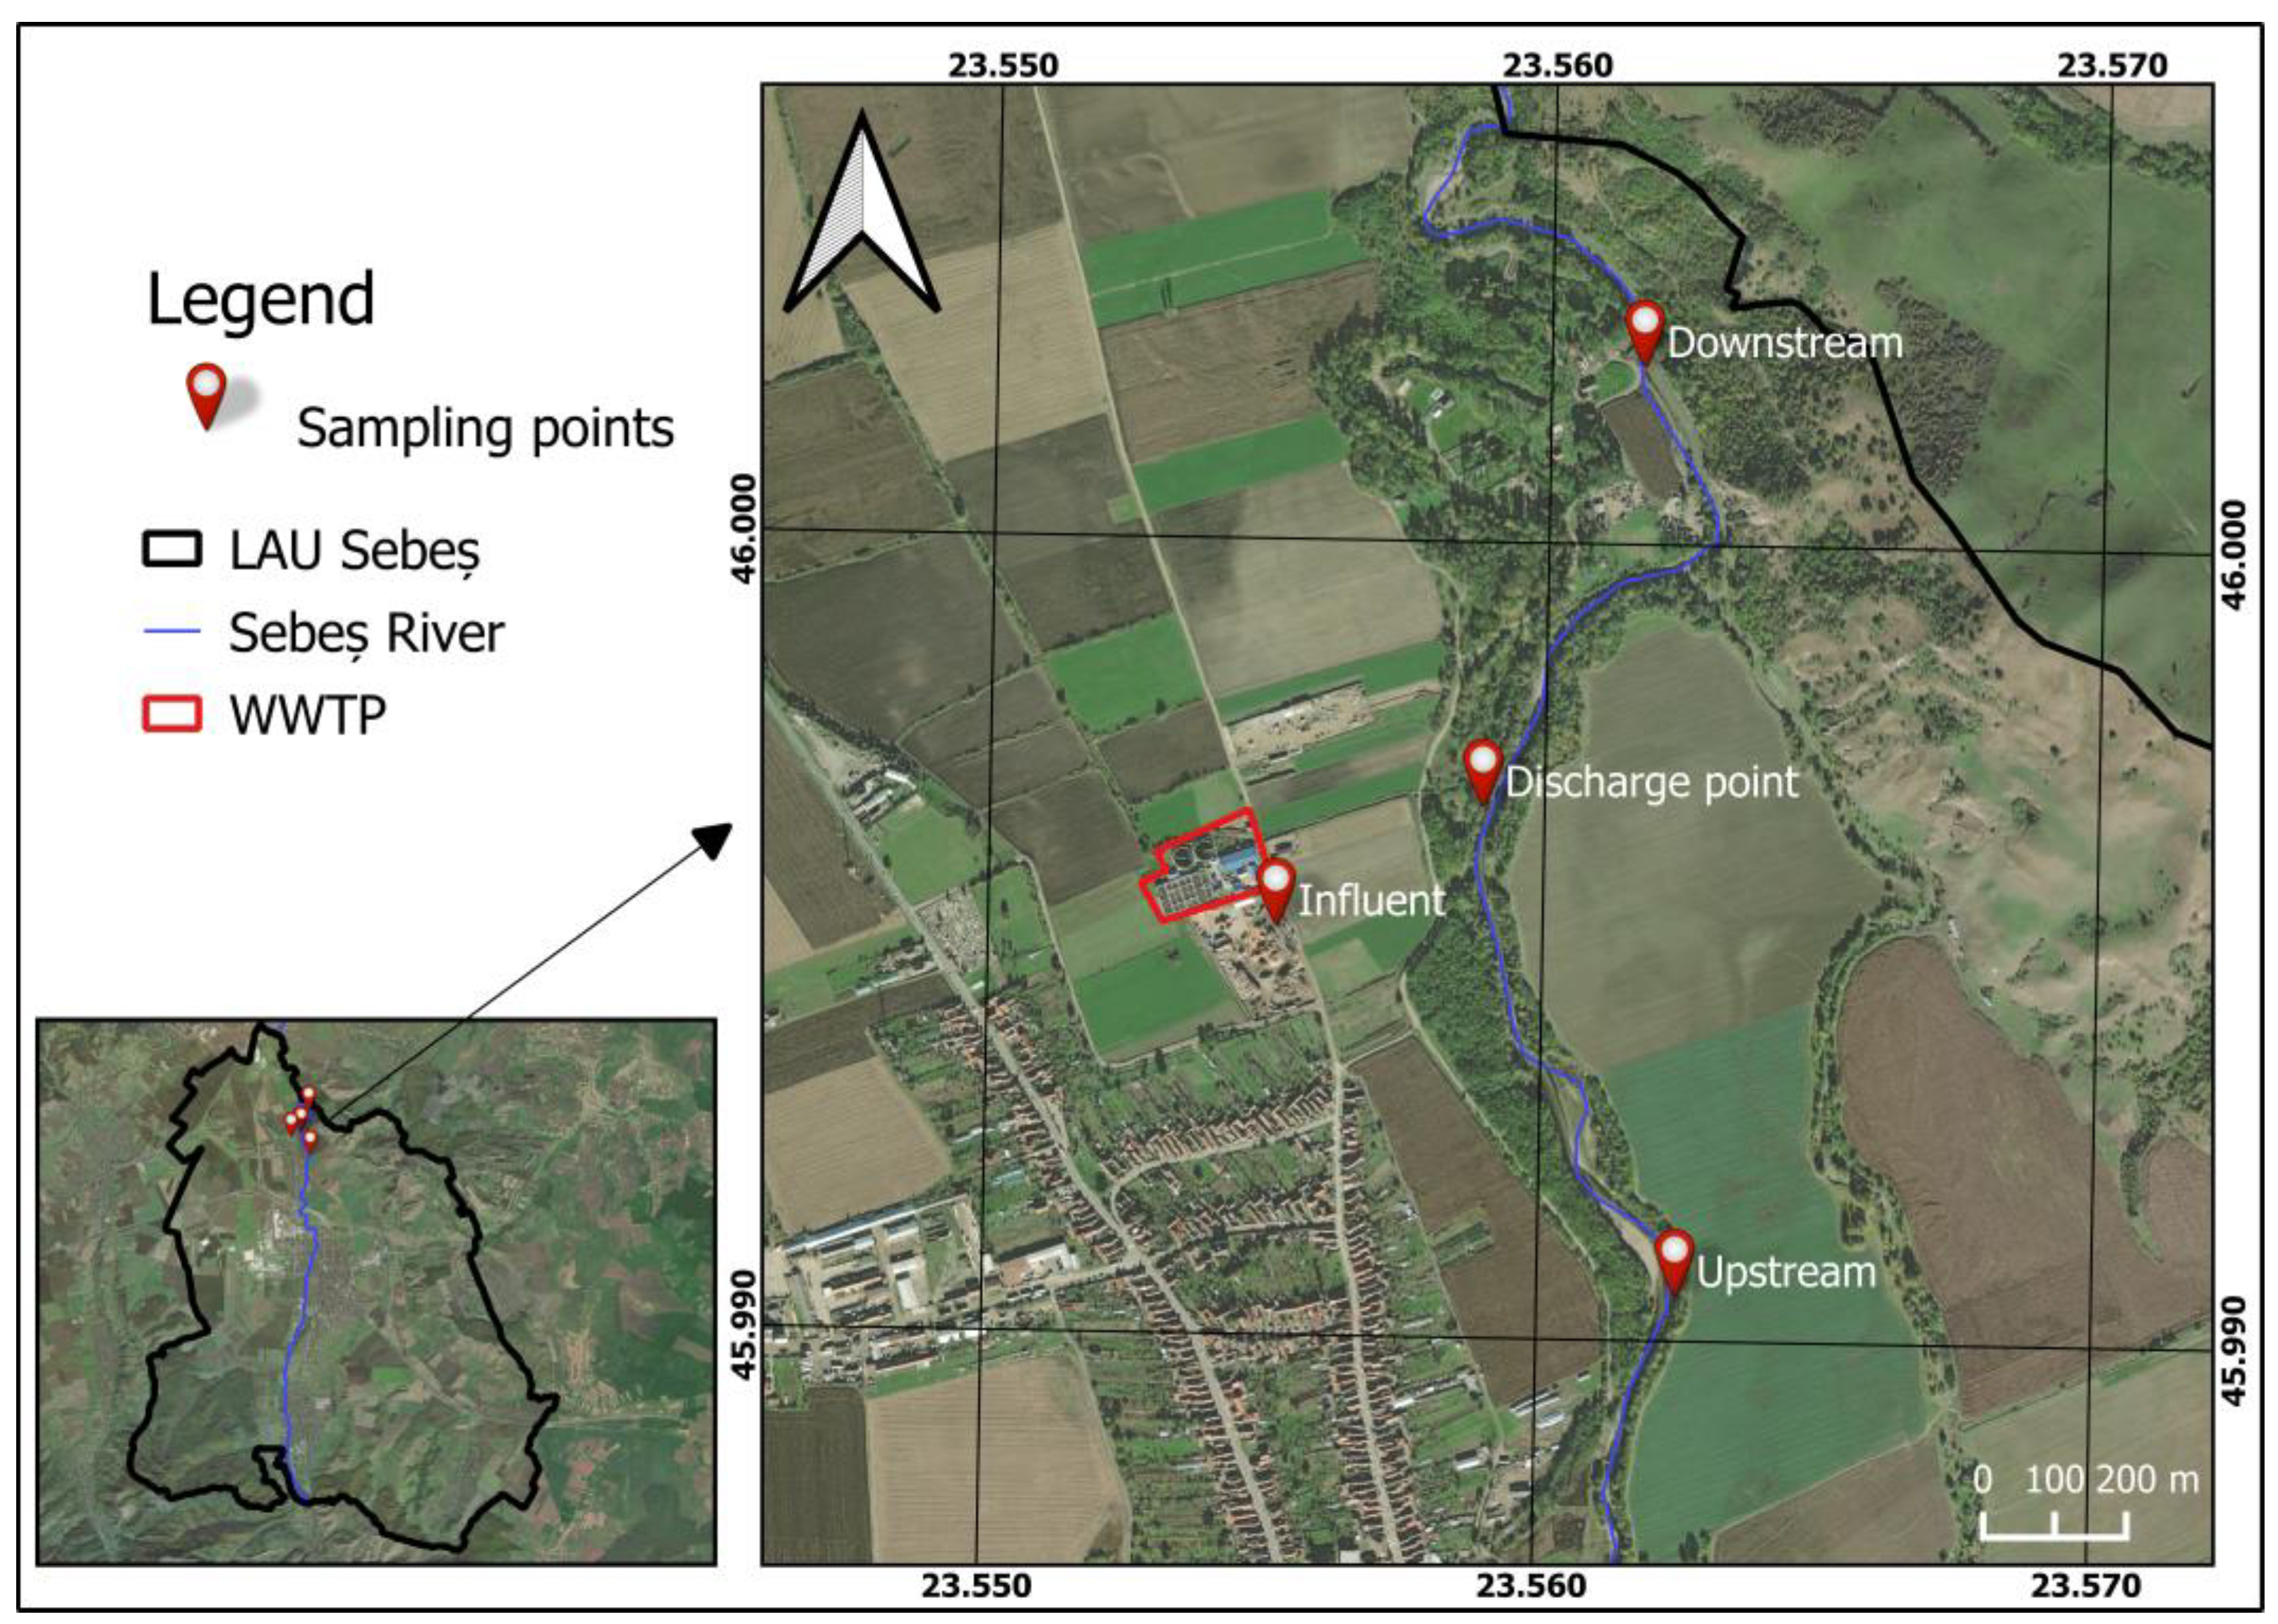
The WWTP taken into consideration in this study is located in Sebeș municipality, Alba County, Romania (Figure 1). It is situated along the Sebeș River, near the confluence point with the Mureș River. The municipality of Sebeș has a population of 26,490 people, according to the 2022 census. The plant serves 4 localities, including Sebeș, with an equivalent population of 36,000 people [38,39]. The WWTP in Sebeș municipality was selected due to the region’s significant agricultural and industrial activities, which make water quality and reuse particularly relevant. About 60% of the Sebeș municipality is covered by agricultural terrain, the types being arable land, pastures, meadows, and vineyards and vine nurseries—indicating potential demand for alternative water sources such as treated wastewater. Regarding the industrial activities in the Sebeș municipality, the manufacturing sector is the most significant, contributing 88% to the city’s total turnover, with areas dedicated to furniture manufacturing, paper and cardboard production, and metal construction fabrication. According to Sebeș Municipality Integrated Urban Development Strategy 2021–2030—SIDU [40], the potential causes of negative impacts on water quality in the area are linked to water overuse (water stress), the low rate of the population connected to wastewater collection and treatment systems, the inadequate operation of existing wastewater treatment plants, urban area development, and insufficient protection of water resources [40]. These factors highlight the importance of assessing water quality in the area and the potential reuse of the treated wastewater in agriculture.
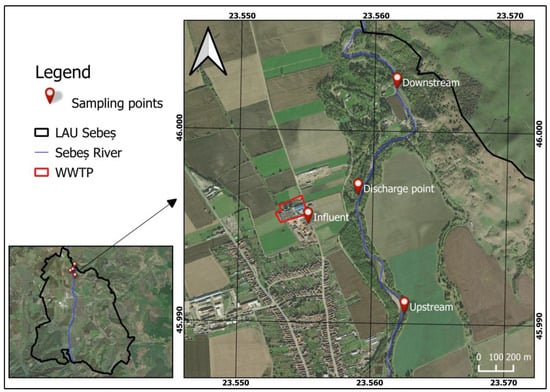
Figure 1.
Location of wastewater treatment plant and sampling points (LAU—Local Administrative Unit; WWTP—wastewater treatment plant).
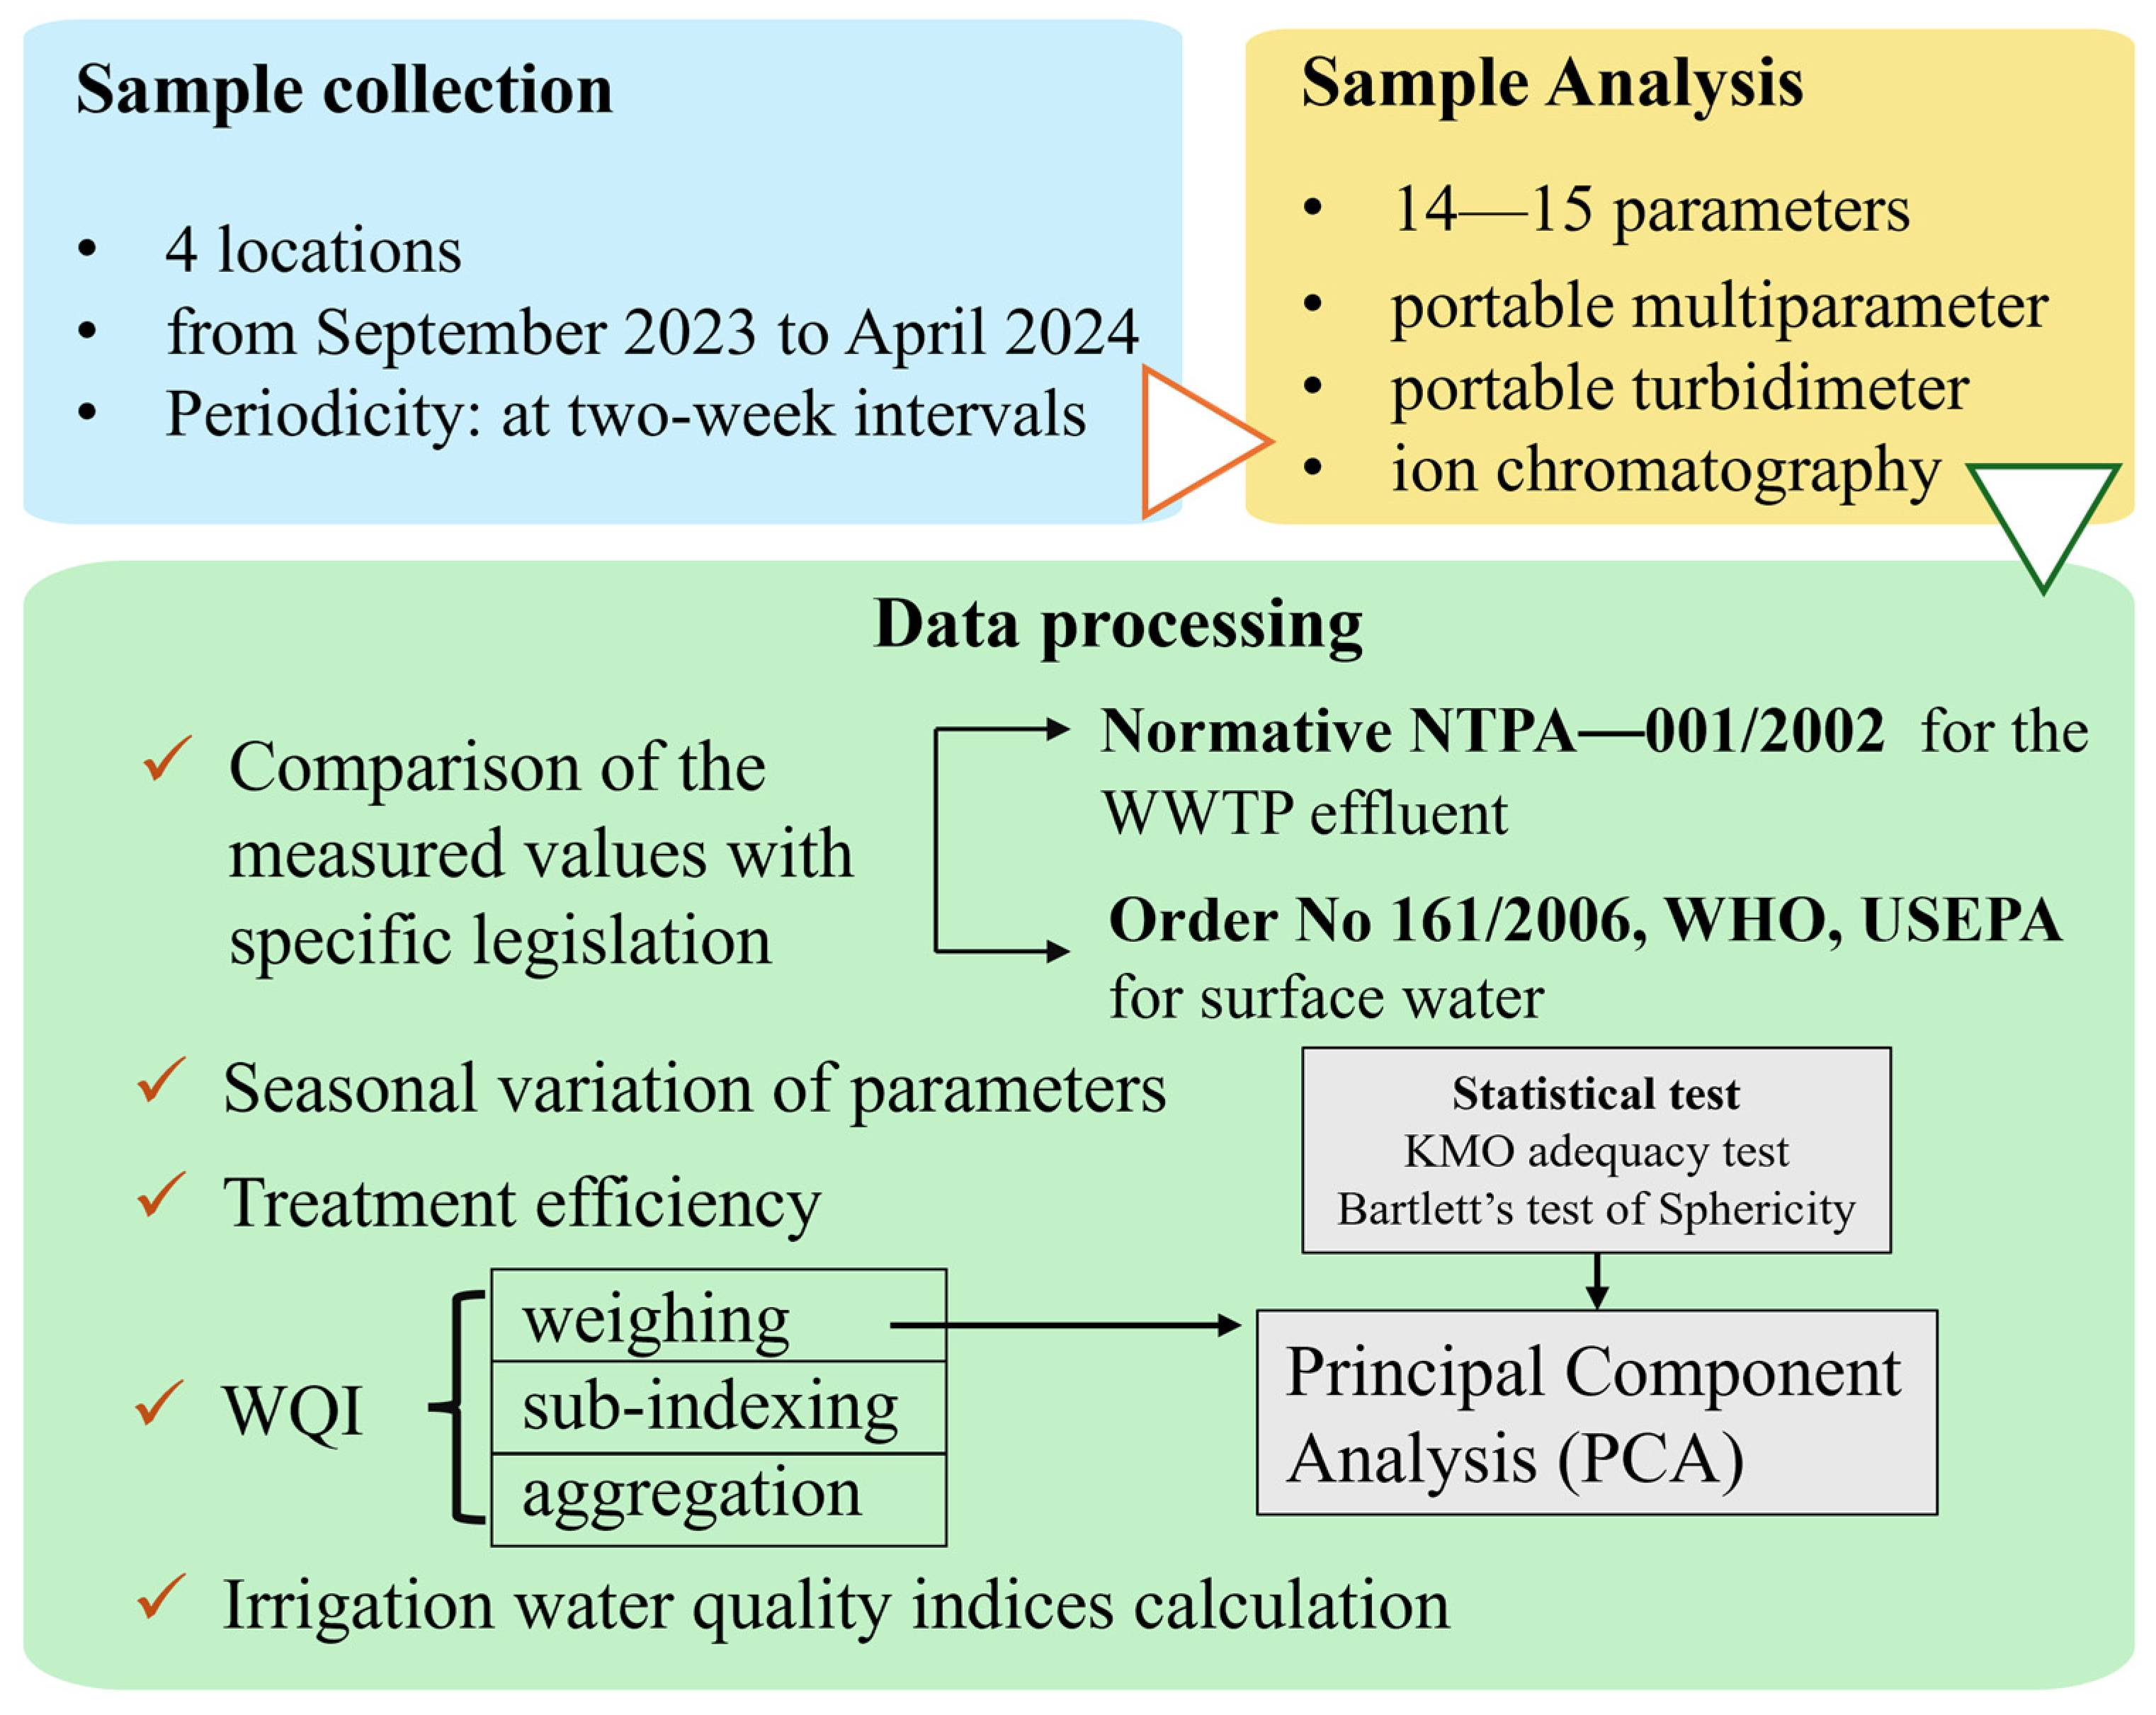
The methodological framework is presented in Figure 2, which outlines the following steps: sample collection, analysis of samples in the laboratory, and data processing. Water samples were collected upstream and downstream of the WWTP discharge point to assess river water quality before and after effluent input. Seasonal variation analysis was performed for the surface water parameters, and a WQI was calculated based on PCA for both upstream and downstream locations. Additional samples were collected from the WWTP influent and effluent to evaluate treatment efficiency and to evaluate the effluent’s suitability for irrigation purposes. Surface water analysis encompassed pH, EC, TDS, turbidity, alkalinity, and ions including Na+, K+, Mg2+, Ca2+, Cl−, SO42−, HCO3−, NO3−, and PO43−. For the WWTP influent and effluent, these parameters were assessed alongside BOD5. Monitoring BOD5 in the influent and effluent of the WWTP provides insight into the treatment plant’s efficiency in reducing organic load. Additionally, BOD5 is a regulated parameter under relevant water reuse guidelines, making it essential for evaluating effluent suitability for irrigation purposes.
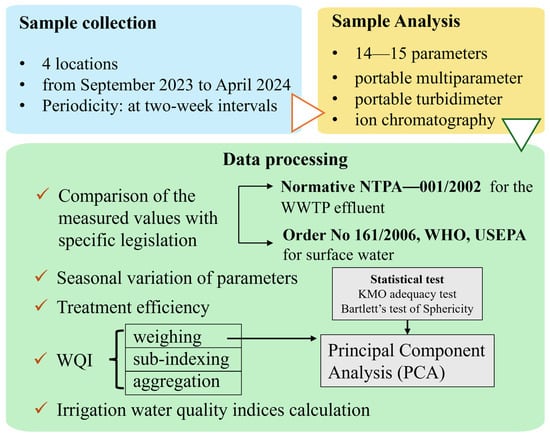
Figure 2.
Methodological framework.
2.2. Sample Collection and Laboratory Analysis
For this study, 68 water samples were collected from September 2023 to April 2024. Sample collection and processing were carried out according to the recommendations established by the standards ISO 5667-1:2023 [41], ISO 5667-3:2024 [42], and ISO 5667-6:2014 [43]. Sampling was conducted at two-week intervals, from four different locations, as follows: we took one sample from the influent and one sample from the effluent of the Sebeș WWTP, and we also took two samples from the Sebeș River, with one taken upstream of the treatment plant’s discharge pipe and one downstream thereof. All water samples were collected at a water depth of approximately 10–20 cm from the surface. In order to achieve good representation of the indicator’s spatial variability, the sampling location was selected approximately 1 km upstream from the treatment plant’s discharging point to avoid the potential impact of contaminant dispersion in its vicinity. A distance higher than 1 km was not selected due to site proximity to the city, thus avoiding the impact from other possible anthropogenic sources of contamination. The downstream sampling point was set to a distance of about 1 km in order to assure the homogenization of the river water with the effluent from the Sebeș WWTP.
The samples were collected in 500 mL polyethylene bottles. The polyethylene bottles were labeled with the following codes: I (influent), E (effluent), AM (upstream), and AV (downstream). Before sample collection, the bottles were thoroughly rinsed with the water that was sampled. Physico-chemical parameters, including pH, electrical conductivity (EC), total dissolved solids (TDS), and turbidity, were measured on site using a portable multiparameter meter (WTW 350i) and a portable turbidimeter (WTW pHotoFlex).
The concentrations of major dissolved ions (Na+, Mg2+, K+, Ca2+, Cl−, NO3−, SO42−, PO43−) were determined in a laboratory using ion chromatography (Dionex IC system 1500), within 48 h of sample collection. Qualitative analysis was performed based on the retention times of the analytes of interest in standard solutions, while the quantitative analysis was performed based on calibration curves, which were generally plotted over the concentration range of 0.1–2.5 mg/L, depending on the ion. The analytical method proved to have a good linearity, considering that the correlation coefficient R2 > 0.999. The limit of detection (LOD) and the limit of quantification (LOQ) were calculated by multiplying the standard deviation of the response (for 10 replicates of blank sample) by 3 (for LOD) and 10 (for LOQ), respectively, and then dividing by the slope of the calibration curve. The ion chromatographic method proved to have an adequate sensitivity, with low values of LOD (between 10.01 and 20.96 µg/L, depending on the ion) and LOQ (between 33.36 and 69.87 µg/L).
The concentration of HCO3−, CO32− and the water alkalinity were determined by titration with HCl (0.1 M) using phenolphthalein and methyl orange as indicators. BOD5 was determined using the dilution method, which measures the amount of dissolved oxygen consumed by microorganisms during the breakdown of organic matter in a water sample. The samples are incubated at a temperature of 20 °C, for a duration of 5 days.
2.3. Data Processing
The effluent values from WWTP were compared against the normative NTPA–001/2002 [10], which specified pollutant concentration limits for industrial and municipal wastewater discharged into natural receptors. The normative establishes the general quality requirements for all wastewater categories, prior to their evacuation in natural receptors, as well as the admissible limit values of the main quality indicators of these waters [9]. Furthermore, the surface water samples collected upstream and downstream from the effluent’s discharge point were compared to Romanian legal standards, specifically the Order No. 161/2006 [44], which establishes the norm regarding the classification of surface water quality for the purpose of determining the ecological status of water bodies. For parameters that were not regulated by Romanian legislation, the analysis relied on internationally recognized standards and recommendations. These include guidelines developed by the World Health Organization (WHO) in its 2024, 2022, and 2017 editions [45,46,47], as well as regulations established by the United States Environmental Protection Agency (USEPA) [48].
The seasonal variation in the parameters was graphically represented by calculating the arithmetic mean of the values for each parameter for 3 established seasons: autumn (September–November), winter (December–February), and spring (March–April). The seasonal variation was determined for three locations (WWTP effluent, upstream, downstream). Additionally, the flow rates obtained from the treatment plant were considered to determine whether there is correlation between flow variation and the variation in the concentrations of the analyzed parameters.
2.4. The Efficiency of the Treatment Processes
The efficiency of the treatment processes is a critical metric that reflects the ability of a treatment plant to remove contaminants from the incoming water. This efficiency is essential for assessing the effectiveness of the treatment processes and ensuring compliance with environmental standards. The parameters considered for this analysis—turbidity, BOD5, NO3−, SO42−, PO43−—are key indicators of water quality and pollutants targeted by WWTP for removal. For each parameter, the mean value was calculated for the influent and effluent, and Equation (1) was used to calculate the efficiency of the average values obtained [49].
Treatment efficiency (%) = (Influent-Effluent)/Influent × 100
2.5. Water Quality Index (WQI)
The WQI method is a widely used and comprehensive approach for the characterization of water quality in a simple way through a single numeric value. It is a simplified way to understand complex data and has practical applications in water resource management, decision-making processes, and environmental protection actions [50,51].
In the first stage, the parameters are weighted using the PCA. PCA was chosen to develop the WQI due to its ability to objectively assign weights to water quality parameters based on their statistical contribution to data variability. PCA is commonly used to both weight the parameters included in the analysis and to uncover the underlying patterns and correlations among them. Therefore, this method identifies how different parameters are interrelated and which parameters exert the most significant influence on the overall system, providing a robust framework for assessing water quality. Parameters with higher loadings on the principal components are considered more influential, and their weights reflect this importance [52,53].
In order to conduct the PCA, the values of the parameters were standardized using Z-score standardization (Equation (2)) [26]. Standard scaling ensures that each variable contributes equally to the PCA, allowing the analysis to capture underlying patterns in the data rather than being biased toward variables with larger scales. Z-score standardization is useful because it handles these variations well, ensuring each parameter is treated equally, regardless of its original scale or distribution [54].
where
Z = (x − μ)/σ
- x is the value of the data point;
- μ is the mean of the data;
- σ is the standard deviation of the data.
PCA divides the parameters into principal components, the loadings of the parameters being used in the weighting process. The loadings for each water quality parameter on a principal component represent how strongly that parameter contributes to that component. Parameters with high loadings on a component are the most significant in explaining the variance captured by that component. For a parameter to be included in one component, the value of the loading must be higher than 0.5. The number of components is decided based on the eigenvalue. The eigenvalues indicate how much of the variance in the data is explained by each component. Components with higher eigenvalues explain more variance. Usually, components with eigenvalues higher than 1 are extracted. Kaiser’s Varimax rotation was performed in order to increase the interpretability of the results. After the PCA was conducted, the weights were calculated by multiplying the relative eigenvalue with the relative factor loadings after rotation [53,54,55,56].
To conduct the PCA and visualize the data, the software R version 4.2.2 was used. R is a powerful tool used for statistical analysis, offering packages and functions that facilitate complex data exploration and visualization.
In the second stage, the parameter sub-indices are generated. A quality rating value (qi) is calculated based on standard guideline values of water quality and using Equation (3). This process enables the comparison of the concentrations of different parameters, which may have varying units and scales, on a common scale. Subsequently, the sub-indices are calculated by multiplying the weight of each parameter to its quality index value (Equation (4)) [54,57].
where qi represents the quality index value for parameter i, ci is the concentration analyzed in the laboratory for parameter i, and si is the regulated standard value for parameter i.
where SIi represents the sub-index value for parameter i and Wi represents the weight of parameter i.
qi = ci/si × 100
SIi = Wi × qi
In the third stage, the sub-indices are aggregated into a Water Quality Index (WQI) by summing the sub-indices values of all selected parameters according to Equation (5) [57,58].
2.6. Irrigation Water Quality Index (IWQI) Calculation
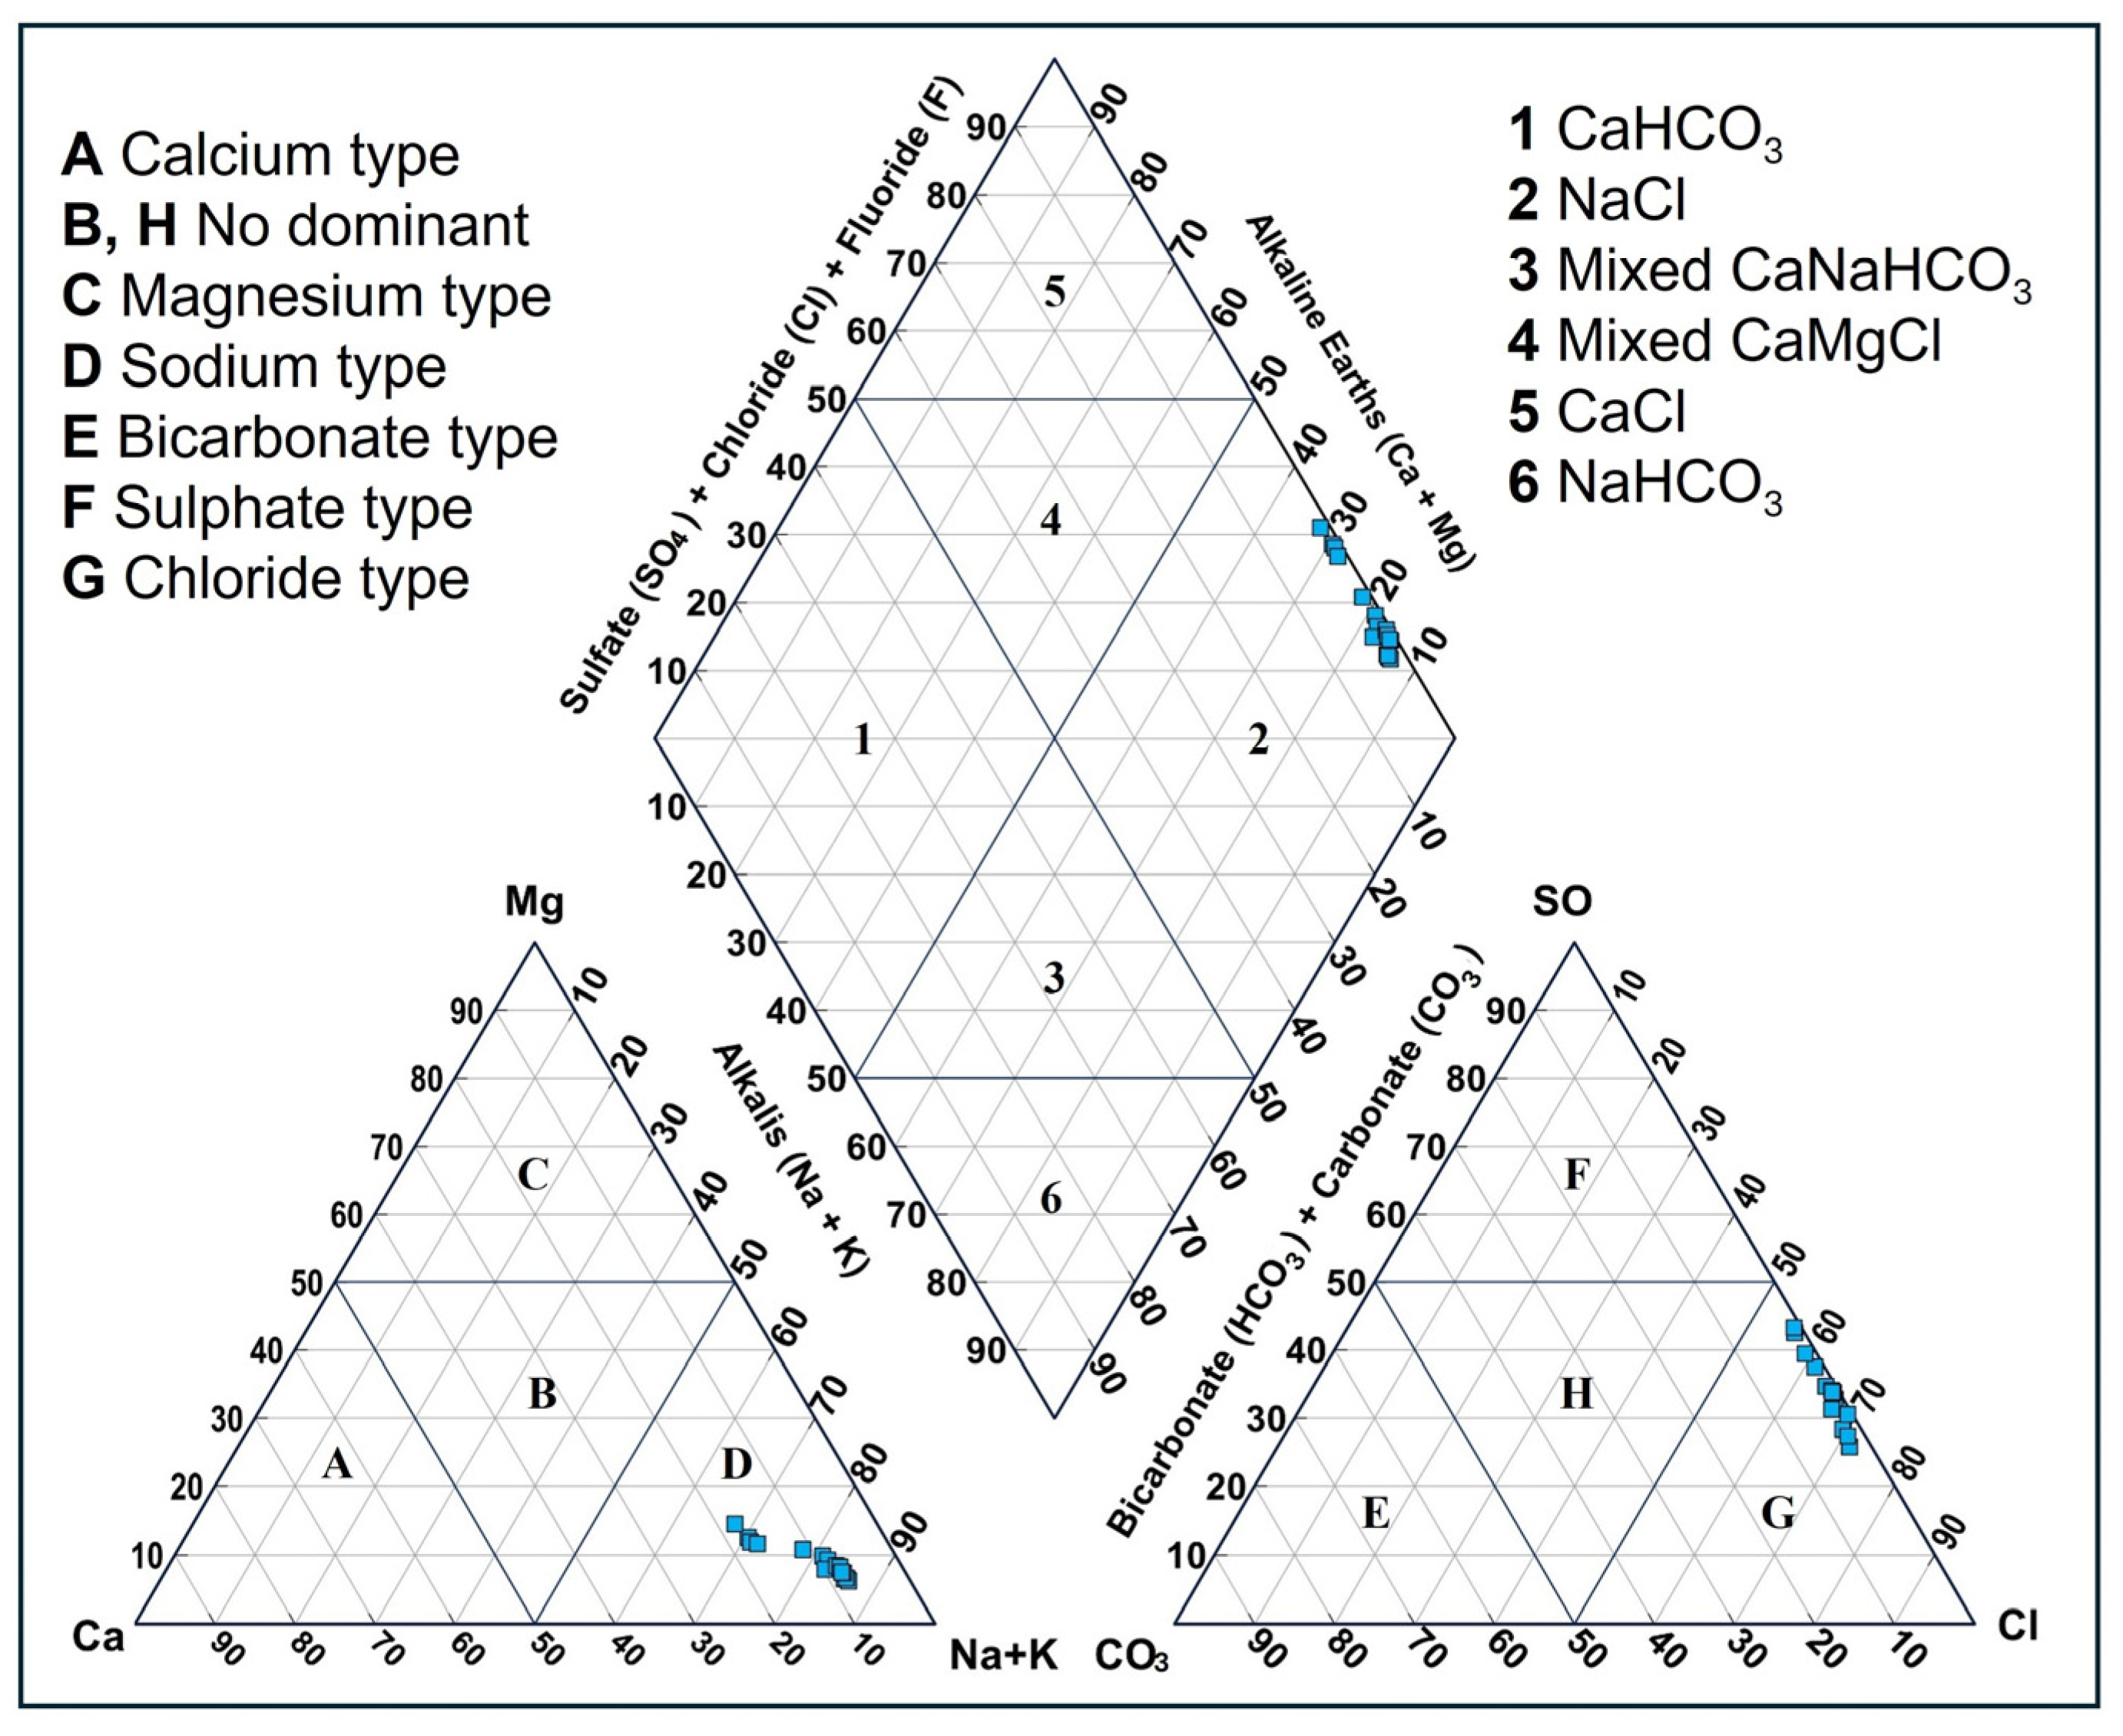
The assessment of the quality of water used for irrigation is essential to ensure its safe and efficient use in agriculture. The specific indices employed in this evaluation help determine the risk of soil salinization and sodicity, as well as the potential impact on plant health [14,31,59]. The irrigation indices are derived from concentrations of ions in the water. To understand and represent the water chemistry and ion composition in the effluent, the Piper diagram, developed by Piper (1944), was used [60]. The diagram indicates the combined distribution of both cations and anions [61].
Therefore, in this study, a series of key parameters were considered to determine the suitability of treated wastewater for irrigation use (EC, TDS, turbidity, BOD5), and specific irrigation indices were calculated (SAR, PI, RSC, %Na and KR).
Electrical conductivity (EC) indicates the concentration of dissolved ions in water and is directly proportional with the TDS. Water with high EC and TDS values indicates elevated salt levels, and therefore using such water for irrigation purposes can reduce soil permeability and water percolation over time [30].
High turbidity levels indicate the presence of suspended particles in the water [62]. Using water with high turbidity as irrigation water can impact the agricultural productivity, as high turbidity is associated with increased densities of bacteria [63,64].
BOD5 is a key parameter for evaluating water quality, representing the oxygen consumed by aerobic microorganisms to break down organic compounds in the water. A low BOD5 value signifies good water quality, while a high BOD5 value indicates poor water quality [65].
The Sodium Adsorption Ratio (SAR) indicates the proportion of sodium in relation to calcium and magnesium in irrigation water or soil solution. The SAR index is important for water resource management, particularly in determining whether a specific water resource can be used for irrigation purposes. High levels of sodium can negatively affect soil structure, reducing its permeability and aeration, which can hinder plant growth. Irrigation water with a high SAR can decrease the soil’s ability to allow water infiltration and percolation, leading to drainage issues and surface water accumulation. Therefore, appropriate management measures are necessary to prevent the deterioration of soil quality and agricultural productivity [66]. To calculate the SAR index, Equation (6) was used [67]:
where Ca2+, Mg2+, and Na+ represent the concentrations of ions in milliequivalents per liter (meq/L).
The Permeability Index (PI) is an index used to evaluate the suitability of irrigation water based on its influence on soil permeability [68]. It indicates the relationship between major cations and bicarbonate in hydrochemistry. The formula includes the major ions that have an influence on permeability [69,70]. This index helps to determine the long-term effects of irrigation water on the soil’s ability to allow the passage of water and air, which are essential for healthy plant growth [14]. The PI was calculated using the following equation [68]:
where Na+, HCO3−, Ca2+, and Mg2+ represent the concentrations of ions in milliequivalents per liter (meq/L).
The Residual Sodium Carbonate (RSC) indicates the alkalinity hazard [68]. We used Equation (8)— adapted from Eaton (1950)—to calculate the RSC in this study [71]. The carbonate concentration was excluded from the original equation on the basis that its presence was negligible compared to bicarbonate in neutral or slightly alkaline water.
The sodium percentage (%Na) is an parameter calculated in order to determine the soil permeability. High concentrations of Na+—which can be absorbed by clay minerals—can reduce the soil permeability, affecting the water infiltration in soil [69]. The %Na was calculated using Equation (9) [72]:
where Na+, K+, Ca2+, and Mg2+ are the concentration of ions in milliequivalents per liter (meq/L).
Kelly’s ratio (KR) indicates the excessive amount of sodium in water, evaluating the tendency of sodium to replace calcium and magnesium [30]. High levels of Na+ indicate that the water is unsafe for irrigation, affecting the capacity of soil to retain nutrients and having a negative impact on plant growth [22]. The KR index was calculated using Equation (10) [73].
where Na+, Ca2+, and Mg2+ are the concentration of ions in milliequivalents per liter (meq/L)
3. Results and Discussions
Regarding the surface water, the measured concentration values showed good compliance with the limits established by Order No. 161/2006 for the first water quality class, as well as with the international standards and recommendations (Table 1). However, exceptions for certain ions were noticed, specifically sodium (Na+), chloride (Cl−), nitrate (N_NO3−), sulfate (SO42−), and phosphate (P_PO43−), whose concentrations values exceeded the limits for the first quality class [44] in several water samples. These deviations may suggest some variation in the chemical composition without posing a critical threat to water quality. Most of these samples were collected from the location downstream of the wastewater discharge point, with the sampling taking place during the months of September and October. This time is significant, as it coincides with the lowest flow rates at the WWTP and relatively low-flow conditions of the receiving river. The average effluent flow from the WWTP was 332 m3/h in autumn, 388 m3/h in winter, and 443 m3/h in spring. These values indicate moderate seasonal variation, with higher effluent volumes discharged during spring. According to [74], the multiannual average flows of the Sebeș River are 8.4 m3/s in autumn, 5.4 m3/s in winter, and 13.8 m3/s in spring. Considering these data, the treated effluent accounts for less than 2% of the river’s flow, even during the low-flow period. This variation likely played a role in the water quality results, as the low flow rates would have reduced the natural dilution capacity of the river systems, allowing pollutants to accumulate more easily. In contrast, the highest flow rates were recorded during the spring months, driven by increased precipitation and snowmelt, which caused a substantial rise in river water volume. This seasonal influx of water typically allows greater dilution of contaminants, lowering their concentrations in the surface water. This observation may also account for the exceedance of the turbidity standard value set by WHO, 2024 [47], in six samples, all of which were collected during the spring season. The presence of highest concentrations downstream highlights the possibility that the treated wastewater, under conditions of lower natural water flow, may be a significant factor in the observed degradation of surface water quality.

Table 1.
Surface water statistics.
Table 1.
Surface water statistics.
| Parameters | Quality Standard | Mean (M) | Standard Deviation (SD) | Min | Max | Legal Standard |
|---|---|---|---|---|---|---|
| pH | 6.5–8.5 | 7.2 | 0.3 | 6.6 | 7.9 | Order No. 161/2006 (Quality class I) [44] |
| EC (µS/cm) | 1000 | 84.8 | 57.7 | 44.1 | 280 | WHO (2022) [46] |
| TDS (mg/L) | 500 | 54.9 | 36.2 | 29 | 181 | USEPA (2018) [48] |
| Turbidity (NTU) | 5 | 4.3 | 6.1 | 0.08 | 32.4 | WHO (2024) [47] |
| Alkalinity (mg/L) | - | 58.6 | 24.7 | 24.4 | 140.3 | - |
| Na+ (mg/L) | 25 | 15.9 | 7.8 | 7.8 | 42.5 | Order No. 161/2006 (Quality class I) [44] |
| K+ (mg/L) | 20 | 0.5 | 0.6 | 0.1 | 3.1 | WHO (2022) [46] |
| Mg2+ (mg/L) | 12 | 1.3 | 0.8 | 0.6 | 4.2 | Order No. 161/2006 (Quality class I) [44] |
| Ca2+ (mg/L) | 50 | 2.9 | 2.3 | 1.1 | 12.8 | Order No. 161/2006 (Quality class I) [44] |
| Cl− (mg/L) | 25 | 19.02 | 8.7 | 10.2 | 48.4 | Order No. 161/2006 (Quality class I) [44] |
| N_NO3− (mg/L) | 1 | 0.3 | 0.2 | 0.09 | 1.4 | Order No. 161/2006 (Quality class I) [44] |
| SO42− (mg/L) | 60 | 15.7 | 14.4 | 3.2 | 68.5 | Order No. 161/2006 (Quality class I) [44] |
| P_PO43− (mg/L) | 0.1 | 0.06 | 0.05 | 0.03 | 0.2 | Order No. 161/2006 (Quality class I) [44] |
| HCO3− (mg/L) | 120 | 1.6 | 0.3 | 0.7 | 2.5 | WHO (2017) [45] |
The concentration values from the effluent samples were compared to the limits established by the NTPA—001 regulation (Table 2) [75]. It can be observed that the measured values fall within the regulated limits.
Table 2.
Effluent statistics.
Table 2.
Effluent statistics.
| Parameters | Quality Standard | Mean (M) | Standard Deviation (SD) | Min | Max | Legal Standard |
|---|---|---|---|---|---|---|
| pH | 6.5–8.5 | 7 | 0.3 | 6.4 | 7.5 | NTPA–001/2002 [10] |
| EC (µS/cm) | - | 389 | 52.8 | 251 | 461 | |
| TDS (mg/L) | - | 253 | 34.6 | 163 | 300 | |
| Turbidity (NTU) | - | 1.7 | 1.2 | 0.3 | 4.4 | |
| Alkalinity (mg/L) | - | 159 | 30.4 | 115 | 207 | |
| BOD5 (mg/L) | 25 | 3.6 | 3.8 | 0.4 | 15.3 | NTPA–001/2002 [10] |
| Na+ (mg/L) | - | 70.8 | 8.4 | 48.7 | 78.9 | |
| K+ (mg/L) | - | 1.6 | 1.06 | 0.2 | 4.2 | |
| Mg2+ (mg/L) | 100 | 4.3 | 1.9 | 2.1 | 8.5 | NTPA–001/2002 [10] |
| Ca2+ (mg/L) | 300 | 8.5 | 4.6 | 3.9 | 17.2 | NTPA–001/2002 [10] |
| Cl− (mg/L) | 500 | 86.8 | 14.2 | 58.7 | 109 | NTPA–001/2002 [10] |
| NO3− (mg/L) | 25 | 6.3 | 3.4 | 0.8 | 11.8 | NTPA–001/2002 [10] |
| SO42− (mg/L) | 600 | 61.8 | 17.6 | 30.5 | 97.5 | NTPA–001/2002 [10] |
| PO43− (mg/L) | - | 0.1 | 0.1 | 0.1 | 0.4 | |
| HCO3− (mg/L) | - | 3.07 | 1.2 | 1.2 | 5.2 |
3.1. Seasonal Variation
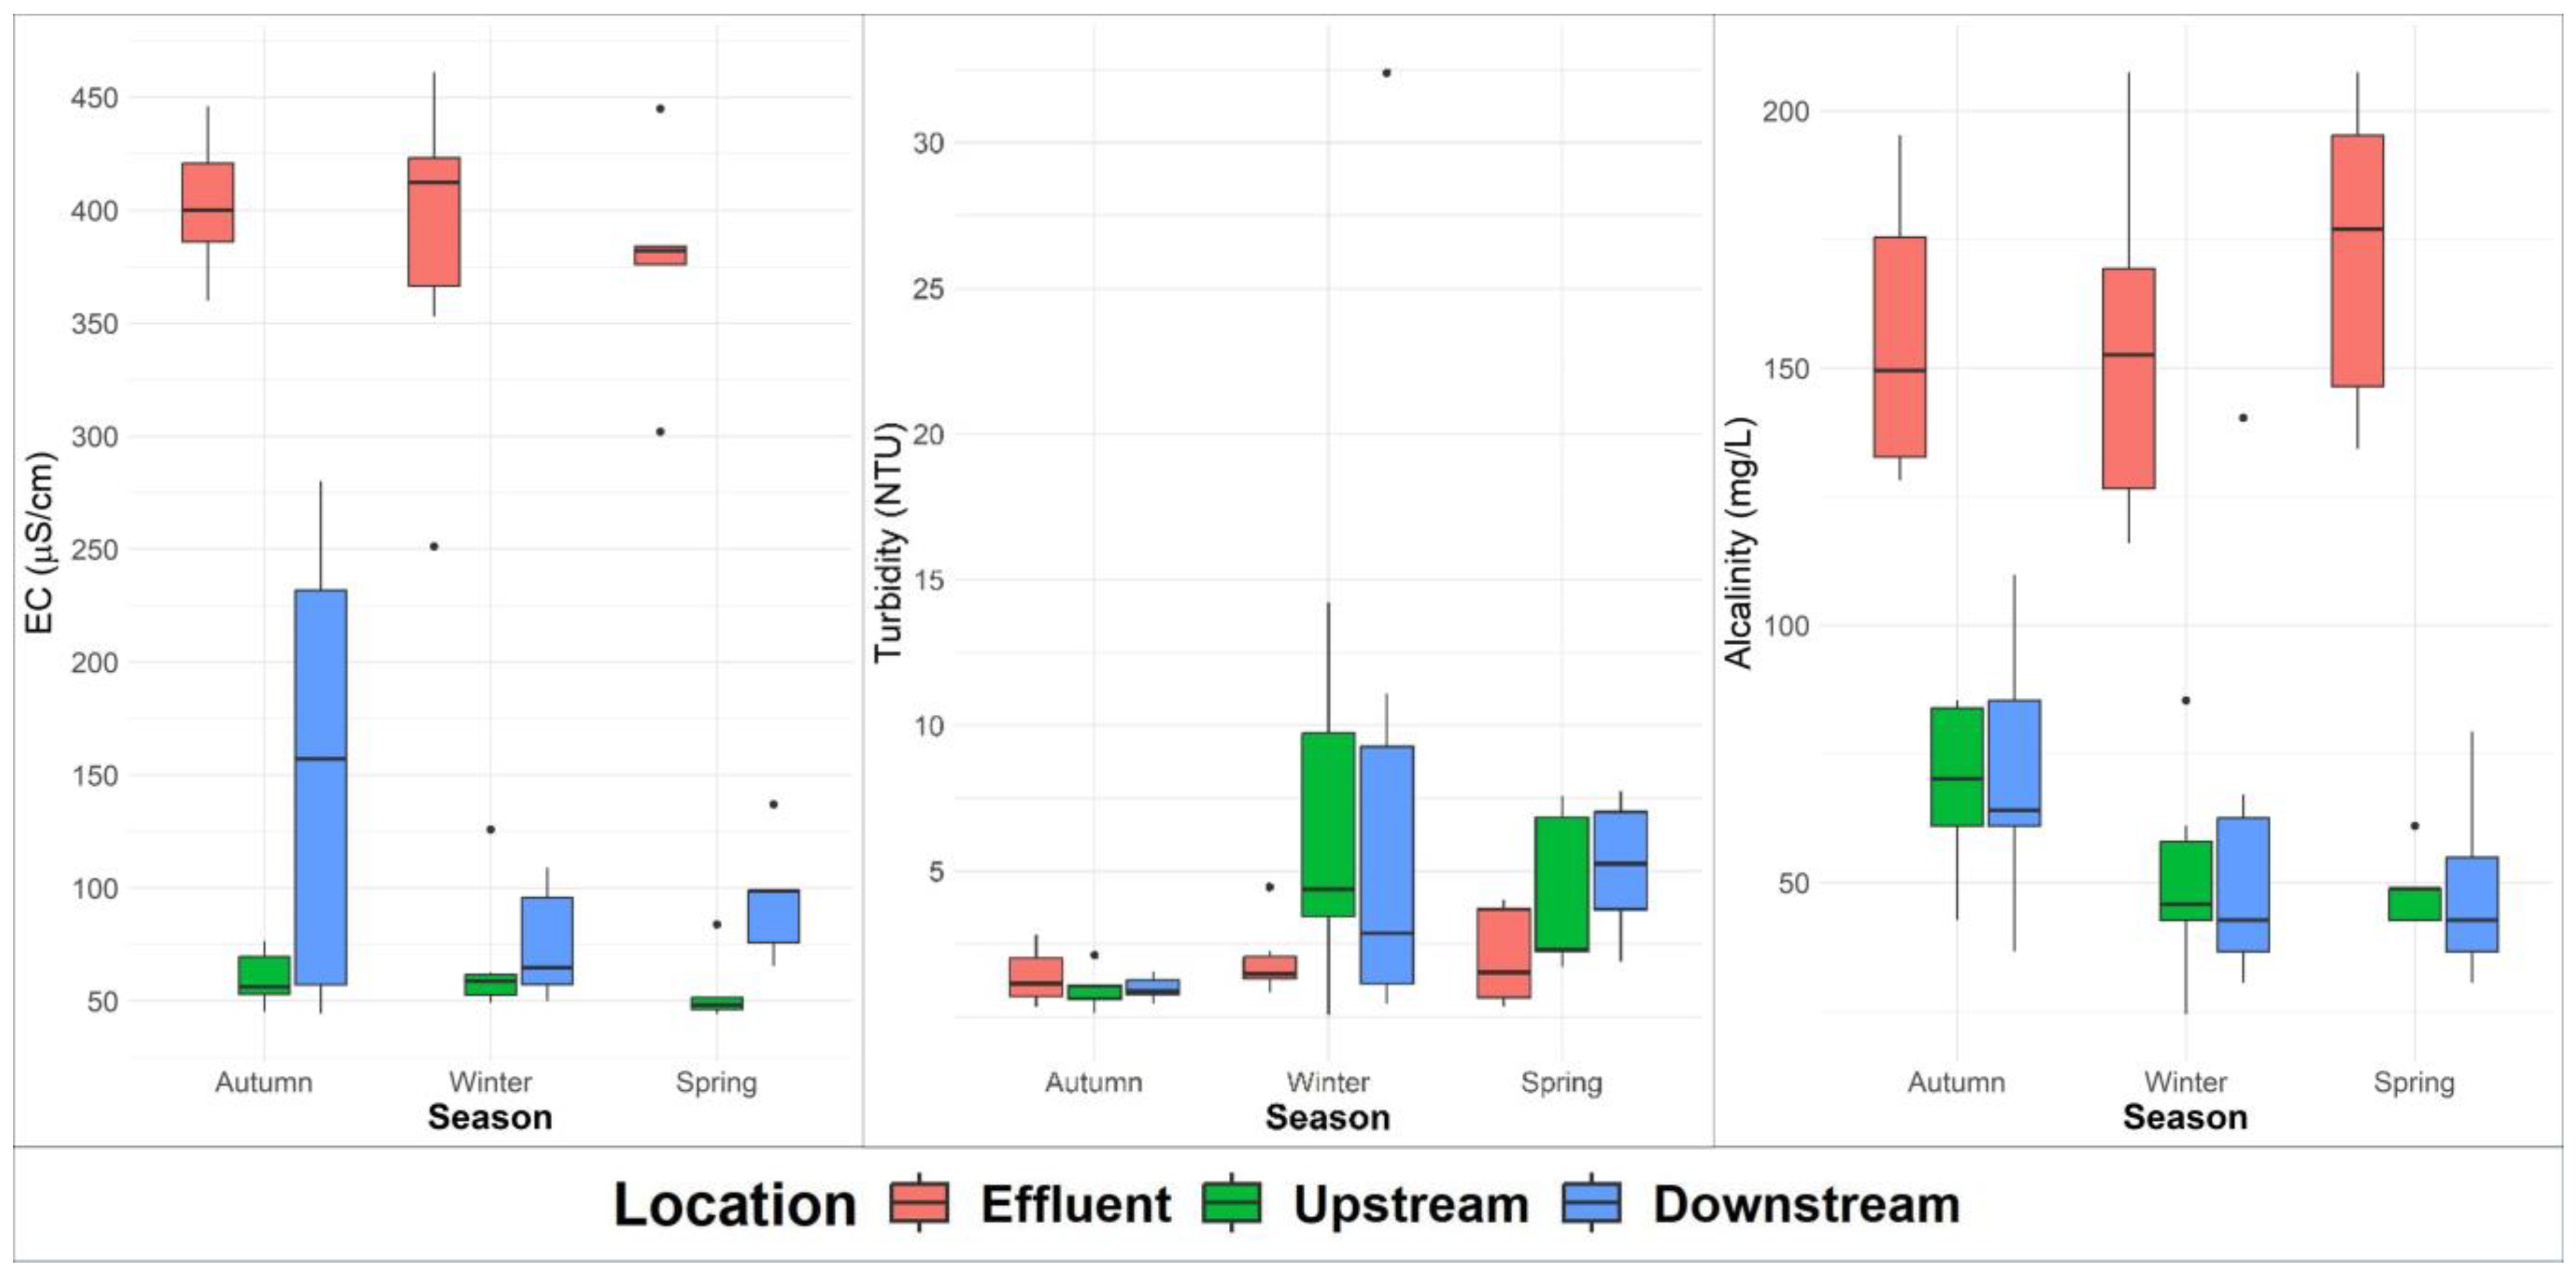
The seasonal variation in the analyzed parameters is presented in Figure 3 for physico-chemical parameters and in Figure 4 for major ions. Notably, during the spring season, both EC and alkalinity display lower values compared to other seasons, while turbidity is higher during this time. These differences can be explained by the increased water flow in the spring: lower parameter values are caused by dilution, while higher values are due to the greater number of particulates being carried into the water. The lowest values of EC are registered for the upstream points for all seasons, with a slight increase downstream, which is more significant in autumn, but it can be concluded that the discharge of treated wastewater does not have a strongly negative impact on the surface water. Given the direct correlation between EC and TDS, TDS was not plotted separately as it followed the same pattern as EC.
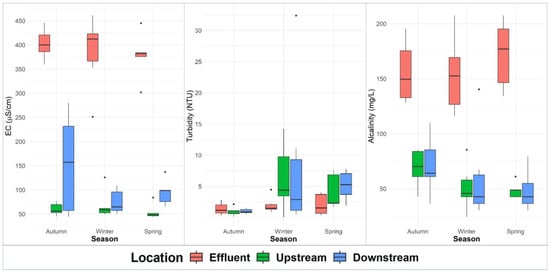
Figure 3.
Seasonal variation in physico-chemical parameters.
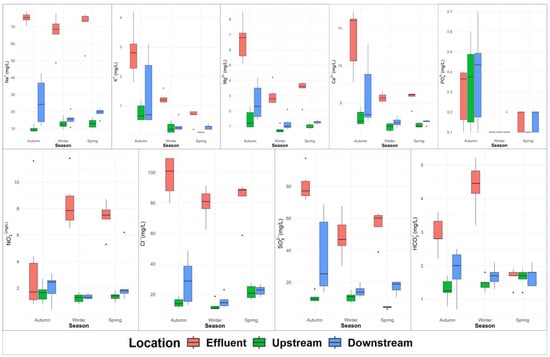
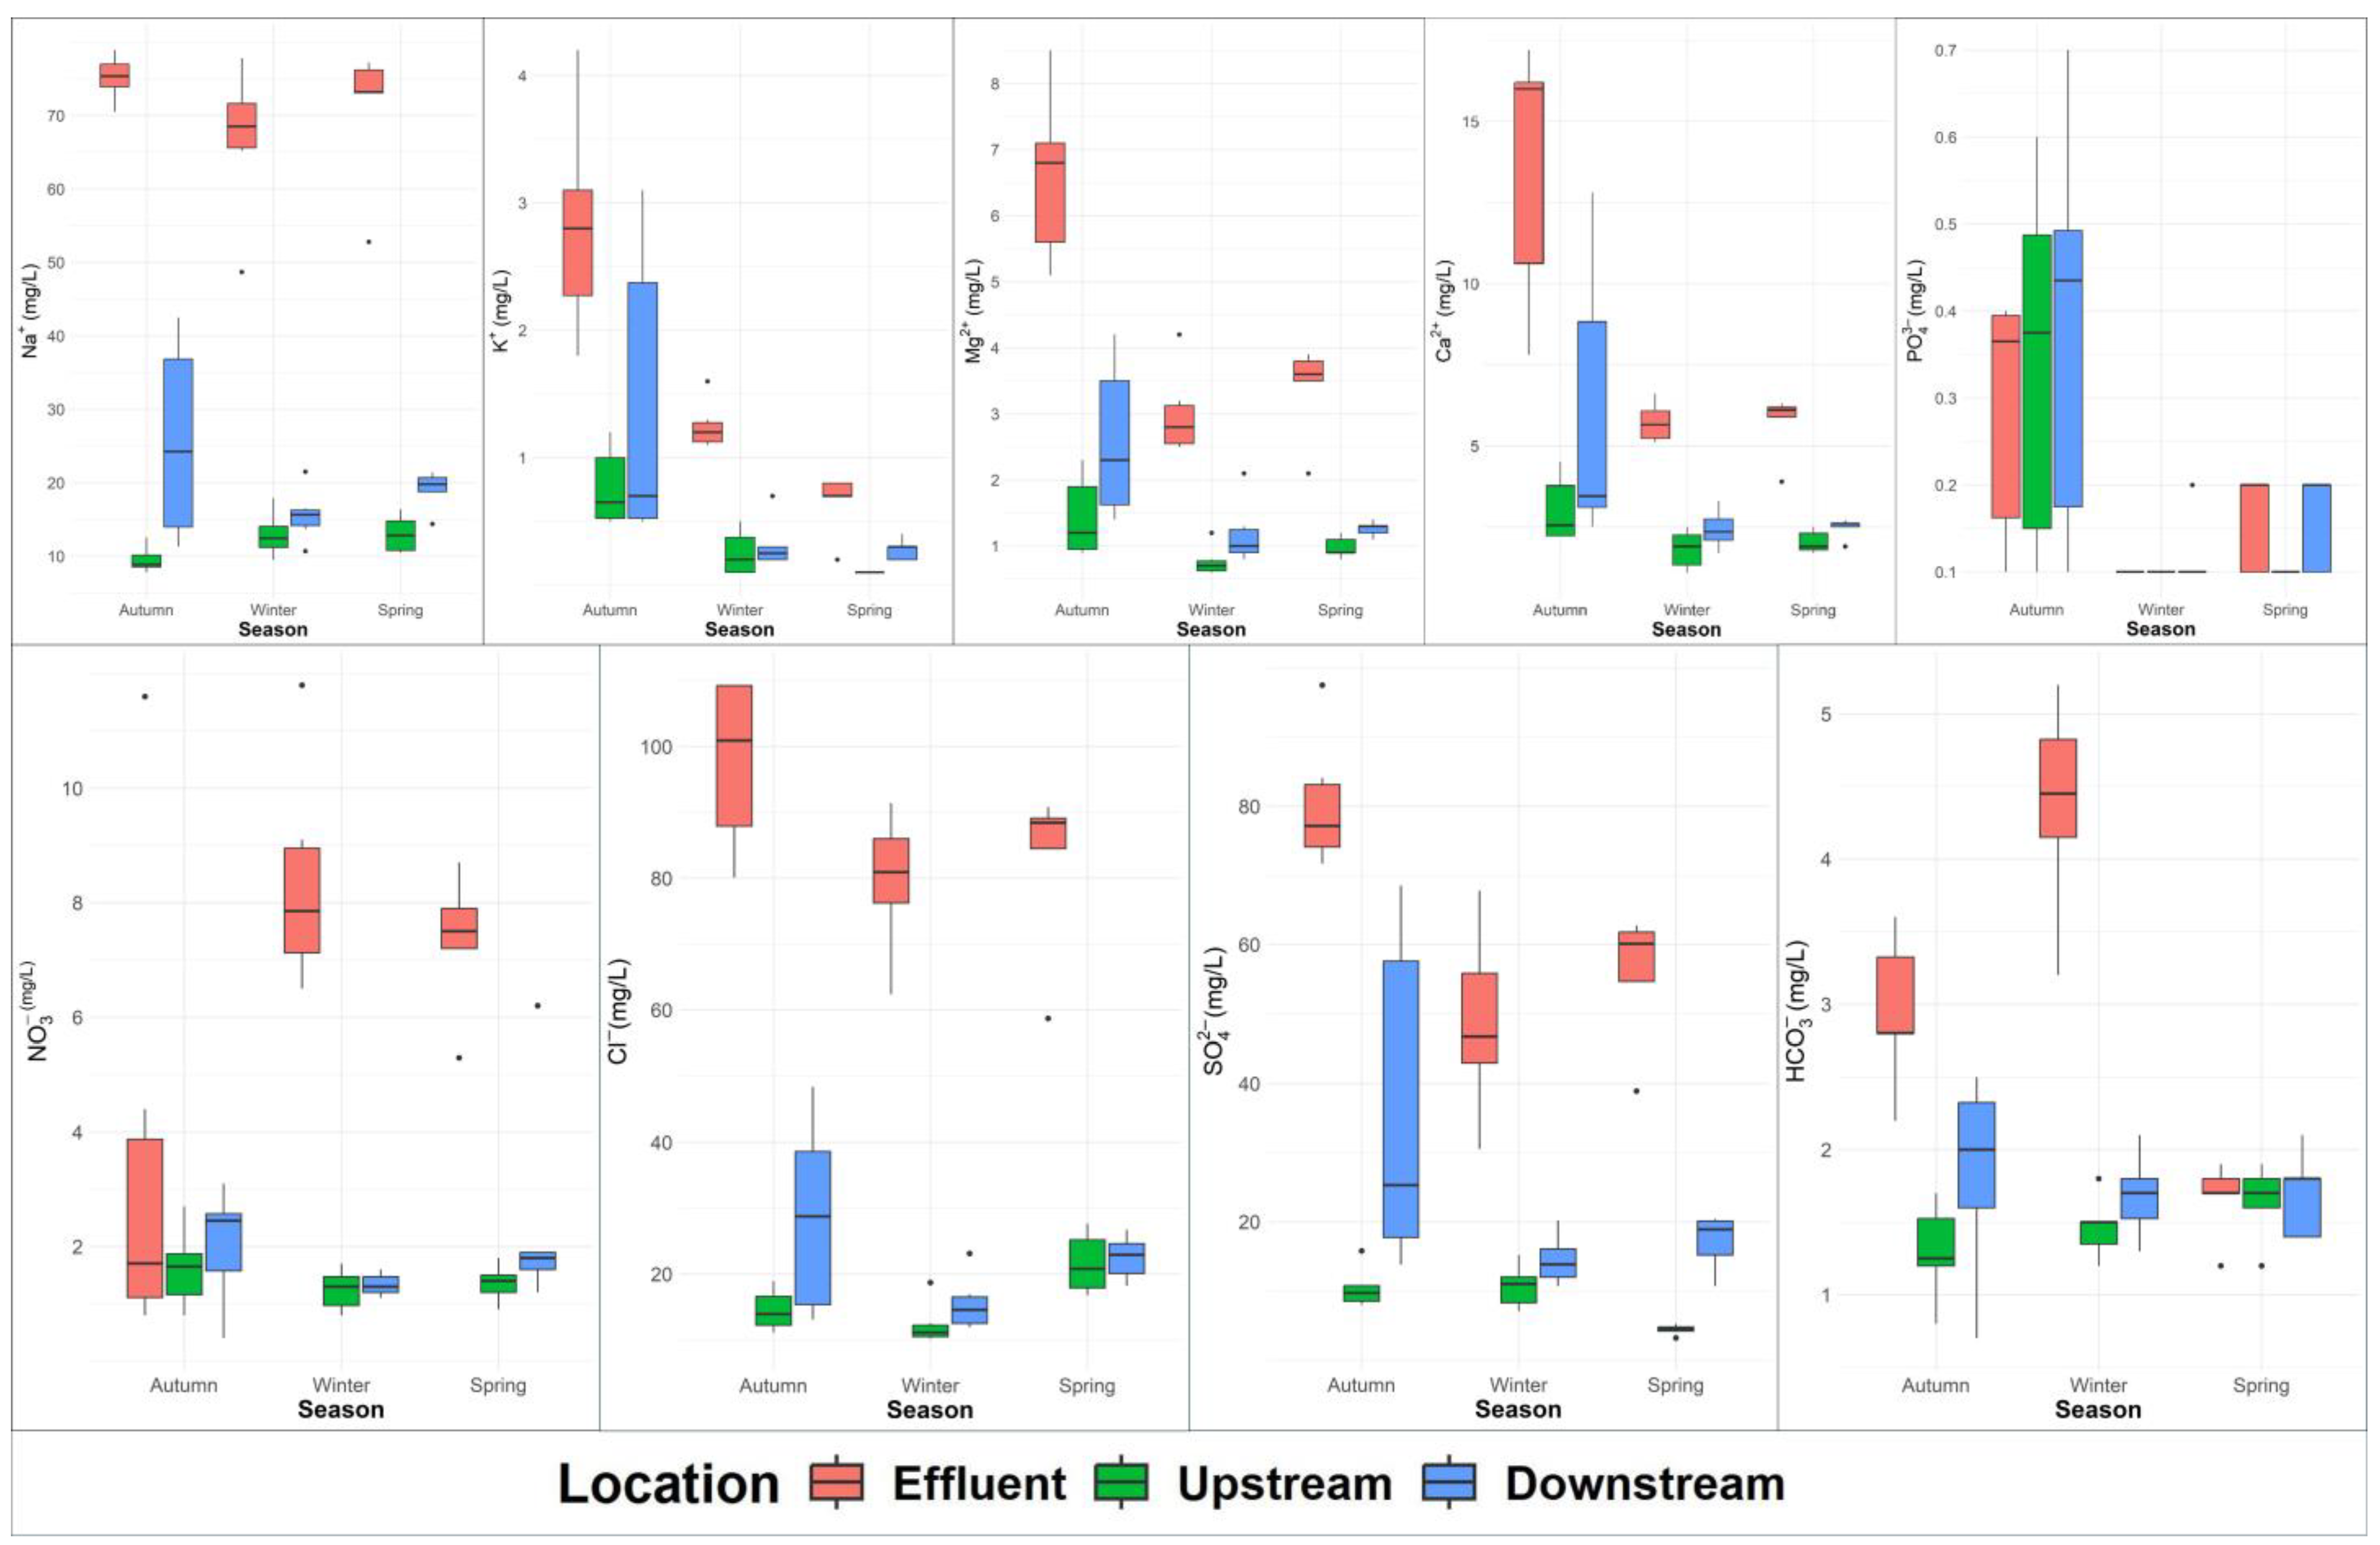
Figure 4.
Seasonal variation in major ions.
The maximum values of turbidity are reached by the river during winter and spring. The slight increase downstream compared to upstream indicates the possible influence of the wastewater treatment plant discharge, but it remains at an acceptable level. The alkalinity has high values in the effluent, being equal during the autumn and winter periods and showing an increase in spring. No significant differences in alkalinity values were observed at the upstream and downstream points.
Except for sodium, all cations showed lower concentrations in the spring. The fluctuations can be correlated with ion solubility and precipitation patterns. In the case of the seasonal variation in potassium ions (K+), magnesium ions (Mg2+), and calcium ions (Ca2+), it is possible to observe a decrease in concentration from autumn to spring. Sodium and sulfate ions have higher values at the downstream point, with lower concentrations during winter. Due to its higher solubility, sodium tends to remain more stable despite the increased water flow.
Generally, anions had lower concentrations in winter, except for the fluoride ion. A possible cause of this could be the improper storage of fertilizers that contain fluoride. Chloride ions (Cl−) exhibit their highest concentrations in autumn, with a significant difference observed between upstream and downstream measurements during this season. This increased concentration of chloride in autumn can be attributed to various factors, such as increased runoff from rain or the leaching of salts from surrounding soils, which may accumulate during the drier months. The noticeable difference between upstream and downstream points suggests that there are additional inputs of chloride downstream, possibly from wastewater discharge. However, in the following seasons, this difference becomes insignificant, indicating that chloride levels tend to equalize as the influence of seasonal factors, such as dilution from increased water flow, comes into play.
For nitrate ions (NO3−), the effluent values in winter and spring are equal to and higher than those recorded in autumn. This increase can be linked to the high values of nitrate in the effluent during winter and spring, but also to the seasonal use of fertilizers in agricultural areas where nitrate is commonly used. In the upstream areas, nitrate concentrations are consistent throughout winter and spring.
The seasonal variation in orthophosphates (PO43−) presents a distinct scenario. In autumn, the concentrations at the upstream and downstream points are higher than those measured in the WWTP effluent. This may indicate that during autumn, other sources, such as agricultural runoff, are contributing more significantly to phosphate levels than the WWTP effluent. In winter, the concentrations of orthophosphates equalize across all locations. By spring, the WWTP effluent concentrations of orthophosphates align with those downstream, indicating the influence of the effluent. Bicarbonate ions (HCO3−) have high concentrations in the WWTP effluent in autumn and winter. However, in general, there is little variation across the different seasons and sampling points, indicating a stable concentration level throughout the year.
3.2. The Efficiency of the Treatment Processes
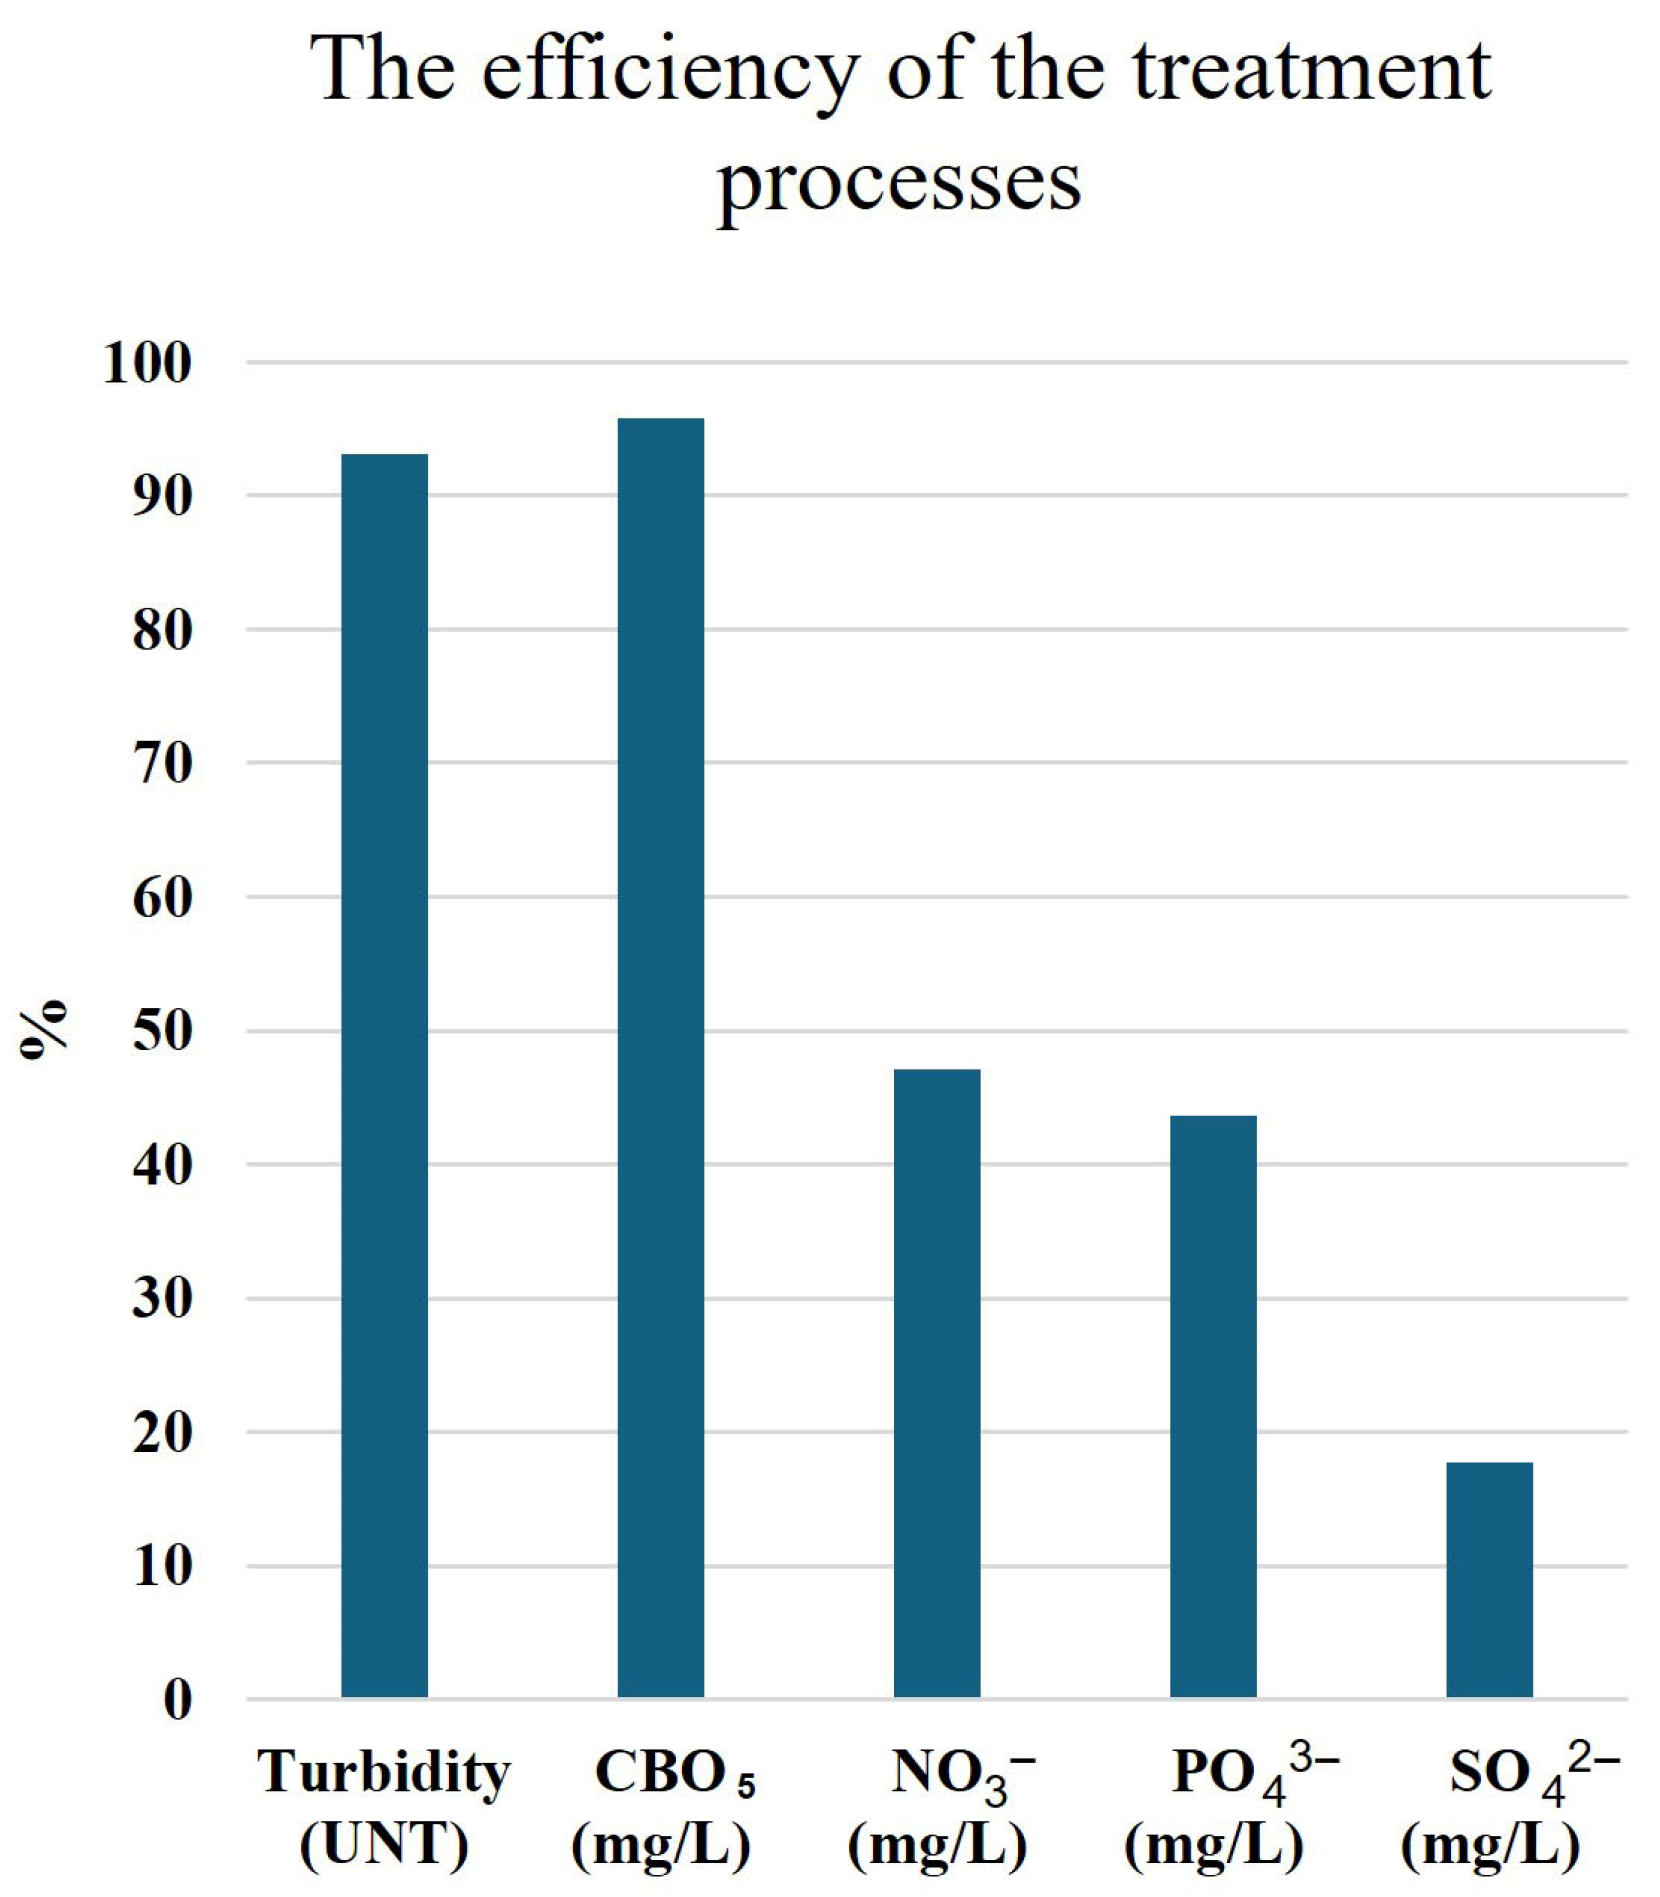
The efficiency of the treatment processes was calculated using Equation (1), based on influent data (Table 3) and effluent data (Table 2). The treatment processes exhibited efficient contaminant removal (Figure 5). The analyzed effluent parameters fall below the limits established by environmental standards, indicating that the wastewater treatment systems are operating effectively. The most substantial reductions are observed for BOD5 and turbidity, with removal efficiencies of 96% and 93%, respectively, reflecting the plant’s strong performance in managing organic and particulate pollutants. For nitrates and phosphates, two of the main pollutants found in surface waters, the removal efficiency is around 50%. These parameters are specifically targeted by the treatment processes due to their environmental and regulatory significance. Sulfates have a lower removal efficiency, being more soluble in water; this makes their removal more challenging.
Table 3.
Influent statistics.

Figure 5.
The efficiency of the treatment processes.
3.3. Water Quality Index (WQI) Results
3.3.1. PCA
Before conducting the PCA, the Kaiser–Meyer–Olkin (KMO) test for sampling adequacy and Bartlett’s test of sphericity were applied to determine the suitability of data and the sampling adequacy [53,76]. The results of the statistical tests showed that the KMO index value is 0.77, which is acceptable (according to [55]), and the value of Bartlett’s sphericity test is highly significant (p < 0.000), which indicates that the data are suitable for PCA.
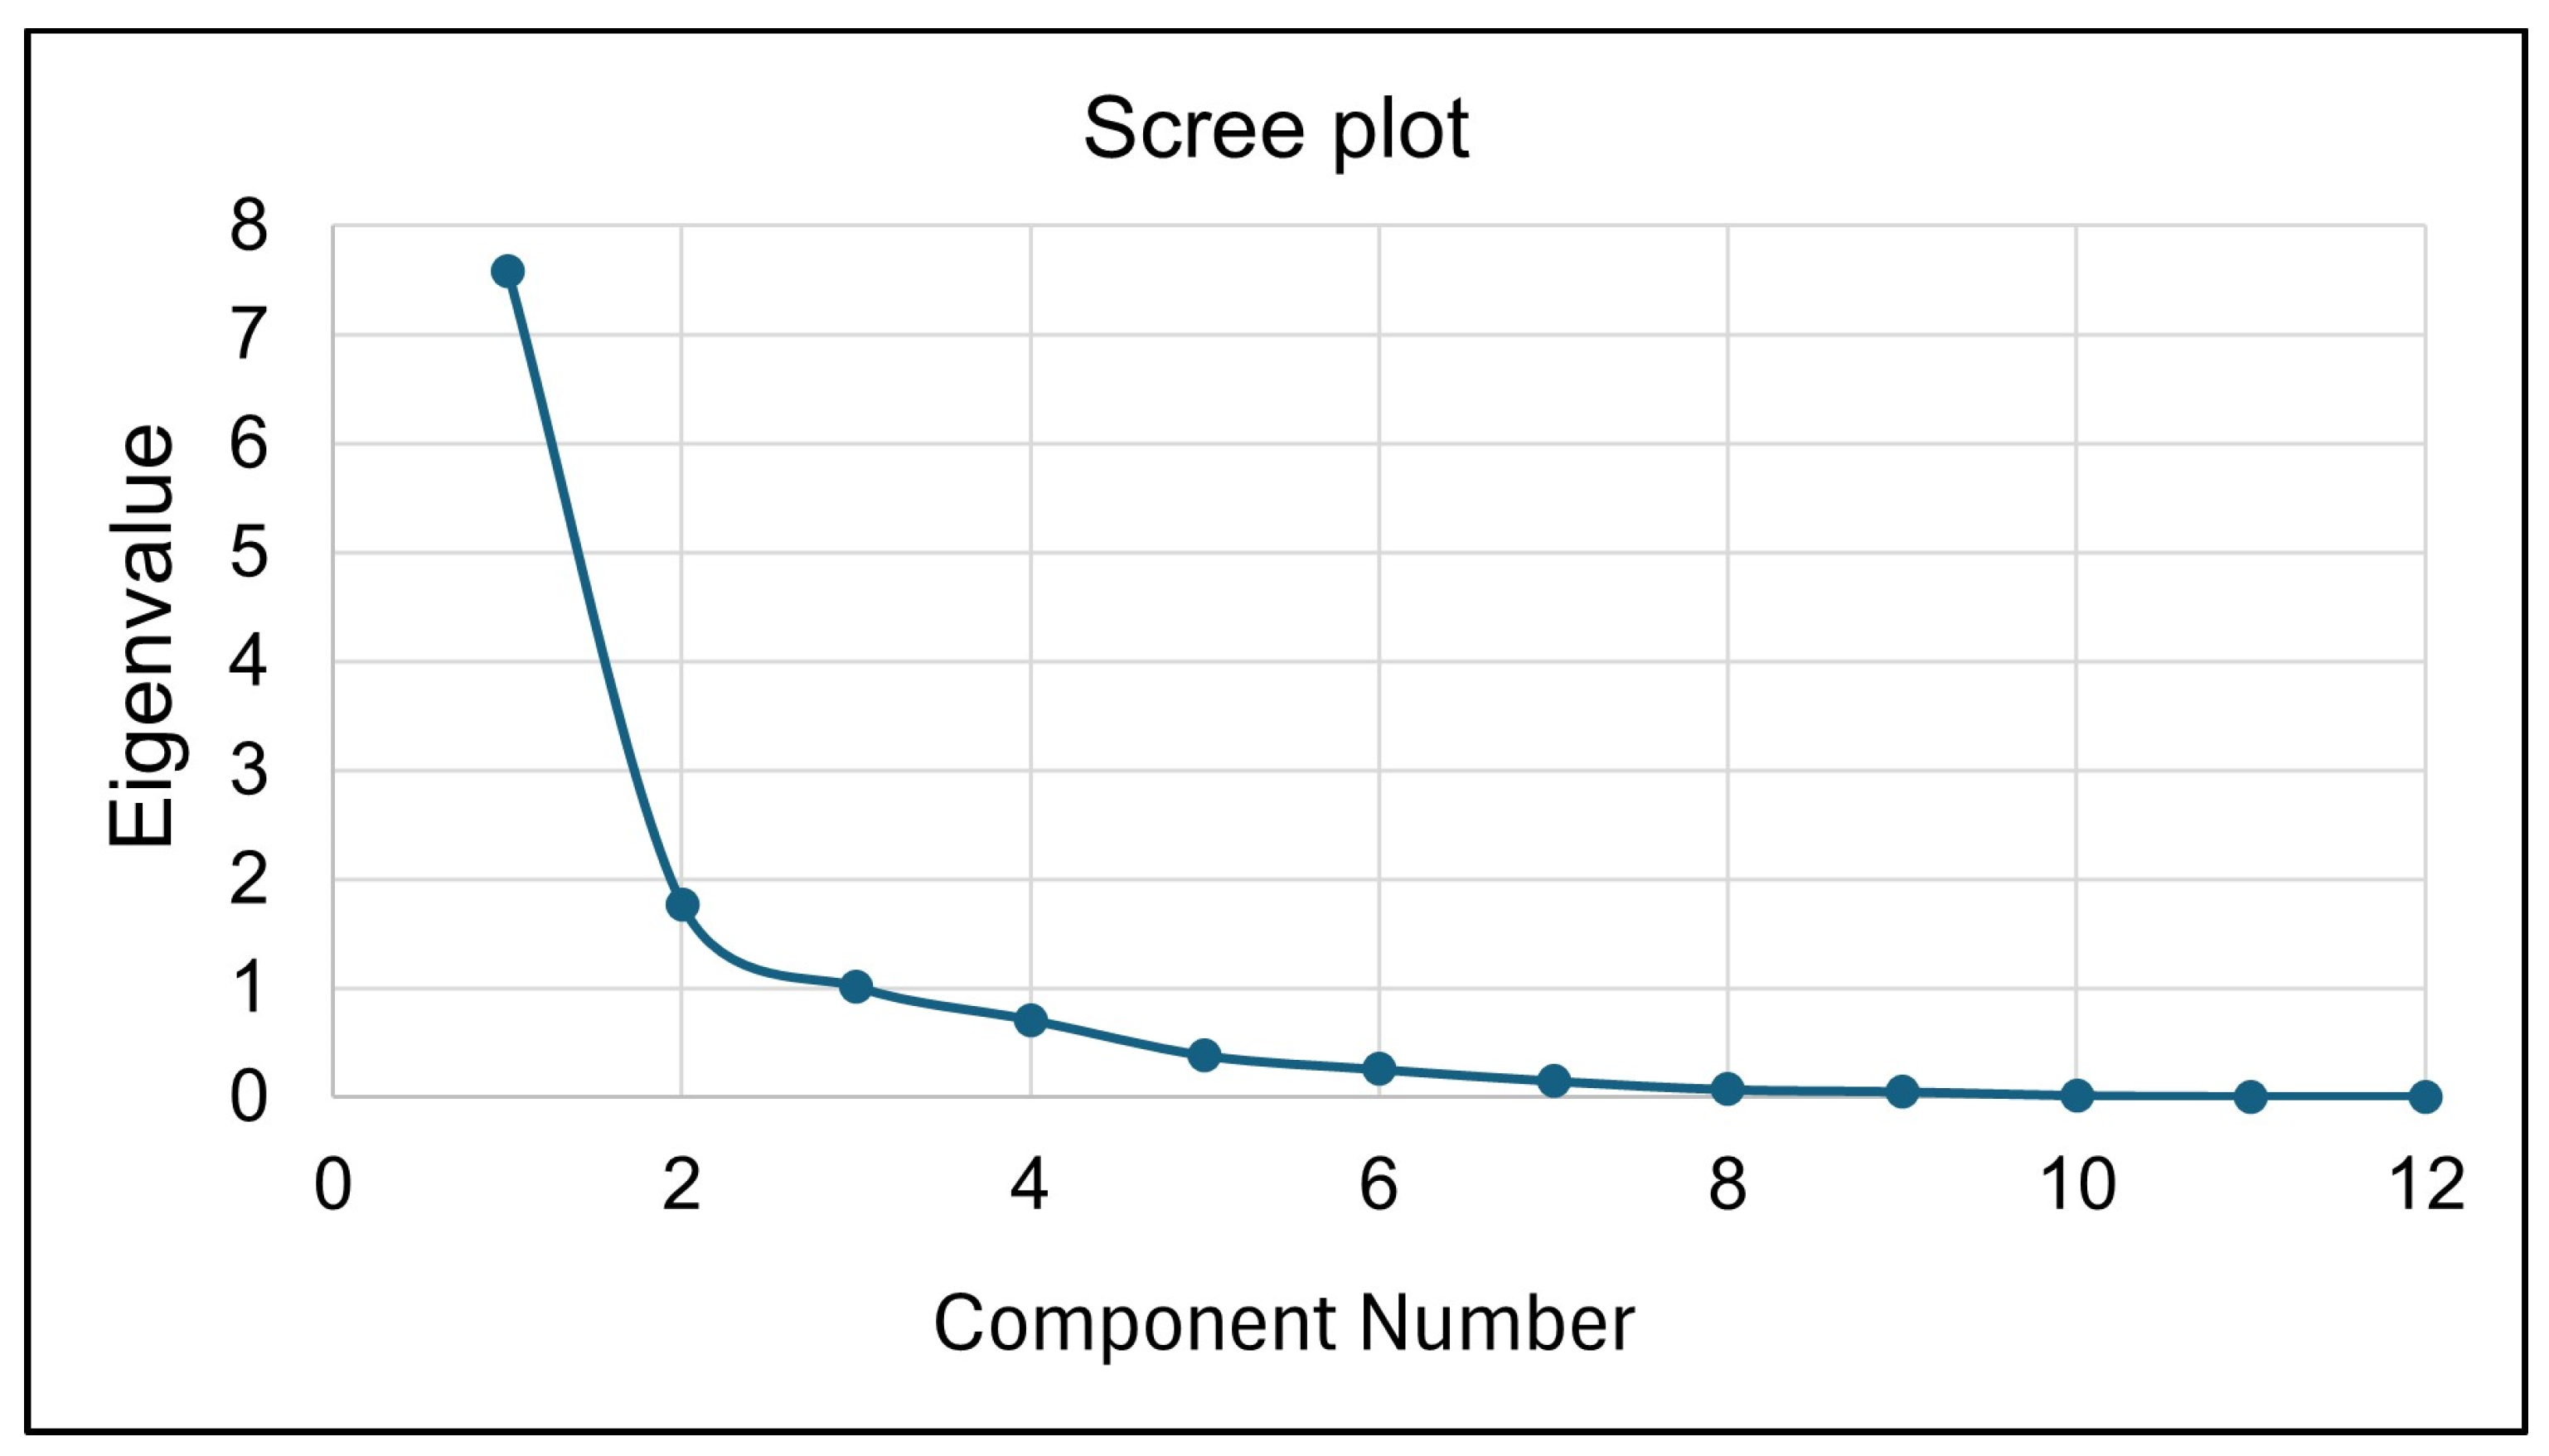
In this study, we applied PCA, considering just the components with an eigenvalue higher than 1 (Table 4 and Figure 6), and 3 principal components were extracted. The results show that the extracted components explain 86% of the variation in the data, with the first component accounting for 63% of the variance, the second component for 14%, and the third for 8%.
Table 4.
The principal components extracted.
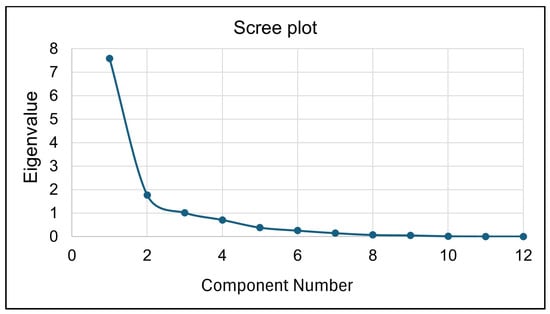
Figure 6.
Scree plot of eigenvalues explained by the resulting components.
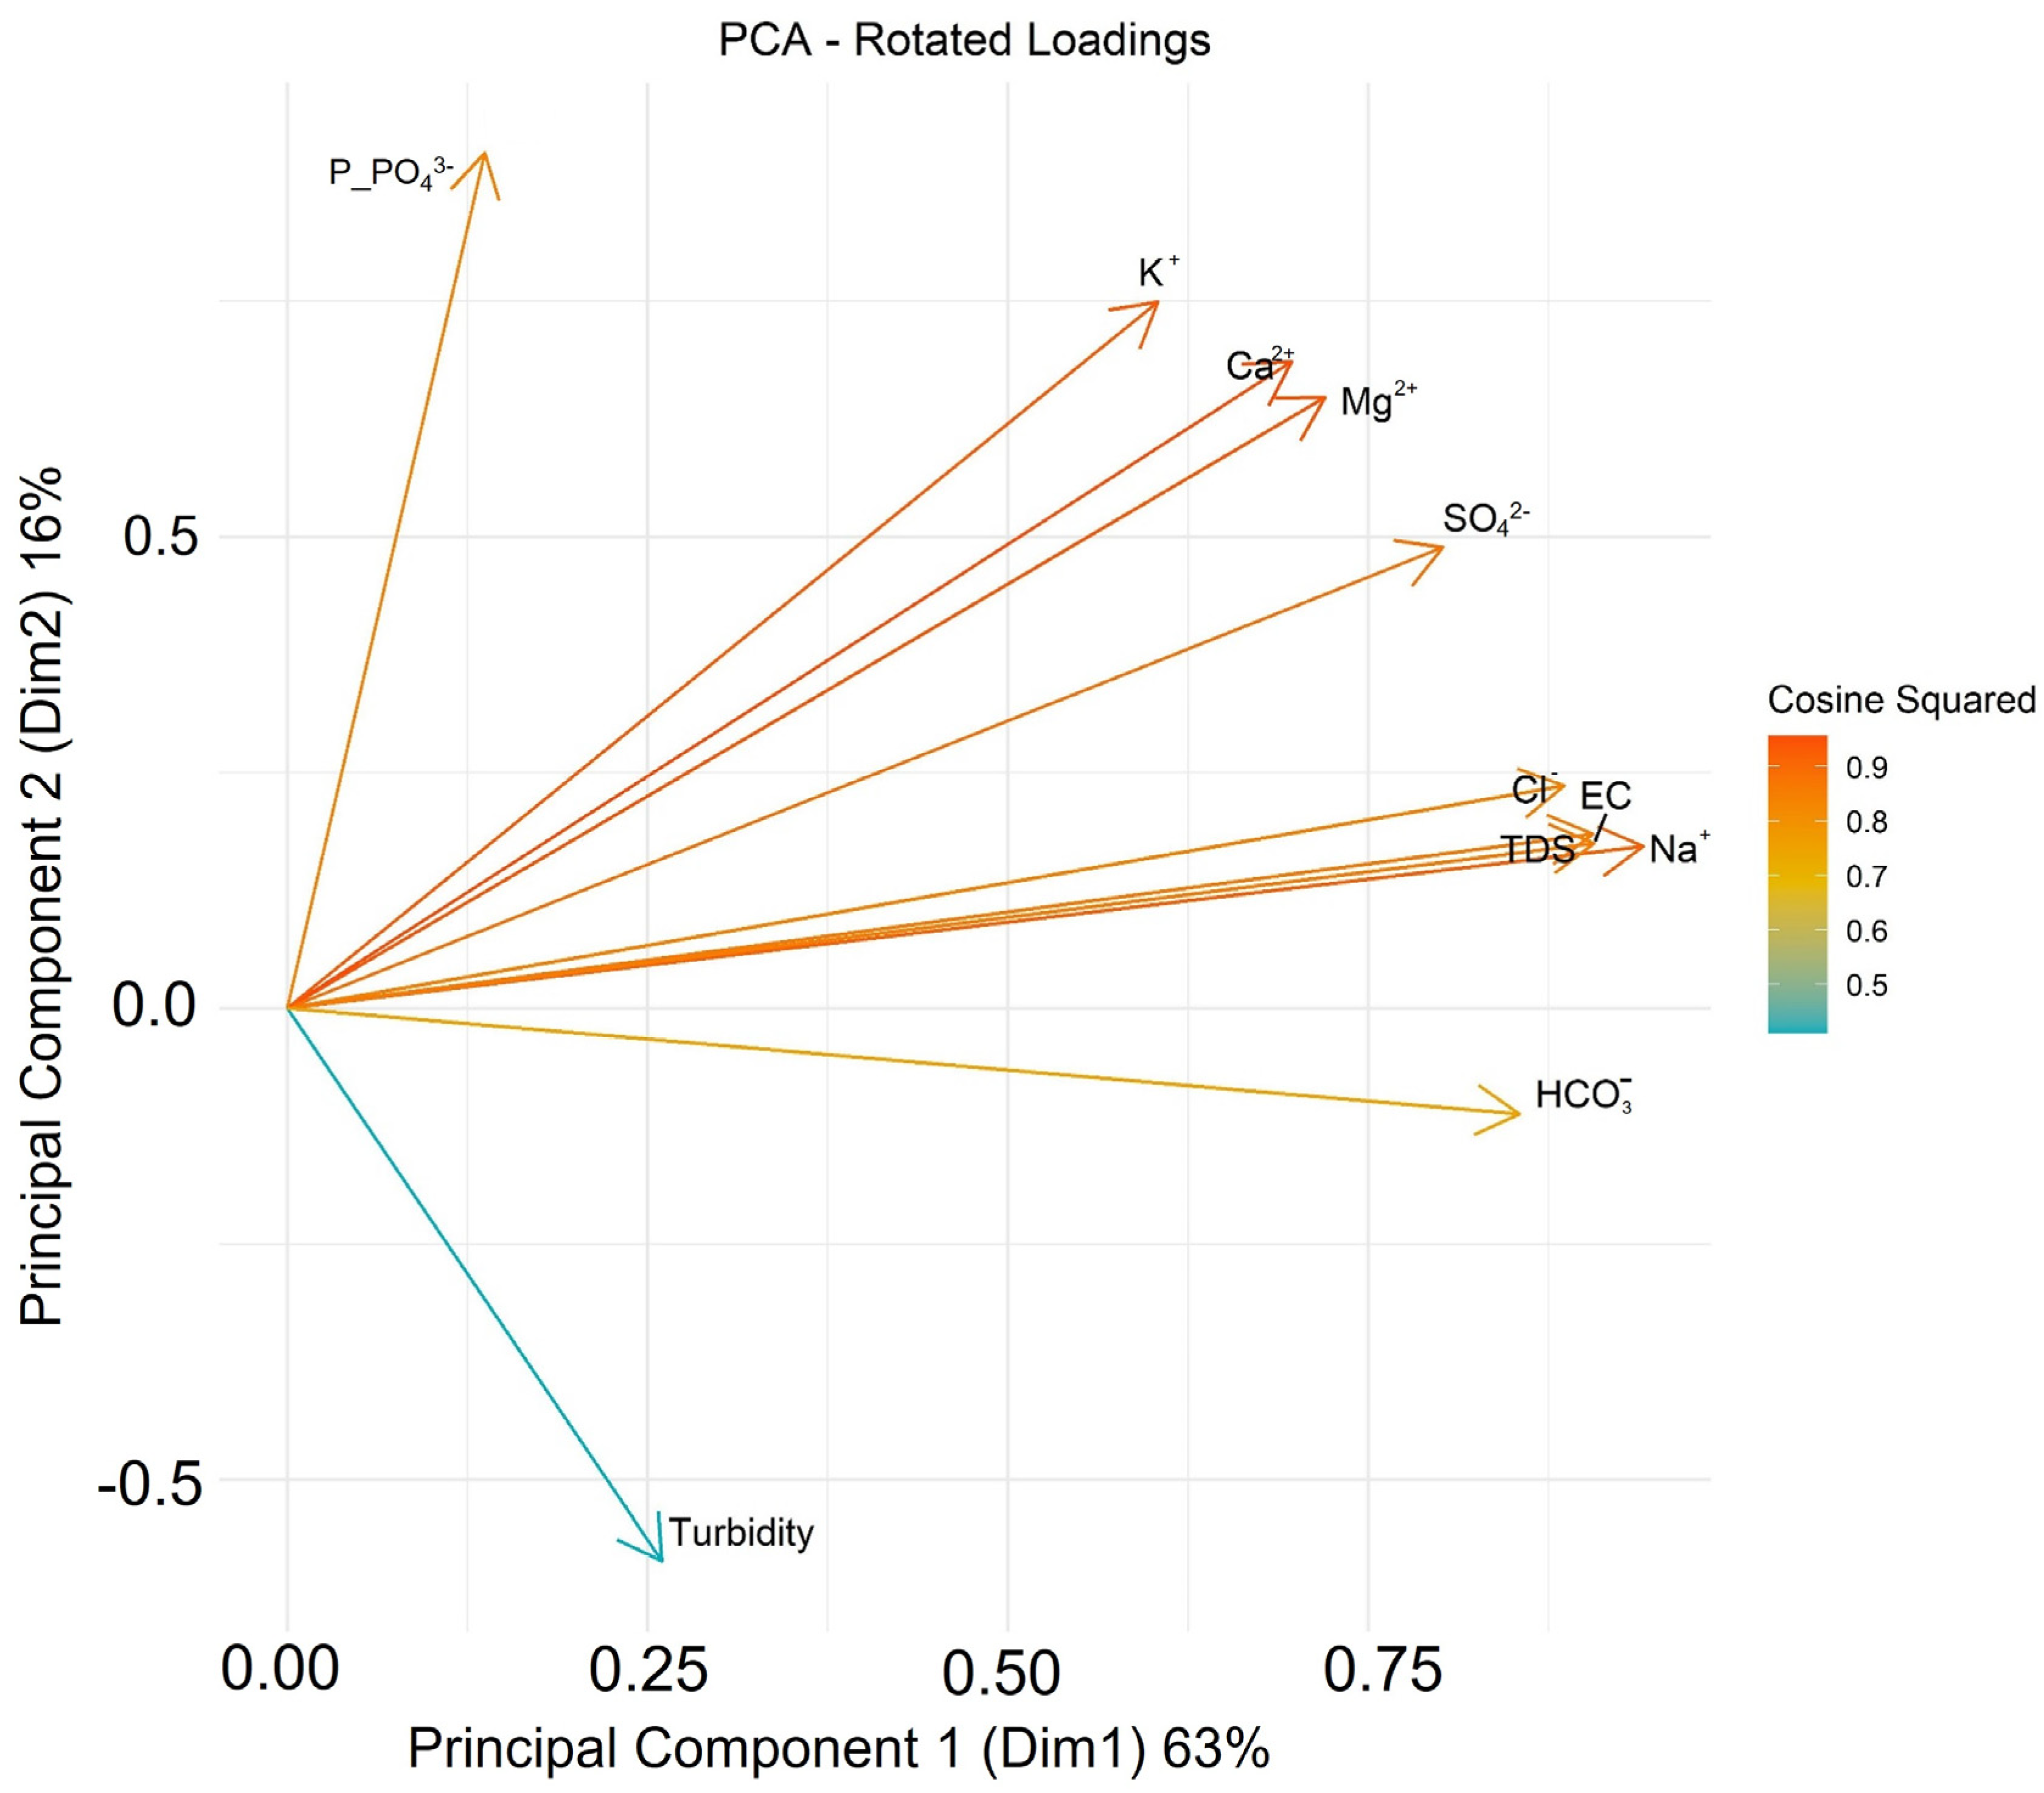
The rotated component matrix was used to select the highest factor loadings in each component and the relative eigenvalue was calculated (Table 5). The PCA showed that the first two components accounted for a significant portion (approximately 77%) of the variance. The contribution of the parameters included in these two components is plotted in Figure 7. The parameters of the first component present a good correlation, with cosine squared values close to 1. The cosine squared values are calculated as the square of the cosine of the angle between the variable’s vector and the principal component. They are a measure of the correlation between the variable and the principal component. A cosine squared value close to 1 indicates that the variable has a strong correlation with the principal component, meaning it contributes significantly to the variance explained by that component. A cosine squared close to 0 suggests that the variable does not contribute much to the principal component, indicating a weak correlation.
Table 5.
Rotated component matrix from PCA and factor loadings after rotation.

Figure 7.
Biplot of first and second principal components.
The first component is dominated by major ions, containing the following parameters: Na+, Mg2+, Ca2+, Cl−, SO42−, EC, TDS, K+, and HCO3−. This suggests that this component might represent a general measure of salinity or total dissolved solids; therefore, this component will be named salinity and mineralization. High positive values could indicate higher salinity or mineral content. The parameters with high positive loadings in component one, such as Na+ (0.941), Cl− (0.886), EC (0.907), and TDS (0.906), are strongly associated with this component, with these parameters explaining a significant amount of the variance in component one.
The second component includes the parameters P_PO43− and turbidity and is indicative of the presence of organic matter and phosphate pollution. A positive loading for phosphate (P_PO43−) indicates that this component is positively associated with phosphate levels. Higher scores in this dimension suggest increased phosphate concentrations, which may occur independently of turbidity levels. The negative loading for turbidity indicates an inverse correlation. When the component increases, the turbidity tends to decrease. For instance, this could reflect a scenario where phosphate enrichment occurs in clearer water with low organic matter, potentially due to agricultural runoff, fertilizer use, or discharge from a WWTP. This pattern highlights a situation where different environmental processes or pollution sources affect water quality in distinct ways, with phosphate entering the water without significantly affecting clarity or organic content.
The N_NO3− parameter is isolated into its own component because its behavior is distinct from other parameters in the dataset, indicating that nitrate levels fluctuate independently of other water quality parameters. This could indicate that a specific environmental or chemical process is underway that predominantly affects nitrate levels but not the other variables as much. This component could represent nitrate pollution due to agricultural runoff, wastewater discharge, or industrial processes that contribute primarily to nitrate levels in the water.
Using the relative eigenvalue and the relative loadings, the weight of each parameter was calculated in Table 6. Parameters with higher weights indicate a higher impact on the overall water quality, making a more significant contribution to the final index value. The advantage of using statistical methods in assigning weights is the objectivity of the analysis, with these data-driven approaches offering more reliable results by reducing subjective biases [56].
Table 6.
Weight calculation based on rotated component matrix.
3.3.2. WQI Calculation
We used Equations (3)–(5) to calculate the WQI, along with the quality standard values (Table 1) and the weights assigned to each parameter using PCA (Table 6). The calculated WQI values (Table 7) are classified into five categories as follows: WQI < 50 (excellent), 50 < WQI < 100 (good), 100 < WQI < 200 (moderate), 200 < WQI < 300 (poor), and WQI > 300 (polluted) [58,76].
Table 7.
Water Quality Index (WQI) values.
The average WQI values (Table 7), both upstream and downstream of the effluent discharge point of the wastewater treatment plant, display a “very good” ecological status (WQI < 50). However, regarding the individual water samples, there are eight instances where the water is classified as “good” (50 < WQI < 100) or “moderate” (100 < WQI < 200). Five of these instances are found downstream, where there is also a greater variability in values, ranging from 20.5 to 101.5. Upstream samples predominantly exhibit lower WQI values, indicating better quality compared to downstream samples. The results show that WQI values tend to increase during autumn, indicating a decrease in water quality. Overall, despite localized and seasonal variations, the WQI values reflect good river water quality.
The WQI applied in this study synthesizes overall water quality information in an easily interpretable form. However, this approach can present some limitations. According to [77], the methods applied can conceal parameters with values exceeding legal limits if other parameters are within limits. Therefore, it is essential to analyze each parameter individually in order to identify such issues.
3.4. Assessment of the Suitability of Treated Wastewater for Irrigation Purposes
According to the Piper diagram (Figure 8), the effluent is predominantly influenced by sodium ions as the dominant cations, along with chloride and sulfate ions as the dominant anions. The hydrochemical type of the analyzed water is NaCl, with secondary calcium–magnesium–chloride–sulfate characteristics, indicating saline water. NaCl-dominant water is generally associated with high salinity, which can affect the soil and crops if used for irrigation. Therefore, calculating irrigation indices that account for these ions, particularly the elevated sodium levels, is essential.

Figure 8.
Piper diagram for effluent.
The results of the irrigation water quality indices are presented in Table 8. The obtained values were compared to the recommended standard values for irrigation water quality parameters and indices (Table 9) to assess potential impacts on soil and crop health.
Table 8.
Irrigation water quality parameters and indices for the study area.
The results showed that the EC in the effluent water varies between 251 µS/cm and 461 µS/cm. All samples fell within the second class of quality regarding the suitability for irrigation, indicating moderate salinity levels. While no specific trend was identified in the EC data, the average value during autumn (402 µS/cm) was higher than in other seasons. The TDS values were below the recommended standard value for the first class of quality (<450 mg/L) in all the samples. The data displayed only minor fluctuations, and no clear seasonal trend in TDS values was apparent. Turbidity levels ranged between 0.36 and 4.46 NTU, with a seasonal increase following the sequence autumn < winter < spring. This increase in spring suggests the presence of greater particulate matter in water during this season, which may correlate with higher flow rates and increased sediment presence. However, overall turbidity remained within acceptable limits. The BOD5 values are higher in autumn and spring, with one sample exceeding the standard limit. These higher BOD5 levels could indicate an increased organic load during these seasons. Elevated BOD5 levels could reduce dissolved oxygen availability, reducing the soil aeration and affecting the nutrient uptake. However, most of the samples fell within the standard limit.
The SAR values increase from autumn to spring, varying between 3.61 and 6.30. These values fall within the excellent-quality class for irrigation water, indicating a low risk of soil structure degradation. The observed seasonal increase in SAR from autumn to spring might be due to slight seasonal changes in the composition of wastewater effluent. Therefore, based on the SAR values, the analyzed water is suitable for use in irrigation purposes.
The PI% index values ranged from 72.18% to 94%, with two samples collected during autumn falling into the moderate-suitability class for irrigation, while the remaining samples were classified as suitable for irrigation, with values exceeding the recommended threshold of 75%. The two exceeding values are close to the threshold of 75%, suggesting that, generally, the water quality for irrigation remains good, with occasional fluctuations.
The RSC values vary between −1.51 and −0.34, increasing from autumn to spring. The lower the value, the more suitable the water is for irrigation use. A negative RSC value indicates that the water has a favorable balance of ions (bicarbonates are in balance with calcium and magnesium) for maintaining good soil structure and permeability.
The sodium percentage showed an increase from autumn to spring, with five water samples collected during spring falling in the “doubtful”-quality class, while the remaining 12 samples were classified as “unsuitable” for irrigation. This trend is caused by the high concentration of Na+ relative to Ca2+ and Ma2+ in the water. A high value of the Na% index can impact the soil permeability and the plants’ water intake [69,76].
The KR values exceed the recommended limit in all the samples. Based on this index, the effluent water is unfit for irrigation purposes. This is caused by intense cation exchange and an excess of Na+, a fact also reported by similar studies [59,78].
Table 9.
Classification of water samples based on standards specified for each irrigation water quality parameter/index.
Table 9.
Classification of water samples based on standards specified for each irrigation water quality parameter/index.
| Parameters | Value Range | Water Classification | References | Number of Samples |
|---|---|---|---|---|
| EC (µS/cm) | <250 | Excellent | Richards, 1954; Thirumoorthy et al., 2024 [51,67] | 0 |
| 250–750 | Good | 17 | ||
| 750–2000 | Permissible | 0 | ||
| 2000–3000 | Doubtful | 0 | ||
| >3000 | Unsuitable | 0 | ||
| TDS (mg/L) | <450 | Suitable | Ayers and Westcot, 1985; Bhatti et al., 2019 [79,80] | 17 |
| 450–2000 | Moderate | 0 | ||
| >2000 | Unsuitable | 0 | ||
| Turbidity (NTU) | ≤5 | Suitable | Regulation 741/2020 [15] | 17 |
| >5 | Unsuitable | 0 | ||
| BOD5 (mg/L) | ≤10 | Suitable | Regulation 741/2020 [15] | 16 |
| >10 | Unsuitable | 1 | ||
| SAR | <10 | Excellent | Richards, 1954; Shil et al., 2019 [67,81] | 17 |
| 10–18 | Good | 0 | ||
| 18–26 | Doubtful | 0 | ||
| >26 | Unsuitable | 0 | ||
| PI% | >75% | Suitable | Das and Nag, 2015 [68] | 15 |
| 20–75% | Moderate | 2 | ||
| <25% | Unsuitable | 0 | ||
| RSC | <1.25 | Suitable | Eaton, 1950 [71] | 17 |
| 1.25–2.5 | Moderate | 0 | ||
| >2.5 | Unsuitable | 0 | ||
| %Na | <20 | Excellent | Wilcox, 1955 [72] | 0 |
| 20–40 | Good | 0 | ||
| 40–60 | Permissible | 0 | ||
| 60–80 | Doubtful | 5 | ||
| >80 | Unsuitable | 12 | ||
| KR | ≤1 | Suitable | Kelley, 1963 [73] | 0 |
| >1 | Unsuitable | 17 |
The primary concern indicated by the irrigation indices is the elevated levels of sodium (Na+), which can negatively impact soil sodicity. High concentrations of sodium ions in water can lead to the replacement of essential cations in soil, such as calcium and magnesium, due to the cation exchange process, particularly within clay minerals. This ion exchange process can degrade soil structure, resulting in reduced permeability and poorer soil aeration, ultimately impacting crop growth and agricultural productivity [51,77]. While indices such as SAR and PI do not directly reflect the risks associated with sodium excess, being less sensitive to changes in sodium concentration, indices like KR and Na% are more responsive to sodium imbalances and classify the water as unsuitable for irrigation. While SAR and PI indices focus on the balance of ions to ensure that sodium does not affect soil structure and water infiltration, the KR addresses the risk of sodium displacing calcium and magnesium from soil particles and the potential for sodicity, which can lead to soil degradation [51]. These results are consistent with findings from other studies highlighting that elevated levels of sodium are a major concern when using the treated wastewater for irrigations [82,83,84]. A study conducted by Moussaoui et al. (2023) [82] identified risks associated with using the water for irrigation, with the Na% index classifying all the samples as unsuitable for this purpose. Benaafi et al. (2024) [83] also observed elevated levels of sodium and chloride in their analysis, all treated wastewater samples being classified as unsuitable for irrigation.
According to the World Bank, renewable water resources per capita in the EU have decreased by 17% over the past 55 years. This trend, coupled with other factors, is expected to lead to heightened water stress across significant areas of the EU by 2030 [85]. Agriculture is one of the most important economic activities in Romania. The country has the highest number of farmers in the EU, with nearly 3.5 million individuals engaged in agricultural activities [86]. While Romania’s agricultural sector contributes significantly to economic growth, it also poses a substantial threat to freshwater resources. Agriculture relies heavily on these resources for irrigation and simultaneously contributes to water pollution through the infiltration of fertilizers and pesticides into water bodies. Adopting water reuse strategies is crucial to sustain agricultural activities and mitigate these environmental impacts. Implementing water-efficient irrigation practices can greatly reduce water consumption in agriculture. Expanding irrigation water sources could also bring economic benefits to Romania. For instance, soybean production—a promising opportunity for Romanian farmers—requires significant water resources. This aligns with shifting dietary preferences across Europe, where the demand for meat alternatives is steadily rising.
Therefore, the findings of this study highlight the necessity for more targeted strategies to ensure the safe reuse of treated wastewater in agriculture. The approach proposed in this study provides a complex understanding of wastewater’s impact on surface water and its suitability for irrigation. This serves as a valuable tool that can be integrated into the decision-making process for sustainable water resource management, helping to mitigate environmental risks and optimize water reuse strategies. In the long term, by identifying risks associated with treated wastewater reuse, the research supports more efficient practices that promote sustainable water use in agriculture. Moreover, the widespread adoption of safe water reuse practices can significantly benefit water resources by promoting conservation and reducing reliance on freshwater for irrigation.
4. Conclusions
This study aimed to develop a comprehensive methodology to evaluate the impact of treated wastewater on receiving surface waters and assess its suitability for irrigation. In surface water, several samples exceeded the regulatory limits for turbidity, sodium (Na+), chloride (Cl−), nitrate (NO3−), sulfate (SO42−), and phosphate (PO43−), failing to meet the criteria for the highest water quality class. These exceptions were mainly observed in autumn, with most samples being collected downstream of the discharge point. These deviations suggest potential impacts from treated wastewater discharge. In contrast, parameters such as EC, TDS, K+, Ca2+, Mg2+ and HCO3− consistently remained within acceptable limits. Seasonal variations were evident, influenced by changes in river flow and anthropogenic inputs. The Water Quality Index (WQI) revealed the excellent overall quality of the surface water, with values below 50 at both upstream (WQI = 34) and downstream (WQI = 47) locations. However, the mean WQI value calculated downstream approached the threshold for the second quality class. The WQI used in this study follows the methodology established by previous research and has proven to be an effective tool for assessing overall water quality, integrating multiple parameters that influence this metric. By employing Principal Component Analysis (PCA) for parameter weighting, the study minimized subjectivity and biases, resulting in more reliable insights. Moreover, irrigation indices highlighted elevated sodium levels in the treated wastewater, with indices like Na% and KR classifying the water as unsuitable, posing risks to soil health and crop growth. These findings underscore the need for targeted management strategies to mitigate such risks and ensure the safe reuse of treated wastewater in agriculture.
This study developed a robust approach, integrating specific indices and statistical methods to provide a holistic and objective framework that offers a deeper understanding of wastewater’s impact. The proposed approach/framework offers a valuable tool that supports sustainable water resource management, a tool that can be integrated in the decision-making processes, guiding policymakers and stakeholders in optimizing wastewater treatment and reuse strategies.
Author Contributions
Conceptualization, I.A.; methodology, I.A., A.A. and C.R.; validation, I.P.; formal analysis, A.A. and C.R.; investigation, A.A. and I.A.; writing—original draft preparation, I.A., A.A. and I.P.; writing—review and editing, I.A., C.B. (Camelia Botezan) and C.B. (Călin Baciu); visualization, C.B. (Camelia Botezan) and M.O.; supervision, C.B. (Călin Baciu); funding acquisition, C.R. and M.O. All authors have read and agreed to the published version of the manuscript.
Funding
This research received no external funding.
Data Availability Statement
The data presented in this study are available on request from the corresponding author.
Conflicts of Interest
The authors declare no conflicts of interest.
References
- Okello, C.; Tomasello, B.; Greggio, N.; Wambiji, N.; Antonellini, M. Impact of Population Growth and Climate Change on the Freshwater Resources of Lamu Island, Kenya. Water 2015, 7, 1264–1290. [Google Scholar] [CrossRef]
- Rezapour, S.; Alamdari, P.; Kalavrouziotis, I.K. Response of Soil Health Index to Untreated Wastewater Irrigation in Selected Farms under Different Vegetable Types. Agric. Water Manag. 2023, 290, 108592. [Google Scholar] [CrossRef]
- Radini, S.; González-Camejo, J.; Andreola, C.; Eusebi, A.L.; Fatone, F. Risk Management and Digitalisation to Overcome Barriers for Safe Reuse of Urban Wastewater for Irrigation—A Review Based on European Practice. J. Water Process Eng. 2023, 53, 103690. [Google Scholar] [CrossRef]
- Wang, Z.; Li, X.; Xiang, S. Assessing de Facto Wastewater Reuse and Its Implications for Water Quality in Yangtze Basin (2014–2021). Heliyon 2024, 10, e40275. [Google Scholar] [CrossRef]
- Carvalho, A.R.; Pérez-Pereira, A.I.; Couto, C.M.C.; Tiritan, M.E.; Ribeiro, C.M.R. Assessment of Effluents Quality through Ecotoxicological Assays: Evaluation of Three Wastewater Treatment Plants with Different Technologies. Environ. Sci. Pollut. Res. 2022, 29, 963–976. [Google Scholar] [CrossRef]
- Foglia, A.; González-Camejo, J.; Radini, S.; Sgroi, M.; Li, K.; Eusebi, A.L.; Fatone, F. Transforming Wastewater Treatment Plants into Reclaimed Water Facilities in Water-Unbalanced Regions. An Overview of Possibilities and Recommendations Focusing on the Italian Case. J. Clean. Prod. 2023, 410, 137264. [Google Scholar] [CrossRef]
- Moretti, A.; Ivan, H.L.; Skvaril, J. A Review of the State-of-the-Art Wastewater Quality Characterization and Measurement Technologies. Is the Shift to Real-Time Monitoring Nowadays Feasible? J. Water Process Eng. 2024, 60, 105061. [Google Scholar] [CrossRef]
- Council of the European Communities. Council Directive of 21 May 1991 Concerning Urban Waste Water Treatment; Office for Official Publications of the European Communities: Luxembourg City, Luxembourg, 1991. [Google Scholar]
- HG 188 28/02/2002—Portal Legislativ. Available online: https://legislatie.just.ro/Public/DetaliiDocument/34651 (accessed on 21 November 2024).
- Romanian Parliament NTPA-001-2002. Available online: https://pierderideapa.wordpress.com/wp-content/uploads/2015/07/ntpa-001-28-02-2002.pdf (accessed on 21 November 2024).
- Romanian Parliament NTPA-002/2002. Available online: https://pierderideapa.wordpress.com/wp-content/uploads/2015/07/ntpa-002-28-02-2002.pdf (accessed on 21 November 2024).
- Romanian Parliament NTPA-011/2002. Available online: https://pierderideapa.wordpress.com/wp-content/uploads/2015/07/ntpa-011-28-02-2002.pdf (accessed on 21 November 2024).
- European Commission. Joint Research Centre. Minimum Quality Requirements for Water Reuse in Agricultural Irrigation and Aquifer Recharge: Towards a Water Reuse Regulatory Instrument at EU Level; Publications Office: Luxembourg City, Luxembourg, 2017. [Google Scholar]
- Truchado, P.; Gil, M.I.; López, C.; Garre, A.; López-Aragón, R.F.; Böhme, K.; Allende, A. New Standards at European Union Level on Water Reuse for Agricultural Irrigation: Are the Spanish Wastewater Treatment Plants Ready to Produce and Distribute Reclaimed Water within the Minimum Quality Requirements? Int. J. Food Microbiol. 2021, 356, 109352. [Google Scholar] [CrossRef]
- Regulation—2020/741—EN—EUR-Lex. Available online: https://eur-lex.europa.eu/eli/reg/2020/741/oj (accessed on 20 November 2024).
- Procházková, M.; Touš, M.; Horňák, D.; Miklas, V.; Vondra, M.; Máša, V. Industrial Wastewater in the Context of European Union Water Reuse Legislation and Goals. J. Clean. Prod. 2023, 426, 139037. [Google Scholar] [CrossRef]
- Romanian Parliament Ordonanta de Urgenta 52 31/05/2023. Available online: https://legislatie.just.ro/Public/DetaliiDocument/271163 (accessed on 21 November 2024).
- Sun, Y.; Chen, Z.; Wu, G.; Wu, Q.; Zhang, F.; Niu, Z.; Hu, H.-Y. Characteristics of Water Quality of Municipal Wastewater Treatment Plants in China: Implications for Resources Utilization and Management. J. Clean. Prod. 2016, 131, 1–9. [Google Scholar] [CrossRef]
- Horton, R.K. An Index Number System for Rating Water Quality. J. Water Pollut. Control Fed. 1965, 37, 300–306. [Google Scholar]
- Mukate, S.; Wagh, V.; Panaskar, D.; Jacobs, J.A.; Sawant, A. Development of New Integrated Water Quality Index (IWQI) Model to Evaluate the Drinking Suitability of Water. Ecol. Indic. 2019, 101, 348–354. [Google Scholar] [CrossRef]
- Sutadian, A.D.; Muttil, N.; Yilmaz, A.G.; Perera, B.J.C. Development of River Water Quality Indices—A Review. Environ. Monit. Assess. 2016, 188, 58. [Google Scholar] [CrossRef]
- Benaissa, M.; Gueroui, Y.; Guettaf, M.; Boudalia, S.; Bousbia, A.; Ouartsi, A.; Maoui, A. Hydrochemical Characterization and Evaluation of Irrigation Water Quality Using Indexing Approaches, Multivariate Analysis, and GIS Techniques in K’sob Valley, Algeria. J. Afr. Earth Sci. 2024, 219, 105385. [Google Scholar] [CrossRef]
- Pany, R.; Rath, A.; Swain, P.C. Water Quality Assessment for River Mahanadi of Odisha, India Using Statistical Techniques and Artificial Neural Networks. J. Clean. Prod. 2023, 417, 137713. [Google Scholar] [CrossRef]
- Mahanty, B.; Lhamo, P.; Sahoo, N.K. Inconsistency of PCA-Based Water Quality Index—Does It Reflect the Quality? Sci. Total Environ. 2023, 866, 161353. [Google Scholar] [CrossRef]
- Nnorom, I.C.; Ewuzie, U.; Eze, S.O. Multivariate Statistical Approach and Water Quality Assessment of Natural Springs and Other Drinking Water Sources in Southeastern Nigeria. Heliyon 2019, 5, e01123. [Google Scholar] [CrossRef]
- Sabinaya, S.; Mahanty, B.; Rout, P.R.; Raut, S.; Sahoo, S.K.; Jha, V.; Sahoo, N.K. Multi-Model Exploration of Groundwater Quality and Potential Health Risk Assessment in Jajpur District, Eastern India. Environ. Geochem. Health 2024, 46, 57. [Google Scholar] [CrossRef]
- Gad, M.; Elsayed, S.; Moghanm, F.S.; Almarshadi, M.H.; Alshammari, A.S.; Khedher, K.M.; Eid, E.M.; Hussein, H. Combining Water Quality Indices and Multivariate Modeling to Assess Surface Water Quality in the Northern Nile Delta, Egypt. Water 2020, 12, 2142. [Google Scholar] [CrossRef]
- Elsayed, S.; Ibrahim, H.; Hussein, H.; Elsherbiny, O.; Elmetwalli, A.H.; Moghanm, F.S.; Ghoneim, A.M.; Danish, S.; Datta, R.; Gad, M. Assessment of Water Quality in Lake Qaroun Using Ground-Based Remote Sensing Data and Artificial Neural Networks. Water 2021, 13, 3094. [Google Scholar] [CrossRef]
- Adilakshmi, A.; Venkatesan, V. Effective Monitoring of Noyyal River Surface Water Quality Using Remote Sensing and Machine Learning and GIS Techniques. Desalination Water Treat. 2024, 320, 100630. [Google Scholar] [CrossRef]
- Anyango, G.W.; Bhowmick, G.D.; Sahoo Bhattacharya, N. A Critical Review of Irrigation Water Quality Index and Water Quality Management Practices in Micro-Irrigation for Efficient Policy Making. Desalination Water Treat. 2024, 318, 100304. [Google Scholar] [CrossRef]
- Hassan, H.B.; Moniruzzaman, M.; Majumder, R.K.; Ahmed, F.; Bhuiyan, M.A.Q.; Ahsan, M.A.; Al-Asad, H. Impacts of Seasonal Variations and Wastewater Discharge on River Quality and Associated Human Health Risks: A Case of Northwest Dhaka, Bangladesh. Heliyon 2023, 9, e18171. [Google Scholar] [CrossRef]
- Hayeri Yazdi, S.; Robati, M.; Samani, S.; Zamani Hargalani, F. Assessing the Sustainability of Groundwater Quality for Irrigation Purposes Using a Fuzzy Logic Approach. Environ. Sustain. Indic. 2024, 22, 100342. [Google Scholar] [CrossRef]
- Salem, S.; Gaagai, A.; Ben Slimene, I.; Moussa, A.; Zouari, K.; Yadav, K.; Eid, M.; Abukhadra, M.; El-Sherbeeny, A.; Gad, M.; et al. Applying Multivariate Analysis and Machine Learning Approaches to Evaluating Groundwater Quality on the Kairouan Plain, Tunisia. Water 2023, 15, 3495. [Google Scholar] [CrossRef]
- Gad, M.; Saleh, A.H.; Hussein, H.; Elsayed, S.; Farouk, M. Water Quality Evaluation and Prediction Using Irrigation Indices, Artificial Neural Networks, and Partial Least Square Regression Models for the Nile River, Egypt. Water 2023, 15, 2244. [Google Scholar] [CrossRef]
- Elsayed, S.; Hussein, H.; Moghanm, F.S.; Khedher, K.M.; Eid, E.M.; Gad, M. Application of Irrigation Water Quality Indices and Multivariate Statistical Techniques for Surface Water Quality Assessments in the Northern Nile Delta, Egypt. Water 2020, 12, 3300. [Google Scholar] [CrossRef]
- Mishra, S.; Kumar, R.; Kumar, M. Use of Treated Sewage or Wastewater as an Irrigation Water for Agricultural Purposes- Environmental, Health, and Economic Impacts. Total Environ. Res. Themes 2023, 6, 100051. [Google Scholar] [CrossRef]
- Hosney, H.; Tawfik, M.H.; Duker, A.; Van Der Steen, P. Prospects for Treated Wastewater Reuse in Agriculture in Low- and Middle-Income Countries: Systematic Analysis and Decision-Making Trees for Diverse Management Approaches. Environ. Dev. 2023, 46, 100849. [Google Scholar] [CrossRef]
- INSSE—Baze de Date Statistice—TEMPO-Online Serii de Timp. Available online: http://statistici.insse.ro/shop/ (accessed on 20 November 2024).
- Ministry of Environment, Waters and Forests, Romania. Flood Risk Management Plan—Mures; Ministry of Environment, Waters and Forests: Bucharest, Romania, 2023. [Google Scholar]
- Sebes Municipality. Integrated Urban Development Strategy 2021–2030; Sebes Municipality: Sebes, Romania, 2022. [Google Scholar]
- ISO 5667-1:2023; Water Quality—Sampling—Part 1: Guidance on the Design of Sampling Programmes and Sampling Techniques. International Organization for Standardization: Geneva, Switzerland, 2023.
- ISO 5667-3:2024; Water Quality—Sampling—Part 3: Preservation and Handling of Water Samples. International Organization for Standardization: Geneva, Switzerland, 2024.
- ISO 5667-6:2014; Water Quality—Sampling—Part 6: Guidance on Sampling of Rivers and Streams. International Organization for Standardization: Geneva, Switzerland, 2014.
- Romanian Parliament Ordin 161 16/02/2006. Available online: https://legislatie.just.ro/Public/DetaliiDocument/72574 (accessed on 21 November 2024).
- World Health Organization. WHO Guidelines for Drinking-Water Quality: First Addendum to the Fourth Edition; World Health Organization: Geneva, Switzerland, 2017. [Google Scholar]
- World Health Organization. WHO Guidelines for Drinking-Water Quality: Incorporating the First and Second Addenda; World Health Organization: Geneva, Switzerland, 2022; ISBN 92-4-004506-6. [Google Scholar]
- World Health Organization. WHO Guidelines for Drinking-Water Quality: Small Water Supplies; World Health Organization: Geneva, Switzerland, 2024; p. 220. [Google Scholar]
- U.S. Environmental Protection Agency. 2018 Edition of the Drinking Water Standards and Health Advisories Tables; US Environmental Protection Agency: Washington, DC, USA, 2018. [Google Scholar]
- Arabzadeh, M.; Eslamidoost, Z.; Rajabi, S.; Hashemi, H.; Aboulfotoh, A.; Rosti, F.; Nazari, F.; Pouladi Borj, B.; Hajivand, M. Wastewater Quality Index (WWQI) as an Indicator for the Assessment of Sanitary Effluents from the Oil and Gas Industries for Reliable and Sustainable Water Reuse. Groundw. Sustain. Dev. 2023, 23, 101015. [Google Scholar] [CrossRef]
- Lumb, A.; Sharma, T.C.; Bibeault, J.-F. A Review of Genesis and Evolution of Water Quality Index (WQI) and Some Future Directions. Water Qual. Expo. Health 2011, 3, 11–24. [Google Scholar] [CrossRef]
- Thirumoorthy, P.; Velusamy, S.; Nallasamy, J.L.; Shanmugamoorthy, M.; Sudalaimuthu, G.; Veerasamy, S.; Periyasamy, M.; Murugasamy, M.V. Evaluation of Groundwater Quality for Irrigation Purposes in Hard Rock Terrain of Southern India Using Water Quality Indices Modelling. Desalination Water Treat. 2024, 318, 100397. [Google Scholar] [CrossRef]
- Benkov, I.; Varbanov, M.; Venelinov, T.; Tsakovski, S. Principal Component Analysis and the Water Quality Index—A Powerful Tool for Surface Water Quality Assessment: A Case Study on Struma River Catchment, Bulgaria. Water 2023, 15, 1961. [Google Scholar] [CrossRef]
- Ajtai, I.; Ștefănie, H.; Maloș, C.; Botezan, C.; Radovici, A.; Bizău-Cârstea, M.; Baciu, C. Mapping Social Vulnerability to Floods. A Comprehensive Framework Using a Vulnerability Index Approach and PCA Analysis. Ecol. Indic. 2023, 154, 110838. [Google Scholar] [CrossRef]
- Nath Roy, B.; Roy, H.; Rahman, K.S.; Mahmud, F.; Bhuiyan, M.M.K.; Hasan, M.; Bhuiyan, A.-A.K.; Hasan, M.; Mahbub, M.S.; Jahedi, R.M.; et al. Principal Component Analysis Incorporated Water Quality Index Modeling for Dhaka-Based Rivers. City Environ. Interact. 2024, 23, 100150. [Google Scholar] [CrossRef]
- OECD; European Union; Joint Research Centre—European Commission. Handbook on Constructing Composite Indicators: Methodology and User Guide; OECD: Paris, France, 2008; ISBN 978-92-64-04345-9. [Google Scholar]
- Naik, M.R.; Mahanty, B.; Sahoo, S.K.; Jha, V.N.; Sahoo, N.K. Assessment of Groundwater Geochemistry Using Multivariate Water Quality Index and Potential Health Risk in Industrial Belt of Central Odisha, India. Environ. Pollut. 2022, 303, 119161. [Google Scholar] [CrossRef]
- Uddin, M.G.; Nash, S.; Olbert, A.I. A Review of Water Quality Index Models and Their Use for Assessing Surface Water Quality. Ecol. Indic. 2021, 122, 107218. [Google Scholar] [CrossRef]
- Sahu, P.; Sikdar, P.K. Hydrochemical Framework of the Aquifer in and around East Kolkata Wetlands, West Bengal, India. Environ. Geol. 2008, 55, 823–835. [Google Scholar] [CrossRef]
- Anuja, S.A.; Kavitha, P.; Jothi, C.H.; Rose, R.J. Seasonal Assessment of Water Quality for Irrigation Using Multiple Indices in Thamirabarani River, Kanyakumari District, India. Desalination Water Treat. 2024, 317, 100206. [Google Scholar] [CrossRef]
- Piper, A.M. A Graphic Procedure in the Geochemical Interpretation of Water-analyses. Eos Trans. Am. Geophys. Union. 1944, 25, 914–928. [Google Scholar] [CrossRef]
- Zakir, H.M.; Sharmin, S.; Akter, A.; Rahman, M.S. Assessment of Health Risk of Heavy Metals and Water Quality Indices for Irrigation and Drinking Suitability of Waters: A Case Study of Jamalpur Sadar Area, Bangladesh. Environ. Adv. 2020, 2, 100005. [Google Scholar] [CrossRef]
- Fahimah, N.; Salami, I.R.S.; Oginawati, K.; Thaher, Y.N. Variations of Groundwater Turbidity in the Bandung Regency, Indonesia: From Community-Used Water Quality Monitoring Data. HydroResearch 2023, 6, 216–227. [Google Scholar] [CrossRef]
- Park, W.; Jeong, S.; Im, S.-J.; Jang, A. High Turbidity Water Treatment by Ceramic Microfiltration Membrane: Fouling Identification and Process Optimization. Environ. Technol. Innov. 2020, 17, 100578. [Google Scholar] [CrossRef]
- Chahal, C.; Van Den Akker, B.; Young, F.; Franco, C.; Blackbeard, J.; Monis, P. Pathogen and Particle Associations in Wastewater. In Advances in Applied Microbiology; Elsevier: Amsterdam, The Netherlands, 2016; Volume 97, pp. 63–119. ISBN 978-0-12-804816-0. [Google Scholar]
- Bendicho, C.; Lavilla, I. Water Analysis|Sewage; Elsevier: Oxford, UK, 2019. [Google Scholar]
- Glińska-Lewczuk, K.; Glińska-Lewczuk, K.; Cymes, I. The Use of Water Quality Indices (WQI and SAR) for Multipurpose Assessment of Water in Dam Reservoirs. J. Elem. 2016, 21, 1211–1224. [Google Scholar] [CrossRef]
- Richards, L.A. Diagnosis and Improvement Of. Saline Alkali Soils Handb. 1954, 60, 129–134. [Google Scholar]
- Das, S.; Nag, S.K. Deciphering Groundwater Quality for Irrigation and Domestic Purposes—A Case Study in Suri I and II Blocks, Birbhum District, West Bengal, India. J. Earth Syst. Sci. 2015, 124, 965–992. [Google Scholar] [CrossRef]
- Al-Ruwaih, F.; Mohammad, R.; Mohideen, S. Assessment of Groundwater Quality of Al-Shagaya Area (Kuwait) for Irrigation and Industrial Purposes Using Water Quality Index and GIS Techniques. Kuwait J. Sci. 2025, 52, 100334. [Google Scholar] [CrossRef]
- Ghosh, A.; Bera, B. Hydrogeochemical Assessment of Groundwater Quality for Drinking and Irrigation Applying Groundwater Quality Index (GWQI) and Irrigation Water Quality Index (IWQI). Groundw. Sustain. Dev. 2023, 22, 100958. [Google Scholar] [CrossRef]
- Eaton, F.M. Significance of Carbonates in Irrigation Waters. Soil. Sci. 1950, 69, 123–134. [Google Scholar] [CrossRef]
- Wilcox, L. Classification and Use of Irrigation Waters; US Department of Agriculture: Washington, DC, USA, 1955. [Google Scholar]
- Kelley, W.P. Use of Saline Irrigation Water. Soil Sci. 1963, 95, 385–391. [Google Scholar] [CrossRef]
- Vigh, M.; Pandi, G. The Influence of the Hydro-Technical System on the Water Flow of the Sebeș River; Cluj University Press: Cluj-Napoca, Romania, 2023; pp. 130–139. [Google Scholar]
- NTPA-001-Din-2002; Normativul-Privind-Stabilirea-Limitelor-de-Încărcare-Cu-Poluanţi-a-Apelor-Uzate-Industriale-Şi-Urbane-La-Evacuarea-În-Receptorii-Naturali. Romanian Government: Bucharest, Romania, 2002.
- Mohamed, N.A.; Wachemo, A.C.; Karuppannan, S.; Duraisamy, K. Spatio-Temporal Variation of Groundwater Hydrochemistry and Suitability for Drinking and Irrigation in Arba Minch Town, Ethiopia: An Integrated Approach Using Water Quality Index, Multivariate Statistics, and GIS. Urban Clim. 2022, 46, 101338. [Google Scholar] [CrossRef]
- Kumar Ravi, N.; Kumar Jha, P.; Varma, K.; Tripathi, P.; Kumar Gautam, S.; Ram, K.; Kumar, M.; Tripathi, V. Application of Water Quality Index (WQI) and Statistical Techniques to Assess Water Quality for Drinking, Irrigation, and Industrial Purposes of the Ghaghara River, India. Total Environ. Res. Themes 2023, 6, 100049. [Google Scholar] [CrossRef]
- Xu, P.; Feng, W.; Qian, H.; Zhang, Q. Hydrogeochemical Characterization and Irrigation Quality Assessment of Shallow Groundwater in the Central-Western Guanzhong Basin, China. Int. J. Environ. Res. Public Health 2019, 16, 1492. [Google Scholar] [CrossRef]
- Ayers, R.S.; Westcot, D.W. Water Quality for Agriculture; Food and agriculture organization of the United Nations Rome: Rome, Italy, 1985; Volume 29, ISBN 92-5-102263-1. [Google Scholar]
- Bhatti, E.-H.; Khan, M.M.; Shah, S.A.R.; Raza, S.S.; Shoaib, M.; Adnan, M. Dynamics of Water Quality: Impact Assessment Process for Water Resource Management. Processes 2019, 7, 102. [Google Scholar] [CrossRef]
- Shil, S.; Singh, U.K.; Mehta, P. Water Quality Assessment of a Tropical River Using Water Quality Index (WQI), Multivariate Statistical Techniques and GIS. Appl. Water Sci. 2019, 9, 168. [Google Scholar] [CrossRef]
- Moussaoui, T.; Derdour, A.; Hosni, A.; Ballesta-de Los Santos, M.; Legua, P.; Pardo-Picazo, M.Á. Assessing the Quality of Treated Wastewater for Irrigation: A Case Study of Ain Sefra Wastewater Treatment Plant. Sustainability 2023, 15, 11133. [Google Scholar] [CrossRef]
- Benaafi, M.; Pradipta, A.; Tawabini, B.; Al-Areeq, A.M.; Bafaqeer, A.; Humphrey, J.D.; Nazal, M.K.; Aljundi, I.H. Suitability of Treated Wastewater for Irrigation and Its Impact on Groundwater Resources in Arid Coastal Regions: Insights for Water Resources Sustainability. Heliyon 2024, 10, e29320. [Google Scholar] [CrossRef]
- Simhayov, R.; Ohana-Levi, N.; Shenker, M.; Netzer, Y. Effect of Long-Term Treated Wastewater Irrigation on Soil Sodium Levels and Table Grapevines’ Health. Agric. Water Manag. 2023, 275, 108002. [Google Scholar] [CrossRef]
- European Court of Auditors. Sustainable Water Use in Agriculture; Publications Office of the European Union: Luxembourg City, Luxembourg, 2021. [Google Scholar]
- Ministry of Agriculture and Rural Development. CAP Plan 2023–2027 for Romania; Ministry of Agriculture and Rural Development: Bucharest, Romania, 2022. [Google Scholar]
Disclaimer/Publisher’s Note: The statements, opinions and data contained in all publications are solely those of the individual author(s) and contributor(s) and not of MDPI and/or the editor(s). MDPI and/or the editor(s) disclaim responsibility for any injury to people or property resulting from any ideas, methods, instructions or products referred to in the content. |
© 2025 by the authors. Licensee MDPI, Basel, Switzerland. This article is an open access article distributed under the terms and conditions of the Creative Commons Attribution (CC BY) license (https://creativecommons.org/licenses/by/4.0/).