Article

Exploration of Microbially Induced Carbonate Precipitation Technology for the Protection of Soil on Agricultural Drainage Ditch Slopes

1
College of Agricultural Science and Engineering, Hohai University, Nanjing 210098, China
2
State Key Laboratory of Efficient Utilization of Agricultural Water Resources, China Agricultural University, Beijing 100083, China
3
Shanghai Water Engineering Design and Research Institute Co., Ltd., Shanghai 200061, China
4
The National Key Laboratory of Water Disaster Prevention, Hohai Unversity, Nanjing 210098, China
5
Nanjing Zhishui Agricultural Technology Academy Co., Ltd., Nanjing 210049, China
*
Author to whom correspondence should be addressed.
Water 2025, 17(13), 2010; https://doi.org/10.3390/w17132010
Submission received: 9 May 2025 / Revised: 18 June 2025 / Accepted: 19 June 2025 / Published: 4 July 2025
(This article belongs to the Section Water, Agriculture and Aquaculture)

Abstract

Microbially induced carbonate precipitation (MICP) offers an eco-friendly approach to stabilize porous materials. This study evaluates its feasibility for protecting agricultural drainage ditch slopes through laboratory tests. Liquid experiments assessed calcium carbonate (CaCO3) precipitation rates under varying bacteria–cementation solution ratios (BCR), cementation solution concentrations (1–2 mol/L), and urease inhibitor (NBPT) contents (0–0.3%). Soil experiments further analyzed the effects of solidified layer thickness (4 cm vs. 8 cm) and curing cycles on soil stabilization. The results showed that CaCO3 precipitation peaked at a BCR of 4:5 and declined when NBPT exceeded 0.1%. Optimal parameters (0.1% NBPT, 1 mol/L cementation solution, BCR 4:5) were applied to soil tests, revealing that multi-cycle treatments enhanced soil water retention and CaCO3 content (up to 7.6%) and reduced disintegration rates (by 70%) and permeability (by 83%). A 4 cm solidified layer achieved higher Ca2+ utilization, while an 8 cm layer matched or exceeded 4 cm performance with shorter curing. Calcite crystals dominated CaCO3 formation. Crucially, reagent dosage should approximate four times the target layer’s requirement to ensure efficacy. These findings demonstrate that MICP, when optimized, effectively stabilizes ditch slopes using minimal reagents, providing a sustainable strategy for agricultural soil conservation.

1. Introduction

Drainage ditches are widely distributed in farming areas [1]. Stone revetment, mortar stone revetment, prefabricated concrete interlocking blocks, and grass-covered slopes are traditional slope protection technologies for farmland drainage ditches [2]. However, the protective materials involved in these traditional technologies have low ecological benefits [3]. Specifically, large amounts of heavy metal ions, dust, or greenhouse gases are produced during the production of cement and other solidified agents used to prepare concrete, which can cause problems such as soil pollution, harm human health, destroy the balance of ecosystems, and exacerbate the greenhouse effect [4]. Otherwise, the process for the production of prefabricated interlocking concrete blocks is relatively complex [5]. The construction of grass-covered protection slopes is relatively simple, but the water passage capacity of ditches is reduced, and desilting is needed with vegetation overgrowth. Therefore, it is necessary to develop a simple, efficient, and environmentally friendly slope protection technology for farmland drainage ditches.
Ecological protection materials and methods, e.g., solidification technology, can be used to markedly improve slope protection performance without threatening the environment [3]. Microbially induced carbonate precipitation (MICP), a biochemical solidification technology, has emerged as a significant process in the domains of energy conservation, environmental protection, and sustainable ecology, with rapid advances in recent years [6]. In MICP, the metabolic action of microbes is used for inorganic mineral precipitation (calcite/calcium carbonate; CaCO3) to strengthen porous materials, thereby enhancing the structural integrity of these materials [7]. The major biochemical mechanism involved in MICP is the formation of calcite minerals by ureolytic bacteria (alkaliphilic urease-producing microorganisms) in the presence of urea and calcium compounds [8]. Thus, MICP can be considered an alternative and sustainable approach for the protection of slopes in agricultural drainage ditches.
Biochemical consolidation via MICP is a relatively mature technology in the fields of construction material production [9,10,11], concrete crack repair [12,13], soil conservation [10,14,15,16,17], wastewater remediation [18,19], etc. The solidification reaction in the MICP process is a biochemical reaction, and the urease-producing microorganism involved in this process, Bacillus pasteurii, is a nonpathogenic aerobic bacterium that is ubiquitous in nature [20]. Bacillus pasteurii can maintain strong biological activity under harsh conditions such as acidic, alkaline, and high-salinity conditions. CaCl2 is usually used as the calcium source in MICP technology because it is economical and the yield of CaCO3 precipitates is high. Therefore, the urease produced by microbes can be used to hydrolyze urea, and the carbonate ions formed can react with CaCl2 to precipitate CaCO3, which can ultimately bind and solidify the sloped soils of farmland drainage ditches. Thus, the MICP process is simple, fast, efficient, and environmentally friendly with a clearly demonstrated mechanism, and it can be applied for protecting slopes in drainage ditches.
The MICP process is governed by multiple factors, such as the identity of the microorganisms involved, calcium and carbonate ion concentrations, nucleation sites, level of urease activity, pH, temperature, and reaction kinetics [21]. At present, most studies on MICP reagent formulations have been focused on reagent concentrations, whereas few studies have focused on the ratio of each component [22]. The effects of multiple curing cycles on soil consolidation have been studied [23], but few studies have investigated the actual solid layer thickness and identified optimal curing methods during the MICP process. To apply MICP for protecting slopes in agricultural drainage ditches, it is necessary to consider the ratios of both inducers and calcium ion solutions. Moreover, the processes of solidification should be investigated.
The biochemical reaction that occurs during the MICP process is relatively rapid [24]. If the inducer and cementation solutions are directly sprayed on a soil surface, the precipitated CaCO3 may quickly block the pores on the soil surface and thereby impede subsequent reactions [25]; thus, the processes of solidification cannot be investigated. Therefore, the use of a urease inhibitor is crucial in this study. Urease inhibitors can be used to control MICP processes to reduce the decomposition rate of urea and ultimately improve the uniformity of distribution of the precipitated CaCO3 in soils [26,27,28]. N-butyl thiophosphoric triamide (NBPT) is a urease inhibitor widely used in agriculture and forestry that does not have a negative effect on the environment [29,30]. Therefore, NBPT had been considered for inclusion as a reagent in the MICP process to protect agricultural drainage ditch slopes.
Hence, the main objective of this study is to explore the feasibility of using MICP technology for slope protection in agricultural drainage ditches. On the basis of laboratory tests, the properties of MICP reagent formulations, such as the bacterial–cementation solution ratio, cementation solution concentration, urease inhibitor carrier solvent type, and urease inhibitor content, were evaluated in this study. Using the optimal MICP reagent formula, the influences of the planned solid layer thickness and number of curing cycles on CaCO3 yield, soil mechanical properties, surface soil cracks, and soil microstructure were investigated. On the basis of these results, the optimal MICP reagent formulation, planned solid layer thickness, and number of curing cycles were predicted. This study is novel in that it demonstrates the feasibility of using MICP to replace traditional slope protection methods as an environmentally friendly technology in agricultural drainage ditches.

2. Materials and Methods

2.1. Materials

2.1.1. Liquid Materials

MICP is a technique in which the metabolic action of microorganisms is used to produce carbonate ions (CO32−) [31], which combine with free calcium ions (Ca2+) to form calcium carbonate (CaCO3) precipitates. The hydrolysis of urea (CO(NH2)2) produces ammonium ions (NH4+) and carbonate ions (CO32) [32], which form CaCO3 precipitates as follows:
CO ( NH 2 ) 2 + 2 H 2 O Urease 2 NH 4 + + CO 3 2
Cell Ca 2 + + CO 3 2 Cell CaCO 3
There were three main types of liquid materials used in the MICP test in this study: bacterial solutions, urease inhibitors, and cementation solutions. The bacterial solution consisted of Bacillus pasteurii, which was used to induce urea hydrolysis [33]. Urease inhibitors are mainly used to slow the hydrolysis rate of urea [34] to decrease CaCO3 precipitation and increase reagent infiltration, thereby increasing the thickness of the consolidated soil layer. The cementation solution was mainly used to provide CO32− and Ca2+ for CaCO3 precipitation during MICP.
Specifically, the Bacillus pasteurii solution used was a Sporosarcina pasteurii solution (ATCC 11859) that was purchased from the Shanghai Preservation Biotechnology Center (SHBCC). It had an OD600 within the range of 0.65~1.01 and urease activity with the range of 9.17~12.54. The urease inhibitor was N-butyl thiophosphoric triamide (NBPT), a white powder with a solubility of 4.3 g/L at 25 °C, which was purchased from Zhengzhou Shenyu Chemical Factory, Zhengzhou, China. The cementation solution was a mixture of urea (CH4N2O) and calcium chloride (CaCl2), in which the molar ratio of urea to CaCl2 was 1:1, which was purchased from Shanghai Yuanye Biotechnology Co., Ltd., Shanghai, China.

2.1.2. Soil Materials

The soils used in the MICP tests were taken from the slope of a drainage ditch with a normal water level in the Water-saving Park Facility Agriculture and Environment Test Field of Hohai University, Nanjing, Jiangsu Province, China (31°54′ N, 118°46′ E). The soil pH was 6.0, the bulk density was 1.47 g/cm3, the soil porosity was 45.44%, and the field capacity was 23.68%. The soil texture was silty loam, and particles of size 0.05~1 mm accounted for 1.12%; those of size 0.01~0.05 mm accounted for 41.89%; those of size 0.001~0.01 mm accounted for 47.6%; and those <0.001 mm accounted for 9.39%.
This type of soil was selected for study due to its widespread distribution in farmland drainage ditch areas and typical physical and chemical properties, which can represent the common soil types encountered in practical engineering applications. The particle composition, pore structure, and permeability of this soil make it an ideal subject for the application of MICP technology, as these characteristics reflect the true effectiveness of applying MICP technology for slope protection.

2.2. Testing Methods

2.2.1. Liquid Tests for the Determination of Reagent Formulations

The liquid tests were conducted in several 100 mL beakers with the aim of obtaining the optimal reagent formulations for the MICP process, including the ratio of bacterial solution to cementation solution (bacteria–cementation ratio), the concentration of cementation solution, the carrier solvent for the urease inhibitor, and the content of the urease inhibitor. In each liquid test, the content of CaCO3 precipitated via MICP was determined via acid washing after 24 h of mixing the reagent solutions. The CaCO3 production rate was defined as the ratio of the precipitated CaCO3 content to the theoretical CaCO3 content. The best treatment was obtained by comparing the CaCO3 precipitate yield in each test.
Bacteria–Cementation Ratio
There were eight treatments with different bacteria–cementation ratios in this test, with temperatures ranging from 27.1 °C to 29.8 °C. Specifically, the volume ratios of the bacterial solution to the cementation solution were 1:5, 2:5, 3:5, 4:5, 1:1, 6:5, 7:5, and 8:5. For each treatment, the volume of bacterial solution was 20 mL, with 0.84 OD600 and 12.54 mM urea hydrolysed/min urease activity. The volume of cementation solution was changed according to the bacteria–cementation ratio, with the concentration of the solution set to 1 mol/L. The bacteria–cementation ratio in the treatment with the highest CaCO3 production rate was selected as the optimal bacteria–cementation ratio for the formulation and was used in the subsequent tests.
Cementation Solution Concentration
On the basis of the optimal bacteria-cementation ratio obtained from the bacteria–cementation ratio exploration tests, different concentrations of the cementation solution (i.e., 0 mol/L, 0.5 mol/L, 1 mol/L, 1.5 mol/L, 2.0 mol/L, 2.5 mol/L, 3 mol/L, and 5 mol/L) were used in these tests, and the CaCO3 precipitate yield was analysed. In this test, the OD600 of the bacterial solution was 0.65, and the urease activity was 9.17 mM urea hydrolyzed/min. The volume of the bacterial solution was 20 mL, and the temperature was kept at 28.2 °C to 30.2 °C. The concentration of the cementation solution in the treatment with the highest CaCO3 production rate was selected as the optimal cementation solution concentration for the formulation and was used in the subsequent tests.
Urease Inhibitor Carrier Solvent and Urease Inhibitor Content
On the basis of the optimal bacteria–cementation ratio and cementation solution concentration, the CaCO3 precipitation yields of MICP mixtures with different urease inhibitor carrier solvents and contents were analyzed through liquid tests. The temperature during tests was kept between 26.9 °C and 29.6 °C, in which the bacterial solution volume was 20 mL, with 0.78 OD600 and 10.34 mM urea hydrolyzed/min urease activity. The bacterial solution and cementation solution were selected as the two kinds of urease carrier solvents [35]. The mass concentrations of the 10 urease inhibitors were set from 0% to 5%, at 0%, 0.025%, 0.05%, 0.1%, 0.25%, 0.5%, 0.75%, 1.0%, 3.0%, and 5.0%. Each treatment had three replicates. The urease inhibitor carrier solvent and urease inhibitor content in the treatment with the highest CaCO3 production rate were selected as the optimal urease inhibitor carrier solvent and urease inhibitor content for the formulation and were used in the subsequent tests.

2.2.2. Soil Tests for the Determination of Planned Solid Layer Thickness and Number of Curing Cycles

Test Design
The planned solid layer thickness refers to the anticipated depth to which the CaCO3 precipitation layer forms in the soil through the MICP process. The optimal MICP reagent formulations obtained from the above tests (Section 2.2.1) were used in this test to explore the influence of different planned solid layer thicknesses and the number of curing cycles on soil consolidation to clarify the actual thickness of the solid layer that could be formed at different reagent dosages and under various solidification processes to provide a basis for the application of MICP to protect the soil on drainage ditch slopes.
This test was conducted in several transparent acrylic boxes with sizes of 12 cm × 12 cm × 12 cm. At the bottom of each soil box, nine holes with a diameter of 4 mm were evenly drilled, and a filter geotextile was laid to prevent leakage of soil particles. The height of the soil was 8 cm, with a volumetric water content of 17% and a bulk density of 1.47 g/cm3. In this test, the OD600 of the bacterial mixture was 1.01, and the urease activity was 10.71 mM urea hydrolyzed/min. During the test, the indoor temperature ranged from 25.9 °C to 31.4 °C.
According to the general thickness of grass blocks used in the ecological drainage ditches, the planned solid layer thickness (planned wetting layer depth) in this test was set to 4 cm and 8 cm, and the number of curing cycles was set to 7. Additionally, after 7 days, samples were collected after one, two, four, and seven curing cycles. One round of curing consisted of one round of bacterial and cementation solution spraying; the interval between each round of spraying was 6 h, and each curing cycle was 42 h. The soil water content, CaCO3 precipitates, soil mechanical properties, surface soil cracks, and soil microstructure were determined in this test.
Sample Selection and Measurement
During the experimental processes, the exudate from the bottom of each box was collected, and the utilization rate of Ca2+ was calculated in the exudate. The CaCO3 content and water content of different soil layers (i.e., 0~2 cm, 2~5 cm, and 5~8 cm) were measured via the acid-washing method and oven-drying method [36], respectively. The soil penetration resistance was measured by a mini-penetrometer (TT-MP1) at each soil point, which reached a depth of 10 mm with an accuracy of 100 kPa.
The disintegration ratio (DR, %) quantifies the proportion of soil sample disintegrated at time t [37] and was calculated as follows:
D R = R t R 0 100 R 0 × 100 %
where R0 is the initial value at the water surface at the buoy, cm; and Rt is the value at the water surface at the buoy at time t, cm.
The soil permeability coefficient was determined by Darcy’s formula. Images of the cracks in the soil surface were obtained by a digital camera. The microstructures of the samples were observed with a Hitachi SU800 scanning electron microscope (SEM), Santa Clara, CA, USA. The identity of CaCO3 crystals was determined by X-ray diffraction (XRD) with a TIR-III X-ray diffractometer (Rigaku Smartlab, Houston, TX, USA).

2.2.3. Statistical Analysis

All experimental data are presented as the means ± standard deviations (Mean ± SDs). One-way ANOVA was used for statistical analysis of different groups, and a value of p < 0.05 was considered to indicate statistical significance. If ANOVA indicated significant differences, Tukey’s HSD test was further applied for multiple comparisons to evaluate the differences between specific groups. All statistical analyses were performed using SPSS 26.0 software (IBM, Armonk, NY, USA).

3. Results

3.1. Effect of Reagent Formula on CaCO3 Precipitation

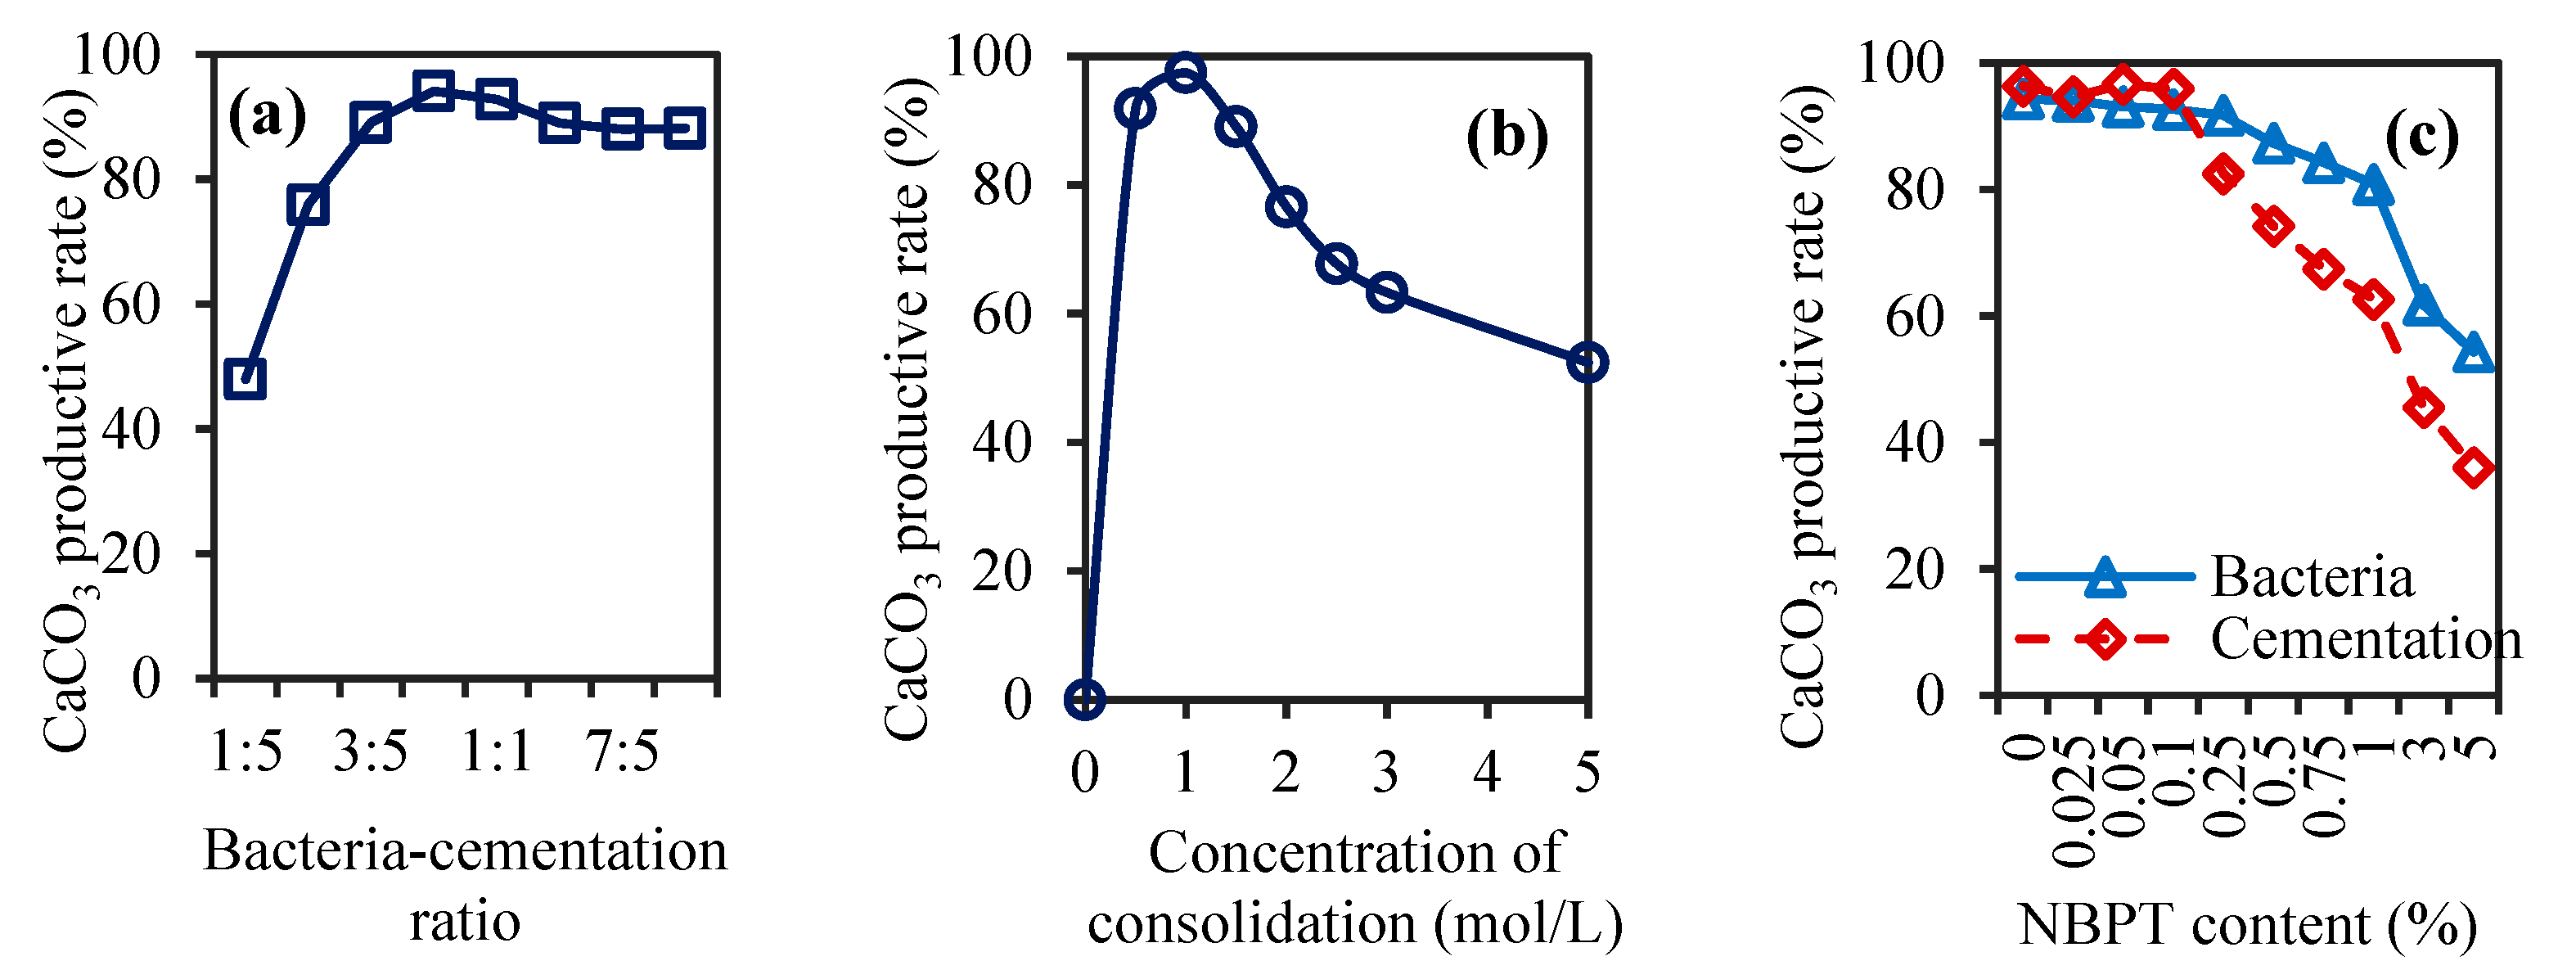
3.1.1. Effect of Bacteria-Cementation Ratio on CaCO3 Yield

To evaluate how the reagent dosage and the number of curing cycles affected soil consolidation, we first analyzed the effect of the bacteria-cementation ratio on CaCO3 yield. The CaCO3 production rates under different bacteria-cementation ratios are shown in Figure 1a. The CaCO3 production rate increased with increasing bacteria-cementation ratio when the ratio was lower than 4:5. Above this value, the CaCO3 production rate decreased with increasing bacteria-cementation ratio. The highest CaCO3 production rate was 94.11% at a 4:5 bacteria-cementation ratio. The results indicated that the amount of bacterial solution sprayed was not enough for the complete utilization of the Ca2+ in the cementation solution when the bacteria-cementation ratio was less than 4:5. However, when the bacteria-cementation ratio was very high, the actual amount of CaCO3 precipitated did not reach the theoretically predicted amount [38]. As the ratio of 4:5 resulted in the highest CaCO3 production rate, 4:5 was selected as the suitable bacteria-cementation ratio for use in the subsequent tests.

3.1.2. Effects of Cementation Solution Concentration on CaCO3 Yield

Different concentrations of cementation solution may affect biochemical reactions in different ways. High concentrations of cementation solution provide more urea and Ca2+ for the biochemical consolidation reaction, but some studies have shown that cementation solutions applied at too high of a concentration may not be conducive to the biochemical consolidation reaction [39]. Thus, an appropriate concentration of cementation solution can maximize the use of microorganisms without affecting the yield of CaCO3. Figure 1b shows the results of the CaCO3 production rate under different cementation solution concentrations at a 4:5 bacteria-cementation ratio. With increasing cementation solution concentration, the CaCO3 production rate first increased but then decreased. The highest yield of the CaCO3 production rate reached 97.42% when the concentration of cementation solution was 1 mol/L. When the cementation concentration was 0.5 mol/L and 1.5 mol/L, the CaCO3 production rates were 91.83% and 89.03%, respectively, and did not significantly differ from the rate of CaCO3 precipitation when the concentration of the cementation solution was 1 mol/L. When the cementation solution concentration was greater than 1.5 mol/L, the amount of CaCO3 precipitated decreased rapidly with increasing cementation solution concentration. Zhang et al. observed a similar phenomenon in their study, where high concentrations of the cementation solution inhibited microbial activity, thereby reducing the efficiency of calcium carbonate precipitation [13]. The above analysis revealed that the concentration of the cementation solution should not exceed 1.5 mol/L because an excessive Ca2+ concentration in the cementation solution can inhibit the activity of urease produced by microorganisms, reduce the hydrolysis of urea, and ultimately reduce the CaCO3 yield [40]. To maximize the use of microorganisms and the cementation solution and achieve the best yield of CaCO3 after the biochemical reaction, a cementation solution with a concentration of 1 mol/L was used in the subsequent tests.

3.1.3. Effects of NBPT on CaCO3 Yield

The concentration of NBPT affects the rate of the biochemical reaction, and controlling the rate of the biochemical reaction can improve the uniformity of the solidified soil to a certain extent. NBPT retards urea hydrolysis by inhibiting urease activity, thereby controlling the rate of CaCO3 precipitate. Figure 1c shows the effect of NBPT on the CaCO3 yield. When the NBPT content exceeded 0.1%, the CaCO3 yield decreased with increasing NBPT content. NBPT had a significant inhibitory effect on the CaCO3 yield. The CaCO3 production rate increased with increasing NBPT content when the content of NBPT was less than or equal to 0.1%. A previous study [29] showed that the CaCO3 formed at an NBPT content of approximately 0.1% mainly consists of calcite, with high compressive strength in the solidified samples, which is consistent with the results of this study. In another study, the researchers found that when the NBPT content was greater than 0.1%, vaterite was produced, and the compressive strength of the solidified sample gradually decreased [41]. The results also indicated that when NBPT was added to the bacterial solution, the CaCO3 yield was relatively stable [41]. Therefore, 0.1% was determined to be the appropriate concentration for NBPT, and it was found that the bacterial solution was a better carrier for NBPT than the cementation solution. This reagent formulation was used in subsequent MICP soil tests.

3.2. Effects of Planned Solid Layer Thickness and Number of Curing Cycles on Soil Water Content and CaCO3 Precipitation

3.2.1. Soil Water Content

Because the consolidation strength of soil samples is affected by their water content, the determination of soil moisture content is helpful to analyse the consolidation effect of the soil samples. Figure 2a shows the soil water content of each soil layer after 7 days of different numbers of curing cycles. The results revealed that the soil water content of each soil layer first increased but then decreased with the increasing curing cycles under the same planned solid layer thickness. In the same soil box, the soil water content increased with increasing soil depth, indicating that the infiltration rates of the bacterial solution and cementation solution were greater than the rate of water evaporation. Similar results were obtained by Liu and Fu in their experiments [22,42]. There were significant differences in the soil water content in the same layer among the different treatments. The soil water content was the highest after two curing cycles under the 8 cm planned solid layer, and the soil water content was the lowest after one curing cycle under the 4 cm planned solid layer.

3.2.2. CaCO3 Content in Different Soil Layers

The amount of CaCO3 produced from biochemical reaction may be different after applying a different number of curing cycles. Figure 2b shows the CaCO3 content in each soil layer after 7 days of different curing cycles. The results revealed that the CaCO3 content in the topsoil (0~2 cm) increased with increasing curing cycles, but there were no significant differences in the CaCO3 content at depths of 2~8 cm among the different treatments. This occurred because consolidation via the MICP process occurred primarily in the 0~2 cm soil layer [43]. The CaCO3 precipitated in the topsoil blocked the infiltration of reactive substances [44], resulting in lower precipitation in the lower layer. The solution doses were the same for four curing cycles under the 4 cm planned solid layer as those for two curing cycles under the 8 cm planned solid layer. Although there were differences in the CaCO3 content of the topsoil under these two treatments (5.46% and 6.11%, respectively), there was no significant difference between them. Consequently, in terms of MICP process efficiency, the treatment with a planned solid layer thickness of 8 cm after two curing cycles resulted in CaCO3 precipitation equal to or greater than that under a planned thickness of 4 cm in the same amount of time. The Ca2+ provided by the cementation solution did not fully react with the precipitated CaCO3, meaning that the CaCO3 produced did not reach the ideal content. The reason for this might be that during testing with the bacterial solution, the number of bacteria involved in the mineralization process decreased, inducing a decrease in urease activity, which inhibited the MICP process and reduced the production of CaCO3, resulting in a lower yield of CaCO3 [13,45].

3.3. Effects of Planned Solid Layer Thickness and Number of Curing Cycles on Soil Mechanical Properties

Farmland drainage ditches, an important part of farmland water conservancy projects [46], constitute the connection zone between farmland pollutants and receiving water bodies [47]. Ditch slopes are easily destroyed, as drainage water is always present in ditches [48], so it is important to improve the stability and safety of farmland drainage ditches. Therefore, the soil penetration resistance, degree of soil disintegration, and soil permeability coefficient were analyzed to determine the feasibility of applying MICP technology for drainage ditch slope protection.

3.3.1. Soil Penetration Resistance

It is helpful to determine the penetration resistance of the soil sample surface to measure the strength of the soil sample surface after the application of different numbers of curing cycles. Figure 3a shows the soil penetration resistance after various rounds of solidification under different planned solid layer thicknesses. The results revealed that when the thickness of the planned solid layer was 4 cm, the soil penetration resistance after the first and second curing cycles was greater than the soil penetration resistance after the fourth and seventh curing cycles. Under a 4 cm planned solid layer, the soil moisture level was relatively low after the first or second curing cycles (Figure 3a), and it is known that soil moisture content influences soil penetration resistance [49].
When the thickness of the planned solid layer was 8 cm, the penetration resistance after the 2nd and 4th curing cycles was lower than that after the 1st and 7th rounds. This may have occurred because the water content after the 1st round of curing was relatively low, which resulted in relatively high soil penetration resistance [50]. After the 2nd, 4th, or 7th cycles, the soil moisture content was high, and the amount of precipitated CaCO3 was also high. Under the same reagent formulation, the soil moisture content was lower under a planned solid layer thickness of 4 cm after two and four curing cycles than under a planned solid layer thickness of 8 cm after one and two curing cycles. However, there was no significant difference in the soil penetration resistance with a planned solid layer thickness of 4 cm after one or two curing cycles and the soil penetration resistance with a planned solid layer thickness of 8 cm after two and four curing cycles. The soil penetration resistance after seven curing rounds with a planned solid layer thickness of 8 cm was significantly greater than that of the other treatments.
In a thicker soil layer (8 cm), the initially sprayed bacterial solution and cementing solution take longer to diffuse to the entire target depth, and the solution concentration may form a gradient in the vertical direction (higher in the surface layer and lower in the deep layer). This may result in slower initiation of reactions in deeper layers, and the formation and growth of CaCO3 crystal nuclei are more widely distributed in space and time. The total amount of cementitious material generated in the initial stage and its immediate reinforcement effect in the surface layer (penetration resistance test location) are not as concentrated and rapid as in thinner layers (4 cm). The reagent in the thin layer (4 cm) can reach the target concentration faster and cover the entire planned layer, leading to faster reaction initiation. The initial generation of CaCO3 is more concentrated in the shallow layer, resulting in a more significant increase in surface resistance in the early stage.
In addition, the higher initial moisture content in thicker layers (as shown in Figure 2a) may also to some extent reduce the initially measured penetration resistance. However, as the curing cycle increases (four and seven times), more reagents are injected and the reaction time is prolonged, and the advantage of the 8 cm planned layer sample gradually becomes apparent. The thicker layer provides greater space and more uniform distribution potential for CaCO3 precipitation. Multiple treatments enabled the reagent to penetrate and react more fully into the deep layers, and ultimately, after the 7th cycle, the 8 cm sample accumulated more CaCO3 in the surface layer, forming a more complete and dense bonding structure, thereby achieving significantly higher penetration resistance.

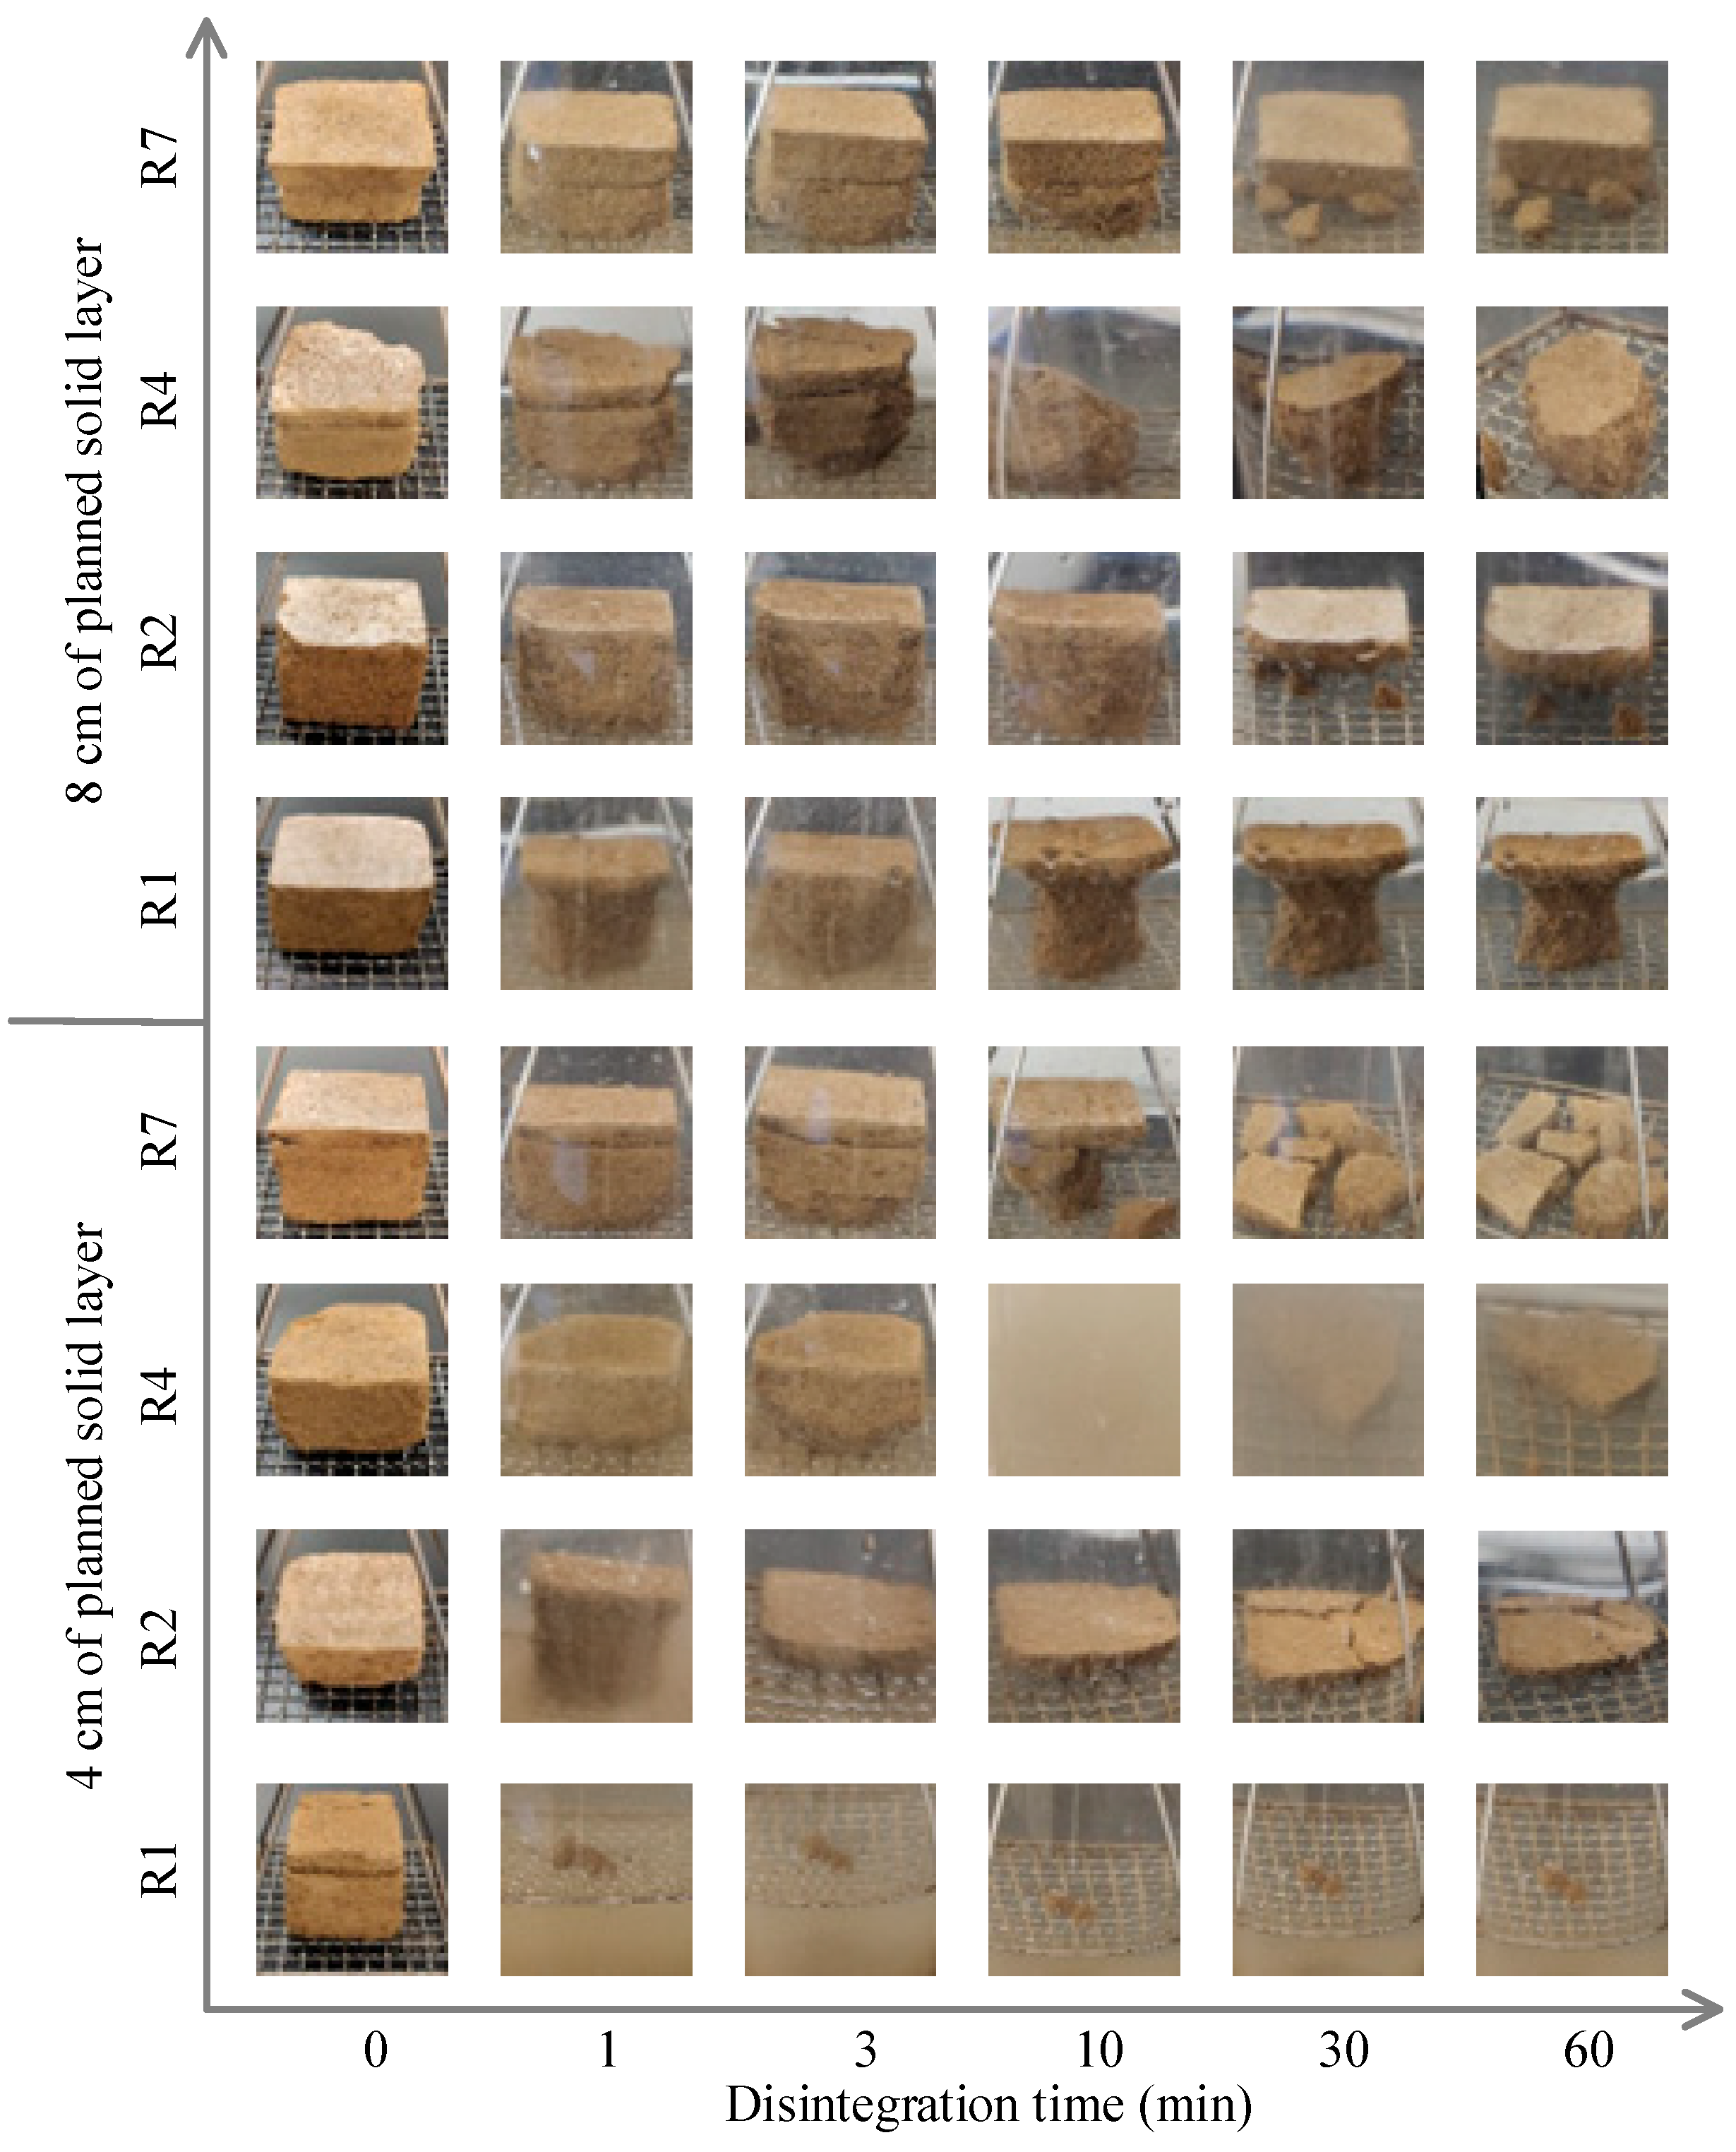
3.3.2. Soil Disintegration

Disintegration Ratio
The disintegration rate is a quantitative measure of soil sample disintegration in water. Figure 3b shows the variation in the disintegration ratio after various numbers of curing cycles with different planned solid layer thicknesses. Lv et al. observed a similar phenomenon in their study; that is, the soil disintegration rate increased significantly as the water content decreased [51]. In this study, the disintegration ratio decreased with increasing soil water content, which occurred under an increasing number of curing cycles. The results revealed that when the thickness of the planned solid layer was 4 cm, the soil samples that solidified after one round of curing disintegrated extremely quickly, almost completely disintegrating within 3 min, and the disintegration ratio was 94%. Afterwards, the disintegration rate was low, and disintegration was almost stopped after 10 min, with a final disintegration ratio of 95%. The soil samples solidified after two curing rounds and disintegrated rapidly in the first 3 min, and the disintegration ratio was 78.05%. Afterwards, the disintegration rate was low, and disintegration stopped after 10 min, with a final disintegration ratio of 80.49%. After four curing cycles, the soil samples disintegrated rapidly in the first 10 min, with a disintegration ratio of 73.91%, and disintegration almost stopped after 10 min. After seven curing cycles, the soil sample disintegrated slowly in the first 3 min, and the disintegration ratio was only 7.84%. The disintegration ratio subsequently increased and stabilized at 58.82% after 30 min. Multiple curing cycles can result in a low disintegration ratio and high water stability [52], which is consistent with the conclusions of previous research [40,53,54] showing that precipitated CaCO3 can enhance the bonding strength between soil particles and ultimately improve the water stability of soil samples.
When the thickness of the planned solid layer was 8 cm, the initial disintegration of the soil sample solidified for one round was low, and then the soil disintegrated rapidly. The disintegration ratio was 46.81% after 10 min, after which the disintegration ratio decreased. The disintegration ratio was 54.26% after 30 min. The initial disintegration rate of the soil sample that had solidified after two curing cycles was low, and the disintegration rate was only 2.13%. Afterwards, the disintegration was rapid, and the disintegration ratio reached 43.47% and 50.21% at 10 min and 30 min, respectively. The initial disintegration rate of the soil sample that had solidified after four curing rounds was low, and then disintegration occurred quickly. The disintegration ratio reached 39.13% and 47.83% after 10 min and 30 min, respectively. After seven curing cycles, the soil sample did not fully disintegrate during the initial 3 min and then disintegrated slowly. The disintegration ratios were 2.08% and 41.67% at 10 min and 30 min, respectively. The disintegration ratio of the soil sample was the lowest after seven curing cycles, and its water stability was the highest. At a planned solid layer thickness of 8 cm, the maximum disintegration ratio was 54.26% after one round of curing, and the minimum disintegration ratio with a planned solid layer thickness of 4 cm was 58.82% after seven curing cycles. Overall, at a planned solid layer thickness of 8 cm, the disintegration ratio after each curing cycle was lower and water stability was better than that at a planned solid layer thickness of 4 cm.
Disintegration Characteristics
The degree of soil sample disintegration in the presence of water may differ as the amount of curing agent varies. Figure 4 shows the disintegration behaviors of the soil samples with different planned solid layer thicknesses at different times under various numbers of curing cycles. The soil sample with a planned solid layer of 4 cm disintegrated extremely rapidly, and disintegration was almost complete after 1 min of the first curing cycle. However, for the soil sample with an 8-cm-thick planned solid layer, the soil below 1 cm disintegrated quickly, but the topsoil layer remained intact. After two rounds, for both the samples with the 4-cm- and 8-cm-thick planned solid layer, the soils disintegrated rapidly in the first 3 min, and then the bottom soil layer disintegrated completely, leaving only the topsoil layer after 30 min. After the 4th round of curing, the soil sample with a planned solid layer of 4 cm disintegrated slowly in the first 3 min and then disintegrated extremely rapidly. Owing to the uneven disintegration of the bottom layer of the soil sample, the solidified surface of the soil sample accidentally fell along the edge of the mesh board, which resulted in extremely turbid water in the measuring cylinder. This phenomenon is consistent with the results reported by Huo et al. [55].
The soil sample with a planned solid layer of 8 cm disintegrated slowly in the first 10 min and then disintegrated rapidly in the soil layer approximately 2 cm below the soil surface. After the disintegration test was complete, the soil samples that remained were taken from the test plate of the disintegrator, and the thickness was measured to be 2 cm. The amount of reagent within the planned solid layer is expected to be approximately four times that needed for the target solid layer.
When the thickness of the planned solid layer was 8 cm, the bottom soil layer disintegrated first, and disintegration was relatively rapid in the first 10 min. After the 7th curing cycle, the soil sample with a planned solid layer of 4 cm disintegrated slowly in the first 3 min and then disintegrated quickly. When the thickness of the planned solid layer was 8 cm, the slow-disintegration period was 10 min, and after 10 min, the soil below the 2 cm layer disintegrated rapidly, and the top 2 cm of the soil layer remained intact when the test was complete. The top 2 cm of surface soil was retained after seven curing rounds at an 8 cm planned thickness, whereas less than 1 cm of soil remained when the planned solid layer thickness was 4 cm. From the above analysis, we can conclude that the soil does not readily disintegrate after undergoing multiple curing cycles at a high planned solid layer thickness, which contributes to our understanding of the characteristics of soil disintegration via the MICP process.

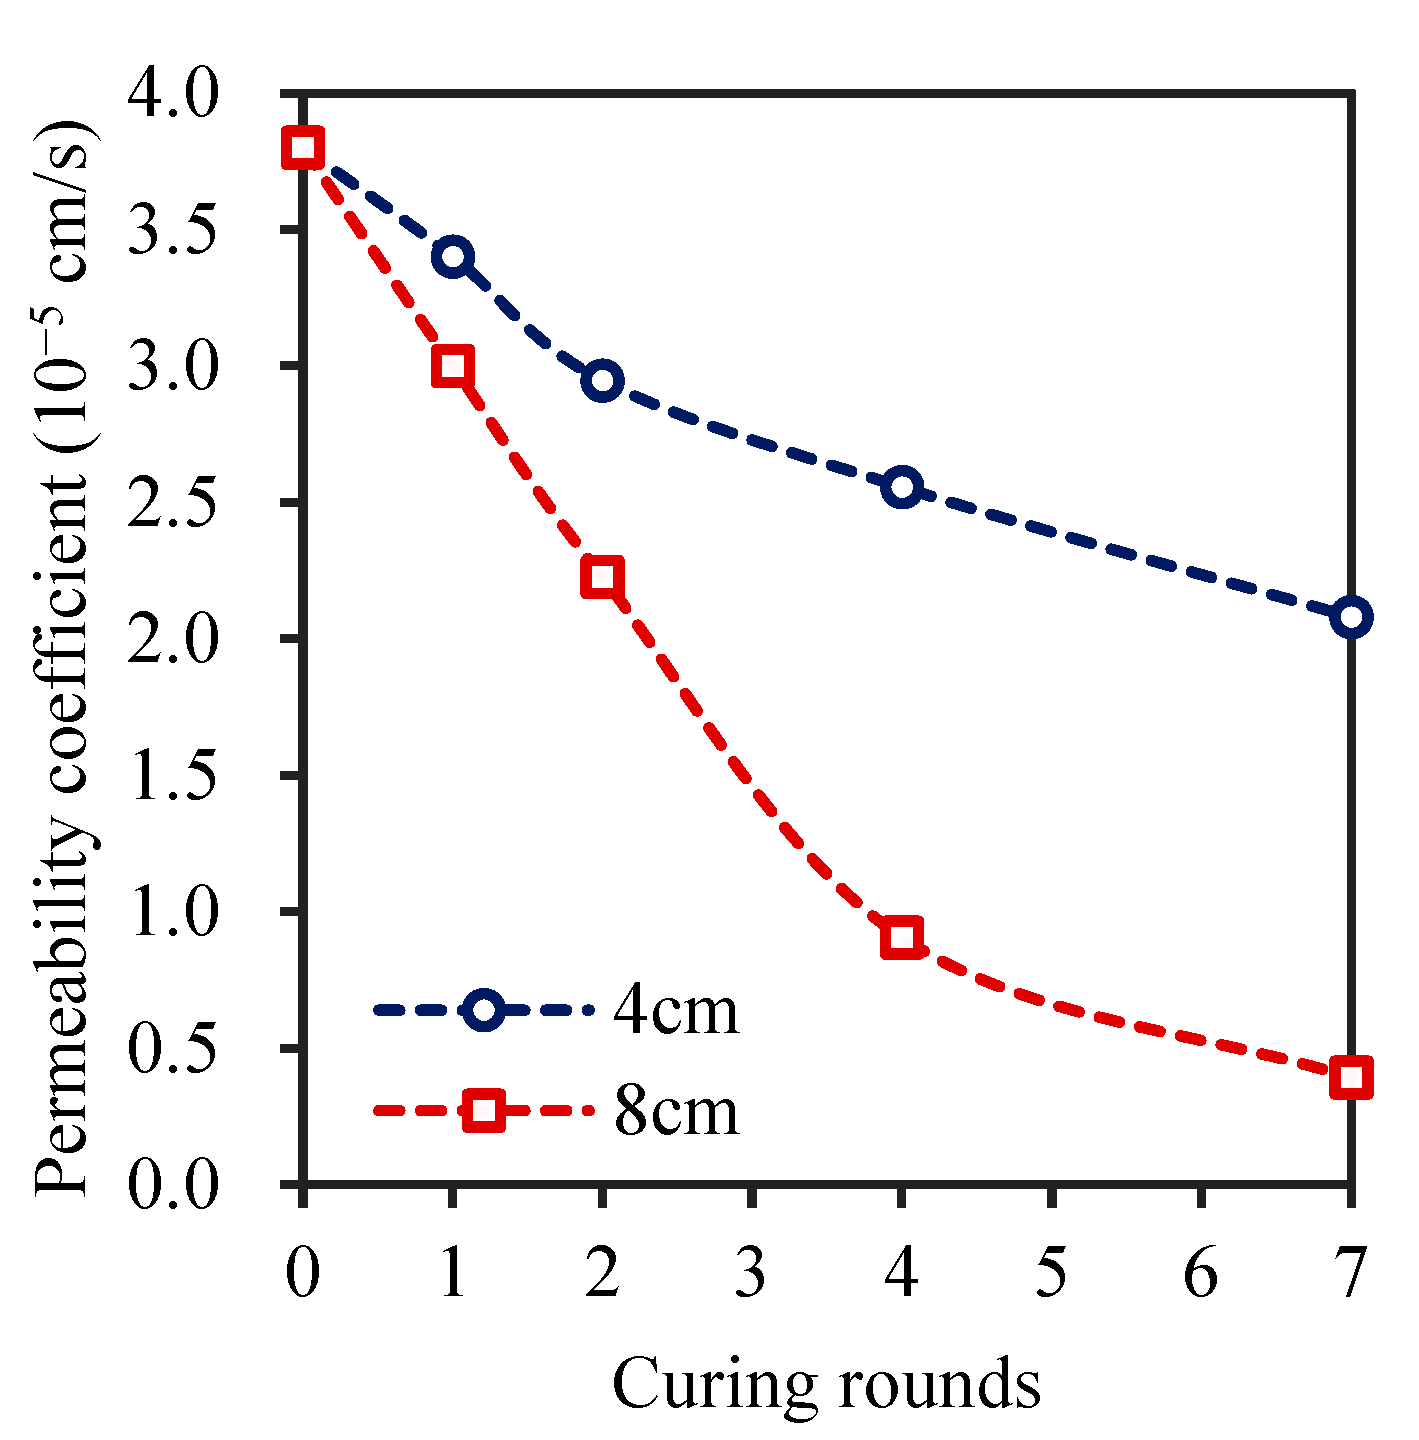
3.3.3. Soil Permeability Coefficient

Figure 5 shows the permeability coefficient of the soil samples under various curing cycles with different planned solid layer thicknesses. The soil permeability coefficient decreased gradually with increasing number of curing cycles, which is consistent with the findings of [23]. The permeability coefficient of the soil sample with a planned solid layer thickness of 4 cm decreased by 22.47% in the first two cycles and decreased by only 13.25% and 18.63% in the 4th and 7th curing cycles, respectively. When the thickness of the planned solid layer was 8 cm, after four curing cycles, the permeability coefficient was reduced to 0.90 × 10⁻⁵ cm/s, a 76% decrease. The decrease in the permeability coefficient was 56.55% after seven curing cycles, which was significantly lower than that after four curing cycles.
The permeability coefficient of the soil sample with a planned solid thickness of 4 cm after two curing cycles was not much different from that of the soil sample with a planned solid thickness of 8 cm after one curing round. The soil permeability coefficient at a planned solid layer thickness of 4 cm after four curing cycles was lower than that at a planned solid layer thickness of 8 cm after two curing cycles [56]. The above analysis revealed that when the thickness of the planned solid layer was 8 cm, the soil was more conducive to solidification, and the permeability coefficient changed only slightly after seven curing cycles [23], indicating that increasing the number of curing cycles may not result in a large reduction in the soil permeability coefficient [57]. Therefore, an 8-cm-thick planned solid layer with seven curing rounds was optimal and resulted in a smaller soil permeability coefficient.

3.4. Effects of Planned Solid Layer Thickness and Number of Curing Cycles on Surface Soil Cracks

Figure 6 shows the cracks in the surface soil after 7 days under various curing cycles at planned solid layer thicknesses of 4 cm and 8 cm. When the planned solid layer was 4 cm thick, there were cross-shaped cracks and finely divided cracks in the middle and four corners of the soil sample after one curing cycle. After two curing cycles, there were small cracks in the four corners of the soil surface with a planned solid layer thickness of 4 cm, and visible white matter appeared in the surface soil. After four and seven curing cycles, no cracks appeared on the soil surface, and obvious cementation was observed. However, there were no obvious cracks on the soil surface when the planned solid layer thickness was 8 cm, and there were white substances visible on the surface of the soil particles under all curing cycles. After seven curing cycles, the cement was relatively complete, and the whole surface was gelatinous when the planned solid layer was 8 cm thick. The reason for this may be that the soil sample with a planned solid layer thickness of 8 cm had a small permeability coefficient after four curing cycles (Figure 5), which resulted in a long residence time for the bacterial solution and the cementation solution on the soil surface after multiple curing cycles [58], resulting in the formation of a dense solidified cement on the soil surface. After several curing cycles, the formed CaCO3 repaired the surface cracks in the soil via filling and bonding [43].

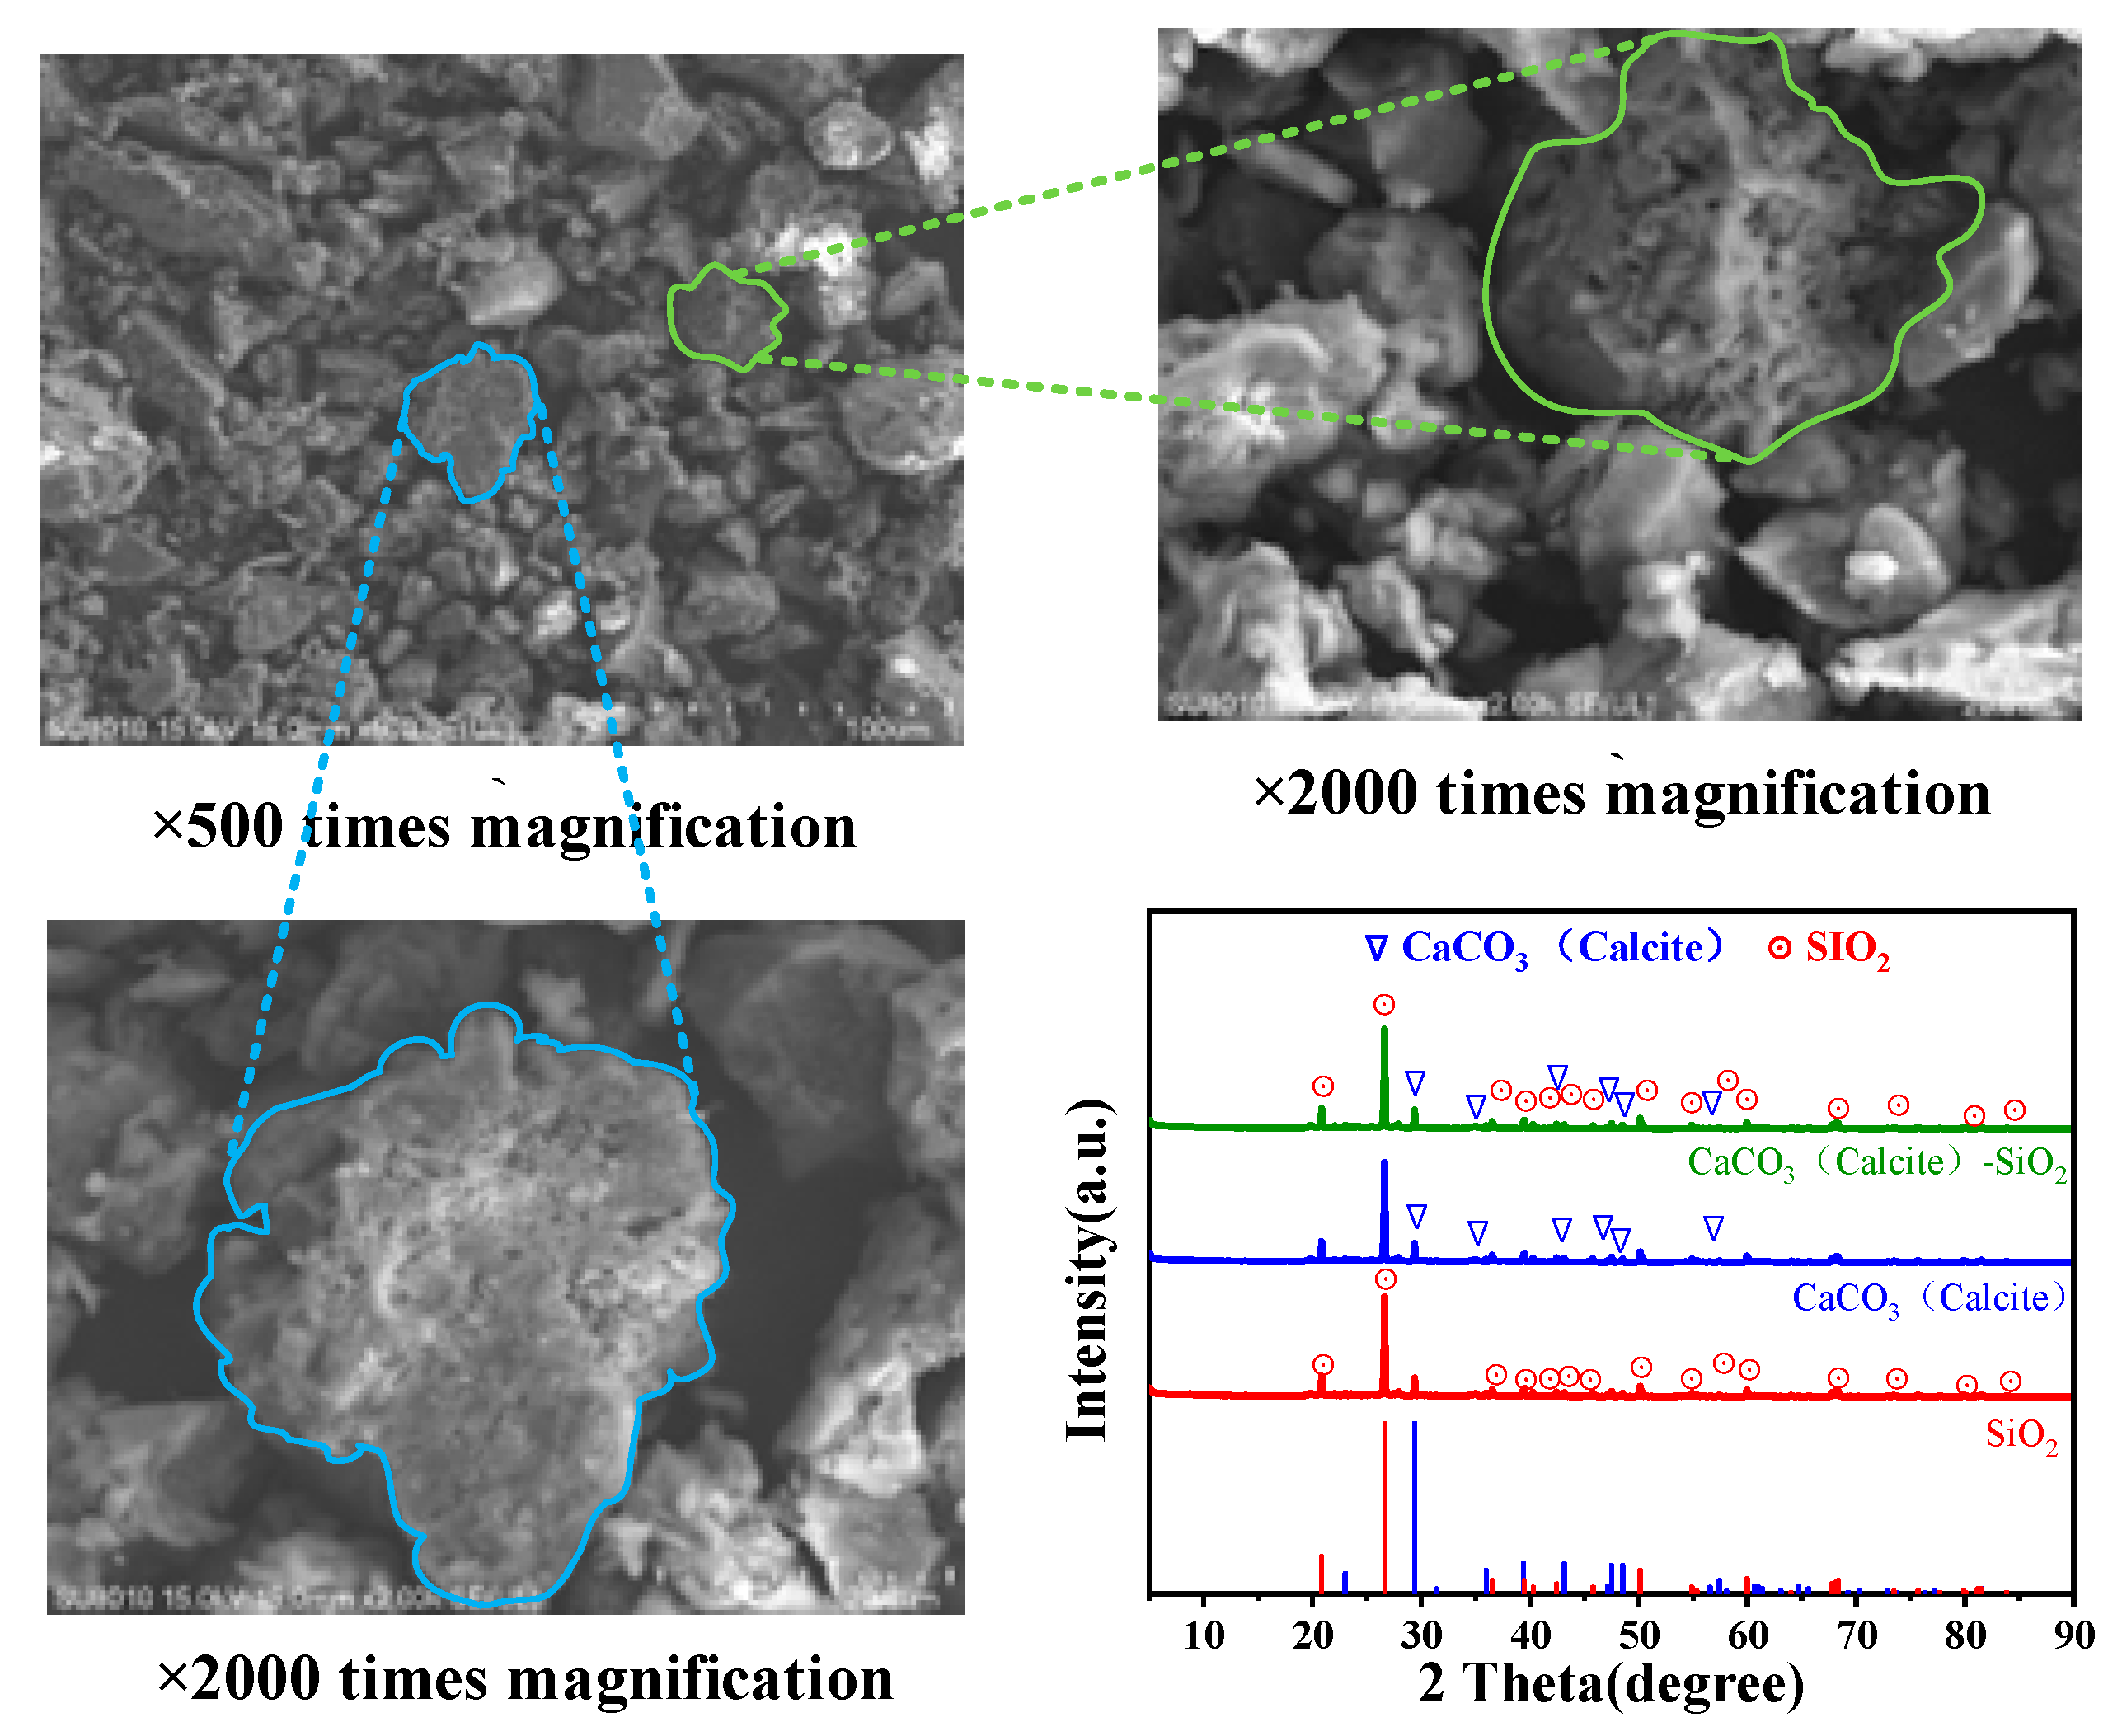
3.5. Effects of Planned Solid Layer Thickness and Number of Curing Cycles on Soil Microstructure

The CaCO3 precipitated during the MICP process can fill soil pores, enhance connections between soil particles, and ultimately improve the strength and impermeability of soils [59]. Figure 7 shows the SEM images and XRD patterns of the soils after MICP under seven curing cycles at a planned solid layer thickness of 8 cm. The precipitated CaCO3 adhered to the surface of the soil particles, and the shapes of the precipitates were irregular. There were many porous structures on the surface, and the CaCO3 structure was not obviously granular but rather was attached to the surface of the soil particles and cemented as a whole [60], which enhanced the bonding of soil particles. Through phase analysis and standard card 05-0586 [61] comparative analysis, it was found that the CaCO3 precipitated via MICP in this test only consisted of calcite crystals.

3.6. Limitations of This Study and Future Prospects

Although this study has contributed to knowledge of how MICP technology can be applied for agricultural drainage ditch slope protection, there are still some limitations that may affect the interpretation and practical application of the research data.
This study focused mainly on indoor experiments. Although the experimental conditions can be controlled, there are significant differences between the indoor environment and the actual slope environment of farmland drainage ditches. For example, the water evaporation rate, changes in temperature, and activities of microbes in the soil in indoor experiments may differ from those in outdoor environments, which may lead to difficulties in reproducing these experimental results in practical outdoor applications. Future research can validate the applicability and stability of MICP technology in real environments through field experiments or by establishing simulated experimental platforms that are more similar to actual outdoor environments.
In addition, this study focused mainly on the effects of MICP reagent formulation, solidification layer thickness, and number of curing cycles on soil solidification and did not consider how other environmental factors, such as rainfall, temperature changes, and soil type diversity, affect the MICP process. These factors may significantly alter the effectiveness of MICP technology in practical applications. Future research can further explore the applicability of MICP technology under different environmental conditions, especially its performance in extreme climates.
The soil samples used in this study were from specific agricultural drainage ditches. Although they are representative to a certain extent, there may be significant differences in the type, texture, and chemical composition of soils from different regions, which may lead to inconsistent effects after MICP application in different areas. Future research can examine more soil samples from additional sources to include more types of soil to validate the universality of MICP technology.
Finally, this study focused mainly on how the MICP process affects soil mechanical properties and permeability but did not delve into the long-term effects of MICP on the ecological environment. Although MICP is considered an environmentally friendly technique, its long-term effects on soil microbial communities, plant growth, and groundwater quality need to be researched further. Future research can incorporate ecological assessments to explore the ecological effects of the long-term application of MICP technology, ensuring its sustainability in protecting agricultural drainage ditch slopes.

4. Conclusions

In this study, the control variable method was used to carry out liquid tests to explore the effects of the bacteria-cementation ratio (1:5~8:5), cementation solution concentration (0~5 mol/L), NBPT carriers (bacteria solution and cementation solution), and NBPT content (0~5%) on the CaCO3 yield, and optimal reagent formulations were obtained. On the basis of the preferred formulations, the effects of different planned solid layer thicknesses (4 cm and 8 cm) and the number of curing cycles (one, two, four, and seven) on the actual solid layer thickness of the soil were investigated by soil consolidation tests. The CaCO3 and water contents of each soil layer, soil mechanical properties, soil surface cracks, microstructures, and other indicators were used to select a good curing process and provide a basis for the application of MICP technology for drainage ditch slope protection. The main findings of this study are as follows.
(1) When the bacteria-cementation ratio was 4:5, the maximum yield of CaCO3 was 94.11%. When the cementation solution concentration was 1 mol/L, the highest yield of CaCO3 was obtained, at 97.42%. When the NBPT content was less than 0.1%, the yield of CaCO3 in both the bacterial and cementation solutions increased slightly, and when the NBPT content was greater than 0.1%, the yield of CaCO3 decreased.
(2) Multiple curing cycles resulted in high water and CaCO3 contents in the soil layer, a low disintegration rate and permeability coefficient, and few surface cracks. Under the same reagent dosage, the soil sample with a planned solid layer thickness of 4 cm had a higher utilization rate of Ca2+ in the cementation solution.
(3) Treatment under a planned solid layer thickness of 8 cm produced consolidation equivalent to or better than that under a planned solid layer thickness of 4 cm in the same amount of time. Therefore, when the same amount of reagent was used, the soil consolidation achieved with a few curing cycles and large amounts of solution was better than that achieved with multiple curing cycles and small amounts of solution.
(4) During application, the reagent dosage should be approximately four times that needed for the planned solid layer.
Although this study has contributed to knowledge of how MICP technology can be applied for agricultural drainage ditch slope protection, there are still some limitations, including the large differences between indoor and outdoor environments, the insufficient consideration of diverse environmental factors, the limited sources of the soil samples analyzed, and the lack of an evaluation of the long-term ecological effects. Therefore, future research should further verify the applicability and stability of MICP in field experiments or platforms that more closely simulate the actual outdoor environment. Moreover, the effects of environmental factors, such as rainfall, temperature changes, and soil type diversity, on the application of MICP technology could be investigated in depth, particularly under extreme climatic conditions. In addition, more soil samples from additional sources should be examined to include more types of soil to verify the universality of MICP technology. Finally, an in-depth ecological assessment of the long-term ecological effects of MICP technology on the soil microbial community, plant growth, and groundwater quality can be conducted to ensure the sustainable application of MICP in agricultural drainage slope protection.

Author Contributions

Methodology, X.H.; validation, X.H.; formal analysis, J.L. and X.J.; investigation, M.S.; data curation, Q.W. and Z.G. All authors have read and agreed to the published version of the manuscript.

Funding

This research was supported by the National Key Research and Development Program of China (No. 2021YFD1700803; D21YFD17008) , the Open Research Fund of State Key Laboratory of Efficient Utilization of Agricultural Water Resources (No. SKLAWR-2024-10) and the National Natural Science Foundation of China (No. 52209052).

Data Availability Statement

The data provided in this study can be provided according to the requirements of the corresponding authors. Because the data involves patents or trade secrets being applied for, it cannot be fully disclosed at present, and the data is not disclosed.

Acknowledgments

We thank Shuyu Wu and Huandi Li of Hohai University for their help in liquid and soil tests.

Conflicts of Interest

Author Mingxiao Su was employed by the Shanghai Water Engineering Design and Research Institute Co., Ltd., Author Qiuming Wu was employed by the Nanjing Zhishui Agricultural Technology Academy Co., Ltd. The remaining authors declare that the research was conducted in the absence of any commercial or financial relationships that could be construed as a potential conflict of interest.

References

  1. Guo, G.; Galen, D.; Khan, I.; Sunohara, M.; Craiovan, E.; Chen, W. Examining the impact of agricultural drainage ditch management on in-stream bacterial communities involved in nitrogen cycling: Insights from the Environmental Change One Health Observatory (ECO2). Front. Sustain. Food Syst. 2024, 8, 1329422. [Google Scholar] [CrossRef]
  2. Yan, J.; Xing, Y.; Shi, H.; Li, X.; Ma, X. Review of research on farmland drainage ditches, weed control, slope protection, and ecological purification. Water Sav. Irrig. 2024, 10, 77–85. [Google Scholar]
  3. Ma, Y.; Bao, H.; Yan, C.; Lan, H.; Peng, J.; Zheng, H.; Song, Z.; Liu, C. Mechanical properties and microstructure evolution of two ecological slope-protection materials under dry-wet cycles. J. Clean. Prod. 2023, 416, 137833. [Google Scholar] [CrossRef]
  4. Habert, G.; Miller, S.; John, V.; Provis, J.; Favier, A.; Horvath, A.; Scrivener, K. Environmental impacts and decarbonization strategies in the cement and concrete industries. Nat. Rev. Earth Environ. 2020, 1, 559–573. [Google Scholar] [CrossRef]
  5. Aswad, A.; Yilmaz, M.; Ismail, S. A Systematic review study on different kinds of interlocking concrete blocks designs and properties. Turk. J. Eng. 2022, 6, 327–337. [Google Scholar] [CrossRef]
  6. Li, Y.; Lu, X.; Liu, S.; Li, L.; Bu, C.; Magombana, B.; Li, J. The progress and trend of Microbially Induced Carbonate Precipitation (MICP) research: A bibliometric analysis. Environ. Earth Sci. 2023, 82, 567. [Google Scholar] [CrossRef]
  7. Zhang, X.; Wang, H.; Wang, Y.; Wang, J.; Cao, J.; Zhang, G. Improved methods, properties, applications and prospects of microbial induced carbonate precipitation (MICP) treated soil: A review. Biogeotechnics 2024, 3, 100123. [Google Scholar] [CrossRef]
  8. Sreekala, A.; Nair, S.; Nathan, V. Microbially induced calcium carbonate precipitation using Lysinibacillus sp.: A ureolytic bacterium from uttarakhand for soil stabilization. Curr. Microbiol. 2024, 81, 387. [Google Scholar] [CrossRef]
  9. Punnoi, B.; Arpajirakul, S.; Pungrasmi, W.; Chompoorat, T.; Likitlersuang, S. Use of microbially induced calcite precipitation for soil improvement in compacted Clays. Int. J. Geosynth. Ground Eng. 2021, 7, 86. [Google Scholar] [CrossRef]
  10. Behzadipour, H.; Sadrekarimi, A. Effects of microbially induced calcite precipitation on static liquefaction behavior of a gold tailings sand. Biogeotechnics 2024, 2, 100097. [Google Scholar] [CrossRef]
  11. Fouladi, A.S.; Arulrajah, A.; Chu, J.; Horpibulsuk, S. Application of Microbially Induced Calcite Precipitation (MICP) technology in construction materials: A comprehensive review of waste stream contributions. Constr. Build. Mater. 2023, 388, 131546. [Google Scholar] [CrossRef]
  12. Liu, B.; Tang, C.; Pan, X.; Cheng, Q.; Shen, Z.; Xu, J.; Zhang, X. Influence of layer thickness on bioremediation of drought-induced soil desiccation cracks using microbially induced calcite precipitation. Acta Geotech. 2024, 19, 4399–4414. [Google Scholar] [CrossRef]
  13. Zhang, Y.; Liu, Y.; Sun, X.; Zeng, W.; Xing, H.; Lin, J.; Kang, S.; Yu, L. Application of microbially induced calcium carbonate precipitation (MICP) technique in concrete crack repair: A review. Constr. Build. Mater. 2024, 411, 134313. [Google Scholar] [CrossRef]
  14. Dagliya, M.; Satyam, N.; Garg, A. Optimization of growth medium for microbially induced calcium carbonate precipitation (MICP) treatment of desert sand. J. Arid Land 2023, 15, 797–811. [Google Scholar] [CrossRef]
  15. Bu, C.; Lu, X.; Zhu, D.; Liu, L.; Sun, Y.; Wu, Q.; Zhang, W.; Wei, Q. Soil improvement by microbially induced calcite precipitation (MICP): A review about mineralization mechanism, factors, and soil properties. Arab. J. Geosci. 2022, 15, 863. [Google Scholar] [CrossRef]
  16. Raveh-Amit, H.; Gruber, A.; Abramov, K.; Tsesarsky, M. Mitigation of aeolian erosion of loess soil by Bio-Stimulated microbial induced calcite precipitation. Catena 2024, 237, 107808. [Google Scholar] [CrossRef]
  17. Wang, Y.; Sun, X.; Miao, L.; Wang, H.; Wu, L.; Shi, W.; Kawasaki, S. State-of-the-art review of soil erosion control by MICP and EICP techniques: Problems, applications, and prospects. Sci. Total Environ. 2024, 912, 169016. [Google Scholar] [CrossRef]
  18. Wang, R.; Tang, C.; Pan, X.; Shen, Z.; Liu, Y.; Lu, X. A biotechnological approach for suspended solids removal in biogas slurry via microbially induced calcite precipitation (MICP). J. Clean. Prod. 2024, 459, 142537. [Google Scholar] [CrossRef]
  19. Liu, Y.; Ali, A.; Su, J.; Li, K.; Hu, R.; Wang, Z. Microbial-induced calcium carbonate precipitation: Influencing factors, nucleation pathways, and application in waste water remediation. Sci. Total Environ. 2023, 860, 160439. [Google Scholar] [CrossRef]
  20. Khoshtinat, S. Advancements in exploiting sporosarcina pasteurii as sustainable construction material: A review. Sustainability 2023, 15, 13869. [Google Scholar] [CrossRef]
  21. Zúñiga-Barra, H.; Toledo-Alarcón, J.; Torres-Aravena, Á.; Jorquera, L.; Rivas, M.; Gutiérrez, L.; Jeison, D. Improving the sustainable management of mining tailings through microbially induced calcite precipitation: A review. Miner. Eng. 2022, 189, 107855. [Google Scholar] [CrossRef]
  22. Fu, T.; Saracho, A.C.; Haigh, S.K. Microbially induced carbonate precipitation (MICP) for soil strengthening: A comprehensive review. Biogeotechnics 2023, 1, 100002. [Google Scholar] [CrossRef]
  23. Chen, Y.; Han, Y.; Zhang, X.; Sarajpoor, S.; Zhang, S.; Yao, X. Experimental study on permeability and strength characteristics of MICP-treated calcareous sand. Biogeotechnics 2023, 1, 100034. [Google Scholar] [CrossRef]
  24. Prajapati, N.; Agnihotri, A.; Basak, N. Microbial induced calcite precipitation (MICP) a sustainable technique for stabilization of soil: A review. Mater. Today Proc. 2023, 93, 357–361. [Google Scholar] [CrossRef]
  25. Cheng, L.; Shahin, M. Chapter 3: Microbially induced calcite precipitation (MICP) for soil stabilization: Innovative approaches to socio-ecological sustainability. In Ecological Wisdom Inspired Restoration Engineering; Springer: Singapore, 2019; pp. 47–68. [Google Scholar]
  26. Rahmaninezhad, S.; Houshmand, M.; Sadighi, A.; Ahmari, K.; Kamireddi, D.; Street, R.M.; Farnam, Y.A.; Schauer, C.L.; Najafi, A.R.; Sales, C.M. Overcoming the inhibitory effects of urea to improve the kinetics of microbial-induced calcium carbonate precipitation (MICP) by Lysinibacillus sphaericus strain MB284. J. Biosci. Bioeng. 2024, 138, 63–72. [Google Scholar] [CrossRef]
  27. Saracho, A.; Haigh, S.; Hata, T.; Soga, K.; Farsang, S.; Redfern, S.; Marek, E. Characterization of CaCO3 phases during strain-specific ureolytic precipitation. Sci. Rep. 2020, 10, 10168. [Google Scholar]
  28. Zehner, J.; Røyne, A.; Sikorski, P. Sample cell for the study of enzyme-induced carbonate precipitation at the grain-scale and its implications for biocementation. Sci. Rep. 2021, 11, 13675. [Google Scholar] [CrossRef]
  29. Xu, W.; Zheng, J.; Chu, J.; Zhang, R.; Cui, M.; Lai, H.; Zeng, C. New method for using N-(N-butyl)-triphosphoric triamide to improve the effect of microbial induced carbonate precipitation. Constr. Build. Mater. 2021, 313, 125490. [Google Scholar] [CrossRef]
  30. Cantarella, H.; Otto, R.; Soares Johnny, R.; Silva, A. Agronomic efficiency of NBPT as a urease inhibitor: A review. J. Adv. Res. 2018, 13, 19–27. [Google Scholar] [CrossRef]
  31. Bhadiyadra, K.; Jong, S.; Ong, D.; Doh, J. Trends and opportunities for greener and more efficient microbially induced calcite precipitation pathways: A strategic review. Geotech. Res. 2024, 11, 161–185. [Google Scholar] [CrossRef]
  32. Sigurdarson, J.; Svane, S.; Karring, H. The molecular processes of urea hydrolysis in relation to ammonia emissions from agriculture. Rev. Environ. Sci. Biotechnol. 2018, 17, 241–258. [Google Scholar] [CrossRef]
  33. Liu, Q.; Jin, X.; Fang, F.; Li, J.; Du, G.; Kang, Z. Food-grade expression of an iron-containing acid urease in Bacillus subtilis. J. Biotechnol. 2019, 293, 66–71. [Google Scholar] [CrossRef]
  34. da Fonseca, A.; Santos, C.; Nunes, A.; Oliveira, D.; de Melo, M.; Takayama, T.; Mansur, B.; de Jesus, F.; do Carmo, A.; Dias, M.; et al. Urease inhibitors technologies as strategy to mitigate agricultural ammonia emissions and enhance the use efficiency of urea-based fertilizers. Sci. Rep. 2023, 13, 22739. [Google Scholar] [CrossRef]
  35. Seifan, M.; Berenjian, A. Microbially induced calcium carbonate precipitation: A widespread phenomenon in the biological world. Appl. Microbiol. Biotechnol. 2019, 103, 4693–4708. [Google Scholar] [CrossRef] [PubMed]
  36. Salehi Sarvak, A.H.; Almodaresi, S.A.; Deh-abadi, A.M.; Shishehbore, M.R.; Kangazian, A.H.; Jamali, A.A. Calcium carbonate sediment corrosion and formation investigation in drinking water distribution network in Sough City, Iran. Sci. Rep. 2025, 15, 2548. [Google Scholar] [CrossRef]
  37. Zhou, H.; Li, H. Soil Disintegration characteristics of collapsed walls and influencing factors in southern China. Open Geosci. 2018, 10, 797–806. [Google Scholar] [CrossRef]
  38. Gilmour, K.; Ghimire, P.; Wright, J.; Haystead, J.; Dade-Robertson, M.; Zhang, M.; James, P. Microbially induced calcium carbonate precipitation through CO2 sequestration via an engineered Bacillus subtilis. Microb. Cell Factories 2024, 23, 168. [Google Scholar] [CrossRef] [PubMed]
  39. Whiffin, V.; van Paassen, L.; Harkes, M. Microbial carbonate precipitation as a soil improvement technique. Geomicrobiol. J. 2007, 24, 417–423. [Google Scholar] [CrossRef]
  40. Yi, H.; Zheng, T.; Jia, Z.; Su, T.; Wang, C. Study on the influencing factors and mechanism of calcium carbonate precipitation induced by urease bacteria. J. Cryst. Growth 2021, 564, 126113. [Google Scholar] [CrossRef]
  41. Wang, H.; Miao, L.; Sun, X.; Wu, L.; Fan, G.; Zhang, J. The use of N-(N-butyl)-thiophosphoric triamide to improve the efficiency of enzyme induced carbonate precipitation at high temperature. Acta Geotech. 2023, 18, 5063–5081. [Google Scholar] [CrossRef]
  42. Liu, B.; Tang, C.; Pan, X.; Zhu, C.; Cheng, Y.; Xu, J.; Shi, B. Potential drought mitigation through microbial induced calcite precipitation-MICP. Water Resour. Res. 2021, 57, e2020WR029434. [Google Scholar] [CrossRef]
  43. Ezzat, S. A critical review of microbially induced carbonate precipitation for soil stabilization: The global experiences and future prospective. Pedosphere 2023, 33, 717–730. [Google Scholar] [CrossRef]
  44. Tan, H.; Chen, F.; He, J.; Chen, J. Effect of soil particle size on the rate of calcium carbonate deposition induced by microorganisms. J. Harbin Eng. Univ. 2019, 40, 1884–1889. [Google Scholar]
  45. Yuan, X.; Zhu, T.; Wang, Q.; Chen, H.; Lin, S.; Wang, X.; Xu, X. An experimental investigation of dispersive soils treated by microbially induced calcium carbonate precipitation (MICP). Constr. Build. Mater. 2024, 446, 137941. [Google Scholar] [CrossRef]
  46. Castellano, M.; Archontoulis, S.; Helmers, M.; Poffenbarger, H.; Six, J. Sustainable intensification of agricultural drainage. Nat. Sustain. 2019, 2, 914–921. [Google Scholar] [CrossRef]
  47. Carstensen, M.; Hashemi, F.; Hoffmann, C.; Zak, D.; Audet, J.; Kronvang, B. Efficiency of mitigation measures targeting nutrient losses from agricultural drainage systems: A review. Ambio: J. Hum. Environ. 2020, 49, 1820–1837. [Google Scholar] [CrossRef] [PubMed]
  48. Herzon, I.; Helenius, J. Agricultural drainage ditches, their biological importance and functioning. Biol. Conserv. 2008, 141, 1171–1183. [Google Scholar] [CrossRef]
  49. Kasirajan, S.; Parthipan, T.; Elamathy, S.; Senthil Kumar, G.; Rajavel, M.; Veeramani, P. Dynamics of soil penetration resistance, moisture depletion pattern and crop productivity determined by mechanized cultivation and lifesaving irrigation in zero till blackgram. Heliyon 2024, 10, e28625. [Google Scholar] [CrossRef]
  50. Li, K.; Wang, Y. The impact of Microbially Induced Calcite Precipitation (MICP) on sand internal erosion resistance: A microfluidic study. Transp. Geotech. 2024, 49, 101404. [Google Scholar] [CrossRef]
  51. Lv, J.; Bao, Y.; Yang, L.; He, X.; Zhang, H.; Li, H. Elevation-related variations of soil disintegration and its driving forces in the water level fluctuation zone of the Three Gorges Reservoir, China. Geomorphology 2024, 455, 109193. [Google Scholar] [CrossRef]
  52. Feng, D.; Yu, Y.; Wang, J.; Fang, C.; Liang, S. Experimental study on shear and disintegration resistance of MICP-treated residual granite soil. Environ. Earth Sci. 2024, 83, 179. [Google Scholar] [CrossRef]
  53. Arpajirakul, S.; Pungrasmi, W.; Likitlersuang, S. Efficiency of microbially-induced calcite precipitation in natural clays for ground improvement. Constr. Build. Mater. 2021, 282, 122722. [Google Scholar] [CrossRef]
  54. Xie, J.; Gao, J.; Cao, H.; Li, J.; Wang, X.; Zhang, J.; Meng, H.; Hong, J.; Li, T.; Xu, M. Calcium carbonate promotes the formation and stability of soil macroaggregates in mining areas of China. J. Integr. Agric. 2024, 23, 1034–1047. [Google Scholar] [CrossRef]
  55. Huo, B.; Huang, Q.; Kang, X.; Liu, X.; Liu, M.; Peng, J. Experimental study on the disintegration characteristics of undisturbed loess under rainfall-induced leaching. Catena 2023, 233, 107482. [Google Scholar] [CrossRef]
  56. Ji, X.; Tang, C.; Pan, X.; Cheng, Y.; Shi, B. Enhancing biocementation performance in low permeability clayey soil through sand column strategy. Catena 2024, 245, 108301. [Google Scholar] [CrossRef]
  57. Zhang, K.; Tang, C.; Jiang, N.; Pan, X.; Liu, B.; Wang, Y.; Shi, B. Microbial-induced carbonate precipitation (MICP) technology: A review on the fundamentals and engineering applications. Environ. Earth Sci. 2023, 82, 229. [Google Scholar] [CrossRef] [PubMed]
  58. Xie, J.; Tang, C.; Liu, B.; Chen, Q.; Yin, L.; Jiang, N.; Shi, B. Water stability improvement of clay based on microbial induced calcium carbonate deposition technology. Zhejiang Univ. Eng. Technol. 2019, 53, 10. [Google Scholar]
  59. Zhang, Y.; Yan, D.; Qu, J.; Wang, X.; Lei, Y.; Du, B.; Xue, K.; Li, G. Research progress of microbial-induced calcium carbonate deposition (MICP) solidified soils. Civ. Eng. 2019, 13, 603–612. [Google Scholar]
  60. Zúñiga-Barra, H.; Ostojic, C.; Torres-Aravena, Á.; Rivas, M.; Vílchez, C.; Jeison, D. Use of photosynthetic MICP to induce calcium carbonate precipitation: Prospecting the role of the microorganism in the formation of CaCO3 crystals. Algal Res. 2024, 80, 103499. [Google Scholar] [CrossRef]
  61. No. 05-0586; CaCO3 Standard Card of Calcite Crystal Form. International Joint Committee on Powder Diffraction Standards (JCPS): Philadelphia, PA, USA, 2006.
Figure 1. Results of CaCO3 productive rate under different bacteria-cementation ratios (a), cementation solution concentrations (b), and NBPT contents with different urease inhibitor carrier solvents (c).
Water 17 02010 g001
Figure 2. Soil water content (a) and CaCO3 content (b) in each soil layer under different curing rounds. Note: small letters refer to significance analysis(p < 0.05), capital letters “A” refer to planned solid layer thickness of 4 cm, and capital letters “B” refer to planned solid layer thickness of 8cm.
Water 17 02010 g002
Figure 3. Soil penetration resistance after 7 days of different curing rounds (a) and disintegration ratio under different curing rounds (b) with the 4 cm or 8 cm planned solid layer. Note: the letters in (a) are significant analysis differences (p < 0.05).
Water 17 02010 g003
Figure 4. Disintegration characteristics of soil samples with different planned solid layer thicknesses under various curing rounds.
Water 17 02010 g004
Figure 5. Soil permeability coefficient after 7 days of different curing rounds with the 4 cm or 8 cm planned solid layer.
Water 17 02010 g005
Figure 6. Cracks of the surface soil after 7 days of different curing rounds with the 4 cm or 8 cm planned solid layer.
Water 17 02010 g006
Figure 7. SEM images and XRD pattern of the soils after MICP under seven curing rounds with 8 cm thickness of the planned solid layer.
Water 17 02010 g007
Disclaimer/Publisher’s Note: The statements, opinions and data contained in all publications are solely those of the individual author(s) and contributor(s) and not of MDPI and/or the editor(s). MDPI and/or the editor(s) disclaim responsibility for any injury to people or property resulting from any ideas, methods, instructions or products referred to in the content.

