Article

Microbial Quantification Using ATP and Petrifilms for Irrigation Water Treated with Cold Plasma or Ozone

Environmental Horticulture Department, Institute of Food and Agricultural Sciences (IFAS), University of Florida, 1549 Fifield Hall, Gainesville, FL 32611, USA
*
Author to whom correspondence should be addressed.
Water 2025, 17(13), 1856; https://doi.org/10.3390/w17131856
Submission received: 1 May 2025 / Revised: 5 June 2025 / Accepted: 20 June 2025 / Published: 22 June 2025
(This article belongs to the Special Issue Ecological Wastewater Treatment and Resource Utilization)

Abstract

Traditional methods of microbial quantification of irrigation water using colony counts from agar culture require dedicated laboratory space and trained personnel, limiting their on-site applicability. Dehydrated Petrifilm™ plates are a simpler alternative but still require 2–3 days to culture. Adenosine triphosphate (ATP) tests may offer a fast and reliable method for quantifying microbes in water. In this study, we compared (a) microbial quantification based on ATP assays with Petrifilm™-based assays, and (b) we evaluated the effectiveness of cold plasma or ozone treatments in controlling microbial growth at various oxidation–reduction potential (ORP) levels. Lake water was recirculated through an ozone or cold plasma treatment system until a target ORP of 700 mV was reached. Samples were collected at various ORP levels and plated for aerobic bacteria and yeast and mold counts using Petrifilm™ plates. The free and total ATP concentrations were measured using the Hygiena EnSURE luminometer and its accompanying free and total ATP swabs. Microbial ATP was calculated by subtracting the free from the total ATP. Cold plasma and ozone showed similar effects on microbial inactivation at 700 mV (p < 0.05). Both treatments achieved complete fungal inactivation at 600–700 mV ORP, bacterial inactivation at 600 mV ORP, and near-complete inactivation of microbial ATP at 600–700 mV. A moderate positive correlation (Pearson’s correlation = 0.39 and Spearman’s rank correlation = 0.39) was observed between the Petrifilm™ bacterial counts and microbial ATP levels, suggesting ATP quantification could complement Petrifilm™ for rapid and non-selective onsite microbial assessment of irrigation water.

1. Introduction

The quality of surface water for use in irrigation, industrial processes, and drinking water supply is influenced by factors such as agricultural runoff, industrial discharges, urbanization, and climate variability [1,2]. These factors lead to the accumulation of microbes, nutrients, heavy metals, and agrichemicals in surface water, ultimately degrading the water quality and creating significant risks for ecosystems, public health, and agricultural productivity [2]. Surface water hosts a wide range of microbial communities, including bacteria pathogenic to humans, such as Escherichia coli, Salmonella, Campylobacter, Listeria monocytogenes, Pseudomonas, Aeromonas, Staphylococcus aureus, and Staphylococcus epidermis [3,4,5]. These microbial contaminants are of significant concern due to their potential to cause several infectious waterborne diseases in humans and cattle and contaminate agricultural produce, leading to public health risks and economic losses [5]. Surface water used for irrigation can also provide a source of inoculum of plant pathogens including oomycetes, fungi, bacteria, viruses, and nematodes that impact plant health [6]. Additionally, many of these microorganisms can form biofilms, which enhance their resilience and persistence in water systems.
Biofilm is an intricate complex of algae, bacteria, and other microbes that adhere to surfaces and are encased in a matrix of extracellular polymeric substances [7]. Biofilm in irrigation systems contributes to water losses, hinders irrigation optimization, and reduces crop production. Furthermore, they serve as reservoirs for pathogenic microorganisms, posing risks to public health by potentially causing foodborne illness outbreaks [8]. Biofilms can obstruct water flow, clog micro-irrigation equipment, corrode metals, and reduce the efficacy of sanitation agents [9,10]. Therefore, monitoring and quantifying these microbial populations are crucial for ensuring water quality and mitigating potential risks associated with agricultural practices.
The aerobic bacterium count, expressed as colony forming units per milliliter (CFU/mL), provides an indicator for potential biofilm clogging in micro-irrigation systems, with a threshold of >10,000 CFU/mL indicating potential risks [11]. Traditionally, the quantification of microbial communities in water has relied heavily on ex situ methods such as culturing microorganisms on agar media to enumerate viable cells. The culture-based method for microbial quantification is often time-consuming and requires trained personnel and dedicated laboratory space, making it challenging to implement in commercial or industrial settings, where maintaining aseptic conditions is not feasible [12]. In response to the shortcomings of traditional techniques, alternative methods have been developed for the on-site quantification of microbial populations.
Dehydrated culture plates known as Petrifilms are simpler than traditional agar-based methods and may be more suitable for determining bacterial counts in non-sterile environments [12]. Petrifilm™ (3M, Saint Paul, MN, USA, “Petrifilm”) is a plating technology that utilizes a dehydrated culture medium with nutrients on a plastic card and a laminate cover slip. The components of each type of Petrifilm plate differ depending on the type of microorganism being cultured, but generally include a nutrient solution, a gelling agent that dissolves in cold water, and indicators for enumeration. Petrifilms are used in agriculture, food, and beverage processing facilities to determine the CFU/mL of aerobic bacteria, yeasts and molds, and food pathogens such as E. coli and Salmonella spp. Petrifilm plates have been validated for monitoring E. coli, aerobic bacteria, and the plant pathogen Xanthomonas campestris pv. Begoniaceae in environmental and irrigation water samples, showing strong correlation with standard methods [10,13,14]. A study by [15] demonstrated that Petrifilm aerobic count plates were statistically equivalent to drop plating on R2A agar for enumerating biofilm bacteria and assessing the disinfestation efficacy of sodium hypochlorite. Similarly, Petrifilm aerobic count plates were found to be equivalent to the standard plating methodology for measuring viable bacteria and spores from hard-surface carriers such as stainless steel and porcelain, suggesting that Petrifilms can also be effectively utilized for testing the surfaces of irrigation lines [16]. Petrifilm offers numerous advantages for monitoring the microbial level in water, including ease of use, reasonable accuracy, cost-effectiveness, and long shelf life. However, its limitation in processing only 1 mL of water may lead to less precise measurements in samples with low microbial concentrations, therefore requiring multiple sample replicates [13]. In addition, not all microbes can be successfully cultured on Petrifilms, including important plant pathogens such as Phytophthora cactorum [10]. Some microbes important for plant or human health may also be recalcitrant and not easily quantified using culture methods such as Petrifilms.
Adenosine triphosphate (ATP) assays offer a broader assessment of the overall microbial activity occurring in a water sample. Employing multiple test methods that focus on different indicators of viability may offer more comprehensive insights into water quality than any individual method [17]. In contrast to Petrifilms, which quantify specific microbial colonies, ATP (also referred to as the “energy currency” of biological cells) can be used as a parameter for assessing microbial activity. ATP is an activated energy molecule found in all living cells and therefore has been used as a potential indicator for estimating the viable biomass in different applications [18]. ATP is commonly measured using bioluminescence-based assays, particularly those utilizing the firefly luciferase enzyme [19]. The luciferase assay is used to measure cellular ATP. In this assay, cells are lysed to release ATP, and D-luciferin and luciferase are added. The luciferase enzyme catalyzes the oxidation of D-luciferin in the presence of ATP and oxygen, resulting in the emission of light. The intensity of light emitted is directly proportional to the concentration of ATP in the sample. Recently, several enzyme-based commercial ATP test kits (e.g., Promega, Hygiena, LuminUltra) have become available and have been widely used for monitoring water quality. These ATP tests provide a rapid and straightforward method for measuring all active microorganisms, including viable but non-cultivable microbes, thereby overcoming the limitations of culture-based techniques [19,20]. The retail cost of commercially available ATP kits range from USD 1500 to 5000 in 2025, with an additional reagent cost of USD 2 to 4 per test, making this technology feasible for routine monitoring. Additionally, studies have demonstrated a strong correlation between the ATP content and intact bacterial numbers, indicating its potential to indirectly assess the bacterial content for both routine monitoring and research purposes [21].
Water treatment technologies such as ozone and cold plasma have shown promising effects in controlling and reducing biofilm formation in irrigation systems. Ozone is a powerful oxidizing agent and an effective disinfectant against bacteria, viruses, and certain algae [22]. Ozone effectively disrupts the biofilm structure by breaking down cell wall components and subsequently oxidizing internal structures such as enzymes, proteins, and genetic material [23]. Cold plasma is an emerging water treatment technology and can be generated using oxygen (O2) from ambient air at standard temperature and pressure to produce reactive oxygen species (ROS) such as ozone (O3), hydrogen peroxide (H2O2), and hydroxyl radicals (OH) through ionized gas [24]. These reactive species cause oxidative stress that disrupts cell membranes, damages DNA, and breaks down essential proteins and lipids, as demonstrated in studies on E. coli and Staphylococcus aureus [25,26]. Water treatment with cold plasma degrades the extracellular polymeric substances that hold biofilm structures together. For example, ref. [27] found that cold plasma treatment could effectively reduce E. coli biofilms, comparable to chemical disinfectants such as ozone and H2O2. Both ozone and cold plasma treatments hold potential for enhancing the water quality and maintaining the efficiency of irrigation systems by providing effective biofilm control without contributing to chemical residues or resistance. An analysis of the cost of ozone in [28] found this technology to be characterized by a high initial capital cost, but a low operating cost per unit volume of water treated. Therefore, ozone is suitable for large horticulture businesses that treat high water volumes. In contrast, cold plasma is an emerging technology that has yet to be widely tested in a commercial setting.
Although ATP assays have been explored for rapid microbial assessment, their comparison with Petrifilm™ and evaluation in the context of irrigation water treatment has not been thoroughly studied. The findings from this study could provide a faster, non-selective alternative to traditional microbial quantification methods, which are often time-consuming and are not suitable for on-site testing. The first objective was to compare the ATP measurements against the colony counts cultured using Petrifilm for assessing the microbial water quality. A second objective was to investigate the effectiveness of water treatment technologies including cold plasma and ozone in controlling microbial growth at various levels of oxidation–reduction potential (ORP). Based on the literature, we hypothesized that the ATP and Petrifilm data would be correlated, indicating that both methods can provide complementary insights into microbial populations. Based on previous studies, we also hypothesized that significant microbial reduction would occur at ORP levels above 600 mV, with effective disinfestation expected around 650–700 mV. In order to generate data for both objectives, a surface water source was recirculated through cold plasma or ozone until a target ORP of 300 mV, 400 mV, 500 mV, 600 mV, and 700 mV was reached. The samples were tested for bacterial and fungal counts using Petrifilm culture plates, and for microbial ATP using a luminometer and its accompanying ATP swabs.

2. Materials and Methods

2.1. Water Source

The surface water used in this experiment was obtained from Lake Alice, which is a natural water body and wildlife refuge located in the University of Florida main campus, Gainesville, FL (29°38.5′ N 82°21.4′ W). The initial water quality data including ORP, dissolved oxygen (DO), pH, electrical conductivity (EC), temperature, and turbidity were collected. The ORP was recorded using a laboratory-grade ORP sensor (Env-20, Atlas Scientific, Long Island City, NY, USA). The temperature and DO were recorded using an Orion 083010MD probe (Thermo Scientific, Watham, MA, USA). The pH and EC were recorded using an HI 9813-51 portable meter (Hanna Instruments, Smithfield, RI, USA). The surface water was then recirculated in a closed-loop system, where it was treated using either a cold plasma (“Ion solutions”, Ingersoll Rand, Inc., Lenexa, KS, USA) or an ozone system (“CD10”, ClearWater Tech, San Luis Obispo, CA, USA) until the target ORP levels were achieved.

2.2. Water Treatment Systems

The cold plasma system consisted of a 60 L reservoir for holding surface water and a plasma reactor chamber. Ambient air was drawn into the system and passed through an oxygen concentrator to remove nitrogen, resulting in oxygen-enriched air, which was supplied to the plasma chamber at a flow rate of 1.1 to 1.2 L/min. Within the plasma chamber, a high-voltage electrical current of 35 V was applied to the oxygen-enriched air to generate cold plasma. The cold plasma system produced dissolved ozone at 0.43 mg/L. Surface water from the reservoir was pumped through the plasma chamber at a flow rate of 18.9 L/min. The plasma process generated ROS and charged particles, which interacted with the water, leading to an increase in DO and ORP of the water.
The ozone system consisted of an oxygenation unit, a 60 L reservoir for holding the surface water, a venturi injector, and a pressurized contact vessel. Oxygen was supplied to the system by an oxygen concentrator (AEROUS, ClearWater Tech, San Luis Obispo, CA, USA), which filtered and concentrated atmospheric oxygen. The concentrated oxygen was then fed into the ozone generator which operated at full capacity to produce ozone at 0.57 mg/L. The ozone gas was injected into the surface water through a venturi injector, ensuring thorough mixing of the ozone into the water stream. Once the ozone was injected into the water, the ozonated water passed into a pressurized contact vessel. This vessel was designed to maximize the dissolution of ozone into the water by maintaining adequate pressure and allowing sufficient contact time between the ozone and the water. The treated water was recirculated back to the reservoir, where ORP was monitored continuously.

2.3. Sample Collection

Pairs of water samples were collected from two points in the treatment process: directly from the reservoir (“Pre”) and after the injector/reactor before the water returned to the reservoir (“Post”). “Pre” samples were collected from the reservoir once the reservoir water reached target ORP levels of non-treated (control), 300 mV, 400 mV, 500 mV, 600 mV, and 700 mV. Concurrently, “Post” samples were taken immediately coming out of the injector/reactor before the treated water was returned to the reservoir.
Water quality parameters including ORP, DO, pH, EC, temperature, and turbidity of the samples were recorded before preparing for microbial analysis.

2.4. Microbial Quantification Using Petrifilm

For the microbial analysis with Petrifilm, both Petrifilm aerobic count plates and Petrifilm yeast and mold count plates were used. Each type of Petrifilm plate targets specific microbial groups, allowing for a comprehensive assessment of water quality.
To quantify aerobic bacteria, Petrifilm aerobic count plates (3M, Saint Paul, MN, USA) were used. A 1:100 dilution of water sample was prepared using sterile deionized water before plating to ensure that the bacterial count falls within the plate’s detection range. Water samples were plated on the Petrifilm by following the manufacturer’s instructions. One milliliter of the diluted sample was pipetted onto each Petrifilm aerobic count plate. A spreader plate was used to spread the 1 mL sample evenly onto the Petrifilm. The plates were then incubated at 30 °C for 72 h to facilitate the growth of bacterial colonies. Post-incubation, the number of colonies was counted using an automated plate reader (6499 Petrifilm™, 3M, Saint Paul, MN, USA). The results, expressed as CFU/mL, provided an estimate of the aerobic bacterial load in the water samples.
For the assessment of fungal populations, Petrifilm yeast and mold count plates (3M, Saint Paul, MN, USA) were used. Petrifilm yeast and mold count plates contain selective nutrients and indicators that facilitate the growth of fungi while inhibiting the growth of bacteria. Following the manufacturer’s instructions, 1 mL of undiluted water sample was directly placed onto each Petrifilm yeast and mold plate. These plates were also incubated at 30 °C for 72 h. Colonies were then counted manually.

2.5. Microbial Quantification Using ATP Assay

AquaSnap™ Total and AquaSnap™ Free (Hygiena, LLC, Camarillo, CA, USA) ATP swabs were used to quantify total and free ATP levels in the water samples. Both tests were performed using a Hygiena luminometer to assess microbial activity. AquaSnap Total swab measured ATP from living cells (microbial ATP) and dissolved ATP in the water (non-microbial ATP), whereas AquaSnap Free measured extracellular ATP from dead or lysed cells. Microbial ATP was calculated by subtracting free ATP from total ATP.
Before testing, AquaSnap devices (swabs) were equilibrated to room temperature. For each sample, the collection swab was submerged in the water for 1 to 2 s. The swab was activated by breaking the valve located in the bulb of the device. The valve was broken by holding the tube firmly and bending the bulb forward and backward until the valve snapped. Once the valve was broken, the bulb was squeezed to expel the liquid into the tube, allowing the sample to mix with the reagent. After activation, the device was shaken for 3 to 5 s before being inserted into the luminometer for the measurement. The measurements were taken within 15 s of activation, with results recorded as relative light units (RLU).

2.6. Experimental Design and Statistical Analysis

The experiment was conducted in a climatically controlled growth chamber with an air temperature set to 21 °C and an average relative humidity of 60%. The study used a randomized complete block design with one treatment factor and three replications. The treatment factor was the type of water treatment applied (cold plasma or ozone), with each experimental run treated as a block to account for variation among runs.
The effectiveness of ORP in microbial inactivation (with separate analysis of aerobic bacteria, yeast and mold, and microbial ATP) was quantified using non-linear regression. We adopted a monomolecular function based on the Weibull distribution curve for survival kinetics, as described by [29]. The survival function was applied to the bacteria and fungal CFU and microbial ATP RLU data that had been normalized from zero to one by dividing data at each ORP level by the CFU or RLU of the untreated control in each experimental run:
S(ORP) = exp[−k(ORP − ORPinit)]
This model allowed us to determine two critical parameters, the inactivation rate constant (k) and the initial ORP (ORPinit), both estimated using SAS software (version 9.4). The non-linear regression procedure PROC NLIN was employed, fitting the model through iterative estimation via the Gauss–Newton method. These parameter estimates were used to graph the survival curves and examine the relationship between ORP and microbial mortality in each treatment condition.

3. Results

3.1. Effects of Cold Plasma and Ozone on Oxidation–Reduction Potential (ORP)

The cold plasma and ozone treatments increased the ORP in the water to above 700 mV (Figure 1). However, the treatments differed in how quickly they reached these target ORP levels, which was a function of the specific equipment used. The ozone treatment resulted in a faster increase in the ORP, achieving the 700 mV target within about 35 min. In contrast, the cold plasma treatment exhibited a more gradual rise, requiring nearly 75 min to reach the same ORP value. This difference in time to reach a target ORP could possibly be attributed to factors such as the initial microbial load, flow dynamics of the treatment systems, or the differences in ROS generation rates and distribution within the treatment system.

3.2. Initial Surface Water Quality

Table 1 represents the initial water quality parameters of the surface water source measured before the water treatment. The aerobic bacteria count was 42,550 ± 13,316 CFU/mL (mean ± standard error), which exceeds the recommended limit of <10,000 CFU/mL for irrigation water to reduce the risk of clogging irrigation lines [11]. Although no specific guidelines exist for yeast and mold or ATP levels, the measured values indicate that the water source could potentially contain plant or food safety pathogens, with a resulting risk for agricultural or drinking water use.
The water source pH of 7.33 ± 0.06 was within the acceptable range for irrigation (<7.5), and the EC of 0.27 ± 0.03 mS/cm was below the recommended range of 0.75–1.5 mS/cm [14]. However, the turbidity level of 3.93 ± 0.13 NTU exceeded the recommended maximum of 2 NTU for irrigation water [30], which can impact the efficacy of disinfestation water treatment methods such as ultraviolet radiation [31,32]. Given the high microbial load and turbidity levels, treatment methods such as cold plasma or ozone have the potential to reduce contamination to within the recommended limits for safe irrigation use.

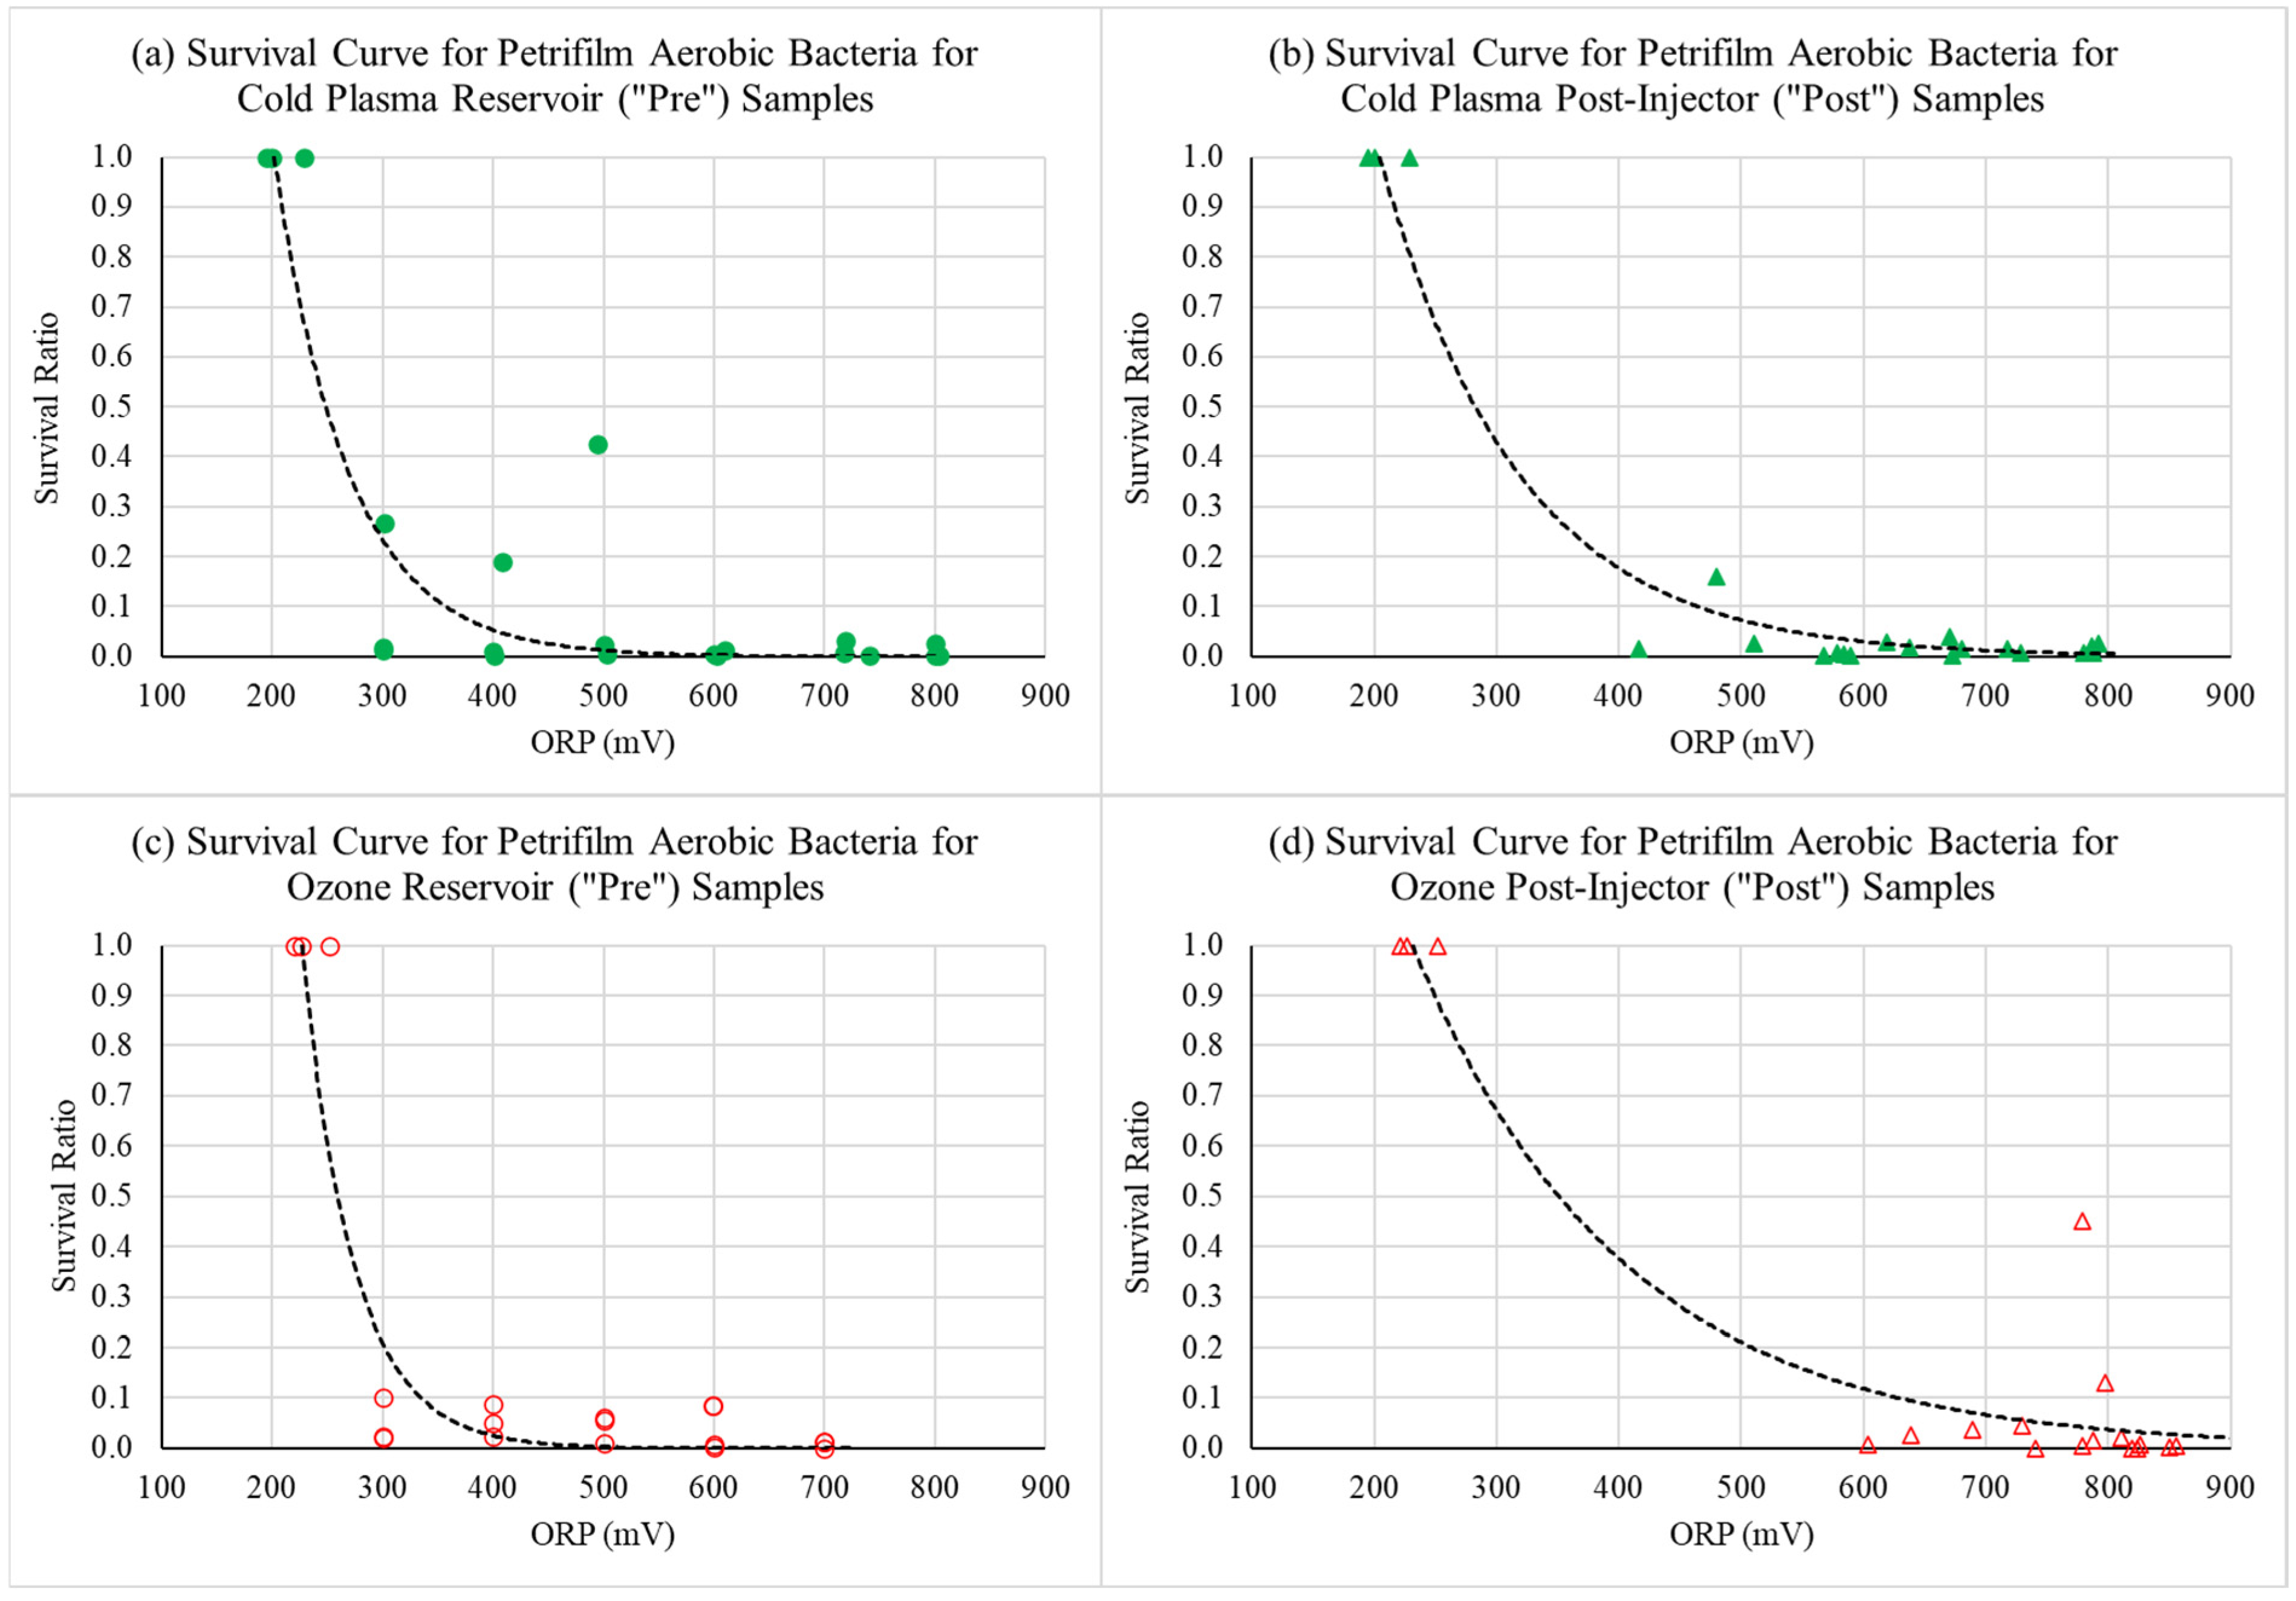
3.3. Effects of Cold Plasma and Ozone Treatment on Fungal and Bacterial Colony Counts Using Petrifilm

The cold plasma and ozone treatments demonstrated high efficacy in reducing the yeast and mold populations in surface water. Figure 2 illustrates the survival ratios for yeast and mold quantified using Petrifilm as a function of the ORP with cold plasma and ozone. In the cold plasma “Pre” samples (Figure 2a), the yeast and mold survival sharply declined between 300 and 500 mV, with complete inactivation occurring near 600 mV. The cold plasma “Post” samples (Figure 2b) showed a slightly less steep decline with near-complete reduction at 700 mV and above. For the ozone “Pre” samples (Figure 2c), complete inactivation of the yeast and mold counts was observed at about 600 mV. The ozone “Post” samples (Figure 2d) exhibited a steady reduction, with complete inactivation near 700 mV. No significant differences were observed in the fungal colony counts between the cold plasma and ozone treatments at an ORP level of 700 mV based on ANOVA at p = 0.05.
The cold plasma and ozone treatments significantly reduced the aerobic bacterial counts, as shown by the survival ratios in Figure 3. The reduction was closely associated with increasing ORP levels, consistent across the “Pre” (reservoir) and “Post” (immediately after the injector) sampling points. For the “Pre” samples treated with cold plasma (Figure 3a), a notable reduction in the aerobic bacteria was observed at ORP levels as low as 500 mV, with a complete reduction achieved around 600 mV. Similarly, the ozone-treated “Pre” samples (Figure 3c) showed a near-complete elimination of aerobic bacteria at 550–600 mV. For the “Post” samples, ORP levels of 700 mV and above were required for both water treatment systems for the near complete reduction of aerobic bacteria populations (Figure 3b,d). No significant differences were observed in the bacterial colony counts between the cold plasma and ozone treatments at an ORP level of 700 mV based on ANOVA at p = 0.05.

3.4. Effects of Cold Plasma and Ozone Treatment on Microbial ATP

The cold plasma and ozone treatments also reduced the microbial ATP levels. Figure 4 shows the reduction in the microbial ATP from the initial untreated control (expressed as the survival ratio using Weibull distribution) with an increase in ORP levels across the cold plasma and ozone treatments. In the cold plasma “Pre” samples (Figure 4a), the microbial ATP levels decreased rapidly between 300 and 500 mV, with nearly complete inactivation around 600–650 mV. The cold plasma “Post” samples (Figure 4b) showed a slightly more gradual decline and inactivation occurring near 700 mV. For the ozone “Pre” samples (Figure 4c), the microbial ATP survival curve demonstrates a sharp initial decline between 400 and 500 mV, followed by complete inactivation at 600 mV and above. In the ozone “Post” samples (Figure 4d), the microbial ATP levels showed a consistent decline across increasing ORP levels, with total inactivation between 700 and 800 mV. No significant differences were observed in the microbial ATP levels between the cold plasma and ozone treatments at an ORP level of 700 mV based on ANOVA at p = 0.05.

3.5. Correlation Between Microbial ATP and Petrifilm Aerobic Bacterial Counts

A moderate positive correlation was observed between the Petrifilm aerobic bacterial counts and microbial ATP levels measured using a luminometer (Table 2). Because the raw data were highly skewed and included zero values, a direct linear correlation was not appropriate without transformation. A power transformation (exponent = 0.13) was applied to both the microbial ATP and Petrifilm data to reduce skewness and meet assumptions of normality and homoscedasticity for the parametric test. A logarithmic transformation was not suitable due to the presence of zero values of the microbial ATP in the data. The microbial ATP is calculated by subtracting the free ATP from the total ATP. In cases where the free ATP exceeded the total ATP, probably because of measurement inaccuracies or inconsistencies in the treated samples, the microbial ATP was calculated as zero. This is demonstrated in Figure 5, where the free ATP occasionally exceeded the total ATP at some ORP levels.
Pearson’s correlation on the transformed data indicated a statistically significant moderate association (r = 0.39, p = 0.0003) between the Petrifilm aerobic bacterial counts and microbial ATP levels (Table 2). In addition, Spearman’s rank-based method, which does not assume normality, was used to confirm the relationship. Spearman’s rank correlation with ρ = 0.39 and p = 0.0004 supported a consistent monotonic association between the Petrifilm aerobic bacterial counts and microbial ATP. The p-values for both methods were <0.001, indicating that there was a positive association between the ATP and Petrifilm values, regardless of whether linear or rank-based methods were used.

4. Discussion

The efficacy of cold plasma and ozone treatments in microbial control can be attributed to their ability to produce ROS such as OH radicals, H2O2, and O3 (in case of ozone technology) [33,34]. These ROS, along with an increased ORP, enhance the oxidative capacity of the water, allowing it to disrupt microbial cells effectively. The ORP refers to the ability of water to oxidize contaminants, with higher ORP values corresponding to a stronger ability to break down microbial cells [35]. Studies show that ORP levels between 600 and 800 mV are needed for effective disinfestation [34]. At around 650–700 mV, ROS can pull electrons from microbial cell membranes, destabilizing and causing cell death [36]. Pathogenic bacteria such as E. coli and Salmonella are inactivated within 30 s at this ORP range, whereas spoilage yeast and sensitive fungi are similarly neutralized within a few minutes. Similarly, maintaining an ORP level of at least 780 mV in chlorinated water was needed for the complete mortality of Pythium aphanidermatum and Pythium dissotocum zoospores, but this response was pH-dependent [37]. In addition to ORP, the ozone dosage produced by cold plasma and ozone plays a crucial role in determining the efficacy of water disinfestation. The disinfestation efficacy of ozone is influenced by its concentration and exposure time. For instance, Pectobacterium carotovorum was completely inactivated at 0.5 mg/L ozone with a 1 min contact time, whereas Fusarium oxysporum conidia required a higher dosage of 1 mg/L ozone for 10 min [38,39]. More resilient pathogens, such as viruses, require higher ozone doses and ORP levels. Cucumber green mottle mosaic virus (CGMMV) was completely inactivated with 7.9 mg/L ozone and a corresponding ORP of 673 mV after 75 min, whereas Tomato mosaic virus (ToMV) required 100 mg/L ozone for 30 min at an ORP of 517 mV to achieve 99% inactivation [40]. The susceptibility to cold plasma varies across microbial species and life stages due to structural differences. Bacteria, including their spores, are inactivated more rapidly than fungi, even under lower plasma dosage. Fungal spores, such as those of Aspergillus oryzae, are more resistant and can survive extended exposure, likely due to their protective encapsulation. In contrast, vegetative yeast cells are more easily inactivated as they lack such protective structures [41,42]. These findings highlight the importance of achieving optimal ozone concentrations and ORP levels for the effective disinfestation of different species of plant pathogens. The ability of cold plasma and ozone treatments to generate high ORP and ozone levels with highly reactive ROS underscores their efficacy for controlling a wide range of microbial contaminants in water.
In this study, the ozone and cold plasma treatments were highly effective in reducing fungal populations at elevated ORP levels (Figure 2). The difference in the ORP requirements between the “Pre” and “Post” samples could be attributed to the transient nature of ROS and the initial microbial load at each sampling point. In the reservoir “Pre” samples, the ORP levels were more stable because ROS had time to generate and disperse evenly, allowing oxidation reactions to proceed throughout the water. In contrast, in the “Post” samples, the ORP is measured immediately after water exits the reactor, where the ROS concentrations are at their highest but have not yet fully interacted with the entire microbial load or organic material present in the water. As a result, a higher initial ORP is needed in the “Post” samples to ensure sufficient ROS diffusion and microbial exposure for effective inactivation. At the higher ORP levels achieved in this study, the oxidative stress generated by ROS likely disrupted fungal cell walls and membranes, leading to near-complete inactivation [43]. This finding aligns with several studies evaluating the impact of cold plasma and ozone on fungal populations, although most of these studies were conducted on surfaces, plants, and post-harvest produce. For example, Ref. [44] found a 2.84-log reduction in yeast and mold counts on mung bean sprouts after being treated with plasma-activated water for 30 min. Similarly, Ref. [45] observed a reduction of 0.5 log in fungal counts in button mushrooms during storage after soaking in plasma-activated water, highlighting the effectiveness of cold plasma in fungal disinfestation. Additionally, the role of ozone in controlling the fungal spores on surfaces was reported by [46], whereby the ozone dosages of 10 to 19 mg were sufficient to achieve 50 to 80% inactivation of yeast species, whereas higher dosages of 60 to 120 mg were required for molds like Penicillium.
In addition to their effects on fungal populations, the cold plasma and ozone treatments also demonstrated significant efficacy in reducing aerobic bacterial populations (Figure 3). These findings are consistent with other studies that highlight the efficacy of cold plasma and ozone in reducing bacterial loads. For example, Ref. [47] reported that atmospheric cold plasma treatment for 60 s could reduce the E. coli to undetectable levels, whereas a significant reduction in the population of L. monocytogens and S. aureus was obtained with cold plasma treatment for 300 s. The mechanism for bacterial inactivation with cold plasma is reported to involve the reactive oxygen and nitrogen species (RONS), particularly hydroxyl radicals, which attack bacterial cell membranes and DNA, leading to cellular damage and death [48]. Additionally, Ref. [49] demonstrated that cold plasma treatment significantly inhibited the growth of aerobic bacteria on fresh-cut pears during cold storage, outperforming sodium hypochlorite treatment. This highlights the use of cold plasma treatment as a viable alternative for microbial disinfestation. Similarly, ozone treatment has been found to effectively inhibit various bacteria, including Gram-negative species such as E. coli and Salmonella and Gram-positive species such as Staphylococcus aureus and Bacillus subtilis [50]. Significant inactivation was reported within 30 min of ozone treatment at lower initial bacterial concentrations (103–105 CFU/mL), though higher concentrations (106–107 CFU/mL) required optimal dosages for effective results. Further structural analysis revealed that ozone caused severe damage to cell membranes, leading to cell lysis.
Microbial ATP is widely used as a reliable indicator of biological activity, as it reflects the metabolic energy within living cells, making it an effective measure for assessing cell viability in water systems [21]. ATP levels, particularly those of intracellular ATP, are generally considered to reflect viable, metabolically active microorganisms, whereas extracellular ATP may originate from lysed or dead cells and can overestimate microbial activity [51]. For this reason, we focused on measuring the intracellular ATP by subtracting free ATP from total ATP to better estimate the microbial viability. In this study, the microbial ATP levels were significantly reduced following treatment with ozone and cold plasma, indicating the effective inhibition of biological activity in the water samples. These results align with prior studies exploring the impact of ozone on the microbial ATP levels in treated sludge, where a marked reduction in the microbial biomass and ATP concentration was noted following increased ozone exposure [52]. Tian et al. observed a 70.89% reduction in ATP concentration at an ozone dosage of 135 mg O3/g total suspended solids (TSS), suggesting that heightened oxidative conditions promote microbial cell disruption and ATP depletion. Similarly, studies investigating cold plasma treatment have shown that ROS are generated during plasma–water interactions and are responsible for disrupting microbial energy metabolism. Ref. [53] found that plasma treatment led to microbial dysfunction in yeast cells by affecting mitochondrial membrane potential and subsequently lowering ATP synthesis due to oxidative stress-induced membrane damage.
In this study, we evaluated Petrifilm and ATP as rapid microbial quantification tools, aiming to correlate their responses under cold plasma and ozone treatments for microbial water quality assessment. Petrifilm provides CFU counts as a culture-based measurement, whereas the ATP test provides a broader measure of the total microbial activity by quantifying the cellular energy levels in RLU. Few studies have investigated the correlation between ATP and traditional culture-based methods like Petrifilm and heterotrophic plate counts (HPC), with varying results. For example, Ref. [54] found weak correlations between ATP and HPC (R2 = 0.31) but a moderate correlation between ATP and flow cytometry (R2 = 0.69) for drinking water samples. Similarly, Ref. [55] observed a strong correlation between ATP and HPC in potable water (R = 0.90), but weaker correlations in non-potable samples, such as those from cooling tower waters, with R values ranging from 0.37 to 0.54. These findings suggest that while ATP can be a reliable indicator of the microbial concentration, its correlation with culture-based methods may depend on factors such as microbial composition, physiological state, and sample type.
We observed a moderate positive association between microbial ATP and Petrifilm aerobic bacterial counts. Pearson’s correlation of power-transformed data indicated a moderate linear relationship (r = 0.39, p = 0.0003). This result was further supported by Spearman’s rank correlation (ρ = 0.39, p = 0.0004), reflecting a positive monotonic association. These results are consistent with previous research showing low to moderate correlations between ATP and culture-based microbial counts in various water sources. Reference [12] reported a discernible correlation (R2 = 0.67) between ATP and plate counts in pure cultures of Pseudomonas fluorescens. In mixed cultures, however, the correlation was poor, with R2 values ranging from 0.01 to 0.47. This variability was attributed to differences in microbial physiology because ATP assays detect both actively growing and dormant cells, whereas Petrifilm only enumerates viable culturable bacteria. Therefore, the ATP assay might not always accurately reflect the culturable population, especially in systems where a significant portion of bacteria are in a viable but non-culturable state [51,56]. A study by [57] detected ATP in samples where no culturable bacteria or fungi were recovered, which was attributed to the possible presence of non-culturable microorganisms such as protozoa or anaerobic bacteria. The study also noted that residual sanitizing agents such as chlorine in the water may have suppressed microbial growth on culture media, while ATP from those organisms remained detectable. Furthermore, some microbes may require different incubation temperatures or growth conditions than those used in standard culture assays, resulting in culture-negative but ATP-positive results. Additionally, ATP methods can lack sensitivity at low microbial concentrations, as shown in previous studies [12], where ATP measurements were less reliable below 104 CFU/mL. Given these factors, the low correlation observed in our study between Petrifilm and ATP measurements may be attributed to the mixed microbial population present in surface water, where a significant portion of bacteria may exist in a viable but non-culturable state. Furthermore, the luminometer detects the total ATP (or free ATP) through a bioluminescent reaction, but several factors such as incomplete lysis of microbial cells can affect this signal. The kit’s reagents are formulated to rupture cells and release intracellular ATP (for the total ATP measurement), but certain microorganisms can be more difficult to lyse. For example, Ref. [58] reported that an ATP swabbing system had trouble efficiently detecting E. coli (Gram-negative) unless an extra sonication step was used, implying that standard reagents did not fully lyse those cells. In that study, the limit of detection for E. coli was higher (less sensitive) than for Gram-positive S. aureus, presumably due to incomplete cell lysis. Therefore, if our water samples contained hard-to-lyse bacteria, the ATP assay might have underreported their presence. Microbial diversity in surface water can also be a major challenge when interpreting ATP results since the amount of ATP per cell can differ greatly depending on the species and their physiological state. Studies have shown that cellular ATP levels vary across different microbial groups and environmental conditions, making it difficult to assume a fixed relationship between the ATP concentration and microbial biomass [59]. Although ATP bioluminescence assays are valuable for monitoring microbial activity in water systems, their use requires the careful consideration of factors such as extracellular ATP, microbial diversity, and the physiological state of microorganisms. The moderate correlation between ATP and Petrifilm in this study underscores these challenges. Additional research is required to gain a clearer understanding of how ATP levels relate to microbial counts in different water types.
Although the correlation between ATP and CFU in our study was moderate, combining ATP with culture-based methods like Petrifilm can still be useful for microbial monitoring. Most published studies comparing ATP with culture-based techniques have focused on traditional methods such as HPC or agar plates, but Petrifilm works in a similar way by growing culturable microbes and can be used in parallel. Previous research has shown that using ATP together with culture-based methods can strengthen disinfection monitoring in water samples. For instance, in a chloraminated drinking water system, the HPC results were mostly below detection (<1 CFU/mL in 90–98% of the samples), making it hard to guide operational decisions. In contrast, the ATP measurements showed clear changes over time and across locations, providing more useful information. The ATP test was sensitive enough to detect small increases in microbial activity even when the HPC showed zero [60]. This highlights how ATP can be a useful tool to support disinfection monitoring by detecting early signs of regrowth or residual biological activity that standard plate counts alone might miss. Similarly, Ref. [61] found that the ATP and HPC values of water samples collected from a chlorinated distribution system at Canadian utilities had only moderate correlation, but both tests led to the same water quality conclusions in 95% of the samples when threshold-based decisions were used. In another study, Ref. [62] showed that ATP bioluminescence assays could detect a >3-log reduction in Enterococcus faecium and Bacillus spore indicators within ~5 min after paracetic acid treatment, whereas traditional culture methods took 1–2 days to show equivalent inactivation. Used alongside conventional plate counts, the ATP assay enabled near real-time verification that the disinfection process was successful, thereby facilitating timely management decisions. Therefore, integrating ATP assays with other complementary techniques may help overcome the limitations of each method and improve the microbial monitoring accuracy.

5. Conclusions

This study demonstrated that cold plasma and ozone treatments were highly effective in reducing microbial populations in surface water, with similar inactivation effects observed at the same ORP levels. Both treatments were effective in reducing fungal and aerobic bacterial species, highlighting their potential for broad-spectrum microbial control. The correlation between ATP measurements and Petrifilm results was moderate, underscoring ATP as a useful indicator for assessing microbial activity, though its reliability may vary based on the microbial physiology and sample conditions. Future research could focus on optimizing ATP measurement techniques to enhance its sensitivity and reliability for microbial quantification in diverse water systems. By optimizing protocols for different water types and standardizing methods, ATP could become a more reliable tool for microbial quantification. Additionally, further research could focus on specific known pathogens, such as E. coli, Pseudomonas, or Pythium, to better understand the effects of cold plasma and ozone treatments on these pathogens and to improve ATP-based monitoring for more targeted and effective water treatment solutions.

Author Contributions

Conceptualization, P.R.F. and D.T.; methodology, P.R.F. and D.T.; formal analysis, D.T. and P.R.F.; investigation, D.T.; resources, P.R.F.; data curation, D.T.; writing—original draft preparation, D.T.; writing—review and editing, P.R.F.; funding acquisition, P.R.F. All authors have read and agreed to the published version of the manuscript.

Funding

This research was supported by the U.S. Department of Agriculture-Agricultural Research Service under the Floriculture and Nursery Research Initiative #58-3607-8-725, USDA National Institute of Food and Agriculture projects multi-state NC1186 and Hatch FLA-ENH-005918. Industry funding was provided by Ingersoll Rand and partners in the Floriculture Research Alliance at the University of Florida (https://floriculturealliance.org).

Data Availability Statement

The data presented in this study are available on request from the corresponding author.

Acknowledgments

The authors would like to thank Simon S. Riley for the valuable assistance with the statistical analysis.

Conflicts of Interest

The authors declare no conflicts of interest.

References

  1. Murdoch, P.S.; Baron, J.S.; Miller, T.L. Potential effects of climate change on surface-water quality in North America. J. Am. Water Resour. Assoc. 2007, 36, 347–366. [Google Scholar] [CrossRef]
  2. Wang, Y.; Wang, P.; Bai, Y.; Tian, Z.; Li, J.; Shao, X.; Mustavich, L.; Li, B. Assessment of surface water quality via multivariate statistical techniques: A case study of the Songhua River Harbin region, China. J. Hydroenviron. Res. 2013, 7, 30–40. [Google Scholar] [CrossRef]
  3. Jin, D.; Kong, X.; Cui, B.; Jin, S.; Xie, Y.; Wang, X.; Deng, Y. Bacterial communities and potential waterborne pathogens within the typical urban surface waters. Sci. Rep. 2018, 8, 13368. [Google Scholar] [CrossRef] [PubMed]
  4. Silva, V.; Caniça, M.; Capelo, J.L.; Igrejas, G.; Poeta, P. Diversity and genetic lineages of environmental Staphylococci: A surface water overview. FEMS Microbiol. 2020, 96, fiaa191. [Google Scholar] [CrossRef]
  5. Bell, R.L.; Kase, J.A.; Harrison, L.M.; Balan, K.V.; Babu, U.; Chen, Y.; Macarisin, D.; Kwon, H.J.; Zheng, J.; Stevens, E.L.; et al. The Persistence of Bacterial Pathogens in Surface Water and Its Impact on Global Food Safety. Pathogens 2021, 10, 1391. [Google Scholar] [CrossRef] [PubMed]
  6. Hong, C.; Moorman, G. Plant pathogens in irrigation water: Challenges and opportunities. Crit. Rev. Plant Sci. 2005, 24, 189–208. [Google Scholar] [CrossRef]
  7. Yin, W.; Wang, Y.; Liu, L.; He, J. Biofilms: The microbial “protective clothing” in extreme environments. Int. J. Mol. Sci. 2019, 20, 3423. [Google Scholar] [CrossRef]
  8. Kanarek, P.; Breza-Boruta, B.; Rolbiecki, R. Microbial composition and formation of biofilms in agricultural irrigation systems-a review. Ecohydrol. Hydrobiol. 2023, 24, 583–590. [Google Scholar] [CrossRef]
  9. Bucks, D.A.; Nakayama, F.S.; Gilbert, R.G. Trickle irrigation water quality and preventive maintenance. Agric. Water Manag. 1979, 2, 149–162. [Google Scholar] [CrossRef]
  10. Meador, D.P.; Fisher, P.R.; Guy, C.L.; Harmon, P.F.; Peres, N.A.; Teplitski, M. Using a dehydrated agar to estimate microbial water quality for horticulture irrigation. J. Environ. Qual. 2016, 45, 1445–1451. [Google Scholar] [CrossRef]
  11. Rogers, D.H.; Lamm, F.R.; Alam, M. Subsurface Drip Irrigation Systems Water Quality Assessment Guidelines; MF2575 SDI Water Quality Assessment Guideline; Kansas State University Agricultural Experiment Station and Cooperative Extension Service: Manhattan, KS, USA, 2003. [Google Scholar]
  12. Mueller, S.A.; Anderson, J.E.; Kim, B.R.; Ball, J.C. Comparison of plate counts, Petrifilm, dipslides, and adenosine triphosphate bioluminescence for monitoring bacteria in cooling-tower waters. Water Environ. Res. 2009, 81, 401–406. [Google Scholar] [CrossRef] [PubMed]
  13. Vail, J.H.; Morgan, R.; Merino, C.R.; Gonzales, F.; Miller, R.; Ram, J.L. Enumeration of waterborne Escherichia coli with petrifilm plates: Comparison to standard methods. J. Environ. Qual. 2003, 32, 368–373. [Google Scholar] [CrossRef] [PubMed]
  14. Meador, D.P.; Fisher, P.R.; Teplitski, M. The Use of Petrifilms to Quantify Aerobic Bacteria in Irrigation Water. Proc. Fla. State Hort. Soc. 2012, 125, 340–342. [Google Scholar]
  15. Fritz, B.G.; Walker, D.K.; Goveia, D.E.; Parker, A.E.; Goeres, D.M. Evaluation of Petrifilm™ aerobic count plates as an equivalent alternative to drop plating on R2A agar plates in a biofilm disinfectant efficacy test. Curr. Microbiol. 2015, 70, 450–456. [Google Scholar] [CrossRef]
  16. Nelson, M.T.; LaBudde, R.A.; Tomasino, S.F.; Pines, R.M. Comparison of 3M Petrifilm Aerobic Count Plates to standard plating methodology for use with AOAC antimicrobial efficacy methods 955.14, 955.15, 964.02, and 966.04 as an alternative enumeration procedure: Collaborative study. J. AOAC Int. 2013, 96, 717–722. [Google Scholar] [CrossRef]
  17. Berney, M.; Weilenmann, H.U.; Egli, T. Flow-cytometric study of vital cellular functions in Escherichia coli during solar disinfection (SODIS). Microbiology 2006, 152, 1719–1729. [Google Scholar] [CrossRef]
  18. Karl, D.M. Cellular nucleotide measurements and applications in microbial ecology. Microbiol. Rev. 1980, 44, 739–796. [Google Scholar] [CrossRef]
  19. Zhang, K.; Pan, R.; Zhang, T.; Xu, J.; Zhou, X.; Yang, Y. A novel method: Using an adenosine triphosphate (ATP) luminescence-based assay to rapidly assess the biological stability of drinking water. Appl. Microbiol. Biotechnol. 2019, 103, 4269–4277. [Google Scholar] [CrossRef]
  20. Liu, G.; Ling, F.Q.; Magic-Knezev, A.; Liu, W.T.; Verberk, J.Q.J.C.; Van Dijk, J.C. Quantification and identification of particle-associated bacteria in unchlorinated drinking water from three treatment plants by cultivation-independent methods. Water Res. 2013, 47, 3523–3533. [Google Scholar] [CrossRef]
  21. Hammes, F.; Goldschmidt, F.; Vital, M.; Wang, Y.Y.; Egli, T. Measurement and interpretation of microbial adenosine triphosphate (ATP) in aquatic environments. Water Res. 2010, 44, 3915–3923. [Google Scholar] [CrossRef]
  22. Glaze, W.H. Drinking-water treatment with ozone. Environ. Sci. Technol. 1987, 21, 224–230. [Google Scholar] [CrossRef]
  23. Fisher, P. Water Treatment for Pathogens and Algae. Originally Published in GMPro Magazine. 2009. Available online: http://www.plantgrower.org/uploads/6/5/5/4/65545169/water_quality_series_from_gmpro.pdf (accessed on 9 December 2024).
  24. Mahanta, S.; Habib, M.R.; Moore, J.M. Effect of high-voltage atmospheric cold plasma treatment on germination and heavy metal uptake by soybeans (Glycine max). Int. J. Mol. Sci. 2022, 23, 1611. [Google Scholar] [CrossRef] [PubMed]
  25. Ikawa, S.; Tani, A.; Nakashima, Y.; Kitano, K. Physicochemical properties of bactericidal plasma-treated water. J. Phys. D Appl. Phys. 2016, 49, 425401. [Google Scholar] [CrossRef]
  26. Zhang, Q.; Ma, R.; Tian, Y.; Su, B.; Wang, K.; Yu, S.; Zhang, J.; Fang, J. Sterilization efficiency of a novel electrochemical disinfectant against Staphylococcus aureus. Environ. Sci. Technol. 2016, 50, 3184–3192. [Google Scholar] [CrossRef] [PubMed]
  27. Park, J.Y.; Park, S.; Choe, W.; Yong, H.I.; Jo, C.; Kim, K. Plasma-functionalized solution: A potent antimicrobial agent for biomedical applications from antibacterial therapeutics to biomaterial surface engineering. ACS Appl. Mater. Interfaces 2017, 9, 43470–43477. [Google Scholar] [CrossRef]
  28. Raudales, R.E.; Fisher, P.R.; Hall, C.R. The cost of irrigation sources and water treatment in greenhouse production. Irrig. Sci. 2016, 35, 43–54. [Google Scholar] [CrossRef]
  29. Peleg, M. Microbial inactivation kinetics models, survival curves shapes, and the temporal distributions of the individual germs deactivation. Food Eng. Rev. 2024, 16, 163–178. [Google Scholar] [CrossRef]
  30. USEPA. Guidelines for Water Reuse. 2012. Available online: https://www3.epa.gov/region1/npdes/merrimackstation/pdfs/ar/AR-1530.pdf (accessed on 21 March 2025).
  31. Farrell, C.; Hassard, F.; Jefferson, B.; Leziart, T.; Nocker, A.; Jarvis, P. Turbidity composition and the relationship with microbial attachment and UV inactivation efficacy. Sci. Total Environ. 2018, 624, 638–647. [Google Scholar] [CrossRef]
  32. Adhikari, A.; Parraga Estrada, K.J.; Chhetri, V.S.; Janes, M.; Fontenot, K.; Beaulieu, J.C. Evaluation of ultraviolet (UV-C) light treatment for microbial inactivation in agricultural waters with different levels of turbidity. Food Sci. Nutr. 2020, 8, 1237–1243. [Google Scholar] [CrossRef]
  33. Foster, J.E. Plasma-based water purification: Challenges and prospects for the future. Phys. Plasmas. 2017, 24, 055501. [Google Scholar] [CrossRef]
  34. Nguyen, N.H.; Cuong, L.C.; Dieu, T.V.; Ngu, T.W.; Oanh, D.T. Ozonation process and water disinfection. Vietnam J. Chem. 2018, 56, 717–720. [Google Scholar] [CrossRef]
  35. Gao, Y.; Francis, K.; Zhang, X. Review on formation of cold plasma activated water (PAW) and the applications in food and agriculture. Food Res. Int. 2022, 157, 111246. [Google Scholar] [CrossRef]
  36. Suslow, T.V. Oxidation-Reduction Potential (ORP) for Water Disinfection Monitoring, Control, and Documentation; ANR Publishing: New York, NY, USA, 2004; Available online: https://anrcatalog.ucanr.edu/pdf/8149.pdf (accessed on 21 March 2025).
  37. Lang, J.M.; Rebits, B.; Newman, S.E.; Tisserat, N. Monitoring mortality of Pythium zoospores in chlorinated water using oxidation reduction potential. Plant Health Prog. 2008, 9, 9. [Google Scholar] [CrossRef]
  38. Igura, N.; Fujii, M.; Shimoda, M.; Hayakawa, I. Research Note: Inactivation Efficiency of Ozonated Water for Fusarium oxysporum Conidia Under Hydroponic Greenhouse Conditions. Ozone Sci. Eng. 2004, 26, 517–521. [Google Scholar] [CrossRef]
  39. Kobayashi, F.; Ikeura, H.; Ohsato, S.; Goto, T.; Tamaki, M. Disinfection using ozone microbubbles to inactivate Fusarium oxysporum f. sp. melonis and Pectobacterium carotovorum subsp. carotovorum. Crop Prot. 2011, 30, 1514–1518. [Google Scholar] [CrossRef]
  40. Runia, W.T. Disinfection of recirculation water from closed cultivation systems with ozone. Acta Hortic. 1994, 361, 388–396. [Google Scholar] [CrossRef]
  41. Scholtz, V.; Julák, J.; Kříha, V. The microbicidal effect of low-temperature plasma generated by corona discharge: Comparison of various microorganisms on an agar surface or in aqueous suspension. Plasma Process. Polym. 2010, 7, 237–243. [Google Scholar] [CrossRef]
  42. Soušková, H.; Scholtz, V.; Julák, J.; Kommová, L.; Savická, D.; Pazlarová, J. The survival of micromycetes and yeasts under the low-temperature plasma generated in electrical discharge. Folia Microbiol. 2011, 56, 77–79. [Google Scholar] [CrossRef]
  43. Tian, Y.; Ma, R.; Zhang, Q.; Feng, H.; Liang, Y.; Zhang, J.; Fang, J. Assessment of the physicochemical properties and biological effects of water activated by non-thermal plasma above and beneath the water surface. Plasma Process. Polym. 2014, 12, 439–449. [Google Scholar] [CrossRef]
  44. Xiang, Q.; Liu, X.; Liu, S.; Ma, Y.; Xu, C.; Bai, Y. Effect of plasma-activated water on microbial quality and physicochemical characteristics of mung bean sprouts. Innov. Food Sci. Emerg. Technol. 2019, 52, 49–56. [Google Scholar] [CrossRef]
  45. Xu, Y.; Tian, Y.; Ma, R.; Liu, Q.; Zhang, J. Effect of plasma activated water on the postharvest quality of button mushrooms, Agaricus bisporus. Food Chem. 2016, 197, 436–444. [Google Scholar] [CrossRef] [PubMed]
  46. Li, C.S.; Wang, Y.C. Surface Germicidal Effects of Ozone for Microorganisms. AIHA J. 2010, 64, 533–537. [Google Scholar] [CrossRef]
  47. Ziuzina, D.; Boehm, D.; Patil, S.; Cullen, P.J.; Bourke, P. Cold plasma inactivation of bacterial biofilms and reduction of quorum sensing regulated virulence factors. PLoS ONE 2015, 10, e0138209. [Google Scholar] [CrossRef]
  48. Mai-Prochnow, A.; Zhou, R.; Zhang, T.; Ostrikov, K.; Mugunthan, S.; Rice, S.A.; Cullen, P.J. Interactions of plasma-activated water with biofilms: Inactivation, dispersal effects and mechanisms of action. npj Biofilms Microbiomes 2021, 7, 11. [Google Scholar] [CrossRef]
  49. Chen, C.; Liu, C.; Jiang, A.; Guan, Q.; Sun, X.; Liu, S.; Hao, K.; Hu, W. The Effects of Cold Plasma-Activated Water Treatment on the Microbial Growth and Antioxidant Properties of Fresh-Cut Pears. Food Bioprocess Technol. 2019, 12, 1842–1851. [Google Scholar] [CrossRef]
  50. Thanomsub, B.; Anupunpisit, V.; Chanphetch, S.; Watcharachaipong, T.; Poonkhum, R.; Srisukonth, C. Effects of ozone treatment on cell growth and ultrastructural changes in bacteria. J. Gen. Appl. Microbiol. 2002, 48, 193–199. [Google Scholar] [CrossRef]
  51. Bonadonna, L.; Briancesco, R.; Giuseppina, R.L. Innovative analytical methods for monitoring microbiological and virological water quality. Microchem. J. 2019, 150, 104160. [Google Scholar] [CrossRef]
  52. Tian, S.; Tian, Z.; Yang, H.; Yang, M.; Zhang, Y. Detection of viable bacteria during sludge ozonation by the combination of ATP assay with PMA-Miseq sequencing. Water 2017, 9, 166. [Google Scholar] [CrossRef]
  53. Xu, H.; Zhu, Y.; Du, M.; Wang, Y.; Ju, S.; Ma, R.; Jiao, Z. Subcellular mechanism of microbial inactivation during water disinfection by cold atmospheric-pressure plasma. Water Res. 2021, 188, 116513. [Google Scholar] [CrossRef]
  54. Siebel, E.; Wang, Y.; Thomas, E.; Frederik, H. Correlations between total cell concentration, total adenosine tri-phosphate concentration and heterotrophic plate counts during microbial monitoring of drinking water. Drink. Water Eng. Sci. Discuss. 2008, 1, 71–86. [Google Scholar] [CrossRef]
  55. Duda, S.; Baron, J.L.; Wagener, M.M.; Vidic, R.D.; Stout, J.E. Lack of correlation between Legionella colonization and microbial population quantification using heterotrophic plate count and adenosine triphosphate bioluminescence measurement. Environ. Monit. Assess. 2015, 187, 393. [Google Scholar] [CrossRef]
  56. Helmi, K.; David, F.; Di Martino, P.; Jaffrezic, M.P.; Ingrand, V. Assessment of flow cytometry for microbial water quality monitoring in cooling tower water and oxidizing biocide treatment efficiency. J. Microbiol. Methods 2018, 152, 201–209. [Google Scholar] [CrossRef]
  57. Arroyo, M.G.; Ferreira, A.M.; Frota, O.P.; Rigotti, M.A.; Andrade, D.; Brizzotti, N.S.; Peresi, J.T.M.; Castilho, E.M.; Almeida, M.T.G. Effectiveness of ATP bioluminescence assay for presumptive identification of microorganisms in hospital water sources. BMC Infect Dis. 2017, 17, 458. [Google Scholar] [CrossRef]
  58. Turner, D.E.; Daugherity, E.K.; Altier, C.; Maurer, K.J. Efficacy and limitations of an ATP-based monitoring system. J. Am. Assoc. Lab. Anim. Sci. 2010, 49, 90–195. [Google Scholar]
  59. Lanpher, K.B.; Popendorf, K.J. Variability of microbial particulate ATP concentrations in subeuphotic microbes due to underlying metabolic strategies in the South Pacific Ocean. Front. Mar. Sci. 2021, 8, 655898. [Google Scholar] [CrossRef]
  60. Maal-Bared, R.; McCracken, M.; Busawon, B.; Simpson, D. Monitoring adenosine triphosphate concentrations in a chloraminated drinking water distribution system for risk and asset management. Water 2023, 15, 1636. [Google Scholar] [CrossRef]
  61. Chen, W.S.; Abkar, L.; Mohseni, M. Evaluating ATP testing for distribution system monitoring: Comparison to HPC, impact of chlorine quenching, and hold time dependency. J. Biol. Eng. 2024, 18, 63. [Google Scholar] [CrossRef]
  62. Park, E.; Lee, C.; Bisesi, M.; Lee, J. Efficiency of peracetic acid in inactivating bacteria, viruses, and spores in water determined with ATP bioluminescence, quantitative PCR, and culture-based methods. J. Water Health 2014, 12, 13–23. [Google Scholar] [CrossRef]
Figure 1. ORP measurements over time (minutes) for surface water samples with ozone and cold plasma water treatments. Each data point indicates the ORP value recorded at a given time for each replication under ozone or cold plasma treatment.
Water 17 01856 g001
Figure 2. Petrifilm yeast and mold counts with change in ORP (mV) over time represented using Weibull distribution survival ratio for cold plasma-treated samples collected from (a) reservoir “Pre” and (b) immediately after the injector “Post”, and ozone-treated samples collected from (c) reservoir “Pre” and (d) immediately after the injector “Post”. Each data point represents the average of three replicate subsamples with three experimental runs for cold plasma and two experimental runs for ozone.
Water 17 01856 g002
Figure 3. Petrifilm aerobic bacteria count in relative units from zero to one (by dividing raw data by the colony forming units/mL of the untreated control from each experimental run) compared with ORP (mV) using the Weibull distribution survival ratio for cold plasma-treated samples collected from (a) reservoir “Pre” and (b) immediately after the injector “Post”, and ozone-treated samples collected from (c) reservoir “Pre” and (d) immediately after the injector “Post”. Each data point represents the average of three replicate subsamples with three experimental runs for each treatment technology.
Water 17 01856 g003
Figure 4. Microbial ATP in relative units from zero to one (by dividing raw data by the RLU of the untreated control from each experimental run) compared with ORP (mV) using the Weibull distribution survival ratio for cold plasma-treated samples collected from (a) reservoir “Pre” and (b) immediately after the injector “Post”, and ozone-treated samples collected from (c) reservoir “Pre” and (d) immediately after the injector “Post”. Each data point represents the average of three replicate subsamples with three experimental runs for each treatment technology.
Water 17 01856 g004
Figure 5. Total, free, and microbial ATP of the samples collected from reservoir “Pre” measured at varying ORP levels with ozone and cold plasma treatments. Each data point represents the average of three replicate subsamples within an experimental run for each treatment technology.
Water 17 01856 g005
Table 1. Initial surface water quality parameters before water treatment.
ParameterMean ± Standard Error
Petrifilm (CFU/mL)Aerobic bacteria42,550 ± 13,316
Yeasts and molds510 ± 219
ATP (RLU)Total1374 ± 363
Free507 ± 193
Microbial867 ± 198
ORP (mV)221 ± 9
DO (mg/L)5.87 ± 0.56
DO saturation (%)66.8 ± 6.3
Temp °C21.8 ± 0.2
pH7.33 ± 0.06
EC (mS/cm)0.27 ± 0.03
Turbidity (NTU)3.93 ± 0.13
Table 2. Correlation coefficients for the relationship between aerobic bacterial counts measured with 3M Petrifilm™ and microbial ATP measured with the Hygiena EnSURE luminometer across both cold plasma and ozone treatments.
MethodCorrelation Coefficientp-Value95% Confidence Interval
Pearson’s correlation (Power = 0.13)0.390.00030.19–0.57
Spearman’s rank correlation (ρ)0.390.00040.16–0.58
Disclaimer/Publisher’s Note: The statements, opinions and data contained in all publications are solely those of the individual author(s) and contributor(s) and not of MDPI and/or the editor(s). MDPI and/or the editor(s) disclaim responsibility for any injury to people or property resulting from any ideas, methods, instructions or products referred to in the content.

