Article

Lithological Controls on Chemical Weathering and CO2 Consumption at Small Watershed Scale: Insights from Hydrochemistry and Stable Carbon Isotope

1
MOE Key Laboratory of Groundwater Quality and Health & Hubei Key Laboratory of Yangtze River Basin Environmental Aquatic Science, School of Environmental Studies, China University of Geosciences, Wuhan 430078, China
2
Nanjing Institute of Environmental Sciences, Ministry of Ecology and Environment of China, Nanjing 210042, China
3
Guangdong Geologic Survey Institute, Guangzhou 510080, China
4
Shandong Institute of Geophysical and Geochemical Exploration, Jinan 250013, China
*
Author to whom correspondence should be addressed.
Water 2025, 17(13), 2008; https://doi.org/10.3390/w17132008
Submission received: 10 May 2025 / Revised: 20 June 2025 / Accepted: 1 July 2025 / Published: 4 July 2025
(This article belongs to the Special Issue Water–Rock Interaction)

Abstract

Previous investigations into lithology-driven weathering processes have largely emphasized large-scale spatial assessments, while studies targeting small watershed scales remain scarce. This study investigated two adjacent watersheds (Chengjia: CJ; Datan: DT) under comparable climatic conditions in Guangdong, China, using hydrochemistry and stable carbon isotopes. The CJ watershed exhibited low-TDS (20–66 mg/L) HCO3-Na·Ca-type waters dominated by silicate weathering, whereas the DT watershed displayed high-TDS (70–278 mg/L) HCO3-Ca-type waters, indicative of mixed carbonate–silicate weathering. Results of carbon isotope composition of dissolved inorganic carbon confirmed that H2CO3-driven weathering was the dominant mechanism in both watersheds. In the CJ watershed, 79.5% of dissolved cations in surface water originated from silicate weathering, yielding a CO2 consumption rate (CCR) of 0.28 × 10⁶ mol/km2/yr, while carbonate weathering was negligible. Conversely, in the DT watershed, 86.4% of dissolved cations were derived from carbonate weathering, yielding a CCR of 1.94 × 10⁶ mol/km2/yr, whereas silicate weathering contributed only 10.3% of cations with a CCR of 0.23 × 10⁶ mol/km2/yr. The chemical weathering rate of carbonate can be up to 10 times that of silicate, resulting in a larger CCR. This study demonstrated the key impact of lithology on hydrochemical characteristics and CO2 consumption at small watershed scales.

1. Introduction

Chemical weathering, involving the dissolution of silicate and carbonate rocks, plays a critical role in the global carbon cycle [1,2,3]. The dissolution of silicate minerals (Equations (1) and (2)) and carbonate minerals (Equation (3)) by carbonic acid (H2CO3) facilitates the transfer of atmospheric/soil CO2 to aquatic systems, where it is converted to dissolved inorganic carbon (DIC) and ultimately transported to the ocean for long-term storage [4,5]. However, dissolution of silicate and carbonate minerals (Equation (3)) by H2SO4 (Equation (4)) and HNO3 (Equation (5)) does not capture CO2 [6,7]. A fundamental distinction exists between silicate and carbonate weathering in terms of their carbon cycle impacts. Silicate weathering represents a permanent carbon sink, as the subsequent deposition processes do not release CO2 back to the atmosphere [8,9]. In contrast, carbonate weathering results in no net effect on atmospheric CO2 over geological timescales, as the carbon initially consumed during dissolution is subsequently released during carbonate precipitation in marine environments [10,11].
CaxMg1−xAl2Si2O8 + 2CO2 + 8H2O → xCa2+ + (1 − x)Mg2+ + 2HCO3 + 2H4SiO4 + 2Al(OH)3
NaxK1−xAlSi3O8 + CO2 + 8H2O → xNa+ + (1 − x)K+ + HCO3 + 3H4SiO4 + Al(OH)3
CaxMg1−xCO3 + CO2 + H2O → xCa2+ + (1 − x)Mg2+ + 2HCO3
2CaxMg1−xCO3 + H2SO4 → 2xCa2+ + 2(1 − x)Mg2+ + 2HCO3 + SO42−
CaxMg1−xCO3 + HNO3 → xCa2+ + (1 − x)Mg2+ + HCO3 + NO3
In addition to reaction mechanisms, the weathering rate of silicate is significantly slower than that of carbonate [12,13]. Therefore, lithology is a key factor controlling chemical weathering and CO2 consumption [3,14]. Understanding the role of lithology in regulating rock weathering processes and CO2 consumption is crucial for accurately assessing the global carbon cycle and carbon sink potential.
The distinct weathering behaviors of silicate and carbonate lithologies yield characteristic solute signatures [15,16,17]. Silicate weathering continuously releases Ca2+, Mg2+, Na+, and K+ into water, whereas carbonate weathering primarily releases Ca2+ and Mg2+ [5,7]. These two processes lead to distinct hydrochemical compositions in natural waters [18,19]. Consequently, hydrochemical composition serves as a robust proxy for identifying dominant weathering processes and quantifying consequent CO2 consumption [20,21,22].
In addition to hydrochemical analysis, carbon isotope fractionation of dissolved inorganic carbon (DIC) can provide supplementary evidence for chemical weathering and CO2 consumption [23,24]. Under closed-system conditions, chemical weathering of silicate and carbonate consumes limited CO2, and the carbon isotope composition of DIC (δ13C-DIC) depends on the following endmembers [7,23,24,25]:
(1)
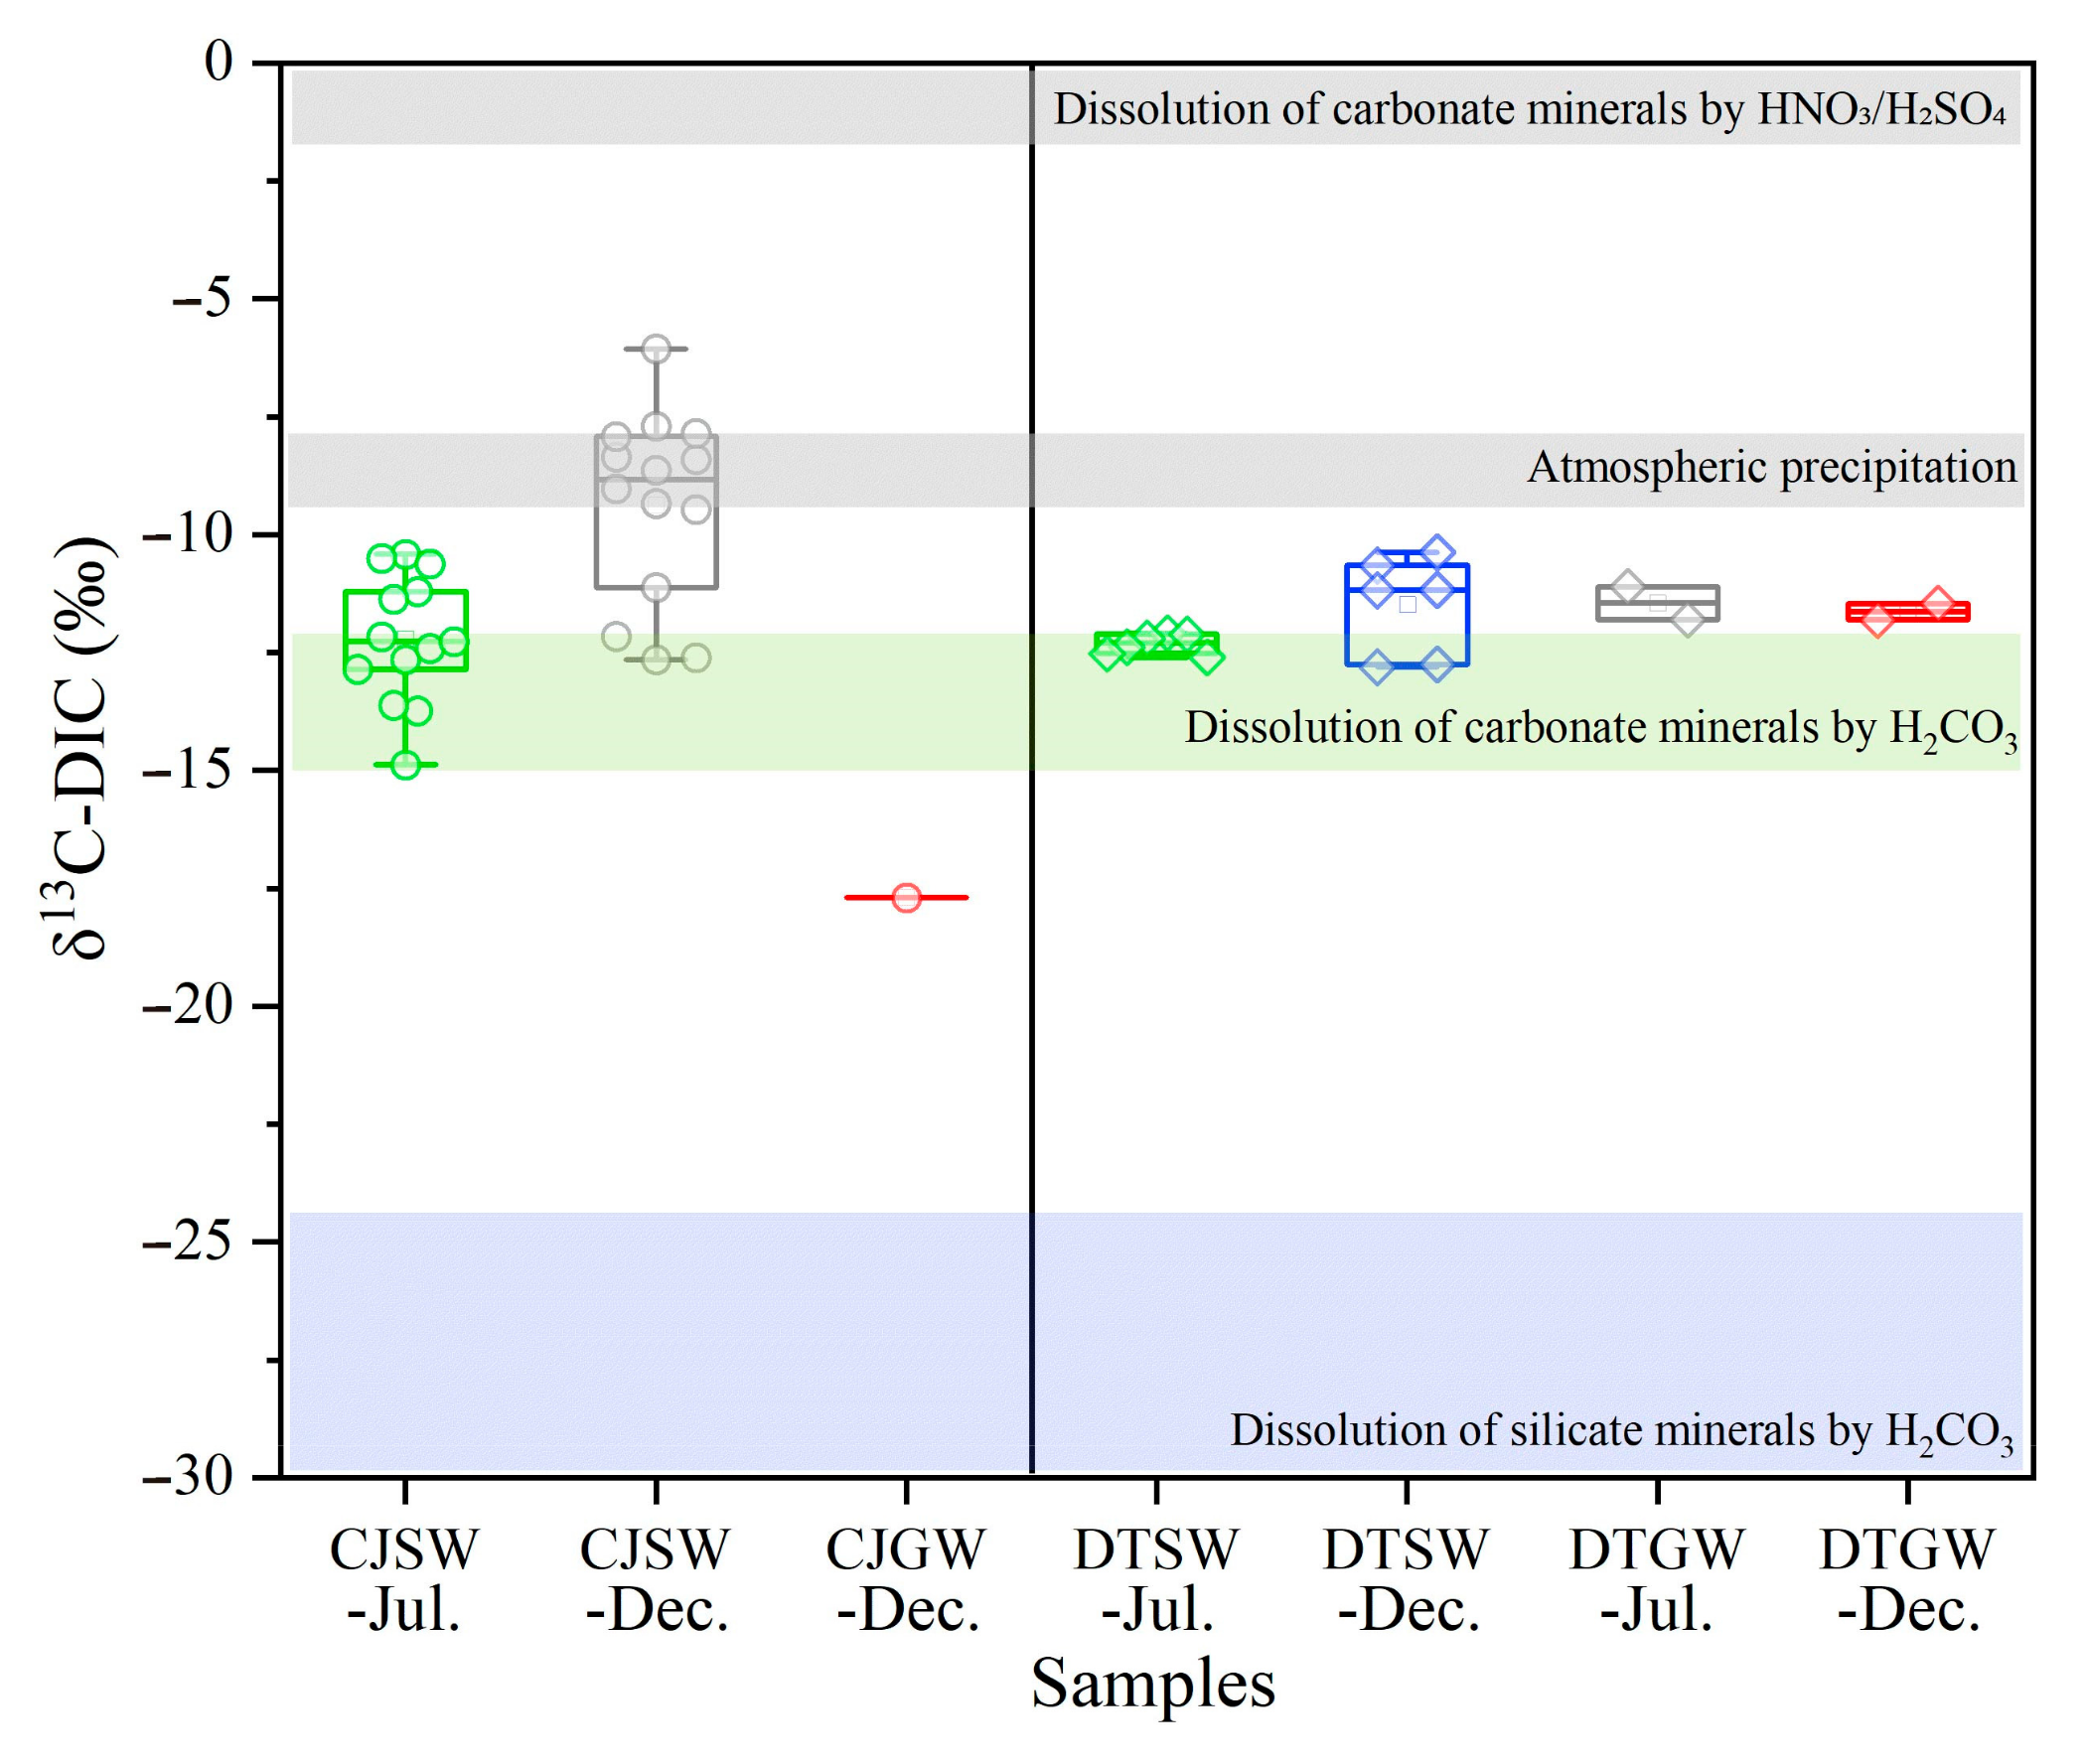
Silicate weathering by H2CO3 produces DIC entirely derived from soil CO2 (Equations (1) and (2)), preserving the soil CO2 isotopic signature. The δ13C values of CO2 derived from both root autotrophic respiration and heterotrophic decomposition of soil organic matter closely match those of the parent plant material [7]. For instance, the predominant C3 plants in South China yields δ13C-DIC values ranging from −30.0‰ to −24.2‰.
(2)
Carbonate weathering by H2CO3 produces DIC, with half derived from carbonate minerals (δ13C-DIC≈0‰) and half from soil CO213C-DIC≈−30.0‰ to −24.2‰) as shown in Equation (3), resulting in δ13C-DIC values of approximately −15.0‰ to −12.1‰.
(3)
Carbonate weathering by HNO3 or H2SO4 produces DIC entirely sourced from carbonate minerals (δ13C≈0‰) (Equations (4) and (5)), yielding δ13C-DIC values near 0‰.
Under open system conditions, atmospheric precipitation is a significant factor influencing the δ13C-DIC in aquatic systems [26]. The δ13C of atmospheric CO2 ranges from −8 to −6‰, with an average of −7‰ [27].
Previous studies have employed hydrogeochemistry and δ13C-DIC to investigate chemical weathering and CO2 consumption [5,7,10,12,21,23,24,28]. However, most research has focused on large-scale basins, where chemical weathering processes are influenced by multiple factors, including climate, lithology, soil, vegetation, and human activities [5,7,21]. The complexity of these interactions makes it difficult to isolate the impact of individual factors on CO2 consumption. In comparison, small watersheds with homogeneous environmental conditions offer ideal natural laboratories for controlled comparative studies, allowing clearer attribution of observed variations to specific weathering processes. Therefore, studies at small watershed scale can provide critical insights into chemical weathering and its influence on hydrogeochemical dynamics and CO2 consumption.
To elucidate the influence of lithology as a dominant variable on chemical weathering and hydrochemical processes at small watershed scale, this study selected two watersheds characterized by consistent climatic conditions, similar vegetation types, and minimal anthropogenic disturbance, but distinct lithologies. By analyzing seasonal variations in hydrochemical characteristics and δ13C-DIC in surface water and groundwater, this study aims to (1) investigate the hydrogeochemical characteristics of surface water and groundwater in these two watersheds; (2) identify the dominant chemical weathering processes in these two watersheds; and (3) assess the CO2 consumption induced by chemical weathering in these two watersheds.

2. Materials and Methods
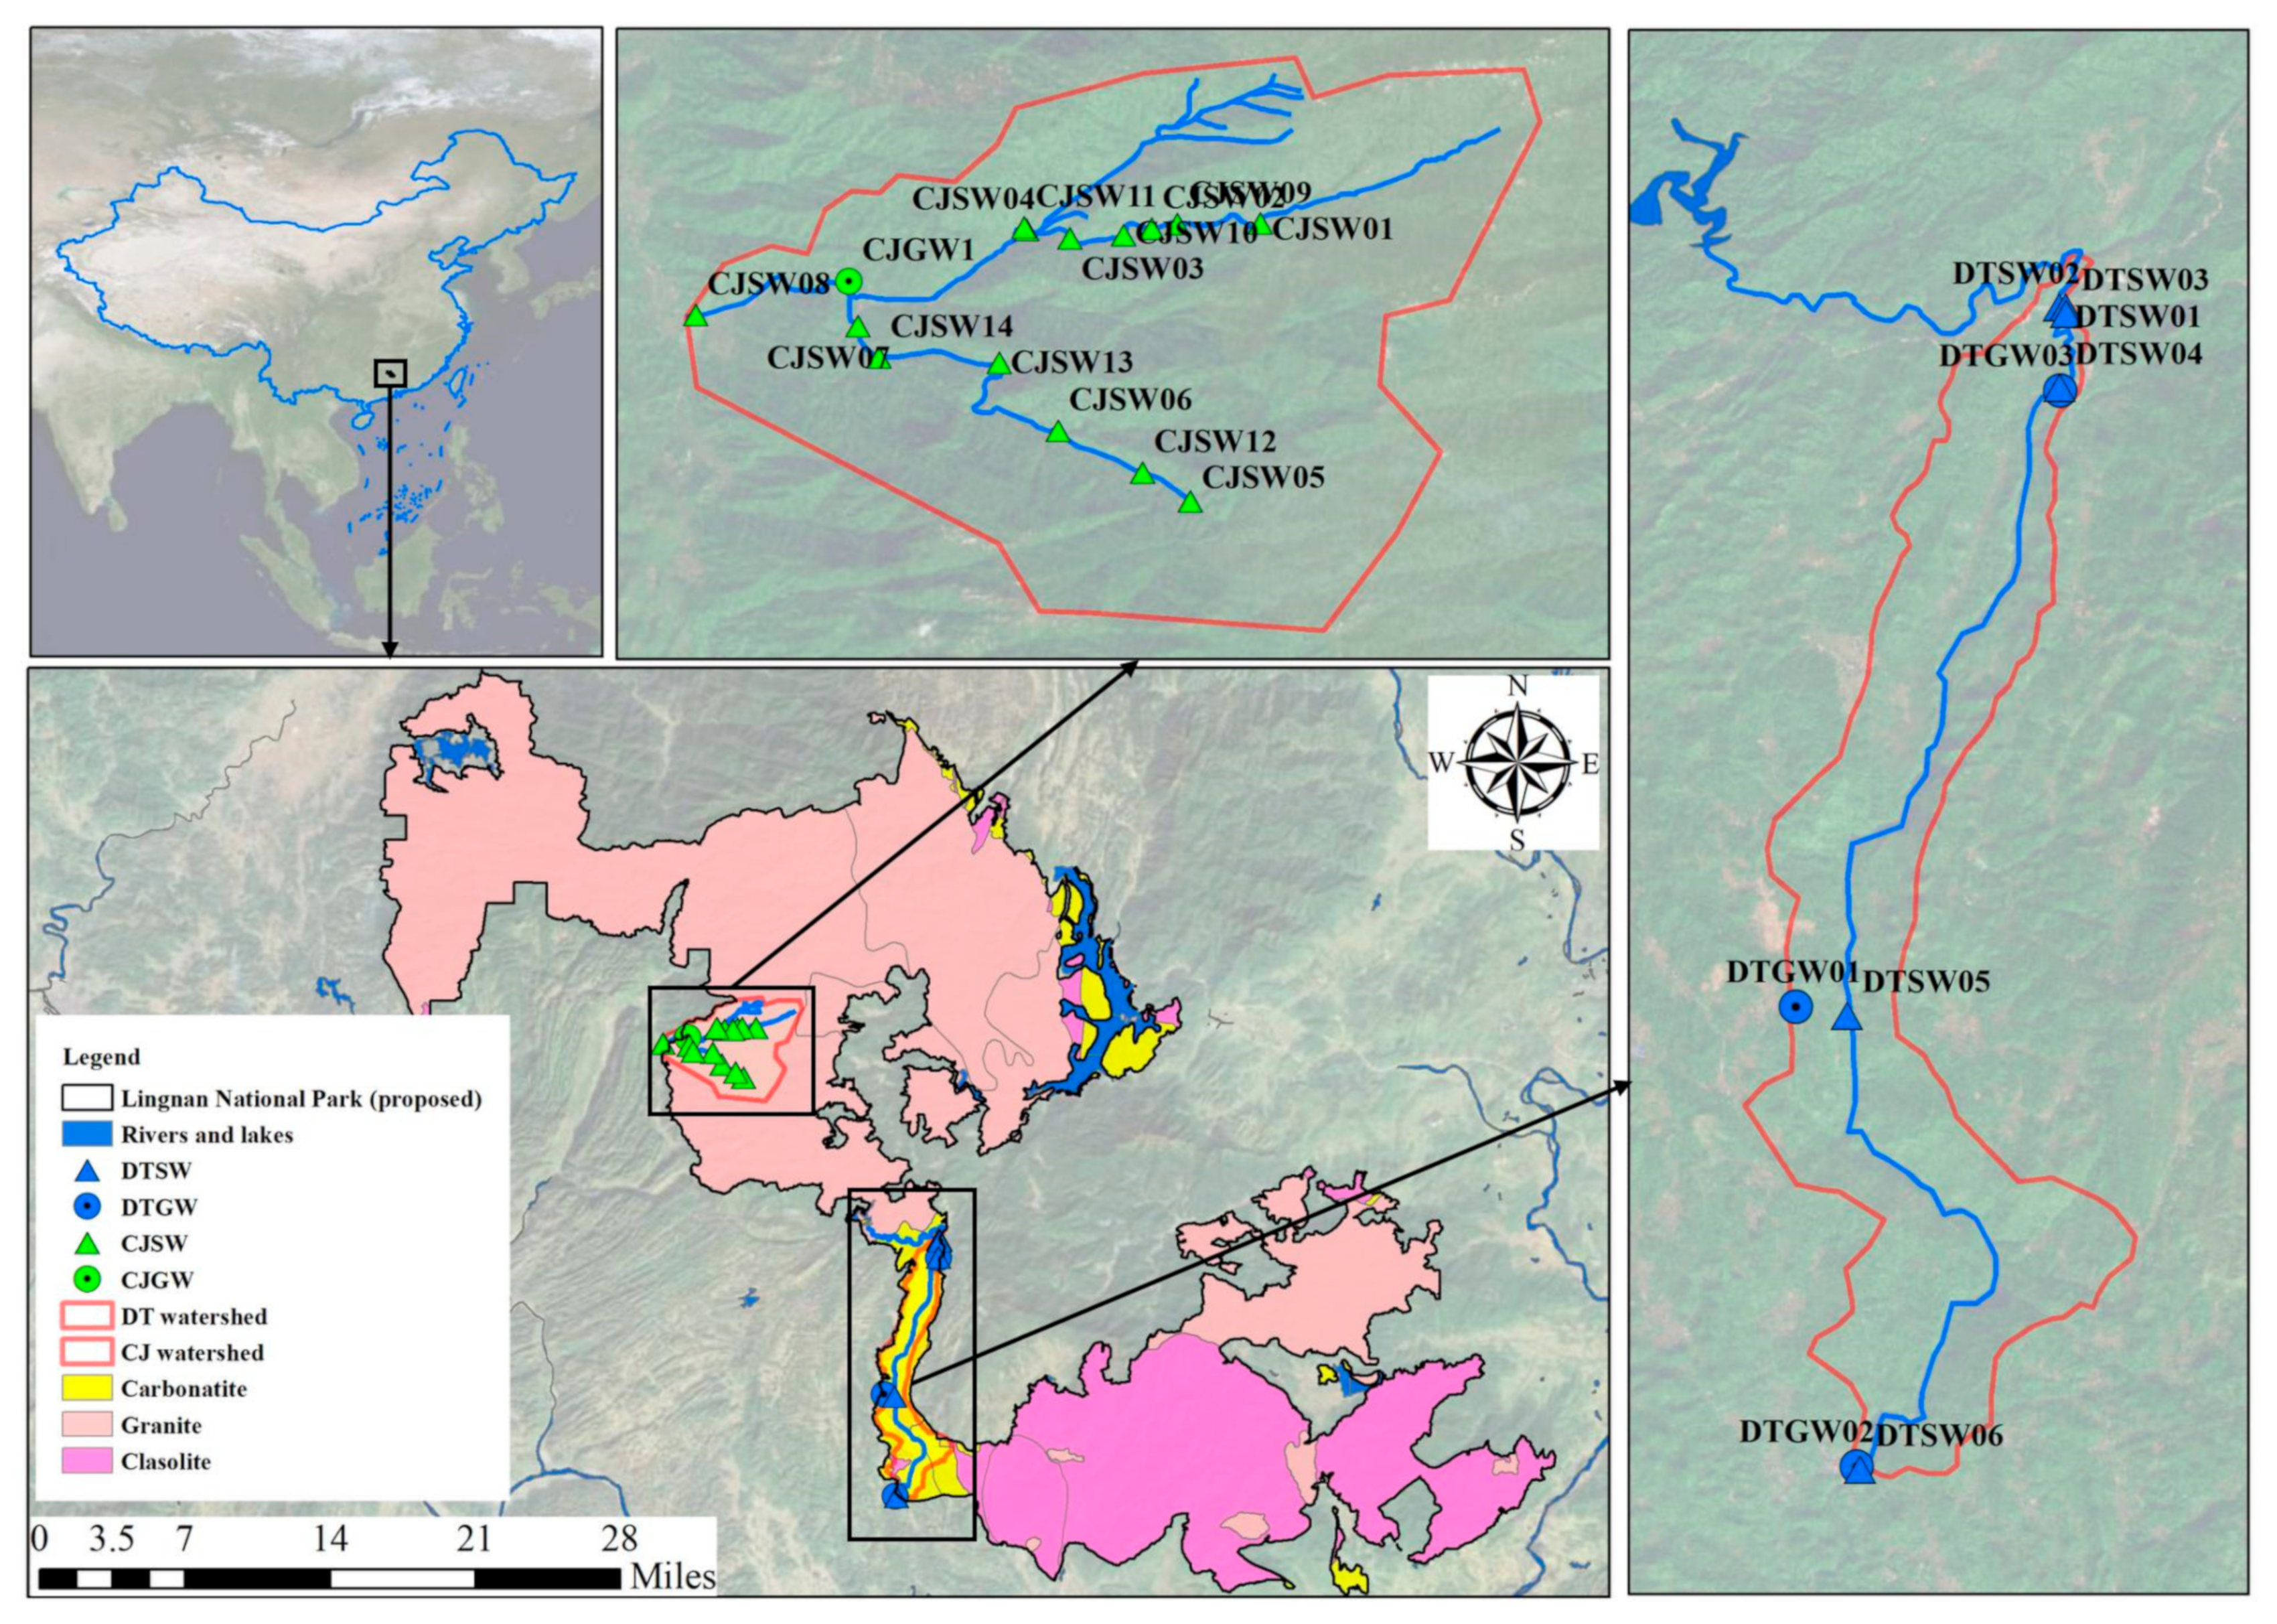
2.1. Study Area

The Chengjia (CJ) and Datan (DT) watersheds are located within the boundary of Lingnan National Park (proposed) in northern Guangdong Province, representing an ecologically significant region of China (Figure 1). The study area is predominantly forested with no residential/industrial area. These adjacent watersheds encompass drainage areas of 55.68 km2 (CJ) and 48.86 km2 (DT), with mean annual runoff volumes of 0.067 km3 and 0.057 km3, respectively. The surface water in the DT watershed flows predominantly in a north-to-south direction, whereas in the CJ watershed, the flow direction is oriented from east to west. Both watersheds maintain dense forest cover and experience minimal anthropogenic disturbance. The study area experiences a subtropical monsoon climate, characterized by an average temperature of 8.6 °C in the coldest month (January) and 27.0 °C in the warmest month (July), with a multi-year mean annual temperature of 19.0 °C. Annual precipitation ranges from 1400 to 2400 mm, with distinct wet (March–August) and dry (September–February) seasons. Rivers and streams are primarily precipitation-fed.
These two watersheds exhibit distinct geological characteristics. The CJ watershed is predominantly underlain by Jurassic monzogranite formations, where groundwater occurs principally as bedrock fissure water. In contrast, the DT watershed features extensive outcrops of Carboniferous carbonate rocks, including limestone, dolomitic limestone, and dolomite, with groundwater systems developing as characteristic karst fissure water. The terrain of the CJ watershed is steep, with a stream gradient (the ratio of drop in elevation of a stream per unit horizontal distance) of 0.068, while that of the DT watershed is gentle, with a stream gradient of 0.005.

2.2. Sampling and Analysis

Field investigations and water sampling were conducted in the CJ and DT watersheds (Figure 1) in July (wet season) and December (dry season) 2023. CJSW-July and CJGW-December represent surface water and groundwater collected from the CJ watershed in July and December, respectively. DTSW-July and DTGW-December represent surface water and groundwater collected from the DT watershed in July and December, respectively. The same applies to other samples. In 2023, a total of 29 and 18 water samples were collected in the CJ and DT watersheds, respectively.
In situ measurements of water, pH, and electrical conductivity (EC) were performed using a portable multiparameter water quality analyzer (Orion VM-01, Thermo Fisher Scientific, Waltham, MA, USA). Within 24 h of collection, alkalinity titration was conducted using standard hydrochloric acid solution to determine HCO3 concentration. For anion analysis, water samples were filtered through 0.45 μm PTFE membranes and stored in sealed 50 mL PET bottles. Cation samples were similarly filtered and then acidified with ultrapure HNO3 to pH < 2 before sealing. Samples for δ13C-DIC were collected in 40 mL brown glass vials without headspace, then vials were sealed immediately with airtight caps and preserved with HgCl2 to inhibit microbial activity. All samples were refrigerated at 4 °C prior to laboratory analysis.
Major anions (Cl, SO42−, and NO3) were analyzed using ion chromatography (ICS-1100, Thermo Fisher Scientific, Waltham, MA, USA) with Na2CO3 and NaHCO3 as the eluent [29]. Major cations (K+, Na+, Ca2+, and Mg2+) were analyzed using inductively coupled plasma–optical emission spectrometry (iCAP7400+, Thermo Fisher Scientific, Waltham, MA, USA) [30] according to a Chinese standard (water quality—determination of 32 elements—inductively coupled plasma optical emission spectrometry). Total dissolved solids (TDSs) were determined using gravimetric analysis (the difference in weight between the water before and after drying at 105 °C [31]. DIC was converted to CO2 through acidification with phosphoric acid (H3PO4). The liberated CO2 was then extracted under vacuum and passed through an ethanol trap cooled with liquid N2 to remove residual water vapor. Finally, the purified CO2 was cryogenically transferred to a sample tube for isotopic analysis. The δ13C-DIC were analyzed with isotope ratio mass spectrometry (MAT 253, Thermo Fisher Scientific, United States), and are reported as per mille (‰) relative to Vienna Peedee Belemnite (VPDB) [7]. A statistical summary of hydrogeochemical and isotopic parameters is exhibited in Table 1.

3. Results and Discussion

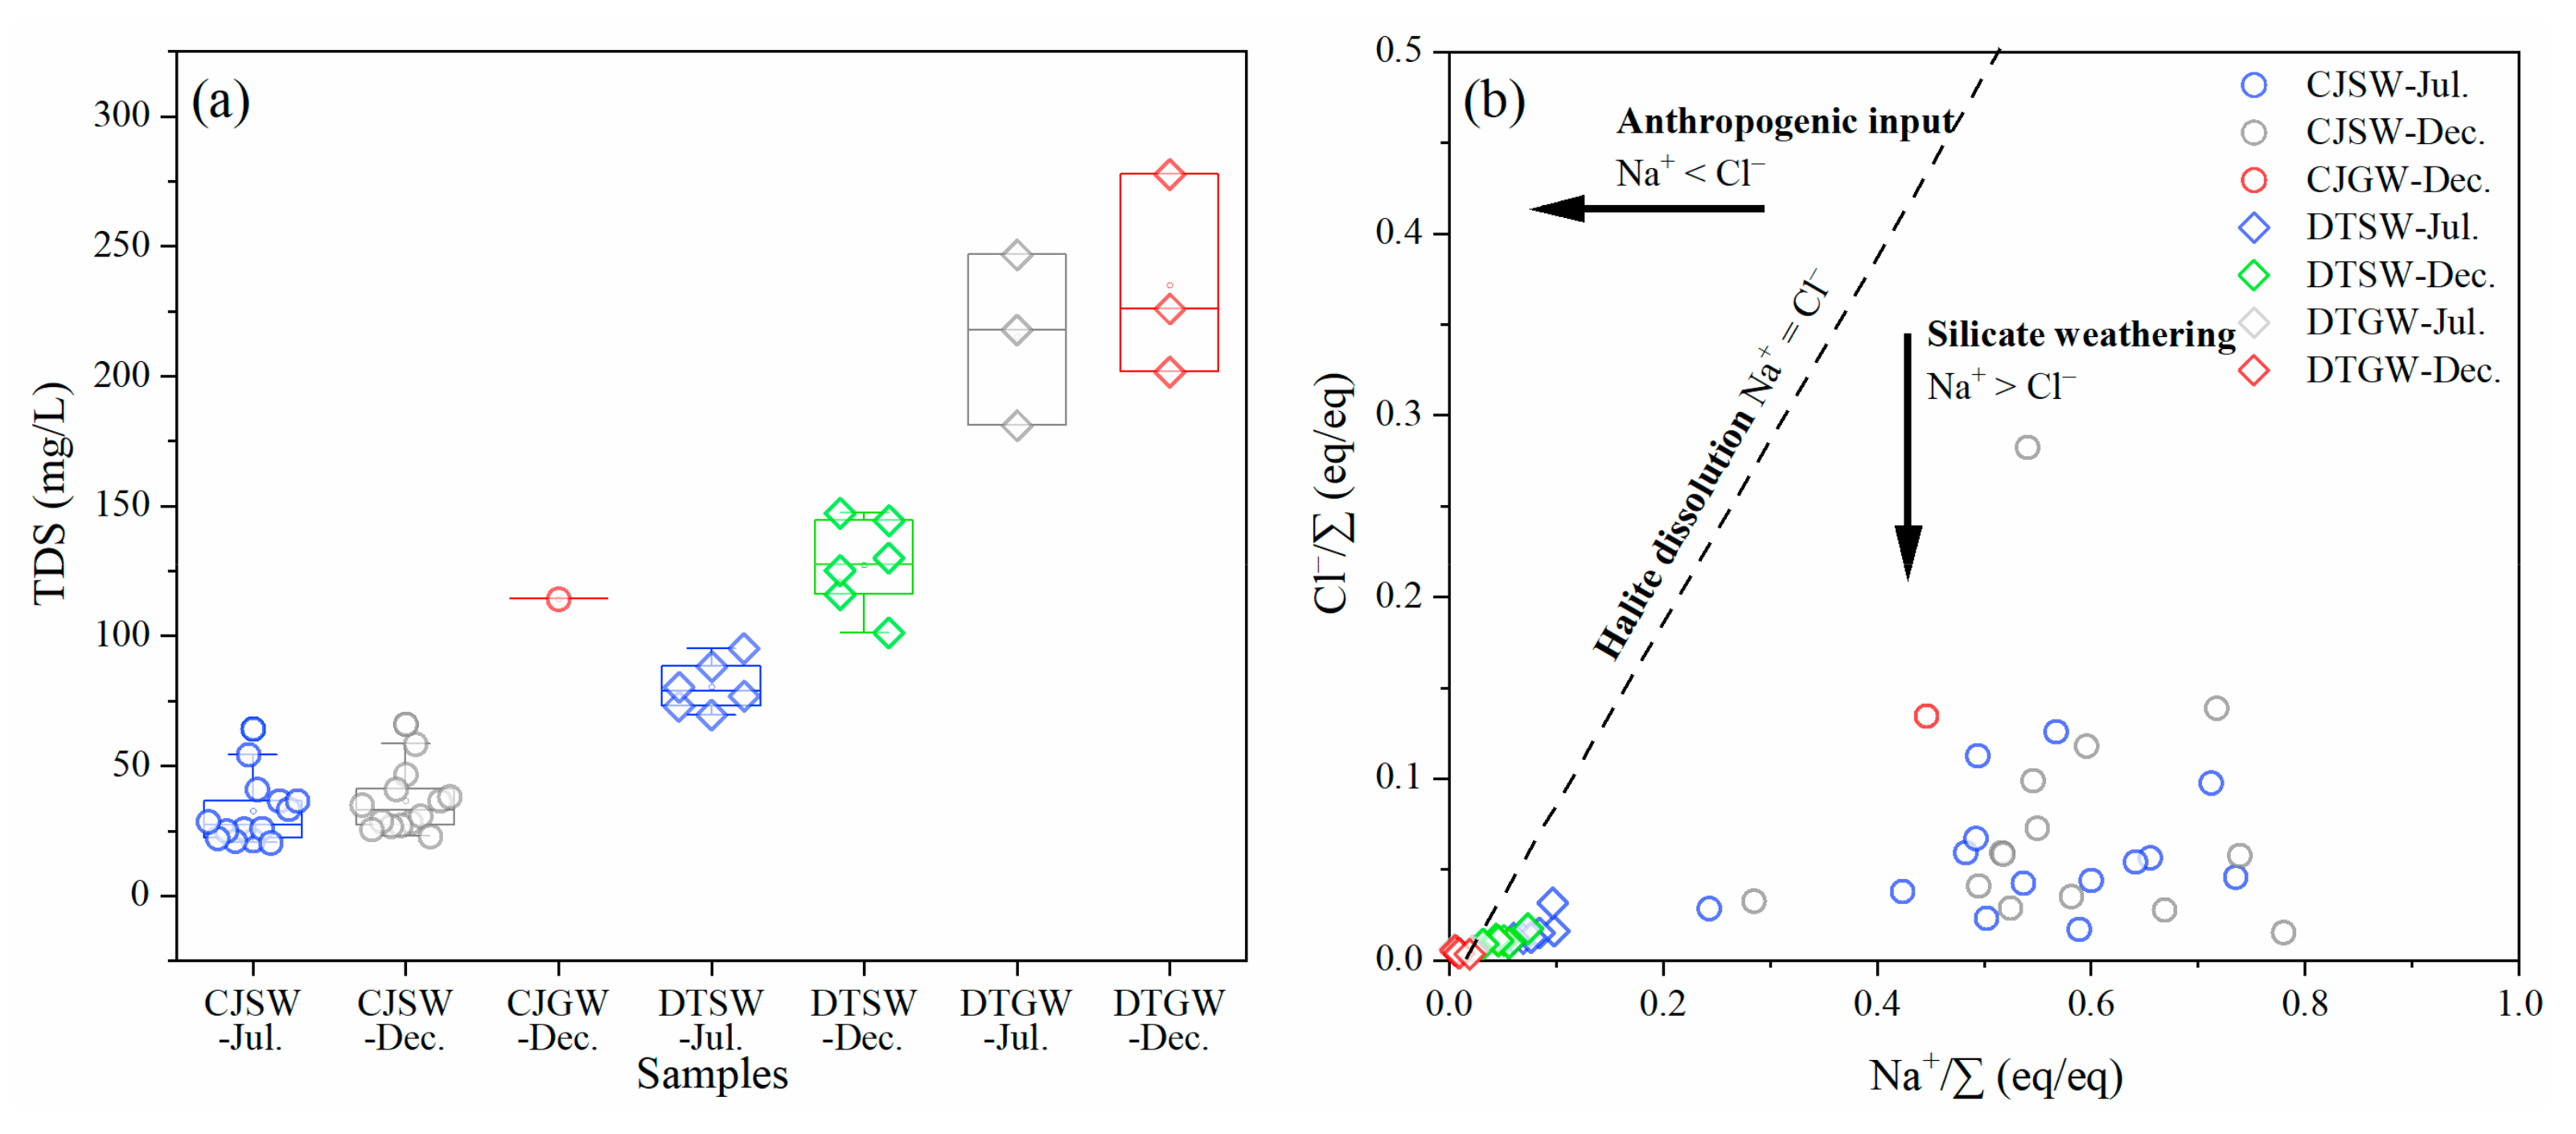
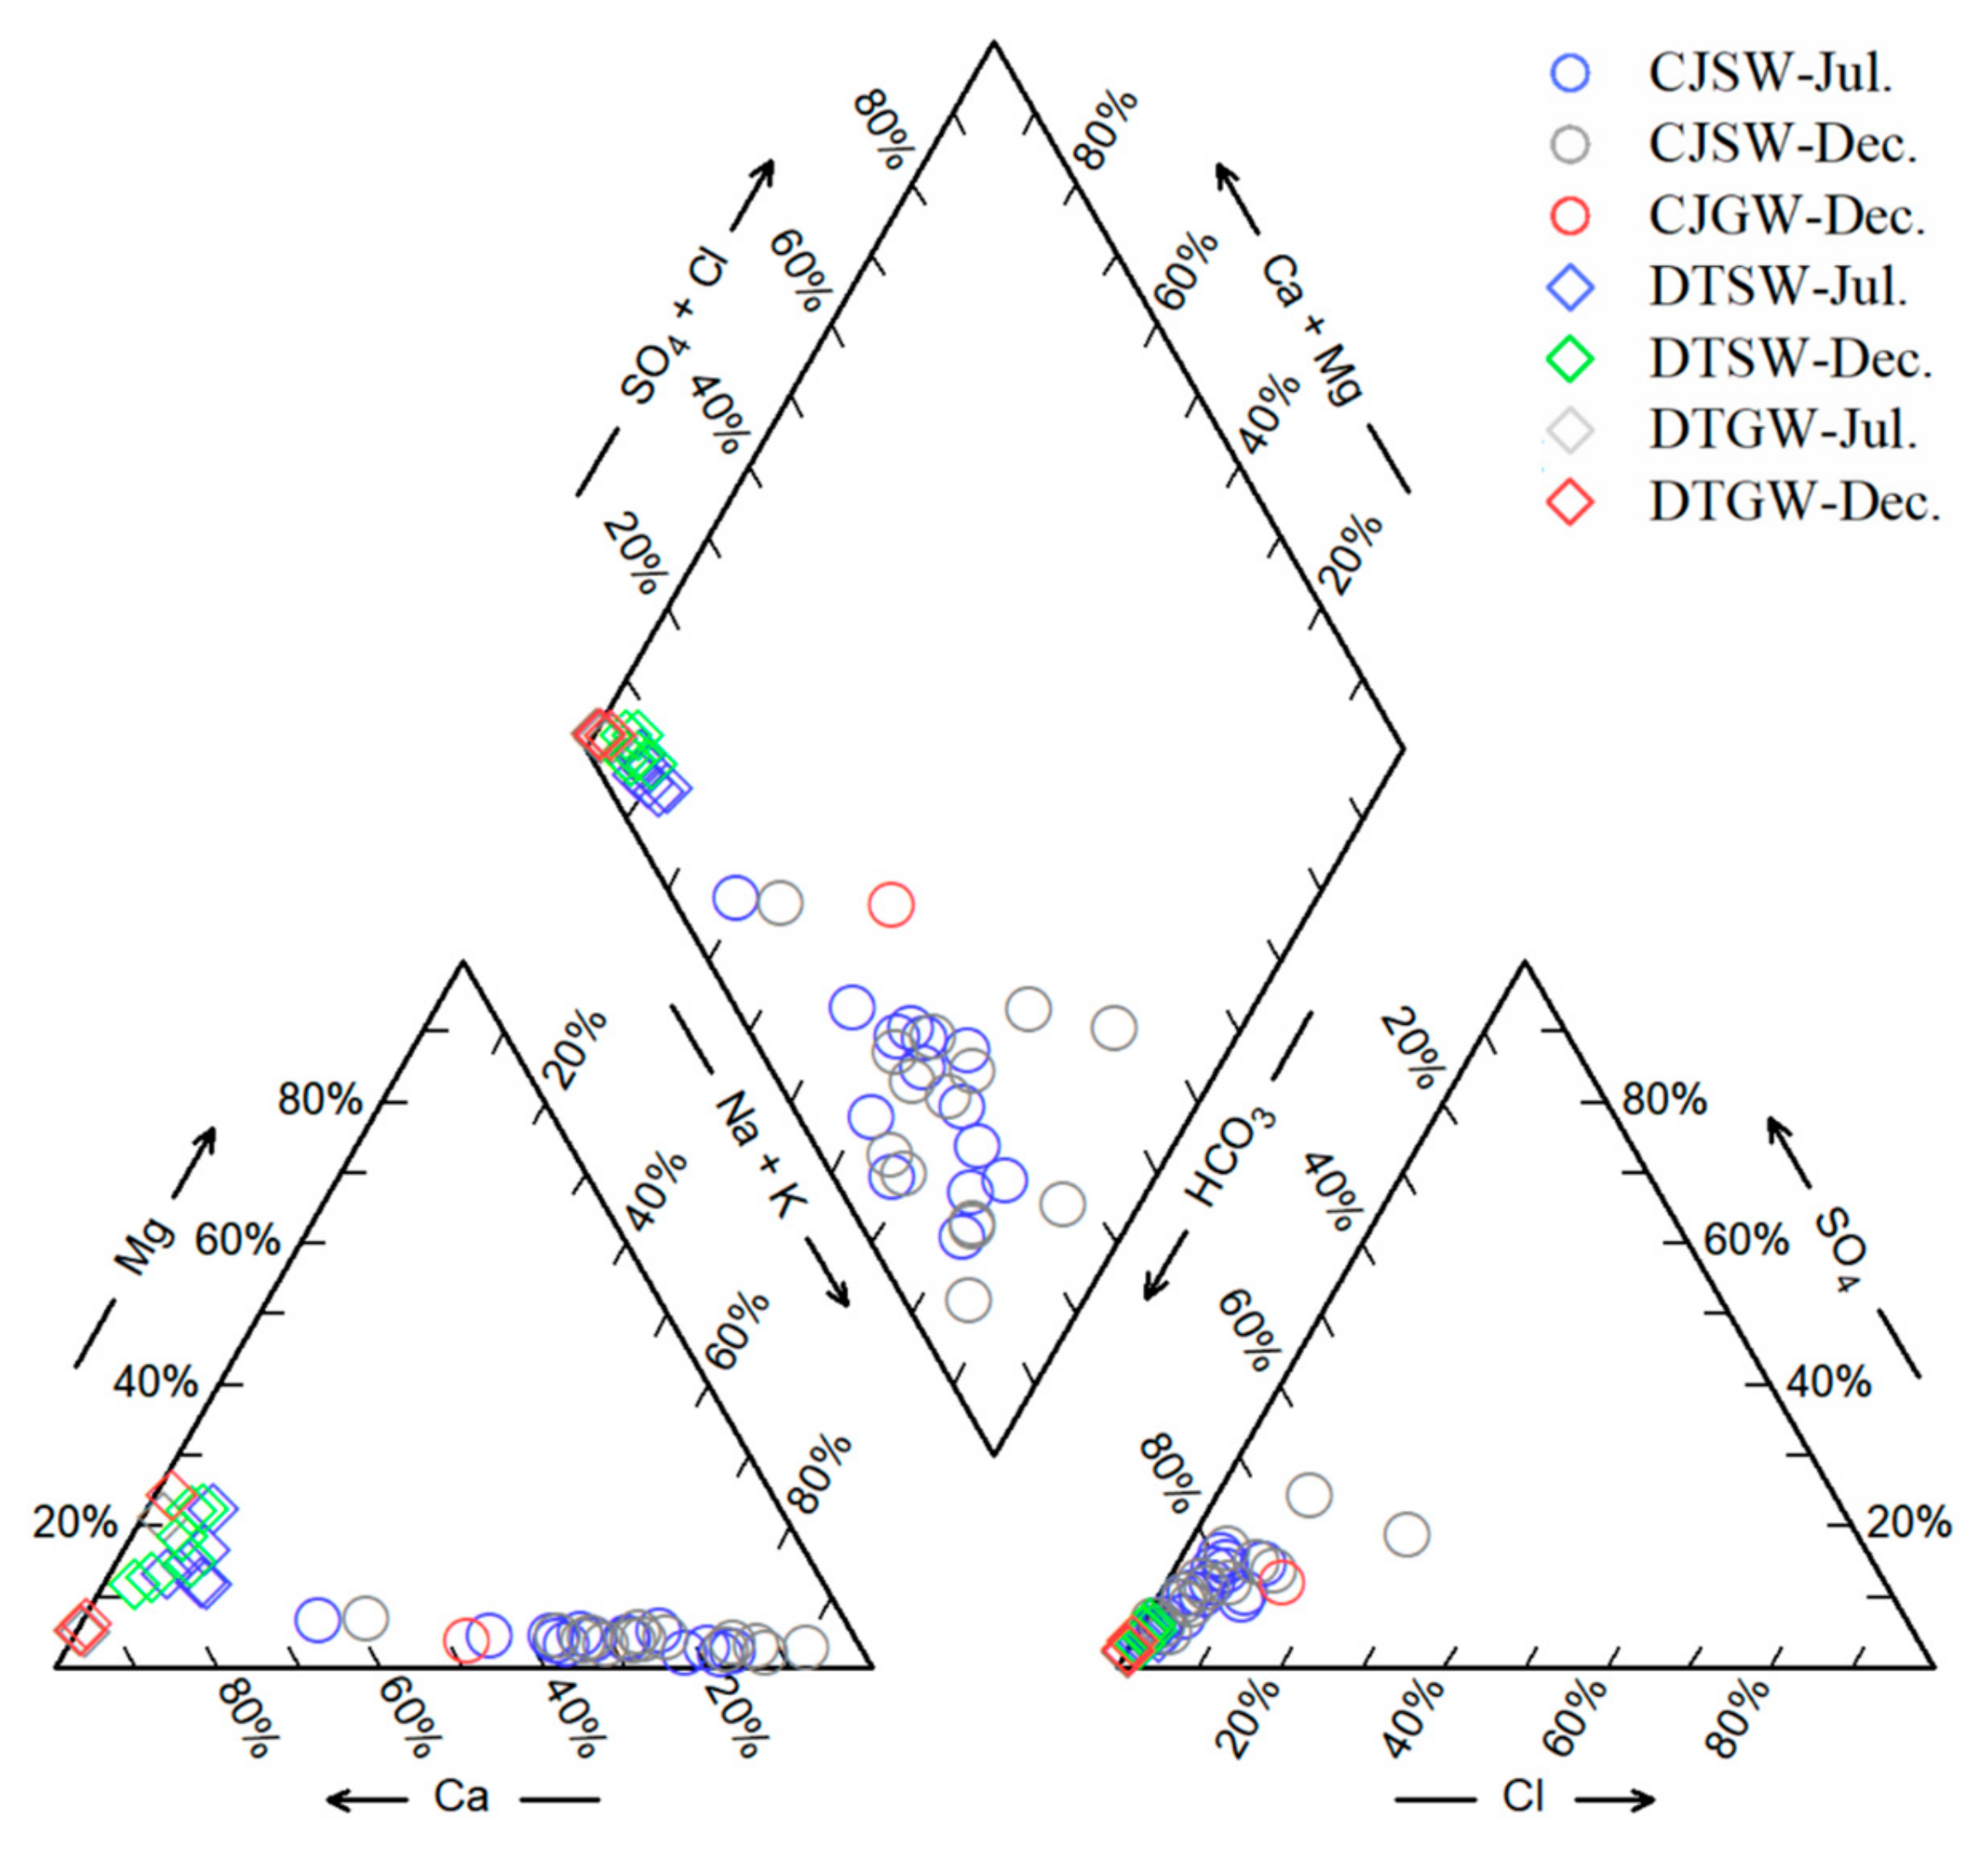
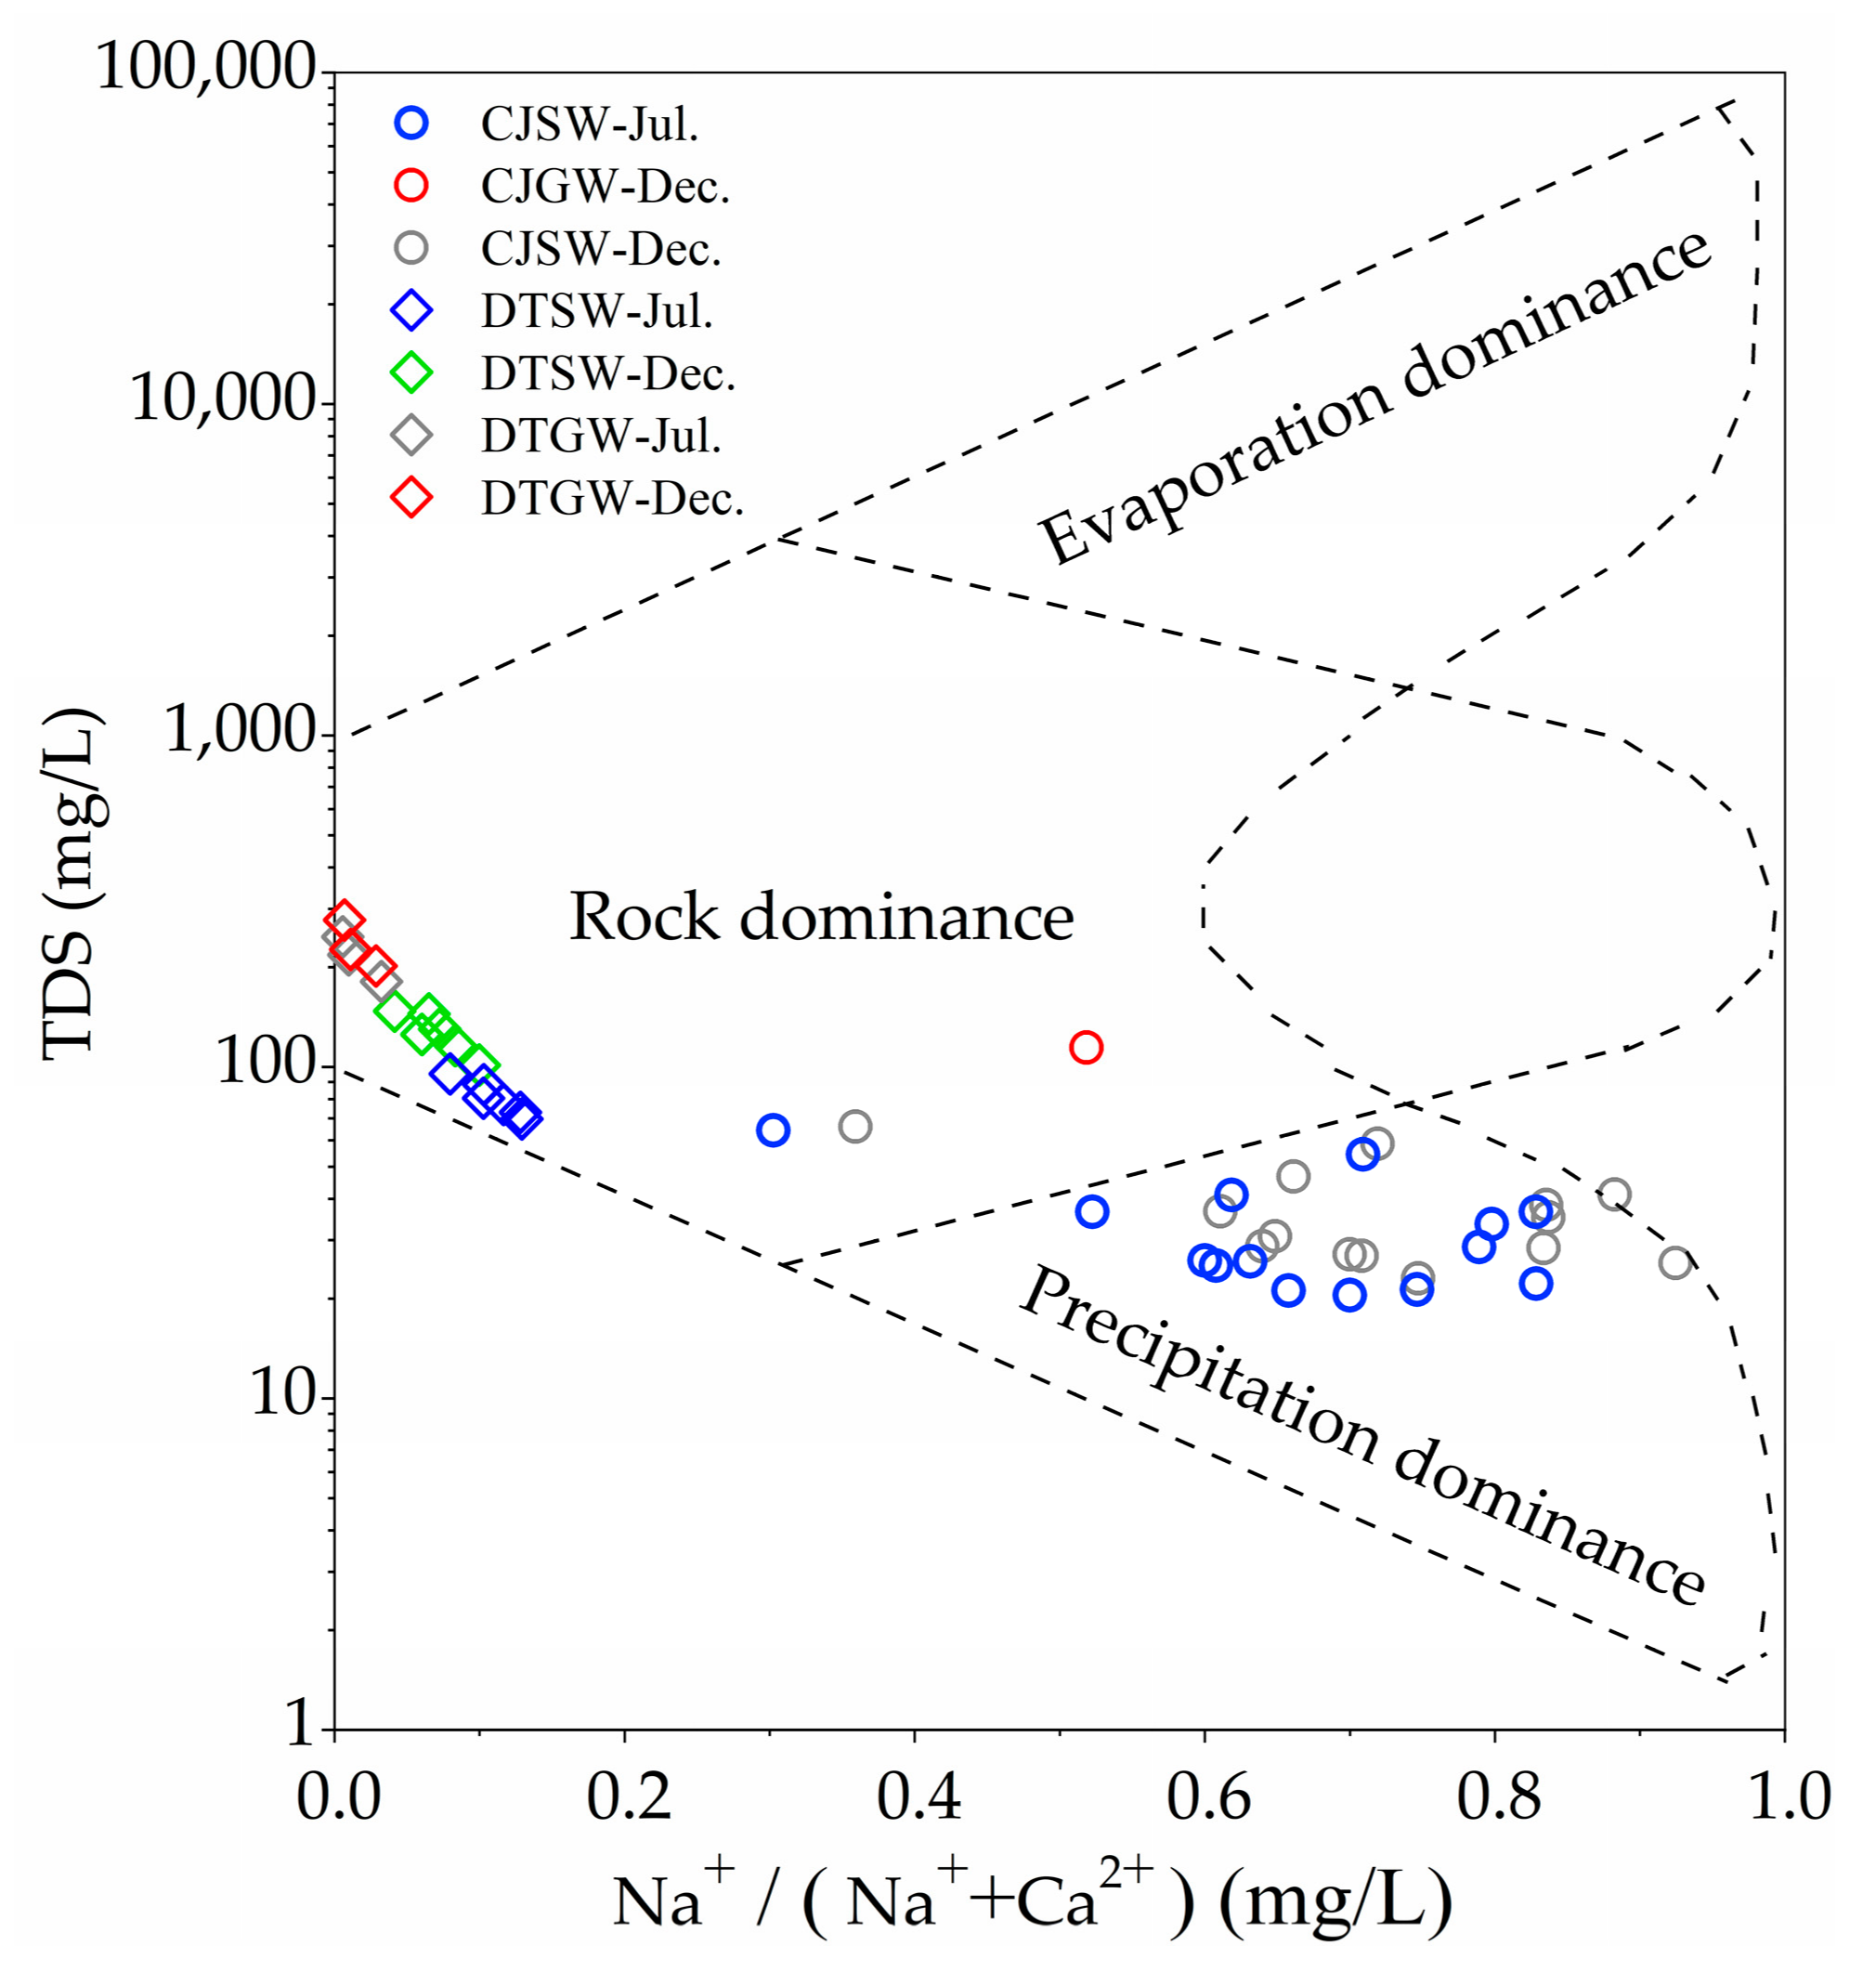
3.1. Hydrochemical Characteristics

As shown in Figure 2a, the TDS of surface water in the CJ watershed ranged from 20.5 to 64.4 mg/L (average: 32.7 mg/L) in the wet season (July) and from 23.0 to 66.1 mg/L (average: 36.7 mg/L) in the dry season (December). The TDS of surface water in CJ watershed is close to the global average TDS value for granite watersheds (23 mg/L) [32]. The TDS of groundwater in the CJ watershed was 114.3 mg/L in the dry season. In contrast, the TDS of surface water in the DT watershed ranged from 69.6 to 95.3 mg/L (average: 80.6 mg/L) in the wet season and from 101.3 to 147.4 mg/L (average: 127.4 mg/L) in the dry season. The TDS of groundwater in the DT watershed varied between 181 and 246.9 mg/L (average: 215.3 mg/L) in the wet season and 201.8–277.7 mg/L (average: 235.1 mg/L) in the dry season. The marked differences in TDS between the CJ and DT watersheds implied distinct hydrochemical characteristics and underlying formation mechanisms.
The atmospheric input is considered as a potential source for solutes in aquatic systems [33,34]. In both watersheds, the TDS content of surface water and groundwater is lower in the wet season than that in the dry season. This may be attributed to abundant rainfall and faster water cycling in the wet season, which enhances dilution effects and weakens water–rock interactions. The TDS content in local rainwater is approximately 15.0 mg/L [18]. The TDS of rainfall in the study area is relatively close to that of surface water in the CJ watershed but significantly lower than that in the DT watershed, indicating that the hydrochemical composition of surface water in the CJ watershed is more influenced by rainfall than that in the DT watershed. The difference in TDS of surface water between the wet and dry seasons is much greater in the DT watershed (Δ = 46.8 mg/L) than in the CJ watershed (Δ = 4.0 mg/L). This suggested a stronger influence of discharge from groundwater to surface water in the DT watershed in the dry season.
Human activities are also a potential factor influencing the hydrochemical composition [18,34]. As shown in Figure 2b, Cl/Na+ ratios observed in both the CJ and DT watersheds were lower than 1, indicating that the influence of anthropogenic input was negligible [34]. Therefore, the chemical composition of water bodies in the study area was primarily influenced by natural processes, consistent with the region’s undisturbed forest ecosystems. Furthermore, Figure 2b shows that the milliequivalent concentrations of Na+ are generally higher than those of Cl in both watersheds, indicating the influence of silicate weathering [7].
Piper trilinear diagrams were used to further investigate the formation mechanisms of hydrochemical characteristics in the two watersheds (Figure 3) [35]. In the CJ watershed, the relative abundance of major cations followed the order of Na+ > Ca2+ > K+ > Mg2+, while HCO3 was the predominant anion, far exceeding those of other anions. Both surface water and groundwater in the CJ watershed were classified as HCO3-Na·Ca type. In contrast, in the DT watershed, surface water and groundwater exhibited significantly higher Ca2+ concentrations than other cations, while maintaining HCO3 as the principal anion. Thus, the surface water and groundwater in the DT watershed were classified as HCO3-Ca type.
The differences in hydrochemical composition and TDS content between the CJ and DT watersheds suggested distinct formation mechanisms. Gibbs diagrams can distinguish the dominant controls on hydrochemical composition, including atmospheric precipitation, rock weathering, and evaporation–crystallization [36,37]. As shown in Figure 4, both surface water and groundwater samples from the CJ watershed in wet season (July) and dry season (December) exhibited low TDS and high Na+/(Na++Ca2+) values, indicating a mixed influence of atmospheric precipitation and rock weathering on hydrochemical characteristics. In contrast, DT watershed samples exhibited significantly higher TDS and lower Na+/(Na++Ca2+) ratios compared to CJ watershed samples (Figure 4), demonstrating rock weathering as the predominant control with negligible contributions from rainfall or evaporation. Notably, dry-season (December) surface water in the DT watershed showed TDS and Na+/(Na++Ca2+) values approaching those of local groundwater, providing further evidence for substantial groundwater discharge into surface water systems in the dry season.
The Gibbs diagram revealed distinct hydrochemical controls between the two watersheds (Figure 4). Hydrochemical composition of the CJ watershed showed dual influences from both rock weathering and atmospheric precipitation, whereas that of the DT watershed was predominantly controlled by rock weathering. Geological investigations demonstrated contrasting lithologies between the watersheds. The CJ watershed is underlain by granite formations, while carbonate rocks dominate the DT watershed. This lithological contrast drives fundamentally different weathering regimes. In the carbonate-rich DT watershed, extensive dissolution of carbonate minerals, such as calcite and dolomite, produced Ca2+-enriched waters (HCO3-Ca type). Conversely, weathering of silicate minerals (such as albite and potassium feldspar) in the granitic CJ watershed generated waters with elevated Na+ concentrations (HCO3-Na·Ca type).
The weathering types controlling hydrochemical composition can be further verified using molar ratios such as Ca2+/Na+ vs. HCO3/Na+ [38,39]. As shown in Figure 5, groundwater samples from the DT watershed clustered near the carbonate endmember, confirming the dominant role of carbonate weathering. Surface water samples from the DT watershed distributed between the silicate and carbonate endmembers, suggesting a combined influence of silicate and carbonate weathering. As shown in Figure 1, the upper reaches of the DT watershed border the northern granitic terrain, potentially imparting granitic weathering signatures to the hydrochemical composition of the surface water. In contrast, both groundwater and surface water from the CJ watershed were located close to the silicate endmember, indicating silicate weathering as the main control. All water samples from both watersheds were far from the evaporite endmember, implying negligible influence of evaporite dissolution. These hydrochemical findings align well with the actual lithology of the two watersheds, demonstrating the critical role of lithology in shaping their hydrochemical characteristics.
To further elucidate chemical weathering processes and their impacts on hydrochemical compositions in both surface and groundwater across the two watersheds, saturation indices (SI) were calculated for representative water samples using PHREEQC (3.6.3 version). As illustrated in Figure 6a, groundwater in the DT watershed reached saturation states for both calcite and dolomite during July and December (SI > 0), indicating dominant carbonate weathering influences. This result, that hydrochemical compositions of waters in the DT watershed were dominated by rock weathering, was consistent with Figure 4. While surface waters in DT showed lower SI values than groundwater, they approached near-saturation conditions. Notably, DT’s surface waters exhibited significantly higher SI values in December (dry season) compared to July (wet season), suggesting enhanced groundwater contributions to surface water during low-flow periods. In contrast, waters in the CJ watershed remained markedly undersaturated with respect to both calcite and dolomite (SI < 0), confirming limited carbonate weathering effects.
Figure 6b revealed that waters in the CJ watershed had higher saturation states for albite and K-feldspar compared to DT, consistent with more intensive silicate weathering. The seasonal pattern of higher albite and K-feldspar SI values in December surface waters was consistent with the DT watershed’s behavior, again indicating stronger groundwater–surface water interactions during dry periods. Figure 6c demonstrated significantly higher gypsum saturation indices in the DT watershed waters compared to that in the CJ watershed, which aligns with the observed SO42− concentration differences between watersheds (Table 1). The consistently negative saturation indices for both silicate and carbonate minerals in waters of the CJ watershed (Figure 6) indicated limited rock weathering activity, which aligns with the patterns shown in Figure 4 (precipitation dominance).

3.2. Identification of CO2 Consumption During Chemical Weatherin Using δ13C-DIC

Theoretically, increasing contributions of carbonate weathering by H2SO4 and HNO3 to CO2 consumption should elevate SO42−/HCO3 and NO3/HCO3 molar ratios, consequently driving δ13C-DIC values toward more positive signatures [7]. However, our data revealed no significant positive correlation between δ13C-DIC and either SO42−/HCO3 or NO3/HCO3 ratios in both surface and groundwater samples from the studied watersheds (p > 0.05). This absence of correlation indicated that carbonate weathering by H2SO4 and HNO3 played a negligible role in CO2 consumption in the studied watersheds.
The δ13C-DIC values of groundwater in the CJ watershed were significantly more negative than the end-member of carbonate weathering by H2CO3 (−30.0‰ to −24.2‰), indicating substantial silicate weathering influences (Figure 7). Surface waters in the CJ watershed exhibited intermediate δ13C-DIC values (−14.9‰ to −6.1‰) between end-member of atmospheric precipitation (−6‰ to −8‰) and carbonate weathering by H2CO3 (−30.0‰ to −24.2‰) during both July and December sampling campaigns. Field geological surveys confirmed the absence of carbonate outcrops in the CJ watershed, suggesting that surface water chemistry reflects the mixing of atmospheric inputs and silicate weathering by H2CO3.
In contrast, both groundwater and surface water in the DT watershed showed δ13C-DIC values (−12.8‰ to −10.4‰) intermediate between precipitation and weathering by H2CO3 end-members. This pattern corresponds with the watershed’s dominant carbonate lithology, confirming mixed atmospheric and carbonate weathering sources. These isotopic patterns were consistent with the analysis of hydrochemical characteristics.

3.3. Quantitative Analysis of Chemical Weathering and CO2 Consumption

The Straightforward Method is a classical approach used to determine the chemical composition and evolution of surface water by analyzing dissolved ions [18,40]. It involves straightforward calculations based on measured concentrations of major ions to understand hydrogeochemical processes such as rock–water interactions and mixing [18,40]. The Straightforward Method was employed to calculate the contributions of different end-members to the dissolved ions in the surface water. The major ions in surface water originate from atmospheric precipitation, anthropogenic inputs, and the chemical weathering of rocks and minerals, which can be expressed as:
[X]river = [X]atm + [X]anthro + [X]carb + [X]sil + [X]evap
In Equation (6), the subscripts river, atm, anthro, carb, sil, and evap represent the contributions from the river, atmospheric precipitation, anthropogenic inputs, carbonate rocks, silicate rocks, and evaporites, respectively. The X represents ions, such as Na+, K+, Ca2+, and Mg2+.
Since there is no exposure of evaporites in the study area and the influence of human activities is minimal, the lowest Cl content in the watershed (6 μmol/L in July and 5 μmol/L in December) was used as the atmospheric input. The concentrations of other atmospheric input ions X (Na+, K+, Ca2+, Mg2+, etc.) were estimated by correcting the molar concentration ratios of these ions to Cl in precipitation [41], as follows:
[X]atm = [Cl]atm × (X/Cl)atm
By integrating actual rainwater samples collected in this study with the average values from previous rainwater data in the Nanling region [42], the average molar concentration ratios of ions from precipitation input were calculated as follows: Na+/Cl = 0.83, K+/Cl = 1.21, Ca2+/Cl = 3.06, and Mg2+/Cl = 0.22.
Since Cl primarily originates from atmospheric input, evaporites, and anthropogenic sources, the Cl concentration corrected for precipitation input can be considered as the contribution from evaporites and anthropogenic sources. Assuming that Na+ from evaporites and anthropogenic sources is in equilibrium with Cl, the following relationship holds:
[Cl]anthro+evap = [Cl]river − [Cl]atm
[Na+]anthro+evap = [Cl]anthro+evap
After correcting for atmospheric precipitation, evaporites, and anthropogenic inputs, the remaining Na+ and K+ (corrected for precipitation input) can be attributed to silicate rock weathering:
[Na+]sil = [Na+]river − [Na+]atm − [Na+]anthro+evap
[K+]sil = [K+]river − [K+]atm
Generally, Ca2+ and Mg2+ primarily originate from carbonate and silicate rocks. Since the exposed lithology in the CJ watershed is Jurassic monzogranite, the contribution of carbonate rock weathering can be neglected. Therefore, the Ca2+ and Mg2+ concentrations in the CJ watershed, after correcting for precipitation input, can be attributed to silicate rock weathering:
[Ca2+]sil = [Ca2+]river − [Ca2+]atm
[Mg2+]sil = [Mg2+]river − [Mg2+]atm
Subsequently, the contributions of silicate rock weathering in the CJ watershed, represented by [Na+]sil, [K+]sil, [Ca2+]sil, and [Mg2+]sil, were used to calculate the end-member ratios for silicate rock weathering: K+/Na+ = 0.17, Mg2+/Na+ = 0.03, and Ca2+/Na+ = 0.21. By incorporating the Mg2+/Na+ and Ca2+/Na+ molar ratios of the silicate rock end-member in the CJ watershed, the contributions of Ca2+ and Mg2+ from silicate rock weathering in the DT watershed were calculated as follows:
[Ca2+]sil = [Na+]sil × [Ca2+/Na+]sil
[Mg2+]sil = [Na+]sil × [Mg2+/Na+]sil
The contributions of Ca2+ and Mg2+ from carbonate rock weathering in the DT watershed were determined by subtracting the atmospheric input and silicate rock input from the total Ca2+ and Mg2+ concentrations in surface water:
[Ca2+]carb = [Ca2+]river − [Ca2+]atm − [Ca2+]sil
[Mg2+]carb = [Mg2+]river − [Mg2+]atm − [Mg2+]sil
By iteratively solving the system of Equations (6)–(17), the molar concentrations of cations originating from atmospheric precipitation, carbonate rocks, silicate rocks, evaporites, and anthropogenic activities were determined. Subsequently, the mass concentrations of cations contributed by each end-member in the watershed and their relative contribution rates were calculated.
For the CJ watershed, the average contributions of silicate weathering and atmospheric precipitation input to cations were 77.9% and 19.6% in July, respectively, while in December, they were 81.1% and 14.8%, respectively (Table 2). For the DT watershed, the average contributions of carbonate weathering, silicate weathering, and atmospheric precipitation input to cations were 82.6%, 12.9%, and 4.5% in July, respectively. In December, they were 90.2%, 7.7%, and 2.1%, respectively (Table 2). These findings suggest a mixed carbonate–silicate weathering signature in the DT watershed. The contributions from anthropogenic input and evaporite dissolution were negligible in the CJ and DT watersheds, which aligns well with the actual conditions of the study area, where there are no exposed evaporites and human activity is minimal.
Values of major ions concentrations (Ca2+, Mg2+, Na+, K+) incorporated into water by dissolution reactions in two studied watersheds were calculated as shown in Table 3. The silicate weathering-derived fluxes of K+, Na+, Ca2+, and Mg2+ to surface waters were comparable between the CJ and DT watersheds. However, carbonate weathering in the DT watershed contributed substantially higher Ca2+ and Mg2+ inputs than in the CJ watershed, resulting in the formation of high-TDS HCO3-Ca-type waters. In contrast, the CJ watershed received relatively minor cation inputs (predominantly Ca2+ and K+) from silicate weathering, ultimately producing low-TDS HCO3-Na·Ca-type waters.
The respective chemical weathering rates of silicate (CWRsil) and carbonate (CWRcarb) can be then calculated as follow [5,43]:
CWRsil = ([Ca2+]sil + [Mg2+]sil + [K+] + [Na+]) × Q/A
CWRcarb = ([Ca2+]carb + [Mg2+]carb) × Q/A
Q and A represent the discharge (mean annual runoff) and drainage area, respectively.
CO2 consumption rate through chemical weathering of silicate (CCRsil) and carbonate (CCRcarb) by H2CO3 can be calculated as follows:
CCRsil = (2 × [Ca2+]sil + 2 × [Mg2+]sil + [K+] + [Na+]) × Q/A
CCRcarb = (2 × [Ca2+]carb + 2 × [Mg2+]carb) × Q/A
Results of CWR and CCR of silicate and carbonate in the CJ and DT watersheds are shown in Table 4. The CWRsil in the CJ watershed was calculated to be 0.24 × 10⁶ mol/km2/yr, while chemical weathering of carbonate was negligible (CWRcarb≈0). In the DT watershed, the CWRsil and CWRcarb were calculated to be 0.20 × 10⁶ and 0.97 × 10⁶ mol/km2/yr, respectively. These results indicated that the hydrochemical composition of the CJ watershed is primarily influenced by silicate weathering, whereas the DT watershed’s hydrochemistry is jointly affected by both carbonate and silicate weathering. The values of CWRsil in the two watersheds were similar. The surface water in the DT watershed originated from upstream silicate-rich watersheds (Figure 1). As a result, despite carbonate rocks being the predominant lithology in the DT watershed, its CWRsil values closely approximated those of the silicate-dominated CJ watershed.
The CWRcarb (0.97 × 10⁶ mol/km2/yr) in the DT watershed is significantly higher than CWRsil (0.20 × 10⁶ mol/km2/yr), shaping the hydrochemical characteristics of relatively high TDS and Ca2+ content. In contrast, the CJ watershed, dominated by slower silicate weathering (CWRsil = 0.24 × 10⁶ mol/km2/yr), exhibits relatively low TDS and Ca2+ levels. The CWRsum (CWRcarb + CWRsil) for the CJ watershed in July and December are 0.22 × 10⁶ mol/km2/yr and 0.26 × 10⁶ mol/km2/yr, respectively, while those for the DT watershed are 0.83 × 10⁶ mol/km2/yr and 1.5 × 10⁶ mol/km2/yr in July and December, respectively. Both watersheds exhibit stronger rock weathering in the dry season compared to the wet season, which might be due to higher rainfall and elevated water levels in the wet season reducing the connectivity between rocks and atmospheric CO2.
The CJ and DT watersheds showed similar CCRsil values of 0.28 × 10⁶ mol/km2/yr and 0.23 × 10⁶ mol/km2/yr, respectively. The CCRcarb of the DT watershed was 1.94 × 10⁶ mol/km2/yr, but chemical weathering of carbonate was negligible in the CJ watershed (CCRcarb ≈ 0). Therefore, CCRsum of the DT watershed (2.17 × 10⁶ mol/km2/yr) was significantly larger than that of the CJ watershed (0.28 × 10⁶ mol/km2/yr). These results indicated lithological controls on hydrochemical characteristics and CO2 consumption in the two watersheds. However, silicate weathering constitutes a net carbon sink [11]. Consequently, although the DT watershed exhibits significantly higher CCRsum compared to the CJ watershed, the CJ watershed exhibited superior long-term carbon sequestration capacity when assessed over extended temporal scales. Both watersheds exhibited higher CCRSil than the global average for silicate-dominated basins (0.1 × 10⁶ mol/km2/yr, [8]), indicating a significant CO2 sequestration capacity.

4. Conclusions

This study investigated the influence of lithology on rock chemical weathering processes and carbon sequestration in two lithologically contrasting watersheds—CJ (granite) and DT (carbonate rock)—located in the Lingnan region of Guangdong Province, China. By integrating hydrochemical analysis, the Straightforward Method, and stable carbon isotope analysis, we demonstrated the lithological controls in regulating weathering dynamics and associated carbon consumption. In the granite-dominated CJ watershed, silicate weathering driven by H2CO3 (CWR: 0.24 × 10⁶ mol/km2/yr) governed hydrochemical evolution, yielding low total dissolved solids (TDS) HCO3-Na·Ca-type waters. Conversely, the carbonate-rich DT watershed exhibited dual control from both carbonate and silicate weathering (CWRcarb = 0.97 × 10⁶ mol/km2/yr; CWRsil = 0.20 × 10⁶ mol/km2/yr), producing high-TDS HCO3-Ca-type waters. Chemical weathering of the CJ watershed dominated by silicate consumed CO2 at a rate of 0.28 × 10⁶ mol/km2/yr, whereas the DT watershed with both carbonate and silicate weathering generated a CCR value of 2.17 × 10⁶ mol/km2/yr. Previous research has often focused on large-scale or climatically distinct basins; our work demonstrated that even localized lithological differences (silicate-dominated vs. carbonate-influenced catchments) can lead to significant variations in weathering pathways and CCR. These findings indicated lithology’s fundamental control on hydrochemical signatures and CO2 drawdown via weathering processes. Given carbon balance’s pivotal role in regional sustainability, this study emphasized that future carbon cycle models and sink quantifications must explicitly incorporate lithological variability to improve accuracy, particularly in complex geological terrains like southern China.

Author Contributions

Conceptualization, Y.L. and Y.Z.; methodology, Y.L. and Y.Z.; software, Y.Z. and J.H.; validation, W.H. and L.B.; formal analysis, Z.Z.; investigation, Y.D. and C.W.; data curation, C.Z. and L.Z.; writing—original draft preparation, Y.L. and Y.Z.; writing—review and editing, Y.Z. and Y.L.; visualization, Y.Z. and J.H.; supervision, W.H. and Z.Z.; project administration, Y.L.; funding acquisition, Y.L. and Y.Z. All authors have read and agreed to the published version of the manuscript.

Funding

This research was supported by the Guangdong Special Fund for National Park Construction (2023GJGY023), Geological Survey and Urban Geology Special Project of Guangdong Province (2023-31), and the National Natural Science Foundation of China (42407126).

Data Availability Statement

The original contributions presented in the study are included in the article, further inquiries can be directed to the corresponding author.

Acknowledgments

We are grateful to all the editors and anonymous reviewers for their helpful comments that greatly improved the quality of the manuscript.

Conflicts of Interest

The authors declare no conflicts of interest.

References

  1. Goudie, A.S.; Viles, H.A. Weathering and the global carbon cycle: Geomorphological perspectives. Earth Sci. Rev. 2012, 113, 59–71. [Google Scholar] [CrossRef]
  2. Martin, J. Carbonate minerals in the global carbon cycle. Chem. Geol. 2017, 449, 58–72. [Google Scholar] [CrossRef]
  3. Liu, Z.; Dreybrodt, W.; Liu, H. Atmospheric CO2 sink: Silicate weathering or carbonate weathering. Appl. Geochem. 2011, 26, S292–S294. [Google Scholar] [CrossRef]
  4. Tank, S.E.; Raymond, P.A.; Striegl, R.G.; McClelland, J.W.; Holmes, R.M.; Fiske, G.J.; Peterson, B.J. A land-to-ocean perspective on the magnitude, source and implication of DIC flux from major Arctic rivers to the Arctic Ocean. Global Biogeochem. Cycles 2012, 26, GB4018. [Google Scholar] [CrossRef]
  5. Hagedorn, B.; Cartwright, I. Climatic and lithologic controls on the temporal and spatial variability of CO2 consumption via chemical weathering: An example from the Australian Victorian Alps. Chem. Geol. 2009, 260, 234–253. [Google Scholar] [CrossRef]
  6. Xie, Y.; Huang, F.; Yang, H.; Yu, S. Role of anthropogenic sulfuric and nitric acids in carbonate weathering and associated carbon sink budget in a karst catchment (Guohua), southwestern China. J. Hydrol. 2021, 599, 126287. [Google Scholar] [CrossRef]
  7. Liu, J.K.; Han, G.L.; Zhang, Q.; Liu, M.; Li, X.Q. Stable isotopes and Bayesian tracer mixing model reveal chemical weathering and CO2 release in the Jiulongjiang River Basin, Southeast China. Water Resour. Res. 2022, 58, e2021WR031738. [Google Scholar] [CrossRef]
  8. Gaillardet, J.; Dupre, B.; Louvat, P.; Allegre, C.J. Global silicate weathering and CO2 consumption rates deduced from the chemistry of large rivers. Chem. Geol. 1999, 159, 3–30. [Google Scholar] [CrossRef]
  9. Moon, S.; Huh, Y.; Qin, J.; van Pho, N. Chemical weathering in the Hong (Red) River basin: Rates of silicate weathering and their controlling factors. Geochim. Cosmochim. Acta 2007, 71, 1411–1430. [Google Scholar] [CrossRef]
  10. Zhong, J.; Li, S.L.; Liu, J.; Ding, H.; Sun, X.L.; Xu, S.; Wang, T.J.; Ellam, R.M.; Liu, C.Q. Climate variability controls on CO2 consumption fluxes and carbon dynamics for monsoonal rivers: Evidence from Xijiang River, Southwest China. J. Geophys. Res. Biogeo. 2018, 123, 2553–2567. [Google Scholar] [CrossRef]
  11. Millot, R.; Gaillardet, J.É.; Dupré, B.; Allègre, C.J. Northern latitude chemical weathering rates: Clues from the Mackenzie River Basin, Canada. Geochim. Cosmochim. Acta 2003, 67, 1305–1329. [Google Scholar] [CrossRef]
  12. Qin, X.; Jiang, Z.; Zhang, L.; Huang, Q.; Liu, P. The difference of the weathering rate between carbonate rocks and silicate rocks and its effects on the atmospheric CO2 consumption in the Pearl River Basin. Geol. Bull. China 2015, 34, 1749–1757. [Google Scholar]
  13. Jiang, P.; Yu, G.; Zhang, Q.; Zou, Y.; Tang, Q.; Kang, Z.; Sytharith, P.; Xiao, H. Chemical weathering and CO2 consumption rates of rocks in the Bishuiyan subterranean basin of Guangxi, China. Sci. Rep. 2020, 10, 11677. [Google Scholar] [CrossRef]
  14. Li, Z.; Zhong, J.; Li, S.; Lang, Y.; Zhu, X.; Chen, S. The effects of hydrological variations on chemical weathering: Evidences from temporal water chemistry, stable carbon and sulfur isotopes. CATENA 2022, 214, 106301. [Google Scholar] [CrossRef]
  15. Peng, H.; Liu, L.; Tao, Z.; Lv, X.; Li, S.; Deng, H.; Gao, Q. Chemical Weathering and Seasonal Variation of Chemical Compositions of Water in Humid Subtropical Basins—A Case Study for the Xizhijiang River Basin. Earth Environ. 2018, 46, 513–523. [Google Scholar]
  16. Sun, P.; Yu, S.; Mo, F.; He, S.; Lu, J.; Yuan, Y. Hydrochemical Characteristics and Influencing Factors in Different Geological Background: A Case Study in Darongjiang and Lingqu Basin, Guangxi, China. Environ. Sci. 2016, 37, 123–131. [Google Scholar]
  17. Maher, K.; Chamberlain, C.P. Hydrologic regulation of chemical weathering and the geologic carbon cycle. Science 2014, 343, 1502–1504. [Google Scholar] [CrossRef]
  18. Liu, F.; Wang, S.; Wang, J.; Guo, F.; Yu, S.; Sun, P. The hydrochemistry characteristics and chemical weathering intensity of an anthropogenically involved catchment, South China. Water 2024, 16, 2444. [Google Scholar] [CrossRef]
  19. Amrish, V.N.; Arun, K.; Nishitha, D.S.; Balakrishna, K.; Udayashankar, H.N.; Khare, N. Major ion chemistry and silicate weathering rate of a small Western Ghats river, Sharavati, southwestern India. Appl. Geochem. 2022, 136, 105182. [Google Scholar] [CrossRef]
  20. Ulloa⁃Cedamanos, F.; Probst, A.; Moussa, I.; Probst, J.L. Chemical weathering and CO2 consumption in a multi-lithological karstic critical zone: Long term hydrochemical trends and isotopic survey. Chem. Geol. 2021, 585, 120567. [Google Scholar] [CrossRef]
  21. Xu, S.; Li, S.L.; Su, J.; Yue, F.J.; Zhong, J.; Chen, S. Oxidation of pyrite and reducing nitrogen fertilizer enhanced the carbon cycle by driving terrestrial chemical weathering. Sci. Total Environ. 2021, 768, 144343. [Google Scholar] [CrossRef] [PubMed]
  22. Kim, H.; Dietrich, W.E.; Thurnhoffer, B.M.; Bishop, J.K.B.; Fung, I.Y. Controls on solute concentration-discharge relationships revealed by simultaneous hydrochemistry observations of hillslope runoff and stream flow: The importance of critical zone structure. Water Resour. Res. 2017, 53, 1424–1443. [Google Scholar] [CrossRef]
  23. Song, C.L.; Wang, G.X.; Mao, T.X.; Huang, K.W.; Sun, X.Y.; Hu, Z.Y.; Chang, R.Y.; Chen, X.P.; Raymond, P.A. Spatiotemporal variability and sources of DIC in Permafrost catchments of the Yangtze River source region: Insights from stable carbon isotope and water chemistry. Water Resour. Res. 2020, 55, e2019WR025343. [Google Scholar] [CrossRef]
  24. Liu, J.K.; Han, G.L. Effects of chemical weathering and CO2 outgassing on δ13CDIC signals in a karst watershed. J. Hydrol. 2020, 589, 125192. [Google Scholar] [CrossRef]
  25. Fu, Y.C.; Tang, C.G.; Li, J.; Zhao, Y.L.; Zhong, W.; Zeng, X.T. Sources and transport of organic carbon from the Dongjiang River to the Humen outlet of the Pearl River, southern China. J. Geogr. Sci. 2014, 24, 143–158. [Google Scholar] [CrossRef]
  26. Xuan, Y.X.; Cao, Y.J.; Tang, C.Y.; Li, M. Changes in dissolved inorganic carbon in river water due to urbanization revealed by hydrochemistry and carbon isotope in the Pearl River Delta, China. Environ. Sci. Pollut. 2020, 27, 24542–24557. [Google Scholar] [CrossRef]
  27. Levin, I.; Graul, R.; Trivett, N.B.A. Long-term observations of atmospheric CO2 and carbon isotopes at continental sites in Germany. Tellus B 1995, 47, 23–34. [Google Scholar] [CrossRef]
  28. Marfia, A.M.; Krishnamurthy, R.V.; Atekwana, E.A.; Panton, W.F. Isotopic and geochemical evolution of ground and surface waters in a karst dominated geological setting: A case study from Belize, Central America. Appl. Geochem. 2004, 19, 937–946. [Google Scholar] [CrossRef]
  29. Wang, H.; Zhu, B.; Shen, L.J.; Kang, H.Q. Size distributions of aerosol and water-soluble ions in Nanjing during a crop residual burning event. J. Environ. Sci. 2012, 24, 1457–1465. [Google Scholar] [CrossRef]
  30. Trancone, G.; Spasiano, D.; Race, M.; Luongo, V.; Petrella, A.; Pirozzi, F.; Fratino, U.; Piccinni, A.F. A combined system for asbestoscement waste degradation by dark fermentation and resulting supernatant valorization in anaerobic digestion. Chemosphere 2022, 300, 134500. [Google Scholar] [CrossRef]
  31. El Housse, M.; Hadfi, A.; Karmal, I.; Tadoumant, S.; Ben-aazza, S.; Errami, M.; Belattar, M.; Mohareb, S.; Tounsi, A.; Driouiche, A. Study of scaling problem in the region of tata (Morocco): Analysis of the elemental composition, crystalline phases, and morphologies of scale deposition in water installations. Appl. Radiat. Isot. 2022, 188, 110388. [Google Scholar] [CrossRef] [PubMed]
  32. Oliva, P.; Viers, J.; Dupré, B. Chemical weathering in granitic environments. Chem. Geol. 2003, 202, 225–256. [Google Scholar] [CrossRef]
  33. Fan, B.; Zhao, Z.Q.; Tao, F.X.; Liu, B.J.; Tao, Z.H.; Gao, S.; Zhang, L.H. Characteristics of carbonate, evaporite and silicate weathering in Huanghe River basin: A comparison among the upstream, midstream and downstream. J. Asian Earth Sci. 2014, 96, 17–26. [Google Scholar] [CrossRef]
  34. Chetelat, B.; Liu, C.Q.; Zhao, Z.; Wang, Q.; Li, S.; Li, J.; Wang, B. Geochemistry of the dissolved load of the Changjiang Basin rivers: Anthropogenic impacts and chemical weathering. Geochim. Cosmochim. Acta 2008, 72, 4254–4277. [Google Scholar] [CrossRef]
  35. Piper, A.M. A graphic procedure in geochemical interpretation of water analyses. Eos Trans. Am. Geophys. Union 1944, 25, 914–923. [Google Scholar]
  36. Gibbs, R.J. Mechanisms controlling world water chemistry. Science 1970, 170, 1088–1090. [Google Scholar] [CrossRef]
  37. Marandi, A.; Shand, P. Groundwater chemistry and the Gibbs Diagram. Appl. Geochem. 2018, 97, 209–212. [Google Scholar] [CrossRef]
  38. Sun, P.; He, S.; Yuan, Y.; Yu, S.; Zhang, C. Effects of aquatic phototrophs on seasonal hydrochemical, inorganic, and organic carbon variations in a typical karst basin, Southwest China. Environ. Sci. Pollut. 2019, 26, 32836–32851. [Google Scholar] [CrossRef]
  39. Cao, Y.; Xuan, Y.; Tang, C.; Guan, S.; Peng, Y. Temporary and net sinks of atmospheric CO2 due to chemical weathering in subtropical catchment with mixing carbonate and silicate lithology. Biogeosciences 2020, 17, 3875–3890. [Google Scholar] [CrossRef]
  40. Galy, A.; France, L.C. Weathering processes in the Ganges-Brahmaputra basin and the riverine alkalinity budget. Chem. Geol. 1999, 159, 31–60. [Google Scholar] [CrossRef]
  41. Zhou, H.L.; Li, Z.X.; Yu, Z.L.; Wang, Y.Y.; Du, F.; Xue, J. Permafrost impacts on chemical weathering and CO2 budgets in the Tibetan Plateau: Micro-watershed perspective on a headwater catchment. CATENA 2024, 247, 108479. [Google Scholar]
  42. Li, L.; Liu, L.Q.; Zhou, G.Y.; Qiu, Z.J.; Zhao, H.B. Effects of canopy damage on hydrochemistry of throughfall and stemflow in evergreen broadleaved forest of Nanling Mountains. J. Soil Water Conserv. 2014, 28, 45–50. [Google Scholar]
  43. Hren, M.T.; Chamberlain, C.P.; Hilley, G.E.; Blisniuk, P.M.; Bookhagen, B. Major ion chemistry of the Yarlung Tsangpo–Brahmaputra river: Chemical weathering, erosion, and CO2 consumption in the southern Tibetan plateau and eastern syntaxis of the Himalaya. Geochim. Cosmoschim. Acta 2007, 71, 2907–2935. [Google Scholar] [CrossRef]
Figure 1. Location of the study area and spatial distribution of sampling sites.
Water 17 02008 g001
Figure 2. (a) TDS contents in different water samples, (b) correlation between Cl/∑+ and Na+/∑+ (∑+ = Na+ + K+ + Ca2+ + Mg2+; in units of charge equivalents).
Water 17 02008 g002
Figure 3. Piper trilinear diagram for water samples.
Water 17 02008 g003
Figure 4. Gibbs diagram for water samples.
Water 17 02008 g004
Figure 5. Correlation between HCO3/Na+ and Ca2+/Na+.
Water 17 02008 g005
Figure 6. (ac) Correlations between saturation indices of different minerals in waters.
Water 17 02008 g006
Figure 7. δ13C-DIC in different water samples. The end-member values of δ13C-DIC were derived from previous studies [7,23,24,25].
Water 17 02008 g007
Table 1. Statistical summary of hydrogeochemical and isotopic parameters of samples.
Sample
Number
TDSpHCa2+Mg2+Na+K+ClSO42−HCO3NO3SiO2δ13C
mg/L/mg/Lmg/Lmg/Lmg/Lmg/Lmg/Lmg/Lmg/Lmg/L
CJSW
-July
14Max64.47.710.50.65.71.50.81.945.02.214.5−10.4
Min20.56.40.40.01.70.30.20.75.10.25.1−14.9
Ave32.77.11.90.12.90.90.41.113.30.98.3−12.2
CJSW
-December
14Max66.17.59.20.66.02.42.03.238.03.316.2−6.1
Min23.06.70.20.01.90.50.20.85.40.06.1−12.7
Ave36.77.01.70.13.41.30.61.413.60.99.5−9.4
CJGW
-December
1Max/
Min/
Ave114.37.214.30.715.42.47.27.862.12.615.4−17.7
DTSW
-July
6Max95.37.726.14.12.51.51.33.889.02.36.1−12.1
Min69.66.516.91.62.30.90.62.159.52.15.6−12.6
Ave80.67.120.12.52.41.00.82.672.92.25.9−12.3
DTSW
-December
6Max147.48.048.87.73.01.61.25.8141.12.47.5−10.4
Min101.37.527.33.22.11.10.83.586.81.75.4−12.8
Ave127.47.837.55.02.71.41.04.5118.32.16.6−11.5
DTGW
-July
3Max246.98.292.08.51.70.91.15.7277.62.46.1−16.6
Min181.07.450.42.40.50.40.74.1196.00.43.0−16.6
Ave215.37.772.64.61.00.70.84.7238.91.74.5−16.6
DTGW
-December
3Max277.78.1115.412.31.80.91.26.2284.91.86.5−11.5
Min201.87.661.73.50.80.50.54.3205.20.33.7−16.5
Ave235.17.888.96.51.20.80.85.1239.41.35.0−13.2
Table 2. Contribution of different sources to cations of river water in study area during different sampling periods.
Contribution of Different Sources to Cations of River WaterCJSW-
July
CJSW-
December
DTSW-
July
DTSW-
December
Carbonate weathering (%)//82.690.2
Silicate weathering (%)77.981.112.97.7
Atmospheric precipitation (%)19.614.84.52.1
Anthropogenic input (%)////
Evaporite dissolution (%)
Table 3. Contribution of chemical weathering (silicate and carbonate) to cations of river water in study area during different sampling periods.
Contribution to Cations
of River Water
CJSW-
July
CJSW-
December
DTSW-
July
DTSW-
December
[Ca2+]sil (mg/L)1.2 1.1 0.9 0.9
[Mg2+]sil (mg/L)0.1 0.1 0.1 0.1
[K+]sil (mg/L)0.6 1.1 0.5 0.5
[Na+]sil (mg/L)2.7 3.1 1.9 2.1
[Ca2+]carb (mg/L)//18.5 36.1
[Mg2+]carb (mg/L)//2.4 4.9
Table 4. CO2 consumption (106 mol/km2/yr) through chemical weathering of silicate and carbonate and chemical weathering rates (106 mol/km2/yr) in the CJ and DT watersheds, respectively.
CWRsilCWRcarbCWRsunCCRsilCCRcarbCCRsum
CJ-July0.2200.220.2600.26
CJ-December0.2600.260.3000.30
CJ-Ave.0.2400.240.2800.28
DT-July0.180.650.830.211.301.51
DT-December0.211.291.500.242.582.82
DT-Ave.0.200.971.170.231.942.17
Disclaimer/Publisher’s Note: The statements, opinions and data contained in all publications are solely those of the individual author(s) and contributor(s) and not of MDPI and/or the editor(s). MDPI and/or the editor(s) disclaim responsibility for any injury to people or property resulting from any ideas, methods, instructions or products referred to in the content.

