1. Introduction
In studies of waves propagating in two or three dimensions, the word ‘wavefront’ has a formal definition. One formulation of this definition is “
the wavefront of a time-varying wave field is the set (locus) of all points having the same phase” (Whelan & Hodgeson [
1]). This is used in applications such as optics and electromagnetics as well as in fluid flows, but attention herein is focused exclusively on waves in fluids. To set the scene, consider waves propagating radially outwards from a point at which a pebble has been dropped into a lake with an otherwise undisturbed surface. At any instant, the resulting disturbance resembles a succession of waves following one after the other in a continuous manner, each decreasing in amplitude with increasing radius. For this simple case, the overall pattern comprises a series of crests and troughs, all of which are circular in plan. Using the above definition, the circle of points on the crest of any particular wave is an example of a wavefront. So are corresponding circles of points in a trough or at intermediate locations between crests and troughs. Importantly, although the fluid particles are moving only radially and vertically, the wavefront itself is circumferential. That is, it is in a direction normal to that of the particle motion and wave propagation. Also importantly, individual circles (wavefronts) give no information about
radial distributions of flow parameters. To obtain that information, it is necessary to compare conditions on successive circles (wavefronts).
In analyses of flows along straight, uniform pipes, it is usually assumed that, at least for pressure, plane waves remain plane. Then, the whole flow behaviour can be represented one-dimensionally by axial variations at any randomly chosen point in the cross-section. Based on the above definitions, if the flow is regarded as three-dimensional, a wavefront is the plane of a cross-section. Likewise, if it is regarded as two-dimensional, a wavefront is a line in the cross-section. Similarly, from a one-dimensional perspective, a wavefront would simply be a point in the cross-section. Clearly, however, none of these interpretations is of practical use for describing wave propagation in pipes. Nevertheless, the term ‘wavefront’ is frequently used, but with a completely different meaning. Instead of describing a feature normal to the direction of wave propagation, it is used to describe the character of
axial variations—i.e., in the same direction as the wave propagation itself. Commonly, but not always, attention is focused on relatively steep-fronted disturbances, namely with strong axial variations in pressure
p and velocity
U, etc. In practice, different parameters can have different axial shapes—e.g.,
p{
x} and
U{
x)—so strictly, it would be proper to refer to, say, pressure wavefronts and velocity wavefronts. In practice, this is rarely done because attention is usually focused on pressure (although both parameters are discussed herein). A classical example of such wavefronts is so-called water-hammer in liquid-filled pipes (Wylie & Streeter [
2]), so named because induced movements of pipes or valve stems, etc., can cause loud knocking sounds. Other examples of steep-fronted waves are encountered in many contexts—e.g., pipe filling (Ferreira [
3]) or emptying (Hou et al. [
4]), arterial blood flow (Alastruey et al. [
5]), leak detection (Xu et al. [
6]), railway tunnels (Herb et al. [
7]; Wang et al. [
8]), fluid–structure interactions (Ferras et al. [
9]) and shock tubes (Balan & Raj [
10]).
Notwithstanding this use of the word ‘wavefront’, the authors have never seen any attempt to define its meaning in the context of one-dimensional, transient flows. The purpose of this paper is to illustrate a wide range of different behaviours and to propose a tentative definition that could be used as a focus. Naturally, any such definition needs to be suitable for identifying examples of the phenomenon even in flows in which other disturbances also exist. Nevertheless, for clarity, each example presented below illustrates only an isolated wavefront, thereby avoiding complications arising from interactions that would mask the individual behaviour.
Indicative Wavefronts
In each example, the initial conditions are uniform pressure and zero velocity. A disturbance is then initiated by a prescribed, rapid increase in pressure at an upstream boundary, rising from ambient pressure to a greater value that is then held constant. This is just one of an infinity of possible ways of creating suitable disturbances, but it has the advantage of enabling many different types of wavefront to be compared in a relatively straightforward manner. Nevertheless, to avoid confusion in the discussions of the various examples, the use of the word ‘wavefront’ is avoided when describing the physical behaviour. Instead, as earlier in this paragraph, the key events are referred to simply as ‘disturbances’. This word would be far too vague to be used in general contexts, but it is unambiguous herein because each example has only one strong disturbance, albeit usually evolving in magnitude and form as it propagates.
Attention is focused on disturbances propagating along uniform pipes and ducts and, except as otherwise stated, the following assumptions are made to provide a clear basis for comparisons:
The pipe is horizontal, stationary, of uniform bore and elastic-walled;
The fluid is inviscid;
In the examples with liquid flows, the fluid density is treated as a constant except in the determination of the speed of sound, which itself is treated as a constant;
The initial conditions along the whole pipe are uniform-pressure and zero-flow;
A disturbance of finite magnitude is initiated by a prescribed time-dependent increase in the stagnation pressure (sometimes called total pressure) at the origin of the x axis. After the initial increase, the pressure is held constant;
All changes are treated as occurring in a homentropic manner.
This method of inducing a disturbance could be mimicked in practice by the rapid opening of a valve at the upstream end of a pipe connected to a reservoir of constant pressure. For present purposes, it has the advantage of ensuring that the induced flow is in the same direction as the wave-like propagation. An alternative method that is preferred in many textbook descriptions of water-hammer, is to begin with a steady flow and to close a valve rapidly at the downstream end of the pipe. However, this can complicate the interpretation of outcomes, especially when the initial pressure distributions include variations in pressure due to, say, skin friction, gravity, finite Mach numbers or unsteadiness. Herein, such complications would bring no benefit to offset these disadvantages.
Each example illustrates the influence of a particular phenomenon—inertia, friction, Mach number, etc. All examples in Part 1 are for liquid flows and those in Part 2 are for gas flows. The latter are inherently less simple than the former because changes in pressure necessarily cause changes in density. Also, both the density ρ and the speed of sound c vary with temperature T. This is important because, except in idealised cases, all three of these parameters vary along propagating disturbances.
The focus of the whole paper is on qualitative behaviour, not on quantitative details. In each case, the same qualitative behaviour would be predicted with any reasonable method of analysis. Accordingly, presenting details of any particular method would deflect attention from the primary focus without adding meaningful value for readers. For completeness, however, it is declared that all of the analyses have been undertaken using the software ThermoTun [
11] which has been used extensively in academic research and in practical engineering design, primarily for simulating flows of gases, notably air, but also in a range of other applications—e.g., subsea oil pipelines. The software uses the Method of Characteristics (MoC) to solve one-dimensional (1D) equations of flow and it has been validated by many measurements at model scale and full scale as well as by detailed comparisons with analytical solutions. In contrast with most textbooks and papers on water-hammer in pipelines, convective terms are retained in the basic equations, thereby enabling behaviour such as the inertial shortening and lengthening of localised phenomena to be simulated. This is rarely important in the case of liquid flows (exceptions include regions of distributed cavitation, where the pressure gradient is zero), but, as illustrated in
Section 7 below, it can be of high importance in some applications of waves in gas flows.
2. Example 1: Base Case
The first example is an idealised base-case against which subsequent cases may be compared.
The diameter and wall-thickness of the semi-infinite, horizontal, uniform-bore pipe are D = 100 mm and e = 4 mm, respectively;
The elastic pipe-wall has a density of 7850 kg/m3 and a Young’s modulus of 200 GPa;
The fluid is an inviscid liquid with a density of 1000 kg/m3 and a bulk modulus of 2.20 GPa;
With these data, the speed of sound in the liquid is c = 1483 m/s and the effective speed of sound, allowing for radial flexibility of the pipe, is ceff = 1326 m/s;
At t = 0, the absolute pressure throughout the pipe and in the surrounding atmosphere is 100 kPa. All pressures presented in the following graphical output are expressed relative to this ambient value;
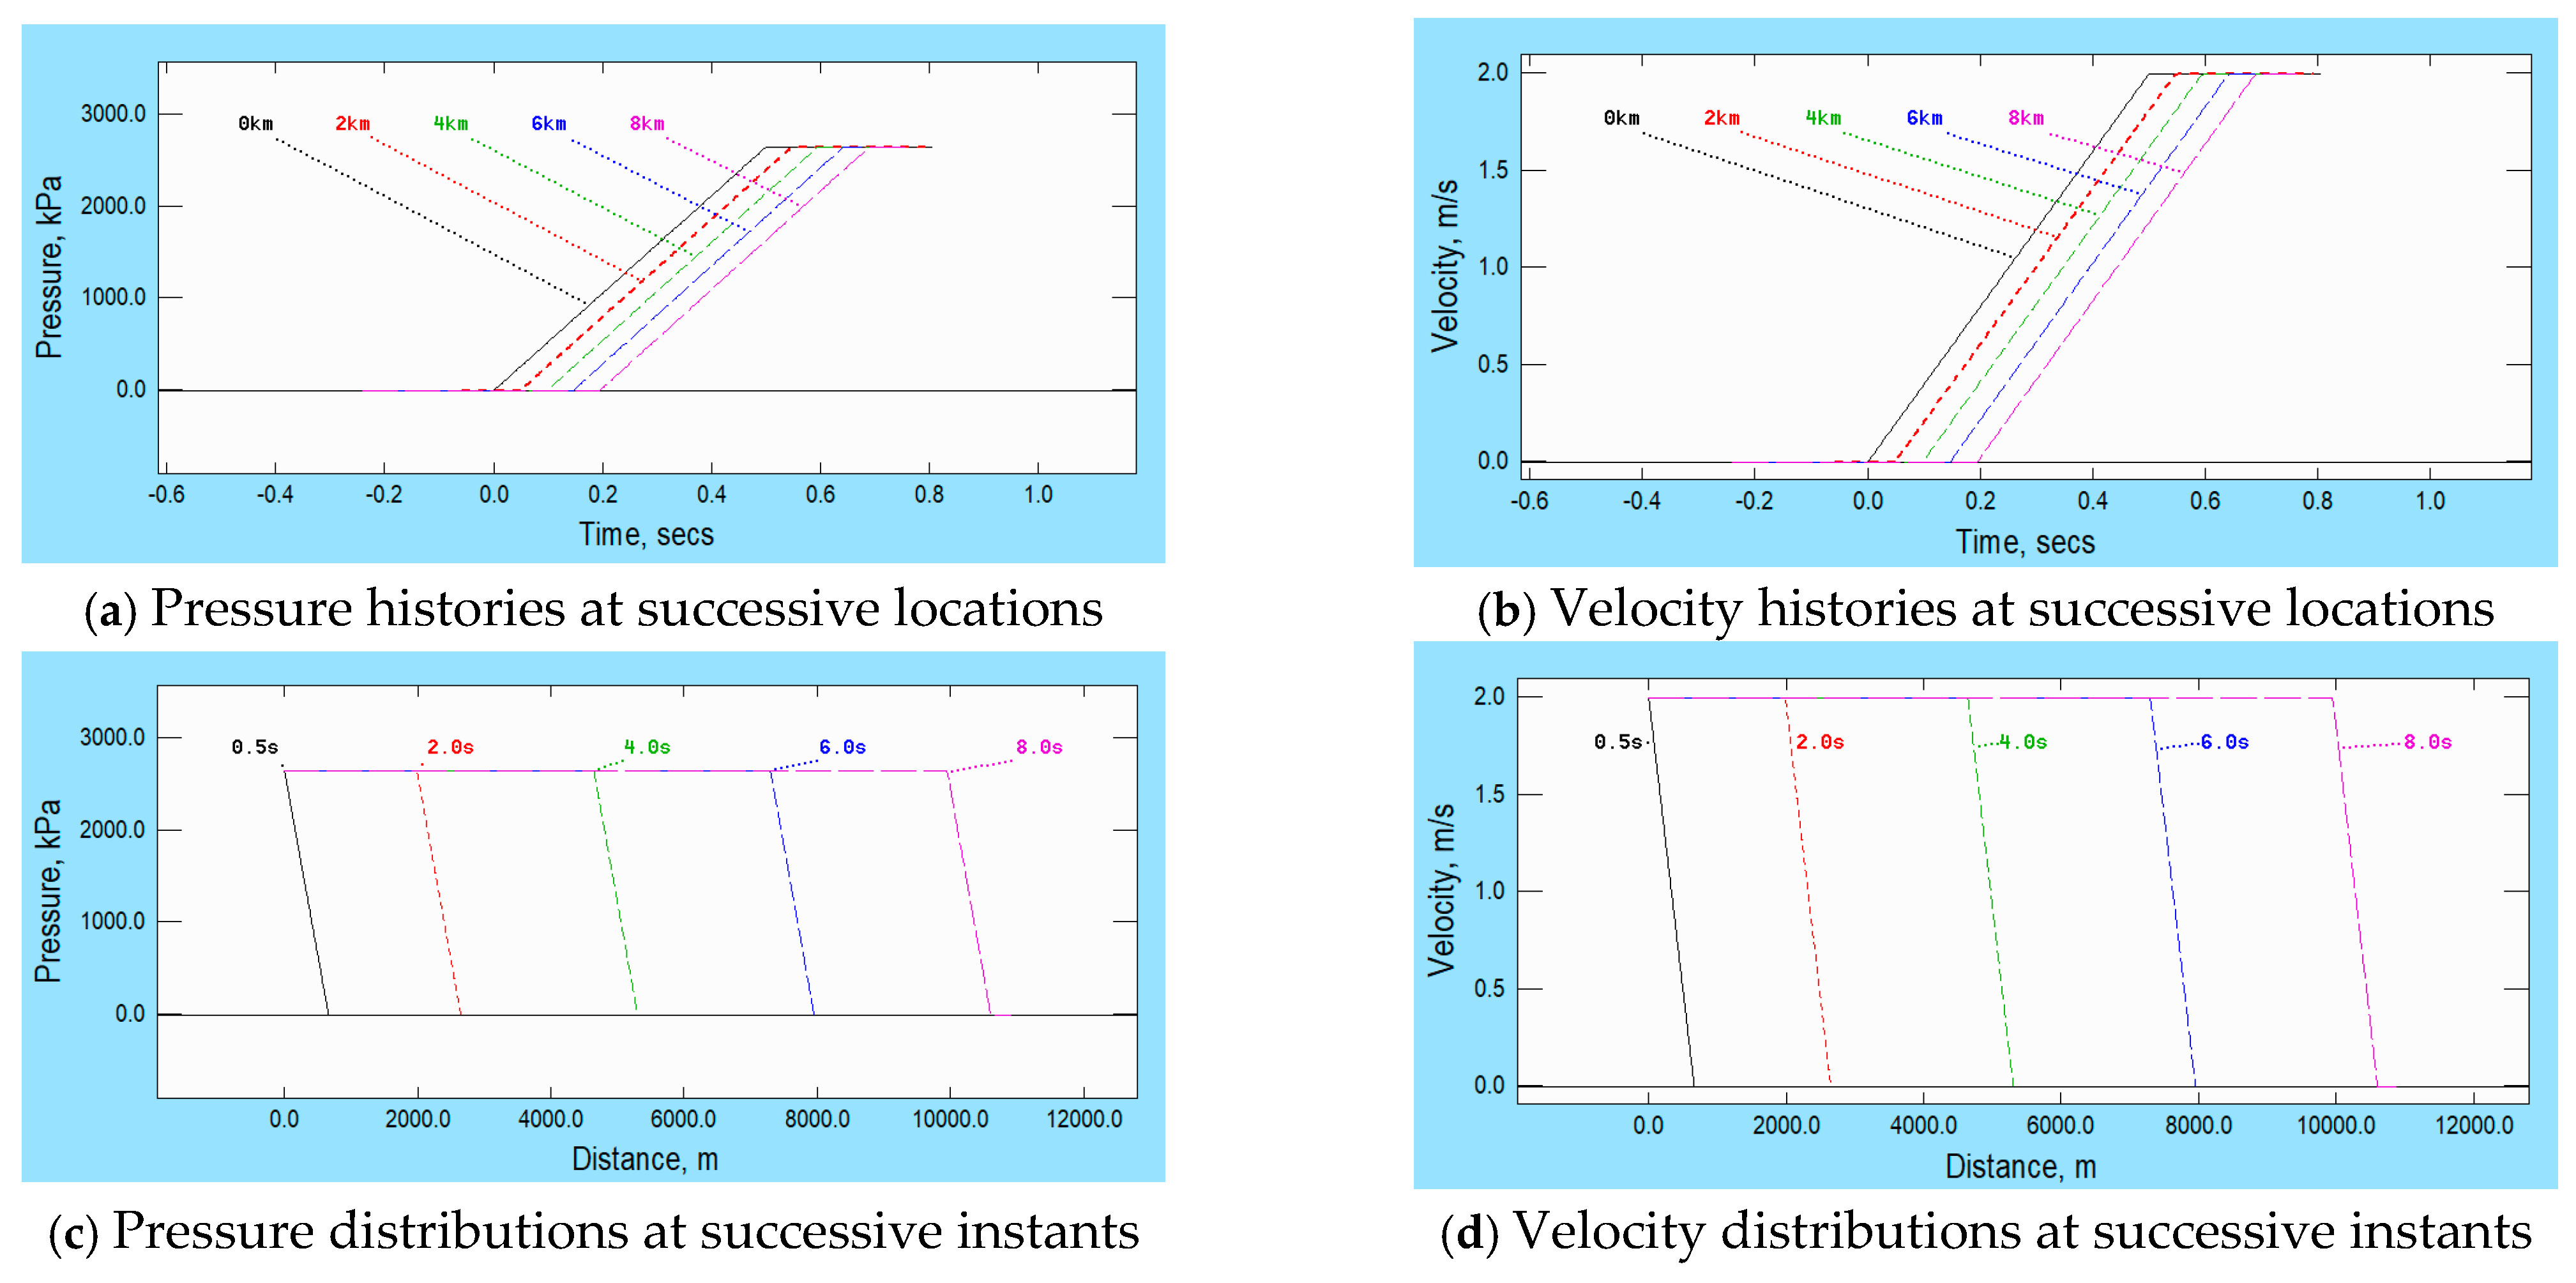
The prescribed rapid change in pressure at the upstream boundary is a linear increase in 0.5 s from the ambient value to a maximum value that is then held constant. The chosen increase causes a velocity increase of 2 m/s.
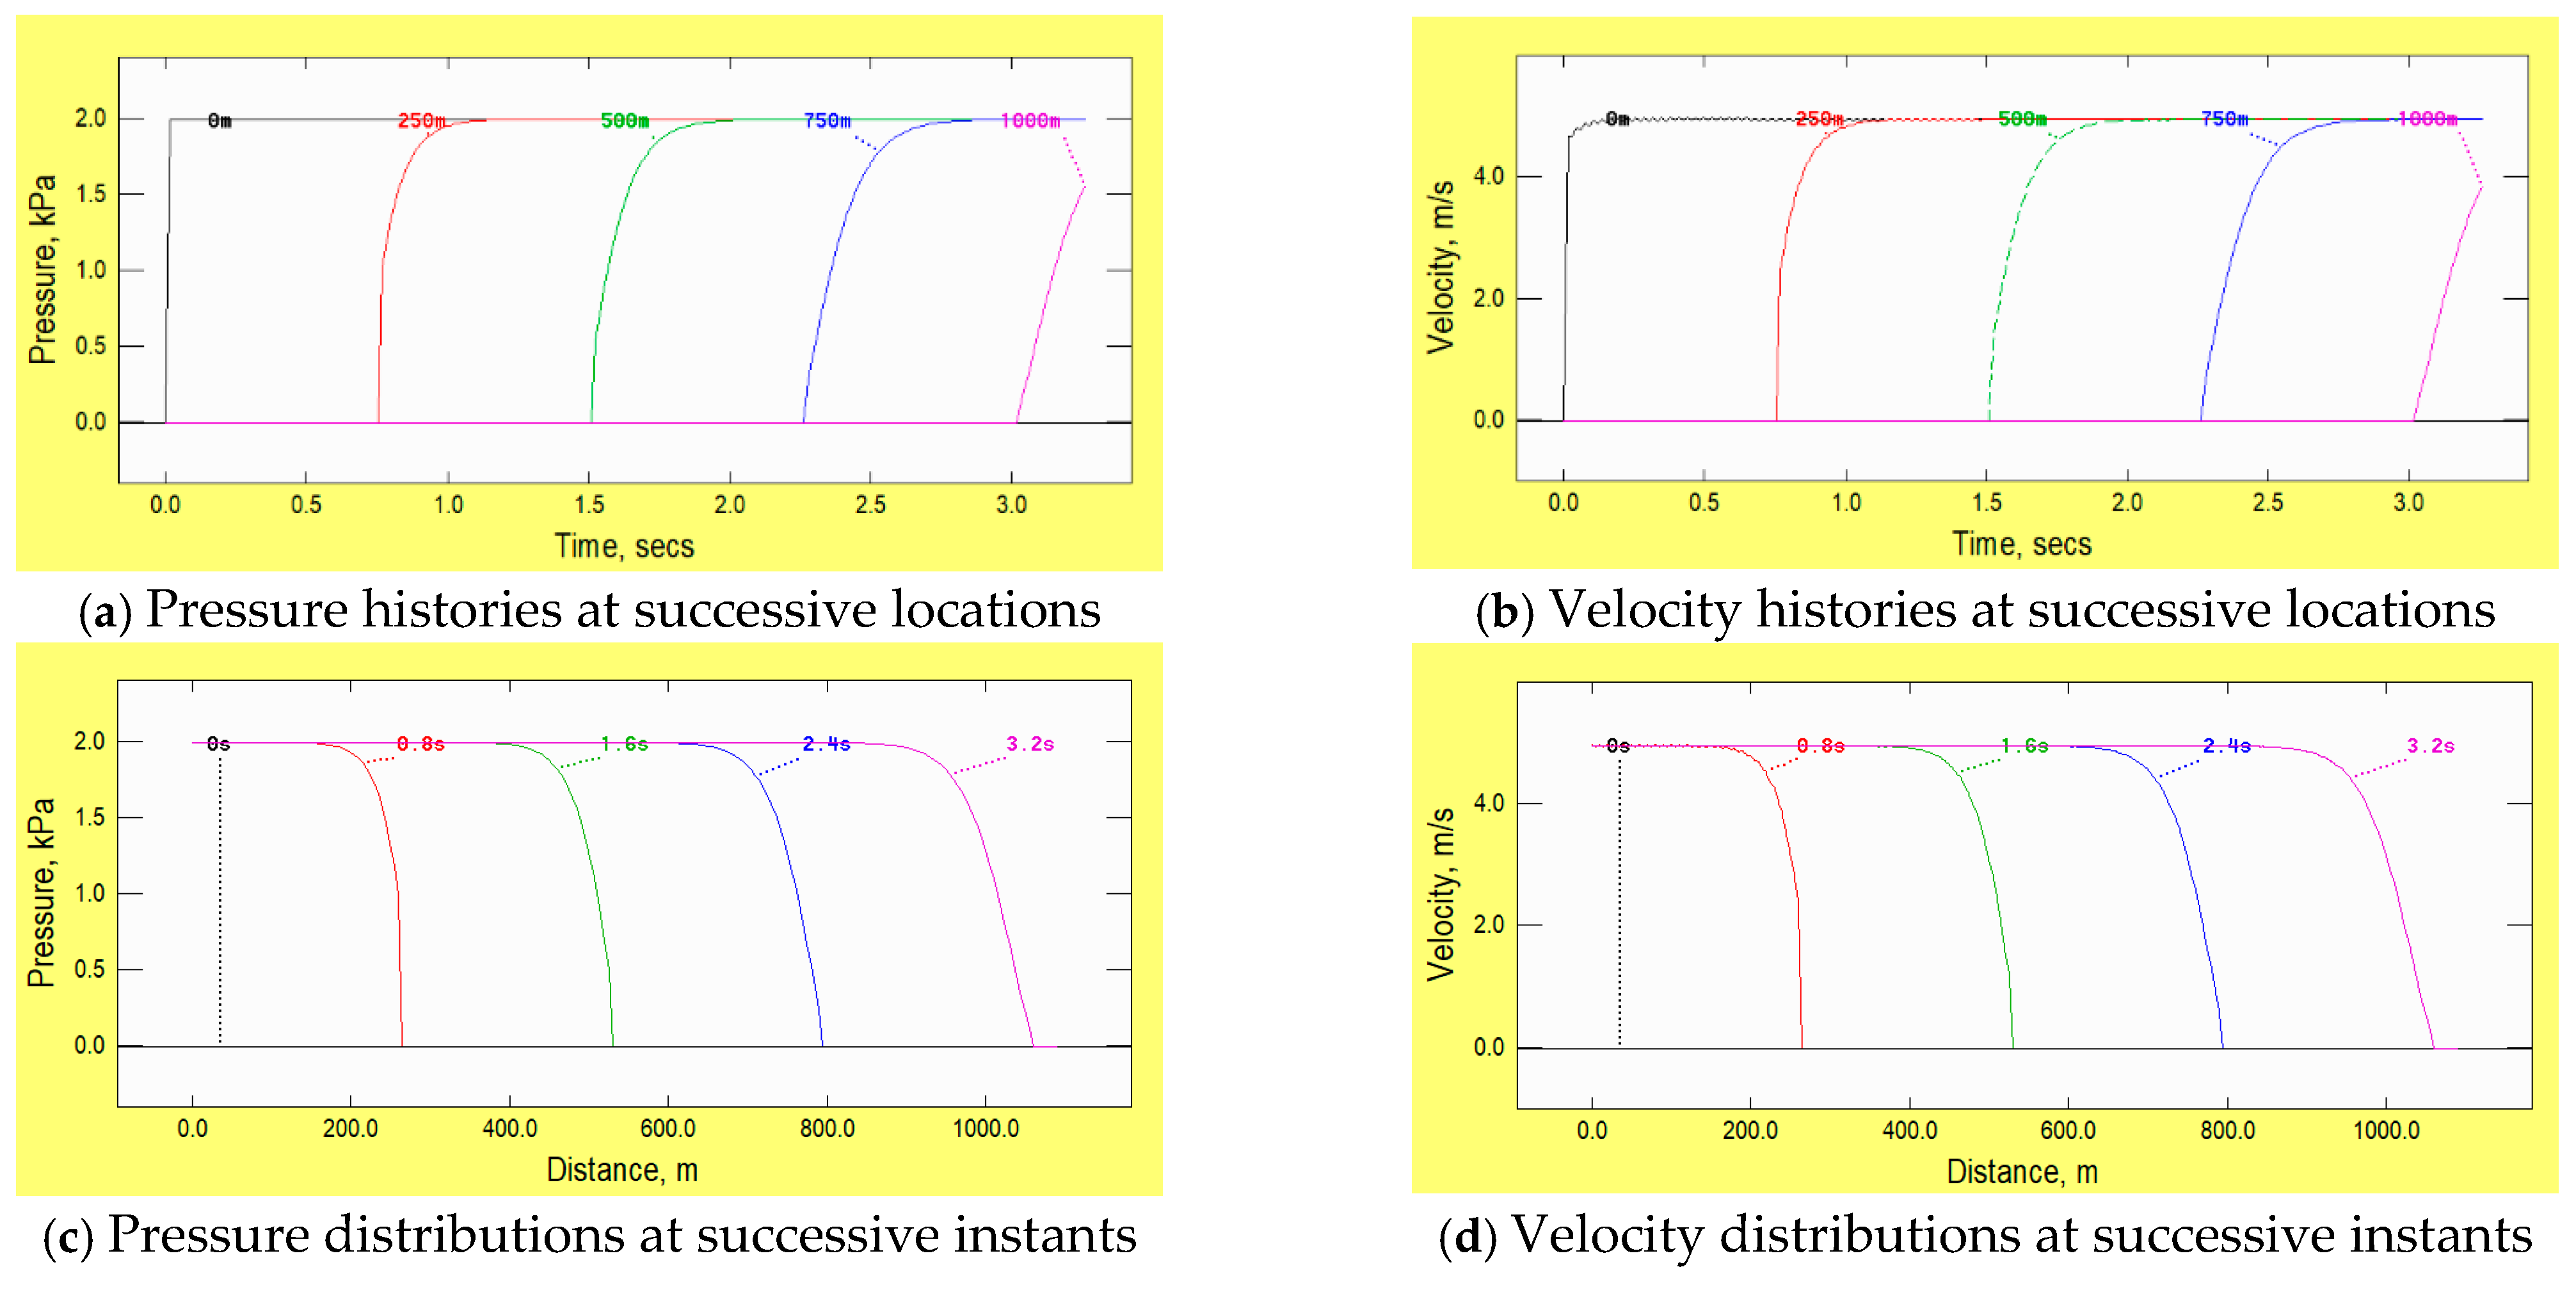
The lower row in
Figure 1 shows pressure and velocity distributions along the pipe at successive instants after valve opening. The first of these, at
t = 0.5 s, is at the instant when the prescribed change at the boundary ceases and the remainder are at intervals of 2 s. By inspection, the only obvious difference between the various distributions is the distance from the boundary to the ramp-like disturbance. The validity of this interpretation is confirmed by the upper row in the figure, which compares pressure and velocity histories at five locations, namely
x = 0, 2, 4, 6 and 8 km. To enable these comparisons to be made in detail, the graphs are offset so that the intervals between them are approximately 0.05 s instead of the true intervals of slightly more than 1.5 s.
Although general behaviour cannot be inferred from individual numerical simulations such as this, the evidence in the figure suggests that the leading ramp is propagating at an almost constant speed and that it is doing so without any change in form. However, as demonstrated below (in Example 6), it is not
exactly true to state that the ramp is propagating without any change whatsoever. Strictly, this could be possible only for infinitesimal disturbances, just as, in the frequency domain, only acoustic amplitude waves approximate almost exactly to propagation in a linear manner. In both cases, waves travel at the local speed of sound relative to fluid particles—i.e., at
U +
c, not just
c. Thus, the propagation speed in regions of high pressure and velocity is greater than that in regions of low pressure and velocity. It follows that the tentative definition given above excludes regions where variations in
U +
c cannot reasonably be regarded as negligible. This issue is revisited in
Section 7 (Example 6) in the context of fluids that are more compressible than liquids.
As an aside, it is worth noting that the fact that the results presented in
Figure 1 are so similar at successive locations up to
x/
D = 80,000 is an indication of the ability of the numerical method to propagate disturbances without causing significant non-physical dispersion. It follows that strong dispersive behaviour predicted in subsequent examples can reasonably be assumed to be primarily attributable to true physical causes, not to numerical inadequacies.
3. Example 2: Quasi-Steady Friction
The second example differs from the first in only one respect, namely removing the idealisation of inviscid conditions. Instead, account is taken of an inevitable consequence of viscosity and turbulence, namely skin frictional resistance at the pipe wall surface. In this example, the resistance is approximated by quasi-steady relationships suitable for turbulent flows. That is, at any particular location, it is treated as being dependent only on the instantaneous Reynolds number, not on rates of change thereof. Consideration of dependence on the latter is deferred until a later example (in
Section 8). However, account is taken of the variation of the quasi-steady skin friction coefficient with the Reynolds number. To highlight the qualitative behaviour, the implied roughness of the pipe wall is relatively large, corresponding to Fanning (and Darcy–Weisbach) friction coefficients of
f = 0.01 (and
λ = 0.04).
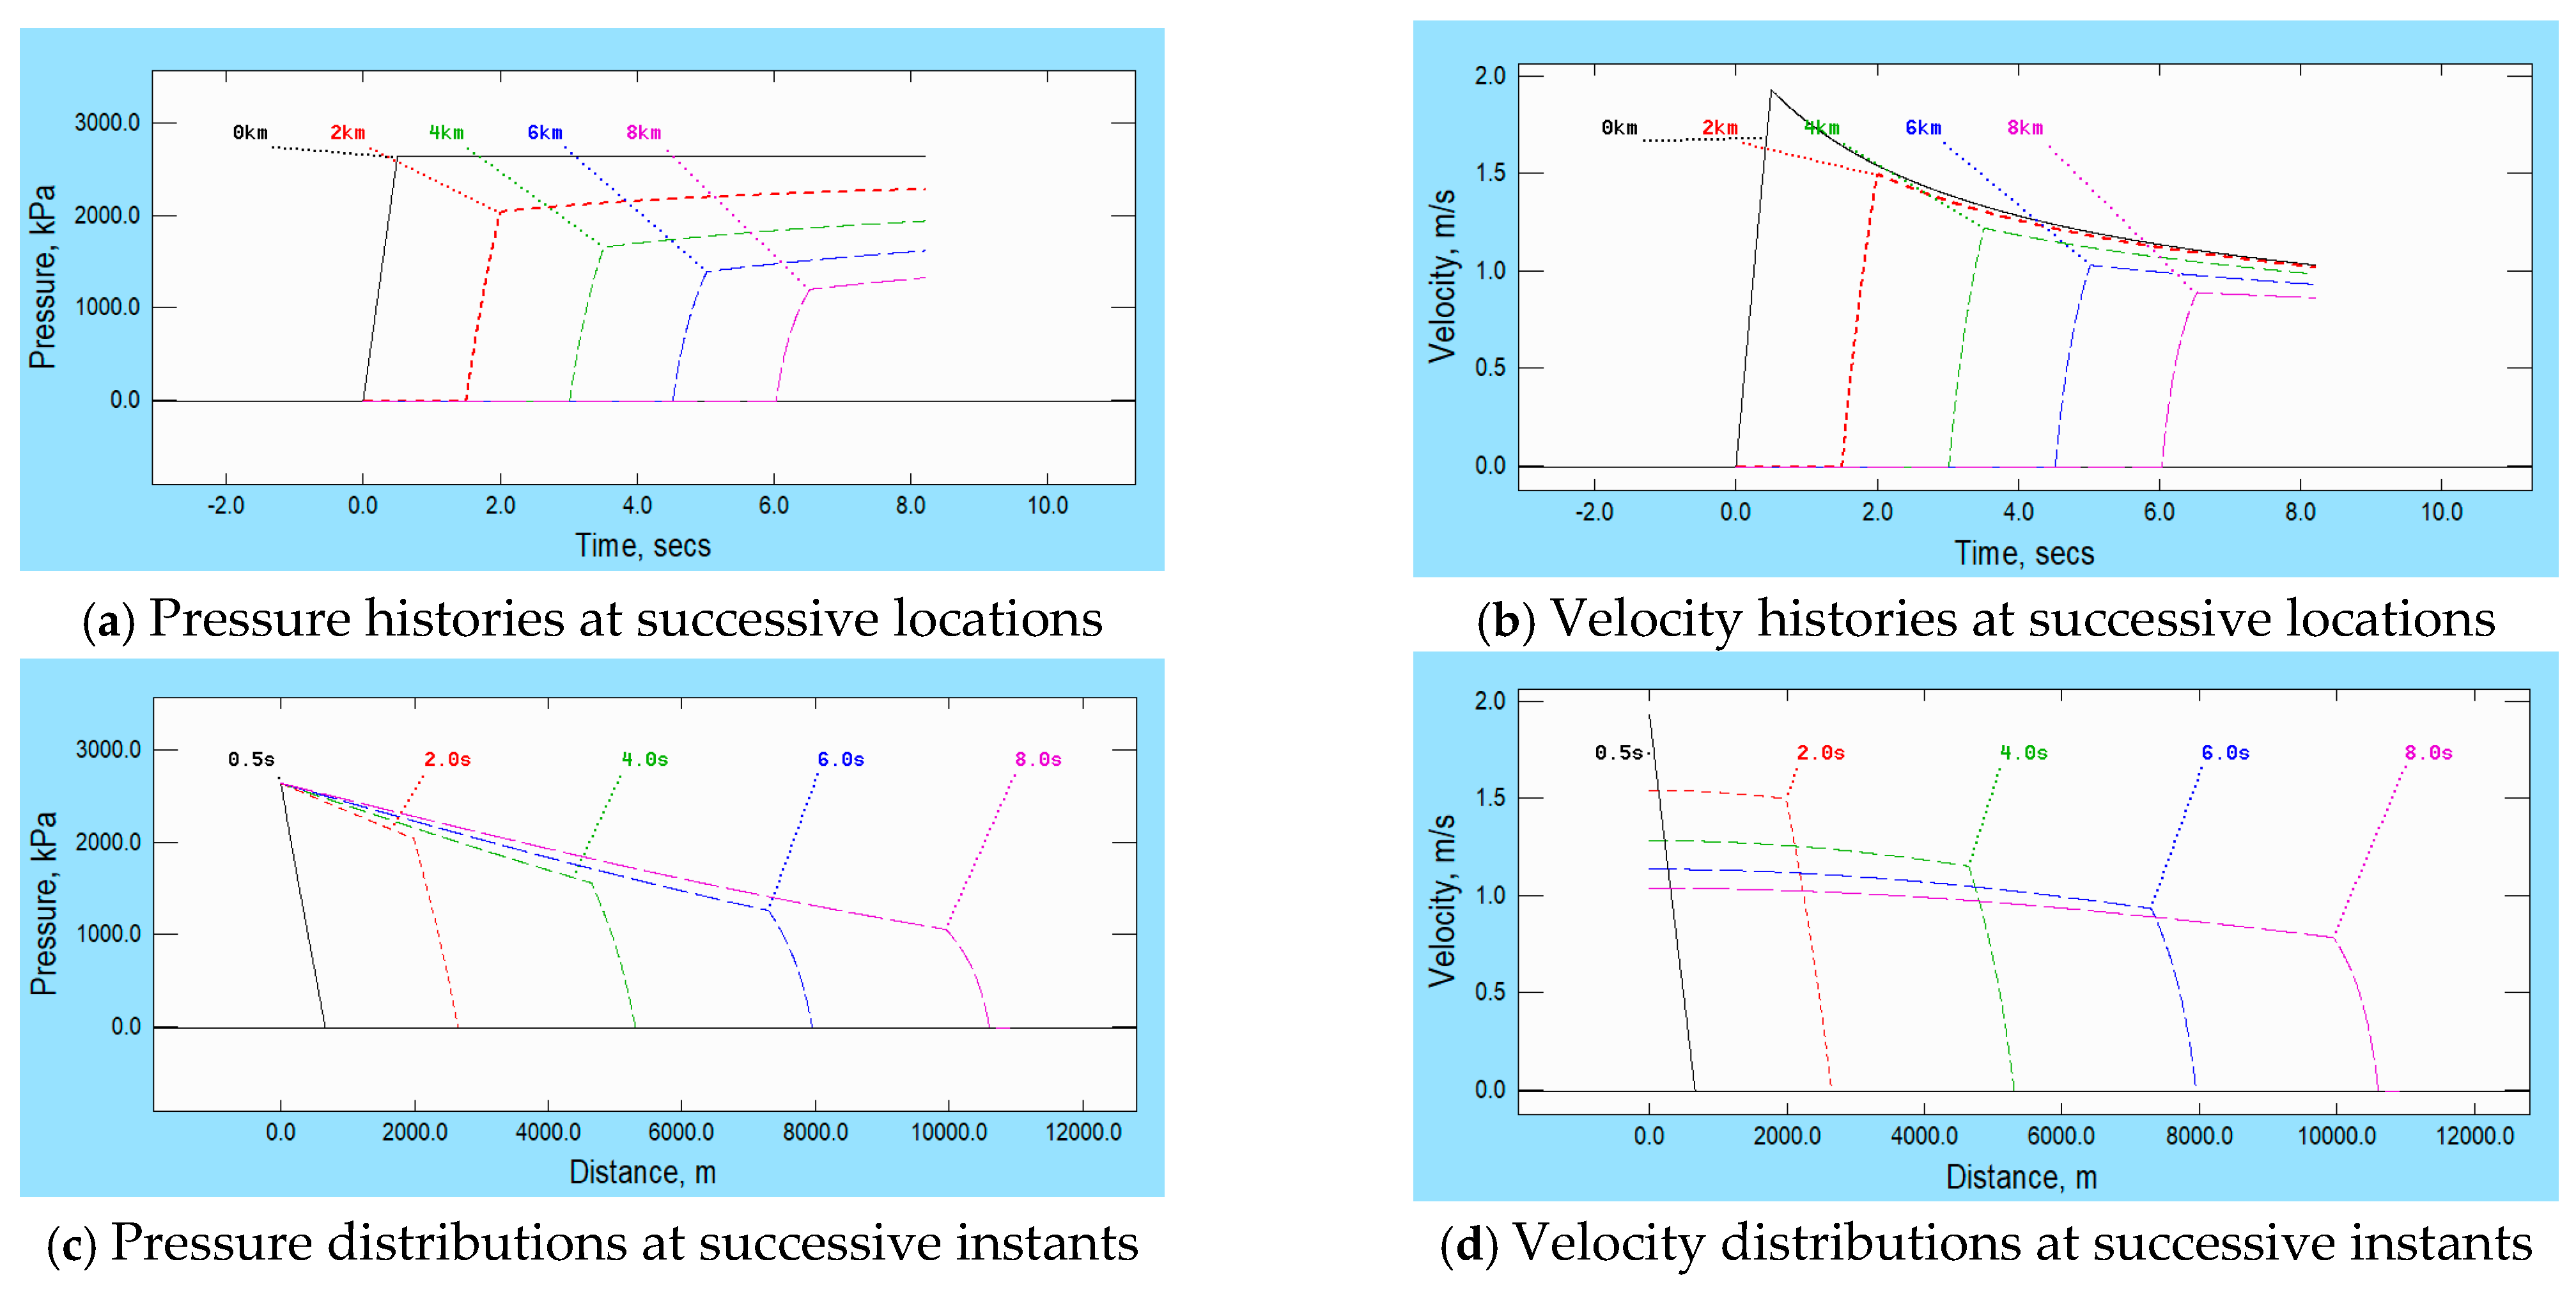
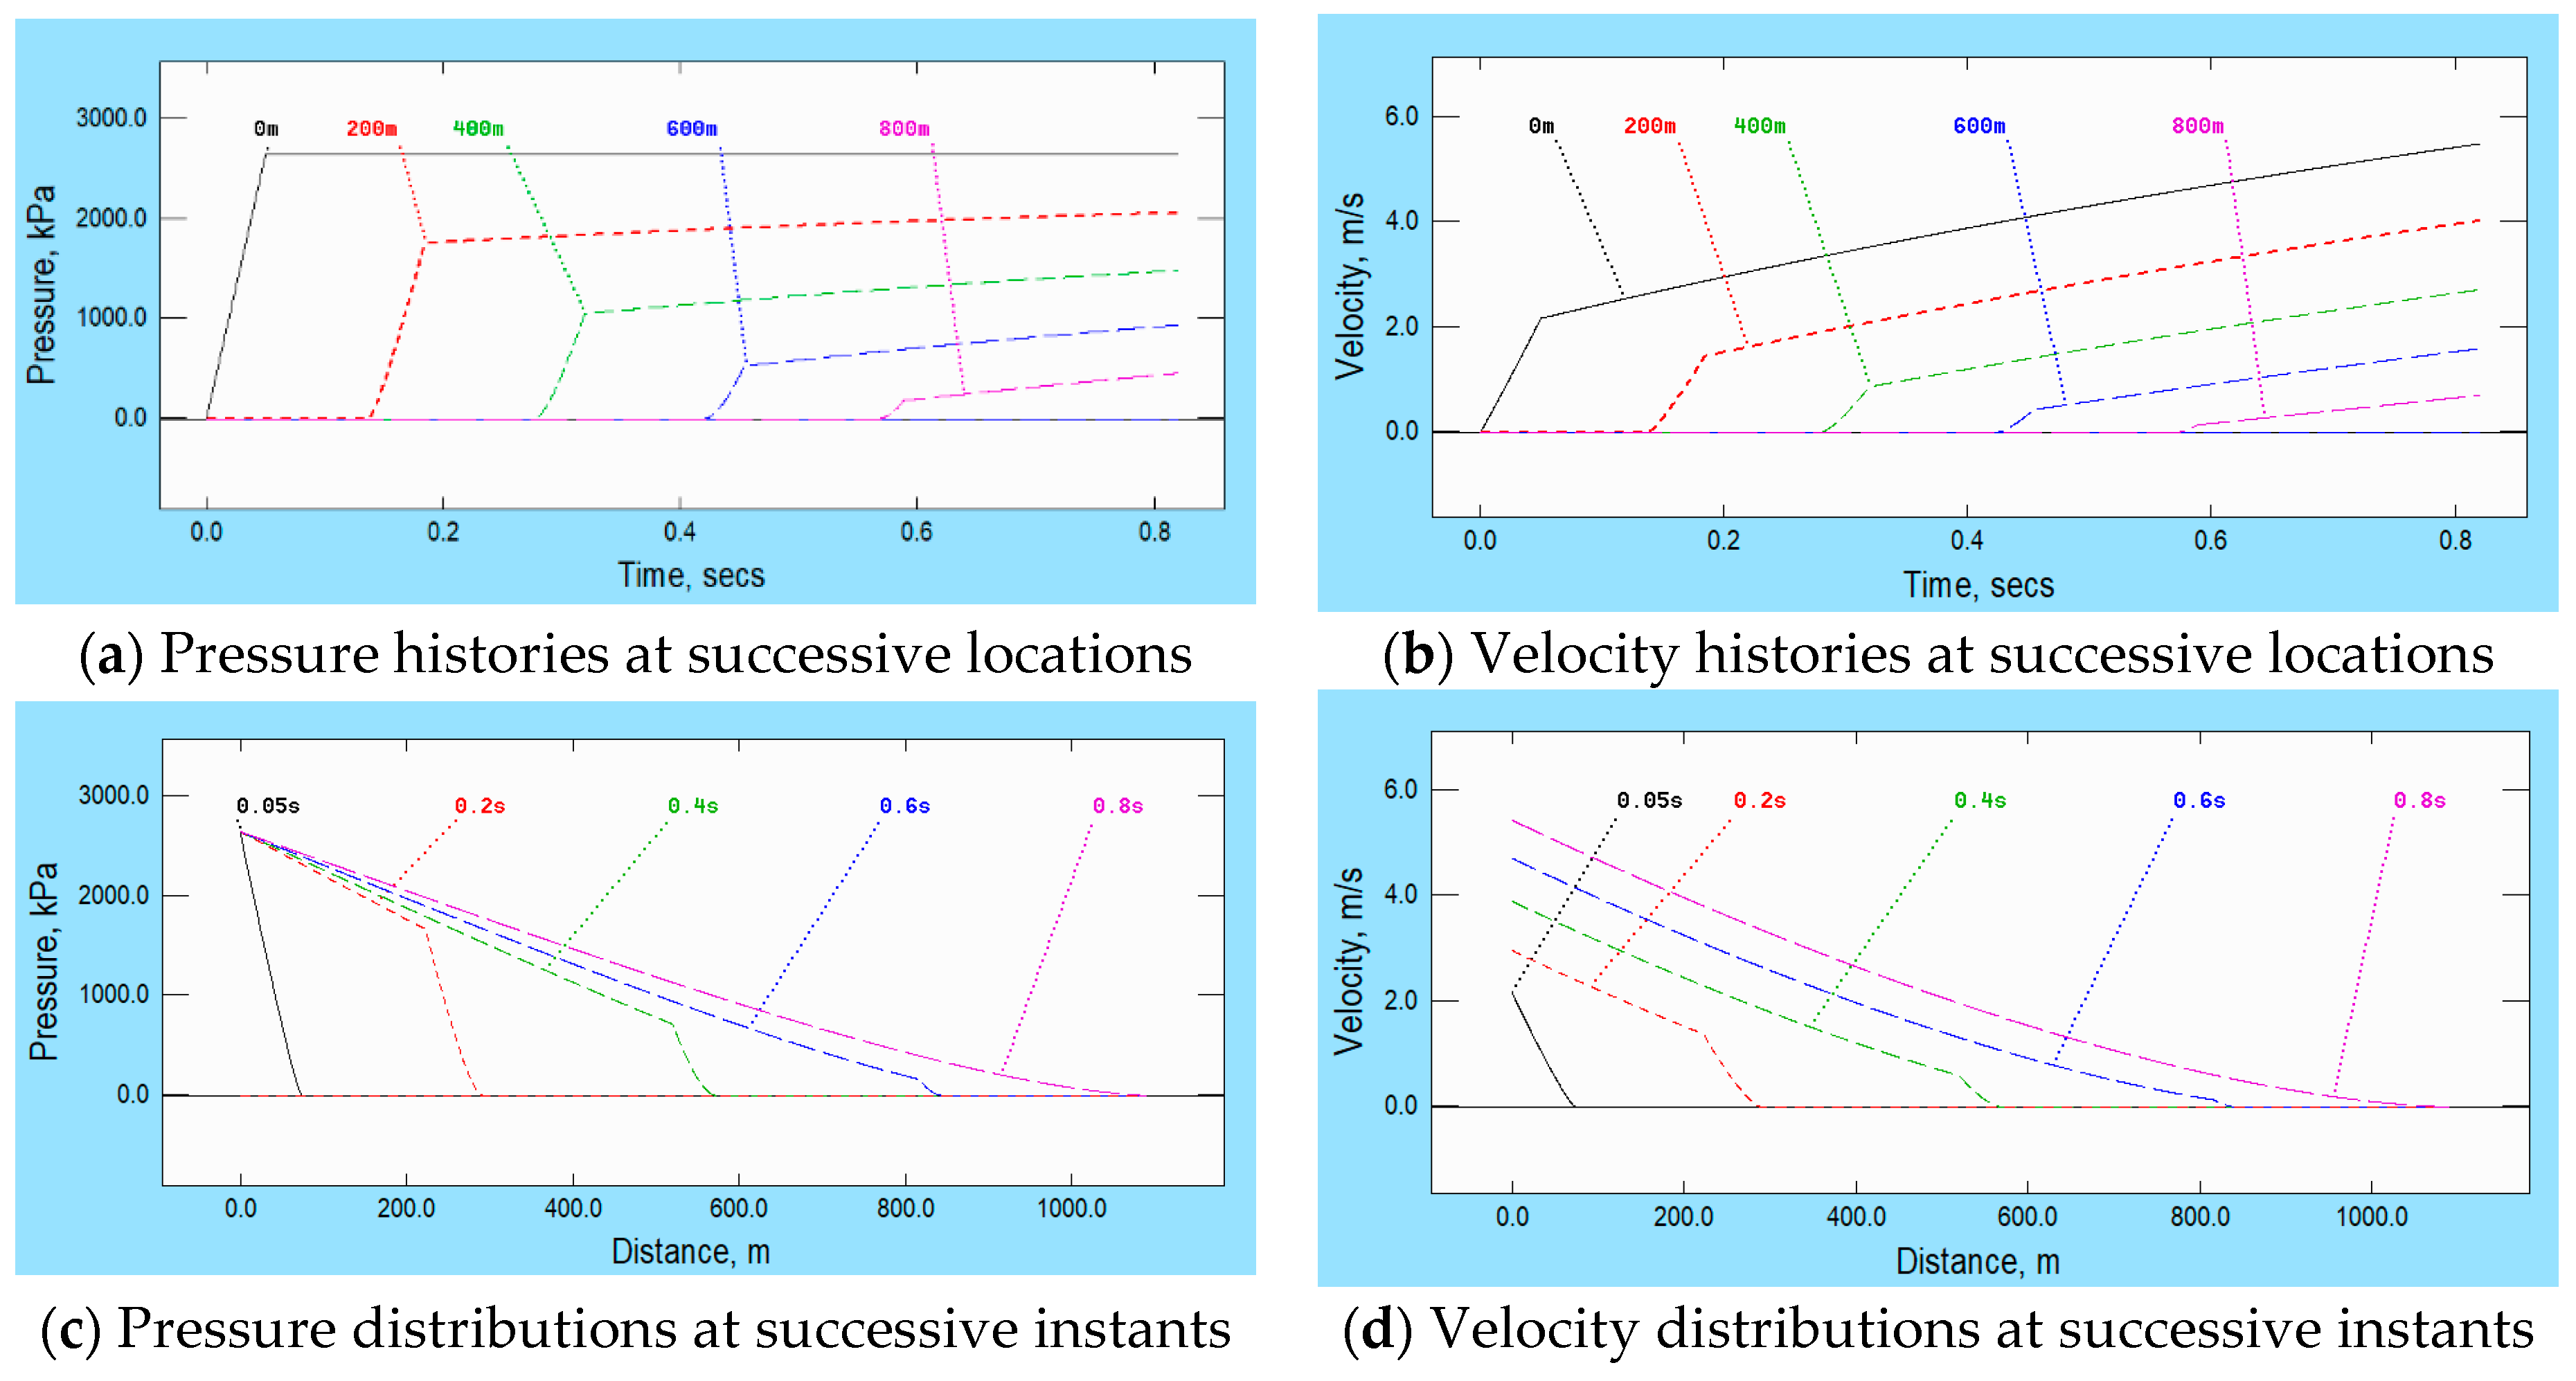
Figure 2 shows pressure and velocity distributions along the pipe when the prescribed upstream pressure is identical to that used in the first example. However, some of the pressure difference is needed to overcome skin friction, and this increases as the length of the disturbance increases. Therefore, the pressure difference available for overcoming inertial resistance reduces, resulting in a continual reduction in the amplitude of the leading ramp as it propagates along the pipe. Furthermore, although the magnitude of the pressure at any particular location along the pipe consistently
increases, the magnitude of the corresponding velocity
decreases. Indeed, it does so even at the upstream boundary where the pressure is held constant. This behaviour was studied in depth by Leslie & Tijsseling [
12] and Liou [
13] who provided simple analytical expressions describing the rate of decay of the step’s amplitude with distance together with corresponding expressions for related phenomena. This extended early work by Ludwig & Johnson [
14]; Binnie [
15] and Burnett [
16] that focussed on specific aspects of the topic.
The preceding qualitative description does not, in itself, explain why the pressure distribution along the pipe is not almost linear—as it would be in a steady flow with uniform velocity. The principal reason for this relates to the time taken for waves to travel. As the leading jump moves along the pipe, the length of the region of wall resistance increases and local flow dynamics just behind the jump require its amplitude to decrease. This is true for the velocity as well as for the pressure, and this information has to be transmitted back to the upstream boundary, implying the existence of continuous reflections travelling in the negative x-direction. Each of these waves itself influences the local flow states during its travel and that, in turn, causes further reflections in the positive x-direction, and so on. Thus, the seemingly simple act of relaxing the assumption of inviscid flow leads to complexities that, although qualitatively explicable, could not be deduced in detail by physical reasoning alone. For completeness, it is acknowledged that, although the principal reason for the non-linear shapes of the depicted pressure distributions is as stated above, the detailed shapes will also be influenced by non-linear aspects of skin friction in turbulent flows.
Even the qualitative nature of the particular outcome illustrated in
Figure 2 is valid only for upstream boundary conditions that imply constant pressure after the initial increase. In these cases, after the initial increase, the corresponding velocity at the boundary reduces indefinitely with increasing time. In contrast, if the prescribed boundary condition were an increase in
velocity to a constant value, the corresponding pressure at the boundary would increase indefinitely. More general upstream boundary conditions include a prescribed relationship between pressure and flowrate (e.g., representing a pump or a valve). The consideration of such cases would lead to less simple outcomes, but it would not add meaningfully to the underlying purposes of the present paper. In most of the following examples, the amplitudes of the velocity and pressure at any particular distance behind the leading zone of the disturbance vary continuously, albeit perhaps slowly. That is, although the disturbances have characteristics in common with those in
Figure 1, the disturbances change as they propagate. Furthermore, they would do so even if additional complications arising from their finite amplitudes did not occur.
One particular detail of the graphs merits further attention, namely the fact that the leading ramp does not maintain its original linear form. This is primarily because, for turbulent flows, the quasi-steady resistance varies approximately with the square of the velocity. Very close to the leading tip, the velocity is small and only a small proportion of any available pressure difference is needed to overcome skin friction. Thus, here, the behaviour will resemble the inviscid equivalent quite closely. However, still focussing on conditions close to the leading jump, the required proportion necessarily increases with increasing distance from the tip. To illustrate this numerically, consider the pressure changes needed to induce velocity changes (a) from zero to 0.2 m/s and (b) from 0.2 m/s to 0.4 m/s. The inertial changes in these two cases are identical so the corresponding pressure differences are also identical. However, the increase in U2 for the first step, namely 0.04 m2/s2, is much smaller than that for the second step, namely 0.42 − 0.22 = 0.12 m2/s2. This behaviour persists all the way back to the upstream boundary.
4. Example 3: Tapered Pipe
Although it is rare for water-hammer simulations to be necessary for liquid flows in stiff, tapered pipes, the topic has occasionally attracted interest—e.g., Tarantine & Rouleau [
17], Yoshizawa & Ando [
18] and, more recently, Jarachi et al. [
19]. Tapering is also important in the context of arterial blood flows (Alastruey et al. [
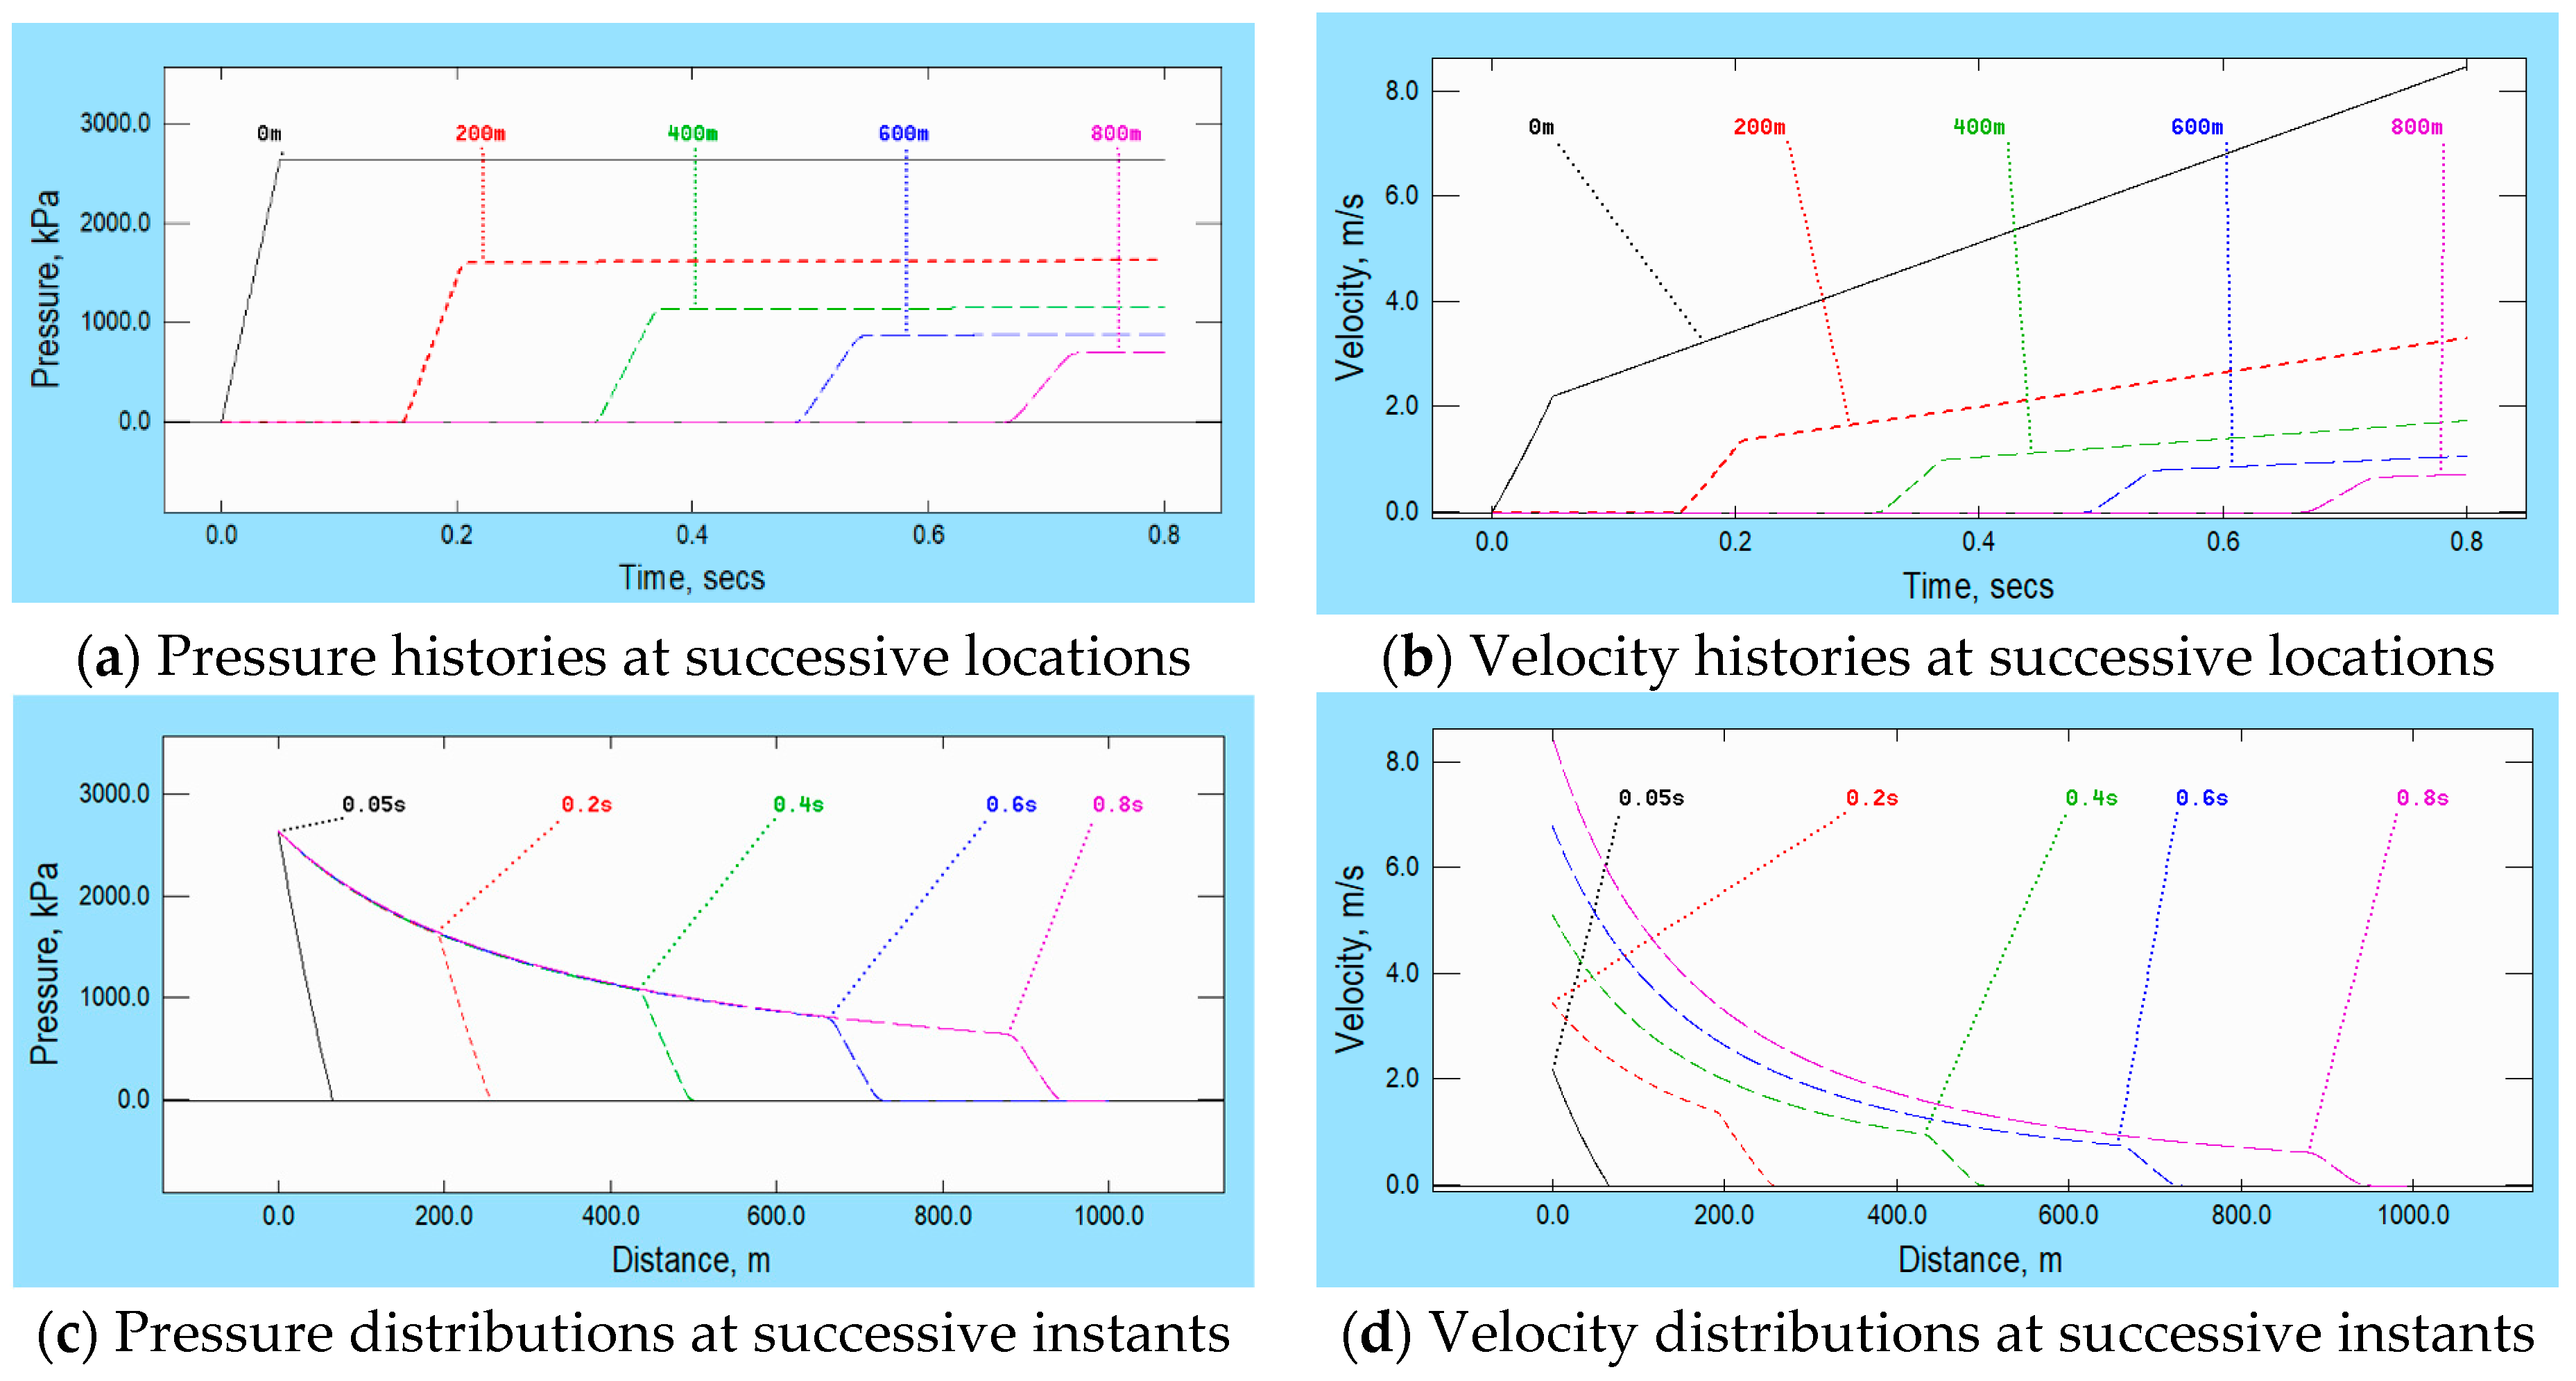
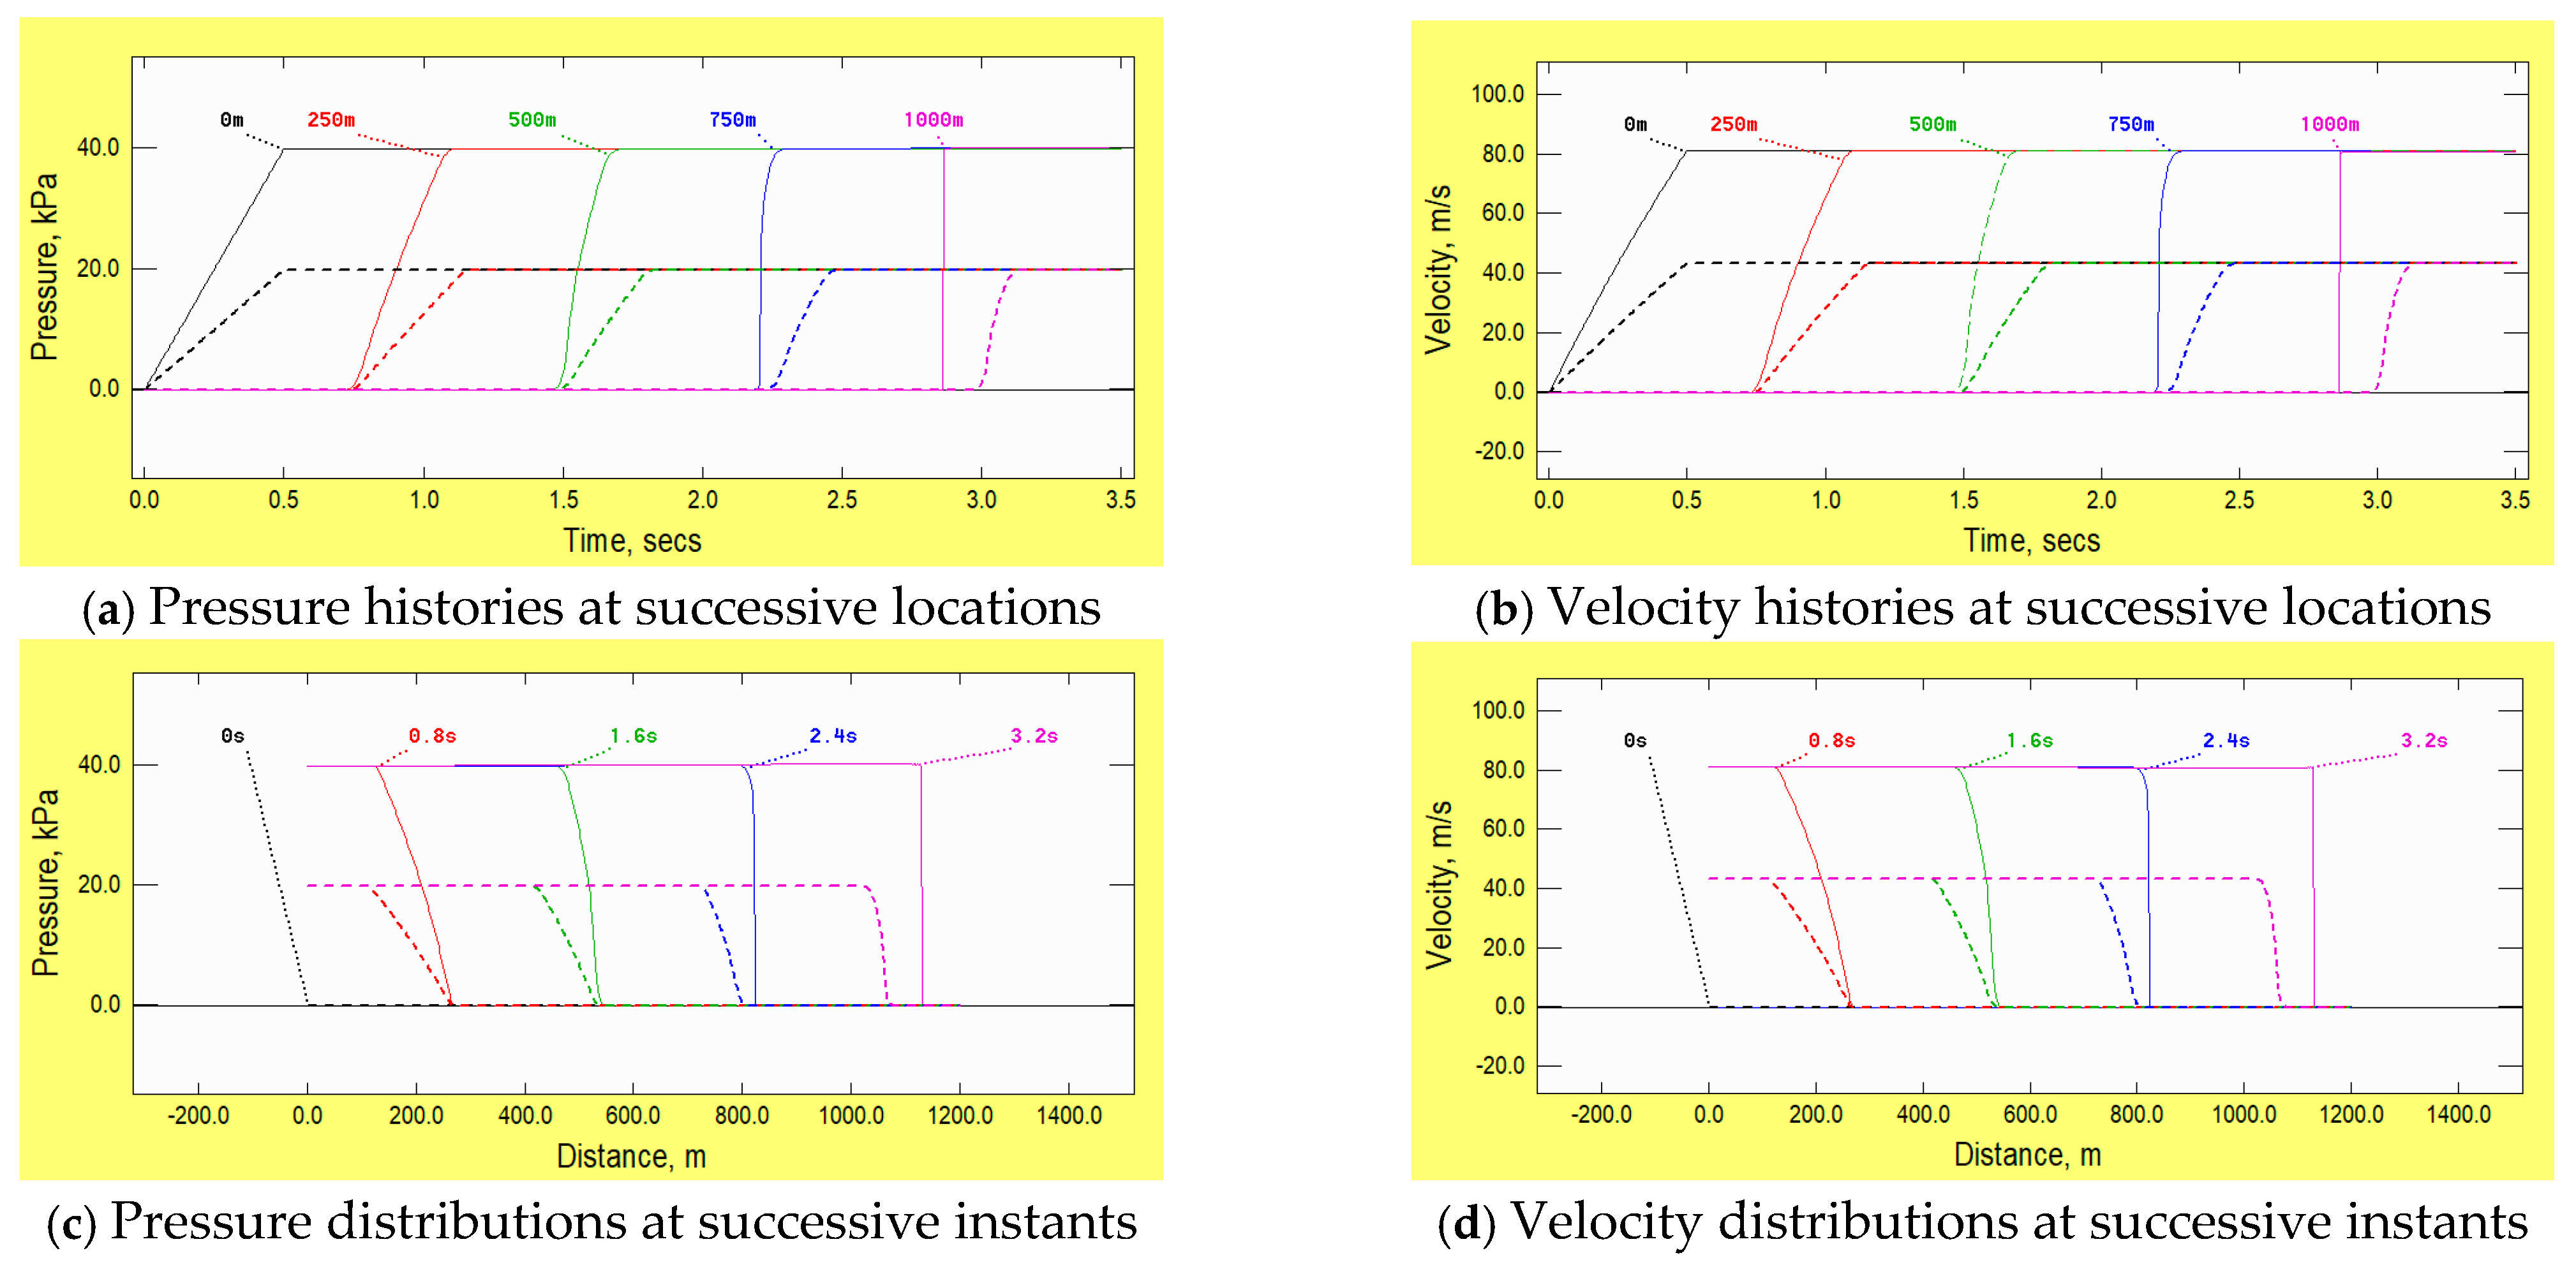
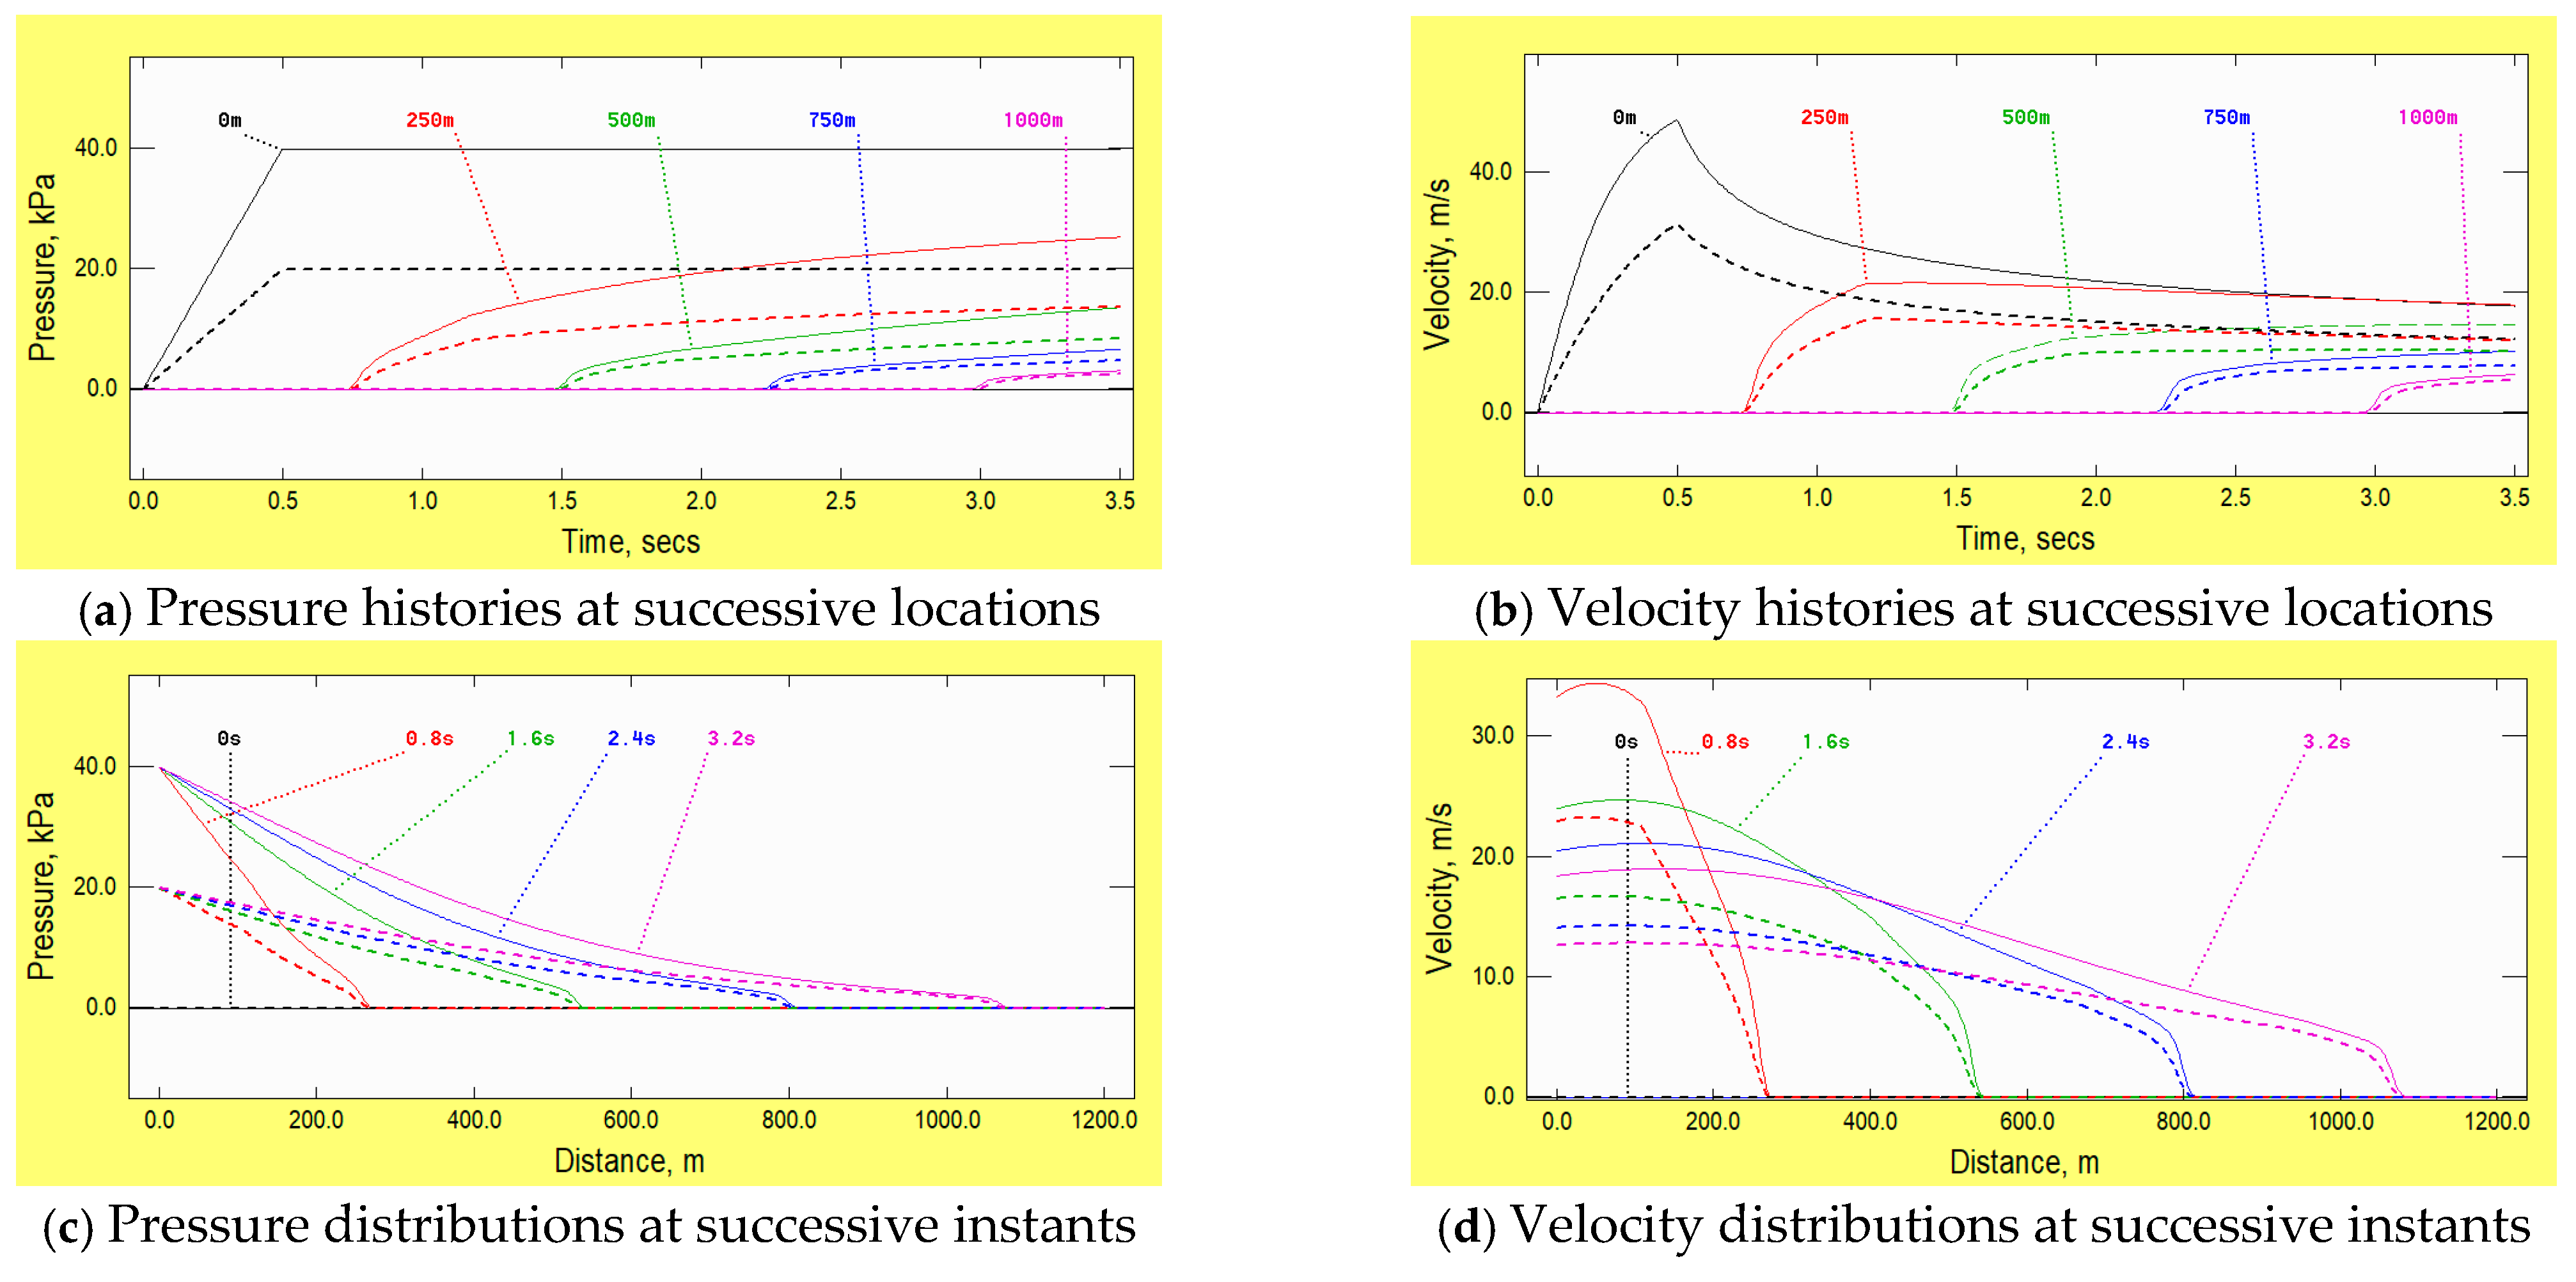
5]). In the third example, the diameter of a 1 km long tapered pipe varies from 100 mm at the upstream boundary to 400 mm at the remote boundary in such a manner that the area varies linearly. The authors do not suggest any practical application for which this geometry would be suitable, but the resulting behaviour is nevertheless informative and is indicative of the influence of tapers. The prescribed pressure history at the upstream boundary is identical to that used in
Figure 1 and inviscid conditions are assumed, thereby enabling the influence of the taper to be inferred unambiguously. Each individual graph of pressure history and distribution in
Figure 3a,c broadly resembles the distributions obtained with quasi-steady friction in a uniform pipe. However, the similarities exist only for the pressures. The trends exhibited in the graphs of velocity are the
opposite of those found in the example with quasi-steady friction. Although the pronounced change in velocity at the front of the disturbance reduces as it propagates, its product with the cross-sectional area—i.e., the volumetric flowrate—nevertheless increases strongly. This information has to be communicated back to the upstream boundary, ‘telling it’ that the prescribed constant pressure can sustain an ever-increasing flow rate and hence an ever-increasing velocity. As a result, the velocity at any particular location along the pipe continually
increases in time, not decreases.
Before moving on to the next topic, it is instructive to consider briefly an alternative variation in area along the pipe, namely a linear increase in
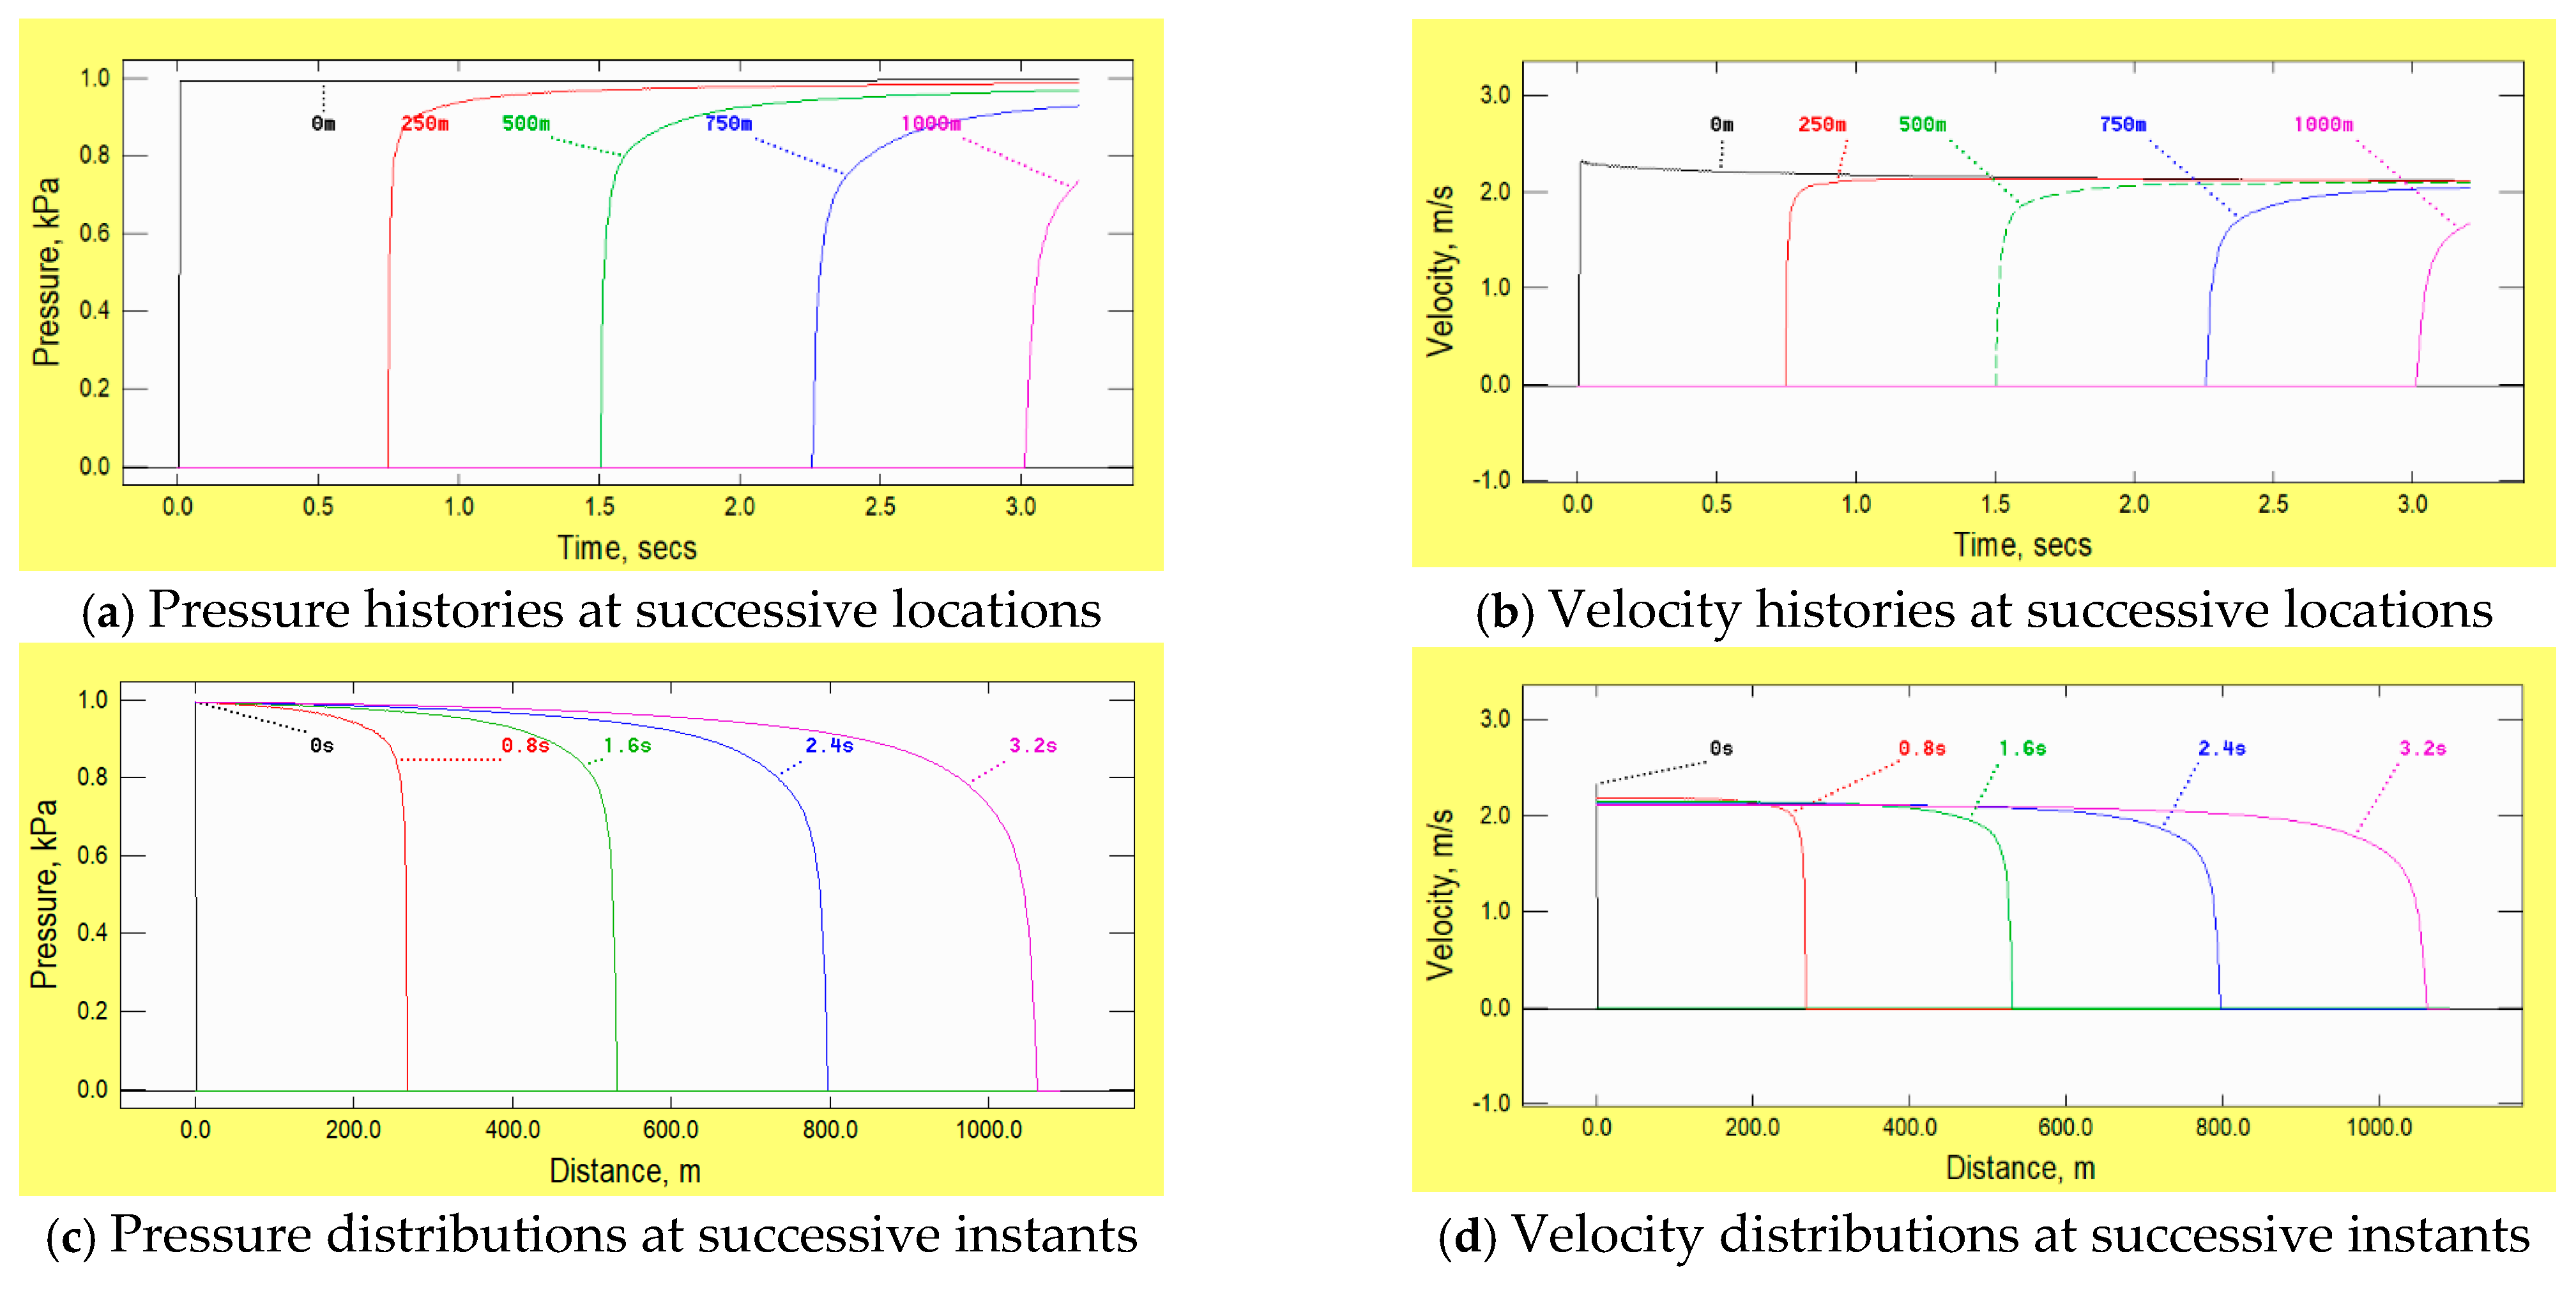
diameter, again from 100 mm to 400 mm. Inevitably, there is a close resemblance between the qualitative behaviours in the two cases (
Figure 3 and
Figure 4). However, at any particular location, the pressure in the linear-diameter case has the striking result of remaining constant after the leading step has passed even though the velocity continues to increase.
Although this might be surprising at first sight, it is actually a special case of a well-known result in a different context, namely the spherical propagation of sound from an isolated point source in an unbounded medium. When a disturbance such as the leading step herein propagates radially outwards, its pressure amplitude varies inversely with the radial distance from the source—see, for instance, Lighthill [
20]. After the disturbance at the origin ceases, no further changes propagate outwards so the radial extent of the zone of unchanging pressures gradually increases—as in the left-hand column of
Figure 4.
5. Example 4: Lateral Mass Flow
Now, the propagation of a disturbance along a leaky pipe is considered (Wylie & Streeter [
2]). The internal diameter of the pipe is 100 mm and its walls are uniformly perforated. The total flow area through them in a 1 km length is equal to twice the cross-sectional area of the pipe. The prescribed pressure history at the upstream boundary is the same as in the preceding examples.
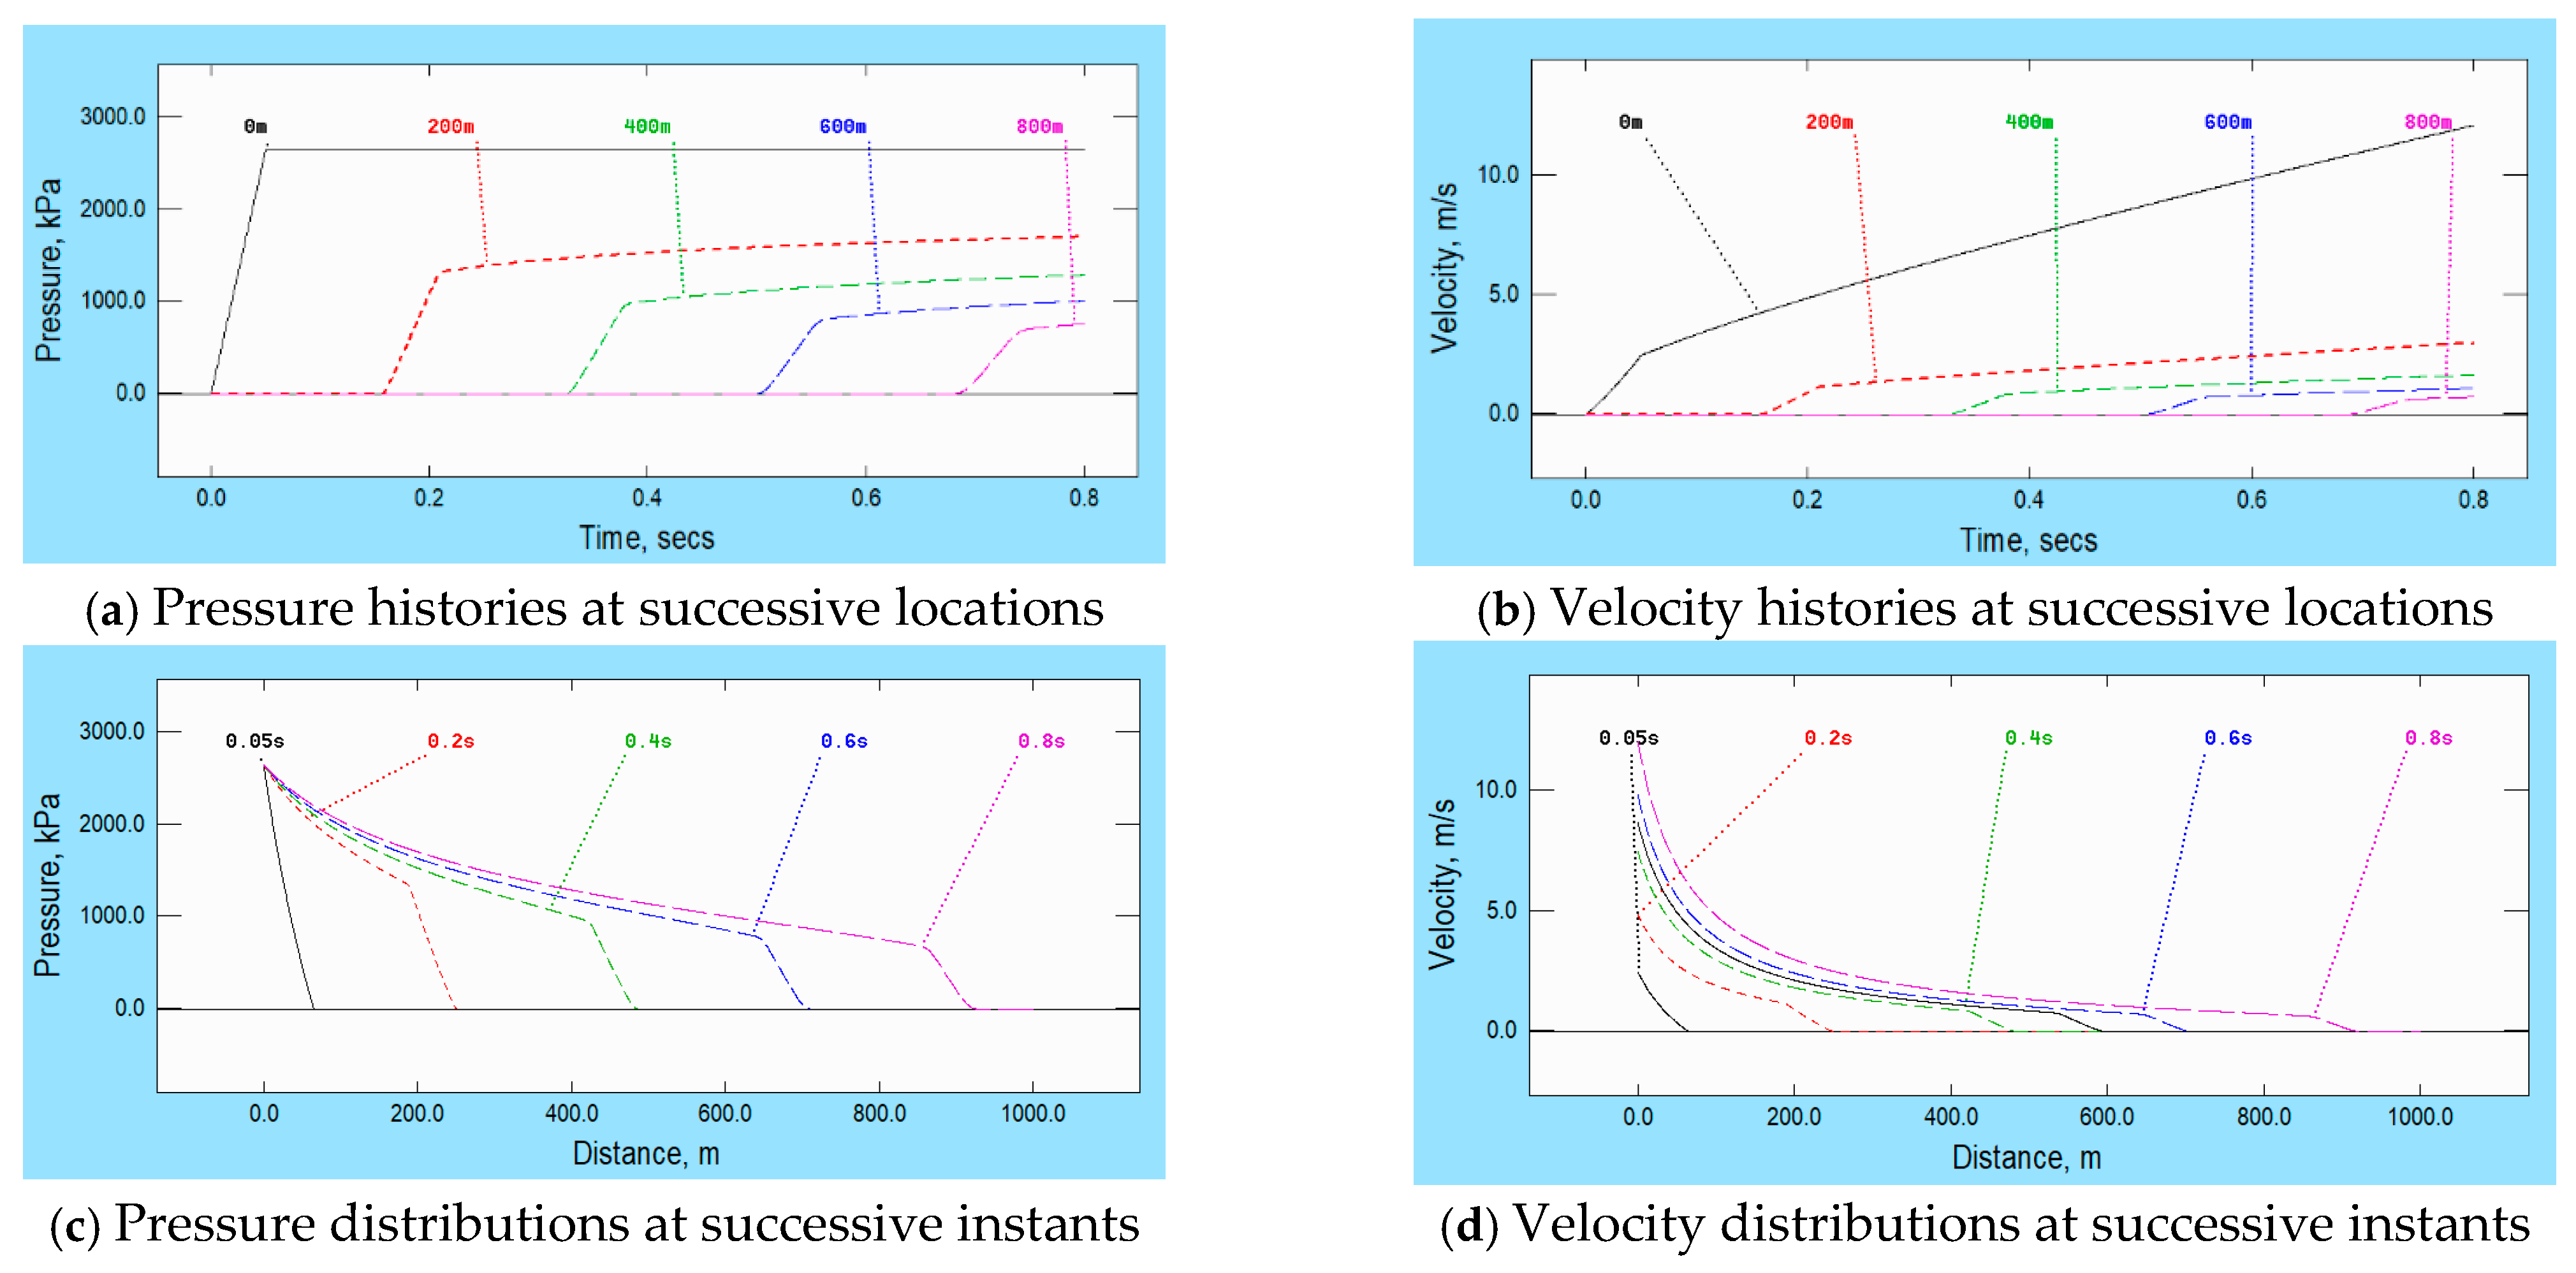
Figure 5 shows that the qualitative features of the pressure and velocity histories and distributions are similar to that obtained above for tapered pipes. However, in stark contrast with those cases, the continual reduction in velocity in the leading zone in this instance is associated with ever-
reducing flow rates. This is necessarily accompanied by a continual reduction in the associated pressure change and, as this information is received at the upstream boundary, the rate of flow into the pipe at that boundary increases.
The loose, qualitative resemblance of the behaviours in the tapered pipe and leaky pipe cases would be even more pronounced if the leakage area were reduced by, say, a half. However, the use of the larger area has the advantage of highlighting a particular characteristic that is of special relevance in the present context, namely the vanishing amplitude of the leading step at larger times. Further reference is made to this later, when attempting to provide a realistic definition of a wavefront.
6. Example 5: Fluid–Structure Interaction
In all the above examples, account is taken of the influence of the pipe’s radial flexibility on the fluid wavespeed along the pipe. However, no account is taken of consequential axial responses in the pipe wall. Instead, the direct influence of the radial flexibility (albeit not also its radial inertia) is treated in a conventional manner that utilises an effective bulk modulus. That is, the pipe is treated as infinitely rigid and the bulk modulus of the fluid is reduced to mimic the influence of the radial flexibility. The adjustment ensures that the resulting speed of sound in the imaginary fluid in a rigid pipe is a good approximation to the speed of propagation of small disturbances in the true fluid in the true pipe.
Although this adjustment is adequate for most engineering purposes, the neglecting of axial disturbances in the pipe wall itself makes the analysis unsuitable for applications in which such disturbances play a significant role. Reviews of papers that allow for the effect are given by Li et al. [
21] and Ferras et al. [
9]. Notable examples include pipework that has little axial restraint, especially when the disturbances are structure-induced, not fluid-induced. In suspended pipework, for instance, pressure forces caused by the rapid closure of a valve can cause the valve itself to move. This causes axial stress waves in the pipe wall and, when either type of wave reaches a bend or junction elsewhere along the pipe, it triggers new disturbances. In general, these can include bending and shear waves as well as axial waves, but attention herein is on single, straight pipes, so only axial waves are considered. This coupling behaviour is known as junction coupling. In most engineering applications, waves in solids travel faster than those in fluids so they can be tracked independently. Importantly, in most engineering applications, notably with flows in metal pipes, these stress waves propagate much faster than the corresponding waves in the fluid itself.
In practice, waves travelling along the pipe in one medium (e.g., the wall) will be detectable in the other medium (i.e., the fluid). For example, stress waves propagating axially in a pipe wall cause circumferential strain as well as axial strain—because of the Poisson ratio effect. The resulting changes in the cross-sectional area of the pipe cause changes in fluid pressure. Likewise, pressure waves in the fluid induce circumferential strains in the pipe wall and the associated axial strains influence axial stress waves in the wall. This behaviour is known as Poisson coupling.
Poisson coupling is usually much smaller than junction coupling, and it is commonly neglected in analyses. That is, stress waves and pressure waves are assumed to propagate between boundaries independently, regardless of whether account is taken of interactions at boundaries. However, Poisson coupling is allowed for in the example shown in
Figure 6. Indeed, to highlight the effect clearly, its importance is intentionally exaggerated in this example. Firstly, the chosen ratio of the pipe wall thickness and internal diameter, namely 1/50, is smaller than would be likely in practical applications in which water-hammer is expected. Secondly, in contrast with the ramp-like pressure changes considered in the preceding examples, the prescribed pressure increase at the upstream boundary is effectively instantaneous.
Axial motion of the pipe wall at the upstream boundary is prevented and, as a consequence, the circumferential strain caused by the increased pressure causes a small, tensile, axial stress wave in the pipe wall. This propagates along the pipe ahead of the main pressure change and, as described above, it will be accompanied by a small increase in pressure also travelling at the speed of the stress wave. However, this change is so small that it cannot be seen directly in the figure. Nevertheless, its reflection from the closed end of the pipe can be seen easily—e.g., at approximately 0.38 s in the pressure history at 800 m and approximately 0.52 s at 600 m. This illustrates the earlier statement that structure-induced changes can be significantly stronger than fluid-induced ones. In this particular case, when the small tensile wave reaches the closed end, it pulls the end back upstream, thereby inducing a compression wave in the fluid.
The influence of Poisson coupling is barely visible in this
Figure 6, but it is seen easily in
Figure 7, which focusses on the periods shortly before and after the reflections of the first stress wave and the first pressure wave at the closed end. The left-hand box shows pressure histories at five locations approximately 100 m upstream of the end. The points labelled A–F are associated with the following events:
- A.
The tensile stress wave shortly before it reaches the closed end;
- B.
A smaller, compressive stress wave reflected from the end;
- C.
A strong compressive pressure wave induced simultaneously with ‘B’;
- D.
A small compressive stress wave initiated when ‘B’ reflected at the upstream end;
- E.
A smaller, tensile stress wave reflected from the closed end;
- F.
A rarefaction pressure wave initiated simultaneously with ‘E’.
The events A, B, D and E illustrate Poisson coupling and the events C and F illustrate junction coupling.
The right-hand box shows corresponding pressure histories during the subsequent reflection of the initial pressure wave at the closed end. The approaching wave passes the chosen locations shown in the graphs during approximately 0.76 s to 0.80 s. When it reaches the end, it forces the pipe to move in the positive x-direction, thereby causing a tensile stress wave to travel back upstream. This passes the graph locations at approximately 0.85 s and is seen in the pressure traces because of Poisson coupling. The primary reflected pressure wave passes during approximately 0.88 s to 0.92 s. The different durations of the stress wave and pressure wave events are caused only by the different speeds of propagation, as also are the relative timings of the events.
Part 2: Gas Flows
In all of the above examples, the fluid is a liquid and, for most purposes, its behaviour can be described with good accuracy without considering its compressibility, except when calculating the speed of sound. However, as illustrated by Zhao et al. [
22] in the context of leak detection, this simplification is not acceptable when analysing pressure waves in gas pipelines. In each example in the remainder of the paper, the fluid is a gas which, for simplicity, is deemed to have the properties of air. In particular, it satisfies an equation of state, namely
where
p is pressure,
ρ is density,
R = 287 J/(kg.K) is the specific gas constant and
T is the absolute temperature. Thus, whereas the density of the liquid in the above examples was deemed to be a constant (except for its influence on the speed of sound), the gas density depends upon both the pressure and the temperature. This has a marked influence in all but one of the following examples. Likewise, the speed of sound satisfies
where
γ = 1.401 is the ratio of the principal specific heats of dry air. No allowance is made for pipe flexibility because its influence is usually tiny in comparison with gas compressibility.
7. Example 6: Mach Number
First, consider the influence of the magnitude of the prescribed pressure change and, consequently, of the induced velocity and Mach number.
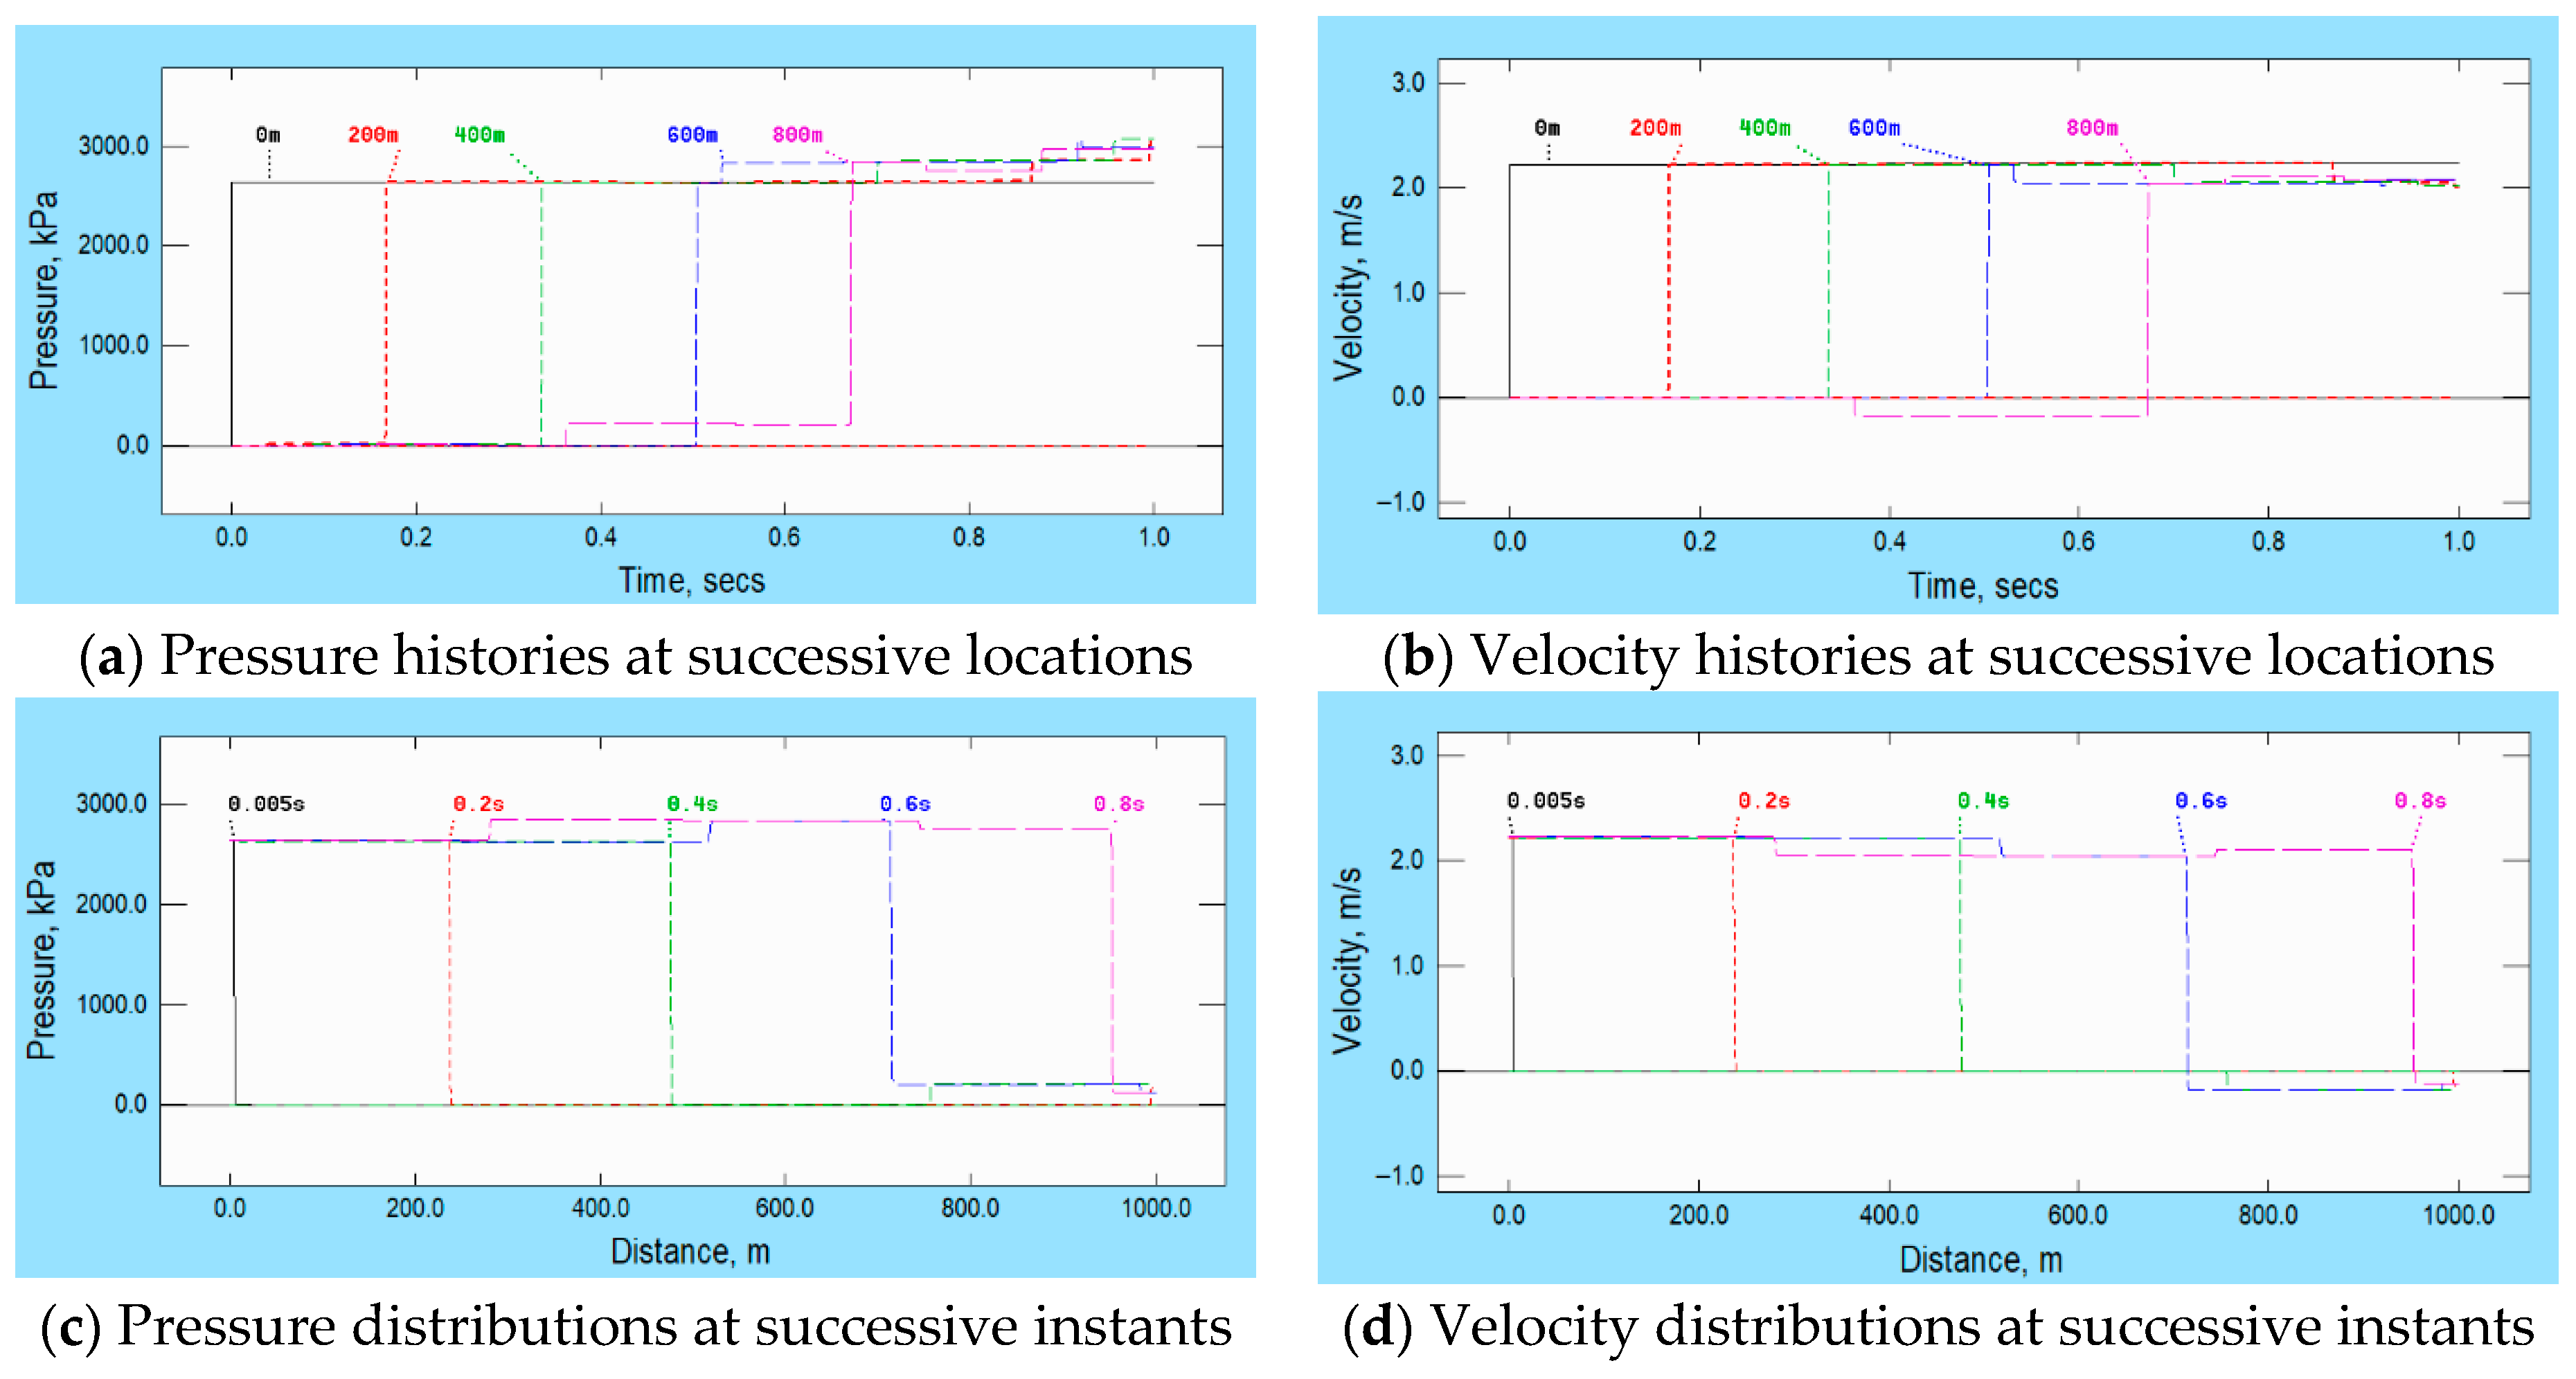
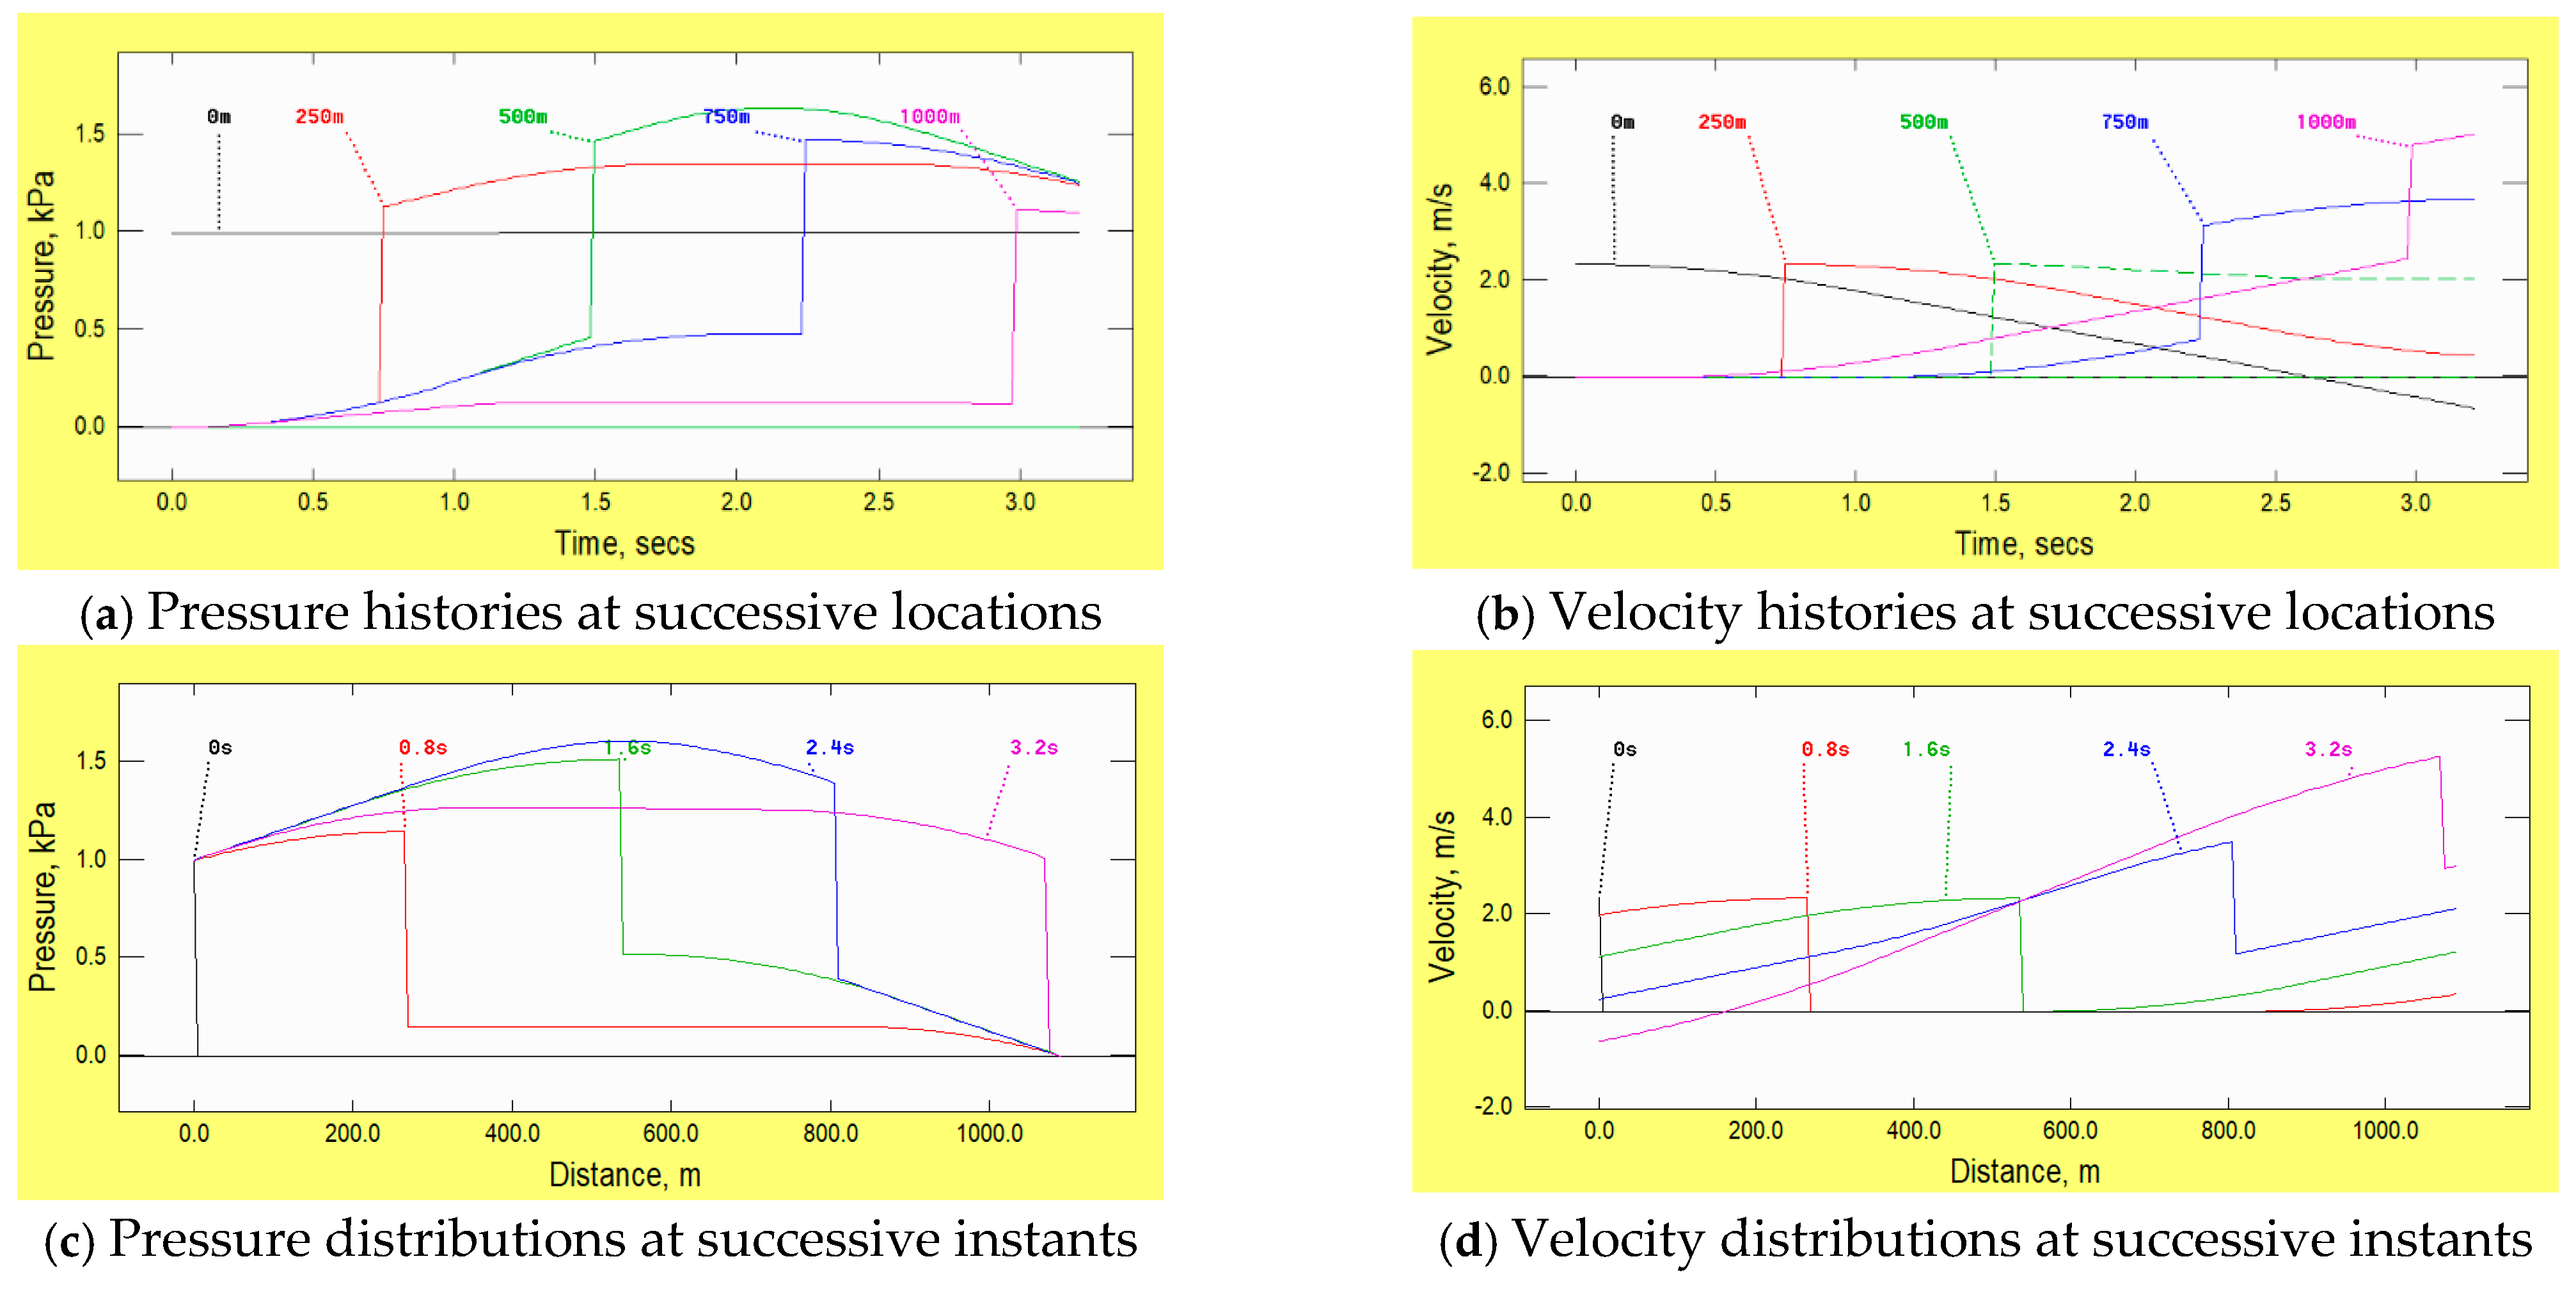
Figure 8 shows two independent cases with different magnitudes of the prescribed change in the upstream pressure. In both cases, external complications such as skin friction and heat transfer are absent and so, in common with the example given in
Figure 1 for wave propagation in a liquid, the maximum pressures do not vary during propagation. However, the steepening process referred to in the closing paragraph of
Section 2 can now be seen clearly. Along the leading ramp, both the velocity
U and the speed of sound
c increase with pressure. Therefore, so does the wavespeed relative to the pipe, namely d
x/d
t =
U +
c, where
x and
t are the distance and time coordinates. In the example with larger pressures, d
x/d
t ranges from approximately 340 m/s at the tip to approximately 429 m/s at the maximum pressure. That is, the heel of the ramp travels approximately 89 m/s faster than the toe. The initial length of the ramp is approximately 170 m, so the heel should catch the toe after approximately 2 s, thereby creating a normal shock. Thereafter, the shock should propagate as a step change travelling at approximately 380 m/s. This process is not reproduced exactly in the figure because the numerical algorithms in the software package used for all examples in this paper do not include shock-capturing capabilities. Nevertheless, by the time that the ramp has reached 1000 m, it is almost a step and it is travelling at approximately the correct speed. The steepening process for the smaller-amplitude wave is similar, but the simulation ends before the time required for it to evolve into a shock (approximately 4 s). This phenomenon is of special interest in shock tube applications, but as demonstrated by pressure measurements reported by Herb et al. [
7], it can also be important in some large-scale infrastructure.
In passing, it is worth noting that the failure of the software to predict the steepening process exactly is attributable primarily to the use of a fixed numerical grid. The spatial grid size ∆x remains constant throughout the simulation, and, although the time step ∆t is chosen independently at the beginning of each time step, the same value is used at all locations. Physically, at any particular (x,t), the local disturbance propagates at dx/dt = U + c, where U and c are the local velocity and the speed of sound (in a stationary, unconfined fluid). Both of these vary along the ramp so the distances travelled during fixed intervals also vary, causing the overall shape of the ramp to change during propagation. An approximate allowance is made for this by choosing the time step at each instant so that ∆x/∆t is equal to the mean of the maximum and minimum values of (U + c) in the previous time step. Inevitably, this causes the tip of the disturbance to travel too rapidly and the heel to travel too slowly, but it enables the general behaviour to be seen and it is a close approximation to the true behaviour after the ramp has become a step. Alternative 1D methods of analysis based on, say, control volume or finite element methods can reduce this effect, but have other downsides such as non-physical oscillations that require specialised numerical counter-measures. Two- and three-dimensional methods can be much less sensitive to this problem, but they, too, can cause numerical oscillations and they require far greater computing resources.
8. Example 7: Unsteady Friction
In
Section 3, the influence of skin friction was illustrated, but, to provide a clear focus, consideration was restricted to a quasi-steady representation thereof. That is, although the simulated skin friction forces depended on the flow velocity, they did not depend upon acceleration or higher derivatives of velocity. Its influence is represented by a convolution-integral model of the generic type first proposed by Zielke [
23]. Convolution-based models (usually designated ‘CVB’) are widely recognized as being more accurate than instant-acceleration-based models (IAB) that do not take explicit account of historical influences of previous flow changes, but the former typically require more complex coding and, until recently, have required significantly greater CPU resources. Strong recent advances made towards overcoming these drawbacks are exemplified by Urbanowicz et al. [
24] who, in addition to greatly increasing efficiency, give an excellent, concise account of key work on this topic.
By inspection, the consequences of the unsteady contribution differ from those of the quasi-steady contribution. They are strongest in regions where the greatest rates of change of acceleration occur, namely near the toe and heel of the leading ramp. As time progresses, the cumulative effect is to reduce the greatest rates of change and, simultaneously, to extend the duration of the period when the influence of the phenomenon is observed. This type of behaviour is commonly seen in measured pressure histories in water-hammer-like flows, especially in laminar flows (e.g., Zielke [
23]), but also in turbulent flows. However, it is less commonly commented upon. Indeed, in the authors’ experience, it is often overlooked by authors claiming ‘good’ agreement with measured pressure histories even if their theoretical predictions do not show the effect. Attention is drawn to this because measured pressure histories are often made close to boundaries such as valves, and pressure histories during the reflections of waves at such boundaries can be strongly influenced by their detailed shapes. [
Example: The initiating disturbance in Figure 9 is a ramp change in pressure in 0.5 s followed by constant pressure. The simulated speed of sound is approximately 340 m/s, so the length of the linear region is approximately 170 m. If such a disturbance were to reflect at a boundary, any measuring device within 85 m of the boundary would detect the tip of the reflection before the arrival of the heel of the ramp.]
9. Example 8: Heated Pipe
In gas flows, changes in pressure are usually accompanied by changes in density and temperature. This leads to temperature differences between the gas and the duct that induce heat transfers that further complicate the behaviour. Banister [
25] pays special attention to heat transfers that arise passively from pressure change due to friction, but points out that greater effects are to be expected when heat transfers are imposed actively.
Figure 10 illustrates a disturbance propagating along a duct that is actively heated at a uniform rate along its whole length. At first sight, the figure appears to be rather complicated, so it is useful to begin the discussion by considering the influence of heat in the absence of the disturbance. If both ends of the duct were closed, the consequential increases in temperature would cause the pressure to increase uniformly along its length. In contrast, if its ends were open, gas would flow out of them and the pressure would decrease from a maximum at mid-pipe-length to a minimum at the ends. The wave propagation seen in the figure superimposes on this background effect.
The chosen initial condition is zero flow, uniform pressure and uniform temperature. Thereafter, the prescribed pressure at the end x = 0 is held constant at an increased value and the rate of heat transfer to the gas is uniform and constant. As the abrupt change in pressure propagates along the duct, it superimposes on the background effect described above. Its magnitude varies slightly because of the influence of the heat on the overall pressure distribution, but its propagation along the duct is qualitatively similar to that in other examples above. The same is not true, however, for the velocity. The initial step change at the prescribed-pressure boundary is essentially the same as if there were no heat. In contrast, the subsequent history is affected strongly by the outflow influence of the heat as well as by the inflow influence of the prescribed pressure. Initially, the latter dominates, but the former gradually increases in importance and eventually causes the direction of flow at x = 0 to reverse. In contrast, throughout the period illustrated, the conditions at the other end of the duct are uninfluenced by the imposed pressure-disturbance. The pressure at that end remains constant and the velocity continually increases. Later, the pressure-induced disturbance will cause additional outflow through this boundary.
10. Example 9: Duct with Chambers
In the example discussed in
Section 4 (
Figure 5), flow could pass through holes in the pipe wall. This is again the case in the present example, but in this instance, the holes are small orifices leading to enclosed chambers distributed axially along the duct. To trigger a strong effect in a short length of duct, the total volume of the chambers is equivalent to 12% of the duct volume. The prescribed pressure history at the upstream boundary is shown as a continuous, black line in the upper-left box in
Figure 11. Although the chambers are quite large, the mass of fluid that can enter them from the pipe is small because it is determined solely by the increase in density that the inflow induces. This, in turn, is determined by the maximum possible increase in pressure inside the chambers. In this example, the geometry of the openings is chosen to ensure that the chambers behave in a slightly over-damped manner, thereby avoiding oscillatory behaviour typical of Helmholtz chambers. As a consequence, the maximum increase in pressure inside any chamber is the same as that in the wave propagating along the duct.
Although, in this example, chambers exist along the whole length of the duct, the length in which their influence is strong is quite short. This is because chambers at successively increased distances behind the leading parts of the disturbance have been exposed to elevated tunnel pressures for successively greater times. As a consequence, their internal pressures have become increasingly close to the maximum imposed pressure and their ability to accept further increases in mass has reduced accordingly. This characteristic behaviour has been recognised for many years (e.g., Vardy & Brown [
26]). A potential practical application of it is given by Liu et al. [
27].
The evolution of the disturbance as it propagates along the duct has some features in common with those caused by unsteady components of skin friction (
Figure 9). In both cases, the influence is strongest in the leading parts of the disturbance and decays asymptotically to zero with increasing distance behind that region. This is to be expected because they are driven by
rates of change of pressure and velocity, not by quasi-steady phenomena. Also in both cases, the phenomenon under consideration is dispersive, although the causes of this are different. In the case of unsteady friction, the difference from ideal behaviour is caused by forces that influence momentum, but not mass-continuity. In the present example, however, it is caused by leakage from the main duct into the chambers, so it influences mass-continuity as well as momentum. In common with all other examples herein, the pressure and velocity histories after the localised regions of relatively abrupt change are particular to the prescribed upstream pressure history. However, the spatial extent of the region that is strongly influenced by unsteady friction will normally be much shorter than that which depends strongly on arrays of chambers.
11. Example 10: Mach Number and Quasi-Steady Friction
As far as is practicable, each of the above examples illustrates the influence of a single variation from an ideal condition. This is helpful for the purposes of illustrating the different behaviours, but it masks the consequences of interactions between multiple influences that are present simultaneously. Such consequences are illustrated in this final example, in which both the Mach number and quasi-steady skin friction exert significant influence (
Figure 12). The only prescribed difference from the example shown in
Figure 8 is the existence of skin friction, but the outcomes of the two cases are very different. Firstly, the magnitude of the disturbance reduces strongly as it propagates—for reasons given in the above discussion of the quasi-steady friction simulation for a liquid flow (
Figure 2). The decay in the present case is much stronger, but this is to be expected with the larger velocities associated with the higher Mach number.
A feature that might be less expected (at least, it surprised the authors) is the gradual convergence of the conditions in the two cases in the leading parts of the disturbance. This is seen especially clearly in the graphs of velocity. If the corresponding example based on inviscid flow had not been undertaken previously, it would have been difficult to infer the causes of the convergence.
Although the physical behaviour observed in this example is of interest in its own right, the more general deduction is that interactions between independent influences can cause effects that are as strong as the individual influences themselves. Nevertheless, the overall outcome—namely a disturbance that decays as it propagates—is of the same general nature as several of the examples given above, in which only one parameter had a strong influence on the nature of the propagating disturbance.
12. Other Phenomena
Although the above examples examine wavefront propagation in a wide variety of contexts, the list is far from exhaustive. Other phenomena that can influence the propagation include, for instance, cavitation in liquids (Bergant et al. [
28]), visco-elastic pipes, elevation, non-uniform fluid properties, condensation and evaporation. Each such case has its own specific characteristics that influence how disturbances evolve during propagation, but it will be common for their leading zones to have similar qualitative forms to those presented above.
As indicated in the opening paragraph of
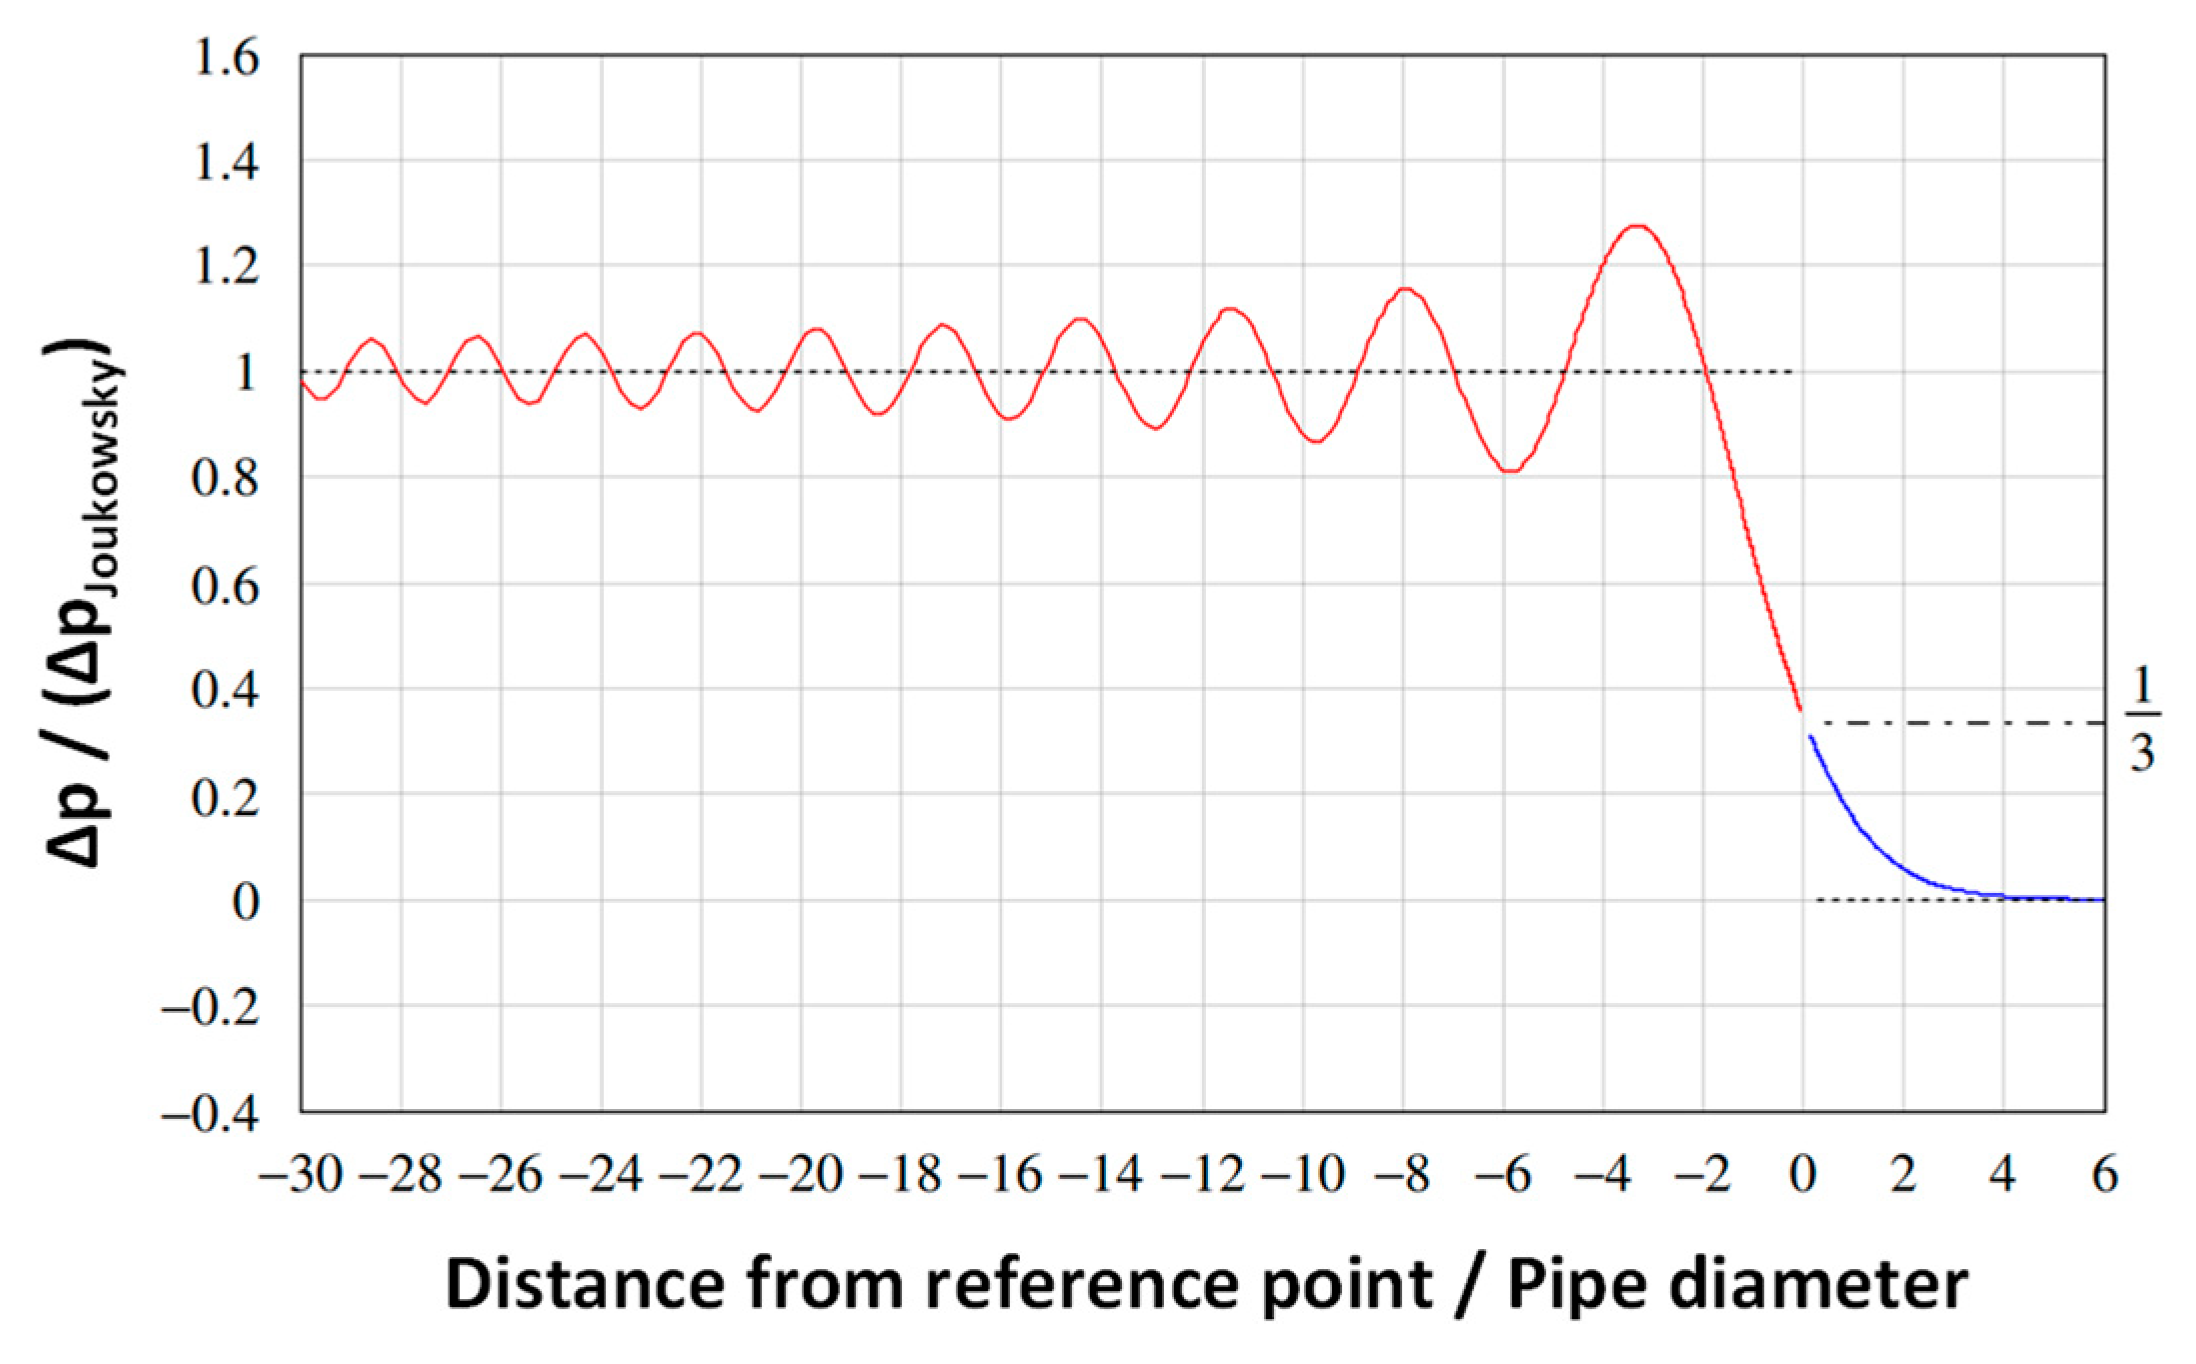
Section 6, the influence of radial inertia is neglected in the subsequent discussion. In practice, inertial influences can cause trailing oscillations of wavefronts as illustrated in
Figure 13 (Tijsseling et al. [
29]) and can lead to dynamic safety factors up to four (Beltman et al. [
30]). The first are theoretical (never observed) and the second have led to provocative discussion (Leishear [
31]).
13. Possible Definitions of ‘Wavefront’
A common characteristic of all the disturbances considered above is that their leading parts propagate in a wave-like manner, albeit often with significant dispersion. In most cases, the extents of their ever-increasing zones of influence are clearly visible in the graphs. That is, the loci of their leading tips are well defined, at least during the early stages of propagation. In some cases, however, the magnitude of the leading part of the disturbance gradually decays so much that the remaining behaviour no longer merits description by a term implying the existence of a defined ‘front’. The following discussion applies only before such conditions are reached.
In the case of Example 1, the magnitude of the disturbance never changes. Also, the rate of change of pressure in the leading ramp increases so slowly that it is not distinguishable in
Figure 1. In the corresponding case for a gas (Example 6), it is again true that the
magnitude does not change, but, in this case, the leading part steepens and has almost become a normal shock in the period simulated. In both cases, it is natural for attention to focus primarily on the evolution of the short ramp-like region even though the length of the region in which flow has changed grows continually. Of course, this is a special case that exists only in idealised simulations that neglect physical influences such as friction and heat transfer. In all cases encountered in conventional practical applications, such influences do exist and changes typically occur continuously along the whole of the region behind the leading part of the disturbance. Nevertheless, any proposed general interpretation of the word ‘wavefront’ will need to be applicable to Examples 1 and 6, as well as to more general cases, so the definition will need to focus on the leading region.
Another aspect of these two examples that is specific to the idealised inviscid constraint is the one-to-one correspondence between the pressure and velocity histories. In more general cases, if the pressure at the boundary is held constant after the initial rise, the velocity at that location will vary in response to whatever happens along the pipe. Such behaviour is seen in all of the other examples above. Likewise, if the velocity were held constant, the pressure would inevitably vary. This distinction is implicitly recognised in the literature insofar as discussion is almost always of pressure waves or wavefronts, not of velocity or flow waves or wavefronts. One reason for focussing on pressure instead of flow for this purpose is that it is usually much easier to obtain good measurements of pressures than of flows. Another reason is that maximum and minimum pressures determine the required pipe strength/class. Nevertheless, a comparison of Examples 3 and 4 (non-uniform area and leaky pipes) demonstrates unequivocally that a knowledge of the pressure history is far from sufficient for inferring flow histories unless adequate supplementary information is also available.
Notwithstanding this potential deficiency, it would be impracticable to require a generic terminology to be dependent on the availability of detailed information of both pressure and flow. Accordingly, the following summary follows the usual practice of describing only pressures. With this proviso, the generic features of disturbances that can be classified as wavefronts are provisionally summarised as:
The overall shape of the pressure distribution at any instant comprises a leading zone of relatively rapidly varied pressure followed by a longer period of more slowly varied pressure;
The speed of propagation of the leading part of the disturbance is comparable with the effective speed of sound superimposed on the local state of the flow;
Notwithstanding the continuously increasing lengths of the disturbed regions, the pressure distributions at successive instants in time share a close family resemblance.
The clarity of these characteristics in the above examples is facilitated by the choice of simple initial conditions and the absence of secondary, externally induced changes. In more general cases, this ideal behaviour would, at best, merely superimpose on the consequences of the other causes of change, and, more likely, would change because of them. Even so, it would not usually prevent the detection of at least the leading part of the propagating disturbance.
Tentative Qualitative Definition
In view of the various factors considered above, it is proposed that the term ‘wavefront’ should normally be reserved to imply “a localised region of relatively rapid change (i) that is readily seen to be moving at approximately the effective speed of sound relative to the local flow and (ii) that is followed by a less localised region of more slowly varying flow.”
This proposed definition focuses on the most consistent character of the above examples, whilst also being uninfluenced by details of the initiating event after the generation of the leading parts of the disturbance. It has the advantage of being consistent with the natural instinct of observers to focus on the strongest features of propagating phenomena. More important, by focussing on localised features, it restricts the use of the term to features that are propagating primarily in an inertial manner. Thus, for instance, whereas the definition is meaningful in the early stages of the leaky pipe example in
Section 5, it excludes the dominantly dispersive behaviour that characterises later stages.
14. Summary and Conclusions
A lack of clarity in the meaning of the term ‘wavefront’ in the context of unsteady fluid flows in pipes and ducts has triggered a search for a suitable definition. Ideally, a rigorous, quantitative definition would be found, but this is impracticable except in almost trivial cases. Instead, the practical search is for a qualitative definition that is specific and as free from ambiguities as practicable. The search process has been informed by illustrating a wide-range of unsteady flows in which the principal behaviour would typically be described with the aid of the word ‘wavefront’. This has led to a proposed generic definition that encapsulates the observed behaviours without reference to any specific application.
The proposed definition is not restricted to idealised flow conditions. Furthermore, it does not require that the disturbance to which it relates must propagate in unchanged form. Also, it does not require all wave components of the disturbance to propagate in the same direction, provided that the overall disturbance does so. Indeed, it is capable of use in the description of flows that are strongly dissipative and even in flows containing sinks that cause loss of mass.
A decade ago, the authors recognized that a similar lack of clarity in the intended meaning of the word ‘wavespeed’ had caused significant confusion in communications, even between persons with considerable experience in theoretical and practical studies of unsteady flows. Before the confusion was recognised, the ambiguity was a strong barrier to the development of proper understanding, and it triggered the preparation of a paper targeted at minimising the risk of similar confusion amongst other experts and, especially, non-experts (Tijsseling & Vardy [
32]). It is hoped that the present paper will have similar benefits regardless of whether the reader has previously detected evidence of miscommunication and its consequences.
In closing. it is emphasised again that a wide range of types of overall flow behaviour has been illustrated above even though attention has been restricted almost exclusively to disturbances resulting from a single triggering event. The number of possible outcomes will increase hugely when additional factors are present, as will nearly always be the case in practical applications. This is one reason why developing algorithms capable of disentangling multiple contributions to measured signals has been so difficult in the past. Current rapid developments in the design of AI methods offer hope for major advances in this respect. Nevertheless, it is clear that training such software to distinguish between different possible causes of particular measurements will be far from straightforward. In the short term, achieving a reliable identification of isolated wavefronts might be a sufficient challenge. Indeed, even then, it might be necessary to restrict the scope to specific systems instead of seeking methods that are effective in all applications. Either way, developers will need to consider issues such as those addressed herein, regardless of how they choose to define words like ‘wavefront’.
