Article

Characterizing Hot-Water Consumption at Household and End-Use Levels Based on Smart-Meter Data

Department of Engineering, University of Ferrara, Via Giuseppe Saragat 1, 44122 Ferrara, Italy
*
Author to whom correspondence should be addressed.
Water 2025, 17(13), 1906; https://doi.org/10.3390/w17131906
Submission received: 26 May 2025 / Revised: 24 June 2025 / Accepted: 25 June 2025 / Published: 26 June 2025
(This article belongs to the Section Water-Energy Nexus)

Abstract

Understanding the characteristics of residential hot-water consumption can be useful for developing effective water-conservation strategies in response to increasing pressure on natural resources. This study systematically investigates residential hot-water consumption through direct monitoring of over 40 domestic fixtures (belonging to six different end-use categories) in five Italian households, recorded over a period ranging from approximately two weeks to nearly four months, and using smart meters with 5 min resolution. A multi-step analysis is applied—at both household and end-use levels, explicitly differentiating tap uses by purpose and location—to (i) quantify daily per capita hot-water consumption, (ii) calculate hot-water ratios, and (iii) assess daily profiles. The results show an average total water consumption of 106.7 L/person/day, with at least 26.1% attributed to hot water. In addition, daily profiles reveal distinct patterns across end uses: hot- and cold-water consumption at kitchen sinks are not aligned over time (with cold water peaking before meals and hot water used predominantly afterward), while bathroom taps show more synchronized use and a marked evening peak in hot-water consumption. Study findings—along with the related open-access dataset—provide a valuable benchmark based on field measurements to support in the process of water demand modeling and the development of targeted demand-management strategies.

Graphical Abstract

1. Introduction

Nowadays, the efficient management of water distribution networks and the definition of water-conservation strategies are pivotal actions to be taken to contrast, or at least, limit the increasing pressure on natural resources worldwide. These actions cannot prescind from the accurate knowledge of water consumption [1,2,3,4,5,6]. In this regard, several studies were carried out with the aim of exploring water consumption drivers and features [7,8], mainly in relation to the residential sector, which typically accounts for the largest number of users [9]. From an operational standpoint, the development of these studies has been made possible by the advent of smart meters [10]—i.e., new-generation water meters with paired software—allowing detailed water-consumption data to be automatically collected and analyzed at very fine spatio-temporal scales, up to the level of individual domestic fixtures (hereinafter denoted to as end uses) and with temporal resolutions up to a few seconds or finer [11]. Specifically, when installed in place of traditional water meters, smart meters have been proven to successfully detect domestic leakages [12,13], notify residents about excessive water consumption [14], send real-time alerts in case of anomalous behaviours [15], or give insights into the characteristics of residential end uses of water [16]. In this context, installing smart water meters on the domestic hot-water line—e.g., downstream of the water heater—allows for investigating the characteristics of residential hot-water consumption through the monitoring of hot-water withdrawals.
Overall, hot-water consumption has a significant impact on residential energy consumption [17,18], being 50% of the total thermal energy required for water-heating purposes in new, well-insulated domestic buildings [19]. Therefore, detailed information on residential hot-water consumption magnitude and profiles can be of great importance in the context of designing optimal water-heating systems and developing efficient water-heating strategies [20], ensuring a reduction in residential energy loads and, in turn, in CO2 emissions [21]. Nevertheless, several examples demonstrating the value of having detailed information on the magnitude and profiles of residential hot-water consumption—obtained through water-consumption monitoring and data analysis—are available in the scientific literature. These examples highlight the critical role such data play in supporting a variety of applications, including hot-water demand modeling [20,22,23,24,25], the optimal design and sizing of domestic plumbing systems or their components [18,26,27], and the formulation of effective strategies for water and energy conservation in residential contexts [28,29,30].
In light of the above, efforts have been made in the last few decades to investigate the characteristics of residential hot-water consumption in different contexts worldwide. In the majority of cases, hot-water consumption was evaluated by installing a single smart water meter at the inlet of the domestic hot-water line, with sampling resolutions ranging from seconds [31,32] to minutes [18,26,28,33,34,35] and hours or coarser [25,36]. This strategy allowed for the effective quantification of the amount of hot water consumed at the household level, along with the respective daily, weekly or seasonal profiles. However, the installation of a single smart meter on the domestic hot-water line does not directly provide information at the level of individual end uses.
To overcome this limitation, household-level data have sometimes been integrated with temperature data from a series of thermocouples installed in strategic points of the domestic plumbing system [37,38,39,40,41,42], or disaggregated and classified into residential end uses of hot water through manual or automated approaches [29,43,44,45], to indirectly investigate the residential end uses of hot water. Conversely, a few case studies are available in which residential hot-water consumption was explored at the level of individual end uses through direct monitoring. For example, in 1995, Edwards and Martin [46] carried out the monitoring of hot and cold water consumption in a sample of end uses from 100 households, and the same was carried out in 2009 by Widén et al. [47], in relation to a group of taps from a sample of about 30 households and at different temporal resolutions (from 1 min to 1 h). However, no quantitative findings about the residential end uses of hot-water consumption are reported in the two aforementioned studies, the focus of which is the analysis of water-consumption determinants and the water-energy nexus, respectively. In recent years, direct end-use monitoring of hot-water consumption was performed by Marszal-Pomianowska et al. [48,49] with a remarkable resolution (2–8 Hz), allowing for the characterization of the exact number of daily per capita events. However, analyses were limited to a subset of end uses from a very small sample (1 and 2 households, respectively) and monitored for a limited period, ranging from 4 to 7 weeks. Other recent examples of studies are those by Arsene et al. [50] and Sborz et al. [51,52], the former of which—mainly devoted to the development of an IoT-based system for water-consumption monitoring at 1 min resolution—was carried out in relation to a limited sample of taps, and the latter of which focused only on the analysis of hourly hot-water consumption of showers (i.e., the only end use related to hot water in the selected household sample). Therefore, the current literature lacks a comprehensive study on residential hot-water consumption exclusively based on the direct monitoring—with sub-hourly temporal resolution and for a period of several weeks—of all the end uses included in a sample of several households.
In light of the above gap, this study aims to systematically investigate the characteristics of residential hot-water consumption at two different levels of spatial aggregation—i.e., entire-household scale and individual end-use scale—exclusively based on field-monitored end-use data, thus avoiding the inaccuracies that may arise from coupling household-level data with temperature data, or the application of automated tools for end-use disaggregation and classification.
Specifically, three main research questions, applicable at both levels of the entire household and individual end uses, are addressed in this study: (i) Which daily per capita volumes of water are related to hot-water consumption? (ii) Which fraction of the total water consumption is related to hot water? (iii) How does hot-water consumption vary across the day? To answer these questions, hot- and cold-water consumption data collected in a sample of five Italian households (with different occupancy rates and number of end uses), over a period ranging from approximately two weeks to nearly four months, and with 5 min sampling resolution, are systematically analyzed and compared to characterize hot-water consumption and the related patterns. Furthermore, hot- and cold-water consumption data, collected across more than 40 domestic fixtures (belonging to six different end-use categories), are systematically catalogued and provided among the Supplementary Materials of this paper, with the aim of providing a reference benchmark for researchers and engineers for modelling purposes or other applications.
The remainder of the paper is structured as follows. Section 2 describes the data sources and materials employed in the study and provides an overview of the core components of the methodology. Section 3 presents the most relevant results obtained from the analysis. Finally, Section 4 draws the key findings derived from the analyses and outlines the main concluding remarks.

2. Materials and Methods

This section describes the main steps of the methodological approach adopted to investigate the residential end uses of hot-water consumption. Overall, the current study (the layout of which is depicted in Figure 1) develops in two main phases: a former phase consisting of end-use data collection and pre-processing (details of which are provided in Section 2.1) and a latter phase including a multi-step analysis (outlined in Section 2.2).

2.1. Materials

2.1.1. End-Use Data Collection

Residential hot-water consumption was investigated by exploiting end-use data collected in a sample of five Italian households in northern Italy, hereinafter denoted as H1–H5. As shown in Table 1, the selected households differ in terms of type and occupancy rates. Specifically: (i) households H1 and H2 are apartments occupied by a single male and a single female, respectively (both aged between 40 and 45); (ii) household H3 is a ground-floor apartment occupied by two women (one aged between 50 and 60, and the other over 70); (iii) household H4 is a two-story apartment inhabited by a three-person family (parents aged between 60 and 65, and a 30-year-old son); and (iv) household H5 is a detached household inhabited by a three-person family (a couple aged between 50 and 60 and a child). It is worth noting that the composition of the household sample resulted from preliminary analyses involving a broader group of households to assess their willingness to participate in the study. Ultimately, due to concerns about the intrusiveness of the monitoring system—which required the installation of at least one smart meter at each domestic fixture—only the five aforementioned households consented to participate.
Although H1–H5 differ in terms of size, numerosity, and type of domestic fixtures installed, the following J = 6 categories of end-use water consumption can be overall identified: dishwasher (DW), kitchen sink (KS), washing machine (WM), shower (S), bathroom taps (BT), and toilet flusher (F). Overall, as reported in Table 1, the monitored household sample includes more than 40 domestic fixtures, ranging from a minimum of 4 fixtures per end-use category (in the case of DW) up to a maximum of 15 (in the case of BT).
Water-consumption monitoring was carried out in each household by installing smart meters on the supply line linking each domestic fixture to the domestic plumbing system. Specifically, a smart meter was installed on the single cold-water line supplying each toilet flusher (F) and electronic appliance (DW and WM), the latter typically being connected only to the cold-water line in European countries, unlike in other contexts [49]. Conversely, two separate meters were installed upstream the cold- and the hot-water supply point of each fixture of the other end-use categories (KS, S, and BT). However, as far as showers are concerned, hot- and cold-water consumption was monitored separately only in household H5. In fact—as in the case study analyzed by Marszal-Pomianowska et al. [48,49]—the presence of wall-mounted (and thus inaccessible) shower-valve cartridges in households H1–H4 only allowed the monitoring of total water consumption without the possibility to discriminate between hot- and cold-water use.
From an operational standpoint, the smart monitoring system consisted of n h mechanical meters—where n h varied across households depending on the total number of fixture supply points—each paired with an optical reader and a radio transmitter utilizing the Wireless M-Bus protocol. The system was configured to record cumulative water volumes (with 1 L accuracy) at a specified temporal resolution and to transmit the logged data daily to a digital platform via the household’s Wi-Fi connection. Further details of the developed monitoring system are available in the study by Mazzoni et al. [53].
Household monitoring was conducted over more than four months, i.e., in relation to 131–137 days from early November 2017 to mid-March 2018. In greater detail, the choice of focusing on the winter season is related to the fact that hot-water consumption is typically the highest when outdoor temperature is the lowest, as widely reported in the literature [34,54,55]. Overall, the system was configured to record data with minute-scale resolution (i.e., 5 min) so as to investigate water consumption with fine level of temporal detail while preserving optic-reader batteries.

2.1.2. Data Pre-Processing

The cumulative volumetric data V i , h recorded over time by each smart meter i (i.e., in relation to a given domestic fixture and a given water line) of each monitored household h ( i = 1 , , n h , being n h the total number of smart meters installed in the h -th household considered, and h = 1 , , H ) were preliminarily converted into water consumption values Q i , h ( t ) in accordance with Equation (1):
Q i . h t = V i , h t + t V i , h ( t )   t
where t and t + t are two subsequent time-steps of the monitored time series (being t equal to 5 min). Therefore, the application of Equation (1) resulted in end-use water consumption time series, with sampling intervals of 5 min. In addition, given that most residential end-use events are typically characterized by volumes ranging from some liters to tens of liters [8], end-use water consumption was expressed in liters (per 5 min intervals) to simplify volume interpretation.
Subsequently, the obtained end-use water consumption dataset was cleaned (i.e., reduced) to exclude: (1) the days during which hot- or cold-water consumption data related to at least one domestic fixture were not available due to issues in data logging, wireless transmission, or Wi-Fi communication; and (2) the days during which the monitored households were not occupied, thus potentially leading to a misestimation of the hot- and cold-water consumption parameter values. In the former case, days with missing data from any domestic fixture were excluded from the analysis. Although this approach may reduce the dataset size, it prevents the inclusion of partial domestic water-consumption records that could bias aggregated profiles at the household scale or compromise the reliability of comparisons of hot-water consumption data across different end-use categories within a given household. As far as the latter case is concerned, all days characterized by inhabitants’ absence in a given household h were identified by evaluating the daily overall consumption of each household h concerned (i.e., D V t o t h ) in accordance with Equation (2):
D V t o t h = t = 1 T d i = 1 n h Q i , h t  
where T d is the total number of 5 min time steps making up the d -th monitored day of the period. In the event that D V t o t h is greater zero, household h is considered as occupied during the d -th day making up the monitored period. Conversely, it is considered as unoccupied and the d -th day is removed from the water-consumption dataset.
Overall, as indicated in Table 1, the above data cleaning process led to a considerable reduction in the number of days with available data. On the one hand, due to issues in wireless transmission or Wi-Fi communication, data availability ranges from a minimum of 17 days (H3) to a maximum of 133 days (H2), with a total of 394 days of available data (i.e., an average of about 79 days per household). On the other hand, householders’ absence resulted in a further reduction in the number of days exploitable in the analysis, which decreased from 394 to 352. Therefore, at the end of the data pre-processing phase, an average of about 70 days with water consumption per household are available, ranging from a minimum of 17 (H3) to a maximum of 111 (H2).

2.2. Methods

To investigate the characteristics of residential hot-water consumption and address the three research questions underpinning this study, a multi-step methodology was developed, comprising: (i) calculation of daily per capita hot-water consumption and comparison against daily per capita total- and cold-water consumption (Analysis I); (ii) assessment of the hot-water ratio (Analysis II); and (iii) evaluation of daily consumption profiles and the related hot-water share (Analysis III). From an operational standpoint, this multi-step methodology was applied to the entire household sample, with results reported at two distinct spatial scales: household (aggregate) and individual fixture (end-use) level.

2.2.1. Analysis I: Daily per Capita Hot-Water Consumption

Daily per capita water consumption (L/person/day) is one of the most commonly employed indicators in the scientific literature to characterize people’s behavior and habits and the attitudes toward a conscious water use [8].
In the present study, daily per capita hot-water consumption was first evaluated analyzed at both the end-use and aggregate levels, as shown in Equations (3) and (4), respectively:
v P C D h o t j , h = 1 O R h 1 D h t = 1 T h Q j , h h o t t  
V P C D h o t h = j = 1 J v P C D h o t j , h  
where Q j , h h o t is the hot-water consumption (L) of the j -th end-use category in the h -th monitored household of the sample, e.g., kitchen sink of household H3 ( j = 1 , , J , with J = 6 for all households considered in this study); T h is the number of 5 min time-steps making up the monitored period of household h ; D h (days) is the length of the monitored period of household h ; O R h is the occupancy rate (persons) of household h ; v P C D h o t j , h is the daily per capita hot-water consumption related to end-use category j in household h (L/person/day); and V P C D h o t h is the overall daily per capita hot-water consumption of household h (L/person/day).
In addition to hot-water consumption, the following two metrics were also evaluated at both aggregate and end-use levels, for comparative purposes: (i) daily per capita cold-water consumption ( v P C D c o l d a n d V P C D c o l d ); (ii) daily per capita consumption related to water of unknown type ( v P C D u n k n o w n a n d V P C D u n k n o w n , corresponding to domestic fixtures with a single smart meter monitoring both cold- and hot-water lines, such as showers in households H1–H4). In greater detail, the two aforementioned metrics were assessed based Equations (3) and (4), considering cold and unknown water consumption instead of hot-water consumption.
Finally, daily per capita total water consumption was assessed as the sum of daily per capita hot-, cold-, and (possibly) unknown water consumption.

2.2.2. Analysis II: Hot-Water Ratio

The hot-water ratio (HWR) is used in the scientific literature to quantify the proportion of hot water relative to the total water consumption within a household or to a specific domestic fixture. Several studies have investigated this parameter across different temporal scales, by considering the entire household [25,52,54,55] or the appliance level [29,49].
From an operational standpoint, given the length of the monitoring period considered in this study, HWR is evaluated only for the cold season. Specifically, it is calculated at both the end-use and aggregate levels, as defined in Equations (5) and (6), respectively.
h w r j , h = v P C D h o t v P C D h o t + v P C D c o l d j , h · 100
H W R h = V P C D h o t V P C D h o t + V P C D c o l d h   · 100  
Based on Equations (5) and (6), HWR is a percentage-based metric which can assume a value ranging from 0% (when the fixture or the household is considered to operate exclusively with cold water) to 100% (when they operate exclusively with hot water). However, in the event that not all the fixtures making use of hot and cold water are equipped with two meters separately monitoring hot- and cold-water consumption, the uncertainty about mixed water (i.e., the amount of unknown water consumption) should be considered when calculating the aggregate HWR of a given household h , the upper limit of which is defined as reported in Equation (7):
H W R h = V P C D h o t + V P C D u n k n o w n V P C D h o t + V P C D c o l d + V P C D u n k n o w n h   · 100  
It, therefore, emerges that, if V P C D u n k n o w n > 0 , the aggregate HWR cannot be exactly quantified, but only a range of values can be provided. The upper and lower bounds of this range are determined by assuming that the total volume of unknown (i.e., mixed) water is entirely attributable to hot water and cold water, respectively.

2.2.3. Analysis III: Daily Water-Consumption Profiles and Related Hot-Water Share

Understanding how water use varies throughout the day—or between different types of days (e.g., weekdays, or weekends/holidays)—enables the identification of peak-demand times, which can be helpful for designing targeted water-demand management strategies or parameterizing water-demand models [56,57]. In fact, about one third of the studies investigating residential end uses of water include an analysis of daily water consumption profiles [8].
In line with previous studies on daily water consumption profiles, normalized patterns of the total domestic water-consumption—defined as sets of u = 24 hourly coefficients of total water consumption —are evaluated at both the end-use ( c 1 , c 2 , , c 24 ) and the aggregate ( C 1 , C 2 , , C 24 ) levels, as shown in Equation (8) and Equation (9), respectively:
c j , u = 1 H h = 1 H t = 1 T u Q j , h t o t t , u 1 24 1 H u = 1 24 h = 1 H t = 1 T u Q j , h t o t t , u
C u = 1 H h = 1 H t = 1 T u j = 1 J Q j , h t o t t , u 1 24 1 H u = 1 24 h = 1 H t = 1 T u j = 1 J Q j , h t o t t , u  
where Q j , h t o t t , u is the total (i.e., hot- and cold-water) consumption of end-use category j in household h at time t of the monitoring period—specifically, over the u -th hour of the day ( u = 1 , , 24 )—and T u is the total numbers of 5 min time steps related to the u -th hour of the day in the monitoring period. The numerator in Equations (8) and (9) represents the average total water consumption—associated with end use j or with the entire household, respectively—during the u -th hour of the day, while the denominator relates to the average daily total water consumption at the end-use or aggregate level. For instance, considering all households grouped together, if c j , u (or C U ) equals 0.5, this indicates that the total water consumption for end use j (or the aggregate consumption) during the u -th hour is half of its daily average.
Specifically, to investigate the daily fluctuations in hot-water consumption, the hot-water share of the daily profile is derived by substituting Q j , h h o t t , u instead for Q j , h t o t t , u in the numerator of Equations (8) and (9). The same approach is applied, for comparative purposes, to assess the cold-water share. Furthermore, daily water consumption profiles are also analyzed separately for working days and for weekends or holidays.

3. Results and Discussion

The results of the application of the methodology for the analysis of hot-water consumption in the five monitored households H1–H5 are presented and discussed in this section, grouped by stage of the analysis in accordance with the method layout.

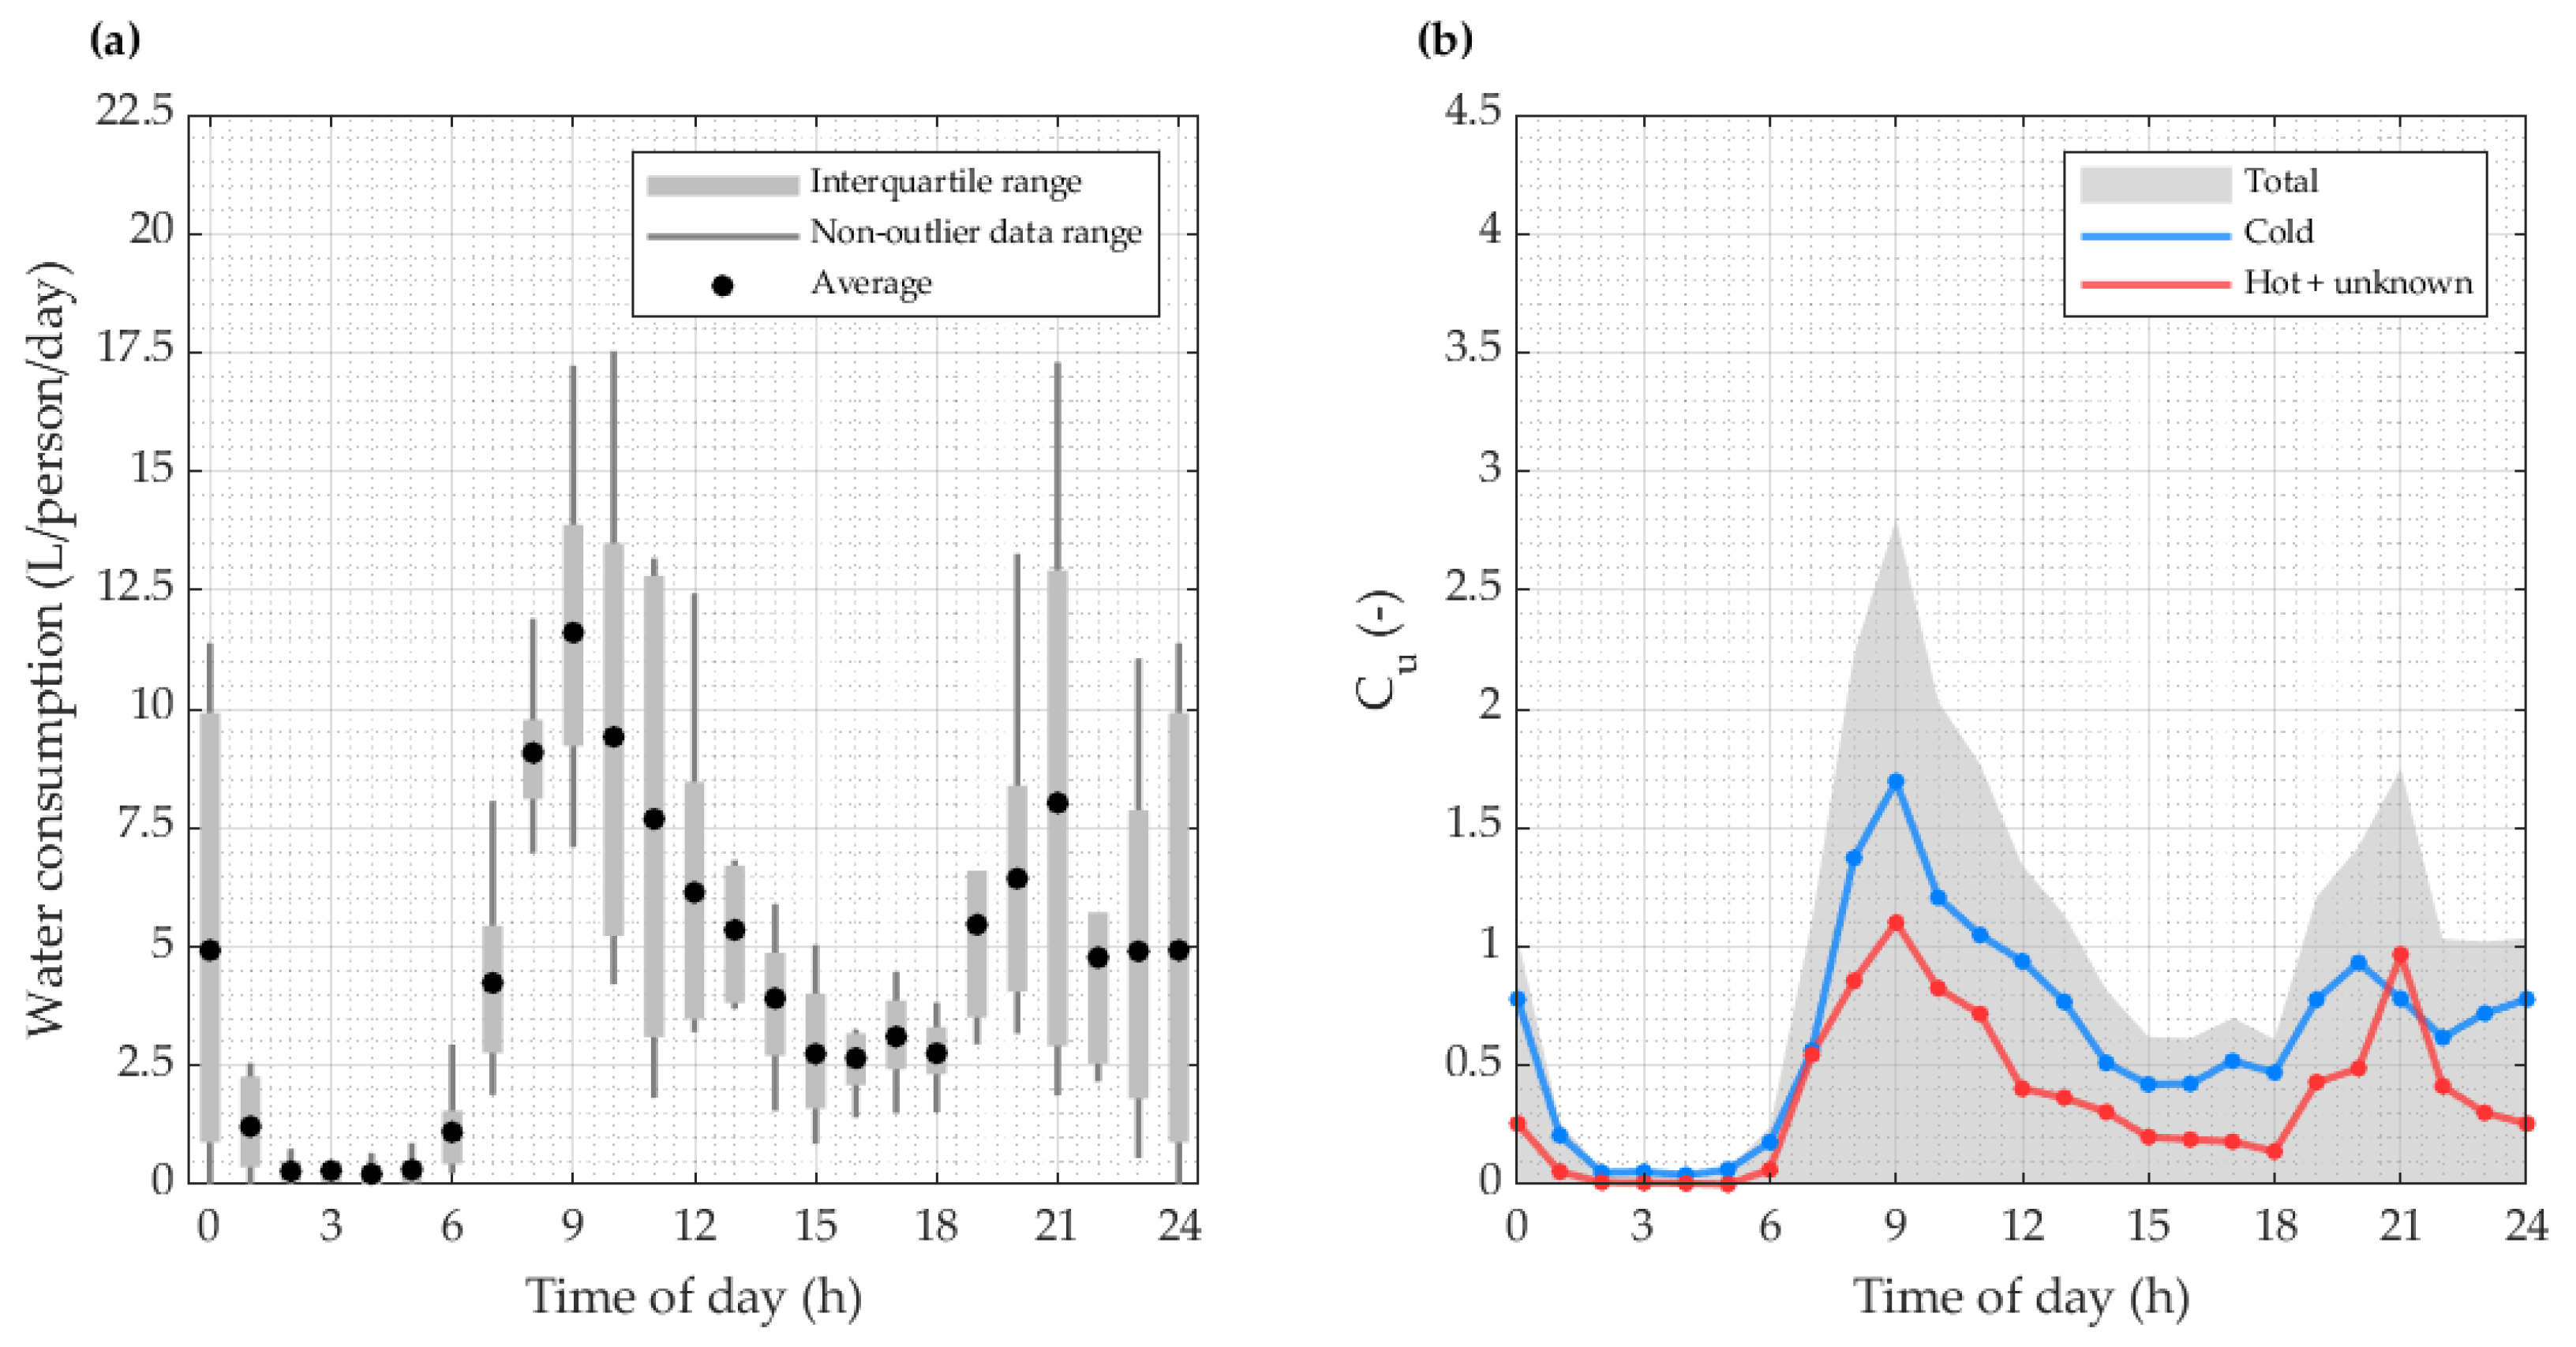
3.1. Analysis I: Daily per Capita Hot-Water Consumption

Daily per capita water-consumption values at the aggregate level (categorized into total, cold, hot, and unknown water use) are presented in Table 2 for each monitored household.
An average of 106.7 L/person/day is consumed in households H1–H5. Specifically, 72.8 L/person/day is related to cold-water consumption, 27.8 L/person/day to hot-water consumption, and 6.1 L/person/day to unknown water consumption (i.e., undifferentiated shower consumption). However, because monitoring was conducted during the cold season, it is reasonable to assume that most shower water consumption—classified as “unknown” in H1–H4—is actually hot. Therefore, the actual hot-water consumption may be closer to the sum of measured hot and unknown water, averaging approximately 33.9 L/person/day.
The analysis of individual household data reveals that H3 recorded the highest hot-water consumption (43.7 L/person/day, increasing to 55.2 L/person/day when including the 11.5 L/person/day of unknown water). H1 followed, with 33.9 L/person/day of hot water (rising to 41.7 L/person/day when the unknown water share is considered). H4 and H5 showed comparable values (monitored hot-water consumption of 23.3 L/person/day and combined value of 29.7 L/person/day in the former case, and 26.2 L/person/day in the latter case, with no unknown water consumption). Lastly, H2 reported the lowest consumption, with hot and combined values of 12.1 and 16.8 L/person/day, respectively. Overall, although the limited household sample size prevents generalization, it is noteworthy that no clear dependency of hot-water consumption on occupancy rates was observed. This suggests that individual habits and end-use characteristics may play a more significant role than the number of occupants.
As far as individual end uses of water are concerned, Table 3 reports the water-consumption values observed across different households. For the sake of brevity, only total, cold-, and hot-water consumption are included, whereas unknown water consumption (only related to household H1–H4 showers) is omitted.
Among end uses, toilet flushers (F) account for the highest average total water consumption (i.e., 34.9 L/person/day, entirely consisting of cold water), this is followed by kitchen sinks (KS), with 22.8 L/person/day (of which 11.7 L is hot water), bathroom taps (BT), with 21.7 L/person/day (14.3 L of which is hot water), and washing machines (WM), which consume 17.0 L/person/day (using only cold water). Conversely, lower water consumption is tied to the use of showers (S), averaging 8.1 L/person/day (in this case, separate hot- and cold-water consumption values are available only for household H5) and dishwashers (DW), with an average of 2.3 L/person/day (entirely composed of cold water). The average total water consumption values reported for different end-use categories are rather similar to the corresponding worldwide-scale values available in the scientific literature (i.e., 38.0 L/person/day for toilet flushers, 32.9 L/person/day for all domestic taps, 28.8 L/person/day for washing machines, and 3.0 L/person/day for dishwashers) [8]. However, the observed 8.1 L/person/day for shower in households H1–H5 is far from the average value of 44.1 L/person/day [8]. This is reasonably due to the cold season (which may reduce shower frequency and thus negatively affect shower water consumption, as reported, e.g., in [58]) and, additionally, to occupants’ habits and lifestyle, including sport activities carried out several times per week and, therefore, the use of showers performed in the sport facilities instead of the home.
Overall, the highest amount of hot water is consumed in bathroom taps (14.3 L/person/day), followed by a slightly lower amount associated with kitchen sinks (11.7 L/person/day). However, despite variations across households, the values for bathroom taps are generally slightly more lumped around the mean (with a standard deviation of about 6.2 L/person/day) compared to those for kitchen sinks (with a standard deviation of about 8.0 L/person/day). This seems to suggest that, at least during the cold season, the use of hot water for personal hygiene is slightly less variable (and thus less dependent on occupants’ habits) compared to hot water use for food-related or kitchen purposes, which is more influenced by individual attitudes. With specific reference to kitchen uses, a comparison of end-use data from households H1 and H2—both occupied by a single person—suggests that the absence of a dishwasher (in H1) may result in significantly higher daily per capita water consumption at the kitchen sink. Specifically, H1 recorded 29.8 L/person/day of total water use (nearly twice that of H2) and 17.9 L/person/day of hot water use (compared to less than 1 L/person/day in H2). These findings indicate that the use of a dishwasher may help reduce not only cold-water consumption but also hot-water use by eliminating the need for manual dishwashing with hot water.

3.2. Analysis II: Hot-Water Ratio

The analysis of the hot-water ratio (HWR) at the level of entire households and individual end uses of water consumption leads to the results shown in Table 4. In aggregated terms, the HWR for the overall sample of households (H1–H5) ranges from 26.1% (a more unlikely case, where it is assumed that the overall unknown water consumption is related to cold water) to 31.7% (a more likely case, where the unknown water is assumed to be hot). Although with differences among the households concerned, the results reveal that approximately one-third of the water used at the household level (Figure 2a) is hot, in line with the values reported in the literature for the winter period, typically in the range from 30% to 40% [25,29,36,54,55].
As far as end uses are concerned, the analysis reveals, on the one hand, HWR values equal to 0% (indicating the use of cold water only) for toilet flushers and electronic appliances, showing how, in Europe, these latter are typically connected only to the cold-water line (conversely, in the USA and Canada, dishwashers and washing machines are sometimes connected to hot water [49]). On the other hand, positive HWR values are observed for kitchen sinks, with an average of approximately 51%, and, more markedly, for bathroom taps, with an average HWR of nearly 66% (Figure 2b). These average values confirm that the end-use categories associated with personal hygiene tend to consume a relatively greater proportion of hot water, and with lower variability, compared to those related to food preparation and cooking. In quantitative terms, HWR values range from 44% to 90% in the former case, as opposed to HWR assuming values from 1% to 90% in the latter case. This is also valid if individual households are concerned. Finally, regarding showers, data from household H5 (for which cold and hot water were monitored separately) indicate that nearly all water consumption (i.e., over 96%) is associated with hot water. Although this result pertains to a single household and is, therefore, not statistically significant, it seems to further confirm that the majority of the unknown amount is represented by hot water.
Overall, the observed HWR values indicate that some end-use categories are predominantly associated with hot-water consumption. This predominance can undermine the reliability of data obtained through indirect approaches, e.g., the disaggregation and classification of household-level data collected at the domestic water inlet. The issue becomes particularly relevant in domestic systems where produced hot water is stored in tanks before use: in these cases, the inflow profile (i.e., cold water entering the tank) often diverges from the outflow profile (i.e., heated water delivered to points of use), potentially resulting in disaggregated data that does not accurately reflect actual occupant behavior.

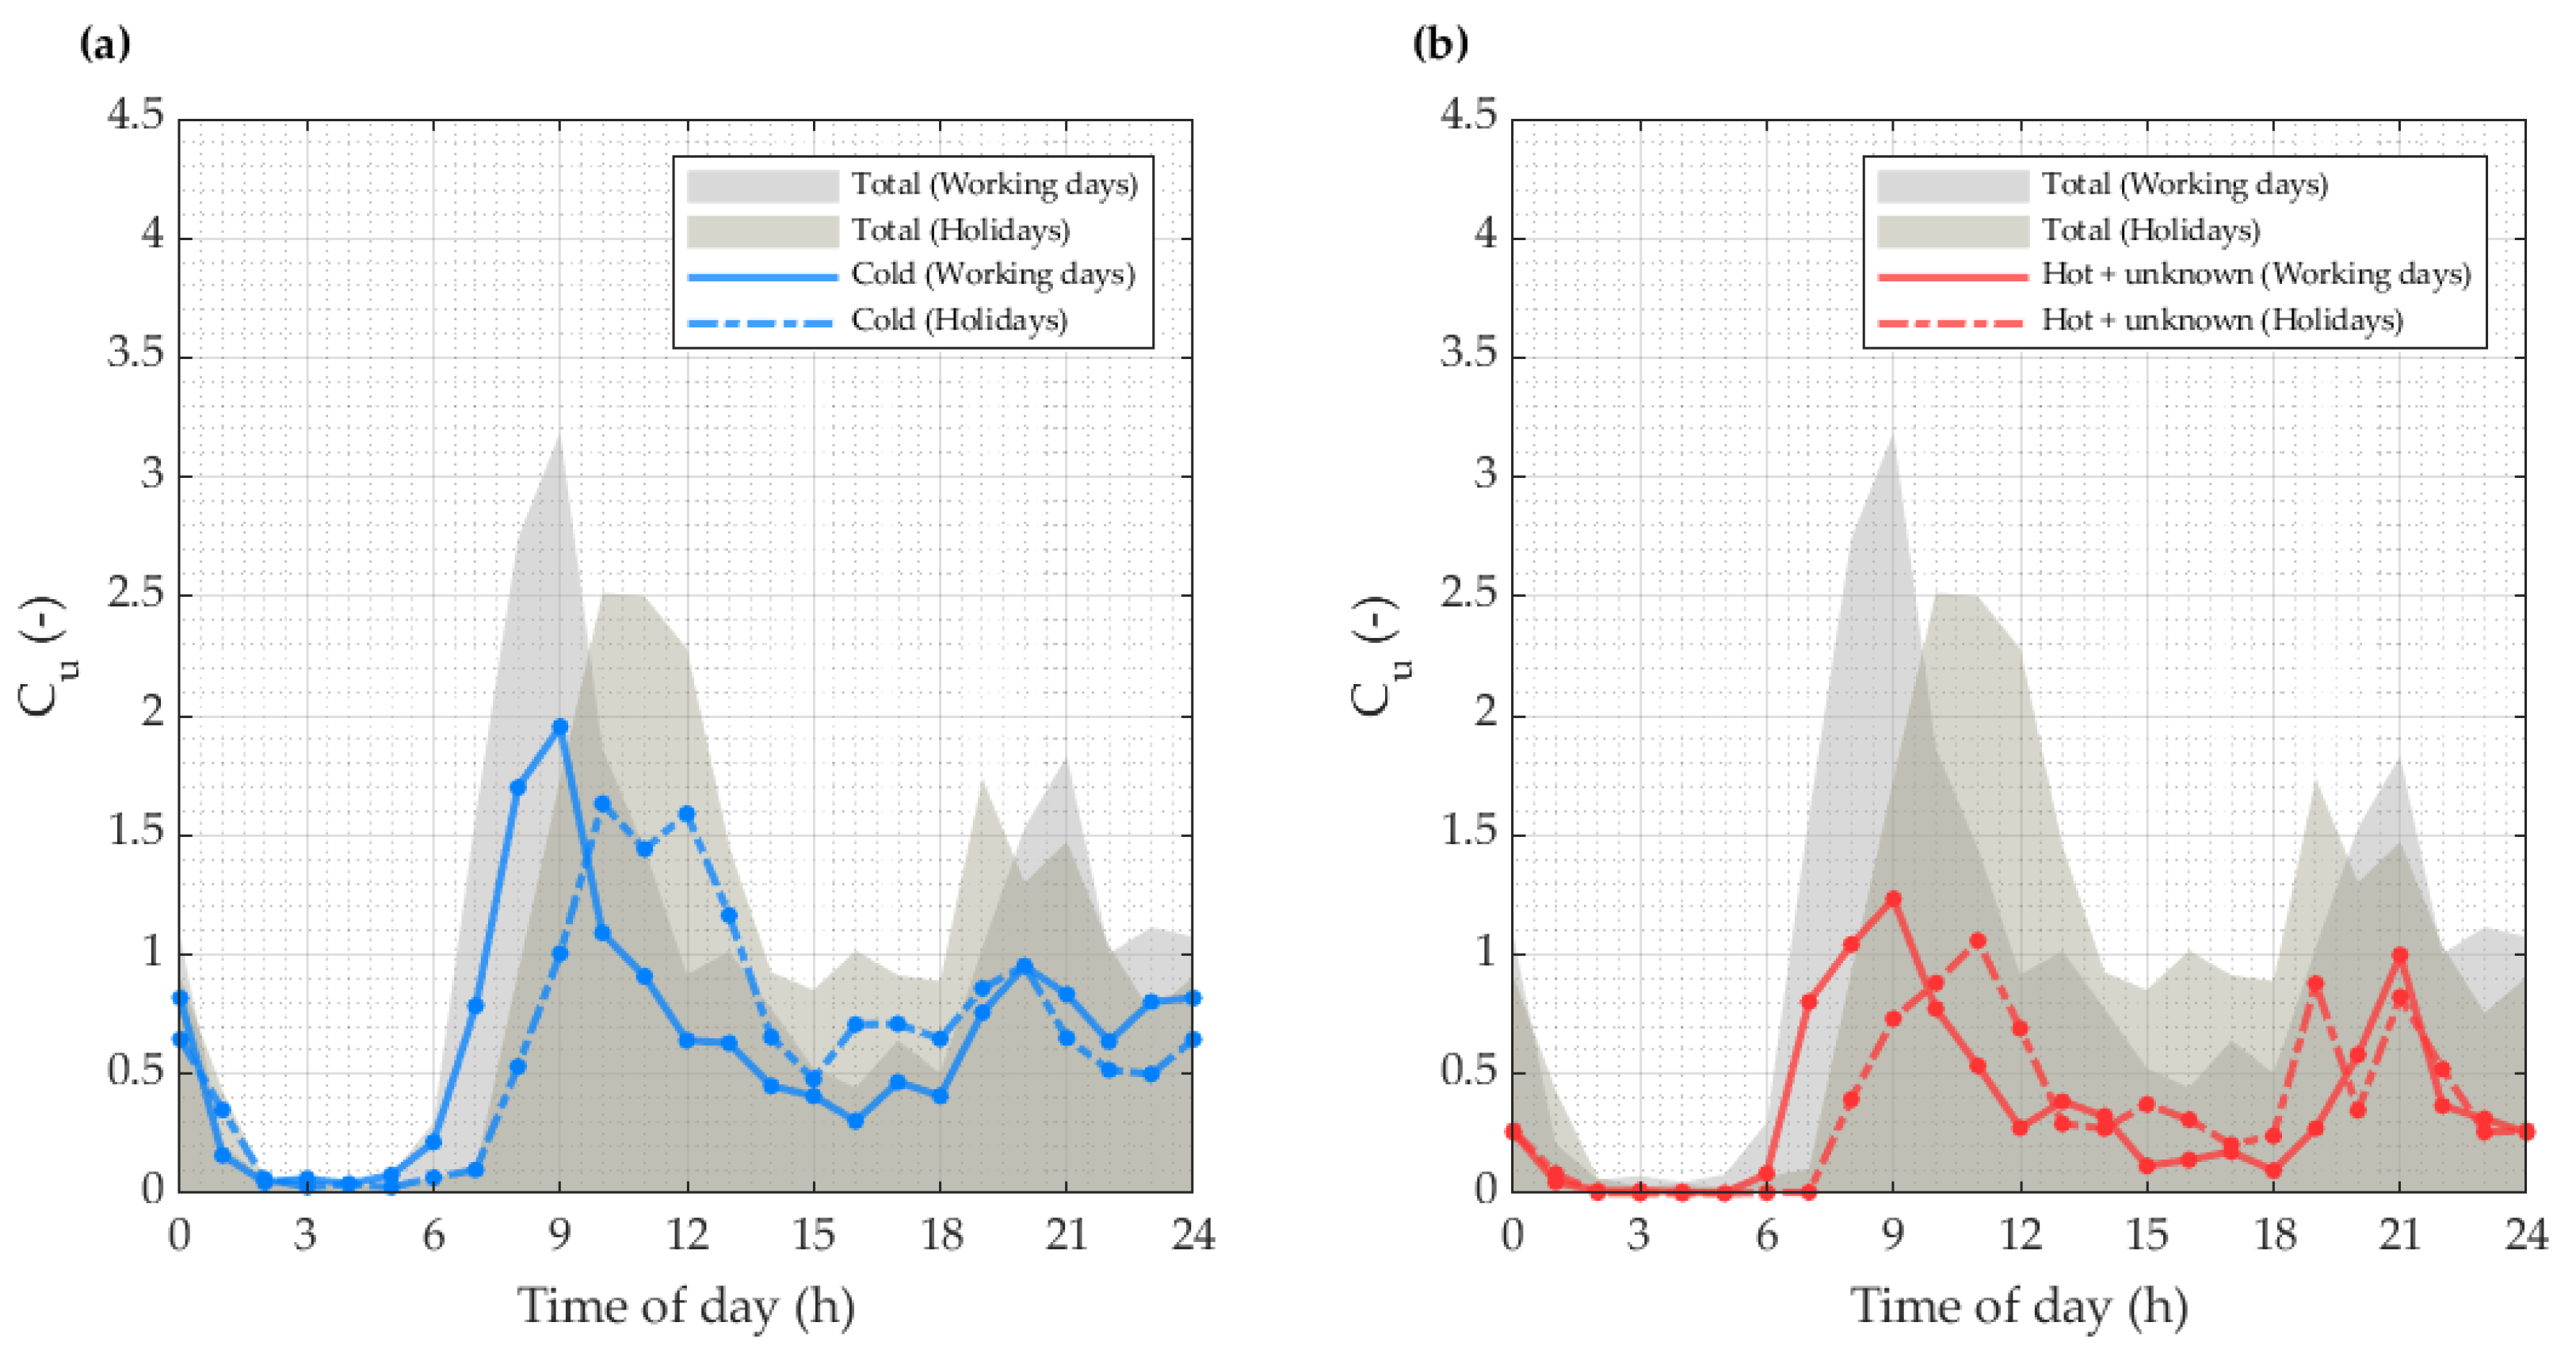
3.3. Analysis III: Daily Water-Consumption Profiles and Related Hot-Water Share

Daily water-consumption profiles are initially analyzed at the aggregate level for the entire household dataset (i.e., H1–H5 grouped together), followed by the examination of each end-use category associated with HWR values greater than zero (i.e., kitchen sinks, showers, bathroom taps).
Figure 3a presents a box-and-whisker plot of the aggregate daily total water consumption profile in dimensional terms. The figure reveals that total water consumption fluctuates throughout the day, with higher consumption during the day and almost no consumption during the night hours, reflecting occupants’ activities and lifestyles. Specifically, an initial peak—averaging approximately 11.5 L/person/h—occurs at 9:00, corresponding to typical morning routines such as preparing for work, school, or engaging in domestic tasks. A second, less marked peak is observed in the evening, around dinner time (or slightly thereafter), with a magnitude of approximately 8.0 L/person/h. Overall, these findings are consistent with those reported in previous studies on residential water-consumption profiles (e.g., [29,56,57,58]).
Regarding the distribution of values across individual households, the box-and-whisker amplitudes are widest during the late morning and evening hours (approximately from 9:00 to 12:00 and from 21:00 to 24:00, respectively), indicating greater variability in occupants’ water-use behavior in the mentioned periods, which also includes peak times. This suggests that while some individuals may be away from home during the late morning due to work or school commitments, others may remain at home and consume water. A similar case is observed in the evening, when some occupants may have already concluded their domestic activities (e.g., dishwashing or personal hygiene), whereas others may still be engaged in them.
Figure 3b displays the normalized, aggregate daily water consumption profile (averaged across households), along with the corresponding cold-water share and combined hot- and unknown water share. The figure shows no significant differences between the trends of cold- and hot-water profiles during the morning and afternoon, both peaking at 9:00, consistent with the peak observed in the total water consumption profile. However, in the evening, a slight misalignment is observed: cold-water consumption peaks at 20:00, whereas hot water peaks at 21:00, when the share of hot water exceeds that of cold water, leading to the total-consumption evening peak.
These observations also hold when normalized water consumption profiles—along with the associated share of cold-water and hot/unknown water—are analyzed separately for working days and weekends or holidays (Figure 4). Occupant water-use behavior exhibits distinct patterns on non-working days when compared to working days. Specifically, the morning peak in total water consumption is delayed, shifting from approximately 9:00 on working days to 10:00–12:00 on non-working days. This temporal shift comes with a reduction in the corresponding peak coefficient C m a x = max { C 1 , C 2 , , C 24 } , which decreases from around 3.2 to approximately 2.5. Such variations can be attributed to the absence of time-constrained activities—such as commuting to work or school—which results in a more distributed water-consumption profile throughout the day. These behavioural differences can also be noted in the cold- and hot/combined-water share profiles, both of which display a peak at 9:00 on working days, and at 10:00–12:00 during non-working days.
With respect to evening water use, Figure 4 illustrates that the total water-consumption peak, occurring at 21:00 on working days, is anticipated to approximately 19:00 on weekends and holidays. However, further differentiation is observed among the types of water consumption. On the one hand, the cold-water share generally peaks at 20:00, irrespective of day type. On the other hand, the hot/unknown water share shows more dynamic patterns: a single evening peak around 21:00 on working days, and multiple peaks occurring between 19:00 and 21:00 on non-working days. This greater temporal variability in hot-water consumption suggests a higher heterogeneity in occupants’ behavior during non-working days. In fact, it is reasonable to assume that hot water—primarily associated with showering or other personal hygiene practices—is used in accordance with more variable schedules on non-working days, whereas on working days, water-consumption patterns are more tied to fixed daily routines.
Finally, normalized total water consumption profiles were analyzed for three specific end-use categories involving combined hot- and cold-water use: kitchen sink (Figure 5a), shower (Figure 5b), and bathroom taps (Figure 5c). The three panels of Figure 5 illustrate distinct diurnal patterns associated with each fixture and highlight peculiar characteristics in the temporal variation of total water consumption, along with hot- and cold-water shares of the specific end-use categories.
As far as total water consumption is concerned, Figure 5 shows that, on the one hand, the normalized profile for the kitchen sinks exhibits multiple peaks—generally coinciding with, or occurring in proximity to, typical mealtimes—likely associated with water use for meal preparation and manual dishwashing. On the other hand, a distinct morning peak is evident in the case of bathroom taps and is even more pronounced in the case of showers (although only data from the H5 shower—i.e., the only shower points where hot- and cold-water consumption were separately monitored—are reported).
With regard to the profiles of hot- and cold-water share, distinctive patterns emerge for each end-use category—some of which have not been documented in previous studies due to the absence of monitoring at the end-use level by discriminating tap type and room location (i.e., kitchen sink versus bathroom taps). For example, in the case of kitchen sinks (Figure 5a), hot- and cold-water shares are not consistently dominant over one another, and exhibit peaks that are not aligned over time. Specifically, cold water tends to be drawn earlier (notable peaks at 09:00, 13:00, and 20:00), likely associated with food preparation tasks that typically do not require heated water. Conversely, hot water usage shows delayed peaks (approximately at 10:00, 14:00, and 22:00), plausibly related to post-meal cleaning activities, such as manual dishwashing, where warm water is generally preferred for hygienic and practical reasons. As for bathroom taps (Figure 5c), the hot-water share consistently exceeds that of cold water. This is mainly evident in the morning, where both exhibit aligned peak times. In contrast, during evening hours, a marked peak in hot-water usage is observed without a corresponding increase in cold-water demand. This asymmetry likely reflects seasonal behavioural adaptations, with occupants preferring hot water for personal hygiene routines in winter. This behavior is further corroborated by the hot- and cold-water share profiles observed in the case of the H5 shower (Figure 5b), showing an almost exclusive reliance on hot water. The cold-water profile remains nearly negligible and is temporally aligned with the hot-water demand, confirming the predominant use of hot water for showering.

4. Conclusions

This study aimed to characterize residential hot-water consumption based on smart-meter data collected in five Italian households over periods ranging from approximately two weeks to nearly four months. More specifically, hot- and cold-water-consumption data were gathered from more than 40 domestic fixtures (grouped into six main end-use categories), with a sampling frequency of 5 min. This enabled a detailed multi-stage analysis of hot-water consumption at both the household (aggregate) and fixture (end-use) levels. The key findings from the analysis are reported below.
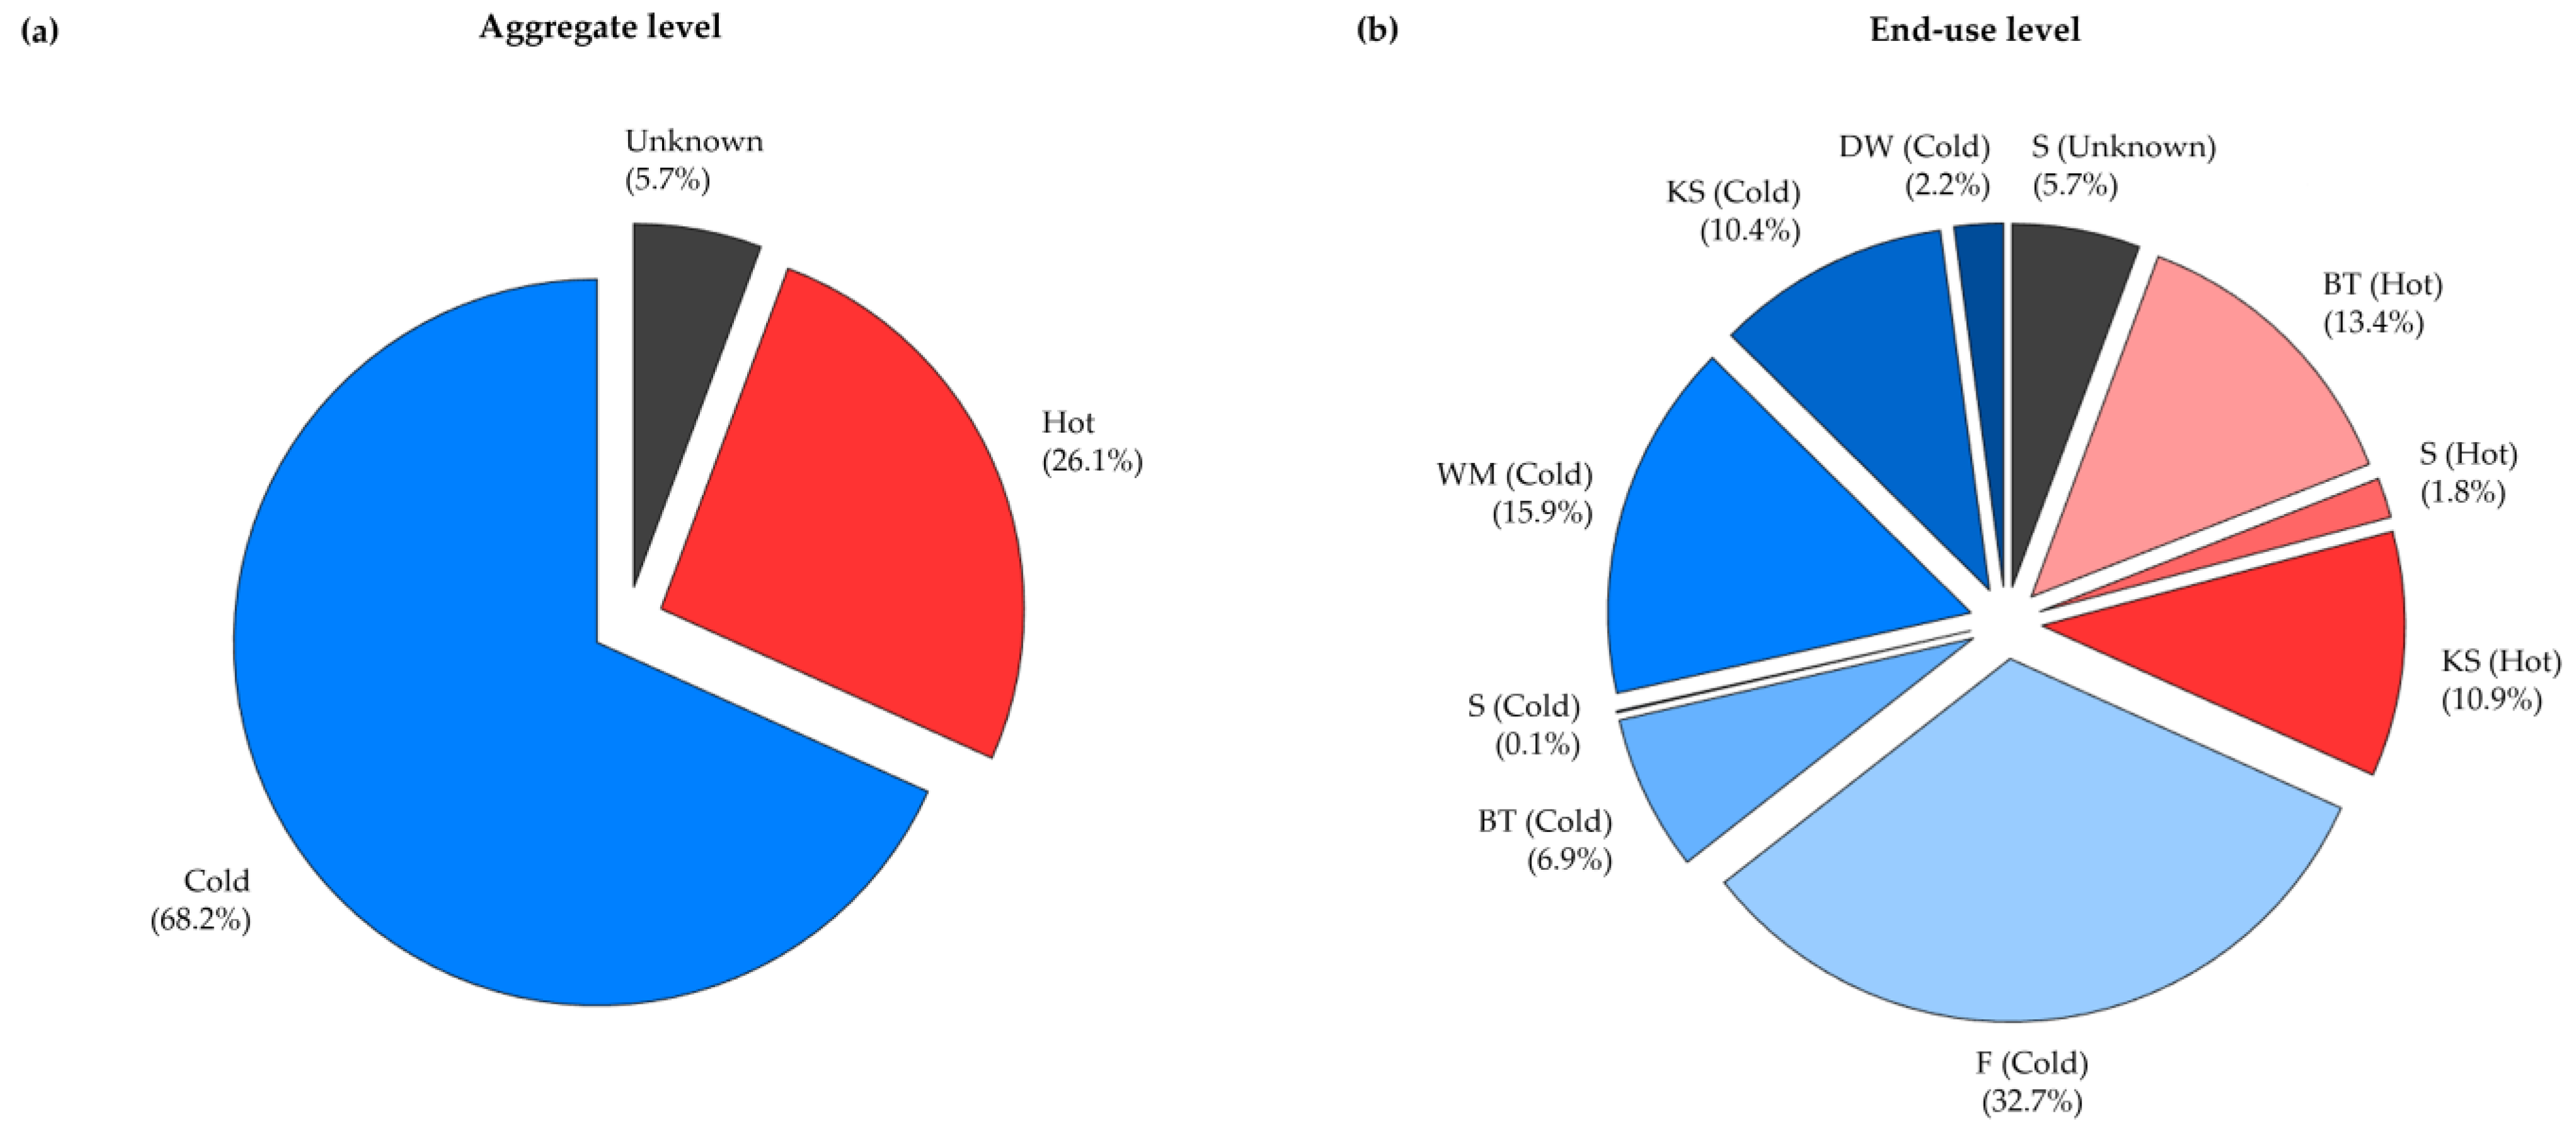
  • The average total daily water consumption across the monitored households is 106.7 L/person/day, of which 27.8 L/person/day was attributed to hot water. Including undifferentiated shower consumption (which is largely assumed to be hot water), the actual hot-water consumption increases to 33.9 L/person/day, revealing a hot-water ratio between 26.1% and 31.7%, consistent with values reported in similar studies. In addition, no correlation is observed between occupancy rate and hot-water consumption, suggesting that the latter is mainly affected by behavioral factors (such as habits and lifestyle) and specific end-use characteristics.
  • At the end-use level, bathroom taps (BT) and kitchen sinks (KS) are the primary contributors to hot-water consumption, with average values of 14.3 L/person/day and 11.7 L/person/day, respectively. These fixtures also exhibit the highest hot-water ratios, averaging 65.8% for BT and 51.3% for KS. As far as showers are concerned, for which hot- and cold-water were separately monitored in only one household, the hot-water ratio exceeds 96%, indicating the predominant use of hot water. However, it has to be highlighted that the rather limited total water consumption values were observed for showers (i.e., 8.1 L/person/day) as a consequence of people having showers in sports facilities instead of at home.
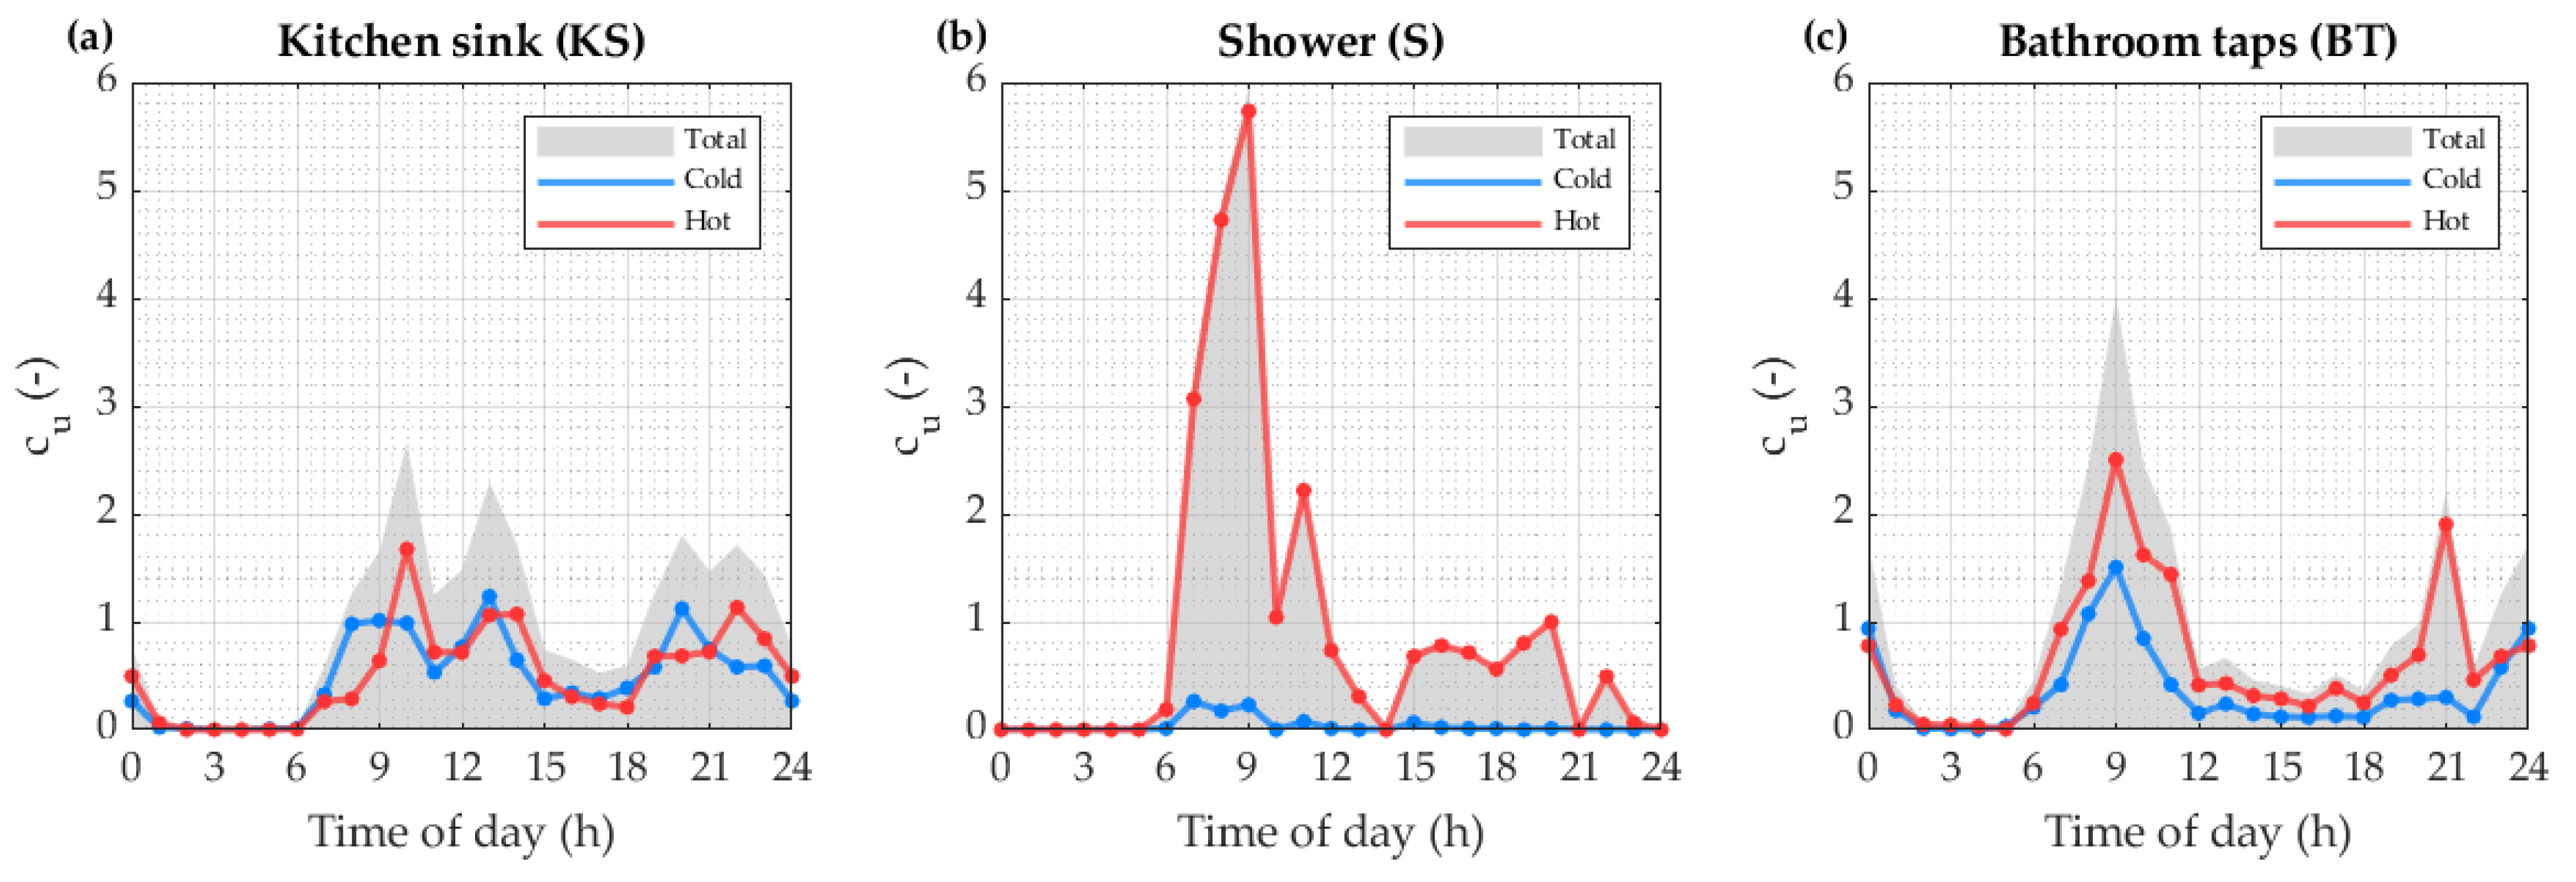
  • At the end-use level, kitchen sinks exhibit multiple peaks throughout the day, with cold-water use typically occurring before meals and hot-water use following meals. Bathroom taps show a primary morning peak—coinciding in terms of hot and cold water—as well as a less pronounced evening peak primarily for hot-water consumption, likely linked to personal hygiene preferences during colder seasons.
In summary, this study provides valuable insights into aggregate and end-use residential hot-water consumption, including daily per capita values, hot-water ratios, and diurnal profiles. The study relied exclusively on direct field measurements (i.e., water-consumption data), avoiding the need for thermal measurements or disaggregation methods. This approach ensured the acquisition of reliable hot-water consumption data, which are openly available and accessible to researchers, and can be utilized for the development, testing, or refinement of water demand models.
Another key methodological advancement of this study—compared to many previous investigations—is the explicit differentiation of tap use by purpose and location, enabling separate analyses of kitchen sinks and bathroom taps. This distinction revealed significant differences in daily per capita consumption, hot-water ratios, and diurnal profiles, providing new insights not available from aggregate or undifferentiated data.
Despite the remarkable outcomes of this study, some limitations have to be highlighted. First, the sample size is relatively small, comprising only five households located within the same geographic area. Moreover, the household composition may not be fully representative of the general population, as certain demographic groups (e.g., individuals aged 10 to 30 years) are not included. Additionally, monitoring was limited to the cold season, which prevents an analysis of seasonal fluctuations in hot-water consumption. Lastly, the inability to separately monitor hot- and cold-water consumption for the majority of showers introduces some uncertainty in the assessment of total hot-water consumption. Therefore, future research will aim to expand the household sample—including data from different geographic regions—and extend the monitoring to other seasons to further enhance understanding of residential hot-water consumption.

Supplementary Materials

The following supporting information can be downloaded at: https://www.mdpi.com/article/10.3390/w17131906/s1, Microsoft Excel® spreadsheet S1 (“Water consumption data.xlsx”): hot-, cold- and unknown water consumption data collected at each fixture of households H1–H5.

Author Contributions

Conceptualization, F.M., V.M. and S.A.; methodology, F.M., V.M. and S.A.; software, F.M., V.M. and S.A.; validation, F.M., V.M. and S.A.; formal analysis, F.M. and V.M.; investigation, F.M. and V.M.; resources, F.M., V.M. and S.A.; data curation, F.M. and V.M.; writing—original draft preparation, F.M. and V.M.; writing—review and editing, F.M., V.M. and S.A.; visualization, F.M., V.M. and S.A.; supervision, S.A. All authors have read and agreed to the published version of the manuscript.

Funding

This research received no external funding.

Data Availability Statement

The original contributions presented in this study are included in the article/Supplementary Materials. Further inquiries can be directed to the corresponding author.

Conflicts of Interest

The authors declare no conflicts of interest.

Abbreviations

The following abbreviations are used in this manuscript:
BTBathroom taps
DWDishwasher
FToilet flusher
KSKitchen sink
SShower
WMWashing machine

References

  1. Morain, A.; Ilangovan, N.; Delhom, C.; Anandhi, A. Artificial Intelligence for Water Consumption Assessment: State of the Art Review. Water Resour. Manag. 2024, 38, 3113–3134. [Google Scholar] [CrossRef]
  2. Zanfei, A.; Menapace, A.; Brentan, B.M.; Righetti, M.; Herrera, M. Novel Approach for Burst Detection in Water Distribution Systems Based on Graph Neural Networks. Sustain. Cities Soc. 2022, 86, 104090. [Google Scholar] [CrossRef]
  3. Marsili, V.; Mazzoni, F.; Alvisi, S.; Franchini, M. From Pressure to Water Consumption: Exploiting High-Resolution Pressure Data to Investigate the End Uses of Water. Water Resour. Manag. 2024, 38, 4969–4985. [Google Scholar] [CrossRef]
  4. Aksela, K.; Aksela, M. Demand Estimation with Automated Meter Reading in a Distribution Network. J. Water Resour. Plan. Manag. 2011, 137, 456–467. [Google Scholar] [CrossRef]
  5. Cardell-Oliver, R.; Wang, J.; Gigney, H. Smart Meter Analytics to Pinpoint Opportunities for Reducing Household Water Use. J. Water Resour. Plan. Manag. 2016, 142, 04016007. [Google Scholar] [CrossRef]
  6. Koop, S.H.A.; Clevers, S.H.P.; Blokker, E.J.M.; Brouwer, S. Public Attitudes towards Digital Water Meters for Households. Sustainability 2021, 13, 6440. [Google Scholar] [CrossRef]
  7. Cominola, A.; Nguyen, K.A.; Giuliani, M.; Stewart, R.A.; Maier, H.R.; Castelletti, A. Data Mining to Uncover Heterogeneous Water Use Behaviors from Smart Meter Data. Water Resour. Res. 2019, 55, 9315–9333. [Google Scholar] [CrossRef]
  8. Mazzoni, F.; Alvisi, S.; Blokker, M.; Buchberger, S.G.; Castelletti, A.; Cominola, A.; Gross, M.P.; Jacobs, H.E.; Mayer, P.; Steffelbauer, D.B.; et al. Investigating the Characteristics of Residential End Uses of Water: A Worldwide Review. Water Res. 2023, 230, 119500. [Google Scholar] [CrossRef]
  9. Mazzoni, F.; Marsili, V.; Alvisi, S.; Franchini, M. Detection and Pre-localization of Anomalous Consumption Events in Water Distribution Networks through Automated, Pressure-Based Methodology. Water Resour. Ind. 2024, 36, 100255. [Google Scholar] [CrossRef]
  10. Clifford, E.; Mulligan, S.; Comer, J.; Hannon, L. Flow-Signature Analysis of Water Consumption in Nonresidential Building Water Networks Using High-Resolution and Medium-Resolution Smart Meter Data: Two Case Studies. Water Resour. Res. 2018, 54, 88–106. [Google Scholar] [CrossRef]
  11. Cominola, A.; Giuliani, M.; Castelletti, A.; Maier, H.R.; Stewart, R.A.; Ochoa-Ruiz, E.; Causapé, J.; Porta, F. Data Mining Techniques for the Analysis of Water Consumption Data. Environ. Model. Softw. 2015, 72, 28–40. [Google Scholar] [CrossRef]
  12. Britton, T.C.; Stewart, R.A.; O’Halloran, K.R. Smart Metering: Enabler for Rapid and Effective Post Meter Leakage Identification and Water Loss Management. J. Clean. Prod. 2013, 54, 166–176. [Google Scholar] [CrossRef]
  13. Luciani, C.; Casellato, F.; Alvisi, S.; Franchini, M. Green Smart Technology for Water (GST4Water): Water Loss Identification at User Level by Using Smart Metering Systems. Water 2019, 11, 405. [Google Scholar] [CrossRef]
  14. Willis, R.M.; Stewart, R.A.; Panuwatwanich, K.; Jones, S.; Kyriakides, A. Alarming Visual Display Monitors Affecting Shower End Use Water and Energy Conservation in Australian Residential Households. Resour. Conserv. Recycl. 2010, 54, 1117–1127. [Google Scholar] [CrossRef]
  15. Salomons, E.; Housh, M. Smart Water Meters Can Save Lives During the COVID-19 Pandemic. J. Water Resour. Plan. Manag. 2022, 148, 02522003. [Google Scholar] [CrossRef]
  16. Mazzoni, F.; Blokker, M.; Alvisi, S.; Franchini, M. An Enhanced Method for Automated End-Use Classification of Household Water Data. J. Hydroinform. 2024, 26, 408–423. [Google Scholar] [CrossRef]
  17. Chmielewska, A.; Szulgowska-Zgrzywa, M.; Danielewicz, J. Domestic Hot Water Consumption in Multiapartment Buildings. E3S Web Conf. 2017, 17, 00014. [Google Scholar] [CrossRef]
  18. George, D.; Pearre, N.S.; Swan, L.G. High Resolution Measured Domestic Hot Water Consumption of Canadian Homes. Energy Build. 2015, 109, 304–315. [Google Scholar] [CrossRef]
  19. Kitzberger, T.; Kilian, D.; Kotik, J.; Pröll, T. Comprehensive Analysis of the Performance and Intrinsic Energy Losses of Centralized Domestic Hot Water (DHW) Systems in Commercial (Educational) Buildings. Energy Build. 2019, 195, 126–137. [Google Scholar] [CrossRef]
  20. de Santiago, J.; Rodriguez-Villalón, O.; Sicre, B. The Generation of Domestic Hot Water Load Profiles in Swiss Residential Buildings through Statistical Predictions. Energy Build. 2017, 141, 341–348. [Google Scholar] [CrossRef]
  21. Sørensen, Å.L.; Walnum, H.T.; Sartori, I.; Andresen, I.A. Energy Flexibility Potential of Domestic Hot Water Systems in Apartment Buildings. E3S Web Conf. 2021, 246, 11005. [Google Scholar] [CrossRef]
  22. Binks, A.N.; Kenway, S.J.; Lant, P.A.; Head, B.W. Understanding Australian household water-related energy use and identifying physical and human characteristics of major end uses. J. Clean. Prod. 2016, 135, 892–906. [Google Scholar] [CrossRef]
  23. Blokker, M.; Agudelo-Vera, C.; Moerman, A.; van Thienen, P.; Pieterse-Quirijns, I. Review of Applications for SIMDEUM, a Stochastic Drinking Water Demand Model with a Small Temporal and Spatial Scale. Drinking Water Eng. Sci. 2017, 10, 1–12. [Google Scholar] [CrossRef]
  24. Chen, L.; Rosenquist, G.; Walker, I.; Meyers, B.; Wyatt, R. Calculating Average Hot Water Mixes of Residential Plumbing Fittings: Using the ANSI 301-2019 Hot Water Draw Model and National Residential Data to Estimate Hot Water Use in Showerheads and Lavatory Faucets; Lawrence Berkeley National Laboratory: Berkeley, CA, USA, 2020; Report No. LBNL-2001352. [Google Scholar]
  25. Meireles, I.; Sousa, V.; Bleys, B.; Poncelet, B. Domestic Hot Water Consumption Pattern: Relation with Total Water Consumption and Air Temperature. Renew. Sustain. Energy Rev. 2022, 157, 112035. [Google Scholar] [CrossRef]
  26. Edwards, S.; Beausoleil-Morrison, I.; Laperrière, A. Representative Hot Water Draw Profiles at High Temporal Resolution for Simulating the Performance of Solar Thermal Systems. Solar Energy 2015, 111, 43–52. [Google Scholar] [CrossRef]
  27. Verhaert, I.; Bleys, B.; Binnemans, S.; Janssen, E. A Methodology to Design Domestic Hot Water Production Systems Based on Tap Patterns. In Proceedings of the 12th REHVA World Congress CLIMA 2016, Aalborg, Denmark, 22–25 May 2016; Volume 3, pp. 1–10. [Google Scholar]
  28. Chao, P.R.; Umapathi, S.; Saman, W. Water Consumption Characteristics at a Sustainable Residential Development with Rainwater-Sourced Hot Water Supply. J. Clean. Prod. 2015, 109, 190–202. [Google Scholar] [CrossRef]
  29. DeOreo, W.B.; Mayer, P.W.; Dziegielewski, B.; Kiefer, J. Residential End Uses of Water, Version 2; Water Research Foundation: Denver, CO, USA, 2016. [Google Scholar]
  30. Canale, L.; Cholewa, T.; Ficco, G.; Siuta-Olcha, A.; Di Pietra, B.; Kołodziej, P.; Dell’Isola, M. The role of individual metering in reducing domestic hot water consumption in residential buildings: A long-term evaluation. J. Build. Eng. 2023, 73, 106734. [Google Scholar] [CrossRef]
  31. Henderson, H.; Wade, J. Disaggregating Hot Water Use and Predicting Hot Water Waste in Five Test Homes; U.S. Department of Energy, Office of Scientific and Technical Information: Washington, DC, USA, 2014. [Google Scholar] [CrossRef]
  32. Lee, J.Y.; Yim, T. Energy and Flow Demand Analysis of Domestic Hot Water in an Apartment Complex Using a Smart Meter. Energy 2021, 229, 120678. [Google Scholar] [CrossRef]
  33. Perlman, M.; Mills, B.E. Development of residential water use patterns. ASHRAE Trans. 1985, 91, 657–679. [Google Scholar]
  34. Meyer, J.P.; Tshimankinda, M. Domestic Hot Water Consumption By Developing Communities In South African Traditional Houses. Energy 1996, 21, 1101–1106. [Google Scholar] [CrossRef]
  35. Makonin, S.; Ellert, B.; Bajic, I.V.; Popowich, F. Electricity, Water, and Natural Gas Consumption of a Residential House in Canada from 2012 to 2014. Sci. Data 2016, 3, 160037. [Google Scholar] [CrossRef] [PubMed]
  36. Ahmed, K.; Pylsy, P.; Kurnitski, J. Hourly Consumption Profiles of Domestic Hot Water for Different Occupant Groups in Dwellings. Solar Energy 2016, 137, 516–530. [Google Scholar] [CrossRef]
  37. Kempton, W. Residential Hot Water: A Behaviorally-Driven System. Energy 1988, 13, 107–114. [Google Scholar] [CrossRef]
  38. Abrams, D.W.; Shedd, A.C. Effect of Seasonal Changes in Use Patterns and Cold Inlet Water Temperature on Water-Heating Loads. ASHRAE Trans. 1996, 102, 1038–1053. [Google Scholar]
  39. Lowenstein, A.; Hiller, C.C. Disaggregating Residential Hot Water Use—Part II. ASHRAE Trans. 1998, 104, 1852–1863. [Google Scholar]
  40. Henze, G.P.; Tiller, D.K.; Fischer, M.A.; Rieger, M. Comparison of Event Inference and Flow Trace Signature Methods for Hot Water End-Use Analysis. ASHRAE Trans. 2002, 108, 467–479. [Google Scholar]
  41. Energy Monitoring Company. Measurement of Domestic Hot Water Consumption in Dwellings; Department for Environment, Food and Rural Affairs (DEFRA): London, UK, 2008. [Google Scholar]
  42. Schoenbauer, B.; Bohac, D.; Hewett, M. Measured Residential Hot Water End Use. ASHRAE Trans. 2012, 118, 872–889. [Google Scholar]
  43. Mayer, P.W.; DeOreo, W.B.; Lewis, D.M. Seattle Home Water Conservation Study: The Impacts of High Efficiency Plumbing Fixture Retrofits in Single-Family Homes; AWWA Research Foundation: Denver, CO, USA, 2000. [Google Scholar]
  44. Mayer, P.W.; DeOreo, W.B.; Towler, E.; Lewis, D.M. Residential Indoor Water Conservation Study: Evaluation of High Efficiency Indoor Plumbing Fixture Retrofits in Single-Family Homes in the East Bay Municipal Utility District Service Area; AWWA Research Foundation: Denver, CO, USA, 2003. [Google Scholar]
  45. Vitter, J.S.; Webber, M. Water Event Categorization Using Sub-Metered Water and Coincident Electricity Data. Water 2018, 10, 714. [Google Scholar] [CrossRef]
  46. Edwards, K.; Martin, L. A Methodology for Surveying Domestic Water Consumption. Water Environ. J. 1995, 9, 477–488. [Google Scholar] [CrossRef]
  47. Widén, J.; Lundh, M.; Wäckelgård, E.; Vassileva, I.; Dahlquist, E.; Ellegaard, K. Constructing Load Profiles for Household Electricity and Hot Water from Time-Use Data—Modelling Approach and Validation. Energy Build. 2009, 41, 753–768. [Google Scholar] [CrossRef]
  48. Marszal-Pomianowska, A.; Valeva, B.T.; Georgieva, V.V.; Kalyanova Larsen, O.; Jensen, R.L.; Zhang, C. High Resolution Measuring System for Domestic Hot Water Consumption: Development and Field Test. Energy Procedia 2019, 158, 2859–2864. [Google Scholar] [CrossRef]
  49. Marszal-Pomianowska, A.; Jensen, R.L.; Pomianowski, M.; Larsen, O.K.; Jørgensen, J.S.; Knudsen, S.S. Comfort of Domestic Water in Residential Buildings: Flow, Temperature and Energy in Draw-Off Points: Field Study in Two Danish Detached Houses. Energies 2021, 14, 3314. [Google Scholar] [CrossRef]
  50. Arsene, D.; Predescu, A.; Pahontu, B.; Chiru, C.G.; Apostol, E.-S.; Truică, C.-O. Advanced Strategies for Monitoring Water Consumption Patterns in Households Based on IoT and Machine Learning. Water 2022, 14, 2187. [Google Scholar] [CrossRef]
  51. Sborz, J.; Cominato, C.; Kalbusch, A.; Henning, E. Hourly and Daily Domestic Hot Water Consumption in Social Housing Dwellings: An Analysis in Apartment Buildings in Southern Brazil. Sol. Energy 2022, 232, 459–470. [Google Scholar] [CrossRef]
  52. Sborz, J.; Kalbusch, A.; Henning, E. Factors That Determine Hot and Cold-Water Consumption in Social Housing Apartments. Archit. Eng. Des. Manag. 2024, 20, 1669–1686. [Google Scholar] [CrossRef]
  53. Mazzoni, F.; Alvisi, S.; Franchini, M.; Ferraris, M.; Kapelan, Z. Automated Household Water End-Use Disaggregation through Rule-Based Methodology. J. Water Resour. Plan. Manag. 2021, 147, 04021024. [Google Scholar] [CrossRef]
  54. Gerin, O.; Bleys, B.; De Cuyper, K. Seasonal Variation of Hot and Cold Water Consumption in Apartment Buildings. In Proceedings of the CIB W062 Symposium 2014, São Paulo, Brazil, 8–10 September 2014; pp. 1–9. Available online: https://www.wtcb.be/homepage/download.cfm?dtype=research&doc=A2_1523.pdf&lang=en (accessed on 9 May 2025).
  55. Ahmed, K.; Pylsy, P.; Kurnitski, J. Monthly Domestic Hot Water Profiles for Energy Calculation in Finnish Apartment Buildings. Energy Build. 2015, 97, 77–85. [Google Scholar] [CrossRef]
  56. Cole, G.; Stewart, R.A. Smart Meter Enabled Disaggregation of Urban Peak Water Demand: Precursor to Effective Urban Water Planning. Urban Water J. 2013, 10, 174–194. [Google Scholar] [CrossRef]
  57. Beal, C.D.; Stewart, R.A.; Williams, P.R.; Hacker, C.H.; Emmonds, S.C.; Capati, G. Residential Potable and Recycled Water End Uses in a Dual Reticulated Supply System. Desalination 2011, 272, 201–211. [Google Scholar] [CrossRef]
  58. Redhead, M.; Athuraliya, A.; Brown, A.; Gan, K.; Ghobadi, C.; Jones, C.; Nelson, L.; Quillam, M.; Roberts, P.; Siriwardene, N. Final Report: Melbourne Residential Water End Uses Winter 2010/Summer 2012; City West Water, South East Water, and Yarra Valley Water: Melbourne, VIC, Australia, 2013. [Google Scholar]
Figure 1. Study layout.
Water 17 01906 g001
Figure 2. (a) Percent values of the cold, hot, and unknown (i.e., mixed) water consumption in the monitored households; (b) Percent values of the cold, hot, and unknown water consumption per end-use category. DW = dishwasher; KS = kitchen sink; WM = washing machine; S = shower; BT = bathroom taps; F = toilet flusher.
Water 17 01906 g002
Figure 3. (a) Box-whisker plot of the daily per capita water-consumption profiles (total water) in the monitored households; (b) daily (normalized) water-consumption profiles—along with cold-water share and combination of hot- and unknown (i.e., mixed-) water share—in the monitored households.
Water 17 01906 g003
Figure 4. Daily (normalized) water-consumption profiles for working days and holidays, along with: (a) cold-water share; (b) hot- and unknown (i.e., mixed-) water share.
Water 17 01906 g004
Figure 5. Daily (normalized) water-consumption profiles—along the cold- and the hot-water share—for different end-use categories: (a) kitchen sink; (b) shower; (c) bathroom taps. Kitchen-sink and bathroom-tap profiles refer to households H1–H5, whereas shower profiles refer only to household H5 because of the impossibility of discriminating between cold- and hot-water consumption in the H1–H4 showers.
Water 17 01906 g005
Table 1. Sample households: occupancy rate, domestic end uses and monitored period.
HouseholdOccupancy
Rate
(Persons)
DWKSWMSBTFMonitoring
Period
(Days)
Period with Available Data
(Days)
Period with
Consumption
(Days)
H11011121131128108
H21111121136133111
H321111211351717
H431122421354242
H531111521377474
Total104566157674394352
Note: DW = dishwasher; KS = kitchen sink; WM = washing machine; S = shower; BT = bathroom taps; F = toilet flusher.
Table 2. Aggregate water consumption (total, cold, hot and unknown water) of the monitored household sample.
HouseholdTotal Water
(L/Person/Day)
Cold Water
(L/Person/Day)
Hot Water
(L/Person/Day)
Unknown Water * (L/Person/Day)
H1127.986.233.97.8
H291.975.112.14.7
H3113.558.343.711.5
H4123.994.223.36.4
H576.750.526.20.0
Average106.772.827.86.1
Note: * Unknown water (i.e., mixed hot and cold water measured by a single smart meter) is due to the impossibility of discriminating between cold and hot-water consumption in household H1–H4 showers.
Table 3. Water consumption (total, hot, cold water) for each end-use category of the monitored household sample.
HouseholdTotal Water
(L/Person/Day)
Cold Water
(L/Person/Day)
Hot Water
(L/Person/Day)
DWKSWMSBTFDWKSWMS *BTFKSS *BT
H1-29.815.47.827.047.8-11.915.4-11.047.817.9-16.0
H25.016.110.04.726.529.65.015.810.0-14.729.60.3-11.8
H32.121.810.411.526.940.72.12.410.4-22.640.719.4-24.3
H42.123.137.66.412.741.82.19.337.6-3.341.813.8-9.4
H52.323.211.69.915.214.52.316.311.60.45.414.56.99.59.8
Average2.322.817.08.121.734.92.311.117.0-7.434.911.7-14.3
Note: DW = dishwasher; KS = kitchen sink; WM = washing machine; S = shower; BT = bathroom taps; F = toilet flusher; * Only results for household H5 are reported because of the impossibility of discriminating between cold- and hot-water consumption in the H1–H4 showers.
Table 4. Aggregate and end-use hot-water ratio of the monitored household sample.
HouseholdHot-Water Ratio, HWR (%)
AggregateDWKSWMS *BTF
H126.5–32.6-60.00.0-59.20.0
H213.1–18.30.01.70.0-44.50.0
H338.5–48.60.088.90.0-90.30.0
H418.8–23.90.059.80.0-74.00.0
H534.20.029.70.096.364.60.0
Average26.1–31.70.051.30.0-65.80.0
Note: DW = dishwasher; KS = kitchen sink; WM = washing machine; S = shower; BT = bathroom taps; F = toilet flusher; * Only results for household H5 are reported because of the impossibility of discriminating between cold- and hot-water consumption in the H1–H4 showers.
Disclaimer/Publisher’s Note: The statements, opinions and data contained in all publications are solely those of the individual author(s) and contributor(s) and not of MDPI and/or the editor(s). MDPI and/or the editor(s) disclaim responsibility for any injury to people or property resulting from any ideas, methods, instructions or products referred to in the content.

