Article

Analysis of Open-Water Changes and Ice Microstructure Characteristics in Different River Channel Types of the Yellow River in Inner Mongolia Based on Satellite Images and Field Sampling

1
State Key Laboratory of Coastal and Offshore Engineering, Dalian University of Technology, Dalian 116024, China
2
School of Energy and Environment, Inner Mongolia University of Science and Technology, Baotou 014010, China
*
Author to whom correspondence should be addressed.
Water 2025, 17(13), 1898; https://doi.org/10.3390/w17131898
Submission received: 9 May 2025 / Revised: 13 June 2025 / Accepted: 24 June 2025 / Published: 26 June 2025

Abstract

The formation and evolution of ice in the Yellow River represent complex dynamic processes. To elucidate the structural characteristics of ice crystals and their governing mechanisms in the Inner Mongolia reach, this investigation utilized high-resolution Sentinel-2 satellite imagery to systematically monitor spatiotemporal variations in open-water formations across diverse channel morphologies throughout the ice regime period. Systematic ice sampling was conducted across diverse channel morphologies of the Yellow River to quantify critical parameters, including crystalline structure characteristics, equivalent diameter distributions, density variations, and sediment content profiles. The results indicate the transformation of open water resulting from various river configurations during the freezing season exhibits distinct characteristics, which are significantly influenced by temperature variations. Ice crystal characterization exhibits that the crystalline structure predominantly manifests as two primary forms: columnar and granular ice formations, with their distribution varying systematically across different channel configurations. Ice crystal morphology exhibits heterogeneity in both form and dimensional characteristics. Columnar ice consistently exhibits larger equivalent diameters compared to granular ice formations. A progressive enhancement in the equivalent diameter of crystals is observed along the vertical axis corresponding to the thickness of the ice during the growth process. The ranges of variation in ice crystal size, ice density, and mud content within ice exhibit differences contingent upon the specific crystal structures present. Observational studies and comparative analyses of ice samples from the Inner Mongolia reach of the Yellow River reveal that channel morphology, ambient thermal conditions, and hydrodynamic parameters are the primary determinants governing the variability in ice microstructure and its associated physical characteristics. This investigation provides fundamental scientific insights and quantitative data that advance our understanding of river ice microstructural characteristics.

1. Introduction

In high-latitude regions of northern China, rivers, lakes, and reservoirs are susceptible to severe ice-related hazards during winter periods due to extreme temperature conditions. The Yellow River, as a major watercourse in northern China, presents particularly challenging ice-related phenomena due to its complex environmental conditions, extensive hazard zones, limited ice flood forecasting windows, and significant mitigation challenges. Consequently, ice-related disasters along the Yellow River represent one of the most critical and severe natural hazards in the region [1]. Ice floes encounter significant impediments at channel constrictions, shallow shoals, acute bends, meandering sections, and bridge pier structures, resulting in increased ice concentration densities across various river segments. These accumulations severely constrict the channel cross-section, leading to substantial upstream water level elevation. The subsequent formation of ice jams and ice dams presents significant flood hazard potential, posing substantial risks to riparian communities and infrastructure along both riverbanks [2,3,4]. River ice, as a natural composite material, constitutes a significant element within the field of Cryosphere Science [5]. The properties of river ice exhibit variability based on regional and temporal factors, primarily influenced by diverse environmental conditions. The processes governing the formation and transformation of ice on the Yellow River are notably intricate and dynamic. In recent years, this phenomenon has garnered extensive scholarly attention, with researchers employing various methodologies, including remote sensing, empirical measurement, and numerical simulation, to investigate it more thoroughly [6,7]. The ice microstructure, which constitutes the fundamental internal architecture, is characterized by three primary components: stratification patterns, crystalline structure, and incorporated impurities [8]. The microstructural configuration of ice serves as a fundamental determinant of its intrinsic characteristics, fundamentally governing its physical properties, including density parameters and sediment incorporation patterns [9]. The development and evolution of river ice are influenced by the presence of crystals. In addition to indirectly influencing the interaction and destructive power between ice and structures, the spatial distribution of ice crystals has a direct impact on the mechanical strength of the ice layer. As a result, studying the crystal structure of ice and the elements that influence it can theoretically support the microstructural properties of ice and serve as the foundation for research on ice engineering.
In relation to the related research on the microstructure of ice, Michel and Eicken [10,11] identified the various forms of ice in the 1970s and 1980s, refined the various types of ice, and examined the size characteristics of various types of ice crystals. Langway proposed a technique for observing the microstructure of ice using a Fisher stage, which yielded parameters like the size distribution, c-axis orientation, bubble size and content in the ice, and crystal type [12]. Wilen [13] also suggested an automatic ice structure analyzer based on the principle of polarization to observe and differentiate ice crystals. Arnaud [14] and Azuma et al. [15] collected information on the crystal structure, particle size, and shape of the ice by using cameras to record its microscopic structure. Using an electron microscope and a camera, Kipfstuhl [16] created high-resolution photographs of ice crystals by applying the microstructure mapping method to their observation. Li analyzed the formation causes of various crystal types by observing crystals on reservoir ice and combining the ice growth process [17]. Currently, ice microstructure study and observation technology are becoming more sophisticated. Various new methods for observing microstructures, including CT [18,19] and nuclear magnetic resonance [20,21], have also been used to observe the microstructure of ice and have achieved good results. The crystal structure of ice determines its physical and mechanical properties to a large extent. Experimental studies on the mechanical properties of ice show that the brittle strength of granular ice is inversely proportional to the square root of its crystal diameter [22], and the ultimate compressive strength of polycrystalline ice is directly proportional to the inverse of the square root of its particle size [23]. Gao et al. [24] performed three-point bending tests on ice samples exhibiting various crystal structures obtained from the Yellow River. Subsequently, they utilized the relationship between crystal structure and mechanical properties to forecast the river’s opening date. Deng used numerical simulation technology to find that there is a certain linear correlation between the uniaxial compression strength of ice and the grain size [25]. The microstructure of ice influences its acoustic, thermal, optical, and electrical properties, which in turn impact the ecological environment of subglacial waters. This microstructural influence forms the foundation for research in ice thermodynamics and remote sensing. Variations in ice types and crystal structures result in diverse thermal, optical, and electrical behaviors, thereby affecting the precision of remote sensing and radar observations [26,27]. Li et al. [28] employed ground-penetrating radar to measure the ice thickness of the Hongqipao Reservoir, revealing the growth patterns of reservoir ice and identifying that bubble content within the ice impacts radar measurement accuracy. Additionally, Li utilized Sentinel-2 remote sensing imagery and airborne radar to observe the ice thickness at the Shishifenzi Bend of the Yellow River across multiple scales, subsequently adjusting the radar dielectric constant to enhance monitoring accuracy for various ice types [29]. Cao et al. [30] utilized ground-penetrating radar to measure the ice thickness in two distinct river channel types: the Yellow River bend and areas around bridge piers. Their findings indicated that factors such as silt, entrapped bubbles, and ice temperature in the Yellow River ice contribute to variability in the propagation speed of radar waves through the ice layer. It is evident that the significance of microstructural features in observations across all scales is substantial. Investigating the structure and morphology of ice crystals, along with related parameters such as ice density, sediment content, and entrapped bubbles, enhances our understanding of the physical properties and damage mechanisms of ice. This research also provides essential theoretical support for the development of advanced ice physics models and the enhancement of remote sensing observation accuracy.
Advances in observational methodologies and technologies have enabled researchers to conduct extensive investigations into the microstructural characteristics of various ice formations, including lake ice [31,32], sea ice [33,34], reservoir ice [35,36], glacier ice [37,38], and polar ice in both Arctic and Antarctic regions [39,40], yielding significant findings. However, there are still few studies and quantitative analyses on river ice microstructures, such as ice crystals, ice density, mud content in ice, and bubbles. The composition, distribution, and morphological characteristics of impurities within ice matrices exhibit significant spatial heterogeneity across different geographical regions. The Yellow River, China’s second-largest watercourse, is characterized by complex hydrodynamic conditions and intricate flow evolution patterns. As the river with the highest sediment concentration globally, its unique characteristics, coupled with complex flow dynamics, result in highly variable crystalline compositions within its ice formations.
Currently, there is little research on ice crystals in the Yellow River, and many issues still need further study, including how to effectively observe the microstructure of ice and how to understand and describe the distribution and evolution of the ice structure in the Yellow River. Based on this, this paper observes and analyzes the basic physical properties of the Yellow River ice, such as its crystal structure, ice density, and mud content. Ice samples were collected from different river channel locations in the Inner Mongolia section of the Yellow River, and parameters such as the shape and size of ice crystals, their distribution, ice density, and mud content in the ice were observed. This investigation integrates analysis of Yellow River ice formation processes with detailed examination of its microstructural characteristics and physical parameters across diverse channel locations, elucidating spatial variations and distinctive patterns. Through comprehensive analysis of ice microstructure and fundamental parameters across different channel morphologies, this research advances our theoretical understanding of ice formation and distribution patterns in the Yellow River system. Furthermore, these findings provide a robust scientific framework for enhancing ice detection methodologies and improving early warning systems for ice-related hazards, including ice jam formation and ice dam development.

2. Materials and Methods

2.1. Study Area

The Inner Mongolia section of the Yellow River, situated at the northernmost extremity of the Yellow River Basin, traverses one league, five cities, and seventeen banners within Inner Mongolia. This section spans a total length of 840 km, with an elevation drop of 162.5 m. It encompasses five hydrological stations: Shizuishan, BayanGaole, Sanhuhekou, Baotou, and Toudaoguai. Owing to its high-latitude location and intricate riverine conditions, this section represents the most complex and challenging area for ice-related phenomena along the Yellow River. In this study, during the winter freezing period of 2023–2024, five different river channel types including straight river channels, curved river channels, single-line bridge channels, double-line bridge channels, and Shaxintan river channels from upstream to downstream in the Inner Mongolia section of the Yellow River were selected for ice collection. The sampling points were the Sanhu estuary hydrological station, under the Dachengxi Yellow River Bridge, the front and middle part of the Shishifenzi Bend and the lower open-water area, before and after the Qianfangzi double-track bridge, and the right bank of the Shaxintan river channel next to Qianfangzi village. A total of 8 ice blocks were collected. The Yellow River Basin map and the locations of different types of river channels are shown in Figure 1. The locations of sampling points at different river channels and their basic information are shown in Figure 1 and Table 1.

2.2. Open-Water Change Monitoring

The open-water areas formed by the selected sampling points were observed using the Sentinel-2 satellite. Sentinel-2 consists of two satellites, 2A and 2B, which complement each other and have a revisit period of 5 days. The satellite is equipped with a multispectral imager, with an orbit altitude of 786 km, an image width of 290 km, and 13 spectral bands. High-resolution images that have been geometrically, radiometrically, and atmospherically corrected are available through the Copernicus Open Access Hub (https://dataspace.copernicus.eu). In order to better obtain the formation process of open waters and different types of ice at different locations, Sentinel-2 satellite images acquired between December 2023 and March 2024 were utilized. Level-2A data with less than 30 percent cloud cover and a spatial resolution of 10 m, in which the ice surface was clearly visible, were selected. The chosen images were temporally distributed to ensure the inclusion of 1–2 images per month, resulting in 14 images per observation point over the four-month period. Remote sensing image processing was conducted using ArcMap 10.8 and ENVI 5.6 software. The post-classification comparison method was employed to continuously analyze changes in the ice surface and open-water areas based on the remote sensing imagery.

2.3. Ice Sample and Crystal Acquisition Method

Ice samples were extracted from stable ice surfaces utilizing chain saws, manual panel saws, and hand ice drill. To extract the ice sample, first use a chain saw to create grooves and cuts on the ice surface. If the ice sample does not separate, employ a manual panel saw to cut the edge of the ice surface. Finally, extract the ice sample vertically and steadily using a hand ice drill. The samples were subsequently preserved in cold storage facilities. To examine the microstructure, samples were vertically sectioned into uniform-thickness segments using a precision bone saw. Each ice segment was processed by planing one surface to achieve flatness, then adhered to a glass sheet to ensure optimal contact. To facilitate microscopic examination, the segments were further reduced to approxim no problemately 1 mm thick sections using a precision planer. The glass sheets were heated slightly, which let the ice sample adhere to the glasses easily. The thinner the ice crystal, the brighter its appearance under an orthogonal polarizing microscope, which conveniently distinguishes crystal boundaries and clarifies the shape of the individual crystal within the ice. These thin sections were analyzed using a polarizing microscope mounted on the Ferris Observatory to observe crystallographic structures. During the acquisition of the crystal image, a calibration scale was established. Utilizing various edge detection techniques based on the Canny operator, the dimensions of the crystals were extracted through the application of Adobe Photoshop, MATLAB, and Image J. Additionally, pertinent parameters, including calculations of equivalent diameter and other associated microstructural metrics, were determined.

3. Results

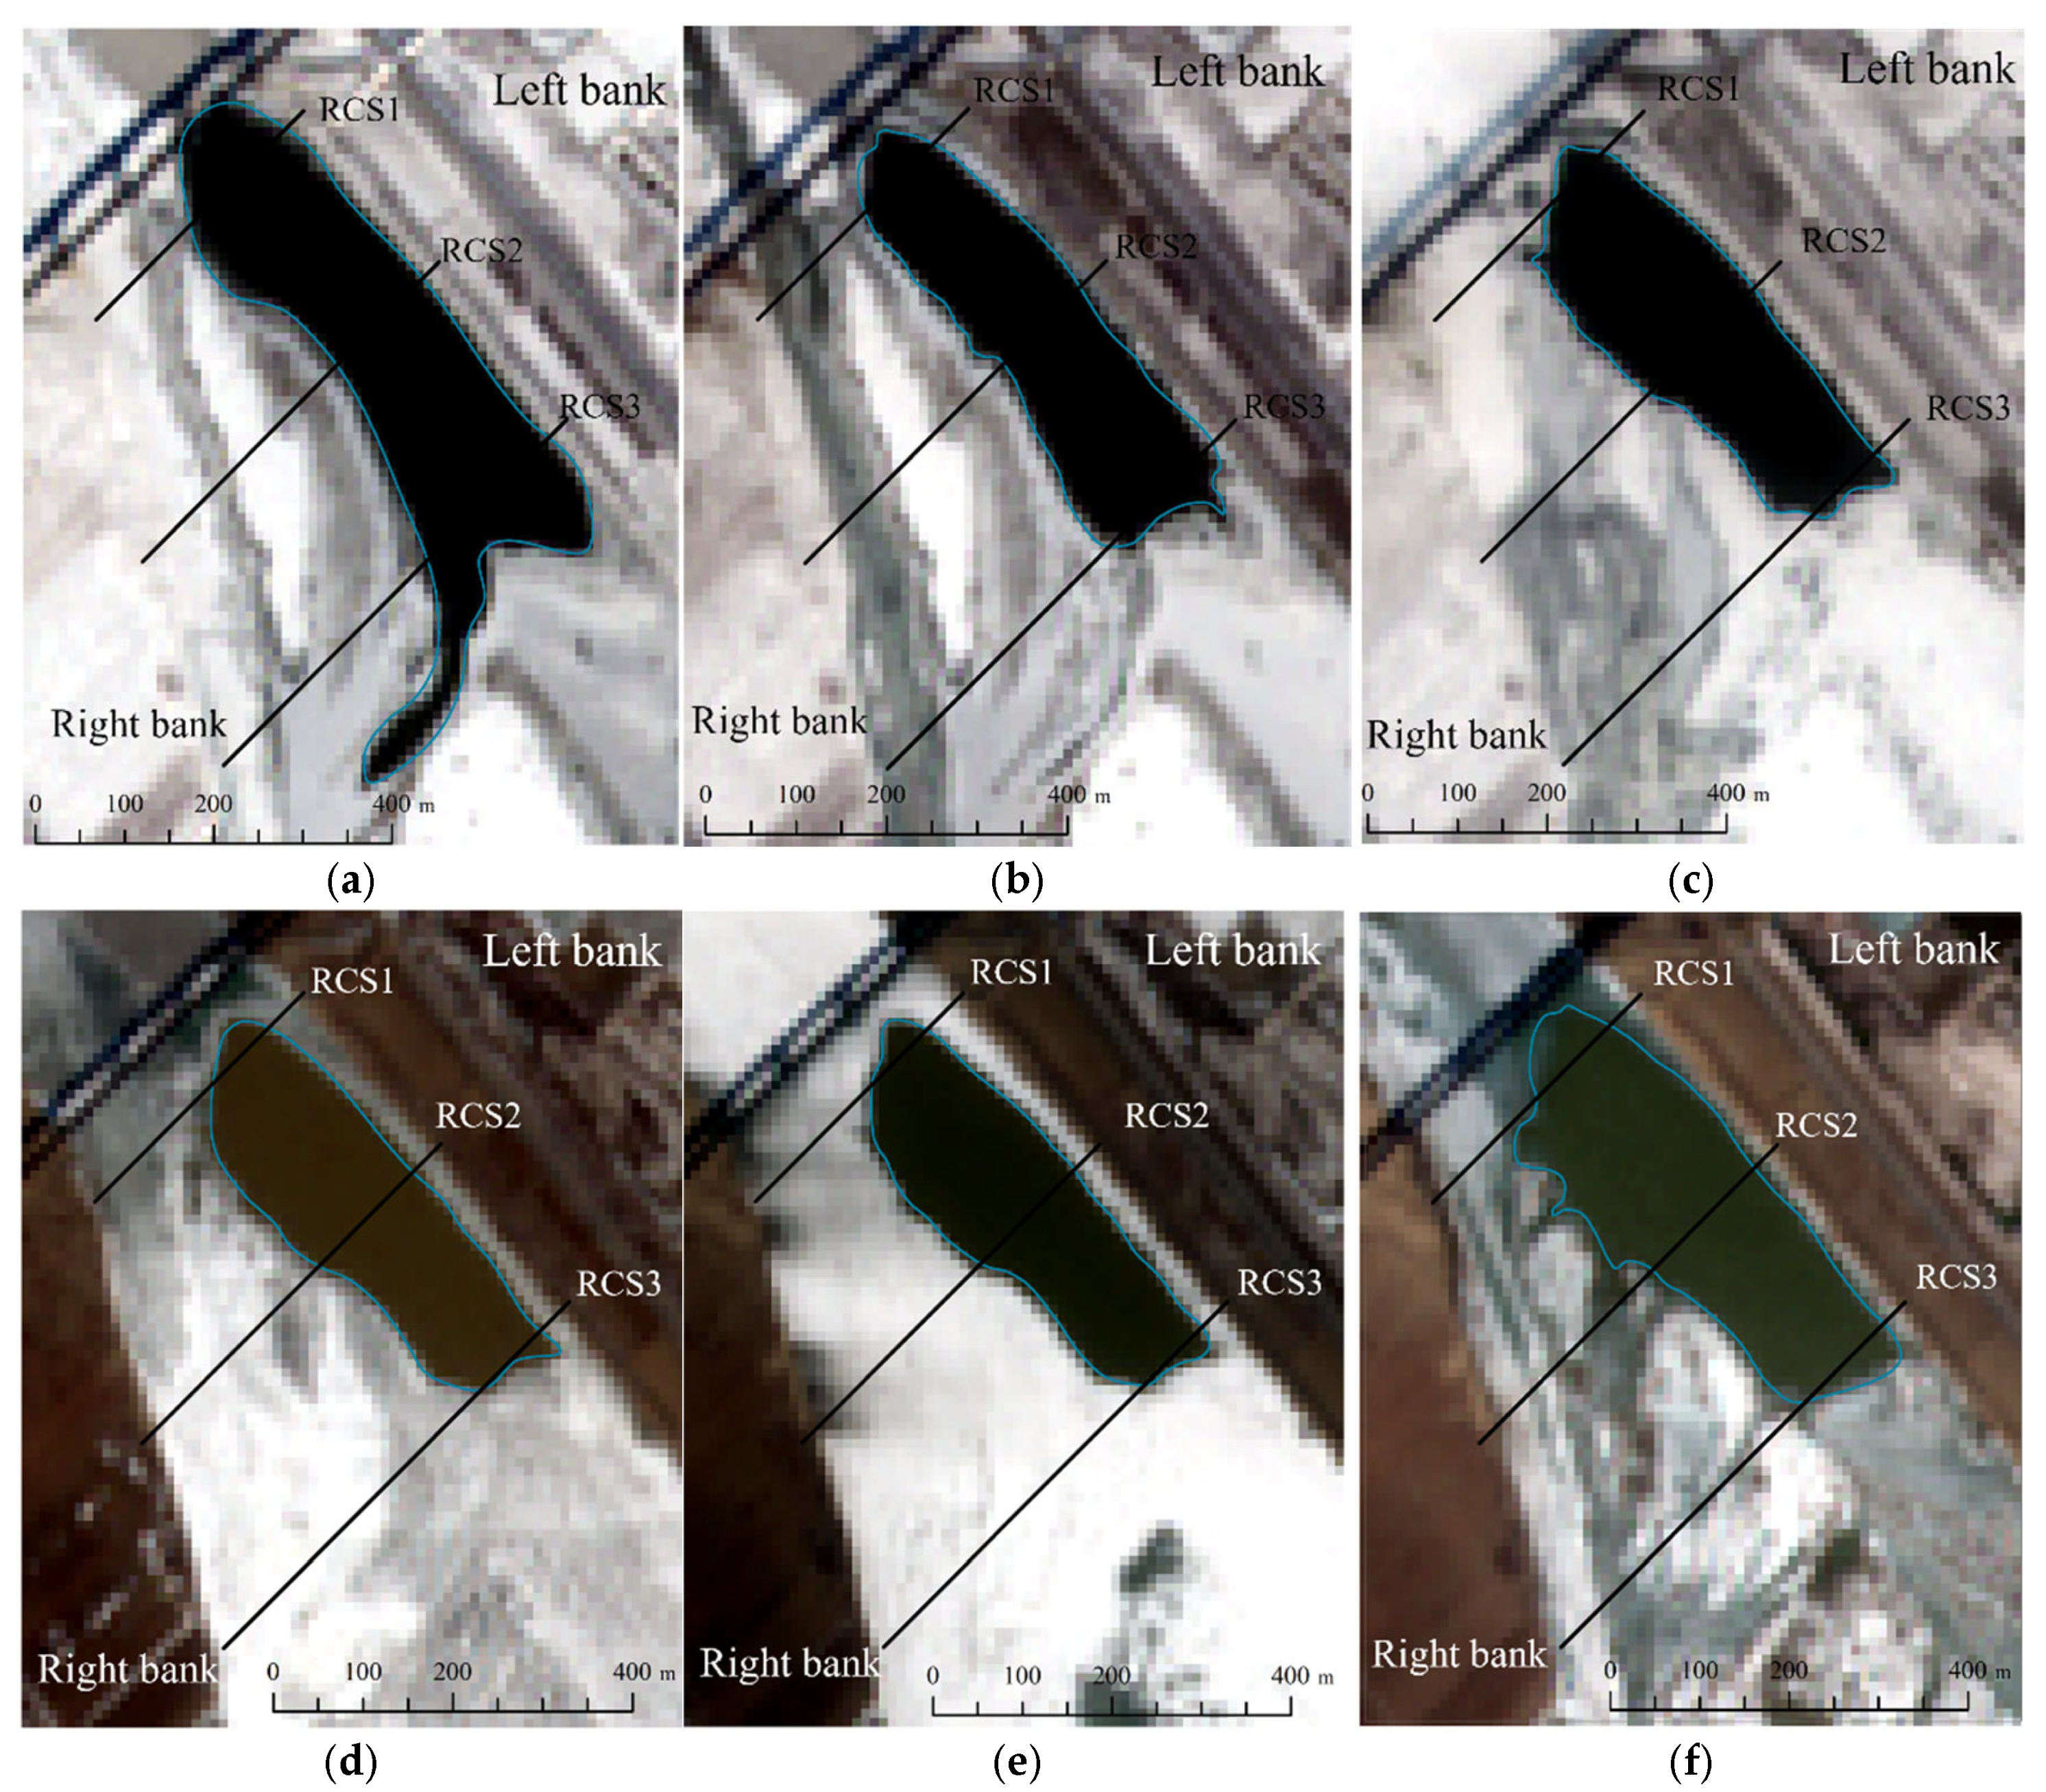
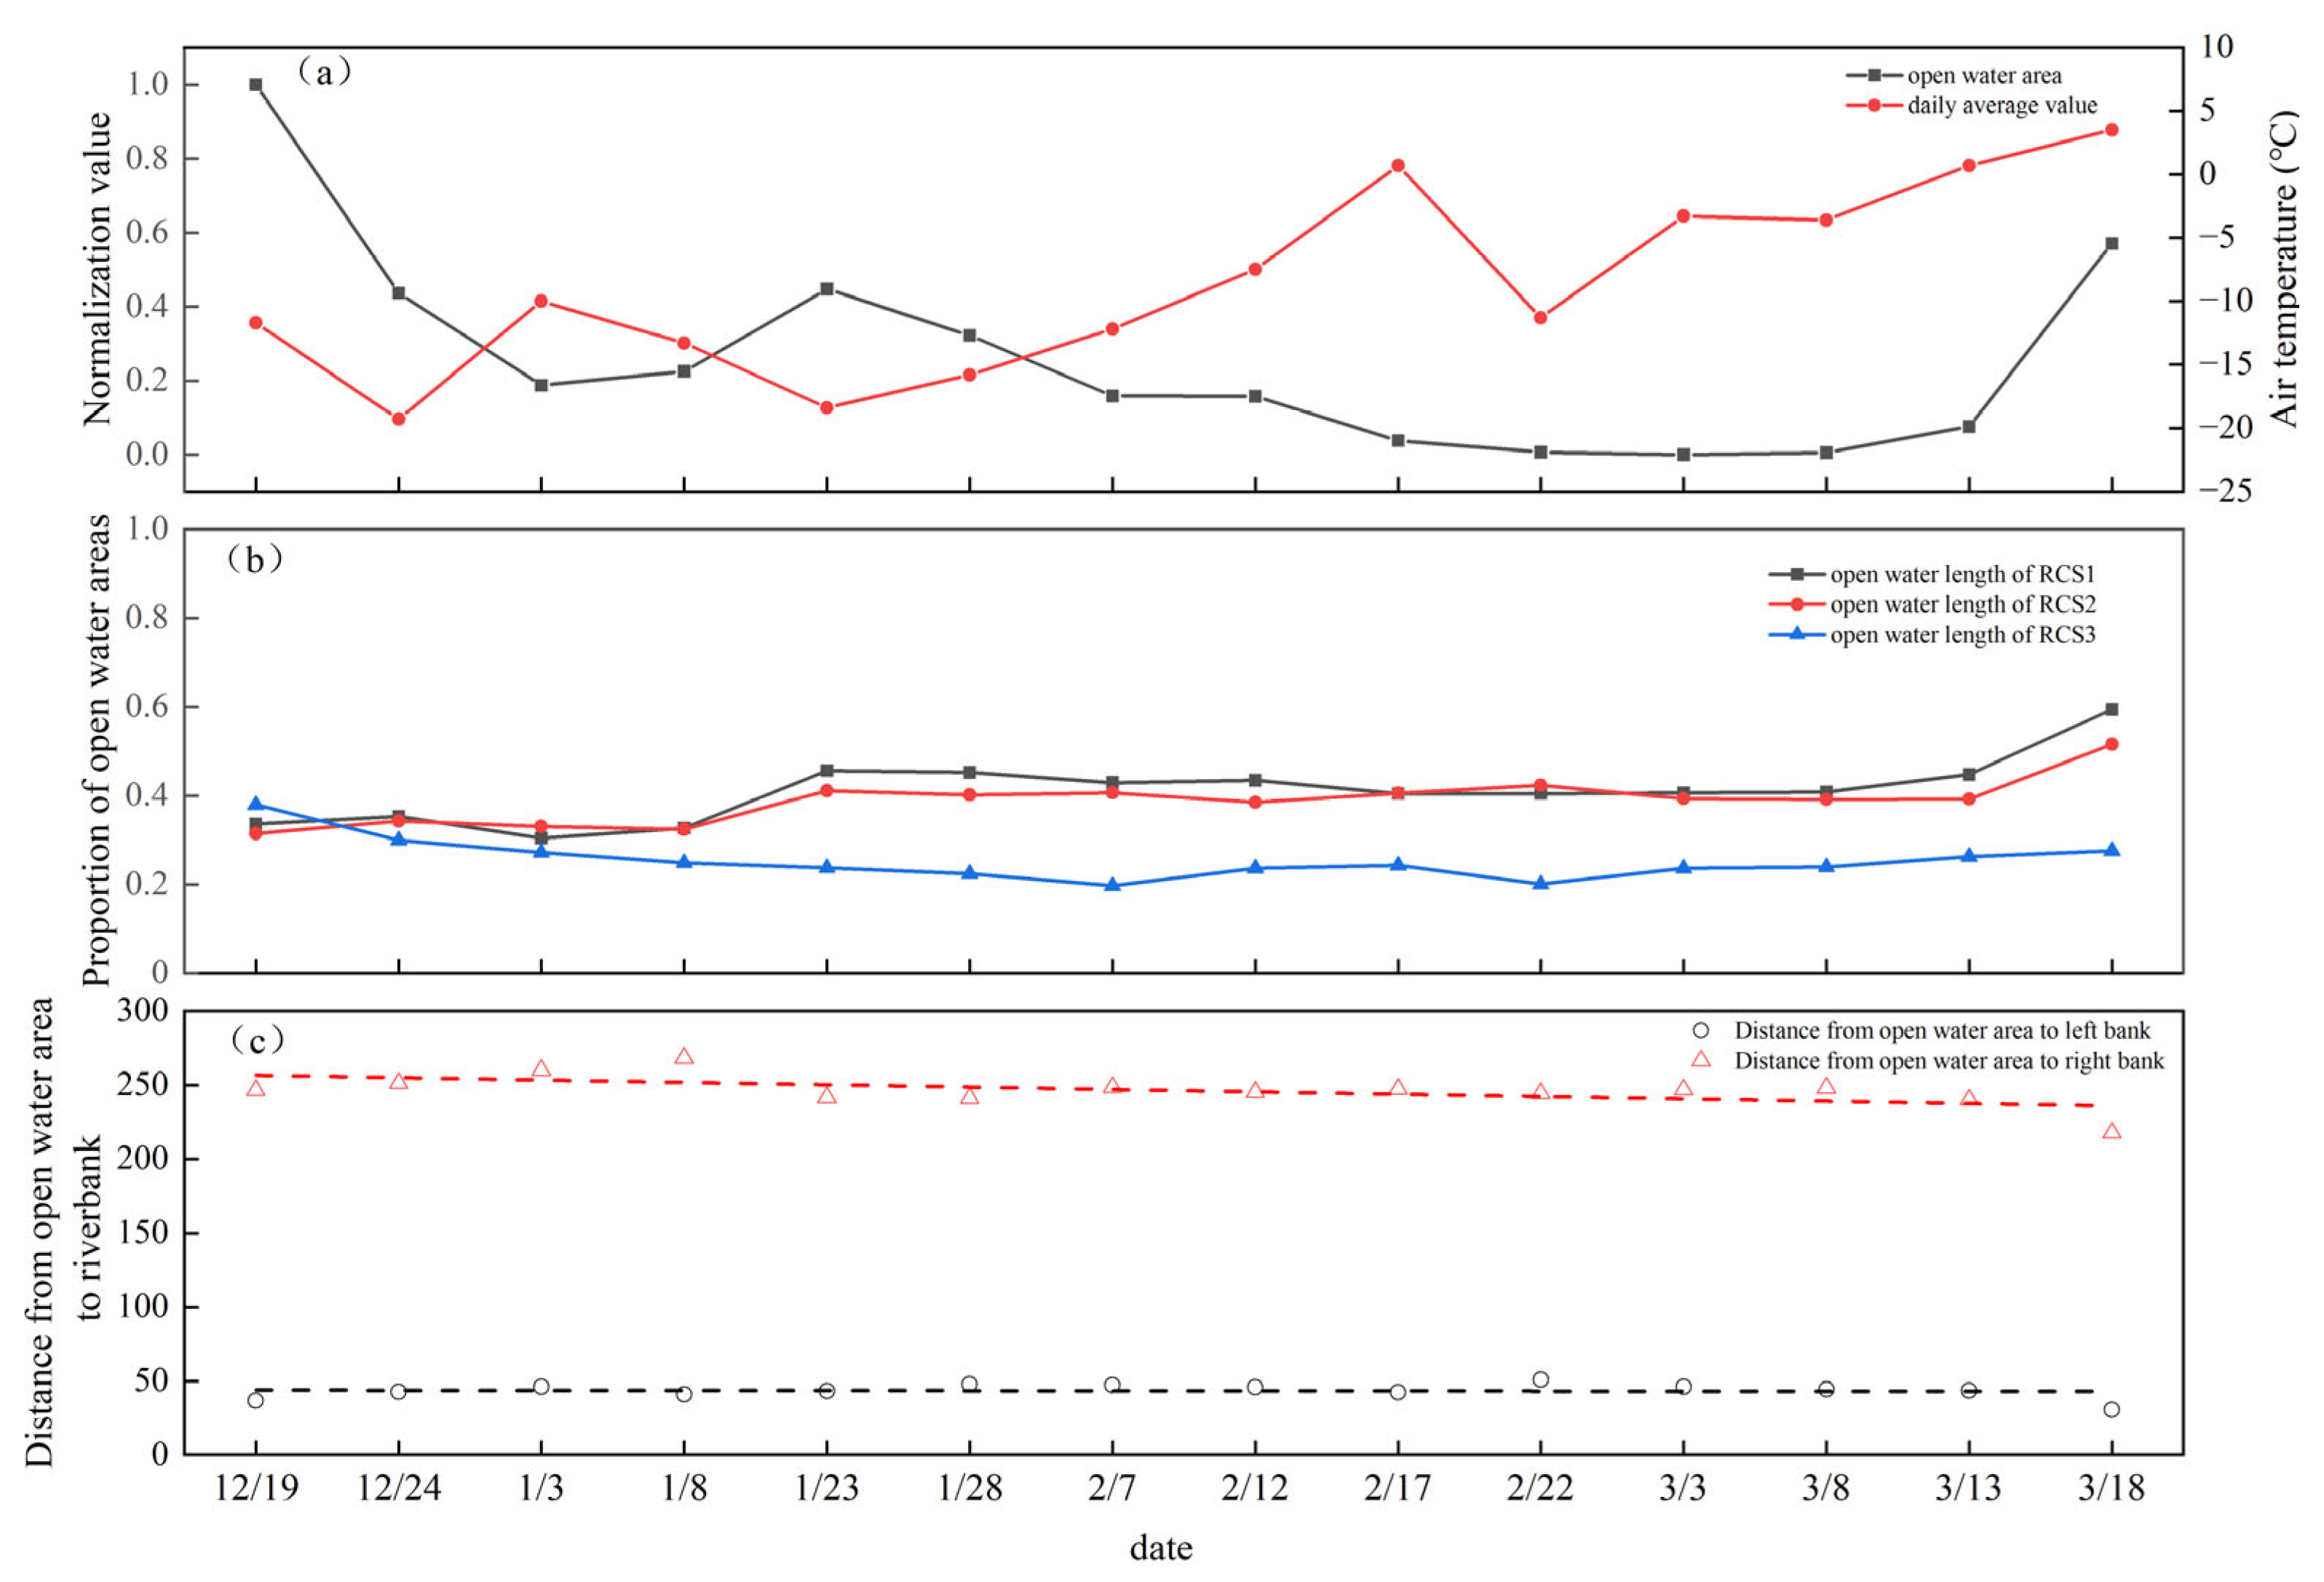
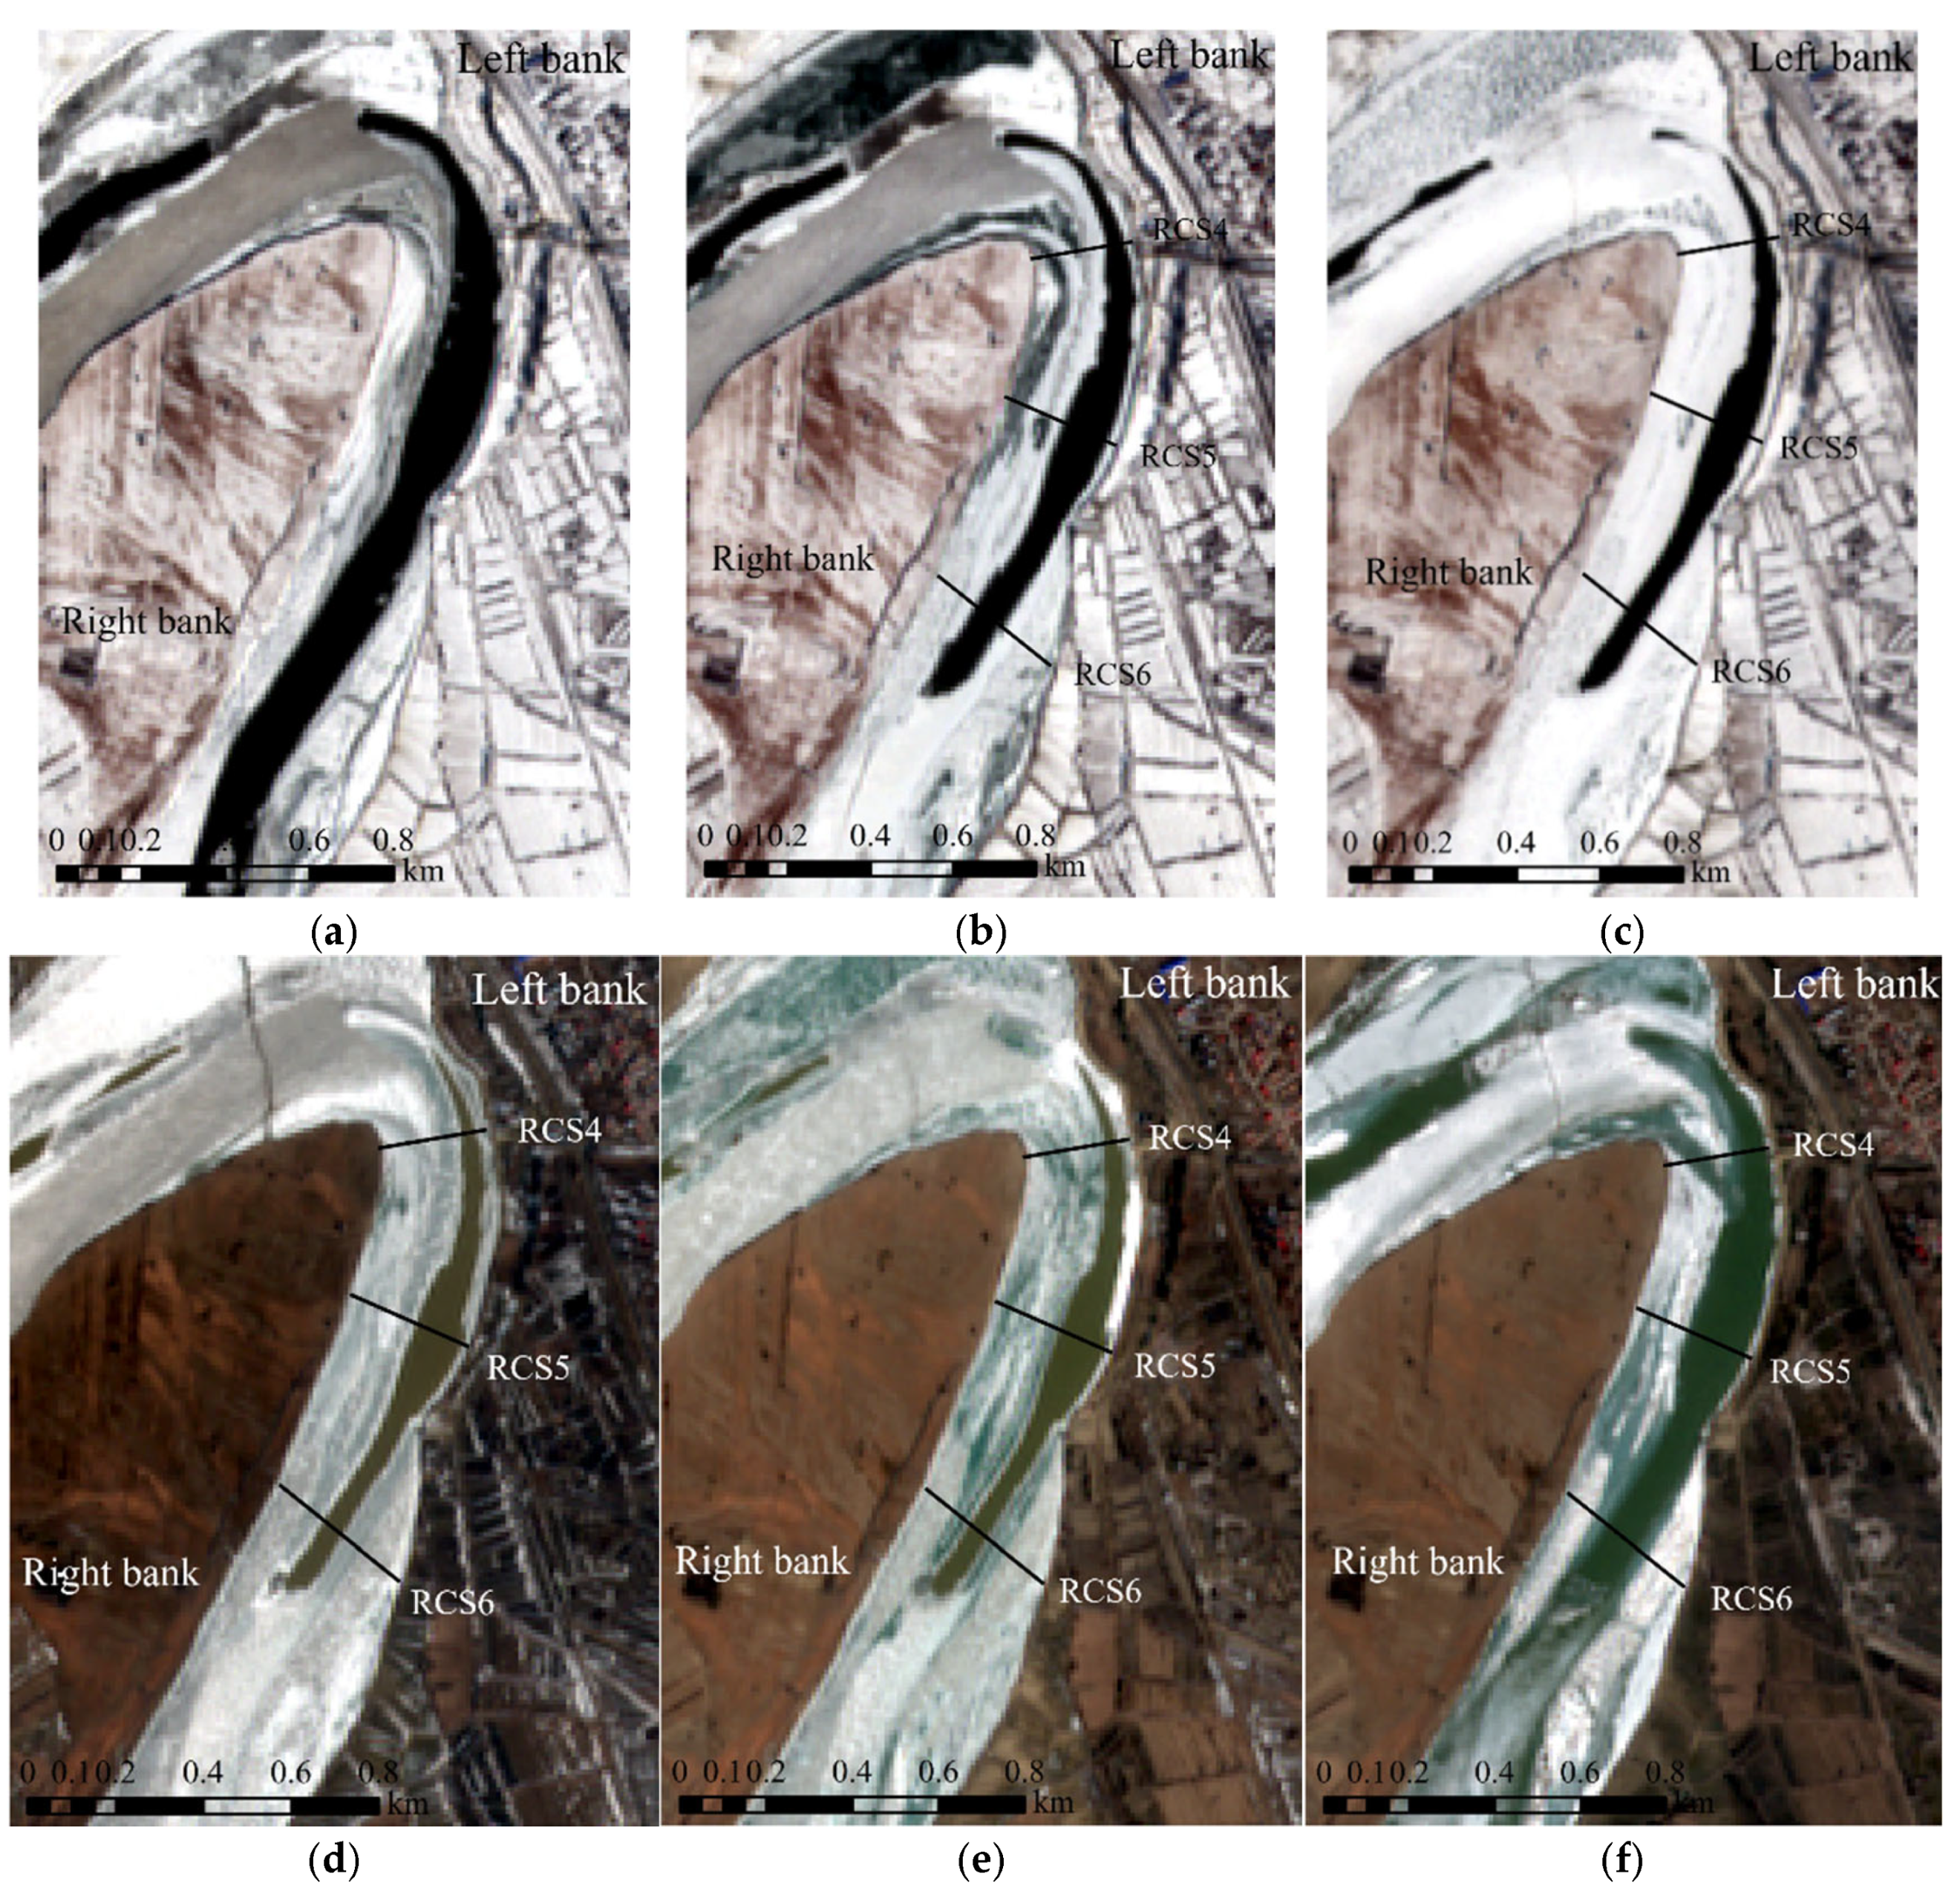
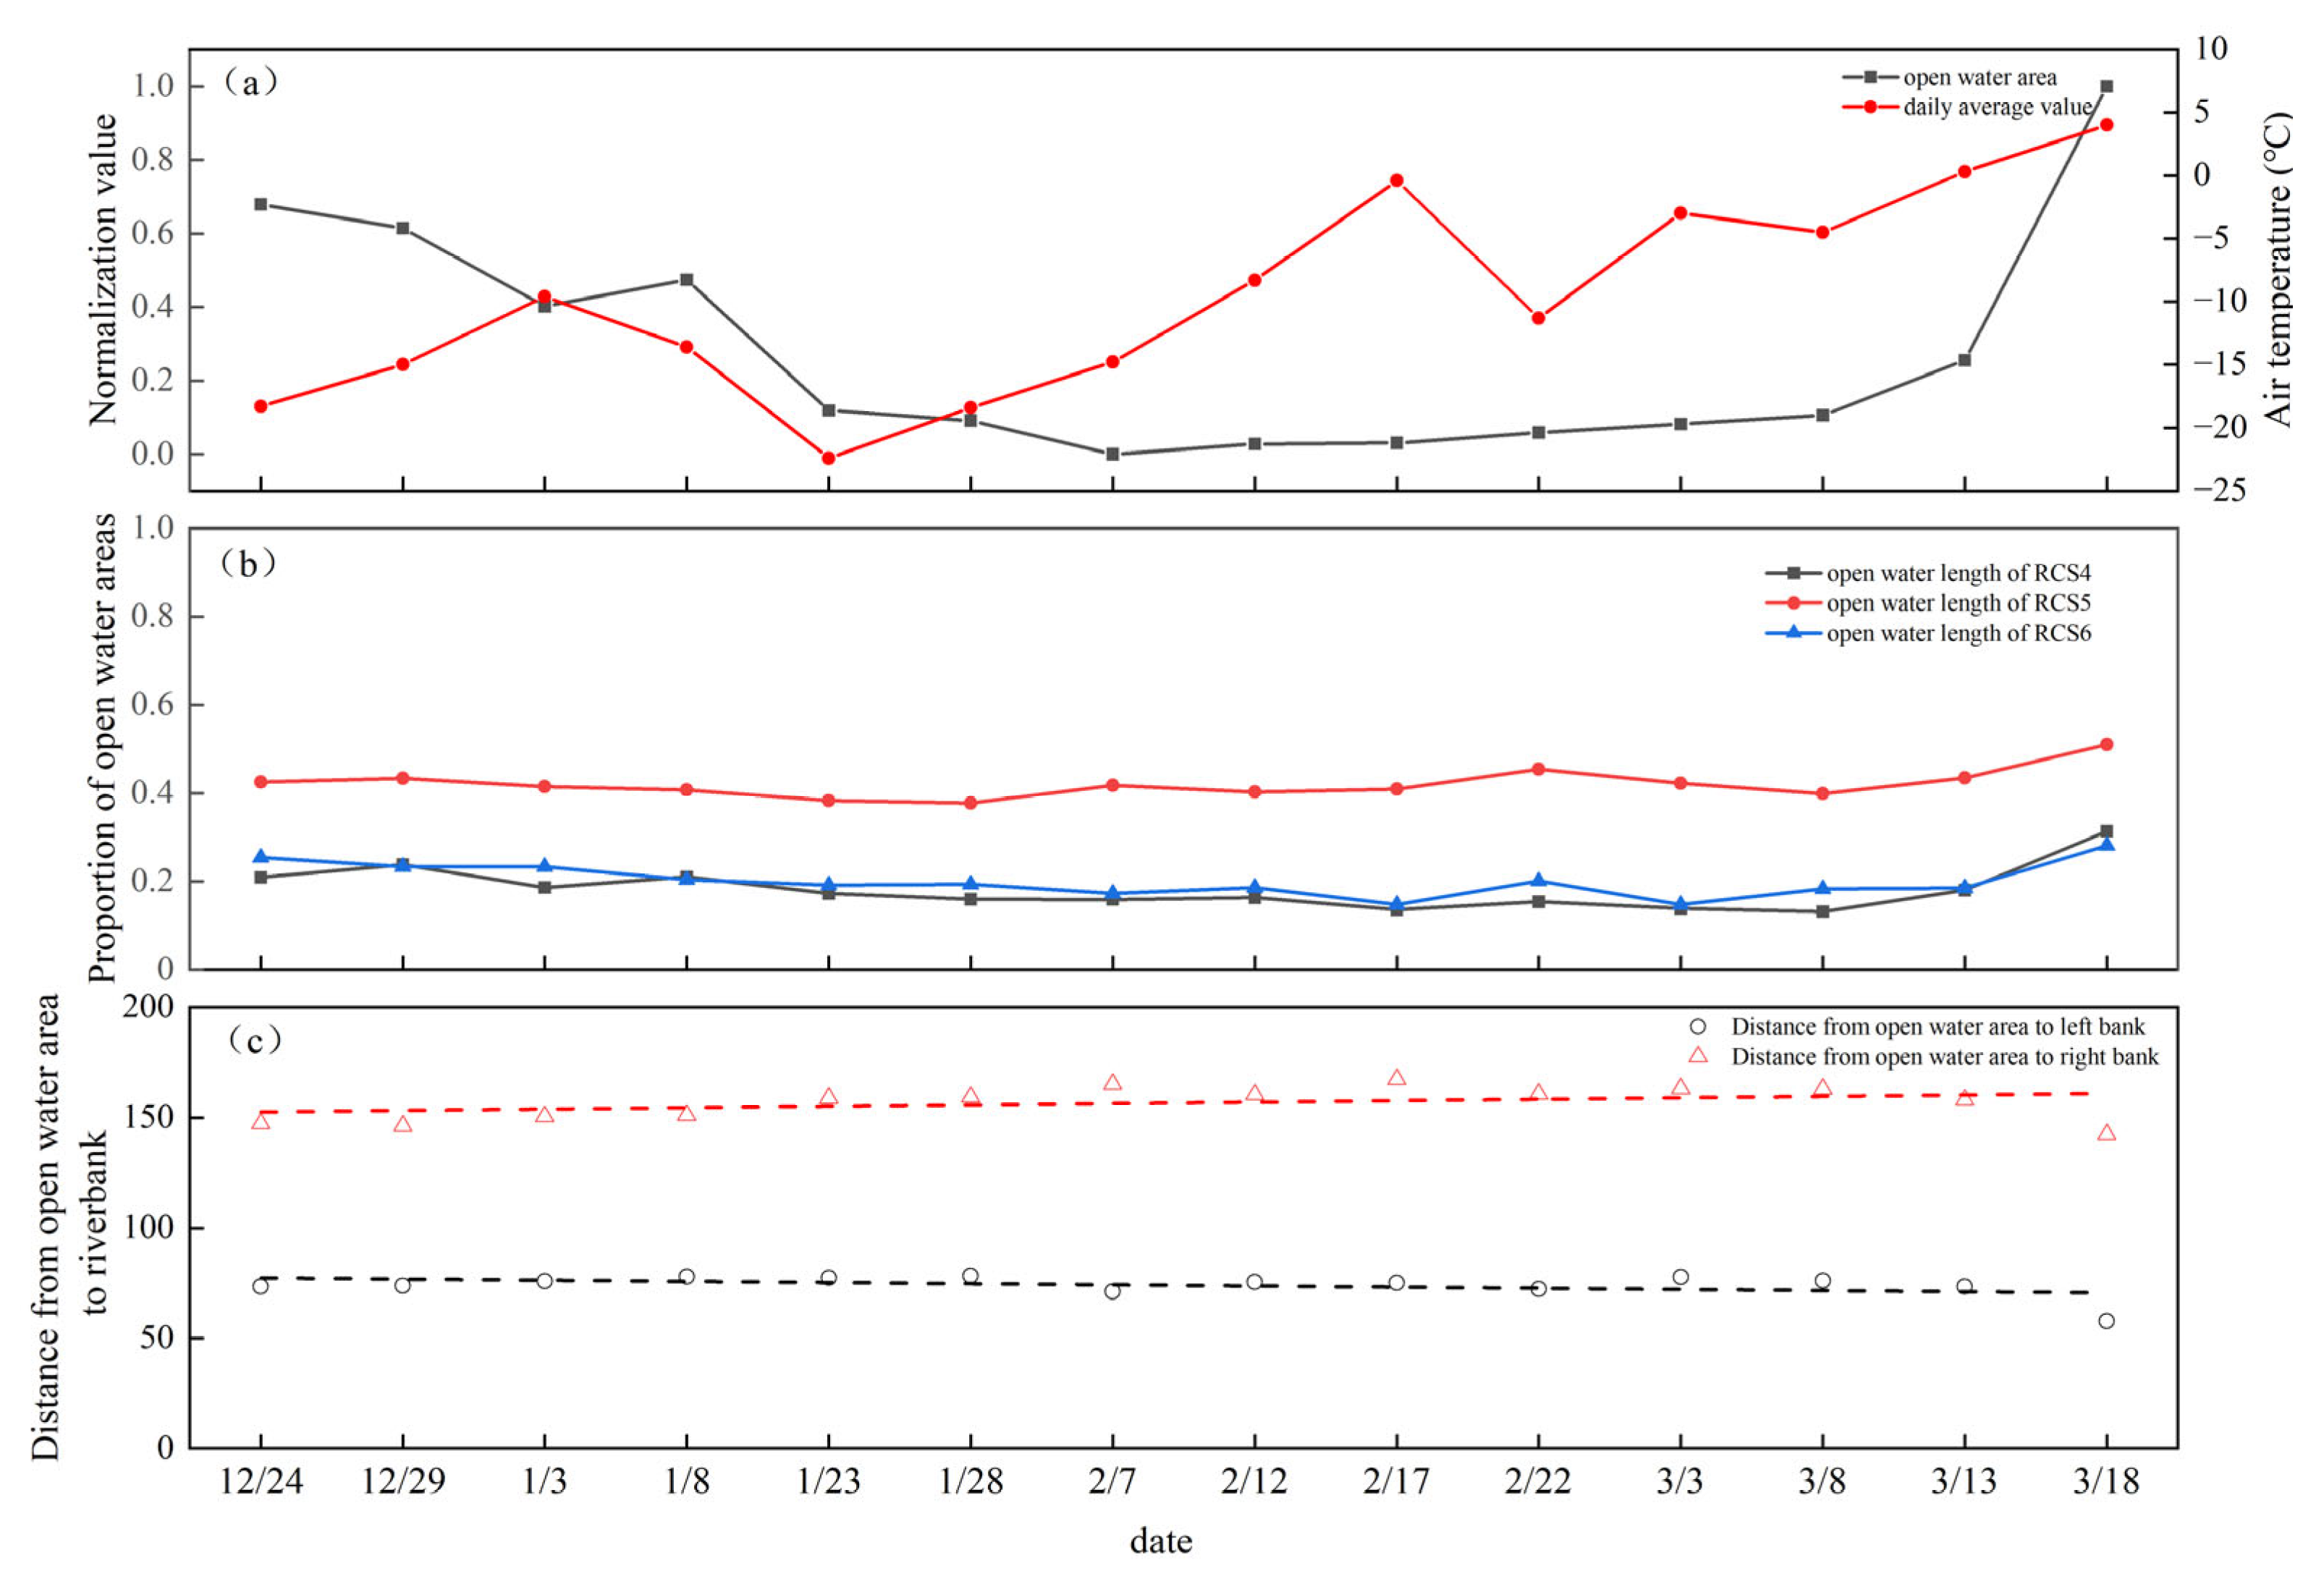
3.1. Open-Water Observations from Different Sampling Points Based on Sentinel-2

The unfrozen open-water areas on the Yellow River’s winter ice surface exhibit complex spatiotemporal dynamics, reflecting the synergistic effects of hydrodynamic conditions, meteorological parameters, and anthropogenic influences. During initial ice formation, localized freezing patterns emerge on the river surface. However, heterogeneous flow conditions and thermal gradients maintain certain areas in an unfrozen state, resulting in distinct open-water zones. Utilizing Sentinel-2 imagery, this study monitored the formation and evolution of unfrozen water areas proximate to sampling locations during the winter of 2023–2024. Among the five sampling sites, open-water formations were observed at the Dachengxi Railway Bridge and the Shishifenzi Bend. According to the location of the open-water, three different position sections were selected to measure the change in the open water relative to the shore, so as to analyze the lateral change in the open water. Figure 2 shows the changes in the open-water area of the Dachengxi Railway Bridge. The remote sensing imagery captured on specific dates, as illustrated in Figure 2, provides a comprehensive overview of the alterations occurring in the open-water area created by the single-track bridge channel. While the open-water area predominantly exhibits a rectangular shape, variations in the front and rear sections, as well as the overall positioning, are evident. The formation of open-water beneath the bridge is particularly pronounced, likely attributable to alterations in water velocity induced by the presence of the pier. Consequently, the freezing processes at various locations exhibit distinct characteristics, with sections situated further from the pier demonstrating greater variability in their changes.
To quantitatively analyze the temporal evolution of open-water areas, measurements were conducted and normalized to establish standardized values. The ratio of open-water length to total riverbank section length was calculated to characterize relative temporal variations. Additionally, distances between open-water boundaries and both riverbanks were measured systematically. Comparative analysis of these spatial relationships relative to both banks enabled comprehensive understanding of open-water positioning and ice surface dynamics during the freeze period. The detailed quantitative results of these analyses are presented in Figure 3. Figure 3a illustrates the correlation between open-water areas and average temperature. During winter, the temperature at the Dachengxi Railway Bridge sampling site initially decreases, then stabilizes, and eventually increases. Correspondingly, the open-water area first contracts, then stabilizes, and finally expands. This pattern is primarily attributed to decreasing temperatures, which lead to increased ice coverage, gradually encroaching upon open-water areas. When temperatures remain below freezing, changes in open-water areas diminish and stabilize. By March, as temperatures rise above 0 °C, ice begins to melt, causing a sharp increase in open-water areas. The melting of ice due to temperature variations impacts the delineation of open water. This phenomenon highlights temperature as the principal determinant affecting the dynamics of open water and ice. The variation in temperature serves as a reliable indicator of alterations in open-water conditions. Figure 3b shows the change in the length of the open-water area. Due to the irregular shape of the open-water area, the change in the cross section will also be different. The expanse of open-water surrounding the Dachengxi Railway Bridge exhibits a shape that approximates a rectangle. It can be seen that the changes in the first two sections selected for the Dachengxi Railway Bridge are basically the same, both increasing first and then stabilizing. This may be due to the water flow conditions that caused the section to not freeze and the section length to gradually increase. However, the change in the third section is relatively small, mainly because the river channel width of the third section is large, the water flow conditions have changed, and the section is at the bottom of the ditch and far away from the bridge, which has little impact on the formation of ice. Figure 3c reveals that open-water areas are generally situated closer to the left bank and more distant from the right bank. Additionally, during ice formation and melting, the right bank experiences relative changes, whereas the left bank remains relatively stable. The open-water region is not situated at the center of the river, suggesting that the flow dynamics are a contributing factor to the alterations observed in the open-water area.
Figure 4 illustrates the evolution of the open-water area at the Shishifenzi Bend. Unlike the open-water areas formed by single-line bridge channels, the Shishifenzi Bend features a long, strip-shaped open-water area that follows the curvature of the bend. The open-water area is narrow at the head and bottom of the bend, widening in the middle. As temperatures fluctuate and ice accumulates within the bend, portions of the upstream open water gradually freeze, leading to a reduction in the total open-water area. As illustrated in Figure 4, the transformation process involved the freezing of certain areas of open water as temperatures progressively decreased. The unique curvature of the bend contributed to an uneven velocity distribution within the open-water, resulting in a greater extent of freezing at the bend’s apex. Concurrently, as temperatures fluctuated and ice accumulation occurred within the bend, portions of the upstream open water began to freeze, leading to a gradual reduction in the overall area of open-water. In March, with a gradual increase in temperature, melting commenced in the central regions of the open-water, progressing downstream. Consequently, the ice began to melt, resulting in an increase in the area of open-water until the river was fully opened.
Figure 5 shows the quantitative changes in the open-water area of the Shisifenzi Bend. As illustrated in Figure 5a,b, the characteristics of the open-water in the bend differ from those of the open-water located beneath the bridge, exhibiting distinct patterns of change. Throughout the freezing period, fluctuations in the open-water area correspond with variations in temperature. Specifically, the open water in the Shisifenzi Bend initially decreases, subsequently stabilizes, and ultimately increases, with the open-water area comprising approximately one-third of the total river course. The unique configuration of the bend channel results in varying lengths of different sections within the open water, with the middle section demonstrating a more pronounced trend of change compared to the sections at both the head and tail of the bend. The analysis presented in Figure 5c facilitates an understanding of the relationship between the open-water boundary and the riverbank. Furthermore, the observed alterations in the boundary indicate a preferential modification of the ice–water contact surface in contrast to the stable ice surface. The newly added ice cover in the open-water is mainly distributed on the right bank, and the change on the left bank is very small because the left bank is the mainstream area with a larger flow velocity. Due to the current conditions in the bend and the absence of lower and longer negative air temperatures to promote ice sheet growth, the lateral growth rate of the right bank ice sheet slowed down over time, resulting in less fluctuation in the area change in open-water. During the melting stage, it can be seen that the right bank still changes more significantly, indicating that open-water areas generally begin to melt from the right bank, and water flow conditions are also the main reason affecting the changes.

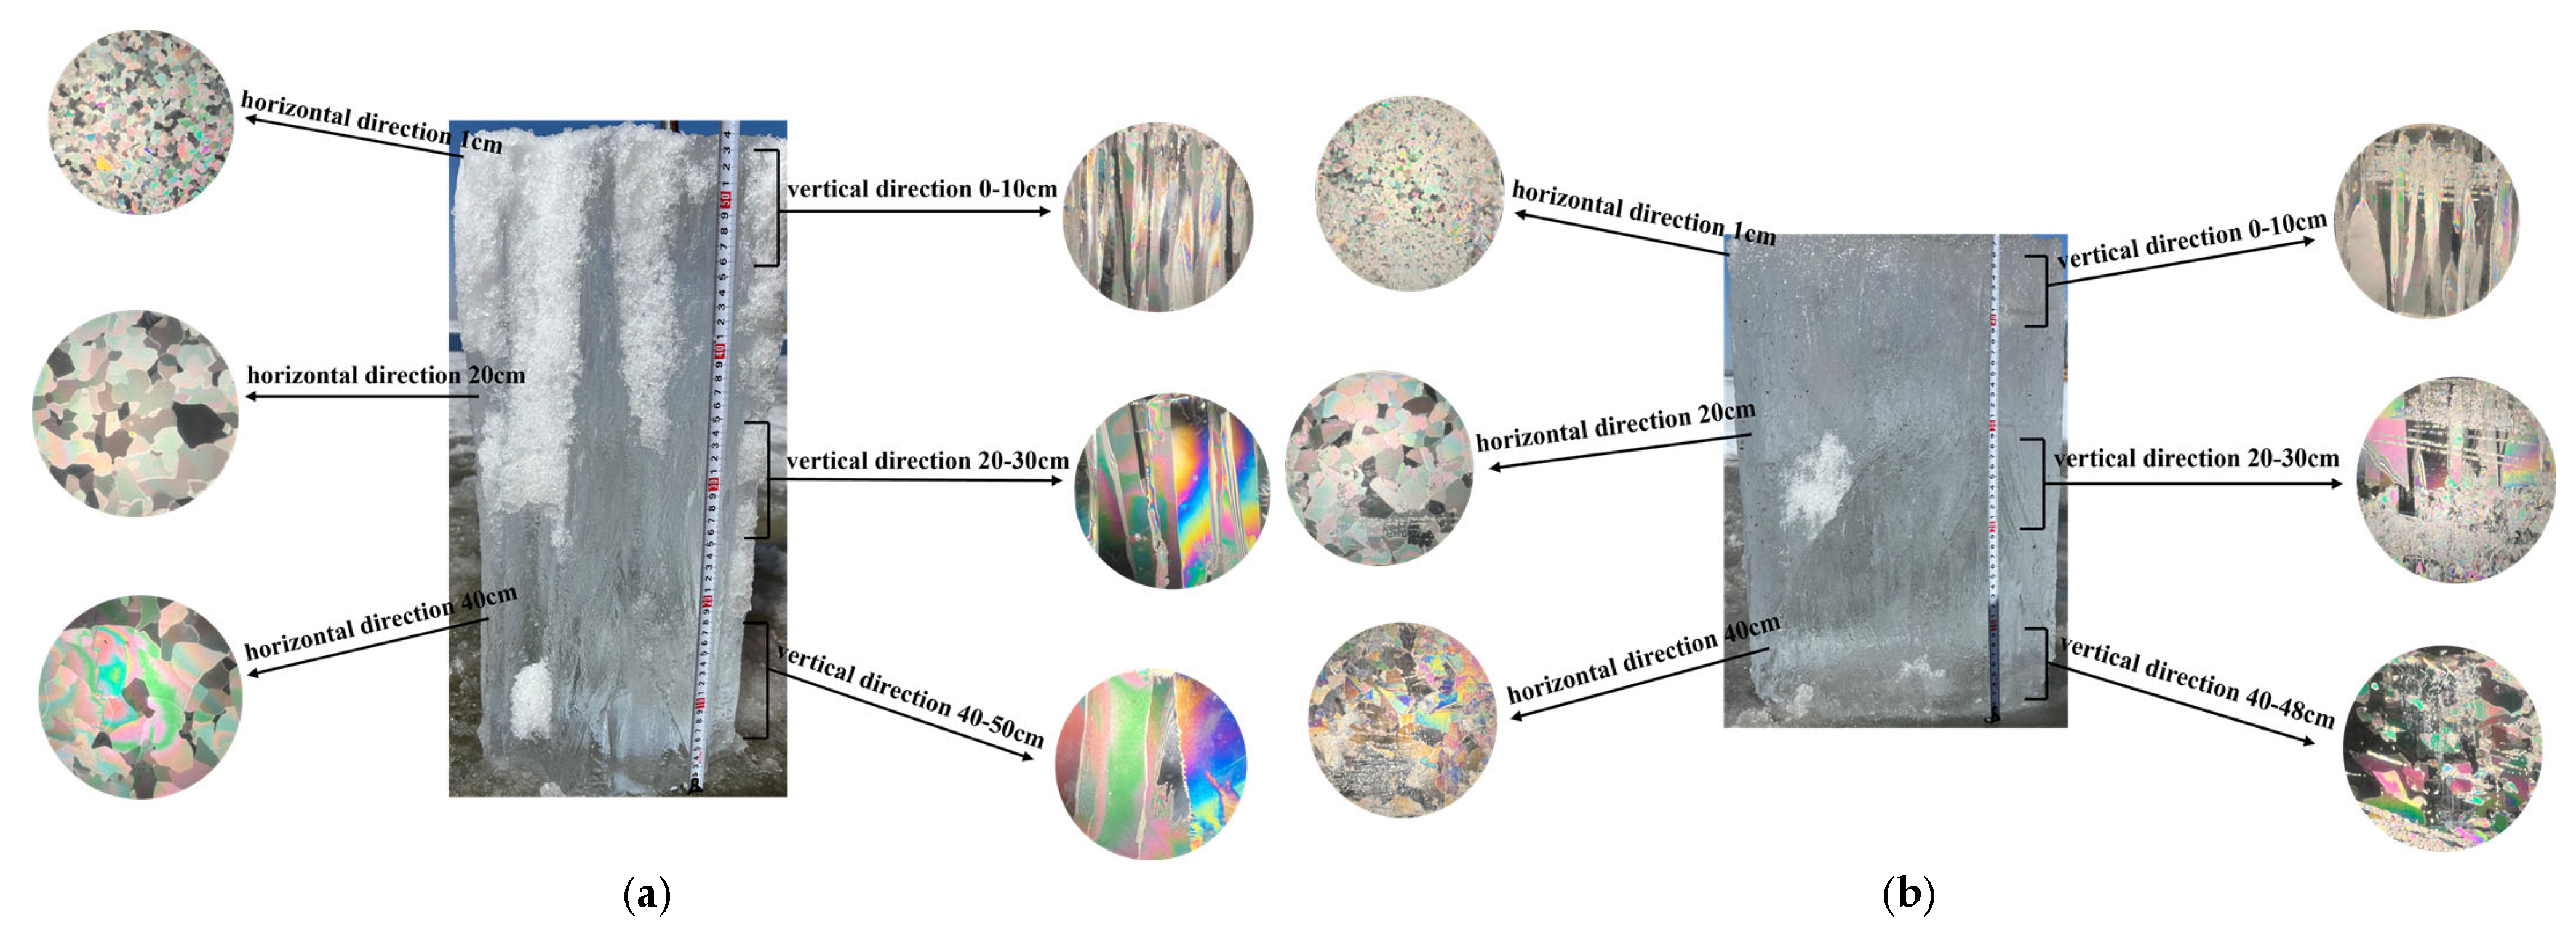
3.2. Ice Crystal Structure Observation Results

Crystal observations were conducted on ice samples taken from different locations in the Inner Mongolia section of the Yellow River. The observation results were compared, analyzed, and sorted out with reference to the classification methods for different types of ice in references [9,10,11]. The ice surface and vertical sections were photographed under an orthogonal polarizer. In the resulting images, adjacent grains appear in different colors, with each color region representing a single grain. For boundaries where the grain structure was not clearly defined, visual identification was used to supplement the interpretation, and the crystal boundaries were manually delineated. This approach allowed us to obtain the crystal structures corresponding to different positions. Based on the obtained ice crystal images and grain size and shape, the Yellow River ice of different river types was classified. Through observation, it was found that the main types of ice crystals in the Inner Mongolia section of the Yellow River are columnar ice and granular ice. Snow-ice will exist on the surface of some ice blocks, and special frazil ice crystal structures will appear in some river channels. In order to better distinguish ice samples at different locations, we also collected ice samples from open waters that froze after the river was closed. DXC1# and SSFZ2# were both post-freezing ice samples of the open waters formed. Figure 6 shows the ice samples and crystal structures formed by the freezing of the Dachengxi Railway Bridge and the Shishifenzi Bend after a period of time in the open-water area. Analysis reveals that ice formations in open-water regions predominantly manifest as columnar ice structures, characterized by rectangular crystalline configurations. These crystals exhibit distinct boundary demarcations, with their longitudinal axes extending continuously along the vertical growth direction of ice thickness. Its freezing process is mainly affected by water flow conditions and heat conduction. In the single-track bridge channel at Dachengxi, the surface stratum of the ice formation displays distinctive snow-ice crystalline characteristics. Snow-ice formations exhibit high granular density with diminutive particle dimensions. The crystalline morphology predominantly consists of circular and granular microstructures. These formations typically originate from accumulated snow deposits that undergo multiple cycles of compression, followed by freeze–thaw processes in conjunction with the underlying ice. There are gaps inside, and the freezing process is greatly affected by hydrodynamics and environmental factors. Both the middle and lower layers are obvious columnar ice, the crystal shape is close to a rectangle, the boundaries are obvious, and the crystal growth direction is consistent with the direction of ice thickness growth. The crystal structure of the ice sample at SSFZ2# is mostly columnar ice, and in the middle and lower layers, some crystals are mixed with some ice crystals with larger particle sizes, and its crystal structure is frazil ice. The crystal shapes of frazil ice are extremely irregular, mostly dendritic and serrated. Most ice crystals are small in size, there are wrapping crystals on the edges of the grains, and there are many gaps between the ice crystals. The freezing process is mainly controlled by environmental interference and hydrodynamic conditions.
Figure 7 shows the crystal structures of different river channel types along the longitudinal section of the Yellow River in Inner Mongolia. It can be seen from the vertical direction of the longitudinal section that the ice crystal structure of the vertical section of different types of rivers is very different. The ice in the straight river channel of Sanhuhekou and the Dachengxi Railway Bridge is columnar ice grown purely by thermodynamics, with only a small amount of granular ice and snow-ice on the surface. Crystal dimensional analysis reveals a progressive increase in particle size along the vertical profile. This pattern indicates that ice formation in straight channel segments and bridge-adjacent sections experiences minimal perturbation, resulting in simplified crystalline architectures predominantly characterized by distinct columnar formations. In contrast, the Shishifenzi Bend exhibits markedly different crystallographic characteristics. The complex hydrodynamic conditions characteristic of curved channels, coupled with ice accumulation phenomena at bend locations, result in more intricate crystal distribution patterns. Furthermore, significant variations in crystalline structure are observed across different positions within the bend configuration. The ice crystal structure at the head of the bend is mostly obvious granular ice, and the particle size of the crystal is very small. The closer to the open-water area, the closer the ice is to pure thermodynamic natural growth. The bottom of the bend close to the open water is mostly columnar ice. In the crystal structure of SSFZ1#, there is frazil ice frozen in the granular ice in the upper and middle ice layers. This may be due to the complex boundary conditions of the curved river channel. Under the action of the water flow, the ice flowers dived and accumulated, and finally froze in the ice layer, thus changing the original crystal structure. For the ice crystal structure of SXT1#, 0–15 cm is granular ice, 15–23 cm is columnar ice, and below 23 cm is mainly granular ice. There is mud and sand in the ice of Shaxintan and some frazil ice is frozen at the bottom of the columnar ice along with mud and sand. The attachment of frazil ice and mud affects the natural growth of the original ice layer and will have different effects on the composition of the crystal structure. This phenomenon occurs predominantly in meandering channels and alluvial reaches characterized by complex hydrodynamic regimes. The crystal structure of the QFZ2# double-track bridge is columnar ice, and there is frazil ice embedded between the columnar ice layers at a depth of 30–40 cm. The double-track bridge piers significantly influence local hydrodynamic conditions, facilitating rapid consolidation of frazil and drift ice to form interstitial frazil layers, which subsequently affect columnar ice development. The predominance of granular ice formations upstream of the double-track bridge indicates that the pier structures impede ice transport and modify flow dynamics. Ice accumulation phenomena near bridge piers result in ice formations that deviate from pure thermodynamically grown columnar structures, instead exhibiting heterogeneous crystalline compositions comprising both granular and columnar ice. This evidence substantiates channel morphology as a primary determinant of crystallographic structure.

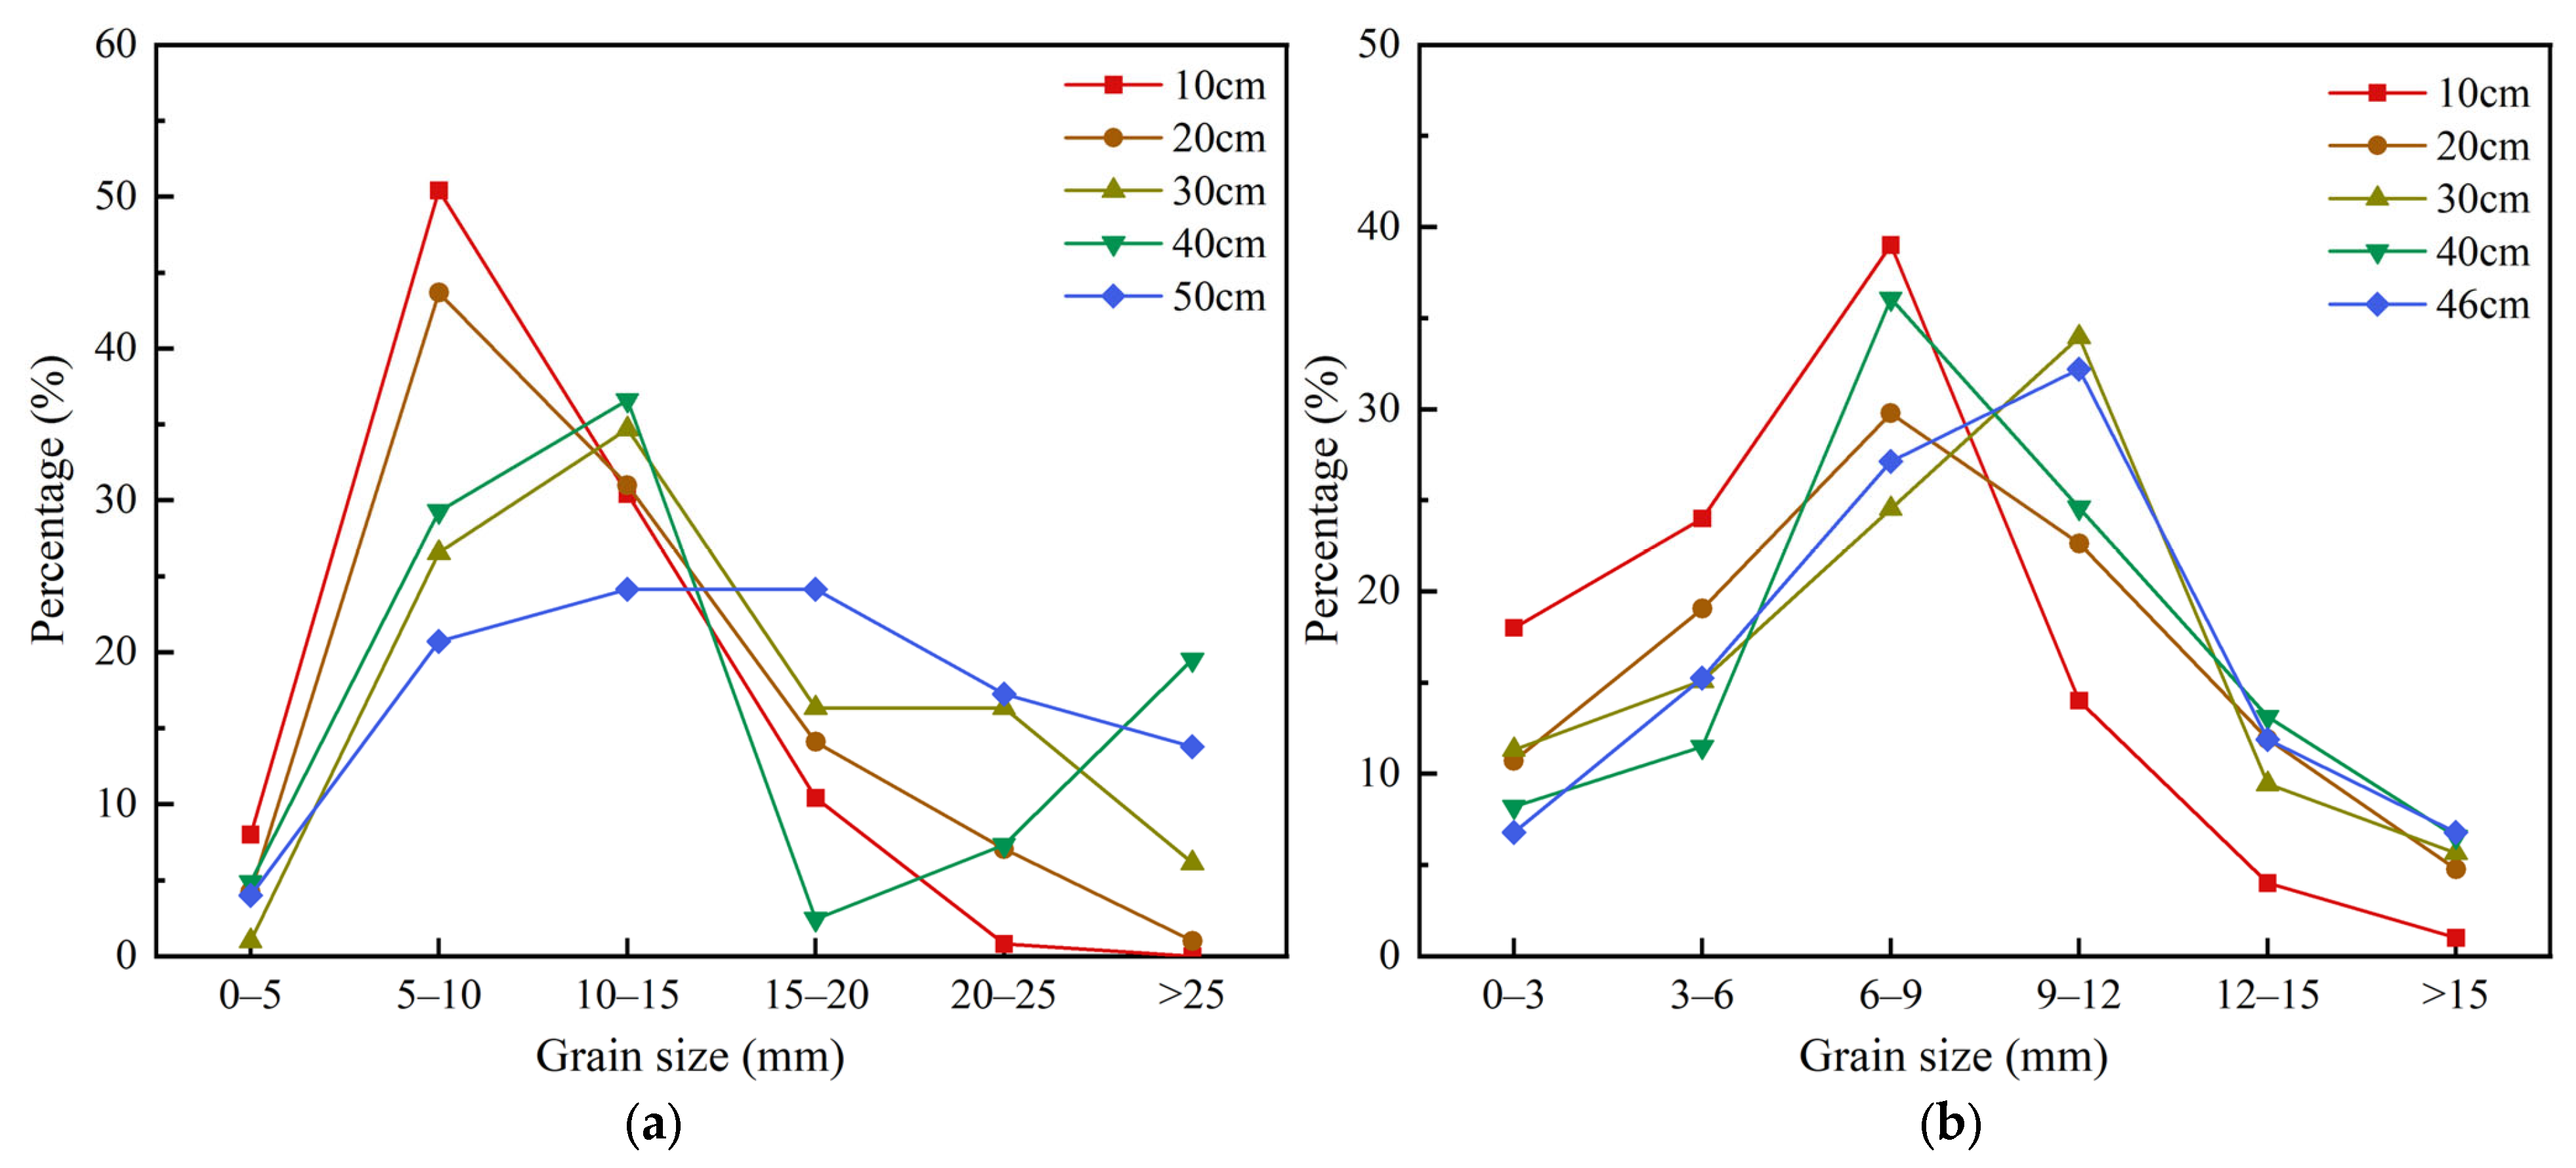
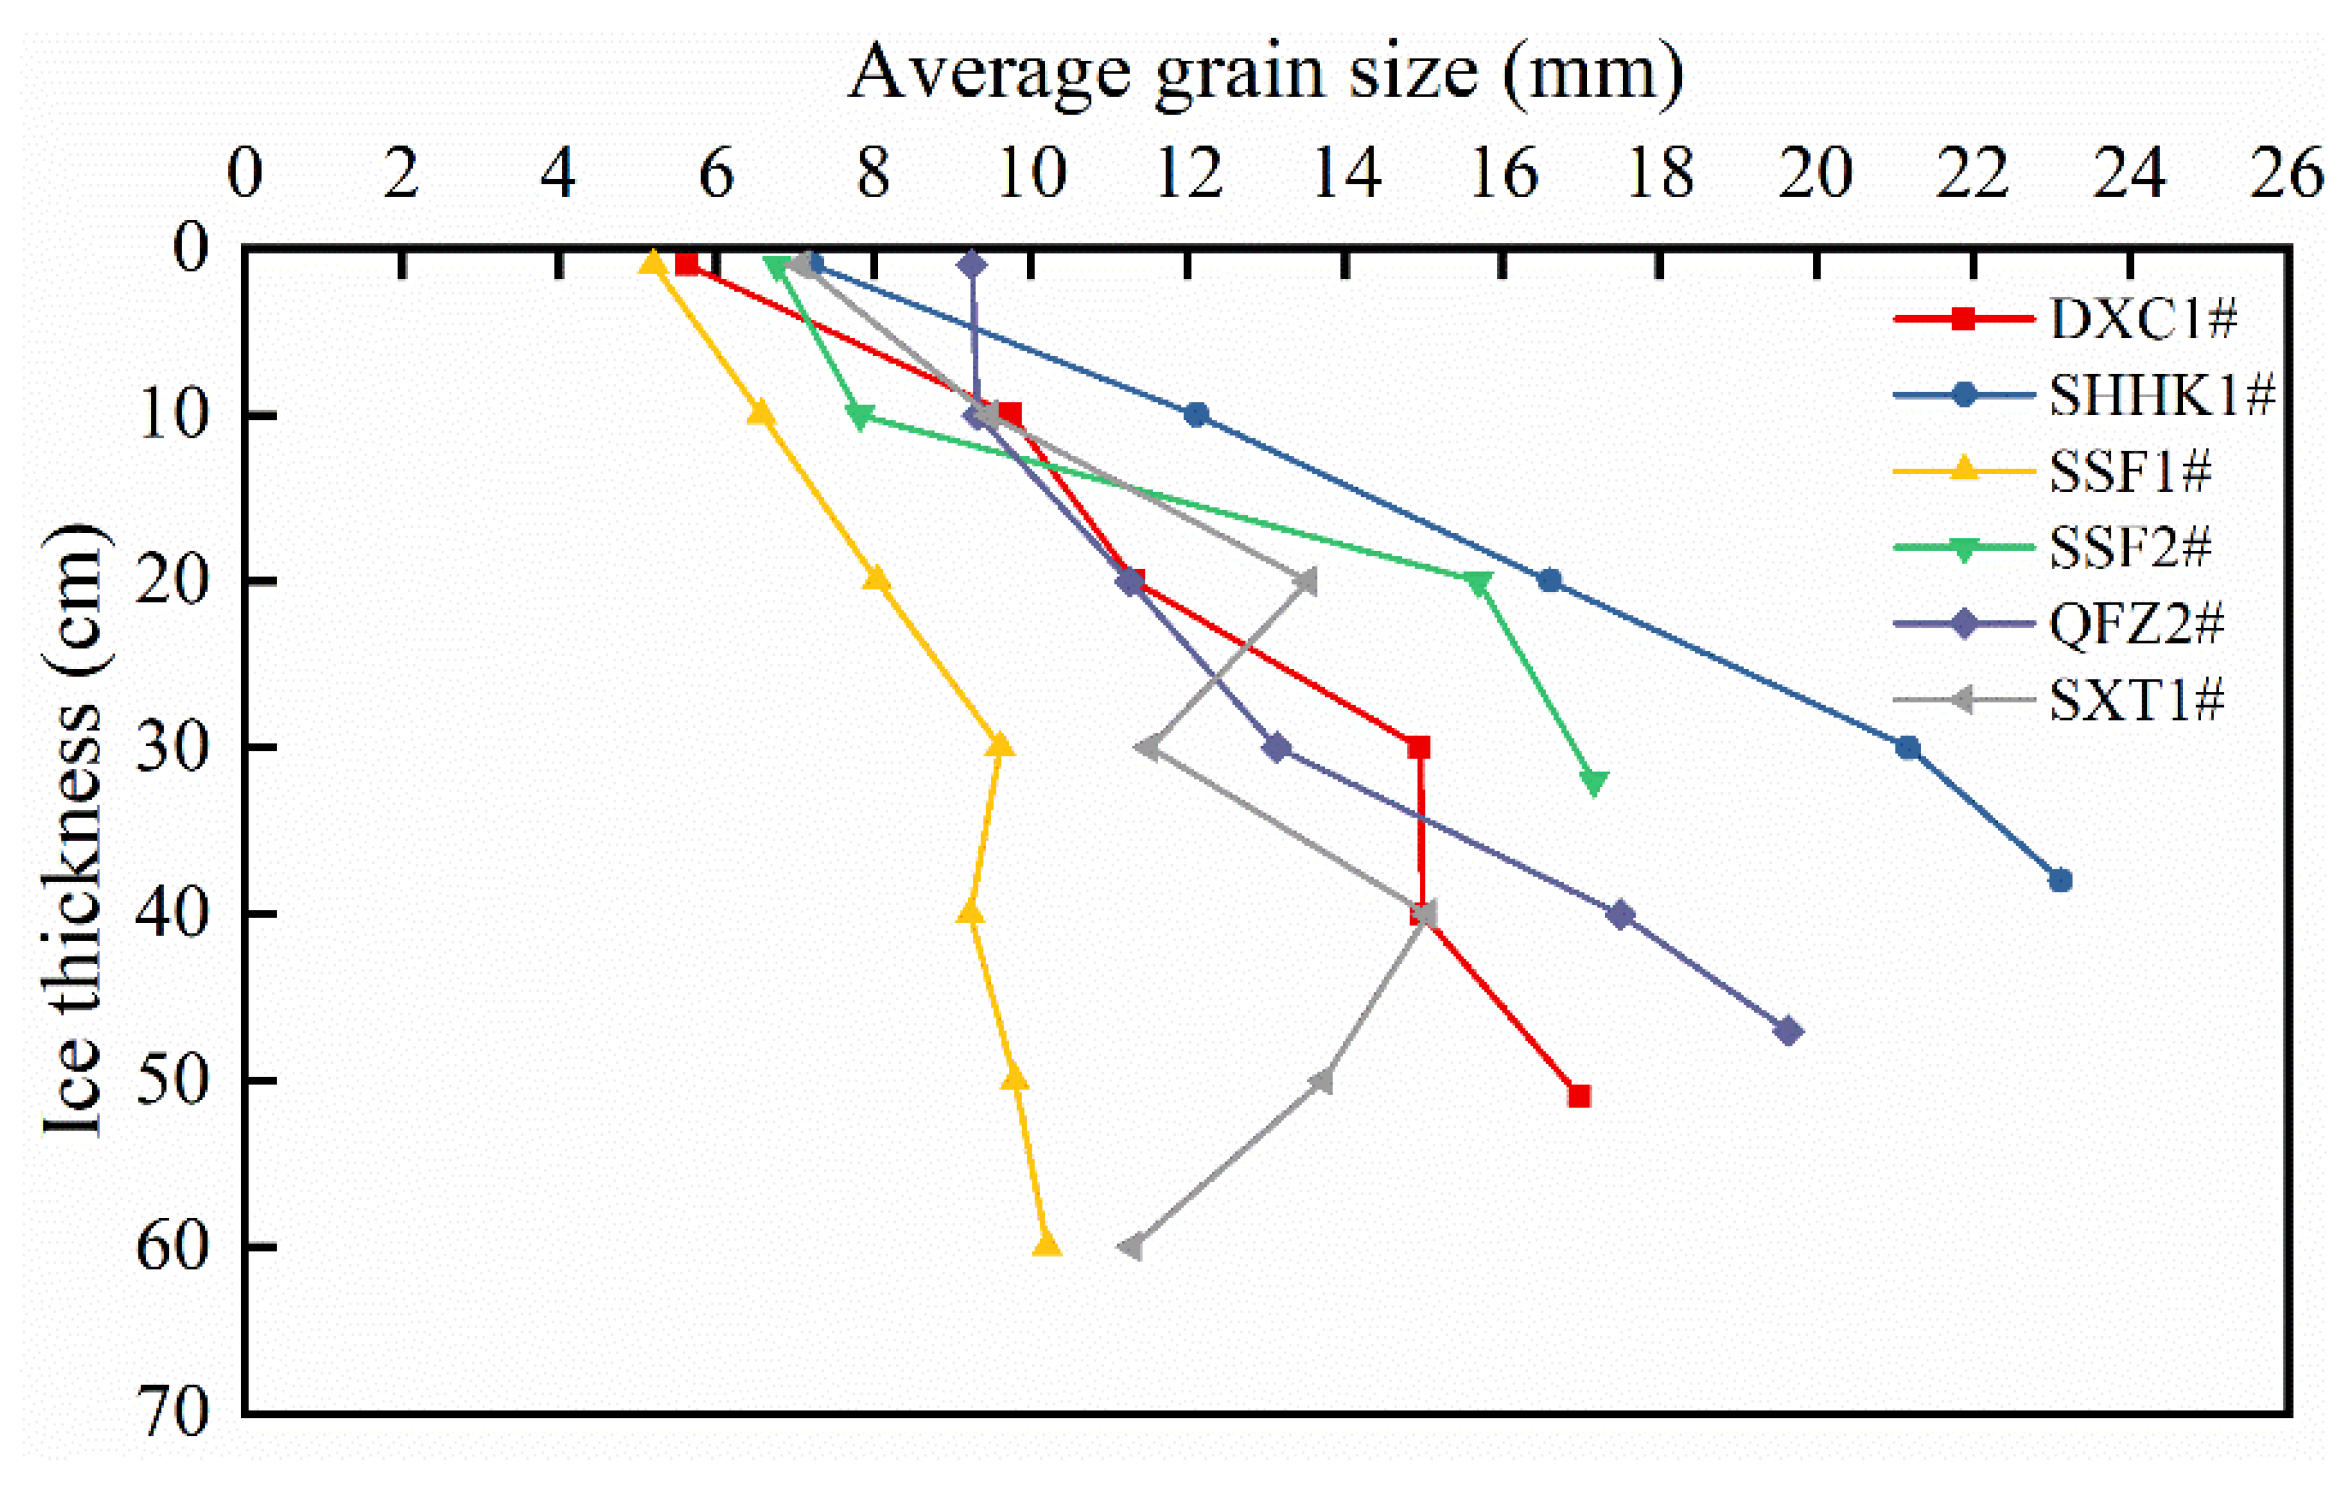
3.3. Ice Crystal Distribution

All of the ice crystals at different river channel locations and different horizontal depths were classified and counted. A total of 45 ice crystal images were obtained, and the size data of the ice crystals were obtained based on the scales arranged during observation. Due to the irregular shape of ice particles, the equivalent particle size is used to describe the size of ice particles. Figure 8 shows the equivalent diameter distribution of columnar ice and granular ice. It can be seen that there is a clear difference in the equivalent diameter distribution of the two crystal types. The equivalent diameters of columnar ice and granular ice both increase first and then decrease. The equivalent diameter of columnar ice is mainly distributed in the range of 6–12 mm, accounting for 40.09% of the total calculated amount. Among them, 8–10 mm accounts for the largest proportion, accounting for 13.98% of the total amount of columnar ice. The columnar ice is relatively large in size, with more large-sized grains, and the proportion of equivalent grains greater than 20 mm accounts for 10.62%. The number of grains with equivalent diameter of 10–20 mm decreases with the increase of equivalent diameter of grains, and the decrease in grain number is relatively gentle. There are more large-sized ice crystals in columnar ice, and the size distribution is more uniform. The equivalent diameter of granular ice is mainly distributed in the range of 2–8 mm, and the proportion of crystals from 0 to 6 mm gradually increases. The amount of 4–6 mm accounts for the largest proportion, accounting for 19.87% of the total calculated granular ice. The equivalent diameter of columnar ice crystals is unevenly distributed, with small sizes being the main ones. The minimum equivalent particle size of columnar ice in the ice sample is 1.12 mm, and the maximum is 42.3 mm. The equivalent diameter range of granular ice is 0.39–19.86 mm, and the equivalent diameter of granular ice is significantly smaller than that of columnar ice.
Two different types of river channels and different types of crystals were selected for ice blocks. The equivalent diameter distribution ratio of each horizontal slice is shown in Figure 9. As can be seen from Figure 9, the equivalent diameters of columnar ice at depths of 10 cm and 20 cm are concentrated in the range of 5–10 mm, and the proportion of 5–10 mm columnar ice at a depth of 10 cm is as high as 50.4%. With increasing depth, the equivalent diameter distribution shifts significantly, predominantly ranging from 10 to 15 mm at the 30 cm depth stratum. At greater depths of 40 cm and 50 cm, crystals with equivalent diameters exceeding 25 mm constitute 19.5% and 13.8% of their respective populations. This shows that the equivalent diameter of columnar ice grown purely by thermodynamics increases with depth, and the proportion of columnar ice grains increases with depth. The proportion of columnar ice grains in the 50 cm layer is relatively uniform, and the difference is not significant. The change trend of the crystal proportion of granular ice at different depths is the same, which is to increase first and then decrease. Unlike columnar ice, the crystal diameter proportion will drop sharply after it is larger than 12 mm, and the proportion of crystals larger than 15 mm is very small, less than 10%. The main grain size of each layer is concentrated between 6 and 12 mm. In the 10 cm layer, the grain size of 6–9 mm accounts for 39.8%; in the 30 cm layer, the grain size of 9–12 mm accounts for 34.1%.
The crystal equivalent diameters of ice samples at different river channel locations in the Inner Mongolia section of the Yellow River were statistically analyzed, and the variation in grain size under different crystal structures along the direction of ice thickness growth was obtained, as shown in Figure 10. The equivalent diameters of various ice crystal types exhibit similar trends, progressively increasing with depth. However, variations in channel morphology and local environmental conditions at different sites further influence crystal growth dynamics. The straight river channel of Sanhu River estuary is columnar ice with pure thermodynamic growth, and the crystal size varies from 7.23 mm to 23.12 mm along the direction of ice thickness growth. The Dachengxi Railway Bridge is a single-track bridge river channel, and its crystal structure is columnar ice with a size variation range of 5.62–17.01 mm, which gradually increases along the depth direction. Notably, for columnar ice, the crystal diameters at the Sanhu River estuary are significantly larger than those observed at the Dachengxi Railway Bridge. This indicates that the bridge piers have an impact on the flow rate of the river. Therefore, the formation process of ice crystals under the bridge is affected to a certain extent compared with the unobstructed straight river channel, resulting in relatively smaller crystal size. SSFZ1# is situated at the ice accumulation zone at the head of the bend, where the crystal structure is predominantly granular ice, with crystal sizes ranging from 5.20 mm to 10.22 mm. SSFZ2#, located in the middle of the bend and formed from post-freeze open water, is adjacent to an existing open-water area. This sample exhibits a columnar ice structure, resulting in larger crystal sizes compared to SSFZ1#, with a size range of 6.77 mm to 17.17 mm and considerable variability in crystal dimensions. The bends in the river are complex and have a great influence on the flow and accumulation of ice, so the types of crystals formed at different locations in the bends are also different. The crystal size range of the Shaxintan channel is 7.08–15.06 mm. In the Shaxintan River channel, the ice contains a lot of sediment, and the growth of crystals is also affected by the sediment, causing the crystal area to fluctuate to a certain extent as the ice thickness increases. Owing to the prevalence of bifurcated channel morphologies in the Shaxintan region, the formation processes of ice are also affected by the boundary conditions of the river channels, and the crystal type is mostly granular ice.

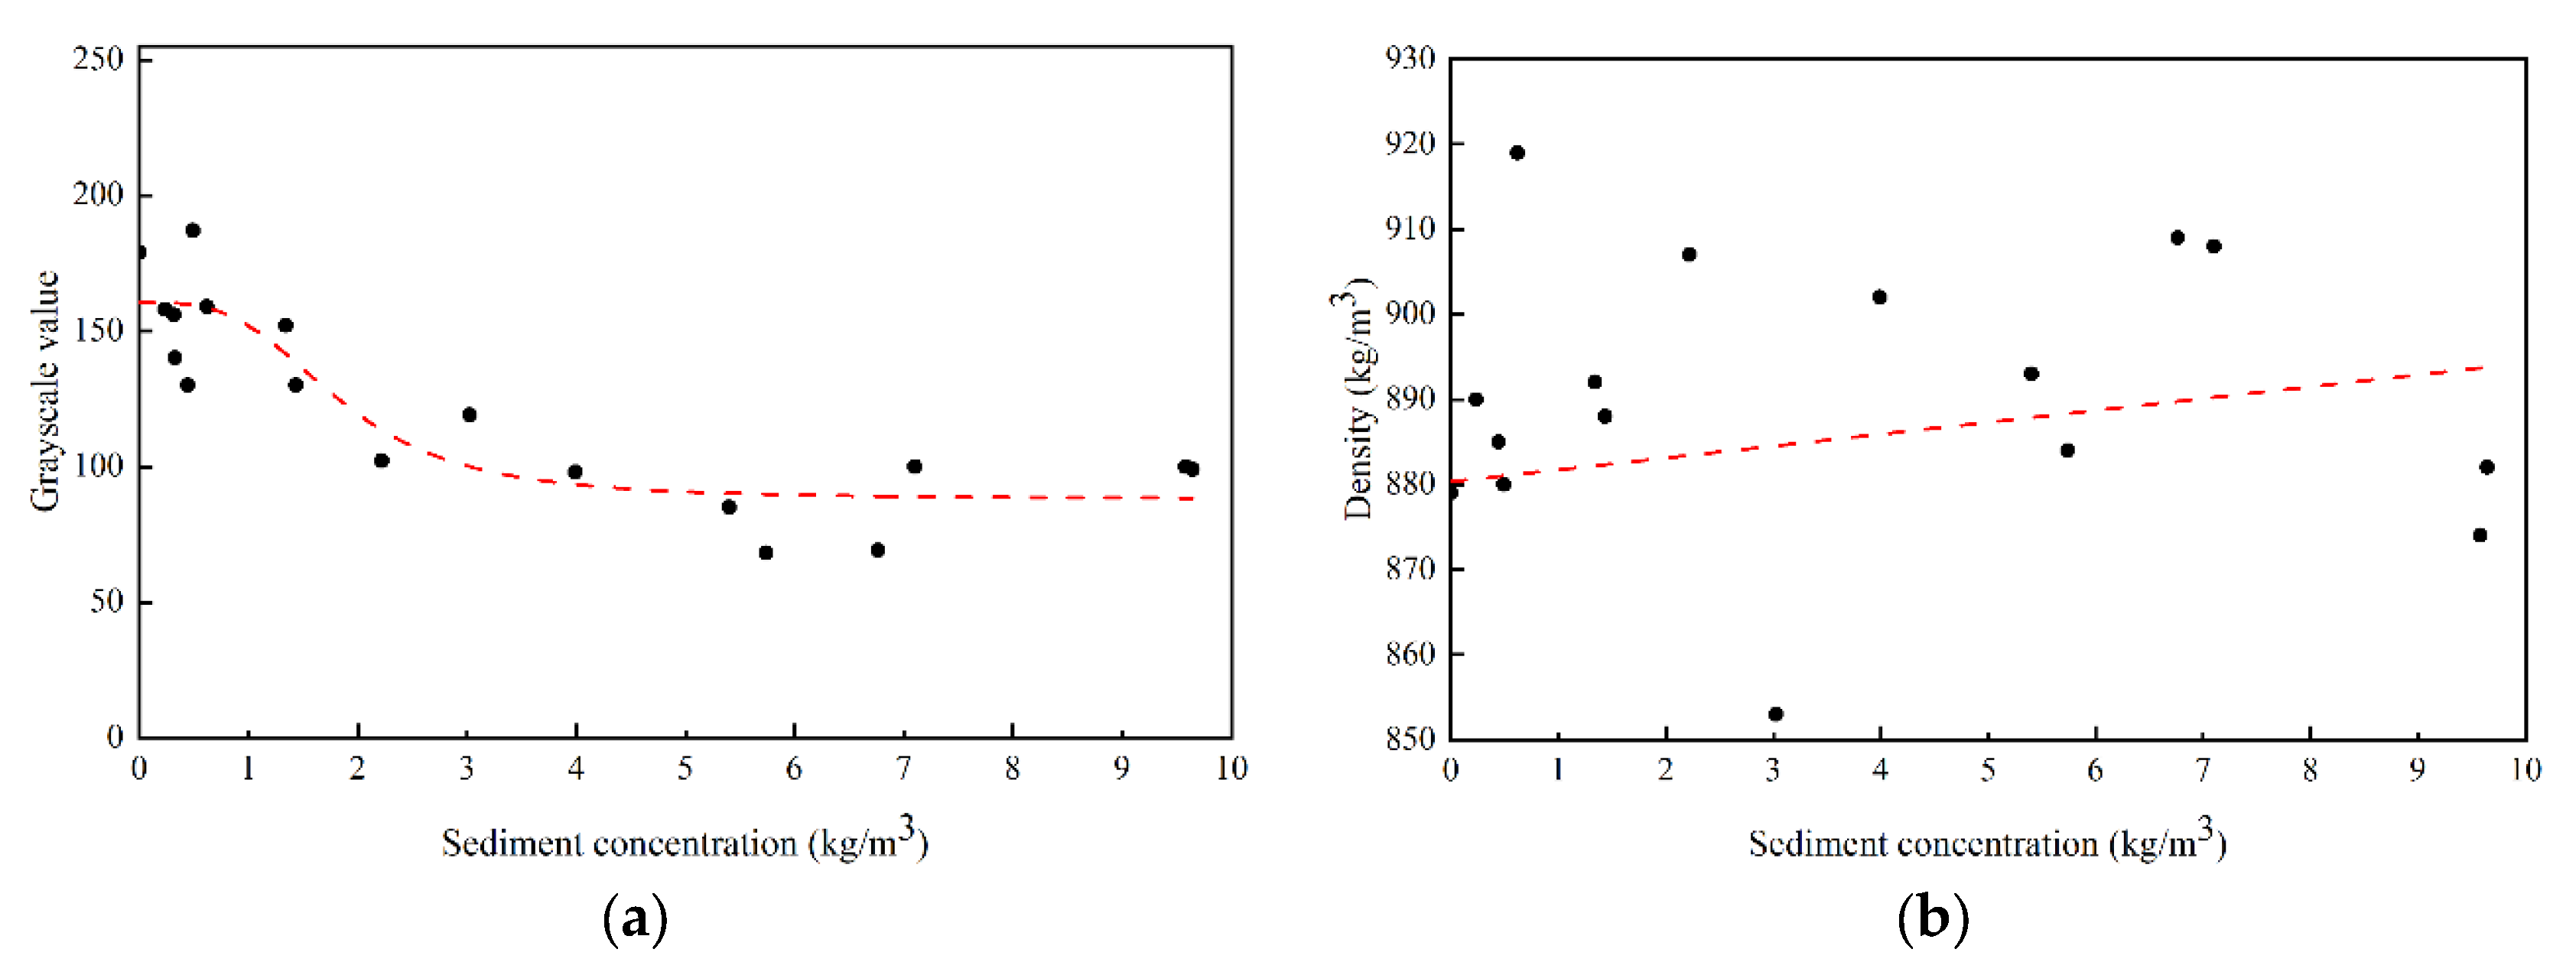
3.4. Ice Density and Sediment Concentration

The ice density and sediment concentration of the ice samples were measured and the results were statistically analyzed, as shown in Figure 11. The density of the ice samples varied from 837 to 918 kg/m3. The ice density across various river channel types in the Inner Mongolia reach of the Yellow River exhibits substantial variability, reflecting the complexity of channel boundary conditions and hydrodynamics. The presence of numerous bubbles, pores, and impurities within the ice significantly influences its density. Analysis of ice density at various locations indicates that columnar ice consistently exhibits higher density than granular ice; however, no clear stratified distribution pattern is observed along the vertical profile of ice thickness. In the Shishifenzi Bend and Shaxintan channel, the density of granular ice displays pronounced fluctuations, likely attributable to channel morphology, which promotes increased sediment incorporation as well as a higher prevalence of pores and bubbles within the granular ice. These factors contribute to marked density stratification and heterogeneous variation. The density variation in columnar ice at the Dachengxi Railway Bridge and Sanhu River estuary is minimal, and its density consistently exceeds that of granular ice. This suggests that columnar ice formed under purely thermodynamic conditions contains fewer pores and impurities, resulting in a more homogeneous density profile. Given the high sediment load of the Yellow River, sediment is frequently incorporated into the ice matrix during freezing, making sediment concentration a key physical parameter in characterizing Yellow River ice. As can be seen from Figure 11b, the distribution of mud content in the ice along the depth direction is uneven, with large variations and lack of certain regularity, indicating that the sediment content brought by water flow at different river channel locations is different. Columnar ice generally grows under the action of thermodynamics. The ice is denser and has fewer pores than granular ice. The amount of sediment that can be directly frozen in the ice is limited. Granular ice, on the other hand, is greatly affected by the scouring of water flow. Sediment generally freezes in granular ice, which has a great impact on the ice density. Most of the sediment is frozen in the middle and lower parts of the ice layer, and the mud content of granular ice is greater than that of columnar ice. While sediment content in river ice varies across different sampling points, comparative analysis reveals that the sediment concentration in the main channel ice is significantly higher than in nearshore ice. Additionally, sediment levels exhibit considerable variability at different depths within the ice layer, accompanied by complex changes in the crystalline structure.

4. Discussion

Using the acquired ice sample images, distinct grayscale values were assigned to various regions of the samples. These grayscale values were then correlated with the ice sample’s density and sediment content, allowing for comprehensive statistical analysis and integration. The results are shown in Figure 12. Figure 12a shows the relationship between grayscale value and mud content. The grayscale value range is 0–255. After grayscale conversion of different ice sample images, the values are mostly between 100 and 200. As the sediment content increases, the color of the ice sample becomes darker, so the grayscale value of this area will be significantly lower than that of the area with low sediment content, indicating that the mud content has a great influence on the grayscale value. As the sediment content increases, the grayscale value shows a downward trend. Figure 12b shows the relationship between ice density and sediment content. It can be found that the distribution of sediment content and density is relatively discrete, the correlation is not significant, and the fluctuation range of density and mud content is large. However, if the mud content in the ice increases, the density of the ice will still increase accordingly, which shows that the mud content is only one of the factors affecting the change in ice density. The density will also be affected by multiple factors such as bubbles, pores, unfrozen water, and frazil ice attachment in the ice. Based on this, detailed analysis of gray value and sediment concentration can also be used as a future research direction. Due to the numerous and intricate factors that influence ice density across various river sections, conducting quantitative research on these determinants represents a significant avenue for future investigation.
Comparative analysis of crystals from various river channel types reveals that the formation of different crystal types is influenced by multiple factors, including hydraulic dynamics, thermodynamic conditions, channel morphology, and anthropogenic activities. The variable channel morphology and intricate hydrodynamic conditions of the Yellow River contribute to the complexity of its ice crystal structures. The types of ice crystal structures vary across different sampling points, and even within the same river section, distinct variations are observed. Additionally, the proportion of granular and columnar ice within the total ice thickness differs by location. The structural types of ice crystals exhibit significant variability across different temporal and spatial scales. Within the same river section, ice crystal structures at various sampling locations also demonstrate distinct characteristics, including irregular shapes and considerable variations in size. Furthermore, the proportions of granular ice and columnar ice relative to the total ice thickness differ among the various sampling sites [41,42]. The development of columnar ice is primarily influenced by thermodynamic factors, resulting in a relatively stable growth process. In contrast to river ice, which exhibits greater complexity, lake ice predominantly consists of columnar ice [31]. Consequently, the intricate nature of river ice crystals constitutes a significant focus of this study and will remain a pertinent area of investigation in future research. In contrast, granular ice growth is affected by a multitude of factors, including crushed ice, drifting ice, impurities, and temperature fluctuations. Generally, the crystal area of granular ice is smaller than that of columnar ice, with most ice samples containing numerous air bubbles, pores, and impurities. Due to the complex river channel shape, during the supercooling process of water, many ice crystals will form in the river channel. The ice crystals can be suspended in the water flow and constantly adsorb and aggregate with other ice crystals to form frazil ice. Under the action of the water flow, the frazil ice and drift ice from the upstream can dive under the ice sheet due to the drag force of the water flow. The diving frazil ice and drift ice will be inserted or adsorbed on the bottom of the downstream ice layer [43,44]. In the observation of ice crystal structure, it was found that many crystals were attached with frazil ice, and there were also many frazil ice particles accumulated. When frazil ice and drift ice freeze in the original ice layer of the river under the action of thermodynamics, it not only increases the thickness of the original ice layer, but also changes the structural characteristics of the original ice layer, resulting in the discontinuity of the crystal structure of the Yellow River ice. There are fewer ice crystals with a single structure, and it is mainly manifested as the alternation of ice crystals with multiple structures, and the emergence of a special frazil ice crystal structure [9]. Different sampling points and different river channel types have different freezing depths and ice thicknesses, which are mainly related to the original thickness of the ice and the effect of the water flow under the ice. Higher flow rates exert a more significant impact on frazil ice formation and enhance the water flow’s ice-carrying capacity. When frazil ice particles are small, their friction with the underside of the ice layer is minimal, allowing them to be transported downstream by the current. Conversely, larger frazil ice particles are more likely to adhere to the ice bottom and, as temperatures decrease, become incorporated into the basal ice layer through further freezing [45]. Due to the complex hydrodynamic conditions in the Yellow River, the subglacial flow velocities at different locations in the river are different, resulting in different thicknesses of frazil ice accumulated under the ice at different locations in the river. As a result, it was found that the thickness of frazil ice frozen at the bottom of the ice layer at different locations in the river was different, which ultimately made the crystal structure of the Yellow River ice layer complex. Frazil ice found in the river can be collected utilizing specialized equipment designed for frazil ice harvesting [46]. Furthermore, the particle size of the frazil ice can be assessed through laboratory measurements and comparative analyses of relevant influencing factors [47,48]. Therefore, further study on the special frazil ice composition and crystal structure of different river sections is also a future research direction.

5. Conclusions

Through the analysis and comparisons of the changing process of open water at different river channel locations in the Inner Mongolia section of the Yellow River as well as the formation and microstructure of ice samples, the results indicate that the open waters created by the Dachengxi Railway Bridge and the Shishifenzi Bend exhibit distinct shapes and dynamic changes. The ice in the mainstream areas freezes rapidly, whereas the ice in non-mainstream areas develops more slowly under the same temperature conditions. During the melting phase, the changes observed on the right bank are considerably more pronounced than those on the left bank. The ice formation in the Yellow River is characterized predominantly by two morphologically distinct types: granular and columnar ice structures. The crystalline composition exhibits remarkable heterogeneity across diverse channel configurations. In straight river segments and sections incorporating single-line bridges, columnar ice formations demonstrate clear predominance. Notably, in curved river segments and alternative channel configurations, where complex boundary conditions exert significant influence, the ice manifests primarily as granular formations or presents a sophisticated alternating pattern of columnar and granular ice architectures. In regions where freezing occurs subsequent to open-water formation, the ice crystals predominantly manifest as columnar structures. Observational and statistical analyses of ice crystals at various locations along the Yellow River reveal that granular ice constitutes the majority of the ice formations, whereas columnar ice represents a comparatively smaller proportion. The growth of columnar ice is relatively stable, primarily influenced by thermodynamic factors. Compared to granular ice, columnar ice features fewer grain boundaries, reduced porosity, and less sediment accumulation. Additionally, certain river channels exhibit the presence of frazil ice and snow-derived ice formations. The equivalent diameter of granular ice predominantly ranges from 2 to 8 mm, while columnar ice exhibits equivalent diameters primarily between 6 and 12 mm. With increasing depth, the ice layer demonstrates a progressive enhancement in the proportion of larger crystal formations, characterized by alternating sequences of granular and columnar ice strata, and the crystal dimensions display distinct maxima at various depths. The mean equivalent diameter of granular ice is demonstrably smaller than that of columnar ice, with a notably lower frequency of large-scale crystal formations. In contrast, columnar ice exhibits a higher proportion of large-scale crystals and demonstrates a more uniform size distribution pattern. The vertical distribution of ice density and sediment content in ice samples collected from various sampling sites along the Inner Mongolia reach of the Yellow River exhibits no discernible patterns with depth. The crystal equivalent diameter, ice density, and sediment content demonstrate variability across different crystalline structures, primarily influenced by channel morphology and ice formation environmental conditions. Analysis of ice sample images reveals that distinct regions are characterized by varying grayscale values, demonstrating a significant inverse correlation between grayscale intensity and sediment concentration. Specifically, lower grayscale values correspond to higher sediment content within the ice. Research indicates that columnar ice consistently exhibits higher density values compared to granular ice formations. While sediment content represents one contributing factor to ice density variations, the observed density fluctuations are attributed to a complex interplay of multiple variables.

Author Contributions

Conceptualization, Y.L. and C.L.; methodology, Y.L.; software, Y.L. and C.L.; validation, Y.L., X.F., and P.L.; formal analysis, Y.L.; investigation, Y.L., X.F., and S.H.; resources, C.L. and P.L.; data curation, C.L.; writing—original draft preparation, Y.L.; writing—review and editing, Y.L., C.L., and P.L.; visualization, Y.L. All authors have read and agreed to the published version of the manuscript.

Funding

This research was supported by Joint Funds of the National Natural Science Foundation of China (U23A2012), Natural Science Foundation of Inner Mongolia Autonomous Region of China (2025MS05122), Keju Plan of Inner Mongolia University of Science and Technology (KJJH2024910).

Data Availability Statement

The data presented in this study are available upon request from the first author.

Acknowledgments

The authors are grateful to the members of the research group who helped collect ice samples. The authors thank the editor and anonymous reviewers for their valuable comments and suggestions to this paper.

Conflicts of Interest

The authors declare no conflicts of interest.

References

  1. Gao, G.; Deng, Y.; Tian, Z.; Liu, S.; Zhang, B. Brief Introduction and Prospect of Recent Ice Research in the Yellow River. Yellow River 2019, 41, 77–81+108. (In Chinese) [Google Scholar]
  2. Bhambri, R.; Hewitt, K.; Kawishwar, P.; Kumar, A.; Verma, A.; Tiwari, S.; Misra, A. Ice-dams, outburst floods, and movement heterogeneity of glaciers, Karakoram. Glob. Planet. Change 2019, 180, 100–116. [Google Scholar] [CrossRef]
  3. Tuo, Y.; Deng, Y.; Li, J.; Li, N.; Li, K.; Wei, L.; Zhao, Z. Effects of dam reconstruction on thermal-ice regime of Fengman Reservoir. Cold Reg. Sci. Technol. 2018, 146, 223–235. [Google Scholar] [CrossRef]
  4. Zhao, S.; Li, C.; Li, C.; Shi, X.; Zhao, S. Processes of river ice and ice-jam formation in Shensifenzi Bend of the Yellow River. J. Hydraul. Eng. 2017, 48, 351–358. (In Chinese) [Google Scholar] [CrossRef]
  5. Yang, X.; Pavelsky, T.M.; Allen, G.H. The past and future of global river ice. Nature 2020, 577, 69–73. [Google Scholar] [CrossRef]
  6. Liu, B.; Ji, H.; Zhai, Y.; Luo, H. Estimation of river ice thickness in the Shisifenzi reach of the Yellow River with remote sensing and air temperature data. IEEE J. Sel. Top. Appl. Earth Obs. Remote Sens. 2023, 16, 5645–5659. [Google Scholar] [CrossRef]
  7. Wang, T.; Guo, X.; Liu, J.; Chen, Y.; She, Y.; Pan, J. Ice Process Simulation on Hydraulic Characteristics in the Yellow River. J. Hydraul. Eng. 2024, 150, 05024001. [Google Scholar] [CrossRef]
  8. Huang, W.; Li, Z.; Han, H.; Niu, F.; Lin, Z.; Leppäranta, M. Structural analysis of thermokarst lake ice in Beiluhe Basin, Qinghai–Tibet Plateau. Cold Reg. Sci. Technol. 2012, 72, 33–42. [Google Scholar] [CrossRef]
  9. Zhang, Y.; Li, Z.; Li, C.; Zhang, B.; Deng, Y. Microstructure characteristics of river ice in Inner Mongolia section of the Yellow River and its influencing factors. J. Hydraul. Eng. 2021, 52, 1418–1429. [Google Scholar] [CrossRef]
  10. Michel, B.; Ramseier, R.O. Classification of river and lake ice. Can. Geotech. J. 1971, 8, 36–45. [Google Scholar] [CrossRef]
  11. Eicken, H.; Lange, M.A. Development and properties of sea ice in the coastal regime of the southeastern Weddell Sea. J. Geophys. Res. Ocean. 1989, 94, 8193–8206. [Google Scholar] [CrossRef]
  12. Langway, C.C. Ice fabrics and the universal stage. In Technical Report 62; Department of Defense, Department of the Army, Corps of Engineers, Snow Ice and Permafrost Research Establishment: Wilmette, IL, USA, 1959. [Google Scholar]
  13. Wilen, L.A.; Diprinzio, C.L.; Alley, R.B.; Azuma, N. Development, principles, and applications of automated ice fabric analyzers. Microsc. Res. Tech. 2023, 62, 2–18. [Google Scholar] [CrossRef] [PubMed]
  14. Arnaud, L.; Gay, M.; Barnola, J.M.; Duval, P. Imaging of firn and bubbly ice in coaxial reflected light: A new technique for the characterization of these porous media. J. Glaciol. 1998, 44, 326–332. [Google Scholar] [CrossRef]
  15. Azuma, N.; Wang, Y.; Yoshida, Y.; Narita, H.; Hondoh, T.; Shoji, H.; Watanabe, O. Crystallographic analysis of the Dome Fuji ice core. In Physics of Ice Core Records; Hokkaido University: Sapporo, Japan, 2000; pp. 45–61. Available online: https://eprints.lib.hokudai.ac.jp/dspace/bitstream/2115/32461/1/P45-61.pdf (accessed on 23 June 2025).
  16. Kipfstuhl, S.; Hamann, I.; Lambrecht, A.; Freitag, J.; Faria, S.H.; Grigoriev, D.; Azuma, N. Microstructure mapping: A new method for imaging deformation-induced microstructural features of ice on the grain scale. J. Glaciol. 2006, 52, 398–406. [Google Scholar] [CrossRef]
  17. Li, Z.; Huang, W.; Jia, Q.; Leppäranta, M. Distributions of crystals and gas bubbles in reservoir ice during growth period. Water Sci. Eng. 2011, 4, 204–211. [Google Scholar]
  18. Kaempfer, T.U.; Schneebeli, M.; Sokratov, S.A. A microstructural approach to model heat transfer in snow. Geophys. Res. Lett. 2005, 32, 1. [Google Scholar] [CrossRef]
  19. Golden, K.M.; Eicken, H.; Heaton, A.L.; Miner, J.; Pringle, D.J.; Zhu, J. Thermal evolution of permeability and microstructure in sea ice. Geophys. Res. Lett. 2007, 34, L16501. [Google Scholar] [CrossRef]
  20. Mercier, O.R.; Hunter, M.W.; Callaghan, P.T. Brine diffusion in first-year sea ice measured by Earth’s field PGSE-NMR. Cold Reg. Sci. Technol. 2005, 42, 96–105. [Google Scholar] [CrossRef]
  21. Cho, H.; Shepson, P.B.; Barrie, L.A.; Cowin, J.P.; Zaveri, R. NMR investigation of the quasi-brine layer in ice/brine mixtures. J. Phys. Chem. B 2002, 106, 11226–11232. [Google Scholar] [CrossRef]
  22. Schulson, E.M. The brittle compressive fracture of ice. Acta Metall. Mater. 1990, 38, 1963–1976. [Google Scholar] [CrossRef]
  23. Peng, W.; Zhu, Y.; Zhang, J. Effects of grain size on the unixal compressive strength of polycrystalline ice. Mech. Eng. 1998, 4, 37–39. (In Chinese) [Google Scholar]
  24. Gao, Z.; Deng, Y.; Zhang, P.; Wang, J. Evaluation of fracture behavior of Yellow River ice based on three-point bending test and PSO-BP model. Theor. Appl. Fract. Mech. 2022, 122, 103644. [Google Scholar] [CrossRef]
  25. Deng, Y.; Wang, J.; Li, Z. Numerical simulation of uniaxial compression failure process of river ice. J. Hydraul. Eng. 2018, 49, 1339–1345. (In Chinese) [Google Scholar] [CrossRef]
  26. Liu, H.; Ji, H.; Mou, X.; Gao, G.; Zhang, B. Experimental study on Yellow River ice thickness monitoring testbased on UAV Radar technology. South-to-North Water Transf. Water Sci. Technol. 2020, 18, 217–224. (In Chinese) [Google Scholar]
  27. Li, Z.; Li, C.; Yang, Y.; Zhang, B.; Deng, Y.; Li, G. Physical scheme and parametrization by using air temperature and ice thickness to improve accuracy of GPR propagation velocity in Yellow River ice. J. Hydraul. Eng. 2022, 53, 902–913. (In Chinese) [Google Scholar] [CrossRef]
  28. Li, Z.; Jia, Q.; Zhang, B.; Leppäranta, M.; Lu, P.; Huang, W. Influences of gas bubble and ice density on ice thickness measurement by GPR. Appl. Geophys. 2010, 7, 105–113. [Google Scholar] [CrossRef]
  29. Li, C.; Li, Z.; Huang, W.; Zhang, B.; Deng, Y.; Li, G. Morphology dynamics of ice cover in a river bend revealed by the UAV-GPR and Sentinel-2. Remote Sens. 2023, 15, 3180. [Google Scholar] [CrossRef]
  30. Cao, X.; Li, C.; Yan, X.; Wu, Y.; Li, Z. Measuring ice thickness around the curve and piers in the Yellow River with ground penetrating radar. South-to-North Water Transf. Water Sci. Technol. 2016, 14, 91–95. (In Chinese) [Google Scholar]
  31. Huang, W.; Li, Z.; Han, H.; Jia, Q. Seasonal evolution of static freshwater lake ice microstructures and the effects of growth processes. J. Glaciol. Geocryol. 2016, 38, 699–707. (In Chinese) [Google Scholar]
  32. Huang, W.; Li, Z.; Niu, F.; Lin, Z. Structural features of the rmokarst lake ice in Beiluhe Basin of Qinghai-Tibet Plateau. J. Hydraul. Eng. 2011, 42, 1277–1282. (In Chinese) [Google Scholar] [CrossRef]
  33. Cole, D.M. The microstructure of ice and its influence on mechanical properties. Eng. Fract. Mech. 2001, 68, 1797–1822. [Google Scholar] [CrossRef]
  34. Lieb-Lappen, R.M.; Golden, E.J.; Obbard, R.W. Metrics for interpreting the microstructure of sea ice using X-ray micro-computed tomography. Cold Reg. Sci. Technol. 2017, 138, 24–35. [Google Scholar] [CrossRef]
  35. Li, Z.; Jia, Q.; Huang, W.; Li, C. Characteristics of ice crystals air bubbles and densities of fresh ice in a reservoir. J. Hydraul. Eng. 2009, 40, 1333–1338. [Google Scholar]
  36. Huang, W.; Lei, R.; Ilkka, M.; Li, Q.; Wang, Y.; Li, Z. The physical structures of snow and sea ice in the Arctic section of 150°-180° W during the summer of 2010. Acta Oceanol. Sin. 2013, 32, 57–67. [Google Scholar] [CrossRef]
  37. Li, Y.; Kipfstuhl, S.; Huang, M. Ice microstructure and fabric of Guliya ice cap in Tibetan plateau, and comparisons with vostok3G-1, EPICA DML, and north GRIP. Crystals 2017, 7, 97. [Google Scholar] [CrossRef]
  38. Shi, L.; Li, Z.; Niu, F.; Huang, W.; Lu, P.; Feng, E.; Han, H. Thermal diffusivity of the rmokarst lake ice in the Beiluhe basin of the Qinghai–Tibetan Plateau. Ann. Glaciol. 2014, 55, 153–158. [Google Scholar] [CrossRef]
  39. Faria, S.H.; Weikusat, I.; Azuma, N. The microstructure of polar ice. Part II: State of the art. J. Struct. Geol. 2014, 61, 21–49. [Google Scholar] [CrossRef]
  40. Li, Z.; Kang, J. Crystals and Fabrics of an Arctic Multi-Year Ice Sample. J. Glaciol. Geocryol. 2001, 23, 383–388. [Google Scholar]
  41. Zhang, Y.; Gao, G.; Deng, Y.; Li, Z.; Li, G.; Guo, W. Investigation on Ice Crystal, Density and Sediment Content in Ice at Different Positions in Bayannaoer Section of the Yellow River. Yellow River 2018, 40, 44–48. (In Chinese) [Google Scholar]
  42. Deng, Y.; Li, Z.; Wang, J.; Xu, L. The microstructure of Yellow River ice in the freezing period. Crystals 2019, 9, 484. [Google Scholar] [CrossRef]
  43. Beltaos, S. Progress in the study and management of river ice jams. Cold Reg. Sci. Technol. 2008, 51, 2–19. [Google Scholar] [CrossRef]
  44. Shen, H.T. Mathematical modeling of river ice processes. Cold Reg. Sci. Technol. 2010, 62, 3–13. [Google Scholar] [CrossRef]
  45. Luo, H.; Ji, H.; Gao, G.; Zhang, B.; Mou, X. Study on the characteristics of flow and ice jam in Shisifenzi bend in the Yellow River during the freeze-up period. J. Hydraul. Eng. 2020, 51, 1089–1100. [Google Scholar] [CrossRef]
  46. Zhang, Y.; Li, Z.; Xiu, Y.; Li, C.; Zhang, B.; Deng, Y. Microstructural Characteristics of Frazil Particles and the Physical Properties of Frazil Ice in the Yellow River, China. Crystals 2021, 11, 617. [Google Scholar] [CrossRef]
  47. McFarlane, V.; Loewen, M.; Hicks, F. Measurements of the evolution of frazil ice particle size distributions. Cold Reg. Sci. Technol. 2015, 120, 45–55. [Google Scholar] [CrossRef]
  48. Morse, B.; Richard, M. A field study of suspended frazil ice particles. Cold Reg. Sci. Technol. 2009, 55, 86–102. [Google Scholar] [CrossRef]
Figure 1. (a) Yellow River Basin; (b) the Inner Mongolia section of the Yellow River; (c) Sanhukou straight river channel; (d) Dachengxi Railway Bridge; (e) Shishifenzi Bend; (f) Qianfangzi double-track bridge; (g) Shaxintan river channel.
Water 17 01898 g001
Figure 2. Changes in the open−water area of the Dachengxi Railway Bridge. (a) 19 December 2023; (b) 3 January 2024; (c) 28 January 2024; (d) 17 February 2024; (e) 3 March 2024; (f) 18 March 2024.
Water 17 01898 g002
Figure 3. (a) Open−water area and temperature change process of Dachengxi Railway Bridge; (b) the proportion of open−water length relative to different riverbank sections; (c) the distance of open water from the left and right banks of the riverbank section.
Water 17 01898 g003
Figure 4. Changes in the open−water area in Shishifenzi Bend. (a) 19 December 2023; (b) 3 January 2024; (c) 28 January 2024; (d) 17 February 2024; (e) 3 March 2024; (f) 18 March 2024.
Water 17 01898 g004
Figure 5. (a) The open−water area and temperature changes in the Shishifenzi Bend; (b) the length of the open−water area relative to different riverbank sections; (c) the distance of the open−water area from the left and right banks of the riverbank section.
Water 17 01898 g005
Figure 6. Types of ice crystal structures after freezing in open water. (a) DXC1#; (b) SSFZ2#.
Water 17 01898 g006
Figure 7. Ice crystal structures at different river locations in the Inner Mongolia section.
Water 17 01898 g007
Figure 8. Distribution of ice crystal equivalent diameter.
Water 17 01898 g008
Figure 9. The proportion of different types of ice crystals at different depths. (a) Columnar ice; (b) granular ice.
Water 17 01898 g009
Figure 10. Variation in equivalent diameter of crystal structure along depth in different channel positions of the Yellow River in Inner Mongolia.
Water 17 01898 g010
Figure 11. Ice density and sediment concentration in the Inner Mongolia section of the Yellow River (a) Density; (b) sediment concentration.
Water 17 01898 g011
Figure 12. (a) Variation in grayscale value of ice samples at different river positions with sediment concentration; (b) relationship between ice sample density and sediment concentration.
Water 17 01898 g012
Table 1. Basic information of sampling points.
Sampling PointLongitude (E)Latitude (S)River Channel TypeIce Thickness (cm)
SHHK1#108°46′24.70″40°36′23.88″Straight River38
DXC1#110°23′52.49″40°25′33.00″Single-track bridge52
SSFZ1#111°25′58.98″40°17′42.67″Bend River68
SSFZ2#111°26′44.16″40°17′42.12″Bend River48
SSFZ3#111°27′20.81″40°17′40.48″Bend River32
QFZ1#111°20′7.44″40°7′12.48″Double-track bridge51
QFZ2#111°20′8.97″40°7′11.16″Double-track bridge49
SXT1#111°19′19.63″40°7′42.96″Shaxintan river channel64
Disclaimer/Publisher’s Note: The statements, opinions and data contained in all publications are solely those of the individual author(s) and contributor(s) and not of MDPI and/or the editor(s). MDPI and/or the editor(s) disclaim responsibility for any injury to people or property resulting from any ideas, methods, instructions or products referred to in the content.

