Article

Mechanisms of Nitrogen Cycling Driven by Salinity in Inland Plateau Lakes, Based on a Haline Gradient Experiment Using Pangong Tso Sediment

1
Chongqing Academy of Ecological and Environmental Sciences (Southwest Branch of Chinese Research Academy of Environmental Sciences), Chongqing 401147, China
2
Key Laboratory of the Three Gorges Reservoir Regions Eco-Environment of Ministry of Education, College of Environment and Ecology, Chongqing University, Chongqing 400044, China
3
Chengdu Fire Protection and Rescue Research Center, Chengdu 610405, China
*
Author to whom correspondence should be addressed.
Water 2025, 17(12), 1797; https://doi.org/10.3390/w17121797
Submission received: 17 April 2025 / Revised: 11 June 2025 / Accepted: 12 June 2025 / Published: 16 June 2025

Abstract

Pangong Tso, a typical plateau lake exhibiting an east-to-west gradient from freshwater to saline conditions, was used to simulate the migration and transformation of nitrogen compounds under different salinity conditions. This study systematically investigates the effects of salinity on nitrogen cycling and transformation in Pangong Tso sediments from 12 sites through controlled laboratory experiments and field monitoring across 120 sites. The data analysis method includes correlation analysis, ANOVA, structural equation modeling (SEM), and mixed-effects modeling (MEM). The results demonstrate that salinity significantly affects nitrogen cycling in plateau lakes. Salinity inhibits nitrification, resulting in an accumulation of ammonium nitrogen (NH4+-N), while simultaneously suppressing gaseous nitrogen emissions through the inhibition of denitrification. Salinity has a significant negative effect on nitrite nitrogen (NO2-N), which is attributable to enhanced redox-driven transformations under hypersaline conditions. A salinity threshold of approximately 9‰ was identified, above which nitrite oxidation was strongly inhibited, consistent with the known high salinity sensitivity of nitrite-oxidizing bacteria (NOB). Higher salinity levels correlated positively with increased NH4+-N and total nitrogen (TN) concentrations in overlying water (p < 0.01), and were further supported by observed increases in dissolved organic nitrogen (DON) and dissolved total nitrogen (DTN) along with rising salinity, and vice versa.

1. Introduction

The Tibetan Plateau, as the “water tower of Asia”, has a lake ecosystem that demonstrates exceptional environmental sensitivity [1,2]. In recent years, due to global warming, melting glaciers, and increasing precipitation, lakes in this region have expanded significantly and showed a decreasing trend of salinity [3,4,5]. In the meantime, the nitrogen cycle process is being influenced by biological and geological chemical adjustments; salinity is a key factor and has influential impacts on the nitrogen transformation pathway, microbial community structure, and endogenous release process [6,7].
Studies indicate that many lakes on the Tibetan Plateau have experienced extensive declines in salinity over the past few decades [3,4,5,8,9]. The main driving factor includes annual precipitation [4], glacier recession and melting water increase [10], surface runoff increase, and lake expansion [11]; these environmental changes act together to impact the water balance and dilution effect of dissolved ions in lakes, which induced the salinity decrease in general [3,5].
The nitrogen cycle includes ammoniation, nitrification, denitrification, dissimilatory nitrate reduction (DNRA), and anaerobic ammonia oxidation (anammox) [12,13,14]. In Tibetan Plateau lakes, salt reduction can promote autotrophic microbial diversity and activity [6], while high salinity and alkalinity may inhibit the expression of denitrification genes [15].
The nitrogen cycle encompasses the processes of nitrogen enrichment, transformation, and release, and is closely related to the overall health of the ecological environment [9,16,17,18]. Sediments represent a crucial reservoir of the nitrogen cycle and serve as an essential source of nitrogen release [19]. Sediment nitrogen release potentials are sensitive to certain environmental factors, such as temperature, salinity, and redox statues [20,21,22,23,24]. An increase in salinity results in a decreased reduction in nitrates and nitrites to nitrogen gas (N2), thereby enhancing the nitrogen retention capacity [25]. Lake salinity rising inhibits denitrification in general. Saltwater pulses significantly inhibit denitrifying enzyme activity in freshwater peat soils as well [15,26]. The DNRA process may be less affected by salinity changes [27].
While numerous studies have explored the impact of salinity on the nitrogen cycle, experimental confirmation regarding the differentiation of nitrogen cycle pathways under varying salinity gradients in plateau lakes remains limited. Specifically, there is a scarcity of comparative investigations involving multi-point, long-term monitoring and laboratory validation in lakes with salinity gradients. Such comprehensive assessments are crucial for understanding the response of the nitrogen cycle and ecological risks associated with salinity changes in these environments.
To address the knowledge deficit regarding nitrogen cycling in plateau lakes, Pangong Tso (China) (Figure 1), a typical example of a plateau lake exhibiting an east-to-west gradient from freshwater to saline conditions, is assessed using controlled laboratory experiments under different salinity conditions, and the rates and pathways of nitrogen transformation in sediments are quantified. Simultaneously, water samples were collected from 120 locations, including overlying water and surface water, while monitoring salinity, NH4+-N, TN, NO3-N, and NO2-N indices. Structural equation modeling (SEM) and piecewise functions were used in conjunction with experimental data, and regression analysis employing the mixed-effects model (MEM) was performed on the monitoring outcomes.

2. Materials and Methods

2.1. Experimental Data Modeling Approach

2.1.1. Experimental Design

Via the surface sediment simulation method, sediment samples were collected from 12 sampling points (Figure 2) in Pangong Tso in May, July, and September of 2023, and were transported to the laboratory where the migration and transformation of contaminants in the sediment were simulated. In addition to the salinity of Pangong Tso, different gradients were set in order to study the effects of changes in water mineralization on the transport and transformation of NO3-N, NO2-N, TN, NH4+-N, and salinity at the water–sediment interface.
(1)
Sediment pretreatment protocol
The mud samples were sealed in polyethylene containers and kept cold until use. Prior to the experiment, the samples were brought to room temperature and then adjusted to the target experimental temperature. Visible impurities (e.g., plant debris, stones) were removed using a 1 mm nylon sieve. The sediments were then thoroughly homogenized by manual stirring with a sterile plastic spatula to ensure consistency. Various indicators were measured for use as the initial base values before the experiment started.
(2)
Setting up the experimental groups
For sampling, three simulation experiments were conducted in June, August, and October. The mud used for the experiments was a substrate collected in situ from 12 spots, and ultrapure water was used for the experiments. Three batches of experiments were conducted.
(3)
Haline gradient design
According to the salinity monitoring results obtained from 120 points in the Pangong Tso basin from May to September, the salinity range of the experimental gradient was appropriately adjusted to cover the existing salinity range of the water in Pangong Tso. Therefore, the haline gradient of the three batches of 12-point groups in the experiment was set to 0‰, 3‰, 6‰, 9‰, and 12‰, with different salinity experimental solutions using the “coarse sea salt (artificial sea salt) + ultrapure water mode” configuration. The artificial seawater was prepared by dissolving analytical-grade NaCl in ultrapure water to achieve the desired salinity gradients. The experimental apparatus was a cylindrical glass container with a volume of 1~2 L. The cylindrical glass container had an inner diameter of about 10 cm and a height of about 20 cm. And when the experimental sample was configured, ultrapure water and the substrate were added according to the volume ratio of 4:1, and the substrate distribution area was shaded.
(4)
Measurement indicators
In the experiment, five indices were measured: NO3-N, NO2-N, TN, NH4+-N, and salinity. In water quality analysis, to assess nitrogen NO3-N, ultraviolet (UV) spectrophotometry is generally employed to determine concentrations by measuring absorbance at a specific wavelength with a UV–visible spectrophotometer [28,29]. NO2-N was determined through its characteristic of reacting with azo dyes to form colored complexes, and these were quantitatively analyzed by measuring absorbance at 540 nm using a spectrophotometer. TN was determined using the chemical digestion spectrophotometric method, where the nitrogen compounds in the samples were first converted to NO3-N under acidic conditions and were then calorimetrically determined using a UV spectrophotometer. NH4+-N was determined through its reaction with salicylic acid under specific acid–base conditions, resulting in the formation of a yellow complex, and then was calorimetrically determined using a spectrophotometer, which is especially suitable for the detection of low concentrations of NH4+-N [18]. NO2-N quantification was conducted via spectrophotometry, following the guidelines of Chinese National Standard GB 7493-87 [30]. TN quantification was carried out using the alkaline potassium persulfate digestion UV spectrophotometric method, in strict adherence to Chinese National Standard HJ 636-2012 [31]. For the determination of salinity, the electrical conductivity (EC) method was utilized, where a conductivity meter measures the EC of the water sample and then estimates its salinity. A Shanghai INESA (Leici) DDS-307A conductivity meter was used for salinity detection.
(5)
Measurement time and requirements
The measurement times were 12 h, 1 d, 2 d, 4 d, 6 d, and 8 d after the beginning of the experiment. For each sample, a syringe or pipette gun was used to extract the appropriate amount of overlying water from the mud–water interface to enable the measurement of indicators. After sampling was completed, ultrapure water was slowly injected along the container wall until the original volume was reached, testing and adjusting the salinity of the overlying water, so that the salinity of the experimental groups was always maintained within the gradient value design.

2.1.2. Analytical Indices

At each time point, an appropriate volume of the surface water was extracted from the water–sediment interface using a syringe or pipette for index determination. After sampling, ultrapure water was meticulously injected along the container wall to restore the original volume. The salinity of the surface water was then tested and adjusted to ensure that the salinity of each experimental group remained at the designed gradient value. In instances where values fell below the detection limit, they were replaced with a small number, i.e., 0.0001.

2.1.3. Data Analysis Methods for Experimental Data

(1)
Experimental data fitting and analysis
Experimental data were first fitted using a first-order kinetic equation [22]:
C t = C 0 + k t
This was to determine pollutant release rates, where   C t and C 0 are the concentrations at time t and initial time, respectively (both in mg/L), t is time (hours), and k is the release rate constant (in mg·L−1·d−1). For each haline gradient (0‰, 3‰, 6‰, 9‰, and 12‰) and each of the nine pollutant indicators, linear regression analysis via the least squares method was employed to calculate k-values and evaluate model goodness of fit (R2 > 0.8 and p < 0.05 considered valid) [23]. When identifying threshold effects, linear relationships in the panel data were explored in order to discover whether a turning point threshold existed in the analysis of the effect of salinity on the rate of conversion of different nitrogen forms.
(2)
Model Integration and Analysis
Based on the above responses, this can be further refined into a path diagram for SEM and analyzed using the semopy package in Python 3.0. To investigate the coupled effects of salinity, time, and experimental batch on contaminant release, a three-way ANOVA was performed using Stata 17.0 with the following model equation:
a o v ( c o n c e n t r a t i o n   s a l i n i t y × t i m e + b a t c h )
The significance of the main effects and interactions were tested (α = 0.05). Stata 17.0 was used for mathematical model analysis and segmented linear regression, and Origin was used for data visualization.

2.2. Monitoring Data Modeling Approach

2.2.1. Monitoring Design

Surface water and overlying water samples were obtained from 120 locations (Figure 2), during the months of May, July, and September. The measurement methods are the same as Section 2.1.1 (4), following the national standards of China [30,31,32,33,34].

2.2.2. Data Analysis Methods for Monitoring Data

A comprehensive data analysis was performed. First, descriptive statistics were applied to the monitoring data to characterize their distribution, and boxplots were generated to visualize variability and identify potential outliers. Second, correlation analysis (CA) was conducted to evaluate the relationships between salinity and various nitrogen species (e.g., TN, NO3-N, NH4+-N) in both surface and overlying waters. Finally, a mixed-effects regression model (MEM) was constructed in Stata 17.0, with salinity as the fixed-effects independent variable and nitrogen species as dependent variables. Random effects were included to account for heterogeneity across water layers, water types, and sampling months. The model results were subsequently compared with those derived from controlled experimental conditions to ensure consistency and robustness.

3. Results and Discussion

3.1. Experimental Data Modeling

3.1.1. Significance Test of Correlation Coefficient and ANOVA

In terms of variance effects and system stability, the variance estimates of all variables were significant (p < 0.05), indicating that the interaction between salinity and nitrogen forms was statistically robust and that the dynamics of the whole system were regulated by a variety of factors (e.g., microbial activity and redox conditions). In addition, the weak positive effect of salinity on ammonia and other forms of nitrogen (coefficient < 0.01) suggests that a long-term reduction in salinity may trigger nonlinear ecological risks (Table 1).
The ANOVA results indicated that the salinity, time, and batch factors have significant effects on the response variable, and these effects on factor concentrations can be examined separately without concern for confounding via interactions (Table 2).

3.1.2. Structural Equation Modeling (SEM)

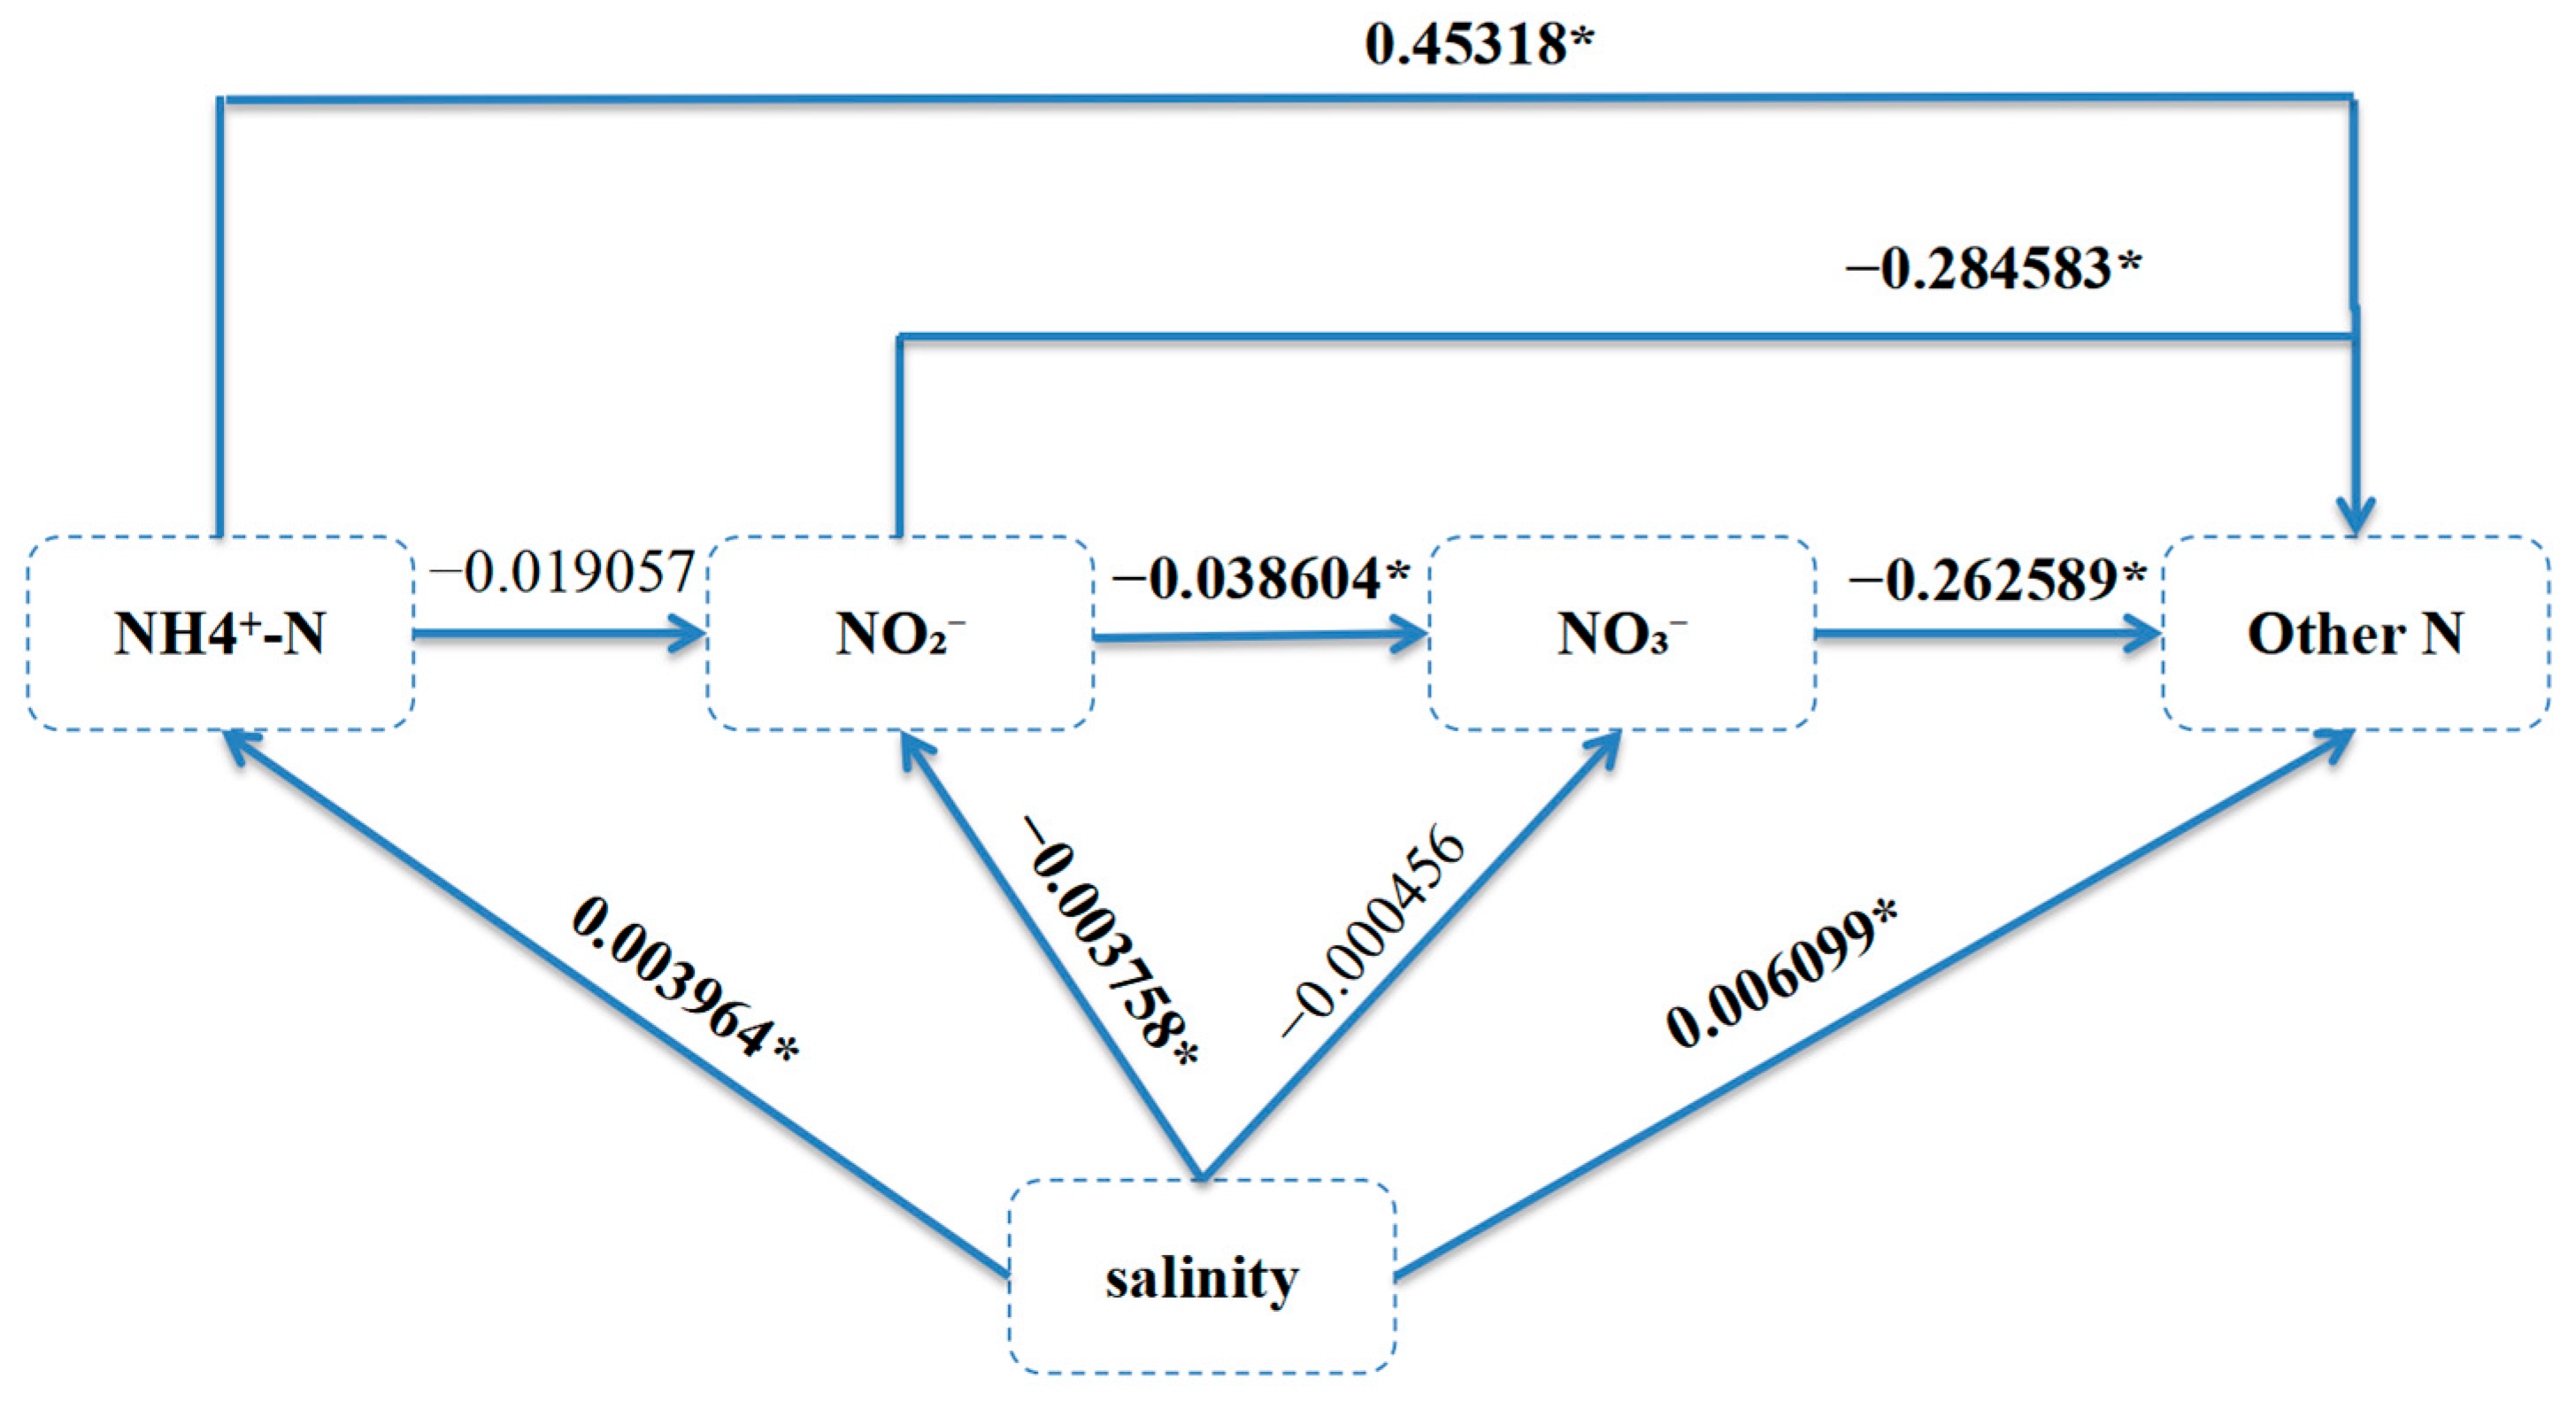
In this study, direct and varying effects among salinity, NH4+-N, NO2-N, NO3-N, and other forms of nitrogen (other_N) were analyzed using structural equation modeling (SEM). The variance estimates for all variables were statistically significant (p < 0.05), indicating there were significant interactions between these variables.
Salinity has different effects on the transport and transformation of different forms of nitrogen. The figure above shows statistically significant positive correlations between salinity and both NH4+-N and other forms of nitrogen (other_N). Specifically, for every 1 unit increase in salinity, the level of ammonia nitrogen increases by 0.004 units, while the increase in other_N was more significant (correlation coefficient of 0.006). In contrast, salinity had a significant inhibitory effect on NO2-N with a correlation coefficient of −0.0038, suggesting that an increase in salinity may lead to a decrease in NO2-N concentration.
In terms of variance effects, the variance estimates for all variables were statistically significant (p < 0.05). Salinity (salinity) had a slight positive but statistically significant effect on NH4+-N with a correlation coefficient of 0.003964, indicating that the concentration of NH4+-N increased slightly with increasing salinity. Salinity had a slightly positive effect on other_N with a correlation coefficient of 0.006099. Salinity had a significant negative effect on NO2-N with a correlation coefficient of −0.003758, indicating that an increase in salinity may lead to a decrease in NO2-N concentration. NH4+-N had a significant positive effect on other nitrogen (other_N), with a correlation coefficient of 0.45318, which is a relatively strong positive relationship, indicating that an increase in ammonia nitrogen significantly enhances the concentration of other forms of nitrogen. NO2-N had a significant negative effect on other nitrogen (other_N) with a correlation coefficient of −0.284583, indicating that an increase in NO2-N can lead to a decrease in other forms of nitrogen. NO3-N also had a significant negative effect on other_N, with a correlation coefficient of −0.262589, which also indicates that an increase in NO3-N may lead to a decrease in other forms of nitrogen.
The direct and variance effects between salinity and different nitrogen forms were analyzed thoroughly using SEM (Table 3, Figure 3), which revealed the multi-scale regulation mechanism of salinity in the nitrogen cycle. The results showed that the direct effects of salinity on nitrogen forms were mainly reflected in the following: Firstly, for every 1 unit increase in salinity, the concentration of NH4+-N increased significantly by about 0.004 units (correlation coefficient of 0.003964), which can be attributed to the fact that salinity inhibited the activity of nitrifying microorganisms, thus slowing down the conversion process of ammonia nitrogen into nitrite and NO3-N. Secondly, the positive effect of salinity on other forms of nitrogen (other_N) was more significant (correlation coefficient of 0.006099), suggesting that salinity may reduce the loss of gaseous nitrogen by inhibiting denitrification. In addition, salinity significantly decreased NO2-N concentration (correlation coefficient of −0.003758), which may be due to the rapid oxidation (to NO3-N) or reduction (to N2O/N2) of nitrite under highly saline conditions. In terms of interactions between different nitrogen forms, ammoniacal nitrogen had a significant positive effect on other nitrogen forms, with a significant increase of 0.453 units for every 1 unit increase in ammoniacal nitrogen concentration (correlation coefficient of 0.45318), emphasizing the position of ammoniacal nitrogen as a ‘core node’ in the nitrogen cycle, possibly through nitrification (NH4+→NO2→NO3), thus driving the transformation of nitrogen forms. In addition, there was a strong negative effect (correlation coefficient of −0.284583) between NO2-N and other forms of nitrogen, which may be due to the rapid oxidation of nitrite to NO3-N or its participation in the denitrification process, resulting in the depletion of other forms of nitrogen. NO3-N exhibited a significant negative feedback effect on other nitrogen forms (correlation coefficient of −0.262589), potentially inhibiting upstream nitrogen transformation.

3.1.3. Analysis of the Effect of Salinity on the Conversion Rate of the Nitrogen Cycle

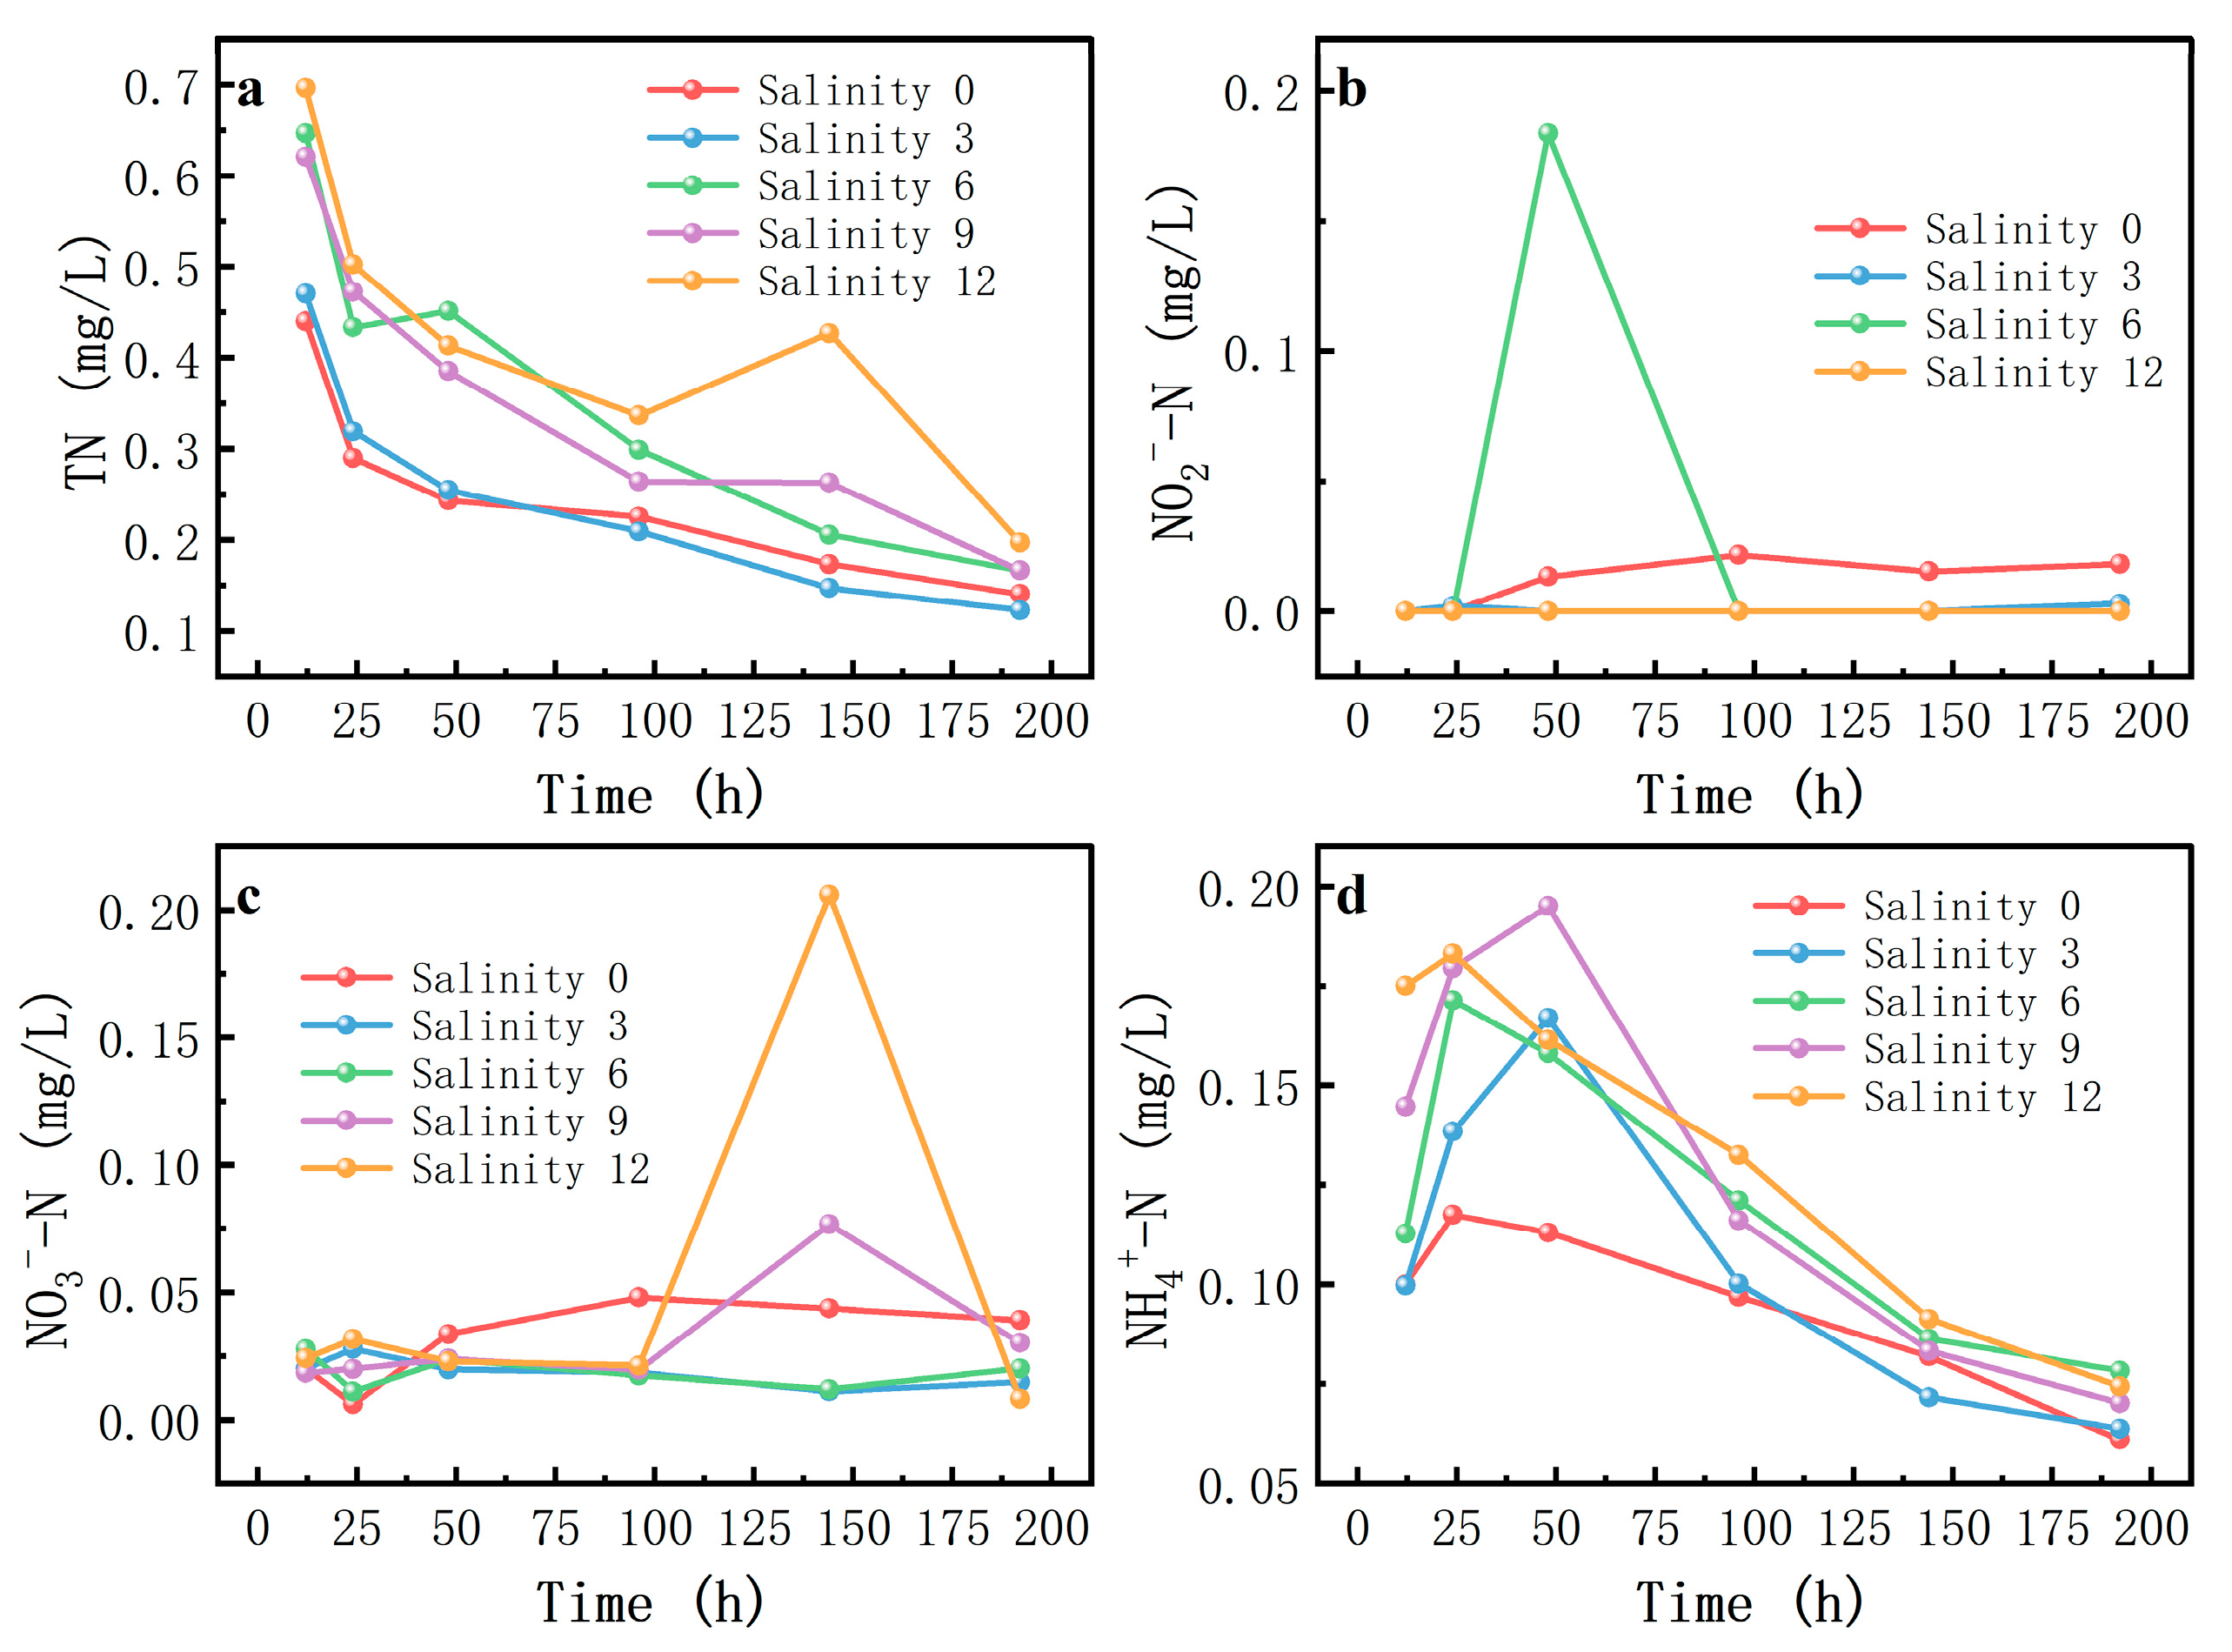
A visualization of different nitrogen forms obtained from the different salinity levels at different time points is shown in Figure 4. The image shows various characteristics of the different nitrogen concentrations in the different forms.
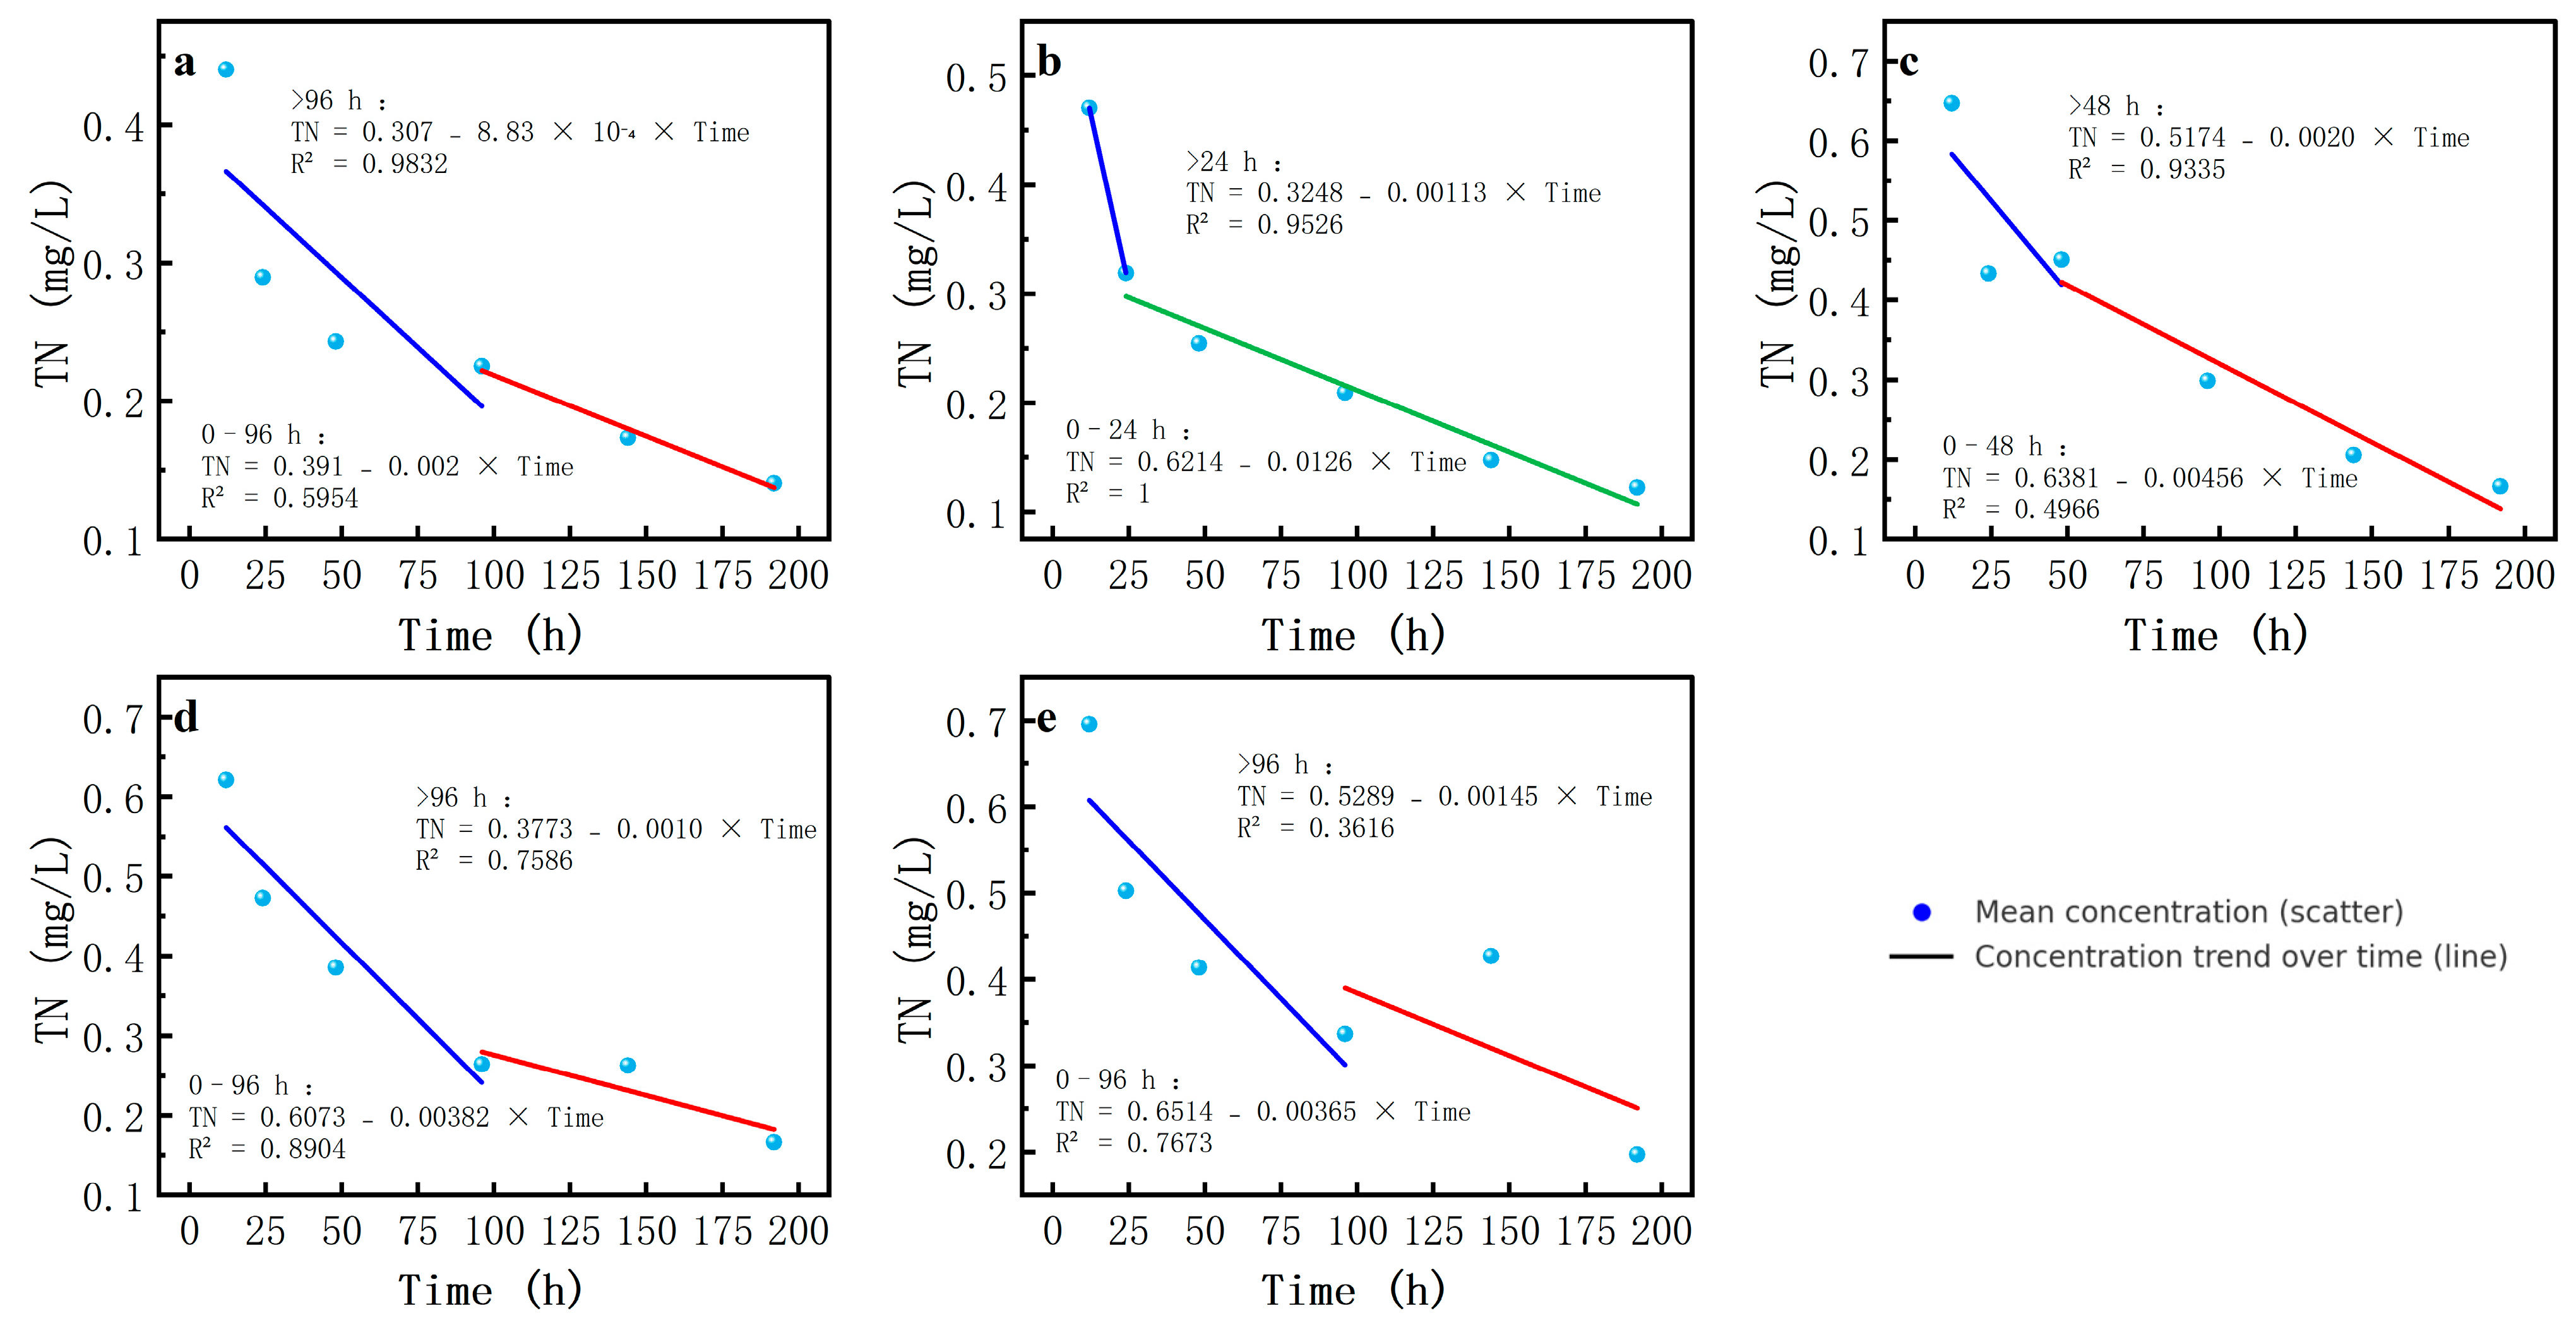
Firstly, the TN concentration exhibited a consistent declining trend throughout the experiment, with salinity-dependent attenuation rates. Under freshwater conditions (0‰ salinity), the TN concentration decreased more slowly, whereas with increasing salinity, the decrease in the TN concentration accelerated, especially at a salinity of 12, where the TN concentration decreased more evidently in the late stage of the experiment.
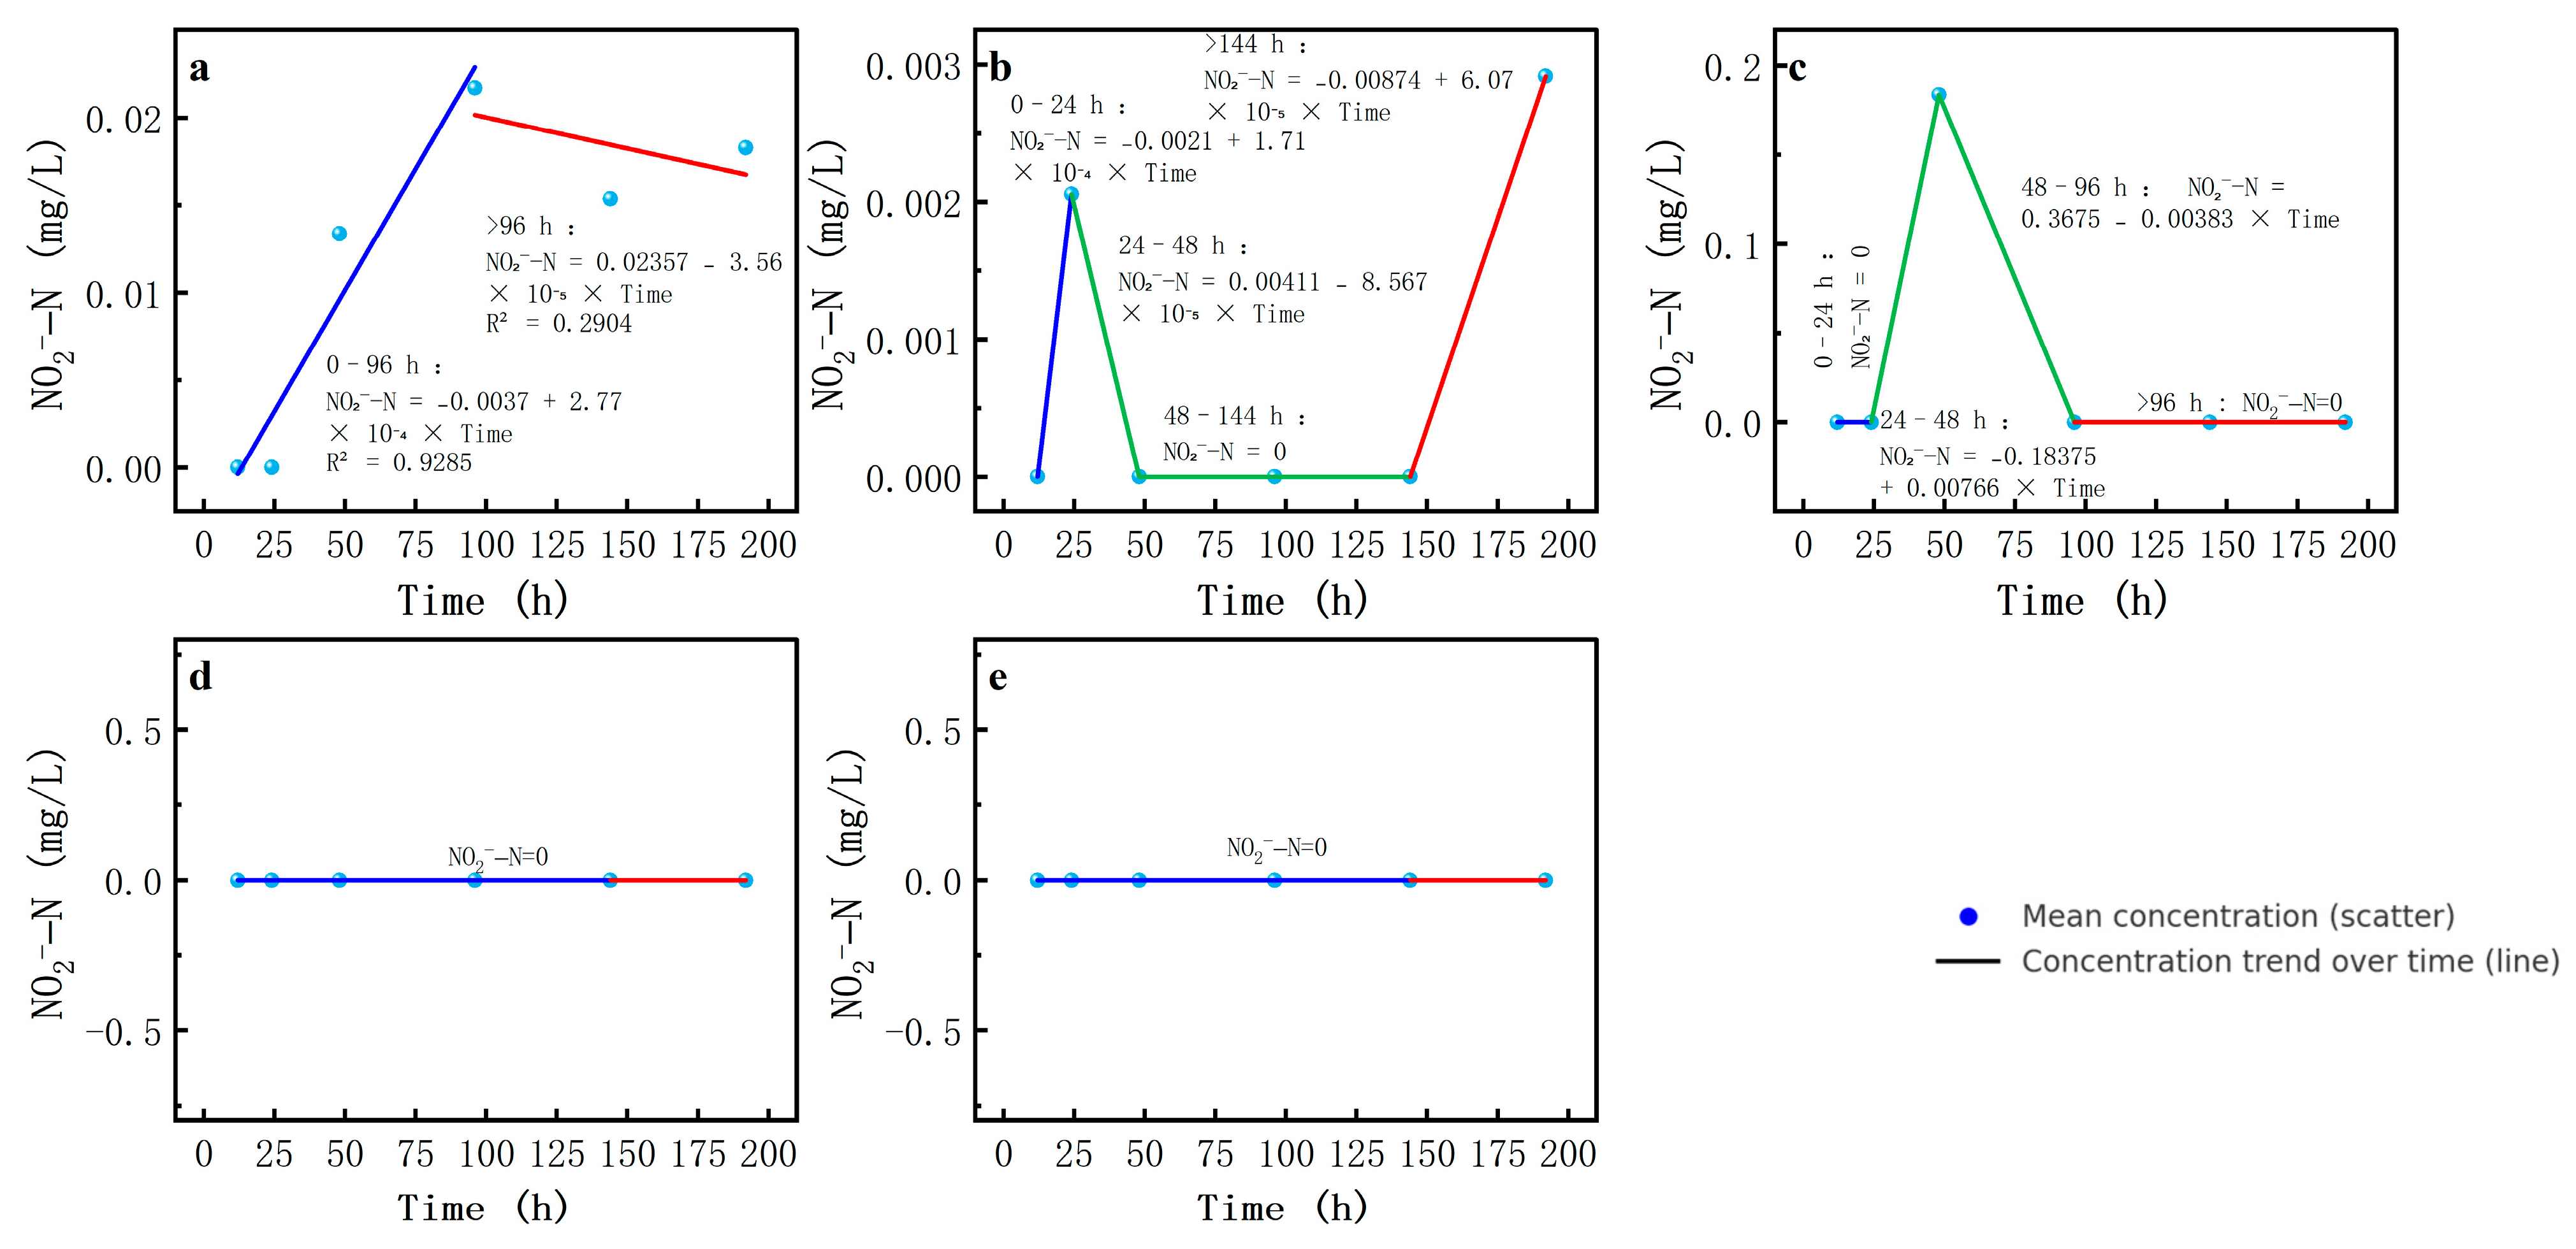
Secondly, NO2-N concentrations were low at the beginning of the experiment but peaked at some salinity levels and then gradually decreased. At a salinity of 6, the NO2-N concentration increased rapidly to the highest value at the beginning of the experiment and then decreased sharply, while under other salinity scenarios, the concentration change was relatively smooth and the peak occurred at a lower time and magnitude.
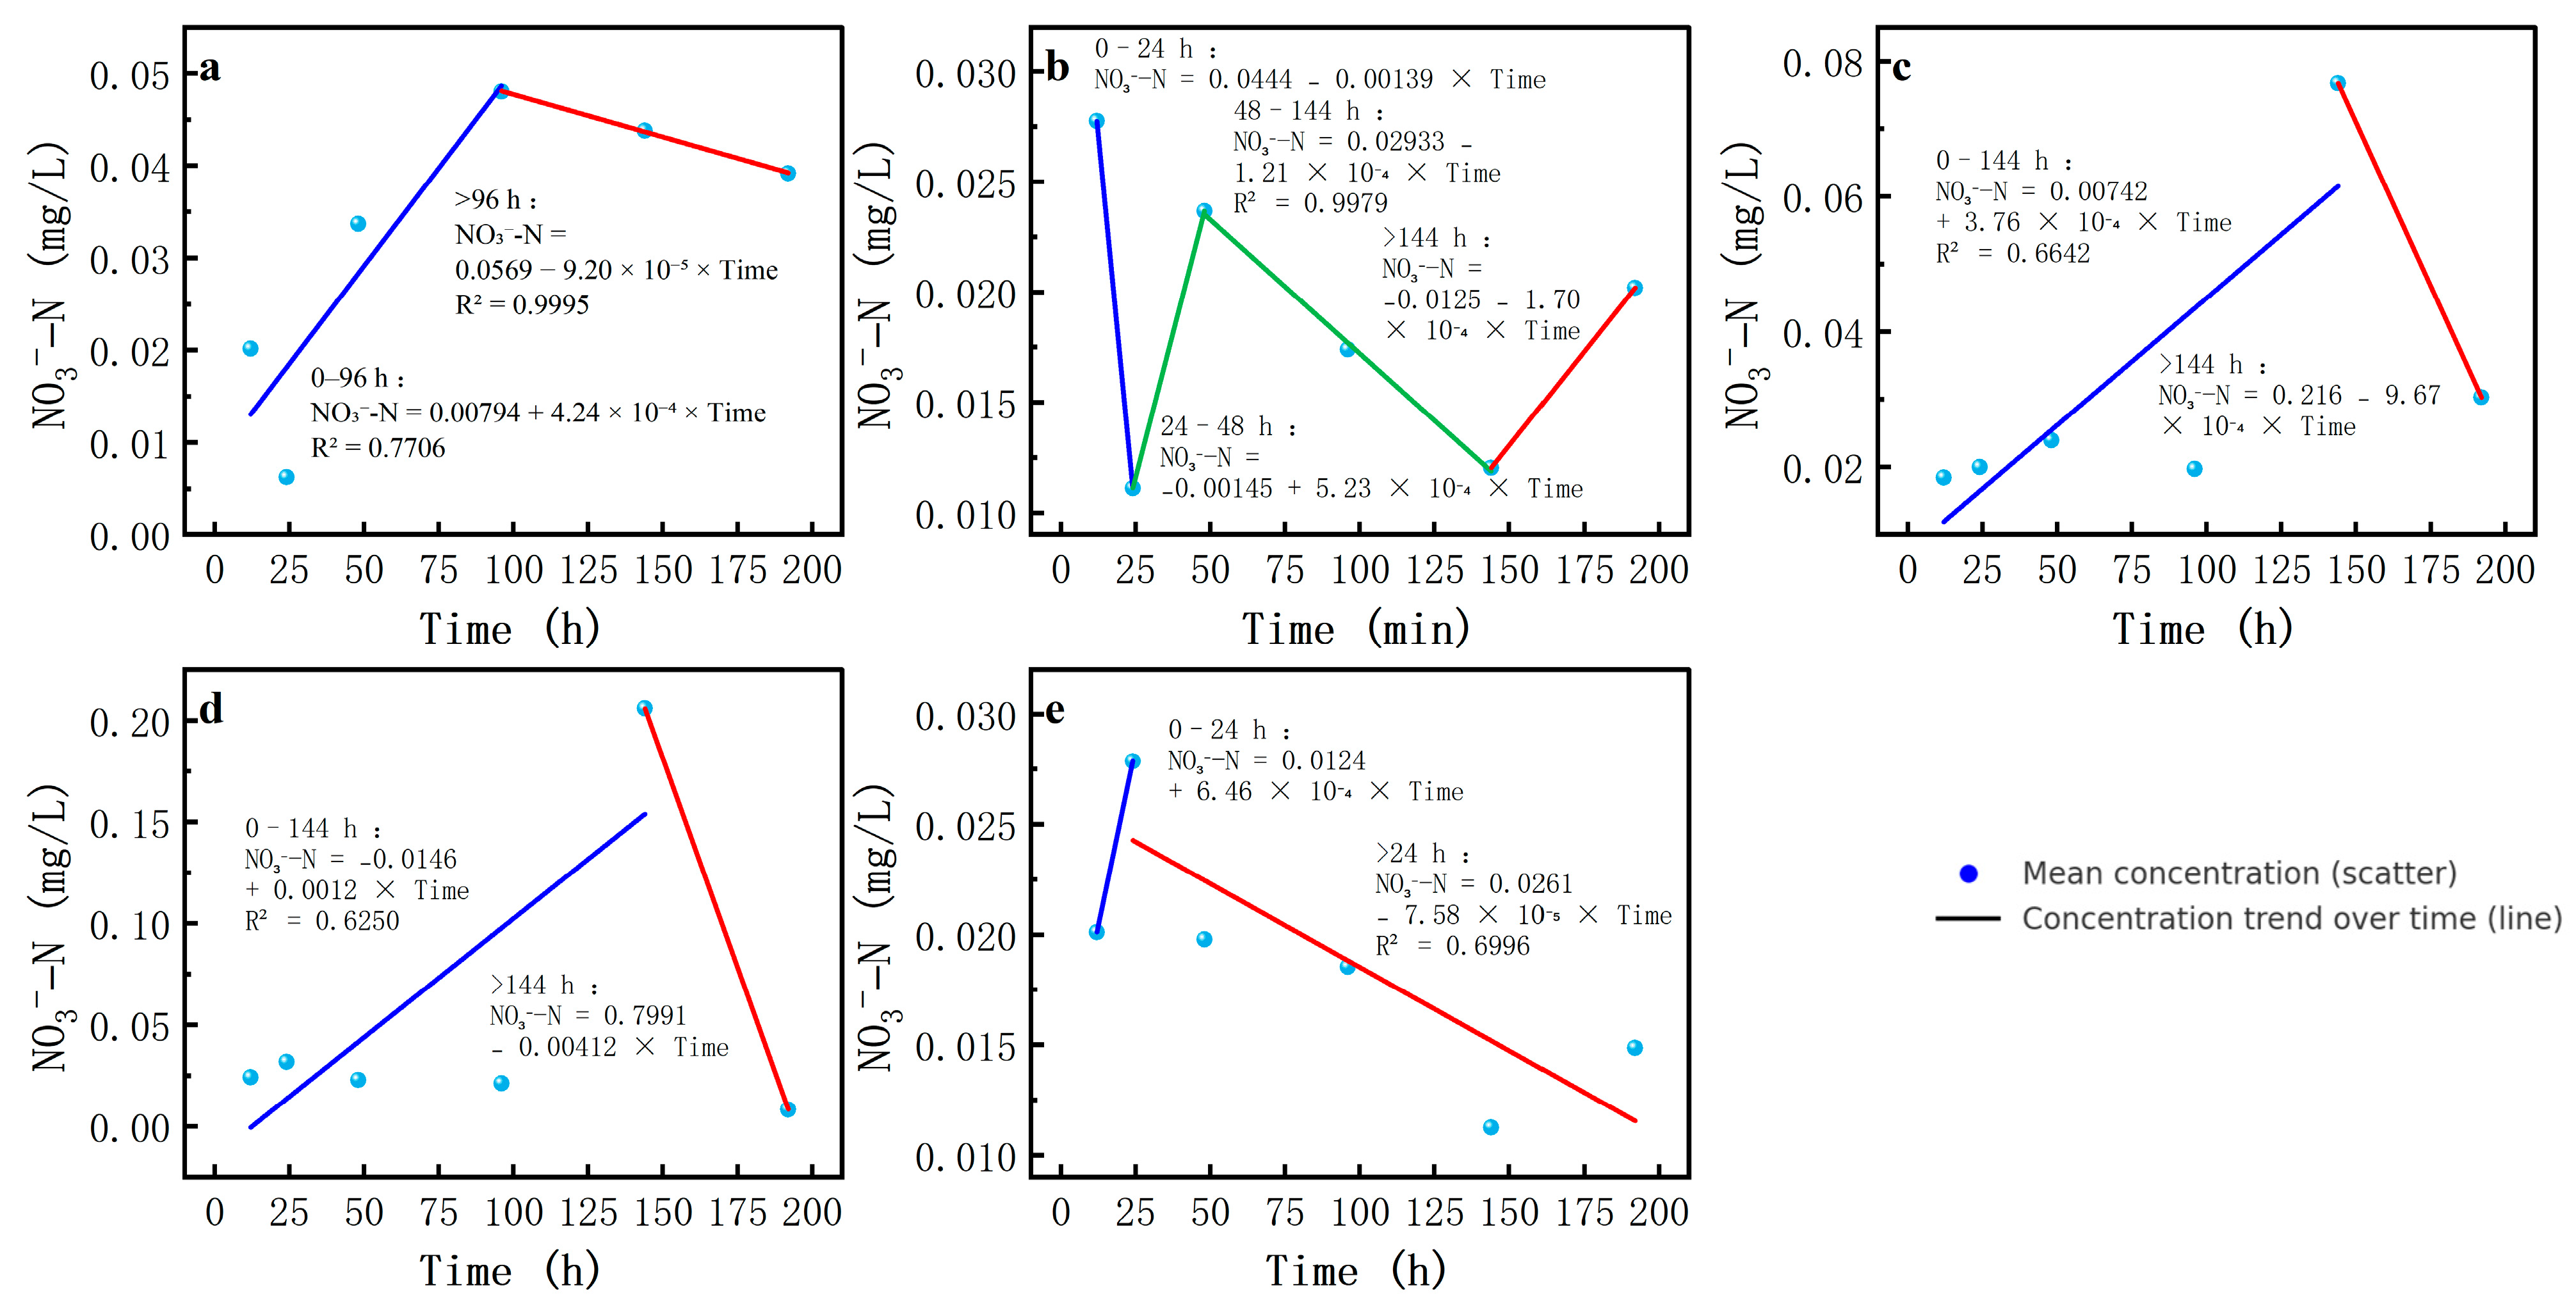
Thirdly, the changes in NO3-N revealed complex salinity-mediated modulations. At a salinity of 0, the NO3-N concentration was relatively stable and low, while at a salinity of 12, the concentration showed a significant peak in the process of experiment, followed by a rapid decline. At other salinities, the magnitude of the change in NO3-N concentration was relatively small.
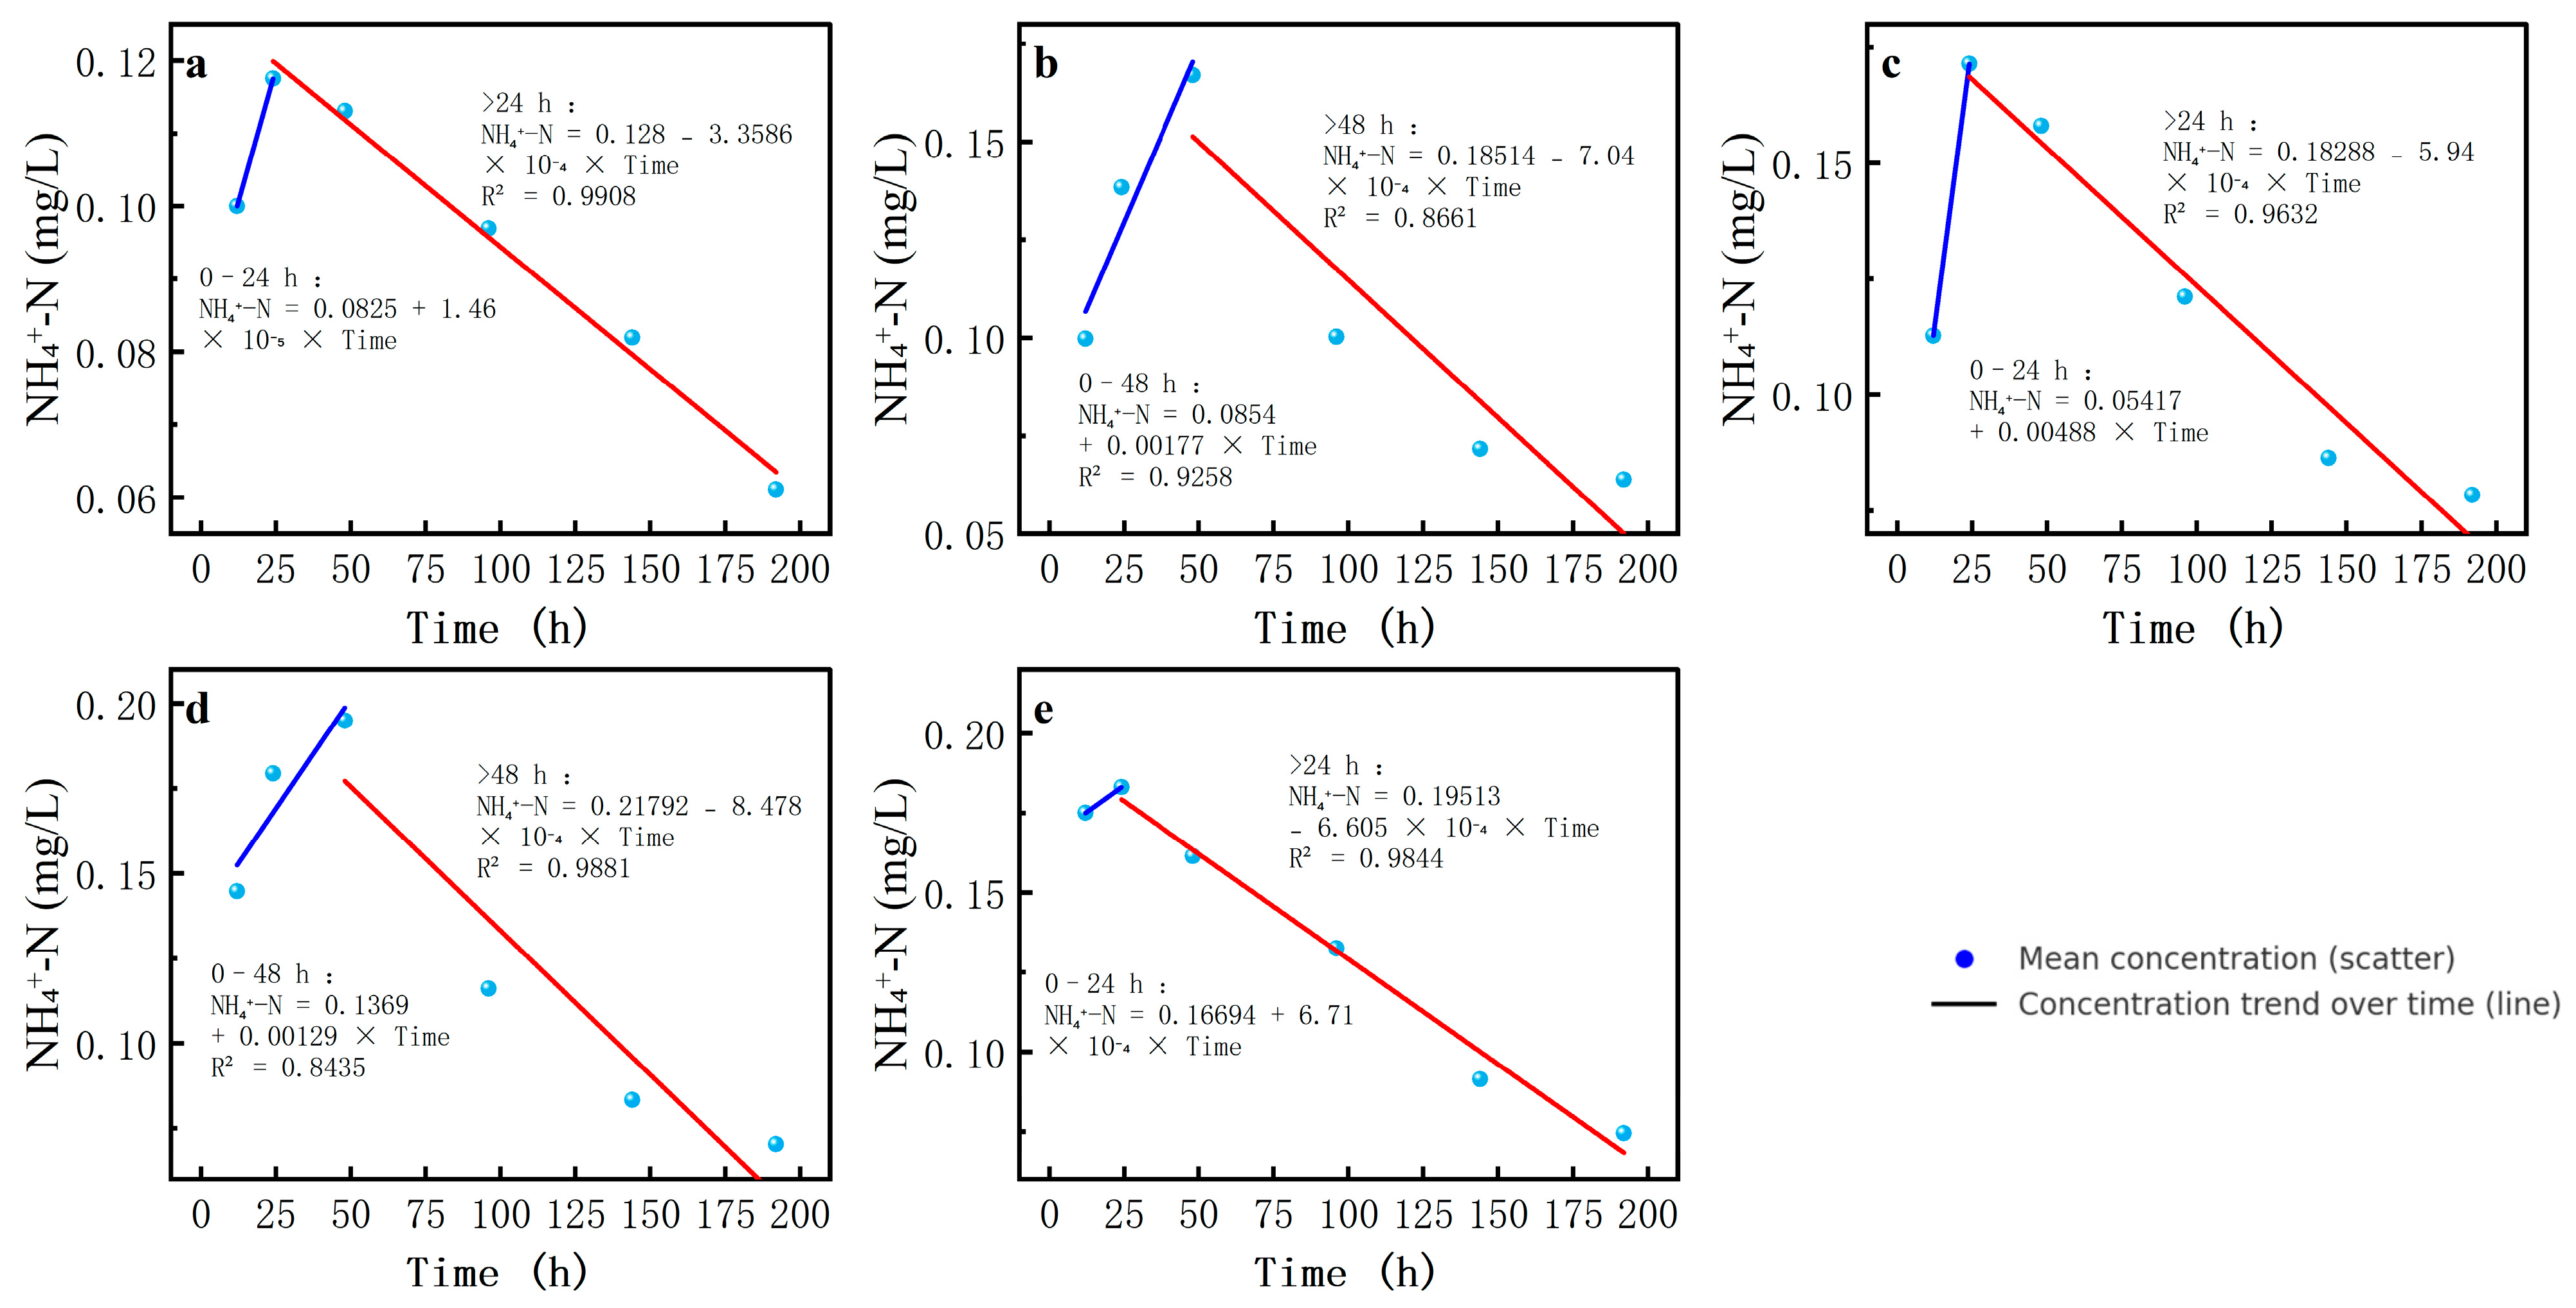
Fourthly, the NH4+-N concentration was high at the beginning of the experiment and then gradually decreased, but the rate of decrease and the final stabilized concentration differed at different salinity levels. In the 0-salinity scenario, the ammonia nitrogen concentration decreased slowly and finally stabilized at a relatively high level, while as the salinity increased, the ammonia nitrogen concentration decreased faster, especially under conditions with salinities of 9 and 12. NH4+-N concentration decreased more significantly in the late stage of the experiment and finally stabilized at a lower concentration level.
In order to describe the cyclic transformation rate of the different forms of nitrogen, the forms of nitrogen were first grouped according to the type of pollutant. For those forms that showed clear inflection points, segmented regression analysis was performed, and inflection points were set accordingly. Regression analysis was used to obtain the regression coefficients of each group and then to calculate the release rate constants (k-values) of the nitrogen forms. Based on these rate constants, the cyclic transformation rates of nitrogen forms at different salinities were further analyzed to determine the salinity thresholds. The specific analysis results of the changes in concentrations under different haline gradients are given below.
TN concentrations decreased over time, while salinity significantly affected the rate of decline. At a salinity of 0, TN decreased slowly because the pure water was unsuitable for the growth of associated bacteria. The absolute k-value of the TN concentration was highest at a salinity of 3‰, indicating a greater nitrogen loss to the atmosphere (Table 4, Figure 5).
NO3-N and NO2-N were the two most critical intermediates. The change in NO3-N concentration consisted of an initial increase followed by a decrease at salinities of 0, 3, 9, and 12‰. The increase in NO3-N concentration at 12‰ salinity was characterized by the largest k-value. At this salinity, the higher NO2-N concentration in the water body facilitated the generation of NO3-N through the nitrification process. In the second phase at 12‰ salinity, the absolute value of k was the largest, indicating a faster reduction in NO3-N, with the highest NO3-N reduction rate in denitrification. At other salinities, the NO3-N concentration varied smoothly with lower peaks, suggesting that nitrite production and consumption reached equilibrium at low and intermediate salinities (Table 5, Figure 6).
At 6‰ salinity, the NO3 concentration exhibited a distinct response, rapidly increasing to a peak at the start of the experiment, then sharply decreasing. This suggests a dynamic interplay between salinity inhibition and competition between NOB and ammonia-oxidizing bacteria (AOB). As the salinity increased to 12‰, AOB-dominated nitrification became predominant, while NOB-driven processes and anammox were inhibited. Instead, with fluctuations at 6‰ salinity and possibly more N2O production at 12‰ salinity, the reaction shifted to the following:
N O N O
The reaction that produced NO2-N is known as nitrification, where AOB oxidizes ammonia nitrogen to nitrite:
N H + 1.5 O N O + 2 H + H O
NOB further oxidizes nitrite to NO3-N:
N O + 0.5 O N O 3
NO2-N had the largest absolute k-value in the second segment at 3‰ salinity. The k-value in the first segment was the highest at 6‰ salinity, indicating the fastest increase in NO2-N concentration at this salinity. This observed peak in NO2-N concentration at around 6‰ salinity, followed by a sharp decline at higher salinities, may be explained by a trade-off between AOB tolerance and NOB inhibition. Specifically, AOB appear to maintain activity at moderate salinity levels, leading to nitrite accumulation, whereas elevated salinity levels increasingly inhibit NOB activity, reducing the oxidation of nitrite to nitrate and resulting in the observed pattern. At high salinities of 9‰ and 12‰, NO2-N concentrations were essentially below the detection limit. In contrast to other studies in wastewater treatment environments, where a significant decrease in AOB activity was found at salinities > 10‰, this experiment suggests that low salinities (9‰ and 12‰) may be sufficient to inactivate AOB and inhibit ammonia oxidation reactions in natural environments such as lake sediment discharges (Table 6, Figure 7).
The NH4+-N concentration first showed an increasing and then a decreasing trend, which was significantly influenced by salinity. The NH4+-N concentration increased most rapidly at 6‰ salinity, while the decrease was fastest at 9‰ salinity, primarily due to nitrification or anammox processes (Table 7, Figure 8).

3.2. Monitoring Data Modeling

(1)
Descriptive Analysis Results
TN concentrations showed a more dispersed distribution. The central lake region exhibited the highest median TN level, while other regions maintained comparatively lower values. Notably, extreme outliers were detected in both the central lake and tributary zones, with values far exceeding the interquartile range, indicating the occurrence of unusually high nitrogen levels in localized areas (Figure 9a).
DTN was predominantly concentrated in the lower concentration range; however, the western lake region displayed a broader range of DTN values. Several extreme outliers were observed in this region, with values well beyond the upper quartile, making these anomalies particularly prominent (Figure 9b).
NO3-N exhibited a slightly right-skewed distribution, with the majority of samples falling within a low concentration range. The western lake region showed slightly elevated NO3-N levels. Extreme outliers were also present in the central lake and tributary zones, indicating abnormally high nitrate concentrations in some locations (Figure 9c).
NO2-N concentrations were generally low, with most data points clustered at the lower end of the distribution. Nevertheless, the central and eastern lake regions displayed higher median values. A few extreme outliers were recorded in the tributary estuary and central lake areas, suggesting localized nitrite enrichment (Figure 9d).
NH4+-N concentrations were more dispersed in the tributary and western lake regions, while other regions showed a tighter concentration distribution. In particular, the central lake region exhibited distinct outliers within the upper quartile range, reflecting the presence of exceptionally high ammonium levels in certain areas (Figure 9e).
The salinity levels across the sampling sites exhibited a relatively concentrated distribution, with no evident outliers, suggesting overall consistency in salinity concentrations among different regions. Among the water body types, the western lake region had the highest median salinity, followed by the tributary estuarine zones (Figure 9f).
(2)
Correlation Analysis (CA)
In the overlying water, the correlation between salinity and nitrogen species (especially TN and NO3-N) was significantly positive. Changes in salinity may affect the distribution of nitrogen. In surface water, the negative correlation between salinity and NO3-N suggests that higher salinity may depress NO3-N concentrations. The relationship between salinity and NH4+-N and NO2-N is weak or complicated (Table 8).
(3)
Mixed-effects Model Regression
In order to further analyze the relationship between salinity and nitrogen forms, regression analysis was carried out using the overlying water data with a mixed-effects model, and compared with the conclusions in the experimental environment.
The coefficient of estimation was 0.004, the standard error was 0, the t-value was 9.71, and the p-value was 0, indicating that salinity had a significant positive effect on NH4+-N (p < 0.01). The chi-square value of the model was 94.225 and the p-value was 0.000, indicating that the model was significant. AIC is −2569.587, which indicates that the model fits well (Table 9).
The coefficient of estimation of salinity and TN was 0.124, standard error was 0.002, t value was 60.32, and p-value was 0, indicating that salinity had a significant positive effect on TN (p < 0.01). The model chi-square value was 3638.515 and the p-value was 0.000, so the model was significant. The AIC was 456.921, indicating a good model fit (Table 10).
The coefficient of estimation for salinity and DON was 0.121, the standard error was 0.003, the t-value was 46.45, and the p-value was 0, indicating that salinity had a significant positive correlation with dissolved organic nitrogen (p < 0.01). The increase in salinity significantly promoted the release of dissolved organic nitrogen. The model chi-square value was 2157.259 and the p-value was 0.000, so the model was significant. The AIC was 180.343, indicating a good model fit (Table 11).
The coefficient of estimation for salinity and DTN was 0.123, the standard error was 0.002, the t value was 60.81, and the p-value was 0, indicating that salinity had a significant positive correlation with DTN (p < 0.01). The increase in salinity significantly promoted the release of dissolved total nitrogen. The model chi-square value was 3697.983 and the p-value was 0.000, so the model was significant. The AIC was 389.081, indicating a good model fit (Table 12).
The coefficient of estimation for salinity and NO3-N was −0.002, the standard error was 0.001, the t-value was −2.40, and the p-value was 0.016, indicating a significant negative correlation between salinity and NO3-N (p < 0.05). The model chi-square value is 5.774 and the p-value is 0.016, which means the model is significant. The AIC was −1429.831, indicating a good model fit (Table 13).
The coefficient of estimation for salinity and NO2-N was 0, standard error was 0.001, t value was 0.19, and p-value was 0.851, indicating that salinity had no significant effect on nitrite nitrogen (p > 0.05). The chi-square value of the model was 0.035 and the p-value was 0.851, indicating that the model fit was not ideal. The AIC was −845.374, indicating a poor model fit (Table 14).

4. Conclusions

With the intensification of global warming and the melting of glaciers, the salinity of plateau lakes is showing a decreasing trend [3,5]. This change in salinity may have significant impacts on the release and cycling of nitrogen in plateau lakes. According to the experimental data in our research, the correlation analysis confirmed the significant impact of salinity on nitrogen release and cycling in plateau lake sediments. ANOVA results further validated the robustness of this conclusion, indicating that the influence of salinity changes on sediment nitrogen release and cycling is not affected by water mineralization, experimental duration, or salinity levels. SEM analysis and segmented regression revealed the overall influence trends between salinity and nitrogen-related products. NH4+-N acted as a central driver of nitrogen transformation through nitrification, while NO2-N and NO3-N exhibited competitive inhibitory effects on other nitrogen forms. A previous study showed that NOB is more sensitive to high salinity [35], and have been found to be most abundant at 8‰ salinity, where almost all NO2-N is oxidized to NO3-N [36]. This is partly in companion to the rapid approach of NO2-N concentrations to zero at salinity 9‰ and 12‰ in this experiment.
Based on the field monitoring data, the increase in salinity significantly promoted the increase in NH4+-N and TN concentrations, a finding supported by the MEM analysis. It was highly consistent with the experimental results and SEM. This indicates that the experimental findings have extrapolation and can partly explain the nitrogen response mechanism in the actual environment. Similar descriptions and analyses have been made in other studies, such as inhibition of bacterial community-mediated nitrogen cycling in soils by high salinity [37] and rapid decrease in nitrogenase activity at elevated salinity, suggesting that salinity affects nitrogenase functional complexes and thus increases nitrogen release from sediments [38]. DON and DTN were monitored and analyzed only by MEM, and both results showed that salinity had a significant positive effect on their concentrations (p < 0.01), further supporting the conclusion that increased salinity drives the accumulation of dissolved nitrogen.

Author Contributions

Conceptualization, R.C. and L.A.; methodology, R.C., Y.Z. and H.X.; software, R.C. and Y.Z.; validation, R.C., Z.Z. and Q.Q.; formal analysis, R.C. and Y.Z.; investigation, Q.Q., R.C., Y.Z. and H.X.; resources, L.A., Z.Z., Y.Z. and H.X.; data curation, G.L. and Y.H.; writing—original draft preparation, R.C.; writing—review and editing, L.A., Z.Z. and R.C.; visualization, X.H. and R.C.; supervision, L.A. and Z.Z.; project administration, L.A. and Z.Z.; funding acquisition, L.A. All authors have read and agreed to the published version of the manuscript.

Funding

Construction Technology of Multi-source Phosphorus Emission Inventory in Typical Yangtze River Basin (2022YFC3203301).

Data Availability Statement

The datasets presented in this article are not readily available because they are part of an ongoing research project. Furthermore, the data involve geographically sensitive information related to border regions, which are subject to institutional and regulatory restrictions. As such, the datasets cannot be openly shared at this stage. Researchers who wish to access the data for academic purposes may submit a reasonable request to the corresponding author via email.

Conflicts of Interest

The authors declare no conflict of interest.

Abbreviations

The following abbreviations are used in this manuscript:
SEMStructural equation modeling
MEMMixed-effects modeling
NH4+-NAmmonium nitrogen
NO2-NNitrite nitrogen
NO3-NNitrate nitrogen
AOBAmmonia-oxidizing bacteria
NOBNitrite-oxidizing bacteria
TNTotal nitrogen

References

  1. The asian water tower. Nat. Rev. Earth Environ. 2022, 3, 618–632. [CrossRef]
  2. Li, X.; Long, D.; Scanlon, B.R.; Mann, M.E.; Li, X.; Tian, F.; Sun, Z.; Wang, G. Climate change threatens terrestrial water storage over the Tibetan Plateau. Nat. Clim. Change 2022, 12, 801–807. [Google Scholar] [CrossRef]
  3. Song, C.; Luo, S.; Liu, K.; Chen, T.; Zhang, P.; Fan, C. Widespread declines in water salinity of the endorheic Tibetan Plateau lakes. Environ. Res. Commun. 2022, 4, 091002. [Google Scholar] [CrossRef]
  4. Yang, K.; Lu, H.; Yue, S.; Zhang, G.; Lei, Y.; La, Z.; Wang, W. Quantifying recent precipitation change and predicting lake expansion in the Inner Tibetan Plateau. Clim. Change 2018, 147, 149–163. [Google Scholar] [CrossRef]
  5. Liu, C.; Zhu, L.; Wang, J.; Ju, J.; Ma, Q.; Kou, Q. The decrease of salinity in lakes on the Tibetan Plateau between 2000 and 2019 based on remote sensing model inversions. Int. J. Digit. Earth 2023, 16, 2644–2659. [Google Scholar] [CrossRef]
  6. Fang, Y.; Liu, J.; Yang, J.; Wu, G.; Hua, Z.; Dong, H.; Hedlund, B.P.; Baker, B.J.; Jiang, H. Compositional and Metabolic Responses of Autotrophic Microbial Community to Salinity in Lacustrine Environments. mSystems 2022, 7, e00335-22. [Google Scholar] [CrossRef]
  7. Huang, J.; Yang, J.; Jiang, H.; Wu, G.; Liu, W.; Wang, B.; Xiao, H.; Han, J. Microbial Responses to Simulated Salinization and Desalinization in the Sediments of the Qinghai–Tibetan Lakes. Front. Microbiol. 2020, 11, 1772. [Google Scholar] [CrossRef]
  8. Fontes, J.-C.; Gasse, F.; Gibert, E. Holocene environmental changes in Lake Bangong basin (Western Tibet). Part 1: Chronology and stable isotopes of carbonates of a Holocene lacustrine core. Palaeogeogr. Palaeoclimatol. Palaeoecol. 1996, 120, 25–47. [Google Scholar] [CrossRef]
  9. Zhao, B.; Hu, Y.; Yu, H.; Chen, S.; Xing, T.; Guo, S.; Zhang, H. A method for researching the eutrophication and N/P loads of plateau lakes: Lugu Lake as a case. Sci. Total Environ. 2023, 876, 162747. [Google Scholar] [CrossRef]
  10. Luo, J.; Niu, F.; Lin, Z.; Liu, M.; Yin, G.; Gao, Z. Abrupt increase in thermokarst lakes on the central Tibetan Plateau over the last 50 years. Catena 2022, 217, 106497. [Google Scholar] [CrossRef]
  11. Liu, Y.; Chen, H. Future warming accelerates lake variations in the Tibetan Plateau. Int. J. Climatol. 2022, 42, 8687–8700. [Google Scholar] [CrossRef]
  12. Kuypers, M.M.M.; Marchant, H.K.; Kartal, B. The microbial nitrogen-cycling network. Nat. Rev. Microbiol. 2018, 16, 263–276. [Google Scholar] [CrossRef]
  13. Daims, H.; Lücker, S.; Wagner, M. A New Perspective on Microbes Formerly Known as Nitrite-Oxidizing Bacteria. Trends Microbiol. 2016, 24, 699–712. [Google Scholar] [CrossRef]
  14. Lu, H.; Chandran, K.; Stensel, D. Microbial ecology of denitrification in biological wastewater treatment. Water Res. 2014, 64, 237–254. [Google Scholar] [CrossRef]
  15. Pan, Y.; She, D.; Shi, Z.; Cao, T.; Xia, Y.; Shan, J. Salinity and high pH reduce denitrification rates by inhibiting denitrifying gene abundance in a saline-alkali soil. Sci. Rep. 2023, 13, 2155. [Google Scholar] [CrossRef]
  16. Wu, S.; Wu, Z.; Liang, Z.; Liu, Y.; Wang, Y. Denitrification and the controlling factors in Yunnan Plateau Lakes (China): Exploring the role of enhanced internal nitrogen cycling by algal blooms. J. Environ. Sci. 2019, 76, 349–358. [Google Scholar] [CrossRef]
  17. Zhang, Y.; Chang, F.; Zhang, X.; Li, D.; Liu, Q.; Liu, F.; Zhang, H. Release of Endogenous Nutrients Drives the Transformation of Nitrogen and Phosphorous in the Shallow Plateau of Lake Jian in Southwestern China. Water 2022, 14, 2624. [Google Scholar] [CrossRef]
  18. Palacin-Lizarbe, C.; Camarero, L.; Hallin, S.; Jones, C.M.; Cáliz, J.; Casamayor, E.O.; Catalan, J. The DNRA-Denitrification Dichotomy Differentiates Nitrogen Transformation Pathways in Mountain Lake Benthic Habitats. Front. Microbiol. 2019, 10, 1229. [Google Scholar] [CrossRef]
  19. Ding, S.; Dan, S.F.; Liu, Y.; He, J.; Zhu, D.; Jiao, L. Importance of ammonia nitrogen potentially released from sediments to the development of eutrophication in a plateau lake. Environ. Pollut. 2022, 305, 119275. [Google Scholar] [CrossRef]
  20. Hu, N.; Sheng, Y.; Tang, Q.; Liu, X. Mechanisms of nitrogen and phosphorus release from heavily polluted coastal sediments and identification of influencing factor. Environ. Res. Commun. 2025, 7, 025005. [Google Scholar] [CrossRef]
  21. Cheng, P.; Bao, X.; Jiao, Y.; Zhang, X.; Li, Q.; Gu, S. Evaluation of the Potential Release Risk of Internal N and P from Sediments—A Preliminary Study in Two Freshwater Reservoirs in South China. Water 2022, 14, 664. [Google Scholar] [CrossRef]
  22. Lu, J.; Liu, T.; Shi, X.H.; Sun, B.; Zhao, S. Characteristics and Pollution Contribution of the Internal Nitrogen Release From the Sediments in the Dahekou Reservoir in Inner Mongolia. Front. Environ. Sci. 2022, 10, 907769. [Google Scholar] [CrossRef]
  23. Chen, Q.; Ni, Z.; Wang, S.; Guo, Y.; Liu, S. Climate change and human activities reduced the burial efficiency of nitrogen and phosphorus in sediment from Dianchi Lake, China. J. Clean. Prod. 2020, 274, 122839. [Google Scholar] [CrossRef]
  24. Li, W.; Xu, S.; Chen, X.; Han, D.; Mu, B. Influencing Factors and Nutrient Release from Sediments in the Water Level Fluctuation Zone of Biliuhe Reservoir, a Drinking Water Reservoir. Water 2023, 15, 3659. [Google Scholar] [CrossRef]
  25. Jiang, X.; Liu, C.; Hu, Y.; Shao, K.; Tang, X.; Zhang, L.; Gao, G.; Qin, B. Climate-induced salinization may lead to increased lake nitrogen retention. Water Res. 2023, 228, 119354. [Google Scholar] [CrossRef] [PubMed]
  26. Marks, B.M.; Chambers, L.; White, J.R. Effect of fluctuating salinity on potential denitrification In coastal wetland soil and sediments. Soil Sci. Soc. Am. J. 2016, 80, 516–526. [Google Scholar] [CrossRef]
  27. Severin, I.; Confurius-Guns, V.; Stal, L.J. Effect of salinity on nitrogenase activity and composition of the active diazotrophic community in intertidal microbial mats. Arch. Microbiol. 2012, 194, 483–491. [Google Scholar] [CrossRef]
  28. Ferree, M.A.; Shannon, R.D. Evaluation of a second derivative UV/visible spectroscopy technique for nitrate and total nitrogen analysis of wastewater samples. Water Res. 2001, 35, 327–332. [Google Scholar] [CrossRef]
  29. Armstrong, F.A.J. Determination of Nitrate in Water Ultraviolet Spectrophotometry. Anal. Chem. 1963, 35, 1292–1294. [Google Scholar] [CrossRef]
  30. Ministry of Ecology and Environment of China. Water Quality—Determination of Nitrogen (Nitrite)—Spectrophotometric Method (GB 7493-87). Implemented 1 August 1987. Available online: https://english.mee.gov.cn/Resources/standards/water_environment/method_standard2/200807/t20080710_125478.shtml (accessed on 11 June 2025).
  31. Ministry of Ecology and Environment of China. Water Quality—Determination of Total Nitrogen—Alkaline Potassium Persulfate Digestion UV Spectrophotometric Method (HJ 636-2012); Issued 29 February 2012, Implemented 1 June 2012. Available online: https://english.mee.gov.cn/Resources/standards/water_environment/method_standard2/201206/t20120618_231805.shtml (accessed on 11 June 2025).
  32. GB/T 11007-2008; Test Method of Electrolytic Conductivity Analyzers. General Administration of Quality Supervision, Inspection and Quarantine of the People’s Republic of China and the Standardization Administration of China. Available online: https://openstd.samr.gov.cn/bzgk/gb/newGbInfo?hcno=977E202281FF004DD9BE6C160DE8EADA (accessed on 11 June 2025).
  33. Ministry of Ecology and Environment of China. Water Quality—Determination of Ammonia Nitrogen—Gas-Phase Molecular Absorption Spectrometry (HJ 195-2023); Issued 27 November 2023, Implemented 1 June 2024. Available online: https://www.mee.gov.cn/ywgz/fgbz/bz/bzwb/jcffbz/202312/W020231208571937460182.pdf (accessed on 11 June 2025).
  34. Ministry of Ecology and Environment of China. Water Quality—Determination of Nitrate-Nitrogen—Ultraviolet Spectrophotometry (HJ/T 346-2007); Trial Implementation 1 May 2007. Available online: https://english.mee.gov.cn/Resources/standards/water_environment/method_standard2/200807/t20080704_125017.shtml (accessed on 11 June 2025).
  35. Lin, C.; Liu, Y.; Li, Y.-Y.; Liu, J. Difference of high-salinity-induced inhibition of ammonia-oxidising bacteria and nitrite-oxidising bacteria and its applications. Bioresour. Technol. 2023, 387, 129640. [Google Scholar] [CrossRef]
  36. Ma, Y.; Luo, Z.; Zhong, J.; Zhang, H.; Huang, X.; Li, C.; Zhang, Y. Effect of environmental factors on nitrite nitrogen absorption in microalgae–bacteria consortia of oocystis borgei and rhodopseudomonas palustris. Water 2023, 15, 1722. [Google Scholar] [CrossRef]
  37. Li, X.; Wang, A.; Wan, W.; Luo, X.; Zheng, L.; He, G.; Huang, D.; Chen, W.; Huang, Q. High salinity inhibits soil bacterial community mediating nitrogen cycling. Appl. Environ. Microbiol. 2021, 87, e01366-21. [Google Scholar] [CrossRef] [PubMed]
  38. Brabban, A.D.; Orcutt, E.N.; Zinder, S.H. Interactions between nitrogen fixation and osmoregulation in the methanogenic archaeon methanosarcina barkeri 227. Appl. Environ. Microbiol. 1999, 65, 1222–1227. [Google Scholar] [CrossRef] [PubMed]
Figure 1. Location of Pangong Tso (China).
Water 17 01797 g001
Figure 2. Sample locations and spot numbers.
Water 17 01797 g002
Figure 3. SEM path diagram (* p < 0.05).
Water 17 01797 g003
Figure 4. Concentrations of different nitrogen compounds over time for different salinity levels. (a) Concentrations of total nitrogen (TN) over time for different salinity levels; (b) Concentrations of nitrite nitrogen (NO₂⁻-N) over time for different salinity levels; (c) Concentrations of nitrate nitrogen (NO₃⁻-N) over time for different salinity levels; (d) Concentrations of ammonia nitrogen (NH₄⁺-N) over time for different salinity levels.
Water 17 01797 g004
Figure 5. Segmented regression curves of TN at different salinities over time. (a) Salinity = 0‰; (b) Salinity = 3‰; (c) Salinity = 6‰; (d) Salinity = 9‰; (e) Salinity = 12‰.
Water 17 01797 g005
Figure 6. Segmented regression curves of NO3-N at different salinities over time. (a) Salinity = 0‰; (b) Salinity = 3‰; (c) Salinity = 6‰; (d) Salinity = 9‰; (e) Salinity = 12‰.
Water 17 01797 g006
Figure 7. Segmented regression curves of NO2-N at different salinities over time. (a) Salinity = 0‰; (b) Salinity = 3‰; (c) Salinity = 6‰; (d) Salinity = 9‰; (e) Salinity = 12‰.
Water 17 01797 g007
Figure 8. Segmented regression curves of NH4+-N at different salinities over time. (a) Salinity = 0‰; (b) Salinity = 3‰; (c) Salinity = 6‰; (d) Salinity = 9‰; (e) Salinity = 12‰.
Water 17 01797 g008
Figure 9. Box graph of salinity and nitrogen compounds’ concentrations in different water types ((a) TN, (b) DTN, (c) NO3-N, (d) NO2-N, (e) NH4+-N, (f) salinity).
Water 17 01797 g009
Table 1. Significance test of correlation coefficients.
NO3-NNO2-NTNNH4+-NOther_NSalinity
NO3-N1
NO2-N0.0181
TN0.1460.0741
NH4+-N−0.044−0.0560.6341
other_N−0.074−0.0840.8690.2721
salinity0.091−0.0550.1710.0900.1541
Table 2. Results of significance tests for interactions (ANOVA).
Partial SSdfMSFProb > F
Model7.474890.0843.60
salinity_~c0.25440.0642.730.028
time_fac1.24750.24910.70
salinity_~c#time_fac0.19200.010.410.99
batch_fac4.04322.02286.740
salinity_~c#batch_fac0.3380.0411.770.079
time_fac#batch_fac1.095100.1094.70
salinity_~c#time_fac#batch_fac0.314400.0080.341
Residual23.0769900.023
Total30.55110790.028
Note: The values in the “Total” row are the sums of the respective columns from all sources of variation. The abbreviations are as follows: Partial SS = partial sum of squares; df = degrees of freedom; MS = mean square; F = F statistic; Prob > F = p-value.
Table 3. SEM analysis results.
lvaloprvalEstimate
NH4+-N~salinity0.004
NO2-N~NH4+-N−0.019
NO2-N~salinity−0.004
NO3-N~NO2-N0.039
NO3-N~salinity0
other_N~NO3-N−0.263
other_N~NH4+-N0.453
other_N~NO2-N−0.285
other_N~~salinity0.006
NO2-N~~NO2-N0.018
NO3-N~~NO3-N0.009
NH4+-N~~NH4+-N0.032
other_N~~other_N0.083
Note:~ indicates a regression path, ~~ indicates a covariance or variance relationship.
Table 4. Haline gradient segmented regression results (TN).
Haline Gradient (‰)K-Value (First Segment)R2
(First Segment)
K-Value
(Second Segment)
R2
(Second Segment)
Turning Point (hours)
0−0.0020.595−0.0010.98396
3−0.0131−0.0010.95324
6−0.0050.497−0.0020.93448
9−0.0040.890−0.0010.75996
12−0.0040.767−0.0010.36296
Table 5. Haline gradient segmented regression results (NO3-N).
Haline Gradient (‰)K-Value (First Segment)R2 (First Segment)K-Value (Second Segment)R2 (Second Segment)Turning Point (hours)
00.00040.7706−0.00010.999596
30.00061−0.00010.699624
6/////
90.00040.6642−0.0011144
120.00120.625−0.00411144
Table 6. Haline gradient segmented regression results (NO2_N).
Haline Gradient (‰)K-Value (First Segment)R2 (First Segment)K-Value (Second Segment)R2 (Second Segment)Turning Point (hours)
00.00030.928500.290496
30.00021−0.0001124
60.00771−0.0038124, 48
90000/
120000/
Table 7. Haline gradient segmented regression results (NH4+-N).
Haline Gradient (‰)K-Value (First Segment)R2 (First Segment)K-Value
(Second Segment)
R2
(Second Segment)
Turning Point (hours)
00.00145831−0.00033590.990824
30.00177080.9258−0.00070370.866148
60.00488431−0.00057060.963224
90.00128970.8435−0.00084780.881048
120.00067131−0.00066050.984324
Table 8. Correlation analysis (CA) results for overlying water and surface water.
(overlying water)salini~gNH4+-N~gTN_ove~gNO3-N_~gNO2-N_~g
salinity_o~g1
NH4+-N_over~g0.098 *1
TN_overlying0.366 ***0.496 ***1
NO3-N_over~g0.238 ***0.0560.479 ***1
NO2-N_over~g0.161 ***0.134 **0.313 ***−0.0561
(surface water)salini~gNH4+-N_~gTN_ove~gNO3-N_~gNO2-N_~g
salinity_o~g1
NH4+-N_over~g0.0831
TN_overlying0.186 ***0.470 ***1
NO3-N_over~g0.155 ***0.463 ***0.933 ***1
NO2-N_over~g−0.147 ***−0.0860.160 ***0.206 ***1
Note: * p < 0.1;** p < 0.05; *** p < 0.01.
Table 9. Mixed-effects REML regression of NH4+-N and salinity.
NH4+-NCoef.St. Err.t-Valuep-Value[95% ConfInterval]Sig
salinity0.00409.7100.0030.005***
Constant0.0760.0145.3800.0490.104***
Constant0.0020.001.b.b0.0010.005
Constant0.0010.b.b00.002
Constant00.b.b00.108
Constant0.0050.b.b0.0050.005
Mean dependent var0.080SD dependent var0.086
Number of obs1080Chi-square94.225
Prob > chi20.000Akaike crit. (AIC)−2569.587
Note: *** p < 0.01.
Table 10. Mixed-effects REML regression of TN and salinity.
TNCoef.St.Err.t-Valuep-Value[95% ConfInterval]Sig
salinity0.1240.00260.3200.120.128***
Constant0.4050.0824.9400.2440.566***
Constant0.0270.034.b.b0.0020.328
Constant0.1090.04.b.b0.0530.224
Constant0.0090.005.b.b0.0030.026
Constant0.090.005.b.b0.0810.1
Mean dependent var0.642SD dependent var0.895
Number of obs720Chi-square3638.515
Prob > chi20.000Akaike crit. (AIC)456.921
Note: *** p < 0.01.
Table 11. Mixed-effects REML regression of DON and salinity.
DONCoef.St. Err.t-Valuep-Value[95% ConfInterval]Sig
salinity0.1210.00346.4500.1160.126***
Constant0.0280.0940.300.763−0.1560.213
Constant0.050.044.b.b0.0090.277
Constant0.0522.406.b.b08.399 × 1037
Constant0.0710.006.b.b0.060.082
Mean dependent var0.287SD dependent var0.855
Number of obs360Chi-square2157.259
Prob > chi20.000Akaike crit. (AIC)180.343
Note: *** p < 0.01.
Table 12. Mixed-effects REML regression of DTN and salinity.
dtnCoef.St.Err.t-Valuep-Value[95% ConfInterval]Sig
salinity0.1230.00260.8100.1190.127***
Constant0.3490.0854.1300.1840.515***
Constant0.0380.035.b.b0.0060.239
Constant0.090.034.b.b0.0430.187
Constant0.010.005.b.b0.0040.029
Constant0.0810.005.b.b0.0730.091
Mean dependent var0.574SD dependent var0.860
Number of obs720Chi-square3697.983
Prob > chi20.000Akaike crit. (AIC)389.081
Note: *** p < 0.01.
Table 13. Mixed-effects REML regression of NO3-N and salinity.
NO3-NCoef.St.Err.t-Valuep-Value[95% ConfInterval]Sig
salinity−0.0020.001−2.400.016−0.0030**
Constant0.1660.0364.6600.0960.235***
Constant0.0090.006.b.b0.0020.034
Constant0.0040.004.b.b0.0010.026
Constant0.0210.004.b.b0.0140.03
Constant0.0120.001.b.b0.0110.013
Mean dependent var0.132SD dependent var0.199
Number of obs1079Chi-square5.774
Prob > chi20.016Akaike crit. (AIC)−1429.831
Note: *** p < 0.01, ** p < 0.05.
Table 14. Mixed-effects REML regression of NO2-N and salinity.
NO2-NCoef.St.Err.t-Valuep-Value[95% ConfInterval]Sig
salinity00.0010.190.851−0.0010.002
Constant0.040.0152.680.0070.0110.069***
Constant00.b.b03.492 × 1071
Constant0.0030.009.b.b00.997
Constant0.0050.009.b.b00.21
Constant0.0150.001.b.b0.0130.017
Mean dependent var0.052SD dependent var0.162
Number of obs720Chi-square0.035
Prob > chi20.851Akaike crit. (AIC)−845.374
Note: *** p < 0.01.
Disclaimer/Publisher’s Note: The statements, opinions and data contained in all publications are solely those of the individual author(s) and contributor(s) and not of MDPI and/or the editor(s). MDPI and/or the editor(s) disclaim responsibility for any injury to people or property resulting from any ideas, methods, instructions or products referred to in the content.

