Abstract
Small and micro wetlands exhibit enduring ecological dynamics that critically inform urban development planning and biodiversity conservation strategies. Focusing on Wuxi City (a representative area under high-intensity anthropogenic pressure in China’s Yangtze River Delta urban agglomeration), we employ the Integrated Valuation of Ecosystem Services and Tradeoffs (InVEST) model. By integrating multi-temporal remote sensing imagery (1980–2020) with field surveys, we quantitatively assess spatiotemporal variations in habitat quality, with particular emphasis on their enhancement effects. The key findings were as follows. (1) The overall habitat quality in Wuxi City declined significantly during the period of 1980–2020 based on 30 m resolution land-use/land cover (LULC) data. The area of “good” habitat increased marginally by 1.02%, while “fair” and “excellent” habitats decreased by 19.4% and 1.64%, respectively. Conversely, the area of “poor” habitat rose markedly by 28.71%. (2) Small and micro wetlands were identified using Support Vector Machine (SVM) classification on Landsat imagery, showing a transformation from abundance to scarcity and then back to abundance. Before 2000, these areas grew rapidly, reaching a peak of 4.04 × 10⁴ hm2 in 2000. Afterward, there was a sharp decline from 2000 to 2005, followed by stabilization. (3) A comparison of two land-use scenarios revealed that incorporating small and micro wetlands significantly expanded high-quality habitat areas and reduced low-quality areas. The most notable expansion occurred in 2000, with high-quality habitat areas increasing by 12.30%. This study demonstrates that directly using existing land-use data for habitat quality simulation overlooks the influence of small and micro wetlands. It is recommended that habitat quality simulations include extracted small and micro wetland data to ensure accurate assessments.
1. Introduction
Small and micro wetlands (<8 hm2 in area), including small lakes, seasonal ponds, artificial fishponds, and montane depression marshes, constitute essential components of urban ecosystems, delivering indispensable services in biodiversity conservation, hydrological regulation, water purification, climate modulation, and cultural provision [1,2,3,4,5,6]. Research demonstrates that their elevated perimeter-to-area ratio [7] creates abundant littoral habitats, with multiple small wetlands exhibiting significantly higher floristic diversity than single large wetlands [8,9]. Their seasonal hydroperiods mitigate fish predation pressure, rendering them vital amphibian breeding refugia [10], exemplified by the 16 amphibian species recorded in a 0.16 hm2 Floridian pond [11]. Hydrologically, their enhanced evapotranspiration capacity enables effective local water regulation, as evidenced by the dynamic floodwater storage in a 0.2 hm2 urban wetland [12]. Regarding water purification, their extensive sediment-water interfaces achieve superior nitrogen-phosphorus removal efficiency compared to larger wetlands [13], with empirical data showing ten 1 ha small wetlands outperforming one 10 ha wetland [5]. Furthermore, their high evapotranspiration rates [14] contribute to microclimate regulation, while simultaneously providing landscape esthetics, environmental education, and cultural heritage values, with some sites possessing archeological significance [5]. These findings collectively underscore the irreplaceable role of small wetlands in maintaining ecological equilibrium and delivering ecosystem services.
Compared to large wetlands, small and micro wetlands have long been neglected. Under rapid urbanization, fundamental changes in land-use patterns have triggered cascading ecological consequences, including biodiversity decline, water management challenges, and ecosystem degradation [15,16,17,18,19]. Research demonstrates that these spatially dispersed small wetlands provide disproportionately significant ecological benefits and exhibit unique adaptability to space-constrained urban environments [3,8,20,21]. Nevertheless, current land-use policies and conservation frameworks continue to overlook small wetlands, resulting in systematic undervaluation of their ecosystem services [22,23]. A case study of Wuxi City in China’s Yangtze River Delta region reveals that despite its dense water network, urban expansion has caused substantial reduction in small wetland area and connectivity [24]. Crucially, systematic research remains lacking on the spatial heterogeneity of small wetlands in high-density urban agglomerations like Wuxi and their mechanisms of influence on habitat quality, particularly regarding quantitative assessment of ecosystem services to guide urban ecological restoration.
Recent progress in remote sensing technology has revolutionized habitat quality assessment for small wetlands. The unique advantages of satellite remote sensing—including broad spatial coverage and frequent temporal observations—enable effective monitoring of wetland distribution and dynamics, particularly for small and fragmented wetland systems [25,26,27,28]. Wetland information extraction is mainly based on Landsat and Sentinel satellite series, along with other high-resolution satellite imagery [29,30,31]. Landsat remote sensing imagery offers extensive data availability with free access, and its 30 m spatial resolution combined with multispectral capabilities achieves an optimal balance between accuracy, timeliness, and cost-effectiveness for large-scale monitoring [30,32]. Landsat imagery, when integrated with machine learning classification techniques and spectral indices, has proven particularly valuable for wetland identification and change detection, achieving substantially improved mapping accuracy [33,34,35]. While these technological developments have become essential tools for evaluating wetland ecosystem functions, several persistent challenges limit assessment precision, including the small physical size of micro-wetlands, poorly defined perimeter boundaries, and combined pressures from both natural processes and human activities [36,37,38].
The Integrated Valuation of Ecosystem Services and Tradeoffs (InVEST) model has emerged as a prominent ecosystem service assessment tool, valued for its efficient processing of limited input data while maintaining robust analytical capabilities [39,40,41]. The model’s Habitat Quality module quantitatively evaluates regional habitat conditions by incorporating multiple threat factors—including land-use conversion, infrastructure development, and anthropogenic disturbances—with weighted parameters based on their relative ecological impacts [42,43,44]. However, current applications frequently overlook the ecological significance of small and micro wetlands in habitat quality evaluations. Their limited spatial extent and dispersed distribution patterns often lead to systematic underestimation in conventional assessments, resulting in incomplete representations of their ecosystem contributions [18,45]. Explicit inclusion of these small wetland features in modeling frameworks is therefore essential for accurate urban ecosystem health evaluation and reliable ecological forecasting.
This study systematically evaluates the ecological influence of small and micro wetlands on habitat quality dynamics in Wuxi City through a novel scenario-based approach. We developed two distinct land-use models: (1) a conventional model using standard land-use classifications and (2) an enhanced model incorporating small wetland data derived from Landsat imagery (1980–2020). By implementing the InVEST model’s habitat quality module for both scenarios, we conducted comparative analyses of spatial patterns and temporal trends across four decades. Our investigation specifically aims to (1) quantify the measurable improvements in habitat quality attributable to small wetland inclusion, (2) identify spatial variations in wetland-mediated ecological benefits, and (3) establish evidence-based recommendations for integrating these critical ecosystems into urban conservation strategies. The findings provide actionable insights for optimizing wetland preservation in rapidly urbanizing landscapes while advancing methodologies for small wetland ecological assessment.
2. Data and Methods
2.1. Study Area
Wuxi City is located in the southeastern region of Jiangsu Province, China, positioned between latitudes 31°07′ N and 32°02′ N, and longitudes 119°33′ E and 120°38′ E. It serves as a significant prefecture-level city within the Yangtze River Delta and the Taihu Lake Basin. Administratively, Wuxi is divided into five urban districts—Liangxi, Xishan, Huishan, Binhu, and Xinwu—as well as two county-level cities, Jiangyin and Yixing (see Figure 1). The total area of the city is approximately 4628 km2, with the urban area encompassing 1644 km2. The region experiences a humid subtropical monsoon climate, characterized by four distinct seasons, abundant rainfall, and high temperatures. The average annual temperature is 16.2 °C, with a mean annual precipitation of approximately 1121.7 mm. The topography of Wuxi is predominantly flat, with scattered low mountains and residual hills. The city is bordered by the Yangtze River to the north and features a dense network of rivers, lakes, and wetlands [46].
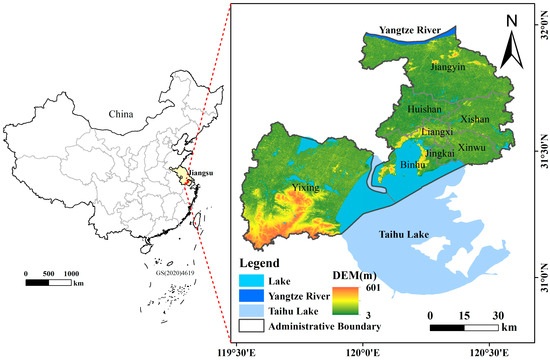
Figure 1.
Location of the Wuxi area.
2.2. Data Sources
Land-use/land cover (LULC) data from 1980 to 2020 were obtained from the Resource and Environment Science and Data Center of the Chinese Academy of Sciences (http://www.resdc.cn, accessed on 25 July 2023). This dataset has a spatial resolution of 30 m and categorizes land into six distinct classes: cropland, forest, grassland, water, built-up land, and unused land. Vector data for major transportation routes (including railways and highways) were sourced from OpenStreetMap (https://www.openstreetmap.org, accessed on 25 July 2023), with a resolution of 1 km. The administrative boundaries and river network data were acquired from the National Geomatics Center of China (NGCC) (http://www.NGCC.cn, accessed on 28 July 2023). Additionally, the remote sensing imagery was retrieved from the United States Geological Survey (USGS) (https://www.usgs.gov, accessed on 15 November 2023). Specifically, Landsat 4–5 TM and Landsat 8 OLI images with a spatial resolution of 30 m were selected, covering Path/Row 119/38. The images were acquired during the vegetation growing season with less than 10% cloud cover, yielding 14 usable scenes after quality filtering (see Table 1).

Table 1.
Remote sensing image data information.
2.3. Methodology
The methodological framework illustrated in Figure 2 consists of three primary phases. First, habitat quality from 1980 to 2020 was assessed using the Habitat Quality module of the InVEST model, based on land-use and land cover (LULC) data and transportation infrastructure (roads and railways). Second, Landsat remote sensing imagery was analyzed by applying the Normalized Difference Vegetation Index (NDVI) and Modified Normalized Difference Water Index (MNDWI) to enhance water and vegetation boundary delineation. The enhanced imagery facilitated the establishment of interpretation markers, with small wetland information extracted through Support Vector Machine (SVM) classification. Finally, the identified small and micro wetlands were incorporated into the LULC dataset to generate an updated version, which was then used to recalculate habitat quality. A comparative analysis between the original and updated datasets was performed to evaluate the impact of small and micro wetlands on habitat quality.
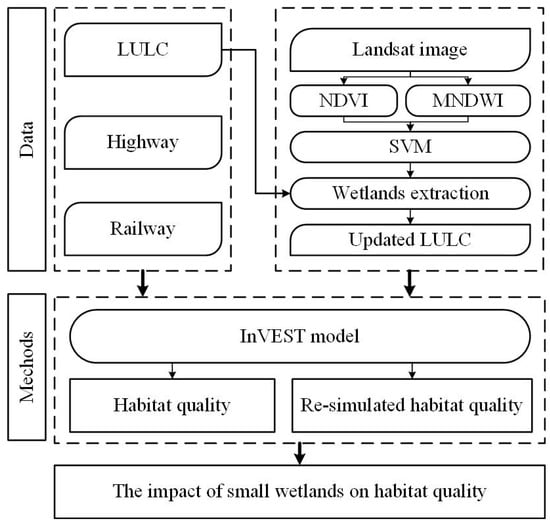
Figure 2.
Methodology framework of this study.
2.3.1. Habitat Quality Evaluation
The InVEST model is widely recognized for its low data requirements, computational efficiency, and high accuracy, making it a reliable tool for habitat quality evaluation [47,48]. The habitat quality module was implemented to evaluate ecological conditions based on land-use maps and the impacts of various threat factors. The model requires five essential input datasets: (1) land-use/cover maps, (2) threat factor data, (3) threat source distribution, (4) habitat types, and (5) sensitivity of each habitat type to different threat sources. The InVEST model operates on the ecological premise that higher habitat quality indices correlate with greater biodiversity richness and enhanced ecosystem resilience [49]. To derive the habitat quality index, the habitat degradation degree must first be calculated using Equation (1):
In this context, represents the degree of habitat degradation, while denotes the number of threat factors to the habitat. indicates the number of grids in the threat layer corresponding to the ground layer, and wr signifies the weight of threat factor . The variable reflects the threat level of grid , and represents the threat level from to habitat grid . Additionally, indicates the accessibility of grid , and denotes the sensitivity of land cover type to threat factor [50]. The calculation of is detailed in Equations (2) and (3):
In this context, represents the linear distance between grid and grid , while denotes the maximum influence range of threat factor [51].
The model assumes that land-use types with higher sensitivity to threats exhibit greater degradation levels. After quantifying habitat degradation, the semi-saturation function transforms grid-based degradation scores into habitat quality values as follows (Equation (4)):
In this equation, represents the habitat quality index for grid in land cover type , while denotes the habitat suitability of land cover type . signifies the habitat degradation degree for grid in land cover type . The parameter (a default model parameter) is the semi-saturation constant , whose value typically equals half of the maximum habitat degradation value (e.g., when maximum degradation is 1, the default software input is 0.5). Notably, higher values indicate more stable ecosystems and consequently higher habitat quality values [52].
In the model, each habitat type exhibits distinct sensitivity to threats, with human activities being the primary driver of habitat quality changes. Therefore, threat factor parameterization primarily considers anthropogenic impacts. Additionally, habitat sensitivity varies by type—higher sensitivity corresponds to lower resistance to disturbances, leading to more severe degradation. Thus, a critical model parameter is habitat sensitivity to each threat factor (Table 2).

Table 2.
Habitat suitability of different land-use/cover types and their sensitivity to threat factors.
Based on field surveys and regional analysis, cropland, built-up land, unused land, railways, and highways were selected as threat factors for Wuxi City (Table 3), as these areas experience intensive human activity. The parameter values and habitat suitability were determined according to the InVEST user manual, the existing literature, and local conditions in Wuxi [53,54]. The habitat quality results were classified into four levels using natural breaks: poor (0–0.22), fair (0.22–0.5), good (0.5–0.75), and excellent (0.75–1.0). Habitat degradation was categorized as slight (0–0.1), mild (0.1–0.23), moderate (0.23–0.32), and severe (0.32–1.0). Both habitat quality and degradation indices range from 0 to 1, where higher values indicate better habitat quality or more severe degradation.

Table 3.
Maximum influence distance and weights of threat factors.
2.3.2. Extraction of Small and Micro Wetlands Information
Current research lacks consensus in defining small and micro wetlands, with substantial variations in depth and size parameters [45,55,56,57]. This study defines them as aquatic features (including lakes, marshes, reservoirs, and rivers) characterized by (1) perennial or seasonal inundation, (2) mean depth <4 m, (3) surface area <8 hm2, and (4) for linear systems, width <10 m combined with length <5 km—a classification consistent with global wetland frameworks [24,33].
Landsat imagery was preprocessed using ENVI 5.3, including mosaicking, radiometric calibration, and atmospheric correction, to minimize interference. MNDWI was applied to extract water features, and NDVI was used for vegetation extraction, resulting in enhanced images. Interpretation markers were then established based on these enhanced images, and an SVM classifier was applied to extract small wetland information. The classification accuracy was validated using the Kappa coefficient (>0.90) and overall accuracy (>95%). Extracted small wetland data were imported into ArcGIS for manual refinement. The MNDWI (Equation (5)) and NDVI (Equation (6)) formulas are as follows:
In this context, denotes the reflectance in the green band (Band 2 for Thematic Mapper [TM] and Band 3 for Operational Land Imager [OLI]). represents the mid-infrared band reflectance (Band 5 in TM and Band 6 in OLI) [58].
indicates the near-infrared band reflectance (Band 4 in TM and Band 5 in OLI), while refers to the red band reflectance (Band 3 in TM and Band 4 in OLI) [59].
3. Results
3.1. Habitat Quality Changes in Wuxi City
The spatial distribution of habitat quality in Wuxi City from 1980 to 2020 was predominantly classified as “fair” (Figure 3). Regions adjacent to major water bodies—such as Lake Taihu, Lake Gehu, and other key lakes and lagoons—consistently exhibited higher habitat quality, while urban built-up areas showed significantly lower values. Over the four-decade study period, a notable patchy expansion of “poor” habitat quality areas occurred, particularly in Wuxi’s core urban districts (e.g., Liangxi District, excluding Yixing and Jiangyin), underscoring the profound influence of urbanization on ecosystem health. Temporally, the mean habitat quality index declined steadily from 0.46 (1990) to 0.40 (2020), with an overall average of 0.43, reflecting progressive degradation.
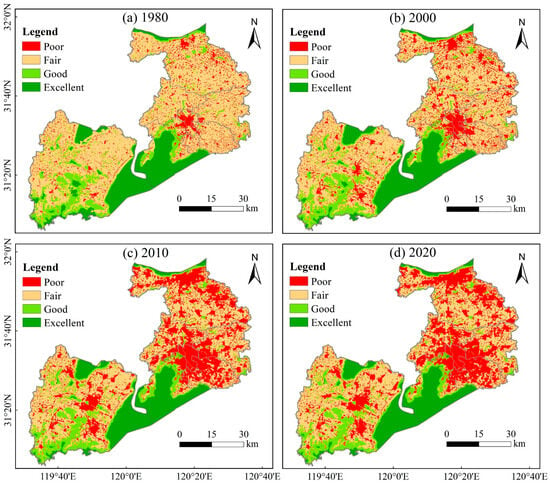
Figure 3.
Spatial distribution of habitat quality in Wuxi City from 1980 to 2020.
Habitat degradation patterns revealed a distinct spatial shift (Figure 4): pre-2010 distributions followed a “north-high, south-low” gradient, which reversed post-2010. “Slightly degraded” areas clustered around Binhu District and northern Yixing (proximal to Lake Gehu), aligning with zones of higher habitat quality near Lake Taihu. In contrast, “mildly degraded” regions, initially concentrated in southern Yixing before 2000, progressively encroached into Wuxi’s urban core after 2000. The majority of the city faced “moderate” degradation, whereas “severely degraded” areas were predominantly linear features along railways and highways, highlighting infrastructure-driven ecological pressures.
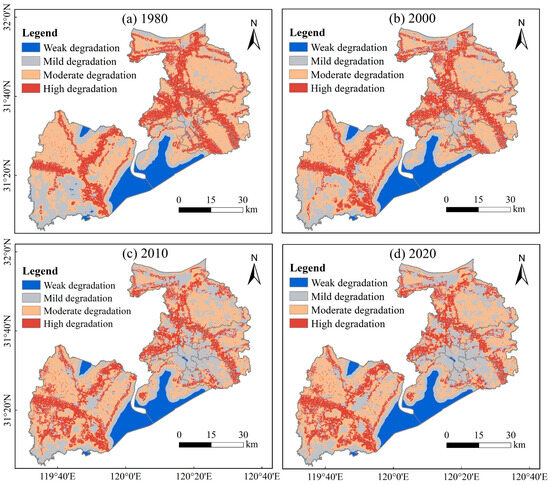
Figure 4.
Spatial distribution of habitat degradation in Wuxi City from 1980 to 2020.
Analysis of habitat quality trends (Figure 5a) reveals a consistent deterioration across Wuxi City from 1980 to 2020. The most striking change occurred in “poor” quality areas, which expanded dramatically from 8.69% to 28.71% of the study area (a net increase of 20.02 percentage points). This expansion was accompanied by substantial declines in “fair” (61.06% to 41.66%, −19.4%) and “excellent” (16.15% to 14.51%, −1.64%) habitats. Only the “good” category showed marginal improvement (+1.02%). The most pronounced degradation occurred between 2005 and 2010, when “poor” areas increased by 7.29 percentage points while “fair” zones decreased by 6.65 percentage points, marking this as the period of most intensive habitat deterioration.
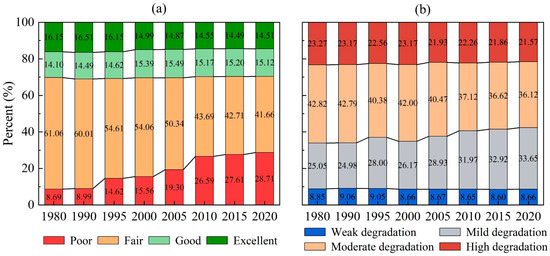
Figure 5.
Changes in the proportion of area covered by different habitat quality and habitat degradation levels in Wuxi City from 1980 to 2020: (a) habitat quality levels and (b) habitat degradation levels.
Habitat degradation patterns (Figure 5b) showed that “slightly” (28.96%) and “moderately” (39.79%) degraded areas dominated the landscape. Temporal trends revealed complex dynamics: “slightly” degraded areas increased by 8.6 percentage points over the study period, while “moderately” and “severely” degraded zones decreased by 6.7 and 1.7 percentage points, respectively. The most significant changes occurred between 2005 and 2010, when “mildly” degraded areas peaked (+3.03 percentage points) and “moderately” degraded areas showed their steepest decline (−3.34 percentage points). Notably, degradation patterns stabilized after 2015, with annual changes in all categories remaining below 1 percentage point.
Land-use transition matrices derived from 1980 to 2020 LULC data were analyzed using Sankey diagrams (Figure 6), revealing pronounced urbanization patterns in Wuxi. The analysis shows built-up areas expanded dramatically from 8.68% to 28.40% of total land area, predominantly through conversion of cropland (94.26% of total urban expansion, equivalent to 10.45 × 10⁴ hm2). Forest and water bodies contributed to secondary conversions, while grassland transfers were minimal. Cropland demonstrated particularly imbalanced dynamics, with total outflows (11.20 × 10⁴ hm2) exceeding inflows (1.53 × 10⁴ hm2) by nearly 7-fold, resulting in a net conversion rate of 86.37%. Water bodies showed cyclical conversion patterns, primarily alternating with cropland areas. These transformations directly correlate with habitat quality deterioration, with two critical periods of accelerated impact: 1990–1995 and 2005–2010. During these intervals, the pace of urban expansion showed the strongest correspondence with habitat quality decline, confirming built-up land growth as the dominant pressure on Wuxi’s ecosystems.
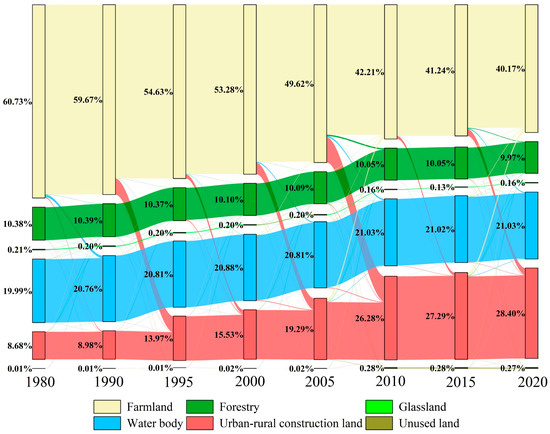
Figure 6.
Land-use transition changes in Wuxi City from 1980 to 2020.
3.2. Changes in Small and Micro Wetlands
Small and micro wetlands were identified through SVM classification, achieving high accuracy as validated by Kappa coefficients (>0.9) and overall accuracy (>95%). These wetlands were subsequently isolated using ArcGIS’s Erase tool based on land-use data for each study period. For additional validation, we compared the 2020 extraction results with the Third National Land Survey data across seven randomly selected sample regions [20,46]. The comparison showed excellent agreement, with discrepancies consistently below 5% (Table 4), confirming the robustness of our wetland extraction methodology.

Table 4.
Accuracy verification of remote sensing image extraction data [33].
Spatial overlay analysis of natural wetland changes (1985–2020) revealed distinct patterns of loss, gain, and stability (Figure 7a–c). While large wetland systems (Yangtze River and Lake Taihu, totaling ~7.8 × 10⁴ hm2) remained stable, we observed substantial changes at local scales: 2.53 × 10⁴ hm2 of natural wetlands were lost (concentrated in Liangxi District, Binhu District, and northern Jiangyin City), while 1.97 × 10⁴ hm2 were gained (primarily in northern Yixing and central Wuxi). Notably, Lake Gehu in Yixing showed significant expansion, and change patterns exhibited spatial overlap between loss and gain areas. Dynamic analysis of small and micro wetlands (Figure 7d–f) revealed a net expansion of approximately 1.86 × 10⁴ hm2 between 1980 and 2020, with nearly half (47%) concentrated in northern Yixing and 24% in southern Jiangyin. Concurrently, approximately 1.35 × 10⁴ hm2 were lost, predominantly in Jiangyin (28.29%), Xishan District (22.80%), and Yixing (20.96%). Stable small and micro wetlands covered only 0.16 × 10⁴ hm2 (35% in southern Yixing), demonstrating significantly lower stability compared to natural wetlands.
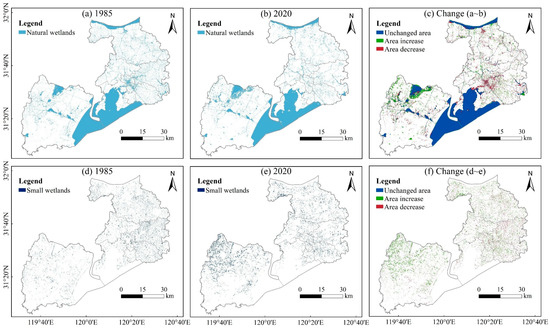
Figure 7.
Spatial changes in natural and small and micro wetlands in Wuxi City from 1985 to 2020: (a) natural wetlands in 1985; (b) natural wetlands in 2020; (c) changes in natural wetlands from 1985 to 2020; (d) small and micro wetlands in 1985; (e) small and micro wetlands in 2020; and (f) changes in small and micro wetlands from 1985 to 2020.
The area of micro and small wetlands generally showed an increasing trend, while the number of patches decreased (Figure 8). The most dramatic changes occurred before 2000, with a near-doubling of wetland area and patch numbers between 1995 and 2000. Post-2000, these metrics stabilized, reaching 2.01 × 10⁴ hm2 (4.35% of Wuxi’s total area) by 2020. Both artificial and natural small wetlands exhibited parallel growth trends, though artificial wetlands temporarily surpassed natural ones in 2000. Despite this crossover, natural small and micro wetlands maintained overall dominance throughout the study period, with only marginal variations observed after 2000.
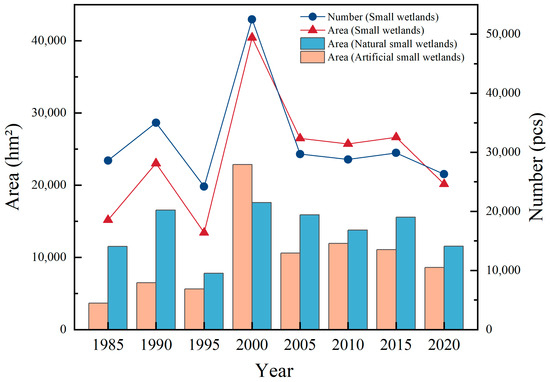
Figure 8.
Changes in the area and patch count of small and micro wetlands in Wuxi City from 1980 to 2020.
3.3. The Impact of Small and Micro Wetlands on Habitat Quality
To quantify the ecological role of small and micro wetlands, we incorporated the extracted wetland data into LULC datasets to generate a revised land-use scenario. Subsequent InVEST model simulations demonstrated that including these wetlands significantly enhanced high-quality habitat areas, particularly in urban cores (Figure 9 vs. Figure 3). The most pronounced improvements occurred in “good” quality habitats within main urban zones, highlighting the disproportionate ecological value of small wetlands relative to their spatial extent. These results provide empirical evidence that even limited small wetland areas can substantially mitigate urban habitat degradation.
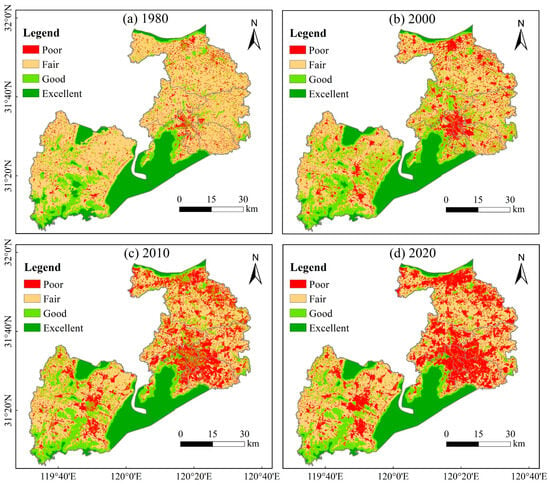
Figure 9.
Spatial distribution of habitat quality in the revised land-use scenario for Wuxi City.
Spatial analysis of habitat quality changes under the two scenarios revealed distinct spatiotemporal patterns in wetland-mediated ecological improvements (Figure 10). The most significant upgrades occurred in Liangxi District during 1980–2000, where habitats shifted predominantly from “poor” to “fair/good”, while other regions showed “fair-to-good” transitions. By 2010, habitat enhancements intensified, with “poor-to-good” conversions concentrated in Jiangyin’s central zone and Liangxi, alongside widespread “fair-to-good” improvements in Yixing and Jiangyin. These spatial patterns persisted in 2020, though improvements became increasingly focused in Yixing, particularly for “fair-to-good” transitions.
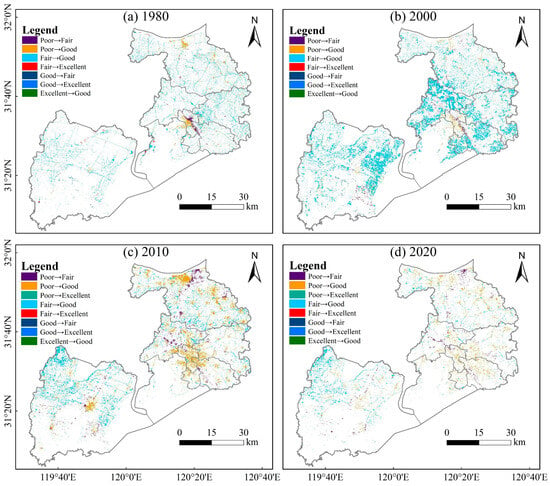
Figure 10.
Spatial changes in habitat quality under two land-use scenarios in Wuxi City, 1980–2020.
The ecological benefits were quantified using Sankey diagrams (Figure 11), demonstrating that wetland incorporation yielded the greatest habitat quality gains in 2000 (12.30% expansion of high-quality areas), followed by 2010 (10.05%). Early periods (1980, 2000) were characterized by “fair-to-good” transitions (3.99% and 10.06%, respectively), while later stages (2010, 2020) showed combined “poor/fair-to-good” improvements (4.55%/4.36% and 1.99%/2.18%, respectively). These differential transition patterns highlight how small wetlands’ habitat benefits evolved alongside urban development phases.
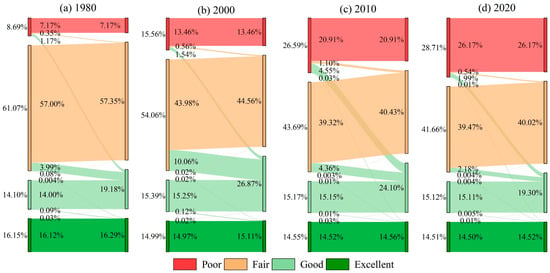
Figure 11.
Habitat quality transitions between different grades under two land-use scenarios in Wuxi City, 1980~2020.
For comprehensive regional assessment, we analyzed three distinct zones: (1) the central urban area (encompassing Liangxi, Xishan, Huishan, Binhu, and Xinwu), (2) Jiangyin City (northern Wuxi), and (3) Yixing City (southern Wuxi). Statistical comparisons (Figure 12) demonstrated consistent habitat quality enhancement across all regions under the wetland-incorporated scenario, with particularly notable gains in 2000 (central urban area: +0.04; Yixing: +0.03) and 2010 (Jiangyin: +0.06), corresponding to periods of intensive urban expansion.
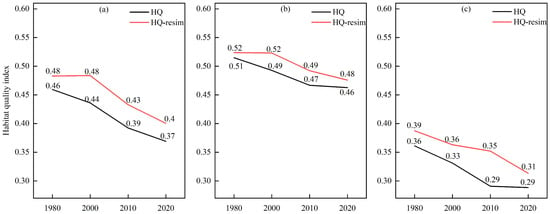
Figure 12.
Changes in the mean habitat quality index across Wuxi’s central urban area, Yixing, and Jiangyin under two land-use scenarios, 1980~2020: (a) Wuxi’s urban area, (b) Yixing City, and (c) Jiangyin City.
The habitat quality upgrades showed clear regional differentiation when examining class transitions (Figure 13). The central urban area exhibited the most substantial improvements in “good” and “excellent” habitats (2000: +5.24%), followed by Yixing (+4.24%). Jiangyin’s peak enhancement occurred later (2010: +2.89%), reflecting distinct temporal trajectories of wetland effectiveness across the urbanization gradient. These spatial patterns underscore how small wetlands’ ecological benefits vary according to regional development characteristics and landscape context.
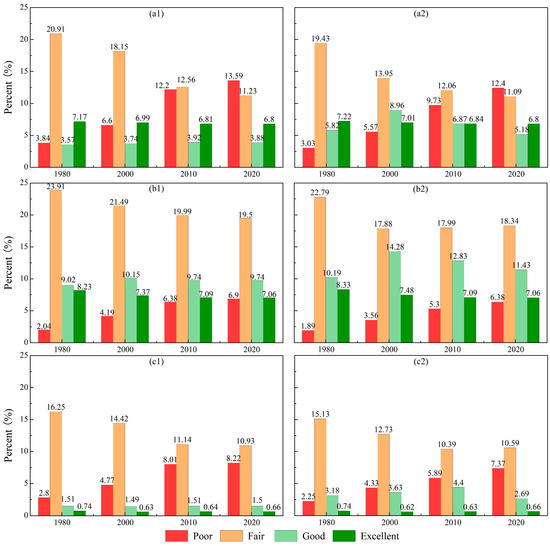
Figure 13.
Transitions in habitat quality grades across Wuxi’s central urban area, Yixing, and Jiangyin under two land-use scenarios, 1980~2020: original land-use scenario—(a1) Wuxi’s central urban area, (b1) Yixing, (c1) Jiangyin; revised land-use scenario—(a2) Wuxi’s central urban area, (b2) Yixing, (c2) Jiangyin.
4. Discussion
This study evaluates urban ecosystem dynamics using the habitat quality module of the InVEST model, whose integrated weighting system incorporates multiple anthropogenic stress factors and demonstrates significant advantages in quantifying habitat degradation [44,60,61]. The results reveal a strong correlation between land-use changes and habitat quality in Wuxi City during 1980–2020. Notably, the rapid conversion of cropland to urban construction land in 1990–1995, 2000–2005, and 2005–2010 (Figure 6) coincided precisely with periods of significant increase in “poor” grade habitat quality. This finding aligns with Chen et al. [62], who similarly reported a declining trend in the regional average habitat quality index during 1980–2020. Zhao et al. [63] and Cao et al. [64] further support these results, demonstrating that habitat quality degradation in Wuxi was primarily driven by cropland loss and urban expansion, while Bian et al. [65] emphasized the critical impact of human activities on habitat quality in the lower Yangtze basin. Of particular note, our results differ from Berta et al. [44] that agricultural expansion dominates habitat degradation. This discrepancy likely stems from regional variations—as a less urbanized area, Ethiopia exhibited more pronounced effects of native vegetation loss and landscape fragmentation due to agricultural expansion.
Landsat series imagery, with its high spatiotemporal resolution and accessibility, provides reliable data support for wetland dynamic monitoring at small-to-medium scales [66,67]. Global studies indicate widespread significant degradation pressures on wetland systems. Pal et al. [68] found that previously intact core wetlands in the Atreyee River basin have fragmented into smaller patches with markedly enhanced edge effects. Singh et al. [69] demonstrated that the shrinkage of India’s Harike wetland is primarily driven by anthropogenic activities, while Jing et al. [70] and Rodrigues et al. [71] revealed prevalent vegetation replacement in floodplain wetlands (e.g., by reeds and meadows). These studies collectively identify two dominant wetland degradation patterns: (1) direct conversion to agricultural and built-up lands [68], and (2) water body shrinkage coupled with vegetation type conversion [70,71]. Our study reveals distinct spatial heterogeneity in natural wetland dynamics in Wuxi City during 1980–2020 (Figure 7). Yixing City showed the most pronounced wetland increase, while Liangxi District experienced the most significant loss. Notably, newly formed wetlands primarily exhibited dispersed, isolated patch configurations, with spatial distribution patterns closely matching the expansion characteristics of small wetlands, particularly in northern Yixing. This suggests that natural wetland dynamics in the study area occur predominantly through the transformation processes of small and micro wetlands. While this aligns with global observations of wetland fragmentation trends [68], it also reflects unique evolutionary characteristics specific to the rapidly urbanizing Yangtze River Delta region.
Our assessment of small and micro wetlands’ impacts on habitat degradation under rapid urbanization reveals that although these wetlands occupied a relatively small area proportion in Wuxi City (8.73% in 2000), their contributions to regional habitat quality improvement significantly exceeded their spatial coverage. Notably, in 2000, when small and micro wetlands accounted for 8.73% of the area, they provided 12.30% of regional habitat quality enhancement (Figure 11). This nonlinear relationship between ecological benefits and spatial scale indicates that multiple small wetlands collectively provide superior ecological benefits compared to single large wetlands, a finding consistent with previous research [72] documenting small wetlands’ advantages in maintaining species diversity. From an ecohydrological perspective, existing studies have systematically elucidated the unique functional mechanisms of small wetlands. Millar [14] demonstrated that the cumulative effect of multiple small wetlands may more effectively reduce runoff at the watershed scale. Knight et al. [73] empirically showed that in downstream wetland restoration projects, distributed small wetland complexes along river channels provide significantly better flood runoff reduction than single large wetlands. These studies collectively highlight that small wetlands, through their distinctive landscape configuration and hydrological characteristics, can deliver specific ecosystem services unattainable by large wetlands [6,14,72,73]. Regarding optimal wetland restoration strategies, the quantitative study by Shen et al. [74] demonstrated that under equivalent restoration areas, distributed small wetland systems could achieve 4.2 times greater nitrogen load reduction than centralized large wetland projects, further underscoring the critical role of small wetlands in urban habitat quality improvement.
The results demonstrated significant spatial heterogeneity in the habitat quality improvement effects of small and micro wetlands (Figure 13). Specifically, the most pronounced enhancement occurred in highly urbanized central districts (+11.81%), with progressively smaller improvements in less urbanized areas, such as Yixing City (+10.28%) and Jiangyin City (+7.89%). This gradient pattern suggests that small wetlands may play a more crucial ecological compensation role in areas with intensive anthropogenic disturbance. This finding aligns with Kim et al. [45], whose complex network analysis revealed that in human-dominated landscapes, small wetlands often function as high-centrality nodes in ecological networks. Their disappearance exerted greater negative impacts on regional ecological connectivity than did equivalent losses of large wetland areas. Existing urban wetland studies [3,21,75,76] confirmed that urban wetland systems enhanced urban ecological resilience and human well-being through multiple mechanisms, including water purification, microclimate regulation, and wildlife habitat provision. These insights provide important foundations for developing differentiated urban ecological management strategies. Particularly in rapidly urbanizing regions, the conservation and restoration of small wetlands should be regarded as key measures for improving regional sustainable development capacity.
This study revealed the significant role of small and micro wetlands in urban habitat quality using the InVEST model, but several limitations should be addressed. First, while the model simulations based on land-use data can reflect macro-scale ecological patterns, discrepancies exist compared to field ecological surveys (e.g., biodiversity monitoring, soil microbial analysis). Since the model parameters (threat factor weights, habitat sensitivity, etc.) were primarily derived from the general literature [53,54], they may not fully capture Wuxi’s rapid urbanization characteristics and regional ecological baseline. Future studies should optimize parameter settings by incorporating local species distribution data and hydrological monitoring records. Second, the identification of small and micro wetlands using 30 m resolution Landsat imagery introduced certain errors. We recommend adopting multi-source data fusion approaches (e.g., integrating Sentinel-2, UAV imagery, and deep learning algorithms) to improve classification accuracy for small-scale wetlands and better elucidate their micro-scale mechanisms in landscape connectivity.
Based on the research findings, we propose the following ecological management strategies. (1) Hierarchical protection system: designate small and micro wetlands with significant habitat improvement effects (e.g., the Liangxi District wetland complex) as priority conservation zones within ecological protection redlines. (2) Dynamic monitoring framework: establish an integrated “Smart Management Platform for Small Wetlands” by combining remote sensing with ground-based observations to enable quantitative assessment of conservation effectiveness. (3) Multifunctional landscape planning: systematically incorporate small wetland networks into sponge city infrastructure and blue-green networks to synergistically enhance multiple ecosystem services, including stormwater regulation, biodiversity conservation, and recreational functions.
5. Conclusions
This study systematically evaluates the ecological contributions of small and micro wetlands in Wuxi City by integrating multi-temporal land-use data (1980–2020) with Landsat-derived wetland maps through the InVEST habitat quality module. Three key findings emerge from our analysis:
(1) Urban habitat degradation trends: Wuxi experienced marked habitat quality deterioration from 1980 to 2020, characterized by substantial expansion of poor-quality habitats and contraction of fair-quality areas. Crucially, the modest 0.5 × 10⁴ hm2 net gain in small wetlands served as a critical buffer against habitat decline, particularly in heavily urbanized zones.
(2) Wetland-mediated habitat improvement: Small and micro wetlands demonstrated disproportionate ecological impacts, driving peak high-quality habitat expansion of 12.30% during 2000—their period of maximum spatial coverage. This finding highlights their exceptional value as natural infrastructure during intense urban development phases.
(3) Spatially differentiated effects: The main urban area showed the strongest response (11.81% habitat improvement), followed by Yixing (10.28%) and Jiangyin (7.89%), revealing distinct regional patterns in wetland effectiveness tied to urbanization intensity and landscape context.
Our results unequivocally demonstrate that conventional land-use datasets fail to capture small wetlands’ ecological significance. We, therefore, recommend mandatory inclusion of high-resolution wetland data in urban habitat assessments, as this study proves such integration is essential for accurate evaluation of ecosystem responses to urbanization. This paradigm shift in assessment methodology will enable more informed conservation planning for these vital yet overlooked landscape elements.
Author Contributions
Data curation, W.W., W.H., X.S. and B.Z.; investigation, J.Z.; methodology, W.W. and W.H.; software, X.S. and B.Z.; supervision, Z.Z.; validation, Z.Z.; writing—original draft, W.W.; writing—review and editing, S.J. All authors have read and agreed to the published version of the manuscript.
Funding
This work was supported by the project entrusted by China Yangtze Power Co., Ltd. (grant Nos. 2423020032, Z242302054) and the National Natural Science Foundation of China (No. 41971025). The project was also supported by the Priority Academic Program Development of Jiangsu Higher Education Institutions (PAPD).
Data Availability Statement
The data will be made available on request.
Conflicts of Interest
The authors declare that this study received funding from the China Yangtze Power Co., Ltd. The funder was not involved in the study design, collection, analysis, interpretation of data, the writing of this article or the decision to submit it for publication. The remaining authors declare that the research was conducted in the absence of any commercial or financial relationships that could be construed as a potential conflict of interest.
References
- Ramsar Convention Secretariat Small Wetlands: Their Importance and Strategies for Effective Conservation; Ramsar Convention on Wetlands: Gland, Switzerland, 2025.
- Shen, X.; Jiang, M.; Lu, X.; Thompson, J.R. Protect and Restore Small Wetlands. Science 2024, 384, 1415. [Google Scholar] [CrossRef]
- Alikhani, S.; Nummi, P.; Ojala, A. Urban Wetlands: A Review on Ecological and Cultural Values. Water 2021, 13, 3301. [Google Scholar] [CrossRef]
- Sofaer, H.R.; Skagen, S.K.; Barsugli, J.J.; Rashford, B.S.; Reese, G.C.; Hoeting, J.A.; Wood, A.W.; Noon, B.R. Projected Wetland Densities under Climate Change: Habitat Loss but Little Geographic Shift in Conservation Strategy. Ecol. Appl. 2016, 26, 1677–1692. [Google Scholar] [CrossRef] [PubMed]
- Zhao, H.; Chen, J.; Chen, X.; Xu, Y.; An, S. Conservation and Management of Small and Micro Wetlands. Wetl. Sci. Manag. 2018, 14, 22–26. [Google Scholar] [CrossRef]
- Cui, L.; Lei, Y.; Zhang, M.; Li, W. Review on small wetlands: Definition, typology and ecological services. Acta Ecol. Sin. 2021, 41, 2077–2085. [Google Scholar] [CrossRef]
- Cohen, M.J.; Creed, I.F.; Alexander, L.C.; Basu, N.; Calhoun, A.J.K.; Craft, C.; D’Amico, E.; DeKeyser, E.S.; Fowler, L.; Golden, H.E.; et al. Do Geographically Isolated Wetlands Influence Landscape Functions? Proc. Natl. Acad. Sci. USA 2015, 113, 1978–1986. [Google Scholar] [CrossRef]
- Richardson, S.J.; Clayton, R.; Rance, B.D.; Broadbent, H.; McGlone, M.S.; Wilmshurst, J.M. Small Wetlands Are Critical for Safeguarding Rare and Threatened Plant Species. Appl. Veg. Sci. 2015, 18, 230–241. [Google Scholar] [CrossRef]
- Deane, D.C.; Fordham, D.A.; He, F.; Bradshaw, C.J.A. Future Extinction Risk of Wetland Plants Is Higher from Individual Patch Loss than Total Area Reduction. Biol. Conserv. 2017, 209, 27–33. [Google Scholar] [CrossRef]
- Semlitsch, R.D.; Bodie, J.R. Are Small, Isolated Wetlands Expendable? Conserv. Biol. 1998, 12, 1129–1133. [Google Scholar] [CrossRef]
- Dodd, C.K., Jr.; Cade, B.S. Movement Patterns and the Conservation of Amphibians Breeding in Small, Temporary Wetlands. Conserv. Biol. 1998, 12, 331–339. [Google Scholar] [CrossRef]
- Braun, D.G.; Clark, V.C. The Benefits of Small Wetlands; Martin County Board of County Commissioners: Martin County, FL, USA, 2017. [Google Scholar]
- Cheng, F.Y.; Basu, N.B. Biogeochemical Hotspots: Role of Small Water Bodies in Landscape Nutrient Processing. Water Resour. Res. 2017, 53, 5038–5056. [Google Scholar] [CrossRef]
- Millar, J.B. Shoreline-Area Ratio as a Factor in Rate of Water Loss from Small Sloughs. J. Hydrol. 1971, 14, 259–284. [Google Scholar] [CrossRef]
- Alberti, M. The Effects of Urban Patterns on Ecosystem Function. Int. Reg. Sci. Rev. 2005, 28, 168–192. [Google Scholar] [CrossRef]
- Seto, K.C.; Reenberg, A.; Boone, C.G.; Fragkias, M.; Haase, D.; Langanke, T.; Marcotullio, P.; Munroe, D.K.; Olah, B.; Simon, D. Urban Land Teleconnections and Sustainability. Proc. Natl. Acad. Sci. USA 2012, 109, 7687–7692. [Google Scholar] [CrossRef]
- Piano, E.; De Wolf, K.; Bona, F.; Bonte, D.; Bowler, D.E.; Isaia, M.; Lens, L.; Merckx, T.; Mertens, D.; van Kerckvoorde, M.; et al. Urbanization Drives Community Shifts towards Thermophilic and Dispersive Species at Local and Landscape Scales. Glob. Change Biol. 2017, 23, 2554–2564. [Google Scholar] [CrossRef]
- Rahimi, L.; Malekmohammadi, B.; Yavari, A.R. Assessing and Modeling the Impacts of Wetland Land Cover Changes on Water Provision and Habitat Quality Ecosystem Services. Nat. Resour. Res. 2020, 29, 3701–3718. [Google Scholar] [CrossRef]
- He, J.; Huang, J.; Li, C. The Evaluation for the Impact of Land Use Change on Habitat Quality: A Joint Contribution of Cellular Automata Scenario Simulation and Habitat Quality Assessment Model. Ecol. Model. 2017, 366, 58–67. [Google Scholar] [CrossRef]
- Hale, R.; Swearer, S.E.; Sievers, M.; Coleman, R. Balancing Biodiversity Outcomes and Pollution Management in Urban Stormwater Treatment Wetlands. J. Environ. Manag. 2019, 233, 302–307. [Google Scholar] [CrossRef]
- Blackwell, M.; Pilgrim, E. Ecosystem Services Delivered by Small-Scale Wetlands. Hydrol. Sci. J.-J. Des. Sci. Hydrol. 2011, 56, 1467–1484. [Google Scholar] [CrossRef]
- Davidson, N. How Much Wetland Has the World Lost? Long-Term and Recent Trends in Global Wetland Area. Mar. Freshw. Res. 2014, 65, 934–941. [Google Scholar] [CrossRef]
- Junk, W.J.; An, S.; Finlayson, C.M.; Gopal, B.; Květ, J.; Mitchell, S.A.; Mitsch, W.J.; Robarts, R.D. Current State of Knowledge Regarding the World’s Wetlands and Their Future under Global Climate Change: A Synthesis. Aquat Sci 2013, 75, 151–167. [Google Scholar] [CrossRef]
- Zhang, J.; Liu, X.; Deng, Y.; Feng, Y.; Zhu, B.; Chu, L.; Zhang, Z. Changing features and influencing factors of small and micro wetlands in Wuxi City. J. Nanjing For. Univ. (Nat. Sci. Ed.) 2024, 48, 27–36. [Google Scholar] [CrossRef]
- Kaplan, G.; Avdan, U. Monthly Analysis of Wetlands Dynamics Using Remote Sensing Data. ISPRS Int. J. Geo-Inf. 2018, 7, 411. [Google Scholar] [CrossRef]
- Rapinel, S.; Fabre, E.; Dufour, S.; Arvor, D.; Mony, C.; Hubert-Moy, L. Mapping Potential, Existing and Efficient Wetlands Using Free Remote Sensing Data. J. Environ. Manag. 2019, 247, 829–839. [Google Scholar] [CrossRef]
- Gallant, A.L. The Challenges of Remote Monitoring of Wetlands. Remote Sens. 2015, 7, 10938–10950. [Google Scholar] [CrossRef]
- Chasmer, L.; Mahoney, C.; Millard, K.; Nelson, K.; Peters, D.; Merchant, M.; Hopkinson, C.; Brisco, B.; Niemann, O.; Montgomery, J.; et al. Remote Sensing of Boreal Wetlands 2: Methods for Evaluating Boreal Wetland Ecosystem State and Drivers of Change. Remote Sens. 2020, 12, 1321. [Google Scholar] [CrossRef]
- Zhang, X.; Wang, G.; Xue, B.; Zhang, M.; Tan, Z. Dynamic Landscapes and the Driving Forces in the Yellow River Delta Wetland Region in the Past Four Decades. Sci. Total Environ. 2021, 787, 147644. [Google Scholar] [CrossRef]
- Guo, M.; Li, J.; Sheng, C.; Xu, J.; Wu, L. A Review of Wetland Remote Sensing. Sensors 2017, 17, 777. [Google Scholar] [CrossRef] [PubMed]
- Chu, L.; Sun, T.; Wang, T.; Li, Z.; Cai, C. Evolution and Prediction of Landscape Pattern and Habitat Quality Based on CA-Markov and InVEST Model in Hubei Section of Three Gorges Reservoir Area (TGRA). Sustainability 2018, 10, 3854. [Google Scholar] [CrossRef]
- Chao Rodríguez, Y.; el Anjoumi, A.; Domínguez Gómez, J.A.; Rodríguez Pérez, D.; Rico, E. Using Landsat Image Time Series to Study a Small Water Body in Northern Spain. Environ. Monit. Assess. 2014, 186, 3511–3522. [Google Scholar] [CrossRef]
- Zhang, J.; Chu, L.; Zhang, Z.; Zhu, B.; Liu, X.; Yang, Q. Evolution of Small and Micro Wetlands and Their Driving Factors in the Yangtze River Delta-A Case Study of Wuxi Area. Remote Sens. 2023, 15, 1152. [Google Scholar] [CrossRef]
- Cavallo, C.; Papa, M.N.; Gargiulo, M.; Palau-Salvador, G.; Vezza, P.; Ruello, G. Continuous Monitoring of the Flooding Dynamics in the Albufera Wetland (Spain) by Landsat-8 and Sentinel-2 Datasets. Remote Sens. 2021, 13, 3525. [Google Scholar] [CrossRef]
- Acharya, T.D.; Subedi, A.; Lee, D.H. Evaluation of Machine Learning Algorithms for Surface Water Extraction in a Landsat 8 Scene of Nepal. Sensors 2019, 19, 2769. [Google Scholar] [CrossRef]
- Rapinel, S.; Hubert-Moy, L.; Clément, B.; Maltby, E. Mapping Wetland Functions Using Earth Observation Data and Multi-Criteria Analysis. Environ. Monit. Assess. 2016, 188, 641. [Google Scholar] [CrossRef]
- Zhou, D.; Gong, H.; Liu, Z. Integrated Ecological Assessment of Biophysical Wetland Habitat in Water Catchments: Linking Hydro-Ecological Modelling with Geo-Information Techniques. Ecol. Model. 2008, 214, 411–420. [Google Scholar] [CrossRef]
- McLaughlin, D.L.; Cohen, M.J. Realizing Ecosystem Services: Wetland Hydrologic Function along a Gradient of Ecosystem Condition. Ecol. Appl. 2013, 23, 1619–1631. [Google Scholar] [CrossRef]
- da Anjinho, P.S.; Barbosa, M.A.G.A.; Mauad, F.F. Evaluation of InVEST’s Water Ecosystem Service Models in a Brazilian Subtropical Basin. Water 2022, 14, 1559. [Google Scholar] [CrossRef]
- Redhead, J.W.; Stratford, C.; Sharps, K.; Jones, L.; Ziv, G.; Clarke, D.; Oliver, T.H.; Bullock, J.M. Empirical Validation of the InVEST Water Yield Ecosystem Service Model at a National Scale. Sci. Total Environ. 2016, 569–570, 1418–1426. [Google Scholar] [CrossRef]
- Posner, S.; Verutes, G.; Koh, I.; Denu, D.; Ricketts, T. Global Use of Ecosystem Service Models. Ecosyst. Serv. 2016, 17, 131–141. [Google Scholar] [CrossRef]
- Wang, B.; Cheng, W. Effects of Land Use/Cover on Regional Habitat Quality under Different Geomorphic Types Based on InVEST Model. Remote Sens. 2022, 14, 1279. [Google Scholar] [CrossRef]
- Wu, L.; Sun, C.; Fan, F. Estimating the Characteristic Spatiotemporal Variation in Habitat Quality Using the InVEST Model—A Case Study from Guangdong–Hong Kong–Macao Greater Bay Area. Remote Sens. 2021, 13, 1008. [Google Scholar] [CrossRef]
- Berta Aneseyee, A.; Noszczyk, T.; Soromessa, T.; Elias, E. The InVEST Habitat Quality Model Associated with Land Use/Cover Changes: A Qualitative Case Study of the Winike Watershed in the Omo-Gibe Basin, Southwest Ethiopia. Remote Sens. 2020, 12, 1103. [Google Scholar] [CrossRef]
- Kim, B.; Lee, J.; Park, J. Role of Small Wetlands on the Regime Shift of Ecological Network in a Wetlandscape. Environ. Res. Commun. 2022, 4, 041006. [Google Scholar] [CrossRef]
- Li, J.; Sun, R.; Xu, L.; Bian, X. Discussion on the Technical Scheme and Result of the Spatial Scope Monitoring of the Wetland in Wuxi. Mod. Surv. Mapp. 2020, 43, 27–30. [Google Scholar]
- Wu, J.; Luo, J.; Zhang, H.; Qin, S.; Yu, M. Projections of Land Use Change and Habitat Quality Assessment by Coupling Climate Change and Development Patterns. Sci. Total Environ. 2022, 847, 157491. [Google Scholar] [CrossRef]
- Tang, F.; Fu, M.; Wang, L.; Zhang, P. Land-Use Change in Changli County, China: Predicting Its Spatio-Temporal Evolution in Habitat Quality. Ecol. Indic. 2020, 117, 106719. [Google Scholar] [CrossRef]
- Zhang, M.; Zhang, F.; Li, X. Evaluation of Habitat Quality Based on InVEST Model: A Case Study of Tongzhou District of Beijing, China. Landsc. Archit. 2020, 27, 95–99. [Google Scholar] [CrossRef]
- Wei, Q.; Abudureheman, M.; Halike, A.; Yao, K.; Yao, L.; Tang, H.; Tuheti, B. Temporal and Spatial Variation Analysis of Habitat Quality on the PLUS-InVEST Model for Ebinur Lake Basin, China. Ecol. Indic. 2022, 145, 109632. [Google Scholar] [CrossRef]
- Zheng, W.; Li, S.; Ke, X.; Li, X.; Zhang, B. The Impacts of Cropland Balance Policy on Habitat Quality in China: A Multiscale Administrative Perspective. J. Environ. Manag. 2022, 323, 116182. [Google Scholar] [CrossRef]
- Zhao, Y.; Qu, Z.; Zhang, Y.; Ao, Y.; Han, L.; Kang, S.; Sun, Y. Effects of Human Activity Intensity on Habitat Quality Based on Nighttime Light Remote Sensing: A Case Study of Northern Shaanxi, China. Sci. Total Environ. 2022, 851, 158037. [Google Scholar] [CrossRef]
- Chen, S.; Jin, Y.; Huang, Y. Spatio-temporal variations of habitat quality and its underlying mechanism in the central region of Yangtze River Delta. Chin. J. Ecol. 2023, 42, 1175–1185. [Google Scholar] [CrossRef]
- Yang, Y. Evolution of Habitat Quality and Association with Land-Use Changes in Mountainous Areas: A Case Study of the Taihang Mountains in Hebei Province, China. Ecol. Indic. 2021, 129, 107967. [Google Scholar] [CrossRef]
- Tornwall, B.M.; Pitt, A.L.; Brown, B.L.; Hawley-Howard, J.; Baldwin, R.F. Diversity Patterns Associated with Varying Dispersal Capabilities as a Function of Spatial and Local Environmental Variables in Small Wetlands in Forested Ecosystems. Forests 2020, 11, 1146. [Google Scholar] [CrossRef]
- Chen, Y.; Wu, L.; Zhang, G.; Tan, Z.; Qiao, S. Quantitative assessment of surface hydrological connectivity in Momoge National Nature Reserve, Northeast China. Chin. J. Appl. Ecol. 2020, 31, 3833–3841. [Google Scholar] [CrossRef]
- Rabbani, G.; Rahman, S.H.; Faulkner, L. Impacts of Climatic Hazards on the Small Wetland Ecosystems (Ponds): Evidence from Some Selected Areas of Coastal Bangladesh. Sustainability 2013, 5, 1510–1521. [Google Scholar] [CrossRef]
- Liu, Y.; Yang, P.; Zhang, S.; Wang, W. Dynamic Identification and Health Assessment of Wetlands in the Middle Reaches of the Yangtze River Basin under Changing Environment. J. Clean. Prod. 2022, 345, 131105. [Google Scholar] [CrossRef]
- Xing, L.; Niu, Z.; Jiao, C.; Zhang, J.; Han, S.; Cheng, G.; Wu, J. A Novel Workflow for Seasonal Wetland Identification Using Bi-Weekly Multiple Remote Sensing Data. Remote Sens. 2022, 14, 1037. [Google Scholar] [CrossRef]
- Tallis, H.; Polasky, S. Mapping and Valuing Ecosystem Services as an Approach for Conservation and Natural-Resource Management. Ann. N. Y. Acad. Sci. 2009, 1162, 265–283. [Google Scholar] [CrossRef]
- Zhang, X.; Liao, L.; Xu, Z.; Zhang, J.; Chi, M.; Lan, S.; Gan, Q. Interactive Effects on Habitat Quality Using InVEST and GeoDetector Models in Wenzhou, China. Land 2022, 11, 630. [Google Scholar] [CrossRef]
- Chen, S.; Liu, X. Spatio-Temporal Variations of Habitat Quality and Its Driving Factors in the Yangtze River Delta Region of China. Glob. Ecol. Conserv. 2024, 52, e02978. [Google Scholar] [CrossRef]
- Zhao, X.; Wang, Y.; He, X.; Liu, X.; Zhang, J.; Deng, Y.; Feng, Y.; Chu, L.; Zhang, Z. Changing features of habitat quality in Wuxi City based on InVEST model. J. Nanjing For. Univ. (Nat. Sci. Ed.) 2024, 48, 165–172. [Google Scholar] [CrossRef]
- Cao, Y.; Wang, C.; Su, Y.; Duan, H.; Wu, X.; Lu, R.; Su, Q.; Wu, Y.; Chu, Z. Study on Spatiotemporal Evolution and Driving Forces of Habitat Quality in the Basin along the Yangtze River in Anhui Province Based on InVEST Model. Land 2023, 12, 1092. [Google Scholar] [CrossRef]
- Bian, C.; Yang, L.; Zhao, X.; Yao, X.; Xiao, L. The Impact of Human Activity Expansion on Habitat Quality in the Yangtze River Basin. Land 2024, 13, 908. [Google Scholar] [CrossRef]
- Mahdianpari, M.; Jafarzadeh, H.; Granger, J.E.; Mohammadimanesh, F.; Brisco, B.; Salehi, B.; Homayouni, S.; Weng, Q. A Large-Scale Change Monitoring of Wetlands Using Time Series Landsat Imagery on Google Earth Engine: A Case Study in Newfoundland. GISci. Remote Sens. 2020, 57, 1102–1124. [Google Scholar] [CrossRef]
- Mao, D.; Wang, M.; Wang, Y.; Jiang, M.; Yuan, W.; Luo, L.; Feng, K.; Wang, D.; Xiang, H.; Ren, Y.; et al. The Trajectory of Wetland Change in China between 1980 and 2020: Hidden Losses and Restoration Effects. Sci. Bull. 2025, 70, 587–596. [Google Scholar] [CrossRef]
- Pal, S.; Sarkar, R.; Saha, T.K. Exploring the Forms of Wetland Modifications and Investigating the Causes in Lower Atreyee River Floodplain Area. Ecol. Inform. 2022, 67, 101494. [Google Scholar] [CrossRef]
- Singh, S.; Bhardwaj, A.; Verma, V.K. Remote Sensing and GIS Based Analysis of Temporal Land Use/Land Cover and Water Quality Changes in Harike Wetland Ecosystem, Punjab, India. J. Environ. Manag. 2020, 262, 110355. [Google Scholar] [CrossRef]
- Jing, L.; Zeng, Q.; He, K.; Liu, P.; Fan, R.; Lu, W.; Lei, G.; Lu, C.; Wen, L. Vegetation Dynamic in a Large Floodplain Wetland: The Effects of Hydroclimatic Regime. Remote Sens. 2023, 15, 2614. [Google Scholar] [CrossRef]
- Rodrigues, I.S.; Hopkinson, C.; Chasmer, L.; MacDonald, R.J.; Bayley, S.E.; Brisco, B. Multi-Decadal Floodplain Classification and Trend Analysis in the Upper Columbia River Valley, British Columbia. Hydrol. Earth Syst. Sci. 2024, 28, 2203–2221. [Google Scholar] [CrossRef]
- Kačergytė, I.; Arlt, D.; Berg, Å.; Żmihorski, M.; Knape, J.; Rosin, Z.M.; Pärt, T. Evaluating Created Wetlands for Bird Diversity and Reproductive Success. Biol. Conserv. 2021, 257, 109084. [Google Scholar] [CrossRef]
- Knight, R.L. Ancillary Benefits and Potential Problems with the Use of Wetlands for Nonpoint Source Pollution Control. Ecol. Eng. 1992, 1, 97–113. [Google Scholar] [CrossRef]
- Shen, W.; Zhang, L.; Ury, E.A.; Li, S.; Xia, B.; Basu, N.B. Restoring Small Water Bodies to Improve Lake and River Water Quality in China. Nat. Commun. 2025, 16, 294. [Google Scholar] [CrossRef] [PubMed]
- Díaz-Pinzón, L.; Sierra, L.; Trillas, F. The Economic Value of Wetlands in Urban Areas: The Benefits in a Developing Country. Sustainability 2022, 14, 8302. [Google Scholar] [CrossRef]
- Pedersen, E.; Weisner, S.E.B.; Johansson, M. Wetland Areas’ Direct Contributions to Residents’ Well-Being Entitle Them to High Cultural Ecosystem Values. Sci. Total Environ. 2019, 646, 1315–1326. [Google Scholar] [CrossRef] [PubMed]
Disclaimer/Publisher’s Note: The statements, opinions and data contained in all publications are solely those of the individual author(s) and contributor(s) and not of MDPI and/or the editor(s). MDPI and/or the editor(s) disclaim responsibility for any injury to people or property resulting from any ideas, methods, instructions or products referred to in the content. |
© 2025 by the authors. Licensee MDPI, Basel, Switzerland. This article is an open access article distributed under the terms and conditions of the Creative Commons Attribution (CC BY) license (https://creativecommons.org/licenses/by/4.0/).


