Abstract
A lake is a sink, source, and converter of phosphorus, and its ability to intercept phosphorus in water bodies is receiving increasing attention. In this study, the Nanyi Lake sediment in the middle and lower reaches of the Yangtze River basin was taken as the research object, and the phosphorus adsorption capacity and influencing factors of the sediment in the basin were investigated through a control variable experiment. The adsorption capacities of sediments at the sample points are L1 > L3 > L2, with maximum values of 372.41 mg/kg, 332.53 mg/kg, and 346.27 mg/kg, respectively. Equilibrium adsorption is reached at approximately 5 h for L1 and L2, and 10 h for L3. The interaction between sediment and phosphorus involves physical adsorption and mono-layer adsorption. The increase in temperature does not promote phosphorus migration from overlying water to sediments, but instead triggers phosphorus release from sediments, indicating an exothermic process for phosphorus adsorption on sediments. When the phosphorus concentration in overlying water is below and above 1 mg/L, increasing disturbance intensity results in enhanced phosphorus adsorption and release in sediments, respectively. The presence of humus in the overlying water, especially humic acid compared with fulvic acid, causes stronger adsorption of phosphorus on sediments. Overall, this study contributes to our understanding of phosphorus adsorption characteristics and mechanisms in Nanyi Lake sediments, providing valuable insights for managing and conserving this freshwater ecosystem.
1. Introduction
Phosphorus, an indispensable nutrient for biological productivity [1], is often a limiting factor for primary production in most freshwater systems. However, it is also a prevalent pollutant. Within lake ecosystems, dissolved phosphate is adsorbed onto inorganic particles, particularly amorphous iron oxide. It is crucial in buffering bioavailable phosphorus to a relatively low concentration, thereby limiting its availability as a nutrient [2]. Phosphate released from lake sediments facilitates the movement of phorphorus into overlying water through processes like molecular diffusion and cation–anion exchange, consequently leading to endogenous phosphorus pollution [3]. The fixation of phosphorus occurs through its binding with various metal oxides in sediments, effectively reducing phosphorus levels in overlying water. However, alterations at the sediment–water interface can trigger phosphorus release from the sediment, resulting in endogenous pollution. Hence, sediment phosphorus adsorption is crucial for adjusting phosphate concentrations in the overlying water [4]. Recent years have witnessed numerous studies focusing on the adsorption characteristics of phosphate in sediments. For instance, Wang et al. investigated the adsorption mechanism of phosphorus in Three Gorges Reservoir sediments and observed a drop in adsorption capacity with increasing sediment particle size [5]. Similarly, Jin et al. explored the variations and influencing factors of phosphorus adsorption in sediments from different nutrient-rich lakes, indicating an increase in the adsorption process with rising temperatures [6]. Nevertheless, the adsorption mechanism of phosphate onto Nanyi Lake sediments remains unclear. Therefore, employing laboratory simulations of the aquatic environment, this study aims to utilize kinetic and thermodynamic models to elucidate the adsorption process and investigate the impact of various influencing factors, ultimately shedding light on the adsorption mechanism of Nanyi Lake sediments from both qualitative and quantitative perspectives.
Located in Xuancheng City in the southeastern region of Anhui Province, Nanyi Lake serves as a freshwater body that flows into the lower reaches of the Yangtze River. As the largest lake in southern Anhui, it plays a pivotal role in regulating the water volume of the Shuiyang River, thus exerting a significant influence on the water quality of the Yangtze River Basin [7]. However, research on the water quality of Nanyi Lake and its influencing factors, particularly regarding the adsorption characteristics of phosphorus by sediments, still needs to be made available. It is of substantial importance to reveal the adsorption characteristics of phosphorus in the sediments of Nanyi Lake. Consequently, this study aims to focus on Nanyi Lake, specifically the lower reaches of the Yangtze River, by selecting representative sites of various environmental types. It intends to investigate surface sediment adsorption kinetics and thermodynamics, the impact of initial solution concentration, calcium and magnesium ion content, and water disturbance intensity on phosphorus adsorption and release. This work seeks to explore the physical and chemical effects of different environmental factors on the sediment–water interface. The research results may provide a scientific basis and technical support for the comprehensive assessment of eutrophication mechanisms and phosphorus release risks associated with Nanyi Lake sediments.
2. Materials and Methods
2.1. Overview of the Study Area and Sample Collection
Nanyi Lake (31°03′~31°20′ N, 118°80′~119°07′ E) is located at the junction of Xuancheng County and Langxi County in Xuancheng City, Southeast Anhui Province. The lake covers an area of about 210 km2, with a water depth ranging from 2 to 4 m. It is the fourth largest natural freshwater lake in Anhui Province and serves as a lake that connects rivers and lakes, with acidic water quality. Based on the characteristics of the lake area, Nanyi Lake is divided into three regions: northeast, southeast, and northwest lake areas (Figure 1). In November 2020, GPS was used to determine each sampling point’s longitude and latitude coordinates, and surface sediment samples from the centers of the three lake areas (L1, L2, and L3) were collected using grab samplers. The collected sediments were placed in self-sealing bags, sealed, transported back to the laboratory, and stored at −20 °C. After freeze-drying, the sediments were crushed, ground using an agate mortar, sieved, and sealed in self-sealing bags for storage.
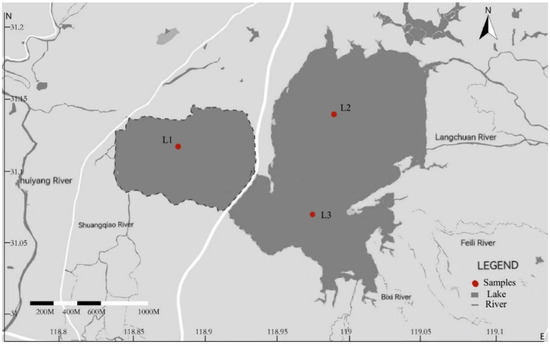
Figure 1.
Distribution of sampling sites in Nanyi Lake.
2.2. Chemicals
Analytical grade of calcium chloride anhydrous, magnesium chloride, potassium phosphate monobasic, potassium bicarbonate, ascorbic acid, and ammonium molybdate were provided by Sinopharm Chemical Reagent Co., Ltd. (Shanghai, China).
2.3. Phosphorus Adsorption-Release Test Method
The contents of total phosphorus (TP) and dissolved total phosphorus (DTP) in the sediments were 0.28 mg/L and 0.051 mg/L, respectively. The adsorption release process of phosphorus in the sediments of Nanyi Lake was simulated under laboratory conditions using the following experimental procedures: According to the concentrations of matrix components in the overlying water, the synthetic solution was prepared in a 15 mL centrifuge tube including 0.7 mol/L H2PO4−, 15 mg/L Ca2+, 3 mg/L Mg2+, and 10 mol/L HCO3−. The sediment sample was then mixed with the synthetic solution and shaken for 24 h at a speed of 150 r/min. The supernatant was centrifuged, and the concentration of phosphate in the solution was determined using the ammonium molybdate spectrophotometric method (GB 11893-89) [8]. The sediment samples before and after adsorption were analyzed using SEM and XRD characterization.
2.3.1. Adsorption Kinetics Experiment
The 0.01 g sediment was spiked into 5 mg/L phosphate solution in a 15 mL centrifuge tube. It was put in an oscillator and shaken at a speed of 150 r/min for 24 h. The samples were then centrifuged and filtered to determine the concentration of phosphate in the filtrate using the ammonium molybdate spectrophotometric method (GB 11893-89) [8].
The amount of phosphate adsorbed by the sediment was calculated based on Equation (1). The adsorption kinetic data were analyzed by the pseudo-first-order kinetic model (PFO) (Equation (2)) [9], pseudo-second-order kinetic model (PSO) (Equation (3)) [10], and Elovich model (Equation (4)).
where qe is the adsorption amount of phosphorus per unit weight of sediment at equilibrium (mg/kg), C0 is the initial concentration of phosphorus (mg/L), Ct is the concentration of phosphorus at specific time (mg/L), V is the volume of test phosphorus solution (L), m is the dosage of sediment sample (g), qt is the adsorption amount of phosphorus per unit weight of sediment at specific time (mg/kg), K1 and K2 are the rate constants of PFO and PSO kinetic equation in sequence (min−1), α is the adsorption rate (mg/(g·h)), and β is the adsorption coefficient (g/mg).
2.3.2. Isothermal Adsorption Experiment
A 15 mL phosphate solution with concentrations ranging from 0 to 0.9 mg/L were prepared. After adding 0.01 g sediment, the samples were put into a water bath oscillator at temperatures of 288 K, 298 K, and 308 K and shaken for 24 h. The phosphate concentrations in the filtrate were determined after centrifugation and filtration. The Langmuir [11] and Freundlich [12] models were used to fit the experimental data and analyze the adsorption mechanism.
Langmuir model:
Freundlich model:
where qmax is the theoretical saturated adsorption capacity (mg/kg), b is the adsorption heat constant (L/mg), Ce is the residual phosphorus concentration in the solution at adsorption equilibrium (mg/L), 0 is the initial concentration of phosphorus solution, n is a constant representing the adsorption strength of solid adsorbent, KF is the adsorption constant, and RL is the reliability of Langmuir equation.
2.3.3. Effect of Water Disturbance Intensity on Phosphorus Exchange
The 15 mL phosphate solutions with concentrations of 0, 0.2, 0.5, 0.8, 1, 2, 5, and 8 mg/L were prepared together with dosing sodium azoate (0.02%) to inhibit bacterial growth. In total, 0.01 g of sediment was added to the phosphate solution, which was put in a thermostatic oscillator. The rotation speed of the oscillator was set to 75 r/min and 150 r/min, respectively. The phosphate concentrations in the solutions were measured after a specific reaction time.
2.3.4. Determination of EPC0 and NAP
Without adding any environmental factors (Ca2+, Mg2+, HCO3−), 15 mL potassium dihydrogen phosphate solutions with concentrations ranging from 0 to 1 mg/L and a concentration gradient of 0.2 were prepared. After adding 0.01 g of sediment sample to each solution, its phosphate concentration was measured at specific time intervals to plot the qe versus Ce curve (Equation (8)). In low phosphorus concentration solution, the adsorption curve of sediment to phosphorus generally conforms to the monadic quadratic linear equation [13]. The critical phosphorus equilibrium concentration (EPC0) is the corresponding value of Ce when qe is equal to 0.
where Ce is the residual phosphorus concentration in the solution at adsorption equilibrium (mg/l), NAP is the original phosphorus content in the sediment of the Nanyi Lake sample point, and m is the parameter to indicate the efficiency of sediment adsorption of phosphate in water (L/kg).
2.3.5. Effect of HA and FA Concentrations on Phosphorus Release
A 25 mL phosphate solution with a concentration of 1 mg/L was prepared. After adjusting the pH, a 0.1 g sediment sample and HA and FA solutions with different concentrations were added to a constant volume of 50 mL. They were put in an oscillator (25 ± 0.5 °C) to vibrate and adsorb for 24 h (according to the adsorption kinetics test, the adsorption equilibrium is reached within 24 h). After the completion of reaction, they were centrifuged for 20 min under the condition of 4000 R/min. After removing the supernatant, the sediment samples were freeze-dried to collect the experimental soil samples, the content of total phosphorus was measured, and its rule of change was analyzed.
3. Results and Discussion
3.1. SEM and XRD Characterization
In Figure 2, the sediment samples without the involvement of adsorption after freeze-drying and grinding appear earthy yellow. The particle fineness varied among the sediment samples. L2 and L3 tended to form larger sediment particle clusters, while L1 soil was fine and dry, making it easier to disperse in water. It has been found that the particle size of sediment affects the adsorption and release of phosphorus, and there is an exponential relationship between the average particle size and the specific surface area of the sediment mineral matrix [5]. Fine sediment with a large specific surface area and pore volume possesses a relatively high phosphorus adsorption capacity. The SEM images showed that the sediment sample was thin particles that tended to facilitate phosphorus adsorption.
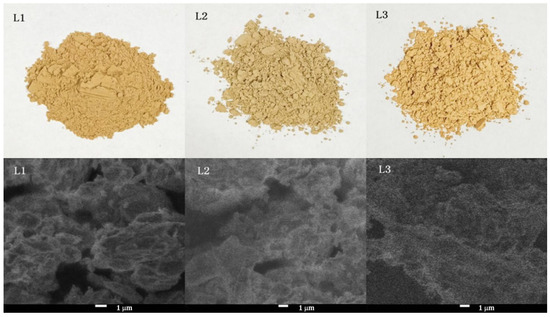
Figure 2.
Sample diagram and scanning electron microscope (SEM) image of sediment.
In order to further investigate the composition of the sediments, XRD characterization of the original sediment was carried out (Figure 3). The evident diffraction peaks at 2θ = 20.90° and 26.6° for the L1–L3 samples were attributed to quartz (SiO2). This indicated that the main component of the sediment samples in Nanyi Lake was SiO2. Especially for the L1 sample, peaks at 2θ = 43.20° and 60.75° corresponding to (Ca, Mg)3(PO4)2 were detected. Peaks at 2θ = 23°, 29.38°, 48.55°, and 57.22° were assigned to the existence of calcite (CaCO3), one of the main sites for phosphorus adsorption in the sediments. The XRD patterns were consistent with previous characterization data of sediments in rivers, lakes, and marine environments [14]. It was reported that potassium salt, quartz, magnesite (Mg6Al2(CO3)(OH)16)·4H2O, and clinopyrite (Na K Al Si3O8) were the main minerals in the sediment soil [15]. In addition, there might be substances present, such as CaPO4, MgPO4, MgHPO4, hydroxyapatite, Ca3Mg3(PO4)4, and CaHPO4. The Ca/Mg precipitation was confirmed to contribute to enhanced phosphorus adsorption [16]. As can be seen from the above analysis, the presence of Ca/Mg precipitation in L1 sediment seems to be conducive to phosphorus adsorption.
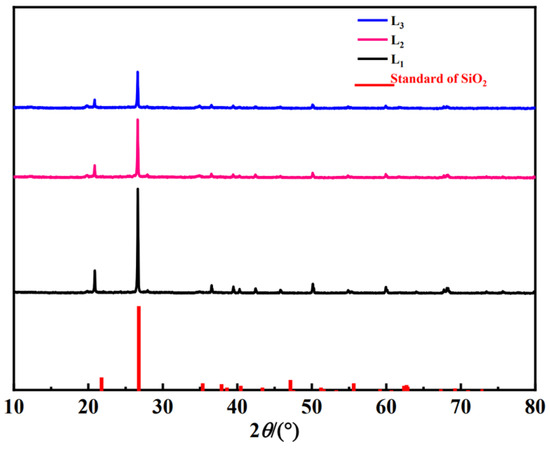
Figure 3.
XRD spectra of sediment samples before adsorption.
3.2. Kinetics Analysis of the Adsorption Process
Figure 4a shows that sediments’ adsorption of phosphorus in water follows a similar trend, with the adsorption capacity increasing with time and eventually reaching a plateau. However, as the adsorption equilibrium is approached, the phosphorus adsorption capacity differs among the different sediment samples. The adsorption process also varies for sediment samples from different lake areas [17]. The adsorption capacity of L1 and L2 points increases with more contact time between sediment particles and phosphorus within the first 300 min. After that period, adsorption reaches dynamic equilibrium, with maximum adsorption capacities of 372 mg/kg and 327 mg/kg, respectively. The phosphorus adsorption capacity of L1 varies from 0 to 372.0 mg/kg in the first 0–300 min, from 372.0 to 375.7 mg/kg between 300 min and 24 h, and from 375.7 to 379.5 mg/kg between 10 h and 24 h. The phosphorus adsorption capacity of L2 varies from 0 to 315.5 mg/kg in the first 0–300 min and from 315.5 to 327.4 mg/kg between 300 min and 24 h, indicating that the adsorption of phosphorus by sediments reaches equilibrium within the first 300 min. However, the adsorption process of L3 is relatively slow, with a maximum adsorption capacity of 334.7 mg/kg. The phosphorus adsorption capacity of L3 varies from 24.7 to 334.7 mg/kg within 0–10 h but shows no change within 10–24 h.
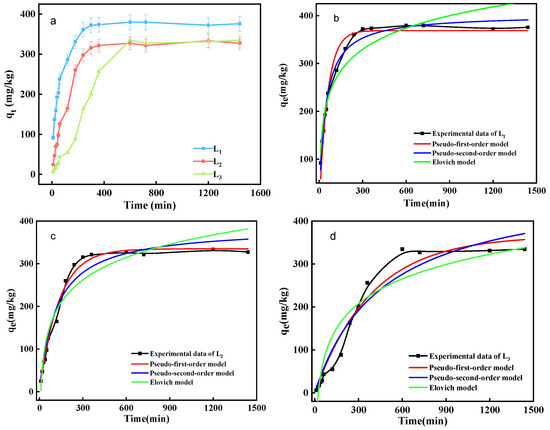
Figure 4.
(a) Kinetic curve of phosphorus adsorption in sediments; Fitting curve of phosphorus adsorption kinetics in different sediments of (b) L1, (c) L2 and (d) L3.
The adsorption rate of phosphorus on sediments gradually decreases over time [18]. The average adsorption rate during the fast adsorption stage is 34.7 mg/(kg·h). After 10 h, the adsorption rate drops to less than 3 mg/(kg·h), indicating a slow adsorption stage. For example, taking L1 as an example, the adsorption rate varies from 143.1 to 289.1 mg/(kg·h) in the first 0–2 h, 90.2 to 289.1 mg/(kg·h) in the first 0–4 h, and only 90.2 to 143.1 mg/(kg·h) between 2 and 4 h. To judge the main stage of adsorption takes not only the adsorption rate but also the proportion of the adsorption amount in that stage to the total amount at equilibrium [19]. In this study, the proportion of phosphorus adsorption capacity of sediment samples in the first 0–2 h to the total amount of equilibrium (24 h) ranges from 16.3% to 75.3%. The adsorption capacity in the first 10 h accounts for more than 80% of the total amount at equilibrium, which is consistent with the previous finding. The decrease in the phosphorus adsorption rate over time may be attributed to the occupation of active adsorption sites on sediment particles [6]. Based on this analysis, the adsorption of the phosphorus by Nanyi Lake sediments primarily occurs during the fast adsorption process in the first two hours, while the slow adsorption stage occurs after 10 h.
The pseudo-first-order kinetic model, pseudo-second-order kinetic model, and Elovich model were employed to fit the phosphorus adsorption kinetic data (Figure 4b–d). The results of the fitting are presented in Table 1. The L1 and L3 sediment samples are evenly dispersed in the aqueous solution, allowing full contact between sediment particle surfaces and exposure of surface adsorption sites in the liquid phase, resulting in a large mass transfer driving force between the two phases, and the L1 sample exhibits the highest adsorption capacity. For L1 and L3 sediment samples, R2 from PSO is the highest, and the fitted equilibrium adsorption capacity (qe) is close to the experimental value, so the pseudo-second-order kinetic model provides a better fit for the dynamic adsorption process of phosphorus on the surface sediments of L1 and L3 in Nanyi Lake [20]. These results indicate that the processes align with surface chemical reactions. On the other hand, the phosphorus adsorption kinetics of L2 align better with the pseudo-first-order kinetic model based on the highest R2 from PFO, suggesting that when sediment at this sample point adsorbs phosphorus, the surface adsorption sites are not fully exposed to the water, while only local sites participate in the adsorption reaction. Compared to K2, the larger value of K1 implies that the local sites are quickly occupied by adsorbates and reach adsorption equilibrium through physical adsorption in a short time. Subsequently, phosphate is fixed through chemical adsorption.

Table 1.
Parameters of the adsorption kinetics equation on sediments.
3.3. EPC0 and Isotherm Analysis of the Adsorption Process
EPC0 (equilibrium phosphorus concentration) represents the dissolved reactive phosphorus (DRP) concentration that does not enter the water or get adsorbed by sediments. In the low phosphorus concentration range, sediment’s adsorption of phosphorus typically follows a univariate quadratic linear equation [21]. In the current study’s conditions (0–1 mg/L), there is a strong linear correlation between phosphorus adsorption capacity and equilibrium phosphorus concentration (Equation (8)), with R2 values ranging from 0.94 to 0.99 (Table 2). Figure 5 illustrates that under low initial phosphorus concentrations, all three sample points’ sediments exhibit desorption behavior, gradually transitioning to the adsorption region as the phosphorus concentration increases [22]. The amount of phosphorus adsorbed by sediments at each point also increases with the initial phosphorus concentration. The EPC0 values for L1, L2, and L3 are 1.08 mg/L, 0.62 mg/L, and 3.82 mg/L, respectively (Table 2). As no Ca2+, Mg2+, and HCO3− were added in this experiment compared to the adsorption isotherm experiment, the sediments acted as a phosphorus source, releasing phosphorus into the overlying water. Compared with XRD patterns, sediments with higher silicon dioxide content show lower original adsorbed phosphorus (NAP) content and smaller equilibrium phosphorus concentration (EPC0). Environmental parameters like salinity and pH can influence the value of EPC0.
Table 2.
EPC0 point and NAP value of phosphorus adsorbed by sediments.
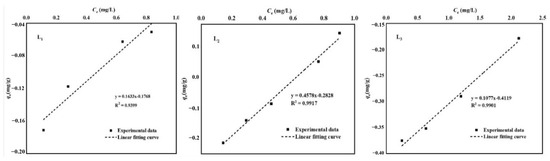
Figure 5.
Fitting curve between sediment EPC0 and NAP.
Under low initial phosphate concentration circumstances, the Langmuir and Freundlich models can be used for fitting (Figure 6a–c). The sediment’s ability to adsorb phosphate in water increases with the initial concentration. Temperature does not enhance the movement of phosphate from the overlying water to sediment, but promotes the release of original phosphorus sources from the sediment, indicating that phosphate adsorption by sediment is an exothermic process. In view of the fitting data, the Langmuir equation better describes phosphorus adsorption by sediments in Nanyi Lake. The average correlation coefficient (R2) for the Langmuir model fitting of L1 at different temperatures is above 0.90, while the R2 for the Freundlich model is approximately 0.88 (Table 3 and Table 4). Most of the phosphate adsorption data from L2 and L3 cannot be fitted by Langmuir and Freundlich models, possibly due to uneven sediment component distribution and high impurity content in the sediment under natural conditions, causing poor adsorption effects [23]. However, the Langmuir model is more consistent with the phosphorus adsorption process on Nanyi Lake sediments than the Freundlich model. Thus, it can be inferred that phosphorus adsorption is primarily monolayer adsorption [24]. The constant b value decreases with increasing temperature, indicating that temperature enhances the affinity of the sediment surface, which suggests a physical adsorption process during phosphate adsorption on the sediment. Using the Langmuir model, the sediments’ maximum theoretical adsorption capacity (qmax) was calculated, ranging from 194.03 mg/kg to 699.63 mg/kg. These sediments exhibit a higher qmax value than other freshwater lakes, indicating a strong phosphorus adsorption capacity. Among the different sample points, L2 has the highest qmax and L3 the lowest, and the adsorption constant (RL) ranges between 0.16 and 0.97 L/mg, with values between 0 and 1, which indicates that the Langmuir isotherm is favorable [25]. The analysis indicates that the phosphorus adsorption capacity of the sediments in the northeast region of Nanyi Lake is higher than in other areas of the lake.
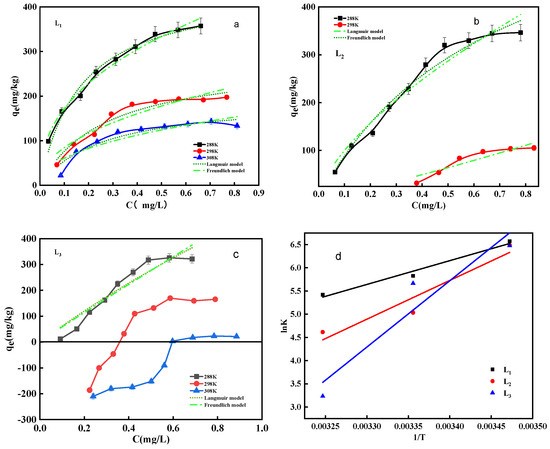
Figure 6.
Fitting curve of phosphorus adsorption process in different sediments of (a) L1, (b) L2, (c) L3; (d) The plot of lnK versus 1/T for estimating thermodynamic parameters.
Table 3.
Langmuir isotherm parameters of phosphate adsorption in sediments of Nanyi Lake.
Table 4.
Freundlich isotherm parameters of phosphate adsorption in sediments of Nanyi Lake.
The thermodynamic parameters of the adsorption process, such as ΔG, ΔS, and ΔH, were studied by analyzing phosphate adsorption in Nanyi Lake sediments at different temperatures [26]. Ka was analyzed using the lnKc vs. qe plot method described by Khan, Singh, and Li et al. The adsorption isotherm data were plotted as lnKc vs. qe (Figure 6d) and extrapolated to QE = 0 to calculate ΔG. Linear regression was performed using lnK and 1/T to analyze ΔS and ΔH (Table 5). The table shows that ΔG ranges from −9.04 to −15.62 kJ/mol, indicating that the adsorption of phosphate by sediments is a spontaneous process. With increasing temperature, the negative value of ΔG decreases, indicating that the adsorption reaction is spontaneous but less thermodynamically favorable at higher temperatures. The ΔH values range from −42.63 to −118.86 kJ/mol, further indicating that phosphate adsorption by sediments is an exothermic process. The negative ΔS suggests that the phosphorus exchange at the sediment–water interface is an entropy reduction reaction [23].
Table 5.
Thermodynamic parameters of phosphorus adsorption in sediments of Nan Yi Lake.
3.4. Effect of Disturbance Intensity on Phosphorus Migration in Sediments
Disturbances in the aquatic environment, such as waves and currents, can significantly impact sediment characteristics and influence phosphorus adsorption. Disturbance can lead to changes in the physical and chemical properties of the water column, including the oxygen diffusion rate, sediment suspension, and water turbidity, and indirectly contribute to eutrophication [27]. In riverbanks or large shallow lakes, hydrodynamic conditions are often controlled by waves and currents, which intensify bottom environment disturbance, resuspend sediments, and promote the release of endogenous phosphorus [28].
This study investigated the interaction between sediment and phosphate under low-intensity disturbance (75 r/min) and high-intensity disturbance (150 r/min). Figure 7 shows that when the phosphorus concentration in the overlying water is lower than 1 mg/L, the disturbance intensity has no significant effect on the release of phosphorus from the sediment. Conversely, increasing the disturbance intensity enhances the adsorption of low-concentration phosphate by the sediment. This effect can be attributed to the resuspension of particles on the sediment surface due to increased water disturbance intensity. As a result, some adsorption sites on the sediment particle surface, previously unoccupied by phosphate, become exposed to the water again, promoting a higher mass transfer driving force between the solid and liquid phases, and the disturbance of water induces the relative movement of molecules, further facilitating phosphate fixation [29]. Additionally, overlying water contains calcium and magnesium ions, which can form calcium-phosphate (Ca-P) and magnesium-phosphate (Mg-P) compounds that settle on the sediment surface, creating the illusion of phosphate adsorption [30]. When the phosphorus concentration in the overlying water exceeds 1 mg/L, increasing the disturbance intensity promotes phosphorus release from the sediments, resulting in higher phosphorus concentrations in the water than the initial concentration. Previous studies [31] have shown that increasing disturbance intensity promotes sediment suspension and accelerates phosphate adsorption by sediments. However, in this experiment, the opposite effect of phosphorus release from sediments is observed. This discrepancy may be attributed to the prolonged contact of sediments and high-concentration phosphate under closed conditions, with low dissolved oxygen content in the water, creating strong reducing conditions at the sediment–water interface. As a result, a significant amount of hydrogen sulfide (H2S) is produced, which reacts with Fe(II) through chemical precipitation, breaking the Fe-P chemical bond and releasing phosphate into the overlying water [32].
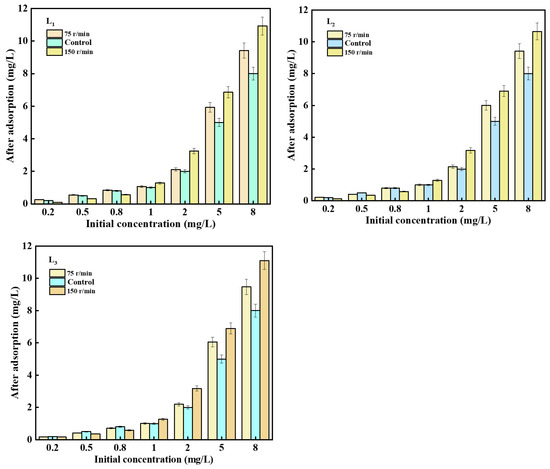
Figure 7.
The influence of different disturbance intensities on phosphorus concentration in sediments.
3.5. Effects of HA and FA Concentrations on Phosphorus Migration in Sediments
Humus primarily comprises fulvic acid (FA), humic acid (HA), and humin. Fulvic acid and humic acid structures contain numerous phenolic hydroxyl, carbonyl, and other functional groups that influence the chemical behavior of the aquatic environment [33]. This experiment adds FA and HA to the simulated phosphorus release reaction system to increase the organic matter content. Different concentrations of FA and HA solutions are added to the overlying water to control the amount of organic matter added, as depicted in Figure 8. With increasing FA and HA contents, the total phosphorus (TP) contents in sediments exhibit varying degrees of increase, indicating that the increase in FA and HA in overlying water promotes phosphorus adsorption by sediments. In other words, sediment organic matter represented by FA and HA is conducive to retaining phosphorus in the bound form within sediments due to the chelation of metal oxides by sediment organic matter during the formation process, which enhances phosphorus adsorption in sediments. In addition, the increase in phosphorus content in sediments varies at different concentrations of humus [34]. In Figure 8 (left), with increasing FA concentration (0–75 mg/L), the increments of TP for L1, L2, and L3 sediments are 492.5, 255.1, and 360.6 mg/kg, respectively. In Figure 8 (right), with increasing HA concentration (0–75 mg/L), the increments of TP for L1, L2, and L3 are 448.5, 386.9, and 536.5 mg/kg, respectively. Comparatively, adding HA leads to a greater increase of TP content in sediments compared with FA. The variation in adsorption amounts may be attributed to the different types of organic matter and their phosphorus adsorption capacities.
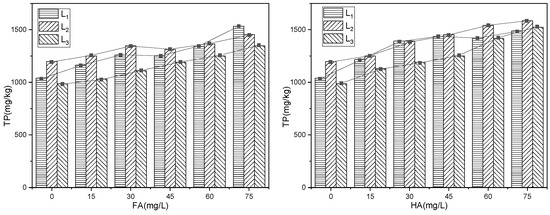
Figure 8.
The influence of humus on phosphorus concentration in sediments.
4. Conclusions
XRD characterization analyses reveal that calcium and magnesium ions in the overlying water combine with phosphate to form calcium/magnesium–phosphorus bonds that precipitate on the sediment surface. This fixation of phosphate in the overlying water reduces the phosphorus concentration in the water, which aligns with the adsorption process of sediment at low concentrations observed in this experiment.
The adsorption kinetic and isotherm fitting provides insights into the adsorption process, revealing that the initial rapid adsorption stage is attributed to the abundance of adsorption sites on sediment particle surfaces and the strong mass transfer driving force between solid and liquid phases. Moreover, an increase in temperature is not favorable for adsorption. The EPC0 and NAP exploration in this experiment shed light on the influence of calcium and magnesium ions on the adsorption and release of phosphorus from sediments. High phosphorus concentration in the overlying water leads to phosphorus release from sediments into the water, and low phosphorus concentration leads to adsorption. The data on water disturbance intensity reveal that, under low dissolved oxygen content conditions, the presence of low phosphorus concentration favors the reaction of calcium and magnesium ions with phosphorus, leading to phosphorus adsorption in sediments. In contrast, under conditions of high phosphorus concentration, sediments break the Fe-P bond to release phosphorus into the water, which becomes the dominant process, leading to increased phosphorus content in the water. The experimental analysis of the effect of humic acid (HA) demonstrates that adding a certain concentration of HA to overlying water enhances the phosphorus adsorption capacity of sediments. Compared to fulvic acid (FA), the presence of HA in sediments causes a more obvious increase in TP.
Author Contributions
Software, X.L.; Writing—original draft, Q.Z.; Writing—review & editing, Y.Y.; Project administration, F.X. All authors have read and agreed to the published version of the manuscript.
Funding
This work was supported by the National Natural Science Foundation of China (No. 42277075) and the National Key Research and Development Program of China (2021YFC3201005).
Data Availability Statement
The original contributions presented in this study are included in the article. Further inquiries can be directed to the corresponding author.
Conflicts of Interest
Qiang Zhang was employed by Anhui Environmental Science and Technology Group Co., Ltd. The remaining authors declare that the research was conducted in the absence of any commercial or financial relationships that could be construed as a potential conflict of interest.
References
- Abrams, M.M.; Jarrell, W.M. Soil phosphorus as a potential nonpoint source for elevated stream phosphorus levels. J. Environ. Qual. 1995, 24, 132–138. [Google Scholar] [CrossRef]
- Li, X.; Huang, L.; Fang, H.; Chen, M.; Cui, Z.; Sun, Z.; Reible, D. Phosphorus adsorption by sediment considering mineral composition and environmental factors. Environ. Sci. Pollut. Res. 2021, 28, 17495–17505. [Google Scholar] [CrossRef] [PubMed]
- Wang, J.; Huang, T.; Wu, Q.; Bu, C.; Yin, X. Sources and Cycling of Phosphorus in the Sediment of Rivers along a Eutrophic Lake in China Indicated by Phosphate Oxygen Isotopes. ACS Earth Space Chem. 2021, 5, 88–94. [Google Scholar] [CrossRef]
- Mahowald, N.; Jickells, T.D.; Baker, A.R.; Artaxo, P.; Benitez-Nelson, C.R.; Bergametti, G.; Bond, T.C.; Chen, Y.; Cohen, D.D.; Herut, B.; et al. Global distribution of atmospheric phosphorus sources, concentrations and deposition rates, and anthropogenic impacts. Glob. Biogeochem. Cycles 2008, 22, GB4026. [Google Scholar] [CrossRef]
- Wang, Y.; Shen, Z.; Niu, J.; Liu, R. Adsorption of phosphorus on sediments from the Three-Gorges Reservoir (China) and the relation with sediment compositions. J. Hazard. Mater. 2009, 162, 92–98. [Google Scholar] [CrossRef]
- Jin, X.; Wang, S.; Pang, Y.; Zhao, H.; Zhou, X. The adsorption of phosphate on different trophic lake sediments. Colloid Surf. A 2005, 254, 241–248. [Google Scholar] [CrossRef]
- Que, S.; Luo, H.; Wang, L.; Zhou, W.; Yuan, S. Canonical correlation study on the relationship between shipping development and water environment of the Yangtze River. Sustainability 2020, 12, 3279. [Google Scholar] [CrossRef]
- GB 11893-89; Water Quality—Determination of Total Phosphorus—Ammonium Molybdate Spectrophotometric Method. National Environmental Protection Agency: Beijing, China, 1990.
- Alonso, V.A.; Kaiser, T.; Babist, R.; Fundneider, T.; Lackner, S. A multi-component model for granular activated carbon filters combining biofilm and adsorption kinetics. Water Res. 2021, 197, 117079. [Google Scholar] [CrossRef]
- Hu, M.; Liu, L.; Hou, N.; Li, X.; Zeng, D.; Tan, H. Insight into the adsorption mechanisms of ionizable imidazolinone herbicides in sediments: Kinetics, adsorption model, and influencing factors. Chemosphere 2021, 274, 129655. [Google Scholar] [CrossRef]
- Liu, D.; Zou, Z.; Cai, Y.; Qiu, Y.; Zhou, Y.; He, S. An updated study on CH4 isothermal and isosteric adsorption heat behaviors of variable rank coals. J. Nat. Gas Sci. Eng. 2021, 89, 103899. [Google Scholar] [CrossRef]
- Touihri, M.; Guesmi, F.; Hannachi, C.; Hamrouni, B.; Sellaoui, L.; Badawi, M.; Poch, J.; Fiol, N. Single and simultaneous adsorption of Cr (VI) and Cu (II) on a novel Fe3O4/pine cones gel beads nanocomposite: Experiments, characterization and isotherms modeling. Chem. Eng. J. 2021, 416, 129101. [Google Scholar] [CrossRef]
- Hoffman, A.R.; Armstrong, D.E.; Lathrop, R.C.; Penn, M.R. Characteristics and influence of phosphorus accumulated in the bed sediments of a stream located in an agricultural watershed. Aquat. Geochem. 2009, 15, 371–389. [Google Scholar] [CrossRef]
- Gusakova, A.I. Mineral composition of the modern bottom sediments of the White Sea. Oceanology 2013, 53, 223–232. [Google Scholar] [CrossRef]
- Kim, S.-R.; Chun, J.-H.; Um, I.-K.; Cukur, D. Distribution and characteristics of sandy sediments along the Northeastern continental shelf of Korea in the East Sea. J. Coast. Res. 2020, 95, 532–536. [Google Scholar] [CrossRef]
- Tang, X.; Wu, M.; Dai, X.; Chai, P. Phosphorus storage dynamics and adsorption characteristics for sediment from a drinking water source reservoir and its relation with sediment compositions. Ecol. Eng. 2014, 64, 276–284. [Google Scholar] [CrossRef]
- Martins, G.; Peixoto, L.; Brito, A.G.; Nogueira, R. Phosphorus–iron interaction in sediments: Can an electrode minimize phosphorus release from sediments? Rev. Environ. Sci. Bio-Technol. 2014, 13, 265–275. [Google Scholar] [CrossRef]
- Zhang, L.; Du, Y.; Du, C.; Xu, M.; Loáiciga, H.A. The adsorption/desorption of phosphorus in freshwater sediments from buffer zones: The effects of sediment concentration and pH. Environ. Monit. Assess. 2016, 188, 13. [Google Scholar] [CrossRef]
- Yu, L. New insights into pseudo-second-order kinetic equation for adsorption. Colloid Surf. A 2008, 320, 275–278. [Google Scholar]
- Xiao, Y.; Yuan, S.; Tang, H. Distribution of phosphorus in bed sediment at confluences responding to hydrodynamics. Proc. Inst. Civ. Eng. 2019, 172, 149–162. [Google Scholar] [CrossRef]
- Pan, G.; Krom, M.D.; Herut, B. Adsorption-desorption of phosphate on airborne dust and riverborne particulates in East Mediterranean seawater. Environ. Sci. Technol. 2002, 36, 3519–3524. [Google Scholar] [CrossRef]
- Lucci, G.M.; McDowell, R.W.; Condron, L.M. Evaluation of base solutions to determine equilibrium phosphours concentrations [EPC0] in stream sediments. Int. Agrophys. 2010, 24, 157–163. [Google Scholar]
- Li, W.; Pan, G.; Zhang, M.; Zhao, D.; Yang, Y.; Chen, H.; He, G. EXAFS studies on adsorption irreversibility of Zn (II) on TiO2: Temperature dependence. J. Colloid Interfaces Sci. 2008, 319, 385–391. [Google Scholar] [CrossRef] [PubMed]
- Hu, F.P.; Wang, M.; Peng, X.M.; Qiu, F.X.; Zhang, T.; Dai, H.L.; Liu, Z.M.; Cao, Z. High-efficient adsorption of phosphates from water by hierarchical CuAl/biomass carbon fiber layered double hydroxide. Colloid Surf. A 2018, 555, 314–323. [Google Scholar] [CrossRef]
- Sun, C.J.; Sun, L.Z.; Sun, X.X. Graphical evaluation of the favorability of adsorption processes by using conditional Langmuir constant. Ind. Eng. Chem. Res. 2013, 52, 14251–14260. [Google Scholar] [CrossRef]
- Khan, A.A.; Singh, R.P. Adsorption thermodynamics of carbofuran on Sn (IV) arsenosilicate in H+, Na+ and Ca2+ forms. Colloid Surf. A 1987, 24, 33–42. [Google Scholar] [CrossRef]
- Qin, P.; Lu, S.; Guo, X.; Liu, X.; Bi, B.; Xue, W.; Wu, D. Effect of natural zeolite capping on phosphorus release from sediments. Desalin. Water Treat. 2019, 165, 97–102. [Google Scholar] [CrossRef]
- Almroth, E.; Tengberg, A.; Andersson, J.H.; Pakhomova, S.; Hall, P.O. Effects of resuspension on benthic fluxes of oxygen, nutrients, dissolved inorganic carbon, iron and manganese in the Gulf of Finland, Baltic Sea. Cont. Shelf Res. 2009, 29, 807–818. [Google Scholar] [CrossRef]
- Palomo, L.; Clavero, V.; Izquierdo, J.J.; Avilés, A.; Becerra, J.; Niell, F.X. Influence of macrophytes on sediment phosphorus accumulation in a eutrophic estuary (Palmones River, Southern Spain). Aquat. Bot. 2004, 80, 103–113. [Google Scholar] [CrossRef]
- Fu, Z.; Hong, Z.; Wei, J.; Liao, Y.; You, S.; Wang, Y.; Lv, J.; Feng, H.; Kolenčík, M.; Chang, X.; et al. Phosphorus fractionation and adsorption characteristics in drinking water reservoir inlet river sediments under human disturbance. J. Soil Sediments 2022, 22, 2530–2547. [Google Scholar] [CrossRef]
- Barlow, K.; Nash, D.; Grayson, R. Investigating phosphorus interactions with bed sediments in a fluvial environment using a recirculating flume and intact soil cores. Water Res. 2004, 38, 3420–3430. [Google Scholar] [CrossRef]
- Zhu, J.; He, Y.; Wang, J.; Qiao, Z.; Wang, Y.; Li, Z.; Huang, M. Impact of aeration disturbances on endogenous phosphorus fractions and their algae growth potential from malodorous river sediment. Environ. Sci. Pollut. Res. 2017, 24, 8062–8070. [Google Scholar] [CrossRef] [PubMed]
- Islam, A.; Morton, D.W.; Johnson, B.B.; Angove, M.J. Adsorption of humic and fulvic acids onto a range of adsorbents in aqueous systems, and their effect on the adsorption of other species: A review. Sep. Purif. Technol. 2020, 247, 116949. [Google Scholar] [CrossRef]
- Abate, G.; Masini, J.C. Influence of pH and ionic strength on removal processes of a sedimentary humic acid in a suspension of vermiculite. Colloid Surf. A 2003, 226, 25–34. [Google Scholar] [CrossRef]
Disclaimer/Publisher’s Note: The statements, opinions and data contained in all publications are solely those of the individual author(s) and contributor(s) and not of MDPI and/or the editor(s). MDPI and/or the editor(s) disclaim responsibility for any injury to people or property resulting from any ideas, methods, instructions or products referred to in the content. |
© 2025 by the authors. Licensee MDPI, Basel, Switzerland. This article is an open access article distributed under the terms and conditions of the Creative Commons Attribution (CC BY) license (https://creativecommons.org/licenses/by/4.0/).