Article

Bed Load Transport in Channels with Vegetated Banks

1
School of Civil Engineering, Iran University of Science and Technology, Tehran 16846-13114, Iran
2
School of Engineering, University of Northern British Columbia, Prince George, BC V2N 4Z9, Canada
*
Authors to whom correspondence should be addressed.
Water 2025, 17(12), 1758; https://doi.org/10.3390/w17121758
Submission received: 17 April 2025 / Revised: 30 May 2025 / Accepted: 5 June 2025 / Published: 12 June 2025
(This article belongs to the Special Issue Flow Dynamics and Sediment Transport in Rivers and Coasts)

Abstract

:
Estimating bed load in rivers is a critical aspect of river engineering. Numerous methods have been developed to quantify bed load transport, often yielding varying results depending on the bed surface texture and grain size. This study aims to investigate how vegetation on channel banks and bed material particle size influence bed load transport, bed shear stress, velocity distribution, and the Shields parameter. It also examines the impact of geometric changes in the channel cross-section on bed load transport capacity. To address these objectives, a novel simulation method was developed to analyze the effects of vegetated banks, bed material size, and channel geometry. Field investigations were carried out in two reaches of the Taleghan River in Iran—one with vegetated banks and one without. Complementary flume experiments were conducted at two scales, incorporating vegetation on the sidewalls. Results showed that Shields parameter distribution corresponded with bed load distribution across cross-sections. Increase in flow rate and the Shields parameter led to higher bedload transport rates. Near vegetated banks, flow velocity, shear stress, and bedload transport were significantly reduced, with velocity profiles showing distinct variations compared to non-vegetated sections.

1. Introduction

Sediment load is a critical factor affecting both the hydraulic performance and morphological evolution of rivers. In practical applications, sediment transport capacity plays a central role in river restoration and water resource management projects. However, estimating sediment transport in vegetated channels is complex due to the heterogeneous nature of river systems, which involves variables such as bed material grain size, channel slope, vegetation characteristics, and hydraulic conditions. The complexity stems from the interplay among vegetation on channel banks, variations in sediment particle size, and morphological changes within the channel. River dynamics (driven by seasonal variations, storm events, and human activities) further complicates research in this field. Recent studies by Iqbal and Tanaka [1,2] have investigated the hydraulic impacts of various dike configurations, including submerged piles and hybrid dike systems. Their findings demonstrate how engineered flow obstructions can alter local turbulence, redirect flow, and affect sediment dynamics—concepts that can also inform our understanding of how natural features such as bank vegetation influence sediment transport. Accurate prediction of bed load transport demands a comprehensive understanding of these interrelated factors. Developing a reliable method for estimating sediment transport capacity in channels with vegetated banks requires extensive field measurements under a wide range of conditions. This effort involves sophisticated instrumentation and methodologies that account for climate, vegetation species, and hydraulic and environmental parameters. Moreover, evaluating the accuracy of existing bed load transport formulas calls for controlled laboratory experiments using natural vegetation [3]. Therefore, understanding the influence of bank vegetation on mean flow velocity, shear velocity, sediment transport rates, and the Shields parameter is essential. Achieving identical conditions for vegetation, flow, and sediment characteristics in both natural rivers and laboratory settings is highly challenging. Nevertheless, researchers have investigated the extent to which field observations and laboratory experiments can be aligned, despite differences in flow depth, sediment properties, and vegetation types. The following section provides a concise summary of key findings from both field and laboratory studies in this domain.
Despite extensive investigations, the role of vegetation in sediment transport remains a topic of ongoing debate due to contradictory findings and experimental limitations [4,5]. Foundational studies by Nikora (2010) and Nepf (2012) significantly advanced the understanding of hydrodynamics and sediment transport in vegetated channels, emphasizing how vegetation influences turbulence structure, velocity distribution, and sediment mobility [5,6]. Vegetation typically reduces flow velocity, which promotes sediment deposition; however, it can also increase turbulence, potentially enhancing sediment mobilization [7,8]. For example, Baptist (2003) and Tang et al. (2013) found that flexible submerged vegetation reduces shear stress and the velocity required to initiate sediment motion, respectively, while Shahmohammadi et al. (2018) observed that increased turbulence intensity enhances sediment mobility [9,10,11]. These findings suggest that the effects of vegetation on sediment transport are highly dependent on plant type, density, and flow conditions. Furthermore, vegetation tends to reduce shear stress, encouraging sediment accumulation and limiting the movement of coarse particles [12]. However, the effectiveness of this mechanism depends on vegetation density and structure. Wang et al. (2015) demonstrated that submerged flexible vegetation reduced the threshold velocity for sediment movement, particularly under low-density conditions [13]. In contrast, higher vegetation densities resulted in flow blockage and the formation of complex turbulence structures. The effects of vegetation on sediment transport vary depending on whether it is submerged or emergent. In particular, vegetation located on channel banks alters velocity profiles by inducing secondary currents that shift the location of maximum velocity from the water surface to near the channel bed. Tabesh et al. (2023a) also highlighted that in zones with emergent vegetation, velocity maxima shifted toward the bed, and Reynolds stress was redistributed closer to the channel bottom [14]. These findings indicate that vegetation alters not only the mean flow but also the turbulence structures, both of which are critical to sediment mobilization [14]. Interestingly, the impact of vegetation on sediment motion becomes negligible when the ratio of the width of the non-vegetated flow area to the height of the vegetated banks exceeds six [15].
The influence of vegetated banks on flow velocity and sediment transport plays a vital role in river restoration projects. Establishing a consistent relationship between field observations and laboratory experiments remains a significant challenge due to scale effects, hydrodynamic complexity, and vegetative structure variability. as differences in scale between natural rivers and laboratory flumes significantly affect the interaction between vegetation and sediment dynamics. Vegetation within a channel increases flow resistance, reduces flow velocity, and, as a result, can elevate flood risk [16,17].
The present study addresses this issue by conducting synchronized measurements of velocity and bedload transport in both natural river reaches and a laboratory flume. The primary objective is to assess the influence of bank vegetation on velocity structure, bed shear stress, Shields parameter distribution, and sediment transport rates. Special emphasis is placed on identifying the similarities and limitations between field and laboratory results, thereby contributing to a more comprehensive understanding of vegetation–flow–sediment interactions. Furthermore, the study examines potential changes in velocity distribution, bed shear stress, and variations in the Shields parameter resulting from the presence of vegetation. Furthermore, although the effects of vegetation on flow structure have been well documented, a significant research gap remains in quantifying how submerged vegetation along channel banks influences bedload transport across varying flow rates and sediment sizes. Existing sediment transport models typically rely on time-averaged shear stress and often neglect the role of vegetation-induced turbulence. Moreover, there is limited integration between field observations and laboratory experiments employing consistent instrumentation. To address these limitations, the present study conducts a comparative analysis of vegetated and non-vegetated channels, evaluating bedload transport, shear stress distribution, velocity profiles, and variations in the Shields parameter using both field data and controlled flume experiments.
The objectives of the present research are (1) to investigate the influence of bed material particle size and flow rate on bedload transport in the presence of submerged vegetation along channel banks; (2) to compare these findings with results from channels lacking vegetation; and (3) to evaluate the extent to which laboratory results can be reliably generalized to field conditions. These objectives aim to address the existing gap in understanding how vegetation, grain size, and channel geometry interact to influence sediment transport.

Field Studies

To date, several acceptable approaches have been developed for estimating bed load transport rates [3,18,19]. Early methods were based on time-averaged bed shear stress, which served as the foundation for estimating transport rates. More recently, approaches incorporating the correlation between turbulent kinetic energy (TKE) and bed load transport rate have emerged. For instance, Dodangheh et al. (2022) investigated the incipient motion of sediment particles under accelerating and decelerating flow conditions in the presence of bed forms, using river data [20]. Their findings indicated that critical bed shear stress increases at the entrance of bed forms—where the bed slope is positive and flow decelerates (e.g., at pool entrances)—and decreases toward the pool exit, where flow accelerates. In the presence of bed forms, velocity profiles near the bed showed greater variation in accelerating flows compared to decelerating flows. Additionally, sudden narrowing of the river channel caused the maximum flow velocity to occur significantly below the water surface. Laboratory studies further revealed that, under decelerating flow, the average threshold velocity decreased with increasing flow depth, whereas the opposite trend was observed in accelerating flow. These findings suggest that the traditional Shields diagram may not be appropriate for non-uniform flow conditions, such as accelerating and decelerating flows. Specifically, sediment motion has been observed even when the critical Shields parameter falls below the threshold defined by the diagram. Thus, in environments where pressure gradients and flow non-uniformity are significant (such as in the presence of bed forms) the Shields diagram may not serve as a reliable criterion for determining sediment incipient motion.
Emmett (1979) emphasized that identifying the location of maximum bed load transport or the specific portion of a cross-section responsible for most of the sediment passage does not justify excluding other areas from bed material sampling. This is because channel cross-section conditions can vary over time due to changes in flow rate and sediment input from upstream [21]. While maximum bed load transport in straight river channels typically occurs near the central axis, in meandering rivers, it often shifts toward the outer bank [22]. Ghani et al. (2002) evaluated sampling techniques in two rivers with channel widths of 14 and 15 m [23]. In one case, bed load samples were collected at one-meter intervals across the cross-section, while in the other, sampling was performed at two-meter intervals. Although the larger interval resulted in approximately 50% greater error, the difference between datasets from the two sampling intervals was not statistically significant when repeated measurements were taken at each point. These findings suggest that reducing the spacing between sampling points is not necessarily required for accurately estimating bed load transport across a channel cross-section.
Clayton and Pitlik (2007) observed that, as flow rate increases, the proportion of the cross-sectional area contributing to bed load transport also expands [18]. Additionally, higher flow rates can shift the location of maximum bed load transport within the channel. Frings et al. (2008) highlighted a key distinction between gravel-bed and sand-bed rivers: in gravel-bed systems, bed load transport is confined to specific zones within the channel, whereas in sand-bed rivers, sediment transport tends to occur more uniformly across the entire cross-section [19].

2. Materials and Methods

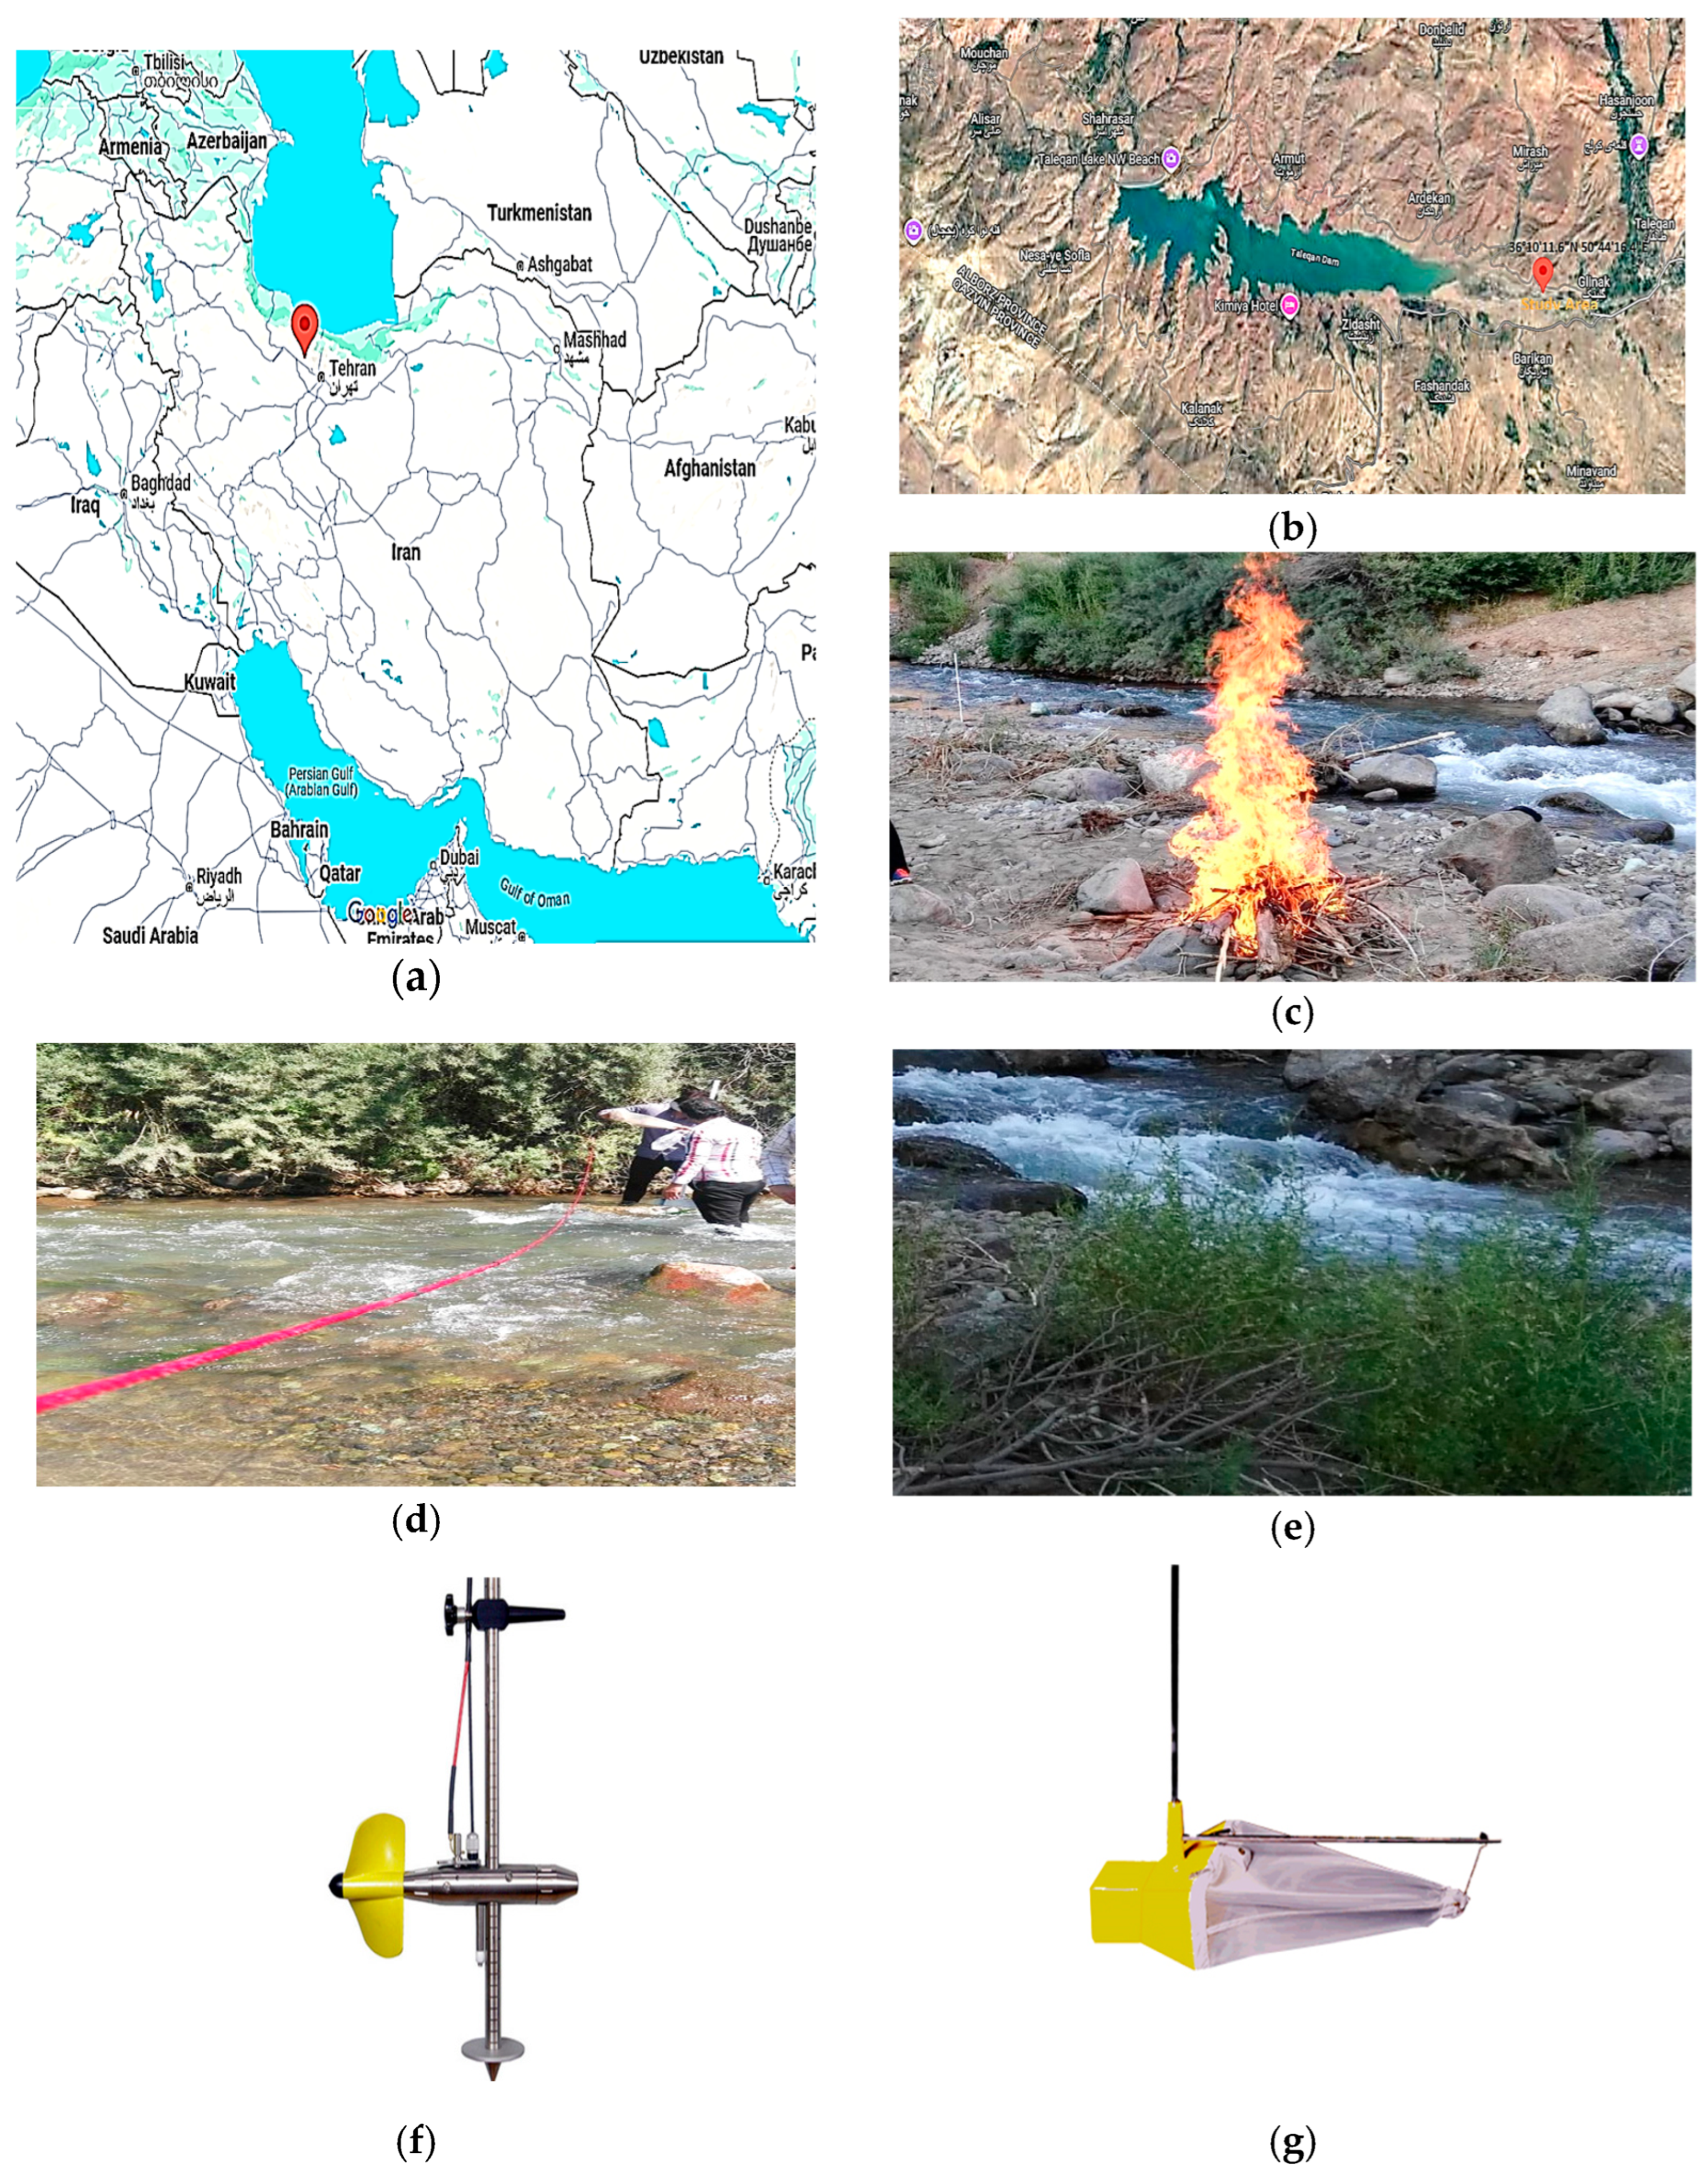
2.1. Field Data Collection

2.1.1. Site Selection

Data for this research were collected from the Taleghan River, located in Alborz Province, Iran, as illustrated in Figure 1. The river originates from the southern slopes of the Alborz Mountains, flows westward, and eventually joins the Shahroud River before merging with the Sepidroud River. The Taleghan River is approximately 175 km long and forms part of the Khazar Sea watershed. The watershed spans from 36°00′30″ N to 36°15′30″ N latitude and from 50°30′ E to 51°15′12″ E longitude. Following preliminary surveys along the river, two study reaches were selected: a 25 m-long reach with vegetation on one bank (Gouran reach) and a 30 m-long reach without vegetation (Pol Vashte reach). Both reaches are straight and characterized by bare riverbeds. Their locations are shown in Figure 1. The Gouran reach includes naturally occurring woody, tree-like shrubs along the channel bank, featuring sturdy branches that extend above the water surface. In contrast, no vegetation was observed along the Pol Vashte reach. The specifications of these two study sites are summarized in Table 1. In this table, d50 denotes the median grain size of both the riverbed and the bed load samples, h is the hydraulic depth, A represents the cross-sectional area, T is the channel’s top width, d50/h indicates relative roughness, and T/h denotes the aspect ratio. The instruments used during the field and laboratory experiments are shown in Figure 1.

2.1.2. Flow Measurements

To enable a meaningful comparison between field measurements and laboratory experiments, considerable effort was devoted to selecting river reaches with flow conditions such as flow depth and bed slope that closely matched those of the laboratory flume, despite the inherent challenges. Field measurements were carried out from early July 2018 to the end of May 2019. A propeller-type mechanical current meter with a 50 mm diameter was used to measure flow velocity at three cross-sections (CS) along the selected reaches of the Taleghan River. At each point in the vertical profile, velocity measurements were repeated three times, with each reading lasting 60 s. To capture detailed flow characteristics near the channel bed, more measurement points were collected in the lower 20% of the flow depth. In this near-bed region, the vertical spacing between points was 0.5 cm, gradually increasing to 1.0–1.5 cm toward the water surface. In total, six cross-sections were studied across the two selected reaches. At each cross-section within the Pol Vashte reach, five velocity profiles were obtained, while three profiles were collected at each cross-section within the Gouran reach. In total, 24 velocity profiles were acquired across the Taleghan River study area, with 12- to 18-point velocities recorded per profile. These profiles were systematically arranged at evenly spaced intervals across the channel width to ensure comprehensive hydraulic characterization, with particular focus on the vegetated, central, and non-vegetated zones of each cross-section.
Bed load samples were collected using a Helley-Smith sampler, which consists of a nozzle, a sample bag, and a metal handle. The entrance of the sampler is square-shaped, with dimensions of 7.62 cm × 7.62 cm, and the overall length of the device is 46 cm. The sample bag, made of polyester, contains small openings with a diameter of 0.25 mm, allowing the collection of particles larger than 38 mm at flow velocities up to 3 m/s. The Helley-Smith sampler is most effective for collecting bedload particles [24].
While the Helley-Smith sampler is a widely accepted tool for coarse bedload sampling, it has notable limitations. Under high-flow conditions or when sampling fine sediment particles, the sampler may underestimate transport due to its mesh size and design. Additionally, flow separation around the sampler nozzle can reduce sampling efficiency, particularly at velocities exceeding 2–3 m/s or when sediments contain a high fraction of silt and sand. Limitations in our field methodology also include reduced accuracy of velocity measurements near dense vegetation when using mechanical current meters, as well as potential under sampling of fine sediment fractions by the Helley-Smith sampler, especially during high-flow events. In this study, bed load samples were collected at the same locations as the velocity measurements. Following the completion of all sampling activities, a sieve analysis was conducted in the laboratory to determine the grain size distribution. The resulting grain size distribution curves were used to characterize the bedload particles. Additional details have been provided to clarify the velocity and sediment sampling methodologies. Vertical velocity profiles were obtained using a propeller-type current meter, with increased resolution near the bed. Bedload samples were collected at corresponding locations using a Helley-Smith sampler. While this study focused on emergent bank vegetation, we acknowledge the challenges inherent in field measurements within vegetated rivers, as highlighted by Bunte et al. (2019) [24].
To determine the characteristics of the particles composing the riverbed, it is necessary to granulate these particles. In channel beds with coarse-grained sediments, one of the most effective methods for determining median grain size is the Volman method. This method involves randomly collecting approximately 100 particles from an area of 0.5 m × 0.5 m (0.25 m2) in the riverbed. The length, width, and thickness of each particle are measured using calipers, and the median of these measurements is calculated to represent the particle’s median diameter. In this study, bed material samples were collected from the entrance, middle, and exit cross-sections along each river reach. Granulation curves for the bed material were then generated. From these curves, the particle sizes corresponding to d84, d60, d50, d30, and d16 were extracted, which represent the sizes at which 84%, 60%, 50%, 30%, and 16% of the particles are finer, respectively. Figure 2 displays the granulation curves for the riverbed particles in the Pol-Vashteh reach, alongside the granulation curve for sediment particles used in the laboratory flume. In this figure, the curve on the right represents the particles making up the riverbed, while the left curve corresponds to the bed load particles from the Pol-Vashteh reach.

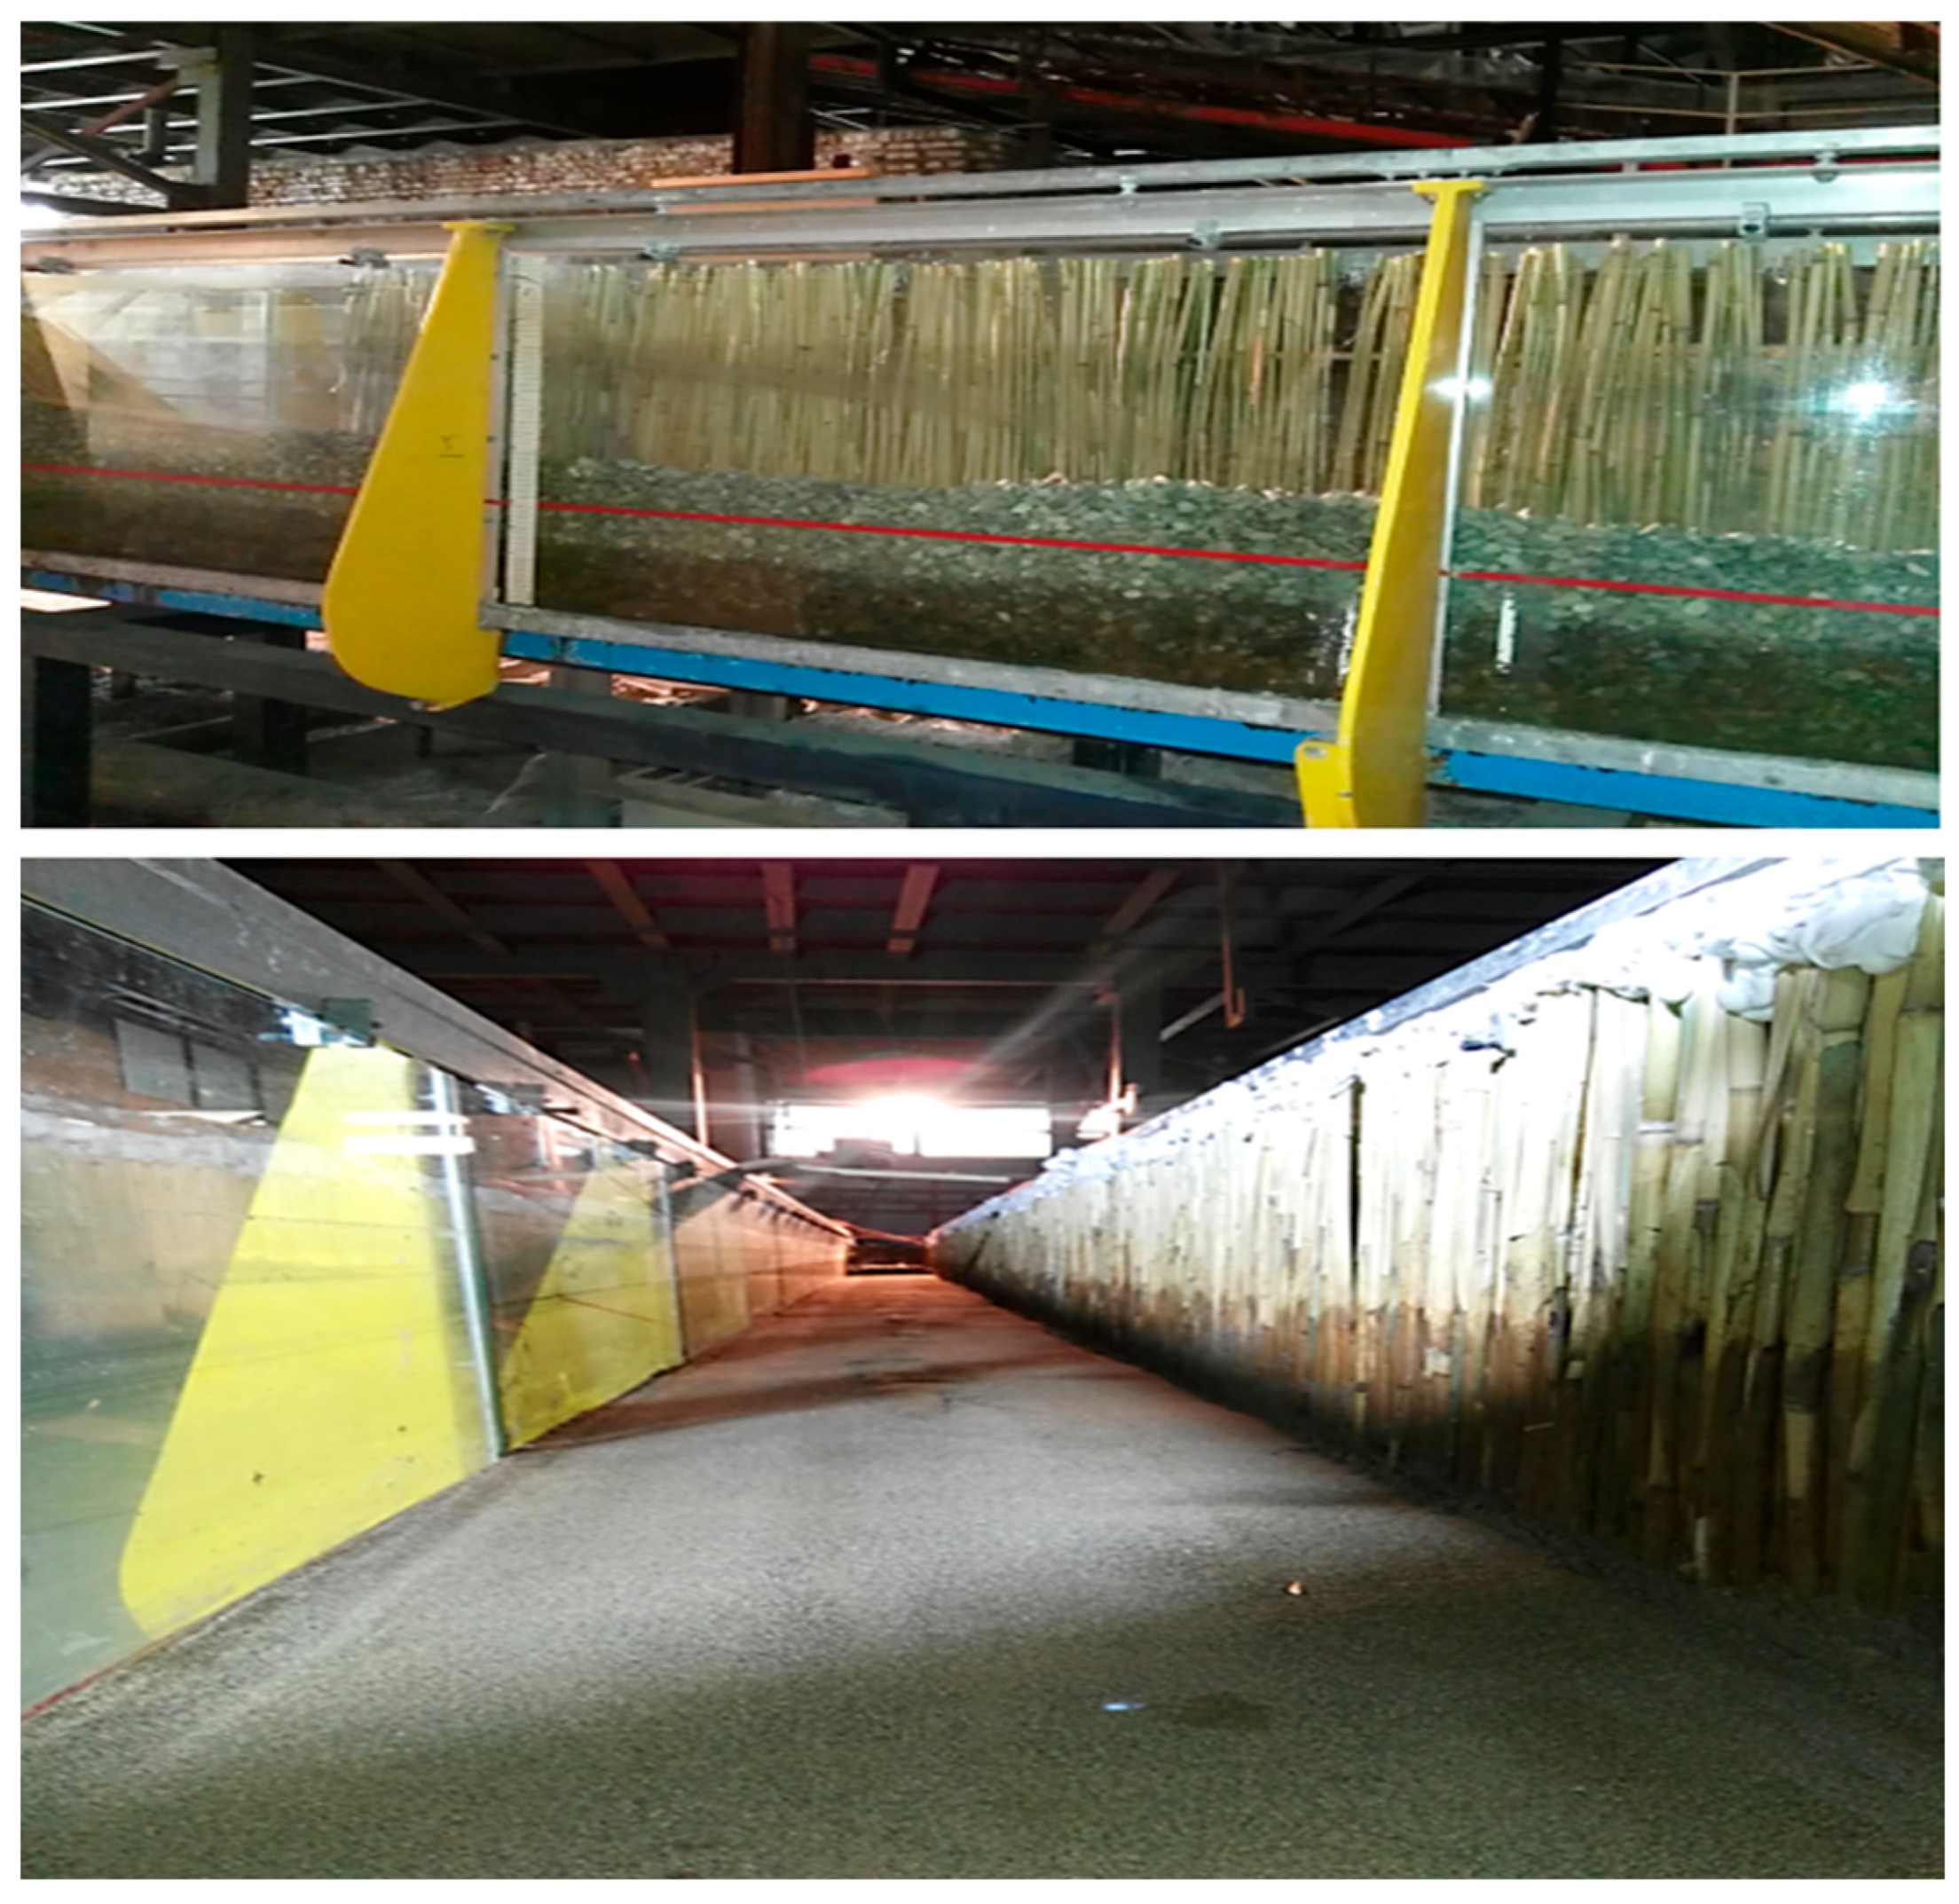
2.2. Laboratory Experiments

Laboratory experiments were conducted in a 13 m-long flume at the Tehran Water Research Center, with a width of 0.46 m and depth of 1.0 m. Flow was supplied by a centrifugal pump with discharge rates of 23 and 45 L/s, monitored by a flowmeter. Artificial vegetation, consisting of dried reed stems (1.2 cm diameter, approximately 50 stems/m in a linear arrangement), was fixed along one sidewall to simulate emergent vegetation. Sediment beds were prepared using fine sand or very fine gravel, selected to match field sediment sizes. Flow depth was controlled by a tailgate, and measurements were taken after ensuring fully developed flow. Velocity profiles and bedload samples were collected at three cross-sections using a propeller-type current meter and a Helley-Smith sampler, respectively. Froude similarity was adopted as the governing physical similarity criterion to maintain dynamic similarity between the laboratory and field conditions, given that flow in both environments was free-surface and subcritical. The sidewalls of the flume are constructed from transparent plexiglass, allowing for observation of flow and bed deformation from the outside. A sliding tailgate, equipped with a measuring ruler, is located at the end of the flume to control the flow depth. Rulers were installed at various cross-sections along the flume sidewalls to measure flow depth. A centrifugal pump with a maximum capacity of 60 L per second was used to deliver water from the holding tank to the flume. A flowmeter in the pumping system ensured the maintenance of the desired flow rate throughout the experiments. Two types of bed material, very fine gravel and fine sand, were used in the laboratory experiments. The sediment used in the laboratory flume experiments consisted of fine sand and very fine gravel with median diameters closely matching those measured at the field sites. Specifically, the selected grain sizes correspond to the D50 and D84 values identified from the Pol-Vashteh and Gouran reaches. This similarity ensures that sediment transport dynamics observed in the flume accurately reflect those in the field. Additionally, reed stalks were placed along one sidewall of the flume to simulate vegetation on the channel bank. Various experimental runs were conducted, considering factors such as the presence of vegetation, particle sizes of the bed material, and flow rates. The specific conditions for these experimental runs are outlined in Table 2, while Table 3 provides details on the characteristics of the sediment particles used in the experiments. It is important to note that the flow depth and discharge remained consistent across all experimental runs, both with and without vegetation on the channel sidewall.
Figure 3 shows barriers were installed in the upstream entrance section of the flume to dissipate flow energy and promote flow development along the length of the flume. With the flume’s total length of 13 m, a 1.5 m section was designated for conducting experiments. The distance from the upstream cross-section (CS) of this experimental section (the first CS) to the flume entrance is 7.5 m, providing sufficient length for the flow to fully develop. The distances from the flume entrance to the subsequent cross-sections in the experimental section are 8.0 m (CS-2), 8.5 m (CS-3), and 9.0 m (exit CS), respectively. In the flume setup, the vegetated section extended from 7.5 m to 9.0 m downstream of the inlet, leaving a 4.0 m non-vegetated outflow section before the outlet to allow for flow transition. To prevent erosion in the upstream section of the flume, coarse particles were placed on the bed, which was prepared as a flatbed without any specific bedforms.
In laboratory experiments, using artificial plants to model natural vegetation can introduce potential errors or inaccuracies in the results. Experimental studies of bed load motion in vegetated channels have often employed rigid vegetation elements, such as circular cylinders with uniform size and homogeneous distribution [25]. However, natural vegetation is inherently variable and has a significant impact on the movement of local particles near the banks [15,25,26]. Consequently, the motion of local particles near the banks in the presence of vegetation, both in natural channels and laboratory settings, becomes complex. This aspect requires further investigation to better understand the similarities and differences in velocity distribution and bed load transport estimation for uniform versus non-uniform vegetation forms in streams. Based on field observations, reed plants are known for their long lifespan and are commonly found in rivers and marsh areas. Given this, it is reasonable to use reed plants as model vegetation on the sidewall of the flume for this research. The artificial vegetation consisted of dried reed stems averaging approximately 1.2 cm in diameter. Arranged along one sidewall of the flume with a spacing of about 2 cm, this setup resulted in roughly 50 stems per meter. This dense configuration was designed to simulate the emergent riparian vegetation commonly found along the banks of the Gouran reach. The average diameter of the reed stems is approximately 1.2 cm, and they were arranged closely together on one sidewall of the flume, with no gaps between them.
Various methodologies are used to evaluate bed load transport in vegetated channels [4]. In studies like the present research, sediments are not supplied at the flume entrance. As a result, sediment motion along the flume is solely driven by bed material erosion and bed load transport, which can be calculated using time-averaged bed stress [27,28]. The duration of bed load data collection in laboratory experiments typically ranges from 1 to 4 min [12,28]. For bed load sampling in the laboratory, three points were established at each cross-section (CS). The first point was located 3 cm from the vegetated sidewall, the second point at the central axis of the channel (21 cm from the sidewall), and the third point near the bare sidewall (39 cm from the vegetated sidewall). Samples were collected at each point with 10 repetitions, each lasting 120 s. It is important to note that flow velocity measurements were also taken at the bed load sampling points. Figure 4 presents a schematic of the laboratory flume, illustrating the flow direction (left to right), the location of the artificial vegetation, and the positions of the cross-sections (CS-1 to CS-3). The flow velocity profiles are labeled as follows: for example, profile 1 B-II corresponds to the velocity profile at the intersection of CS-1 and axis B during the second series of tests.

2.3. Calculations

2.3.1. Estimation of Bed Load Rate

Bed load was sampled once or twice daily over a ten-week period during snowmelt and flood conditions using a handheld Helley-Smith sampler. In this study, the unequal width increment bed load sampling method was employed for bed load collection. Sediment transport was measured in the layer between 0 and 7.67 cm above the bed. Samples were collected at different verticals at each section, with each sample being repeated three times. The bed particles were dried and sieved using standard methods. Fall phi-interval sieves, ranging from 0.5 mm to 64 mm, were used to classify the samples into different grain size categories. The unit bed load transport rate (kg/m-s or ton/day-m) was calculated by dividing the total weight of the sample (in kg) by the total sampling time (calculated from the number of verticals and the time in seconds) and the width of the sampler (in meters). This value was then multiplied by the width of the channel (in meters) to obtain the mean transport rate across the channel cross-section (kg/s or ton/day).
Field measurements included bed load and flow discharges, velocity profiles, depth and top width, surface grain size distribution, and water slope surveys. The median grain size (d50) of the bed surface in the selected reaches ranged from 19 mm to 28 mm. To estimate the bed load rate, bed load samples were collected from the channel bed using the Helley-Smith device. The bed load transport rate per unit time and per unit width was then determined.
Bed load was sampled once at each study section over ten weeks during the snowmelt and flood periods using a handheld Helley-Smith (HS) bedload sampler. Notably, there have been few previous attempts to sample bedload across a section while concurrently measuring velocity profiles, making the data presented in this paper relatively rare. The HS sampler is a direct measurement, pressure differential sampler designed for sediments ranging in size from coarse sand to medium gravel, making it suitable for the particle sizes encountered in the study reaches. The HS sampler consists of an expanding nozzle, sample bag, and frame. It is designed for use in flows with mean velocities up to 3 m/s. The sampler features a square 7.62 cm entrance nozzle and a 46 cm-long sample bag made from 0.25 mm mesh polyester. The standard sample bag has a surface area of approximately 1900 cm2. The mesh openings allow water and fine sediment to pass through, while trapping coarser sediments.
Bed load transport in the layer from 0 to 7.67 cm above the bed was measured using a Helley-Smith sampler. Samples were taken at different verticals within each section, with each sample being repeated three times. It is important to note that “bed load” in this context refers to near-bed sediment transport captured by the Helley-Smith sampler in the 0 to 7.67 cm zone above the bed. Moving sediment fractions ranging from 0.125 to 32 mm were measured using the Helley-Smith sampler. The bed particles were dried and sieved using standard methods. Phi-interval sieves ranging from 0.5 mm to 64 mm (coarse sand to very coarse gravel) were used to separate the samples into grain size classes. The unit bed load transport rate (kg/s-m or ton/day-m) was calculated by dividing the total weight of the sample (in kg) by the total sampling time (number of verticals and time in seconds) and the width of the sampler (in meters). Average samples from each station across the section were integrated using the unequal width increment method to obtain the mean transport rate through the channel cross-section (kg/s or ton/day). It was assumed that the bed load sampling efficiency was 1.0 [21].
In Table 4, the sixth column presents the weight of the particles collected in the sampler per unit of time (one second), calculated as follows:
D r y   w e i g h t   ( g r / s e c ) = D r y   w e i g h t   ( g r ) N u m b e r   o f   r e p e t i t i o n × D u r a t i o n   o f   e a c h   r e p e t i t i o n   ( s e c )
The seventh column shows the value of the transported bed load per unit of time and per unit width (one meter), calculated as follows based on the proportionality process:
D r y   w e i g h t   ( g r / s e c . m ) = D r y   w e i g h t   ( g r / s e c ) S a m p l e r   o p e n i n g   w i d t h   ( m )

2.3.2. Determination of Shear Velocity

In streams with coarse bed particles, the boundary layer characteristics method can be used to determine the shear velocity by utilizing all velocity data within a profile. This method has been successfully applied in studies of non-uniform flows in rivers with both fixed and mobile channel beds [29]. The shear velocity is calculated using the following equation:
u * = δ * θ U m a x 4.4 δ *
where Umax is the maximum velocity in a velocity profile (m/s), the coefficient c is a function of flow characteristics, and its value from 3.8 to 4.4 was variable. In Equation (1) δ * is the displacement thickness of the boundary layer, and θ is the momentum thickness of the layer that can be obtained using the following equations:
δ * = 0 h 1 U U m a x d z
θ = 0 h U U m a x 1 U U m a x d z
After calculating the shear velocity, the bed shear stress can be determined using the following Equation:
τ 0 = ρ u * 2
where ρ is the density of the fluid.

2.3.3. Determination of Shields Parameter

The Shields parameter is obtained using Equation (5):
τ * = τ 0 γ S γ d 50
where γs and γ are the specific weights of sediment and water, respectively.

2.4. Assumptions and Limitations

The present study has certain assumptions and limitations. Both selected river sections in the Taleghan River are straight, with relatively constant channel widths, minimizing the impact of width variation. To ensure the accuracy of field measurements, the maximum flow depths of the study reaches range from 50 cm to 60 cm, and emergent vegetation is present along the banks. Due to channel width limitations, it was not possible to use the same type of vegetation in laboratory experiments. However, many studies have used rigid cylinders with specific diameters to simulate emergent vegetation in laboratory settings. A uniform vegetation cover along the flume sidewalls was used to allow the boundary layer to develop without disruption. Variations in roughness could destabilize the boundary layer, making it difficult to draw conclusions from the data. Although natural vegetation does not survive in a laboratory flume, the effects of vegetation roughness can still be studied using similar-sized and -shaped vegetation, even if the specimens are not living. It is important to note that flow velocity data were collected using the same current meter in both the natural river and the laboratory flume. This consistency is particularly useful for field conditions, where many uncontrolled factors can influence measurements. This study primarily focuses on measuring streamwise flow velocities in both environments, with channel beds in both settings maintained flat and free of bedforms. Although scaling differences between natural rivers and laboratory flumes present challenges, careful efforts were made to preserve hydraulic similarity—especially by maintaining comparable Froude numbers. Consistent instrumentation was also employed in both environments to minimize data variability. Despite inherent physical differences, the observed trends across both settings provide a valid basis for comparison.

3. Results and Discussion

Based on the collected data for flow velocities and bed load, the flow rates in the river, bed load rate, average flow velocities, maximum velocities, flow Froude numbers, and Reynolds numbers were calculated. Table 5 summarizes the hydraulic characteristics of the flow and the morphological features of the channels. In this table, the second column lists the CS name; the third column presents the average flow velocity (m/s); the fourth column shows the maximum flow velocity (m/s); the fifth column indicates the discharge (m3/s); the sixth column details the discharge per unit width (m3/s·m); the seventh column specifies the bed load rate (ton/day); the eighth column presents the bed load rate per unit width (ton/day·m); the ninth column lists the flow Froude number; the tenth column displays the Reynolds number; the eleventh column shows the bed shear stress; and the twelfth column indicates the Shields parameter. The method for calculating the bed load rate was explained in the previous section. It should be noted that, since the unit for bed load rate in most proposed equations is in tons per day, the results in this study are also presented in this format.
Since the Froude numbers are clearly less than 1.0 and the Reynolds numbers exceed 4000 at all cross-sections, the flow in both the river reaches and the laboratory channel is subcritical and turbulent. A comparison between average and maximum velocities reveals that the difference between these values increases with the Reynolds number (e.g., at P2). Results show that, in the Pol-Vashteh reach, the relative roughness (d50/h) is approximately 0.06, and the Shields parameter ranges from 0.077 to 0.079. In contrast, the Gouran reach exhibits a higher relative roughness of 0.13, with Shields parameter values ranging from 0.022 to 0.048. This inverse relationship indicates that smaller relative roughness corresponds to a higher Shields parameter, supporting the findings of Church (2006) [30]. As shown in the sixth column of Table 5, discharge varies across different cross-sections in the Pol-Vashteh reach. These differences may be due to measurements taken on different days—especially given that precipitation in this region is generally lower during spring. Considering the critical Shields parameter (τ*c = 0.03), Table 5 indicates that the Shields parameters at P1 and G1 are both below this threshold. Nevertheless, bed load movement was still observed at these locations, highlighting the complexity of sediment transport, which can be influenced by numerous uncontrolled factors in natural river systems.

3.1. Sediment Granulation

Granulation analysis in this study was conducted using both the Volman method and standard sieve testing. After generating the granulation curves and determining the characteristic grain size diameters, an additional parameter—the geometric standard deviation (σg)—was calculated to evaluate the uniformity of bed particle distribution. The geometric standard deviation is calculated using Equation (6). A σg value less than 1.4 indicates a uniform particle distribution in the channel bed, while a value greater than 1.4 signifies a non-uniform distribution. The granulation curve results include three components: (1) particles comprising the channel bed in the two river reaches, (2) the bed load particles, and (3) the sediment particles used in the laboratory experiments. These results are summarized in Table 3 and Table 6.
σ g = d 84 d 16
According to Table 3 and Table 6, the particle distributions in the riverbeds of both reaches—as well as the sand particles used in the laboratory experiments—have a geometric standard deviation greater than 1.4, indicating a non-uniform distribution of bed material. Additionally, Table 6 shows that the geometric standard deviation of bed load samples collected from the river at cross-sections P3, G1, and G3 also exceeds 1.4, confirming that the particle size distribution of the bed load at these locations is non-uniform.

3.2. Velocity Distribution

Figure 5 illustrates the velocity profiles at various cross-sections within the two study reaches. Overall, the velocity distribution profiles along the central axis of the river appear relatively regular, with higher velocity values observed at the center compared to areas near the riverbanks. Closer to the banks, greater deviations in the velocity profiles are evident due to the influence of emergent vegetation. In the Gouran reach, approximately 80% of the velocity profiles showed maximum velocities occurring just below the water surface. Flow velocities tend to increase with depth initially and then decrease near the surface—a pattern partly attributed to the narrowing of the channel along this reach, which suggests the presence of accelerating, non-uniform flow. Although care was taken to ensure a flat riverbed during data collection, minor bedforms inevitably developed as a result of ongoing sediment transport. In the Gouran reach, where vegetation is present along the left bank, a dip phenomenon was observed in most velocity profiles near the vegetated bank. This is attributed to the generation of secondary currents by the vegetation, producing a convex-shaped velocity distribution. This observation aligns with the findings of Tabesh et al. (2023a), who reported that emergent vegetation shifts the maximum velocity closer to the bed due to enhanced secondary circulation [14]. Similarly, Zhao and Nepf (2021) found that vegetation modifies vertical velocity profiles by generating turbulence layers at the canopy top, especially under submerged conditions [31].
Moreover, the velocity profiles in the Gouran reach exhibited greater irregularities across the flow depth compared to those in the Pol-Vashteh reach, which has bare banks and lacks vegetative influences.
In the laboratory experiments, axis-A was located closest to the vegetated sidewall, axis-B corresponded to the central axis of the channel, and axis-C was positioned near the opposite (bare) sidewall. The results showed that no significant irregularities were observed in the velocity profiles along the central axis (axis-B), indicating that vegetation had minimal influence on flow conditions at this location. In contrast, pronounced irregularities were detected near the vegetated sidewall, especially when the channel bed was composed of fine sediment particles (fine sand) and the aspect ratio was relatively small. When the bed material was changed to very fine gravel, these irregularities were notably reduced—particularly in the absence of vegetation along the flume sidewall. Furthermore, velocity values were found to increase progressively with distance from the vegetated sidewall, reinforcing the observation that vegetation has a localized but significant impact on flow structure near the bank.
Vegetation along the channel sidewall acts as an obstacle to flow, reducing local velocities and redirecting the flow toward the opposite, non-vegetated sidewall. In the second experimental setup, the objective was to assess the effect of varying discharge on velocity profiles. The results showed a consistent upward trend in flow velocity as the discharge increased, reaching up to 45 L per second. In the third setup, the influence of bed material particle size on velocity profiles was investigated. The findings indicated that switching from fine sediment to coarser particles not only increased the overall flow velocity but also reduced the irregularities in the velocity distribution. As illustrated in Figure 6, near the vegetated sidewall, the maximum velocity occurred at a certain depth below the water surface. However, as the distance from the vegetated wall increased, the location of maximum velocity shifted upward toward the water surface, accompanied by a general increase in velocity. This shift can be attributed to vegetation-induced drag and turbulence near the channel bed. Vegetation increases flow resistance, creating a low-velocity zone adjacent to the stems. Above this zone, a shear layer forms at the vegetation-top interface, enhancing turbulence and momentum exchange. The resulting velocity dip near the vegetated boundary arises from secondary currents and altered turbulence structures, which redistribute momentum toward the channel center and cause the velocity maximum to shift downward. This pattern suggests the presence of secondary currents near the vegetated boundary, which significantly influence flow structure in that region.
Velocity profiles from the first and second experimental setups reveal a higher velocity gradient near the bed (z/H < 0.25) compared to the rest of the flow depth. Beyond z/H = 0.25, velocity increases again, peaking between z/H = 0.60 and 0.66, before decreasing toward the water surface. This irregular pattern is attributed to vegetation along the channel bank and the influence of sediment particles, which disrupt uniform flow and induce quasi-uniform conditions. As a result, turbulence and bed shear stress become nonlinearly distributed throughout the flow depth and along the reach. In the third setup, velocity decreases at z/H = 0.26, with a maximum at z/H = 0.66. In contrast, the fourth setup—lacking vegetation on the flume sidewall—exhibits a regular velocity distribution, steadily increasing from the bed to the water surface with minimal deviation.

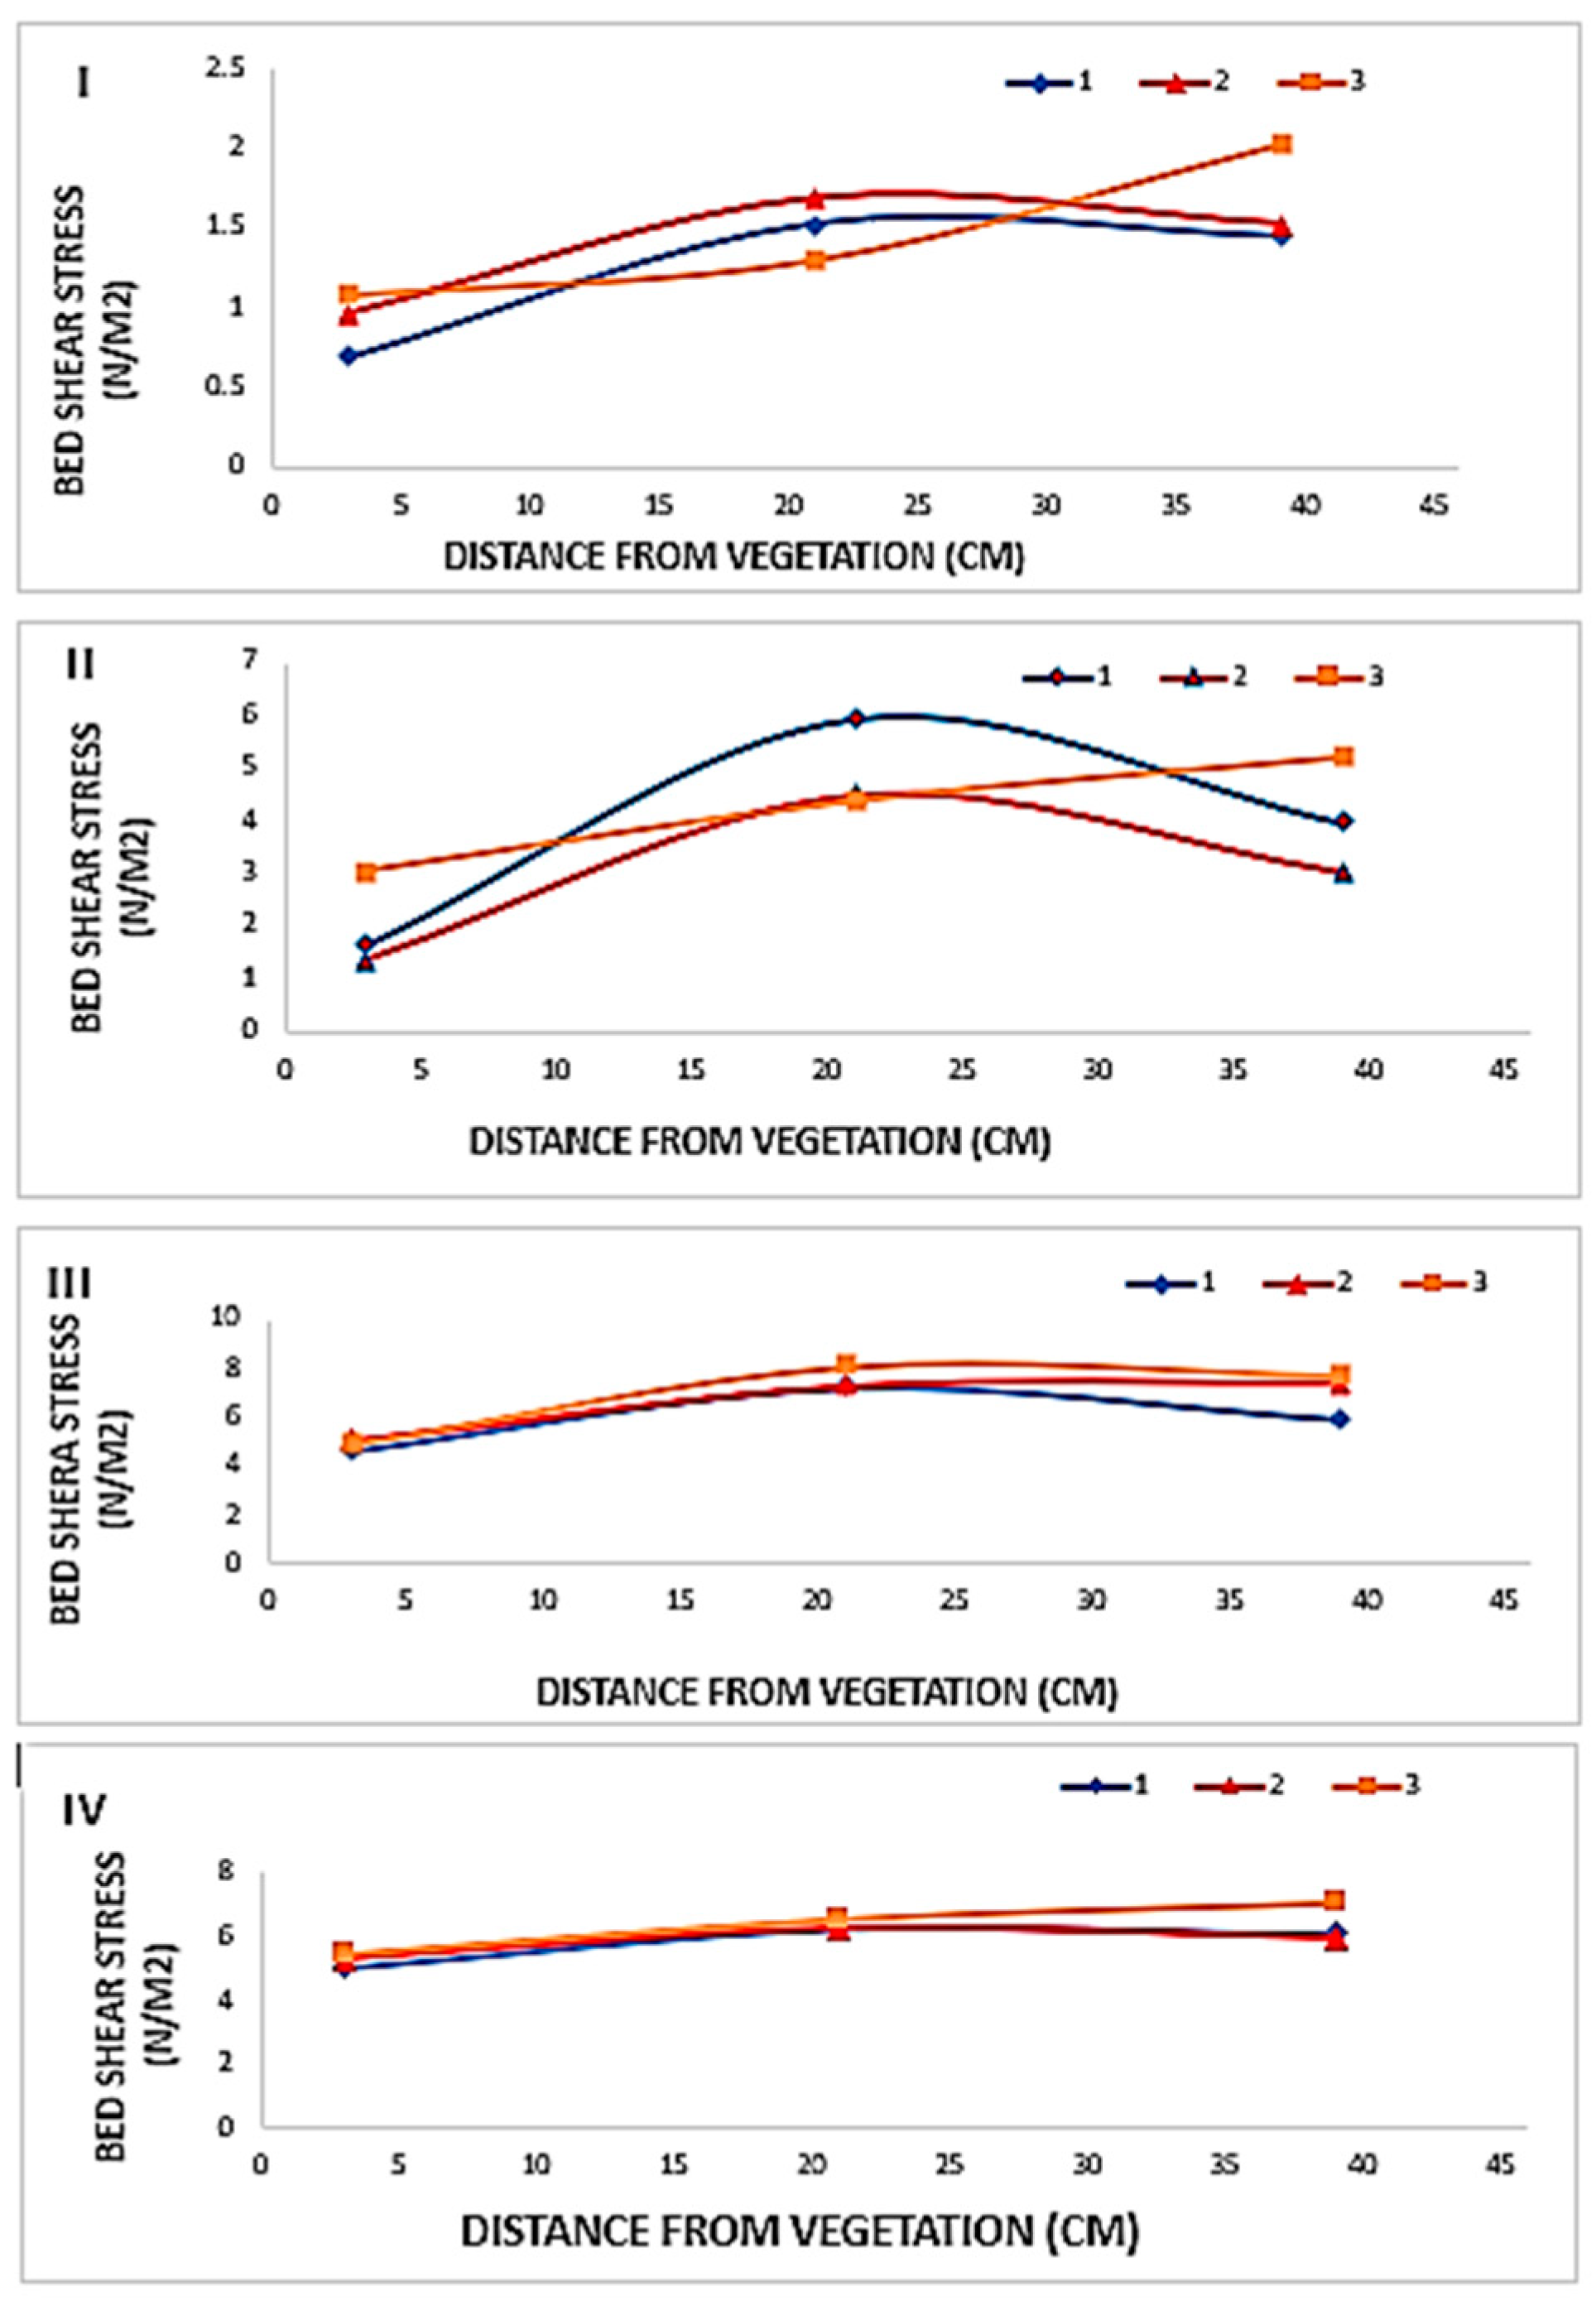
3.3. Bed Shear Stress

At any point within a cross-section (CS), the local bed shear stress can be determined using the calculated shear velocity. To assess the mode of bed load transport at each point, both the local bed shear stress values and their distribution diagrams are essential. In addition to these calculations, equivalent bed shear stresses were computed for all cross-sections to estimate bed load transport using established equations, as summarized in Table 7.
Figure 7 presents the distribution diagrams of bed shear stress across various cross-sections (CSs) of the channel. The results show that maximum bed shear stress occurred near the vegetated bank, where flow velocity decreases due to vegetation, while turbulence levels are elevated. In the second experimental setup, increasing the flow rate from 23 to 45 L per second led to a slight rise in bed shear stress compared to the first setup, although the locations of maximum and minimum shear stresses remained unchanged. The highest bed shear stress was observed along the channel’s central axis, attributed to the increased flow depth. In the third experimental setup, a significant increase in bed shear stress was observed due to the use of coarser bed material. However, the location of the maximum shear stress remained consistent. As the particle size increased, the variation range of bed shear stress across the section narrowed, explaining the notable difference between maximum and minimum shear stress values in the first and second setups. In the fourth setup, which lacked vegetation, bed shear stress was higher than in all other test conditions. The distribution near the vegetated bank formed a convex profile, showing a decrease in shear stress toward the bed. Under this condition, the maximum shear stress did not occur at the bed surface but above it, influenced by the prevailing pressure gradient.

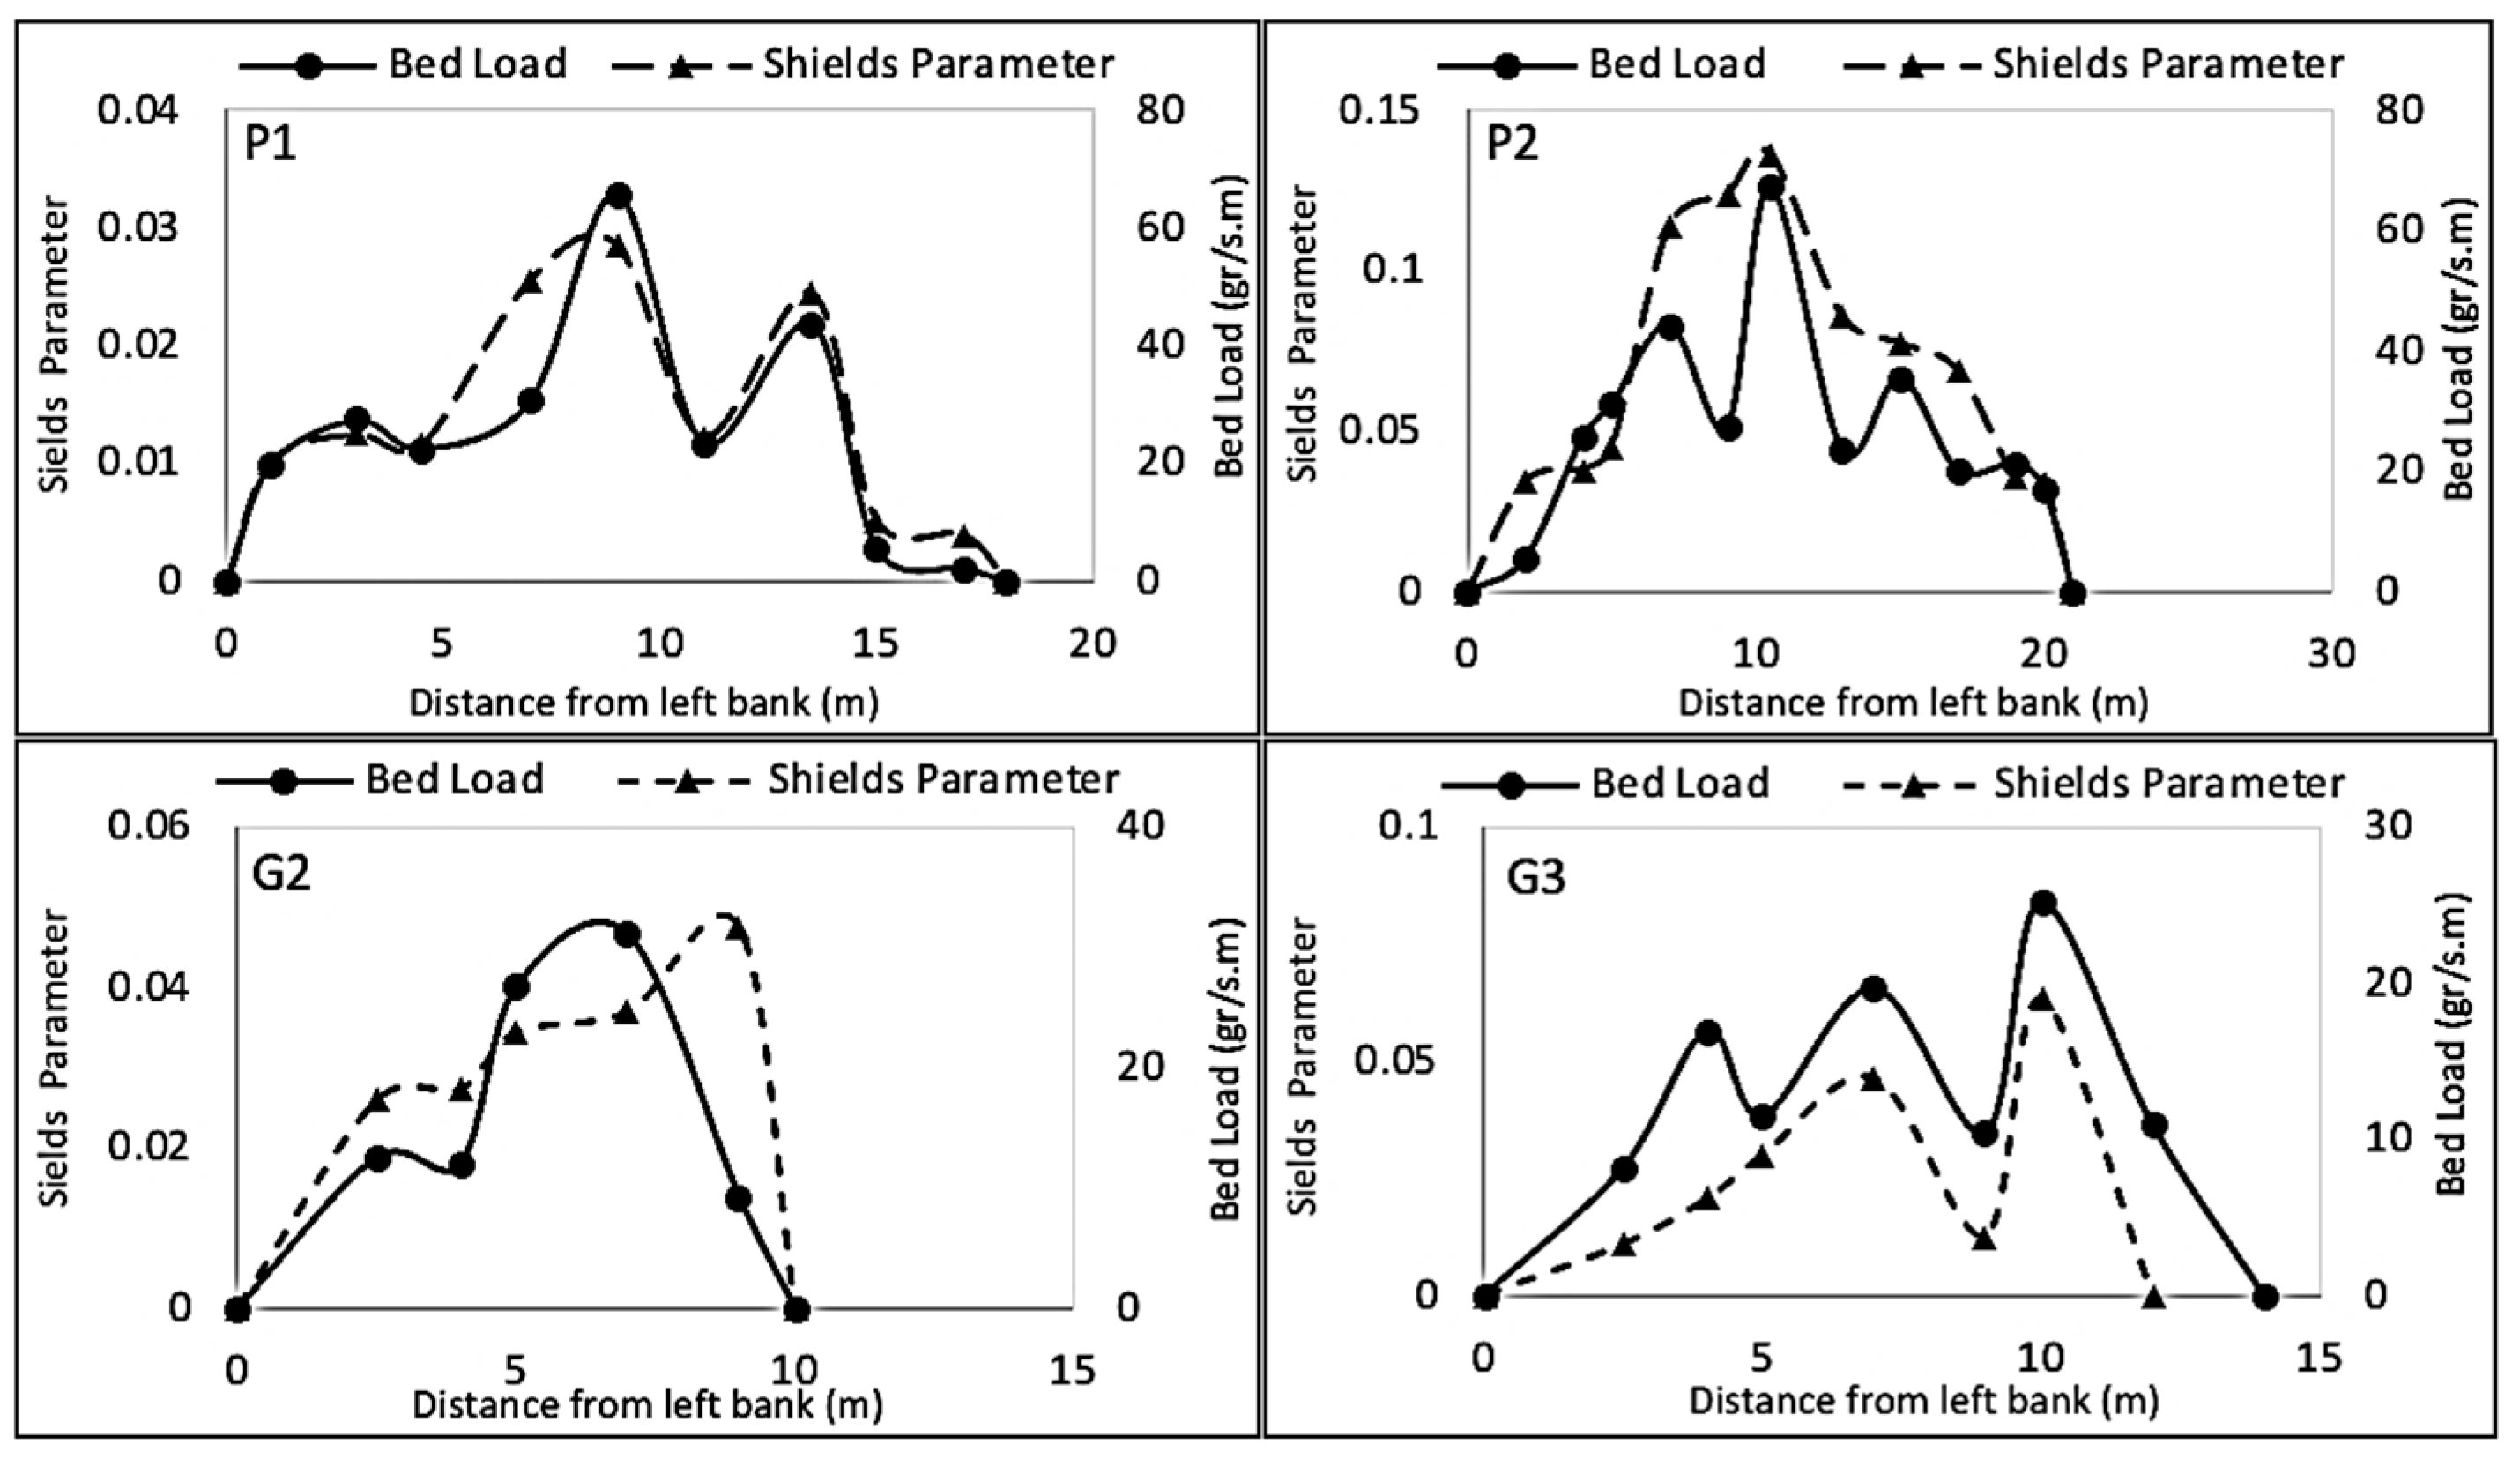
3.4. Variations in Shields Parameter and Bed Load

The sediment load of a river is primarily influenced by several factors, including precipitation characteristics within the watershed, watershed features, river geometry, channel bank friction, variations in flow depth, the presence of bank vegetation, the composition of the riverbed (coarse- vs. fine-grained materials), and the riverbed slope. Bridge and Gabel (1992) observed that variations in bed load across the channel width closely mirror changes in flow velocity and bed shear stress [22]. Typically, areas with the highest bed load transport align with regions of maximum bed shear stress. However, this relationship is not always direct, as sediment transport is also affected by turbulence and other interacting factors. In the present study, the distributions of the Shields parameter and bed load transport were analyzed concurrently, as shown in Figure 8. The results reveal that both distributions follow a similar trend.
Figure 8 demonstrates a clear correlation between the Shields parameter and bed load transport values. At cross-section CS-P2, located approximately 7 to 9 m from the left riverbank, an interesting phenomenon was observed: although the Shields parameter was higher at the 9 m point than at the 7 m point, the bed load transport was greater at 7 m. This mismatch may be explained by several factors. One is the grain hiding and exposure effect, where finer particles sheltered by coarser grains can be mobilized more easily, even when the local Shields parameter appears low. Additionally, turbulence intensity plays a critical role in sediment mobilization. Prior studies (e.g., [7,31]) suggest that turbulent kinetic energy is a more reliable predictor of bedload transport than bed shear stress in vegetated flows. Consequently, localized bursts of turbulence or sediment sorting may enhance transport in areas with lower average stress levels. A similar trend was noted between 13.5 and 15.0 m from the left bank. This discrepancy can be attributed to variations in bed shear stress. In gravel-bed rivers, the riverbed is composed of both fine and coarse particles, with fine grains having a lower critical bed shear stress than coarse grains. The grain-size distribution of the bed material in this study reveals significant variability, which likely influences the observed bed load transport patterns. This variability in particle size was consistently evident along both the Pol-Vashteh and Gouran reaches (G3), particularly at 2.0 and 4.0 m from the left bank.
Figure 8 also indicates that Shields parameter values at CS-P2 are higher than those at CS-P1. This aligns with the bed load particle size data in Table 6, which shows that the median diameter of bed material at CS-P2 is larger than at CS-P1. A similar trend is observed between CS-G2 and CS-G3. However, it is important to note that a consistent relationship between the Shields parameter (and consequently, bed load transport rate) and particle size is not evident across all cross-sections. For example, this correlation is not clearly observed between CS-P1 and CS-G3.
Figure 9 illustrates the relationship between Shields parameter values and bed load transport. Laboratory bed load samples consistently indicate a strong dependence of bed load transport on the Shields parameter. Moreover, the locations of the maximum values for both parameters closely align. Notably, Shields parameter values are lower near the vegetated bank compared to those at the channel center and near the bare bank. This spatial variation in the Shields parameter is reflected in corresponding differences in bed load transport across the cross-sections.
A comparison between the first and second experimental setups indicates that an increase in flow rate results in higher bed load transport, as expected. Correspondingly, the Shields parameter values in the second setup are higher than those in the first, reflecting the elevated flow conditions. In contrast, the third experimental setup—characterized by an increase in the median particle size (d50) of the bed material—shows a decrease in Shields parameter values at most cross-sections, leading to reduced bed load transport. In the fourth setup, which featured a bare channel without vegetation, both the Shields parameter values, and bed load transport increased.
Values of critical Shields stress (τ*c) typically vary by an order of magnitude, ranging from approximately 0.01 to 0.1, depending on factors such as particle Reynolds number, particle packing, and the method used to define incipient motion. Mueller et al. (2005) [32], in their study of 45 gravel-bed rivers, reported τ*c values ranging from 0.008 to 0.117. The relatively low critical Shields stress values estimated in the present study are consistent with those observed by Fenton and Abbott (1977) [33] for fully exposed grains. These low values suggest that particles were mobilized under relatively low shear stresses, occurring in sections characterized by high aspect ratios (W/h), coarse median grain size (d50), and low bed slopes. One possible explanation for the low critical Shields stress values lies in the findings of Mueller et al. (2005) [32], who demonstrated that τ*c decreases with increasing d50/d90 ratios—that is, more uniform sediments require lower shear stress to initiate motion. Similarly, Mueller et al. (2005) [32] and Lamb et al. (2008) [34] showed that τ*c tends to decrease with decreasing channel slope. Moreover, the presence of non-uniform flow likely influenced the initiation of sediment motion due to the nonlinear distribution of Reynolds stress, as noted by Afzalimehr et al. (2007) [35]. It is also important to acknowledge that the low τ*c values observed in this study may, in part, result from the assumption of a constant d50 across the cross-section. In regions with locally finer material—such as quiescent depositional zones with low shear stress—this assumption could lead to overestimation of local d50, thereby underestimating the critical Shields stress. This effect may have contributed to the particularly low values of τ*c observed at points of minimal bed load transport.
Overall, the results from both the field investigations in the Taleghan River and the laboratory experiments demonstrate a clear correlation between the Shields parameter and bed load transport. In both cases, higher Shields parameter values correspond to greater bed load. Additionally, an increase in flow rate consistently results in increased bed load transport, as observed in both field measurements and the second experimental setup. There is also a strong relationship between variations in bed material particle size and Shields parameter values across both field and laboratory settings. However, Figure 8 and Figure 9 highlight notable differences between the field observations and laboratory results. These discrepancies can be attributed to the differing nature of the data sources. The field data from the Taleghan River reflect complex, real-world conditions influenced by numerous uncontrolled or unmeasured factors. In contrast, the laboratory experiments were conducted under controlled conditions, featuring uniform bed material, evenly distributed vegetation, and consistent flow depth across the flume width. Moreover, while the laboratory study was conducted with a flat bed and without bedforms, achieving a truly flat bed in natural river conditions is practically impossible. It should be clarified that the Shields parameter in Figure 8 and Figure 9 is not zero, but rather very small. A small Shields parameter (τ* = 0.006) has been reported by Motamedi et al. (2014) in a gravel-bed river [36], supporting Buffington and Montgomery’s assertion that no universal value for incipient motion should be emphasized. Furthermore, the effect of bed shear stress due to sediment is minimal compared to the impact of bed shear stress induced by vegetation. Vegetation alters the typical linear shear stress distribution for a constant flow depth, creating a nonlinear shear stress profile over submerged vegetation. As a result, maximum Reynolds stress occurs above the vegetation, with Reynolds stress reaching zero just below the water surface. This generates a negative Reynolds stress distribution above the zero-Reynolds stress point, leading to the dip phenomenon observed in velocity profiles. The bending capacity of the vegetation stems creates a fluid layer above the vegetation, which inhibits momentum exchange and shear interaction between the fluid inside and outside the vegetation cover. The drag produced by this fluid layer increases turbulence, shifting the location of maximum turbulence stress further away from the vegetation cover.

3.5. Measurement Uncertainty and Limitations

Although careful attention was paid to measurement accuracy in both the field and laboratory, several sources of uncertainty remain. First, the propeller-type current meter used in the field provides depth-averaged velocity and may have reduced accuracy near the bed and sidewalls, where flow variability is high. Additionally, the Helley-Smith sampler has known limitations, particularly in capturing fine particles or in fast, highly turbulent flows, as noted previously.
In the field, sediment heterogeneity introduced additional uncertainty. The riverbed comprised a mixture of grain sizes, yet the D50 value used to calculate Shields parameters was assumed constant across each cross-section, despite likely local variability. This assumption may have led to underestimating the critical Shields stress in areas dominated by finer material.
Moreover, slight variations in channel geometry, bedforms, and vegetation arrangement in the field introduced complexities that are difficult to replicate in the laboratory. Although laboratory conditions were controlled, scale effects and the use of artificial vegetation contribute to interpretative limitations. These uncertainties should be carefully considered when generalizing the findings.

3.6. Bed Load Transport Affected by the Channel Geometry

Figure 10 illustrates the channel bed profiles at various cross-sections (CSs) of the Taleghan River, along with corresponding variations in bed load transport. In Figure 10-P1, a bar in the center of the cross-section divides it into two areas, with most of the bed load being transported on the right side. As the flow moves over this small bar, bed load transport decreases at that point. The bed load distribution at CS-P1 shows that greater river depths are associated with higher bed load transport. In areas with higher bed load transport, both bed shear stress and the Shields parameter are elevated. Conversely, near the right bank of the river, where the Shields parameter is low, bed load transport approaches zero.
The ‘P1’ cross-section (CS-P1) of the Pol-Vashteh reach is the widest among all study cross-sections across both river reaches. The bed load distribution diagram for this cross-section, shown in Figure 10, reveals three exceptionally high bed load values, which correspond to locations with the maximum flow depth. A bar located in the middle of the cross-section significantly alters the Shields parameter values, leading to a dramatic decrease in bed load transport near the bar. Furthermore, Figure 10 illustrates that the highest bed load transport occurs in the area with the greatest flow depth.
Figure 10 shows that at CS-P3, the waterway near the right bank functions as the main channel. Between 6 m and 10 m from the left bank, there is a bar that is likely submerged during high flow conditions. The Shields parameter and bed load results at this cross-section are expected to resemble those at CS-P2, suggesting that the bed load value near the submerged bar would be minimal. The maximum bed load occurs where the flow depth is greatest. At CS-1 and CS-2 of the Gouran reach, the channel bed elevation profiles are regular, allowing bed load particles to move freely across the entire channel width. The maximum bed load values are found in areas with the deepest flow. Additionally, the bed load distribution at CS-3 in the Gouran reach mirrors the results observed at other cross-sections in the Pol-Vashteh reach.

4. Conclusions

In this study, we examined bed load transport in both a river and a laboratory channel, considering the impact of vegetation along the channel banks. The following key results were obtained:
(1)
The velocity profiles along the central axis of the river are more uniform compared to those near the vegetated riverbank. Most velocity profiles near the vegetated bank exhibit a dip phenomenon, suggesting the formation of secondary currents caused by the presence of vegetation.
(2)
As the flow approaches the vegetated bank, it is redirected towards the non-vegetated bank, leading to higher flow velocities near the non-vegetated side. An increase in bed material grain size is associated with higher velocities and reduced irregularity in the velocity profiles.
(3)
Based on the experiments conducted, it was confirmed that the presence of vegetation along the channel bank creates a minimum shear stress near the vegetated bank and a maximum along the flume’s central axis. The shear stress distribution adjacent to the vegetated bank exhibits a convex profile, indicating a gradual reduction in shear stress toward the channel bed. In contrast, regions farther from the vegetated bank show a quasi-linear distribution with comparatively higher shear stress values.
(4)
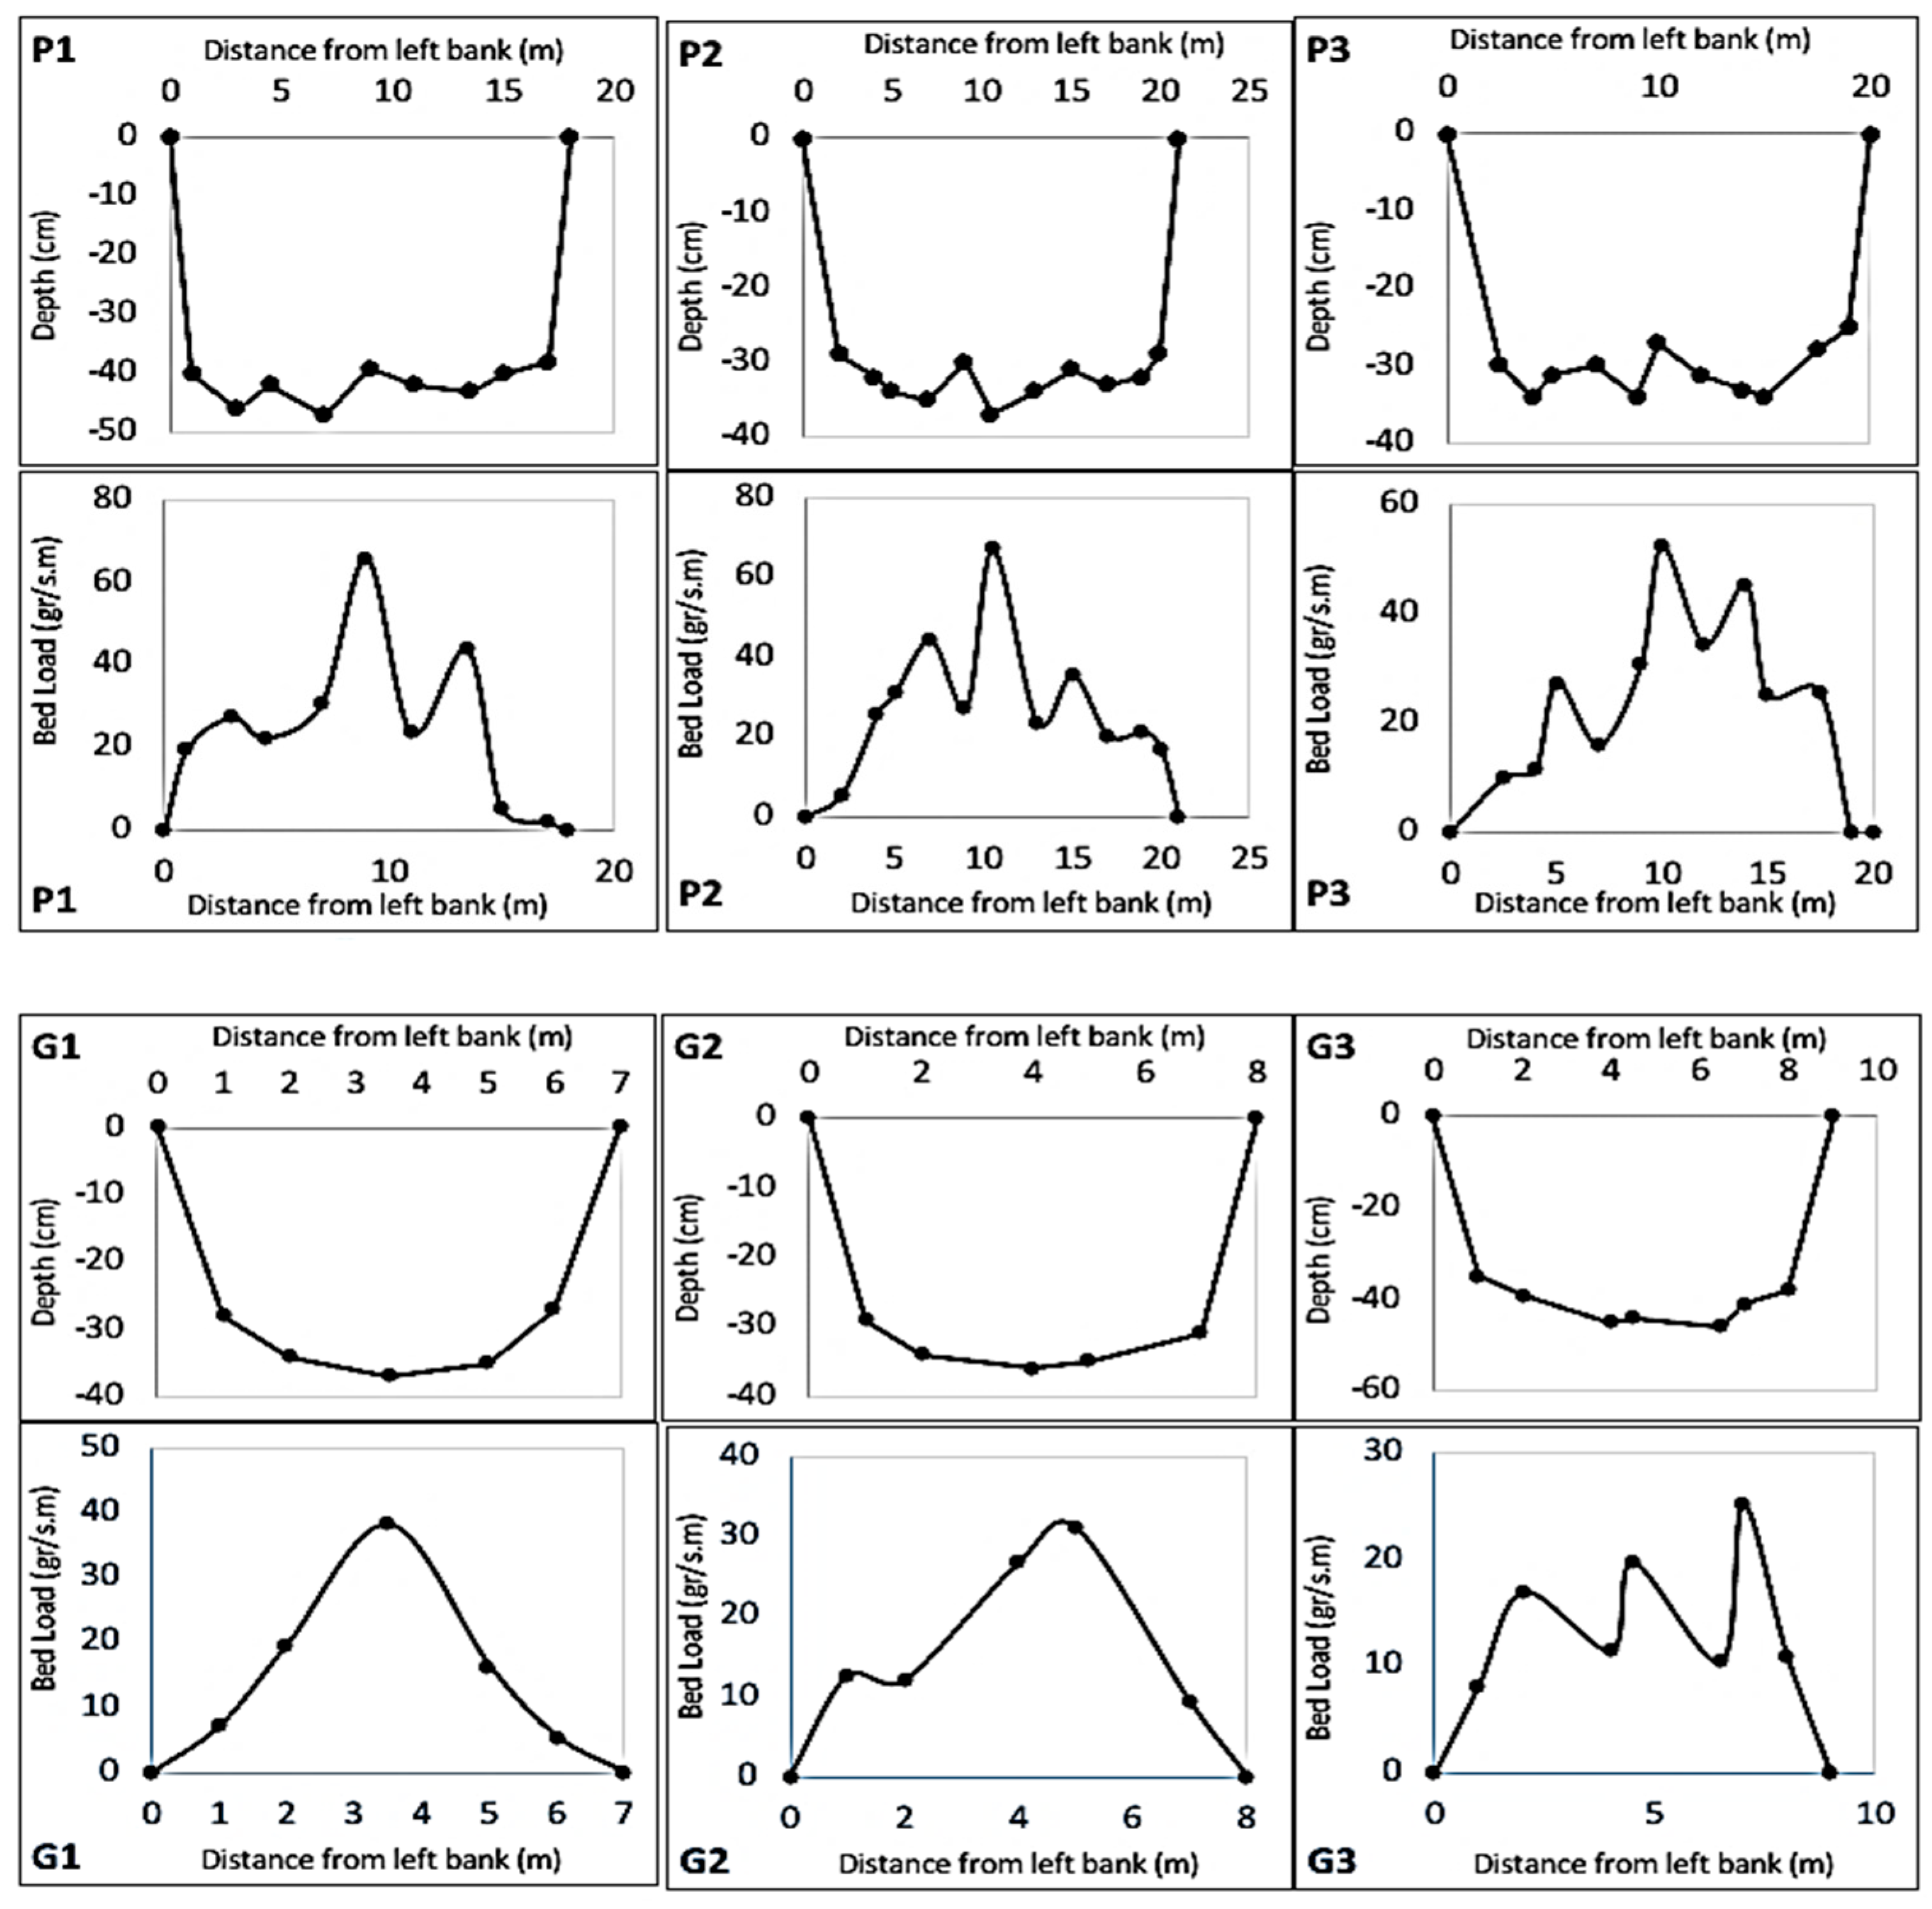
The locations of maximum bed load transport coincide with the positions of the maximum Shields parameter and the deepest flow points. The presence of vegetation along the channel introduces additional hydraulic resistance, altering the flow structure by reducing near-bed velocity and turbulence intensity. These changes result in lower Shields parameter values and consequently suppress bedload transport.
(5)
Based on both field and laboratory observations, shear velocity consistently exhibits a convex distribution pattern rather than a linear one. This behavior is attributed to flow retardation caused by sediment in the bed and vegetation along the channel banks. Similar trends were observed in both river and laboratory channels. Further studies are needed to validate these findings and to compare results from field investigations with those from laboratory experiments. We recommend assessing the effects of different vegetation types such as flexible versus rigid and submerged versus emergent on sediment transport. Additional research should also explore a wider range of flow conditions and sediment sizes to confirm and extend the current findings. Moreover, long-term monitoring in natural rivers could help reveal the cumulative impacts of vegetation on bed morphology under variable flow regimes.
(6)
The novelty of this research lies in its integrated approach, combining field and laboratory data to assess the effects of bank vegetation on sediment transport—an aspect seldom evaluated under both real and controlled conditions.
(7)
In summary, the novelty of this research lies in its integrated use of field and laboratory data to assess the effects of bank vegetation on sediment transport—an area rarely evaluated under both real and controlled conditions. Additionally, the study offers new insights into the decoupling of the Shields parameter from bedload response, particularly along vegetated banks, which remains an understudied topic.
Overall, this study provides a comparative framework for understanding sediment dynamics in vegetated and non-vegetated channels. The findings offer valuable insights for eco-hydraulic model development, bank stabilization strategies, and sediment management in river restoration projects. In particular, recognizing how vegetation alters flow resistance and sediment mobility can help practitioners enhance flood mitigation and channel rehabilitation efforts. Future studies could investigate the effects of submerged and flexible vegetation types across varying flow regimes or incorporate numerical modeling of turbulence-resolving flows to better predict sediment entrainment patterns. Additionally, long-term monitoring of vegetated reaches throughout different seasons could provide valuable insights into the temporal evolution of sediment dynamics.

Author Contributions

Conceptualization, H.A., F.J. and E.D.; methodology, H.A. and F.J.; experimental analysis, F.J.; writing—original draft preparation, E.D., F.J., H.A. and J.S.; writing—review and editing, F.J., E.D., H.A., J.S. and K.A.; supervision, H.A.; funding acquisition, J.S. and H.A. All authors have read and agreed to the published version of the manuscript.

Funding

This research received no external funding.

Data Availability Statement

The raw data supporting the conclusions of this article will be made available by the authors on request.

Conflicts of Interest

The authors declare no conflicts of interest.

References

  1. Iqbal, S.; Tanaka, N. Hydraulic Performance Assessment of Various Submerged Pile Designs around an Emerged Dike. Water Sci. Eng. 2024, 17, 406–416. [Google Scholar] [CrossRef]
  2. Iqbal, S.; Tanaka, N. An Experimental Investigation on Dike Stabilization against Floods. Geosciences 2023, 13, 307. [Google Scholar] [CrossRef]
  3. D’Ippolito, A.; Calomino, F.; Dey, S.; Gaudio, R.; Penna, N. Bedload transport through emergent vegetation: Current status and its future prospect. Environ. Fluid Mech. 2023, 23, 711–733. [Google Scholar] [CrossRef]
  4. Nikora, V.I.; Goring, D.G.; Biggs, B.J.F. On gravel-bed roughness characterization. Water Resour. Res. 1999, 35, 3973–3983. [Google Scholar] [CrossRef]
  5. Nikora, V. Hydrodynamics of aquatic ecosystems: An interface between ecology, biomechanics and environmental fluid mechanics. River Res. Appl. 2010, 26, 367–384. [Google Scholar] [CrossRef]
  6. Nepf, H.M. Hydrodynamics of vegetated channels. J. Hydraul. Res. 2012, 50, 262–279. [Google Scholar] [CrossRef]
  7. Yang, J.Q.; Nepf, H.M. A turbulence-based bed-load transport model for bare and vegetated channels. Geophys. Res. Lett. 2018, 45, 10428–10436. [Google Scholar] [CrossRef]
  8. Shan, Y.; Zhao, T.; Liu, C.; Nepf, H. Turbulence and Bed Load Transport in Channels with Randomly Distributed Emergent Patches of Model Vegetation. Geophys. Res. Lett. 2020, 47, e2020GL087055. [Google Scholar] [CrossRef]
  9. Baptist, M.J. A flume experiment on sediment transport with flexible, submerged vegetation. In International Workshop on Riparian Forest Vegetated Channels: Hydraulic, Morphological and Ecological Aspects; RIPFOR: Trento, Italy, 2003. [Google Scholar]
  10. Tang, H.W.; Wang, H.; Liang, D.F.; Lv, S.Q.; Yan, L. Incipient motion of sediment in the presence of emergent rigid vegetation. J. Hydro-Environ. Res. 2013, 7, 202–208. [Google Scholar]
  11. Shahmohammadi, R.; Afzalimehr, H.; Sui, J. Impacts of turbulent flow over a channel bed with a vegetation patch on the incipient motion of sediment. Can. J. Civ. Eng. 2018, 45, 803–816. [Google Scholar] [CrossRef]
  12. Yager, E.M.; Schmeeckle, M.W. The influence of vegetation on turbulence and bed load transport. J. Geophys. Res. Earth Surf. 2013, 118, 1585–1601. [Google Scholar] [CrossRef]
  13. Wang, H.; Tang, H.W.; Zhao, H.Q.; Zhao, X.Y.; Lü, S.Q. Incipient motion of sediment in presence of submerged flexible vegetation. Water Sci. Eng. 2015, 8, 63–67. [Google Scholar] [CrossRef]
  14. Tabesh Mofrad, M.R.T.; Afzalimehr, H.; Parvizi, P.; Ahmad, S. Comparison of Velocity and Reynolds Stress Distributions in a Straight Rectangular Channel with Submerged and Emergent Vegetation. Water 2023, 15, 2435. [Google Scholar] [CrossRef]
  15. Specht, F.J.; Koll, K. Adaptation of bed-load transport formulas for vegetated banks. In Volume 2 “Model Application for Wetlands Hydrology and Hydraulics” of the Conference Wethydro; Center of Excellence in Wetland Hydrology: Bialistok, Poland, 2004. [Google Scholar]
  16. Anderson, B.G.; Rutherfurd, I.D.; Western, A.W. An analysis of the influence of riparian vegetation on the propagation of flood waves. Environ. Model. Softw. 2006, 21, 1290–1296. [Google Scholar] [CrossRef]
  17. Rutherfurd, I.; Anderson, B.; Ladson, A. Managing the effects of riparian vegetation on flooding. In Principles for Riparian Lands Management; Lovett, S., Price, P., Eds.; Land and Water Australia: Canberra, Australia, 2007; pp. 63–84. [Google Scholar]
  18. Clayton, J.A.; Pitlick, J. Spatial and temporal variations in bed load transport intensity in a gravel bed river bend. Water Resour. Res. 2007, 43, W02426. [Google Scholar] [CrossRef]
  19. Frings, R.M.; Kleinhans, M.G.; Vollmer, S. Discriminating between pore-filling load and bed-structure load: A new porosity-based method, exemplified for the river Rhine. Sedimentology 2008, 55, 1571–1593. [Google Scholar] [CrossRef]
  20. Dodangeh, E.; Afzalimehr, H. Incipient motion of sediment particles in the presence of bed forms under decelerating and accelerating flows. J. Hydrol. Hydromech. 2022, 70, 89–102. [Google Scholar] [CrossRef]
  21. Emmett, W.W. A Field Calibration of the Sediment-Trapping Characteristics of the Helley-Smith Bedload Sampler; U.S. Geological Survey Professional Paper 1139; U.S. Government Printing Office: Washington, DC, USA, 1979. [Google Scholar]
  22. Bridge, J.S.; Gabel, S.L. Flow and sediment dynamics in a low sinuosity, braided river: Calamus River, Nebraska Sandhills. Sedimentology 1992, 39, 125–142. [Google Scholar] [CrossRef]
  23. Ghani, A.A.; Ariffin, J.; Azazizakaria, N.; Shukriyahya, A.; Abdul-Talib, S. Error introduced in measurements of bed load transport. In Advances in Hydraulics and Water Engineering, Proceedings of the 13th IAHR–APD Congress, Singapore, 6–8 August 2002; Imperial College Press: London, UK, 2002; pp. 195–198. [Google Scholar]
  24. Bunte, K.; Swingle, K.W.; Ettema, R.; Abt, S.R.; Cenderelli, D.A. Bedload traps and Helley-Smith Sampler Collect Different Rates and Particle Sizes of Gravel Bedload. In Proceedings of the SEDHYD 2019, 11th Federal Interagency Sedimentation and 6th Hydrologic Modeling Conference, Reno, NV, USA, 24–28 June 2019. [Google Scholar]
  25. Gaudet, J.M.; Roy, A.G.; Best, J.L. Effect of orientation and size of Helley-Smith sampler on its efficiency. J. Hydraul. Eng. 1994, 120, 758–766. [Google Scholar] [CrossRef]
  26. Bonilla-Porras, J.A.; Armanini, A.; Crosato, A. Extended Einstein’s parameters to include vegetation in existing bedload predictors. Adv. Water Resour. 2021, 152, 103928. [Google Scholar] [CrossRef]
  27. Jordanova, A.A.; James, C.S. Experimental study of bed load transport through emergent vegetation. J. Hydraul. Eng. 2003, 129, 474–478. [Google Scholar] [CrossRef]
  28. Kothyari, U.C.; Hashimoto, H.; Hayashi, K. Effect of tall vegetation on sediment transport by channel flows. J. Hydraul. Res. 2009, 47, 700–710. [Google Scholar] [CrossRef]
  29. Afzalimehr, H.; Rennie, C.D. Determination of bed shear stress in gravel-bed rivers using boundary-layer parameters. Hydrol. Sci. J. 2009, 54, 147–159. [Google Scholar] [CrossRef]
  30. Church, M. Bed material transport and the morphology of alluvial river channels. Annu. Rev. Earth Planet. Sci. 2006, 34, 325–354. [Google Scholar] [CrossRef]
  31. Zhao, T.; Nepf, H.M. Turbulence dictates bedload transport in vegetated channels without dependence on stem diameter and arrangement. Geophys. Res. Lett. 2021, 48, e2021GL095316. [Google Scholar] [CrossRef]
  32. Mueller, E.R.; Pitlick, J.; Nelson, J.M. Variation in the reference Shields stress for bed load transport in gravel-bed streams and rivers. Water Res. 2005, 41, W04006. [Google Scholar] [CrossRef]
  33. Fenton, J.D.; Abbott, J.E. Initial movement of grains on a stream bed: The effect of relative protrusion. Proc. R. Soc. Lond. A Math. Phys. Sci. 1977, 352, 523–537. [Google Scholar]
  34. Lamb, M.P.; Dietrich, W.E.; Sklar, L.S. A model for fluvial bedrock incision by impacting suspended and bed load sediment. AGU J. Geophys. Res. 2008, 113, F03025. [Google Scholar] [CrossRef]
  35. Afzalimehr, H.; Dey, S.; Rasoulianfar, P. Influence of decelerating flow on incipient motion of a gravel-bed stream. Sadhana 2007, 32, 545–559. [Google Scholar] [CrossRef]
  36. Motamedi, A.; Afzalimehr, H.; Singh, V.J. Evaluation of a novel approach to determine the critical Shields stress. J. Hydrol. Eng. ASCE 2010, 15, 892–900. [Google Scholar] [CrossRef]
Figure 1. (a) Location of the study area on Google Maps. (b) Study reaches along the Taleghan River as seen on Google Maps. (c,d) Vegetation along the Taleghan River within the study area (Gouran reach). (e) Close-up view of the riverbank vegetation. (f) Propeller-type mechanical current meter; (g) Helley-Smith bed load sampler used in the field and laboratory data collecting.
Water 17 01758 g001
Figure 2. Granulation curves of the particles in the riverbed of the Pol-Vashteh reach compared to the granulation curve of sediment particles used in the laboratory channel.
Water 17 01758 g002
Figure 3. A view of the laboratory flume used in this research.
Water 17 01758 g003
Figure 4. A view of the flume bed prepared with vegetation on one sidewall of the flume and the locations for measuring flow velocities and bed load.
Water 17 01758 g004
Figure 5. Velocity profiles at different CSs of the river.
Water 17 01758 g005
Figure 6. Representative velocity profiles measured in the laboratory flume.
Water 17 01758 g006
Figure 7. The bed shear stress distribution diagrams at different CSs.
Water 17 01758 g007
Figure 8. The Shields parameter and bed load transport at some CSs of the river.
Water 17 01758 g008
Figure 9. Changes in Shields parameter versus bed load transport of experiments.
Water 17 01758 g009
Figure 10. The CS profiles of the Taleghan River and the variations in bed load values.
Water 17 01758 g010
Table 1. Specifications of selected reaches in the river.
Name of River Reach Name of Cross-Section D50 (mm)d50
(mm)
h (m)A
(m2)
T (m)d50/hT/h
Pol-VashtehP1196.40.397.1518.00.04846.15
P2196.00.306.3521.00.06370.00
P3195.80.285.5820.00.06871.42
GouranG14211.10.281.977.00.15025.00
G24210.20.292.338.00.14427.58
G3428.10.373.319.00.11624.32
Table 2. Conditions of the experimental runs.
Experiments RunVegetated Flume SideBed MaterialDischarge (L/s)
IYesFine sand23
IIYesFine sand45
IIIYesVery fine gravel45
IVNoVery fine gravel45
Table 3. Characteristics of sediment particles used in the laboratory experiments.
Particle Group ClassificationD (mm)d16 (mm)d50 (mm)d84 (mm)d90 (mm)σg
fine sand0.180.190.240.410.501.46
Very fine gravel0.181.602.103.103.401.39
Table 4. The bed load rate at CS-1 of Pol Vashte reach (P1).
Distance From Left BankSampling Duration (s)Repetitions NumberDepth (cm)Sample Dry Weight (gr)Sample Dry Weight (gr/s)Sample Dry Weight (gr/s.m)
0000000
1.01205404253.5446.47
3.01205462101.7522.96
4.51205421551.2916.95
7.01205472351.9525.69
9.01205391050.87511.48
11.01205421501.2516.40
13.51205431901.5820.77
15.0120540900.759.84
17.0120538700.587.65
18.0000000
Table 5. Hydraulic and morphological characteristics of the flow in the river.
Reach NameCS UeqUmaxQqQsqsFrRe × 105τ τ *
P10.560.8923.6730.20415.400.850.261.315.780.0198
Pol-VashtehP20.961.7335.8550.27823.241.110.531.8227.930.0771
P31.121.6755.650.28227.541.370.621.7927.340.0791
G10.6320.9730.9610.1375.660.810.290.913.640.0227
GouranG20.8841.251.8070.2257.930.990.421.3615.440.039
G30.8001.222.2060.2458.030.890.351.5714.720.0482
Table 6. Characteristics of sediment particles that make up the riverbed.
Reach Name d 16 (mm) d 50 (mm) d 84 (mm) d 90 (mm) σ g
Pol-Vashteh13.519.028.028.81.44
Gouran192838451.41
Table 7. Local and equivalent bed shear stress (τLocal) of the laboratory experiments.
Test NumberCS NumberAxis-AAxis-BAxis-C τ e q
10.6961.5211.441.26
Series I20.9611.6811.5211.38
31.0761.2962.0251.43
11.665.923.964.16
Series II21.374.483.023.16
33.024.355.184.11
14.627.225.925.56
Series III25.047.227.396.32
34.98.17.746.81
15.046.246.085.38
Series IV25.276.245.925.34
35.476.567.065.94
Disclaimer/Publisher’s Note: The statements, opinions and data contained in all publications are solely those of the individual author(s) and contributor(s) and not of MDPI and/or the editor(s). MDPI and/or the editor(s) disclaim responsibility for any injury to people or property resulting from any ideas, methods, instructions or products referred to in the content.

