Article

Multi-Criteria Decision Making: Sustainable Water Desalination

1
Faculty of Engineering and Physical Sciences, University of Southampton, Southampton SO17 1BJ, UK
2
Chemical Engineering Department, King Khalid University, P.O. Box 394, Abha 61411, Saudi Arabia
*
Author to whom correspondence should be addressed.
Water 2025, 17(12), 1729; https://doi.org/10.3390/w17121729
Submission received: 28 April 2025 / Revised: 29 May 2025 / Accepted: 4 June 2025 / Published: 7 June 2025
(This article belongs to the Special Issue Novel Methods in Wastewater and Stormwater Treatment)

Abstract

With an increasingly more urbanised global population, surface water and groundwater resources are being/have become outpaced by growing demand. The oceans could address this pertinent scarcity issue, once their high-salinity content is removed. Water desalination could thus be a crucial pathway towards addressing global water scarcity. However, conventional desalination is known to be highly energy-intensive, with limited scalability and potentially significant negative environmental impacts. Multi-criteria Decision Making (MCDM) presents a novel approach towards sustainable water desalination based on sustainability-related criteria. The Fuzzy Analytical Hierarchy Process (FAHP) was implemented to determine the most optimal small-scale, modularised, and remote reverse osmosis (RO) desalination plant configurations. Twelve configurations were assessed, based on four plant capacities (50, 100, 150, and 200 m3/day) and three diesel-to-solar photovoltaic energy configurations (100–0%, 75–25%, and 60–40%). The hybridised diesel-to-solar configurations were generally ranked higher, particularly when less reliant on diesel, and at small(er) capacities, in terms of the criteria: sustainability, overall efficiency, and standalone potential while maintaining competitive costs. This can likely be attributed to their relatively lower fuel and energy consumption and associated costs. Further research should aim to consider additional criteria, such as battery cost, as well as life cycle assessments that include transportation-related costs/emissions.

1. Introduction

As the global human population continues to grow and becomes increasingly more urbanised, groundwater and surface water resources are close to becoming/have become outpaced by demand in many regions [1,2,3]. Presently, over 780 million people globally do not have (easy) access to clean, safe drinking water [3,4]. This can have severely negative impacts upon the holistic development of a country/region, in areas such as (but not limited to) economic growth, education, infrastructure, social justice, and responsible resource consumption/utilisation [2,5,6]. The oceans (~97% of the planet’s available water) could be the key towards addressing water scarcity, but only if the high salinity is addressed (i.e., the brine is extracted). Water desalination is a process in which brine is extracted from seawater/brackish water, thereby broadening freshwater availability that can also be utilised for various other purposes, such as agriculture [2,3,7].
Approximately half of all conventional desalination units in the world (totalling at >15,000, with a total daily freshwater production rate of ~70 million m3) are in the Middle East, largely due to its being one of the most water-scarce regions in the world [2,3,6]. Thermal and electrical separation are the primary industrial methods for water desalination [7]. In thermal separation, such as multi-stage flash (MSF) and multi-effect distillation (MED), high temperature steam vaporises the water, leaving behind the brine (and waste) [7,8]. In contrast, the latter involves utilising high pressure generated via pressurised water sent through series of membranes [7,8]. Reverse osmosis (RO), an electrical-based technology, dominates the desalination market, with ≥60% of desalination plants using RO [2,7,8]. Seawater-derived RO is comparatively less energy-intensive than MED at 3–6 kW/m3 vs. 3–22 kW/m3, though this is dependent on the thermal separation method, salinity, and total capacity [8]. Table 1 shows the desalination water costs, which were obtained using a modified version of [9].
On the other hand, in comparison to groundwater pumping, using RO to derive desalinated water is far more costly at USD 0.49–2.89 per m3 [10]. The key issues associated with desalination are energy costs and the disposal of brine waste. According to the IEA, desalination accounted for 5% of the Middle East’s total energy consumption in 2016, while only generating 3% of the region’s water supply [10]. Figure 1 illustrates that ~41% of total costs can be attributed to the energy demands required to generate the necessary temperatures and pressures for desalination, which can also have severe adverse environmental effects [11]. A total of 200 kWh/day is consumed globally by desalination plants, with a ratio of 3–10 kWh to 1 m3 of desalinated water (<1 kWh for conventional drinking water) [11,12]. Up to 99% of the total energy demand is derived from fossil fuels [13].
Desalination plants must therefore transition towards (green) sustainability, which could be achieved with process intensification and modularisation using stranded renewable energy sources, such as wind and solar, especially in water-scarce regions [3,6,14]. Smaller, modularised plants are more cost-effective overall than downsizing existing large-capacity plants, especially in conjunction with process intensification (i.e., improvements in overall efficiency, reduced overall costs, and better water quality). RO systems are optimised towards smaller, modularised plants, as they have an adaptable and easily maintainable modular membrane design, though this requires further design development [11,14]. That said, such systems are highly geared towards process intensification for various additional reasons, especially due to developments in recent decades: low energy intensity, high efficiency, low capital costs, and high selectivity/permeability regarding transportation components [15].
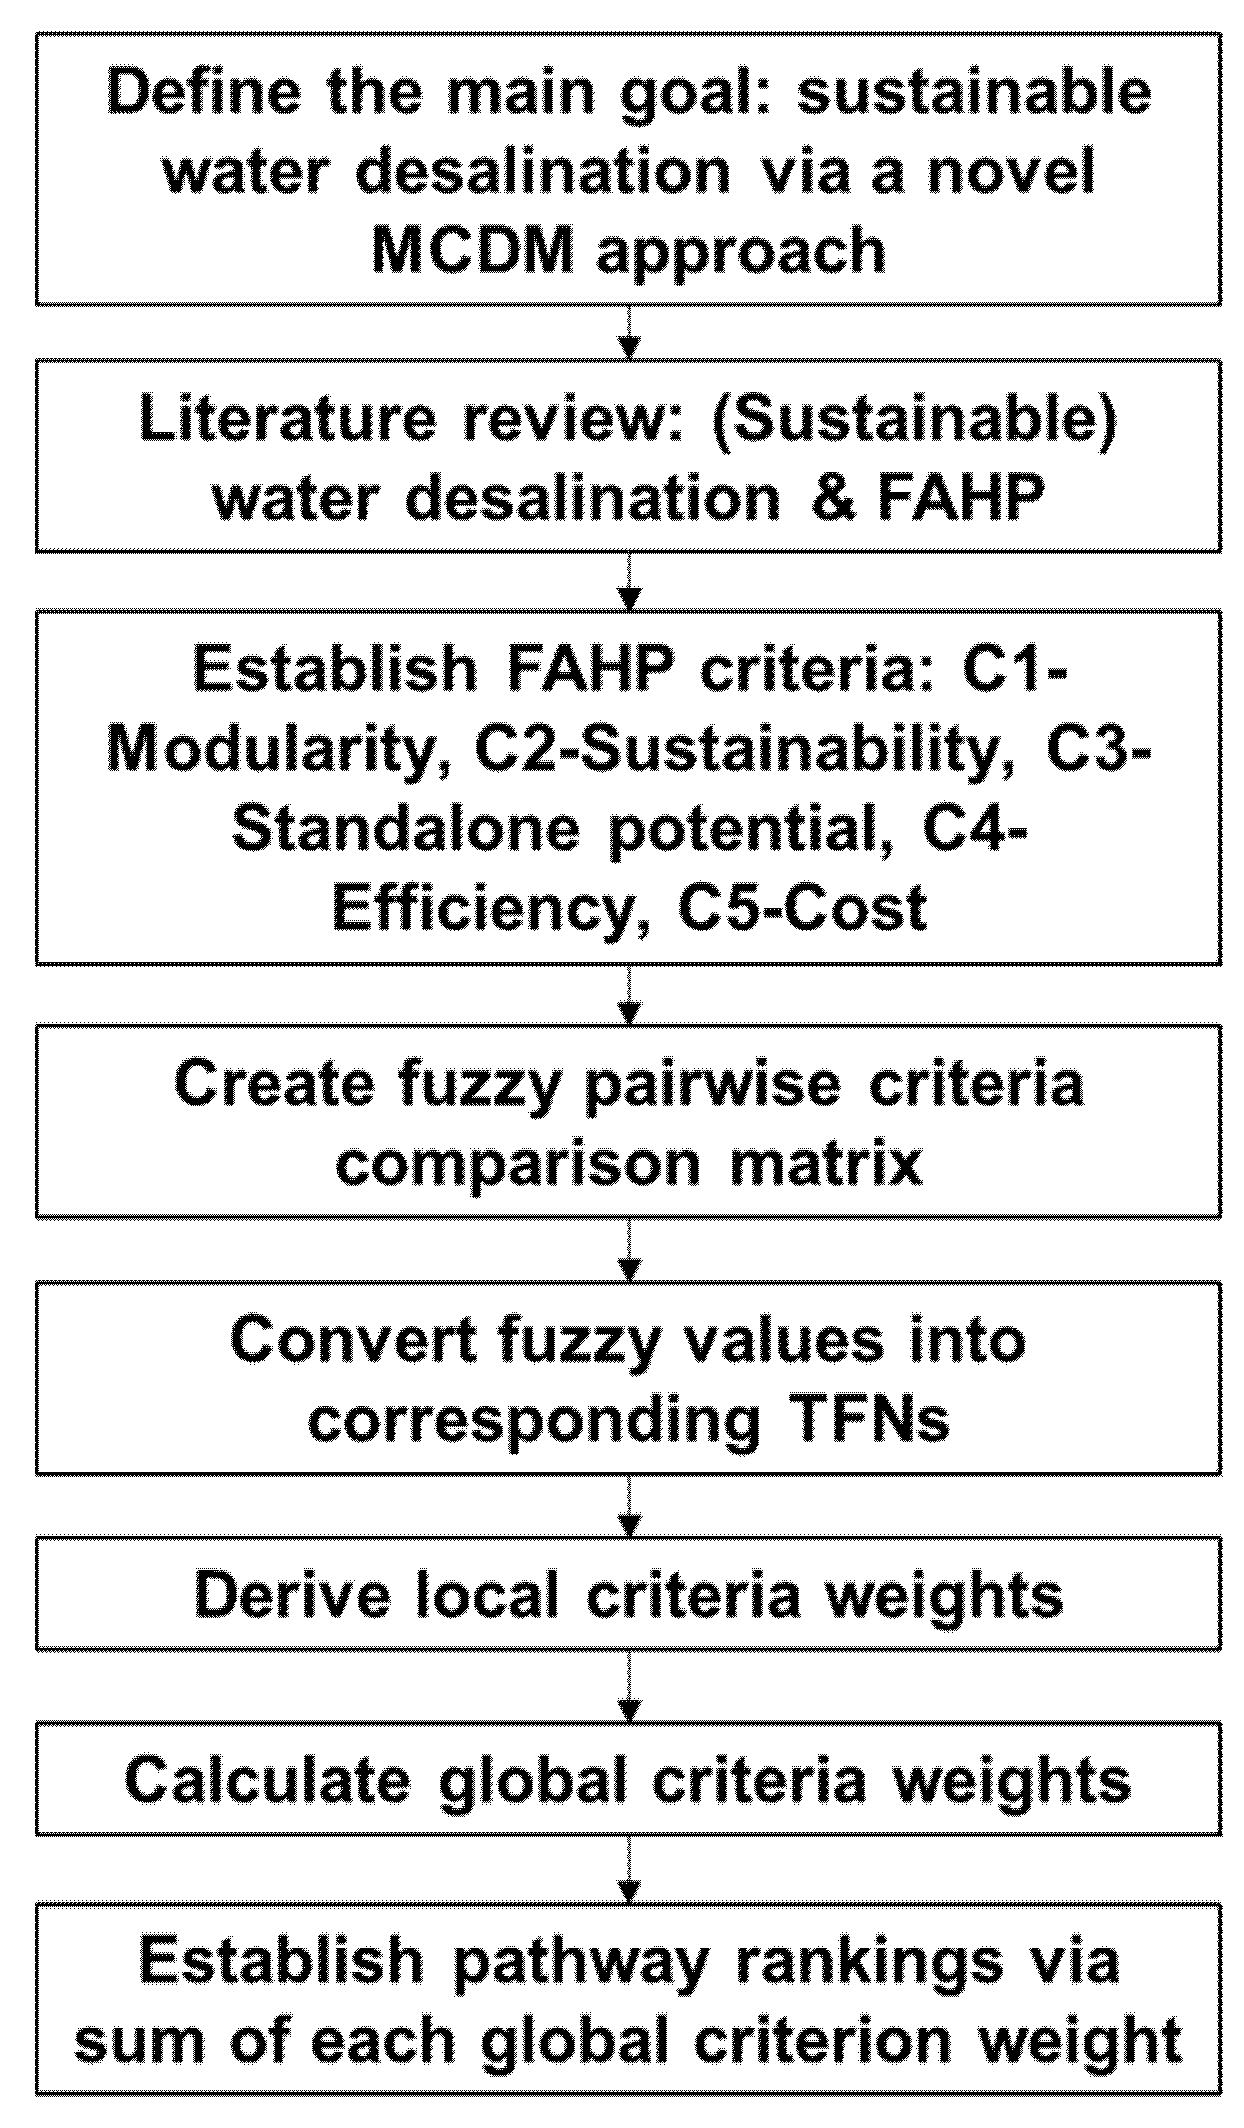
Multi-criteria Decision Making (MCDM) could be the key towards incorporating and/or improving the sustainability of small-scale desalination processes. MCDM enables a novel approach towards the selection of the most optimal small-scale RO desalination pathway(s), based on (green) sustainability-related criteria, which encompasses sustainable water desalination (Figure 2). Section 2 details a case study regarding a relatively small-scale (i.e., community-scale) RO desalination and water treatment plant system in Sohar, Oman. The Analytical Hierarchy Process (AHP) was selected as the MCDM methodology because it is highly adaptable, easy to use, and presents a clear hierarchical structure. A Fuzzy Analytical Hierarchy Process (FAHP) framework was developed and implemented to determine the most optimal sustainable desalination configuration pathway(s), based on the quantitative and qualitative data of various capacities and diesel-to-solar energy mixes. The FAHP framework seeks to illustrate that the most sustainable pathway(s) overall can be identified and selected via MCDM, while also meeting population and industry demands (e.g., cost).

2. Materials and Methods

The standard plant configuration is single-pass RO with continuous operation, based in Sohar, Oman. Improved recovery was achieved via small-unit recirculation of reject water, though this was not modelled in the case study. The desalination process design and modelling insights were obtained from [16]. Whenever and wherever possible, water sample information was acquired from numerous sources for the Gulf of Oman. If this was not possible, the Persian Gulf served as an appropriate substitute, due to its relative proximity. Appendix A lists the key parameters for designing RO systems, Omani drinking water quality standards, and the recommended limits regarding design for conventional desalination via surface seawater [17,18,19]. The model design accounted for seasonal-based variations, particularly the maximum range values, in water characteristics and their effects on RO systems [18]. Smaller units can improve recovery via reject water recirculation; however, this was not modelled for this study.
Water flux, the most essential design characteristic, is dependent upon the source(s) and quality of feed water, which in turn affect the risk of membrane fouling [18,20,21,22]. Therefore, membrane characteristics must be designed to address fouling, for the sake of reliable, long-term (membrane) performance and integrity in sustainable desalination [21,22]. Water Application Value Engine (WAVE) and Desalination Economic Evaluation Program (DEEP) software were optimised to assess relatively small-scale desalination plants, with an assumed 24 h/day operation (daily rates) for modelling consistency. Additionally, model plant life was set to 20 years, with an annual availability of 90% based on the literature findings [16,18,21,22].
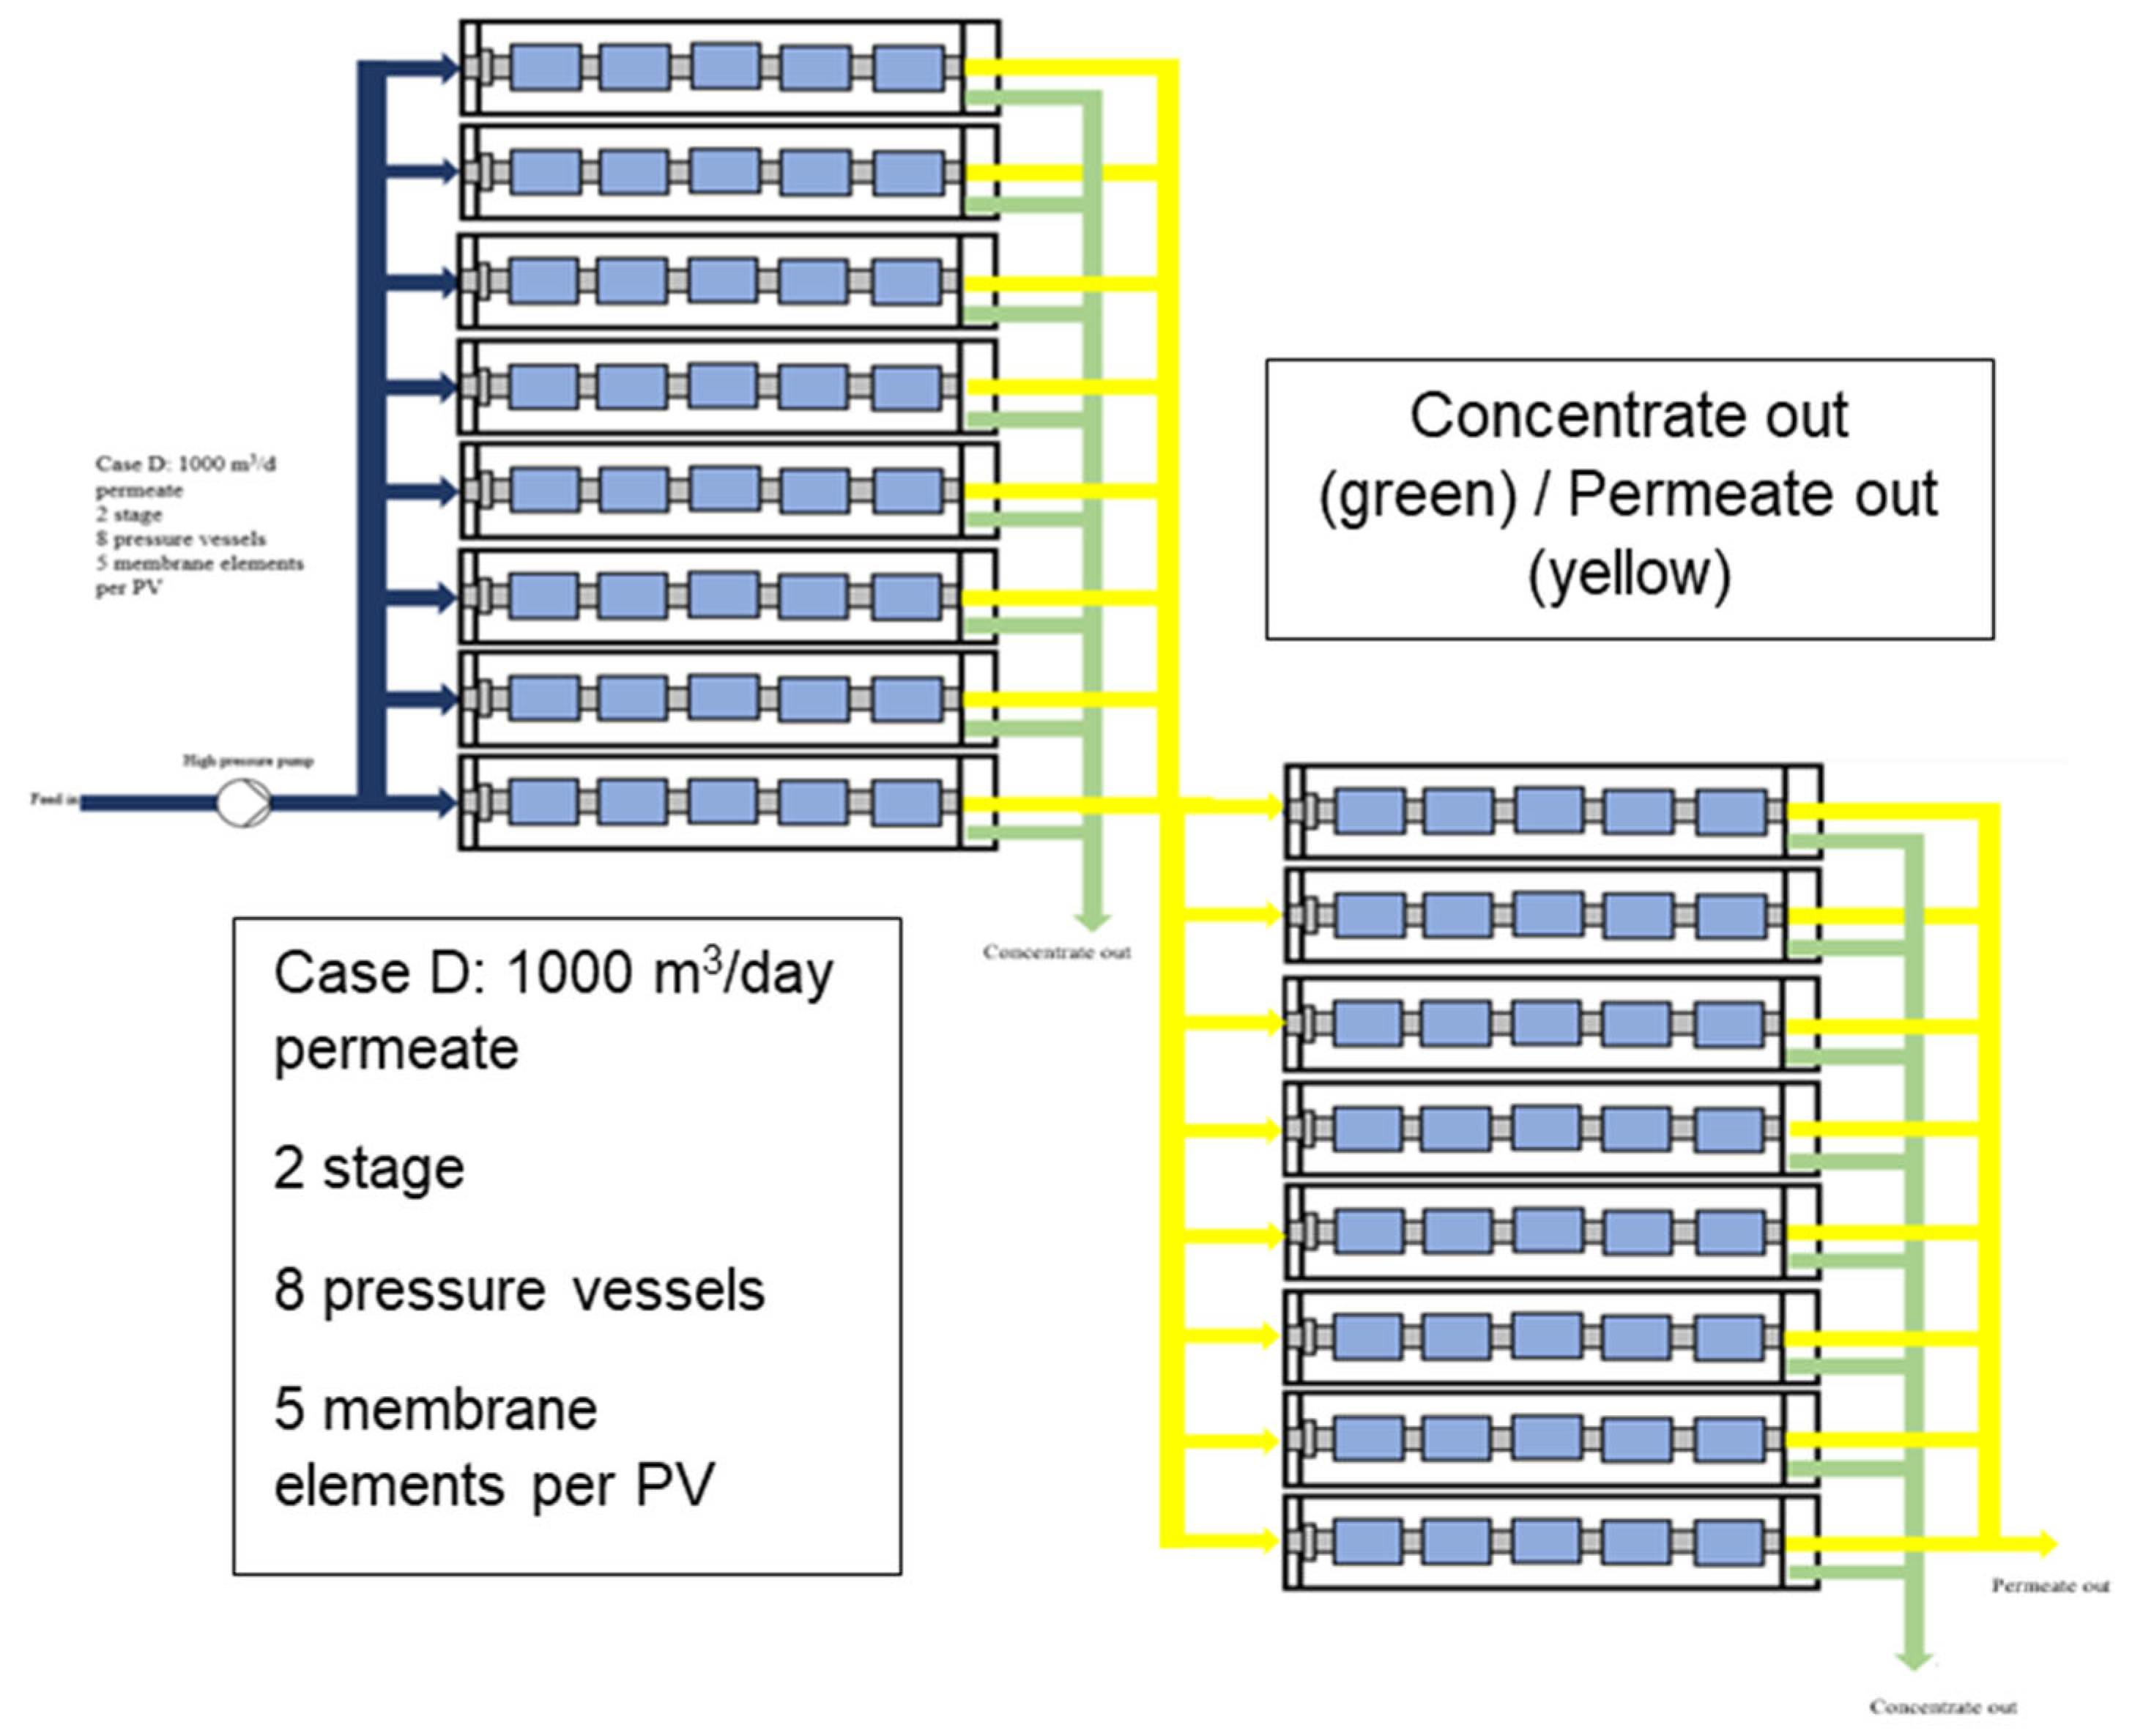
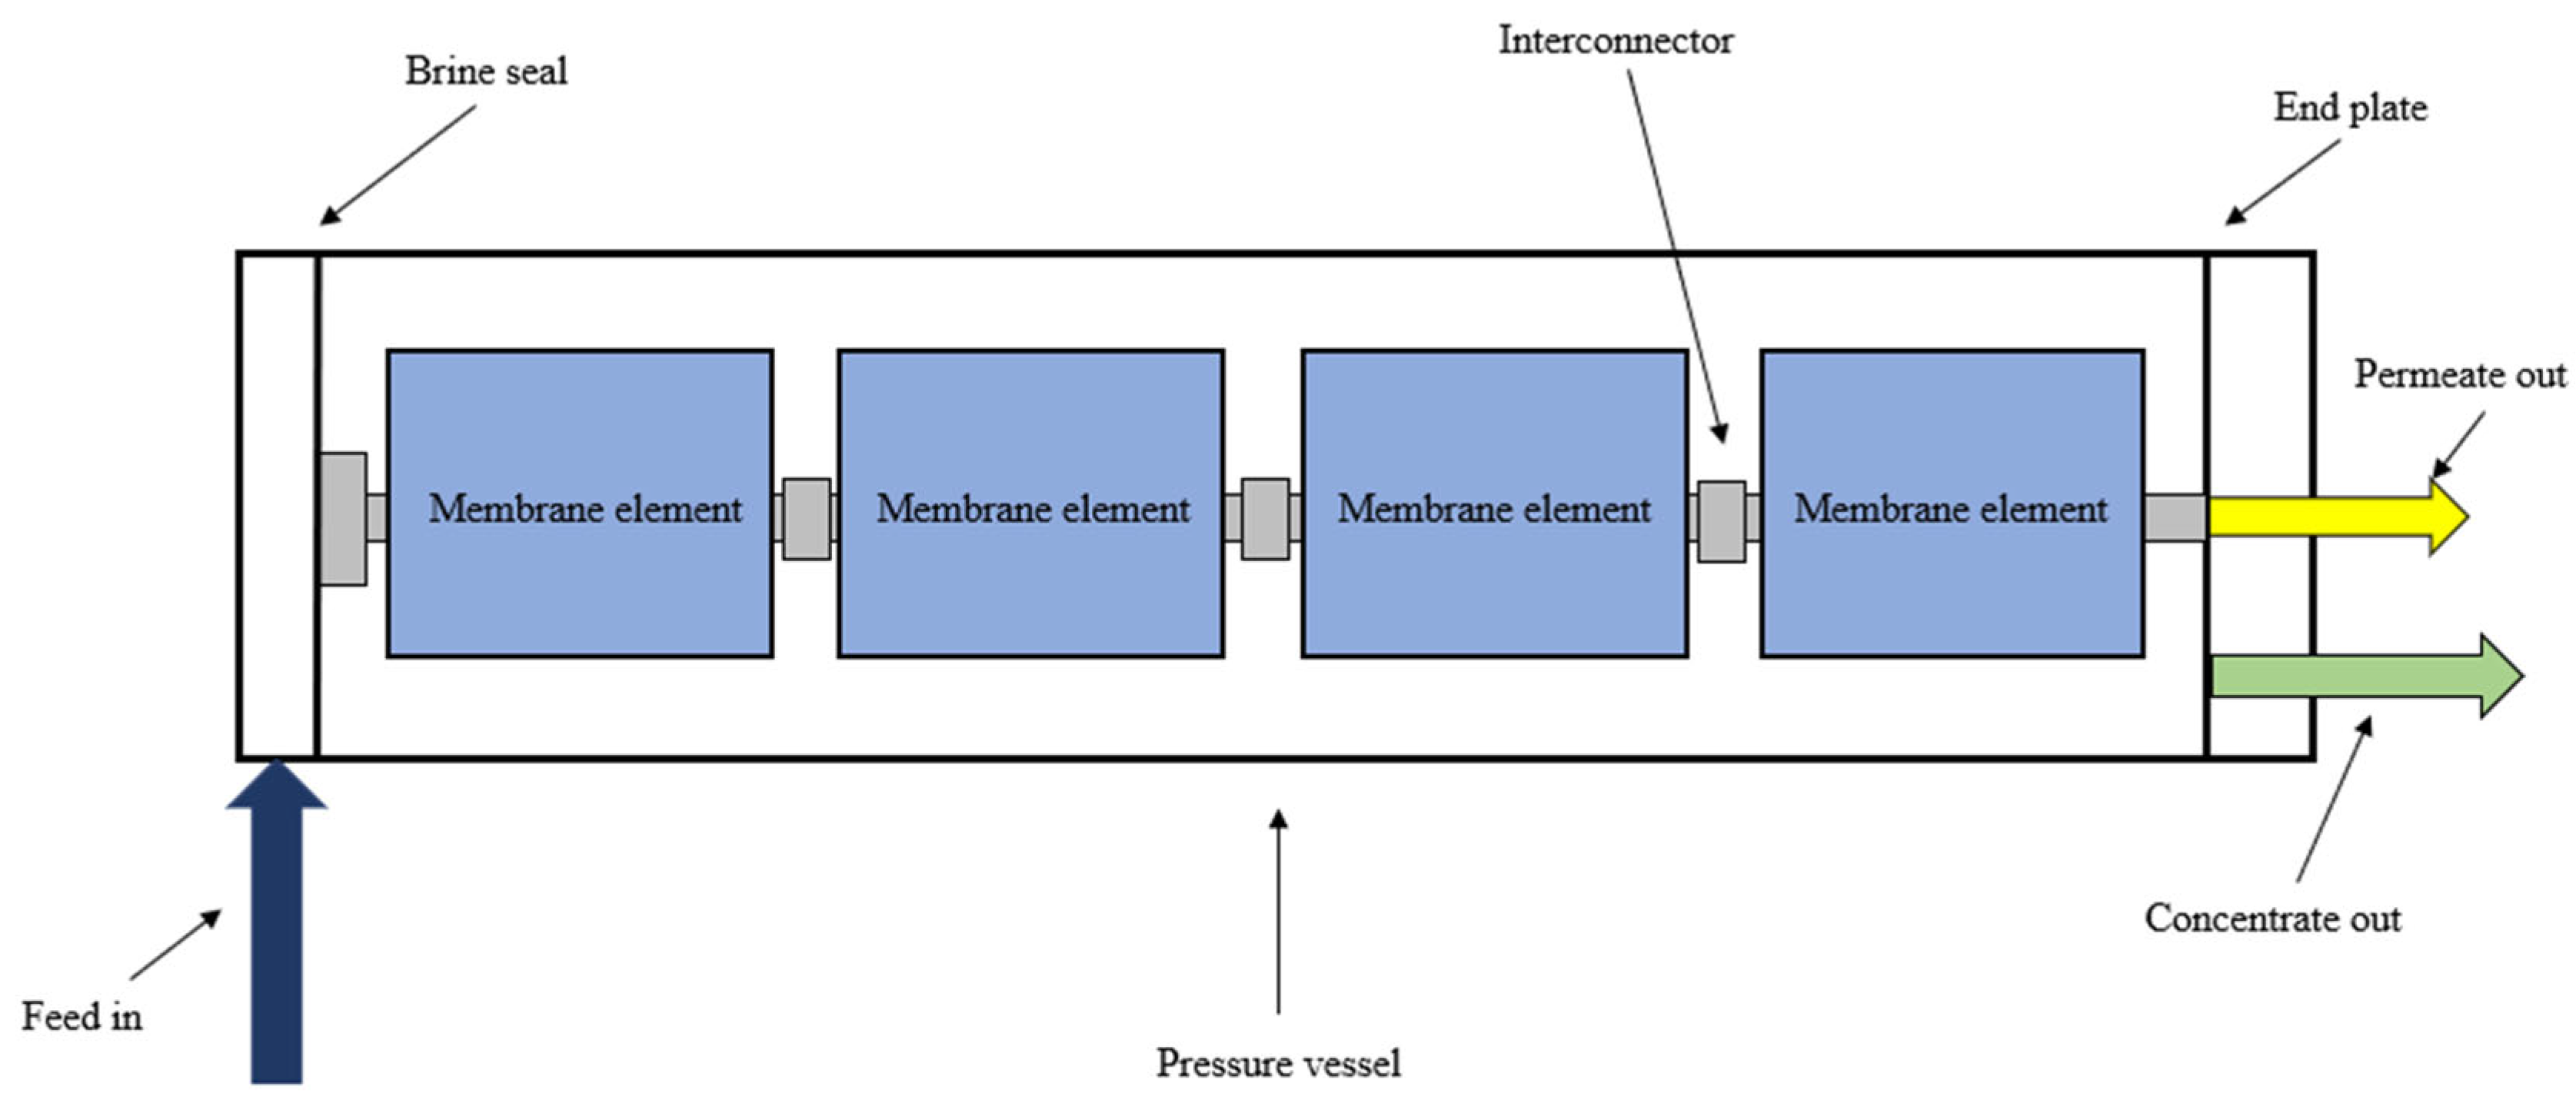
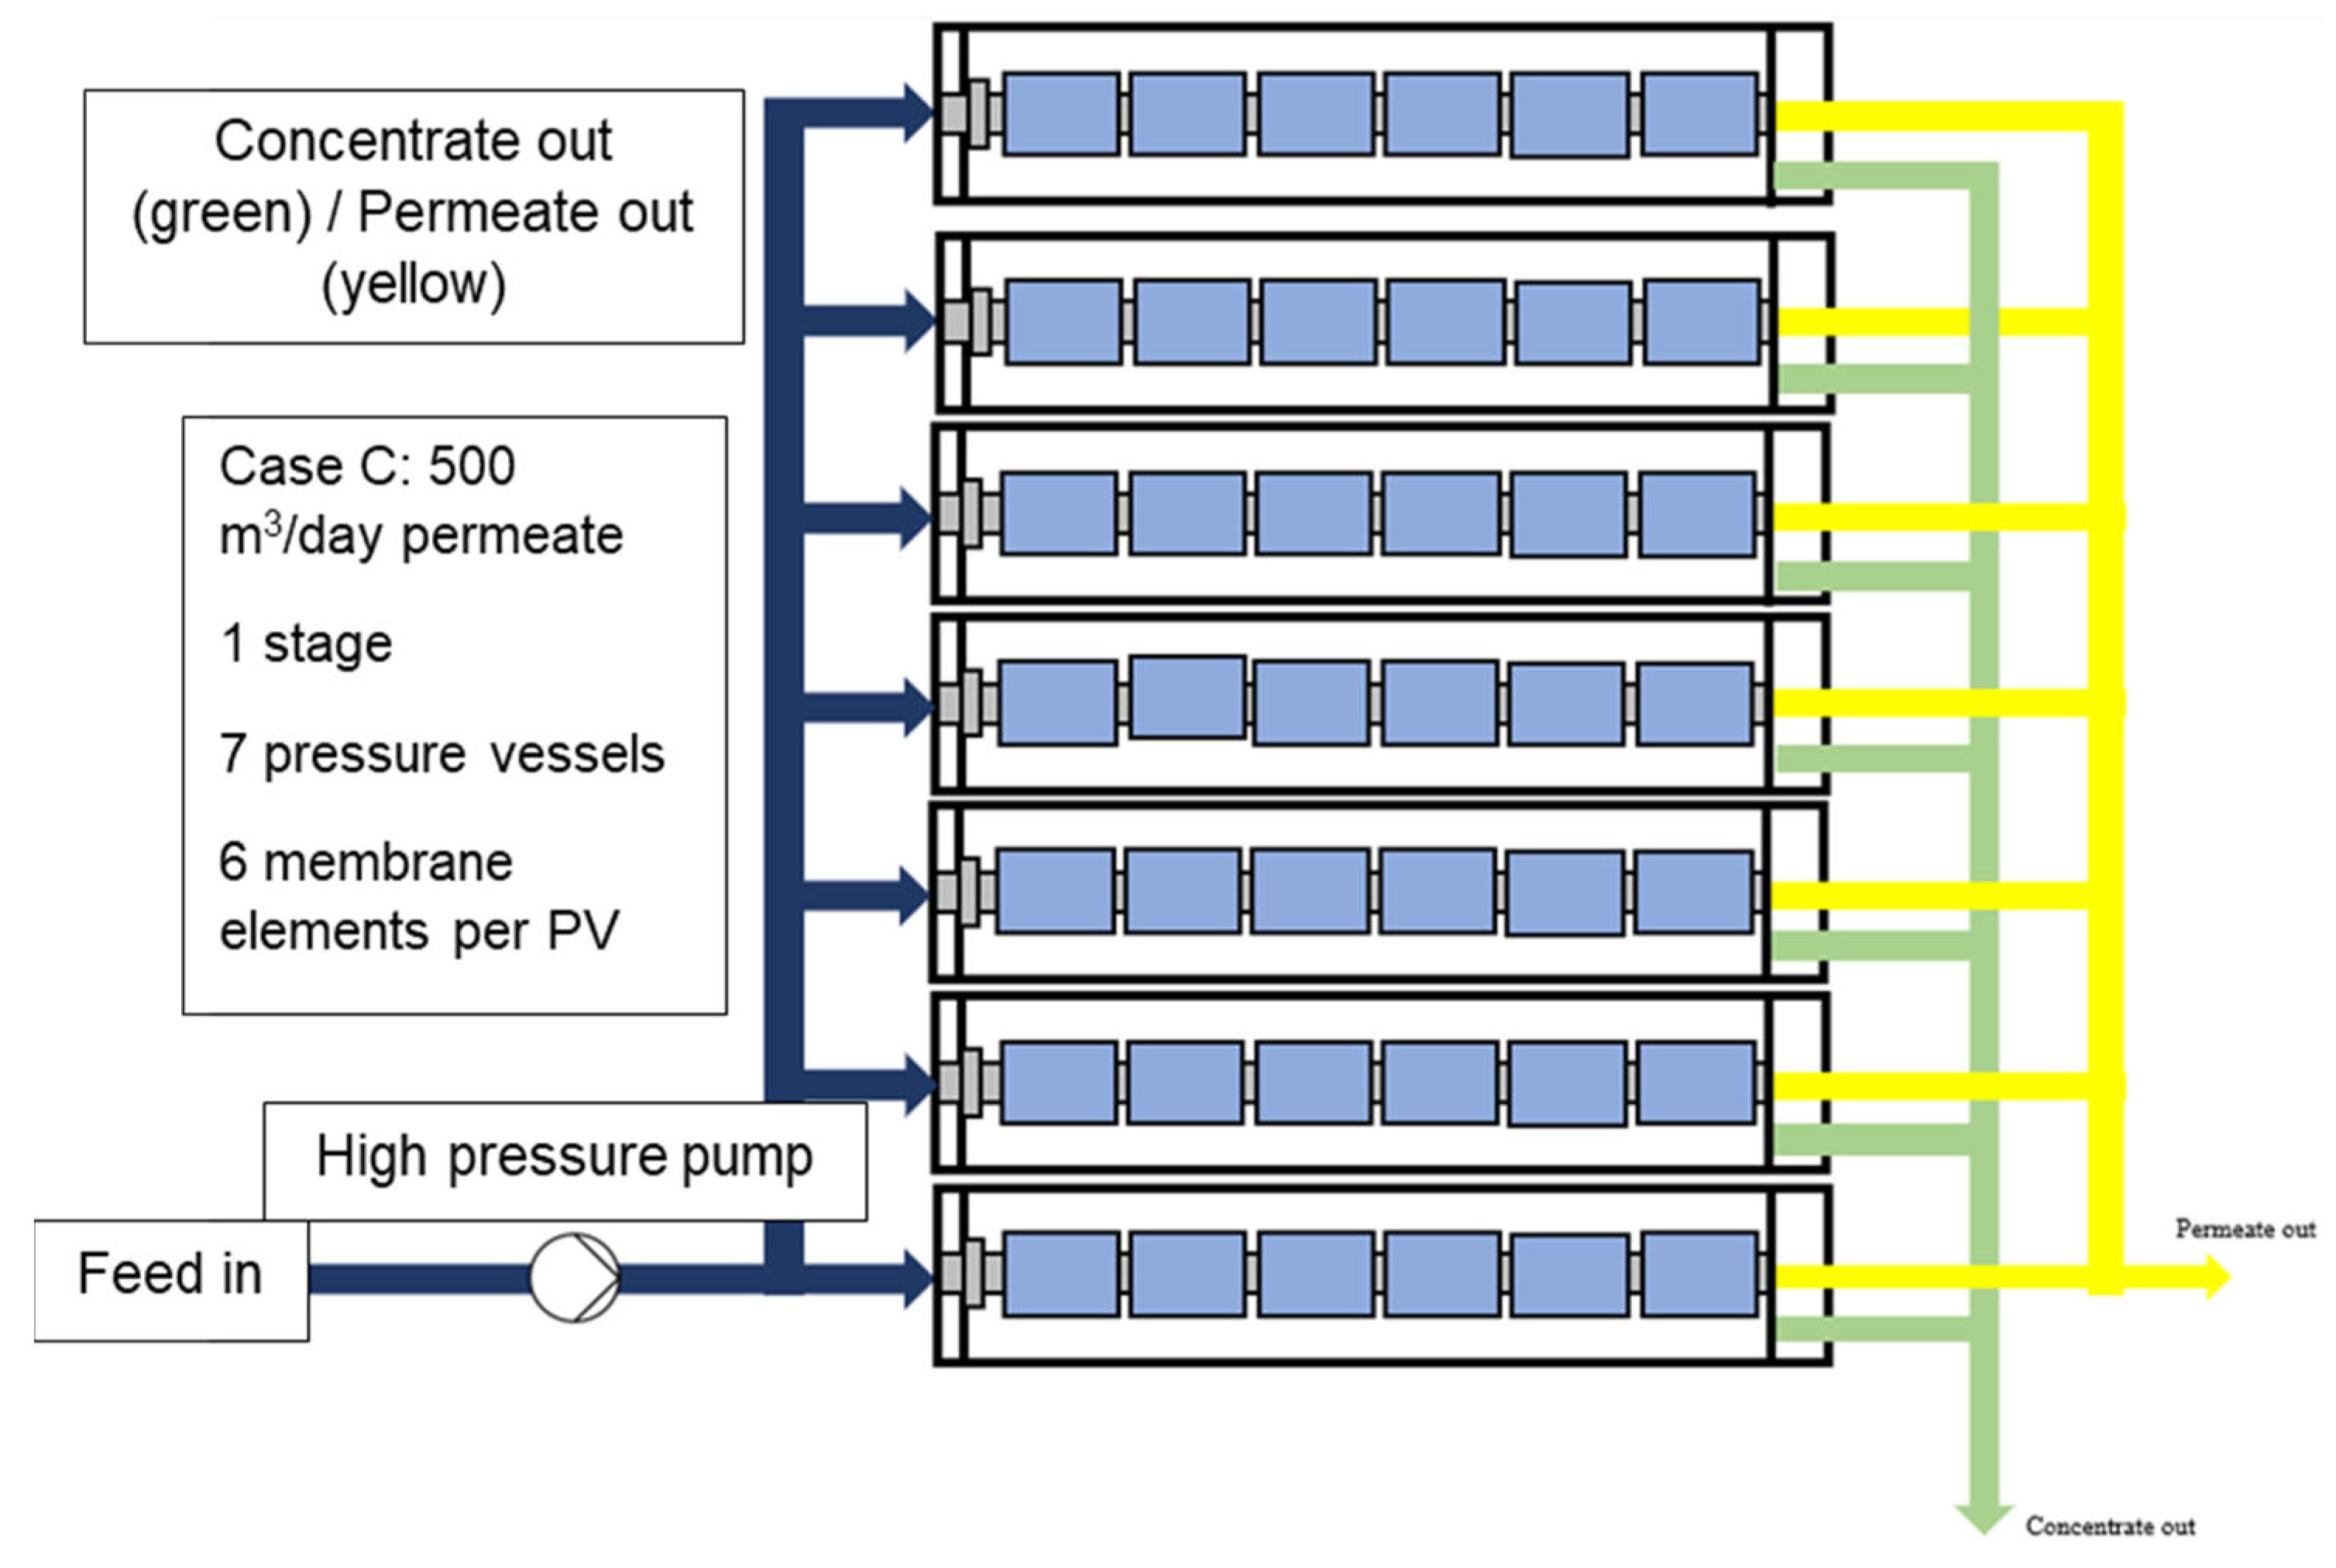
WAVE, developed by Dupont Water Solutions, is a popular software platform for modelling advanced desalination and water treatment technologies [23,24,25,26]. Four cases were optimised—each at 50, 200, 500, and 1000 m3/day (Table 2)—with the full parameter details listed in Appendix B. A conservative-to-typical flux rate range of 7–8.6 GFD was selected, while total energy use (kWh/m3 of product water) and USD price were minimised via adjustments to the following characteristics: pressure vessels per stage, membrane type, number of membrane stages, and membrane elements per pressure vessel. Figure 3 shows the typical detailed design for an RO train [27], which the study uses as the proposed RO design for the study. The default operating costs were selected (0.14 USD/m3 and 0.69 USD/m3), while electricity costs were adjusted to values in Oman, circa September 2022 [28]. Each case has an assumed recovery of 75.4% that was used to calculate the input flow rates. Figure 4 shows the configuration for Case A, with B–D in Appendix C.
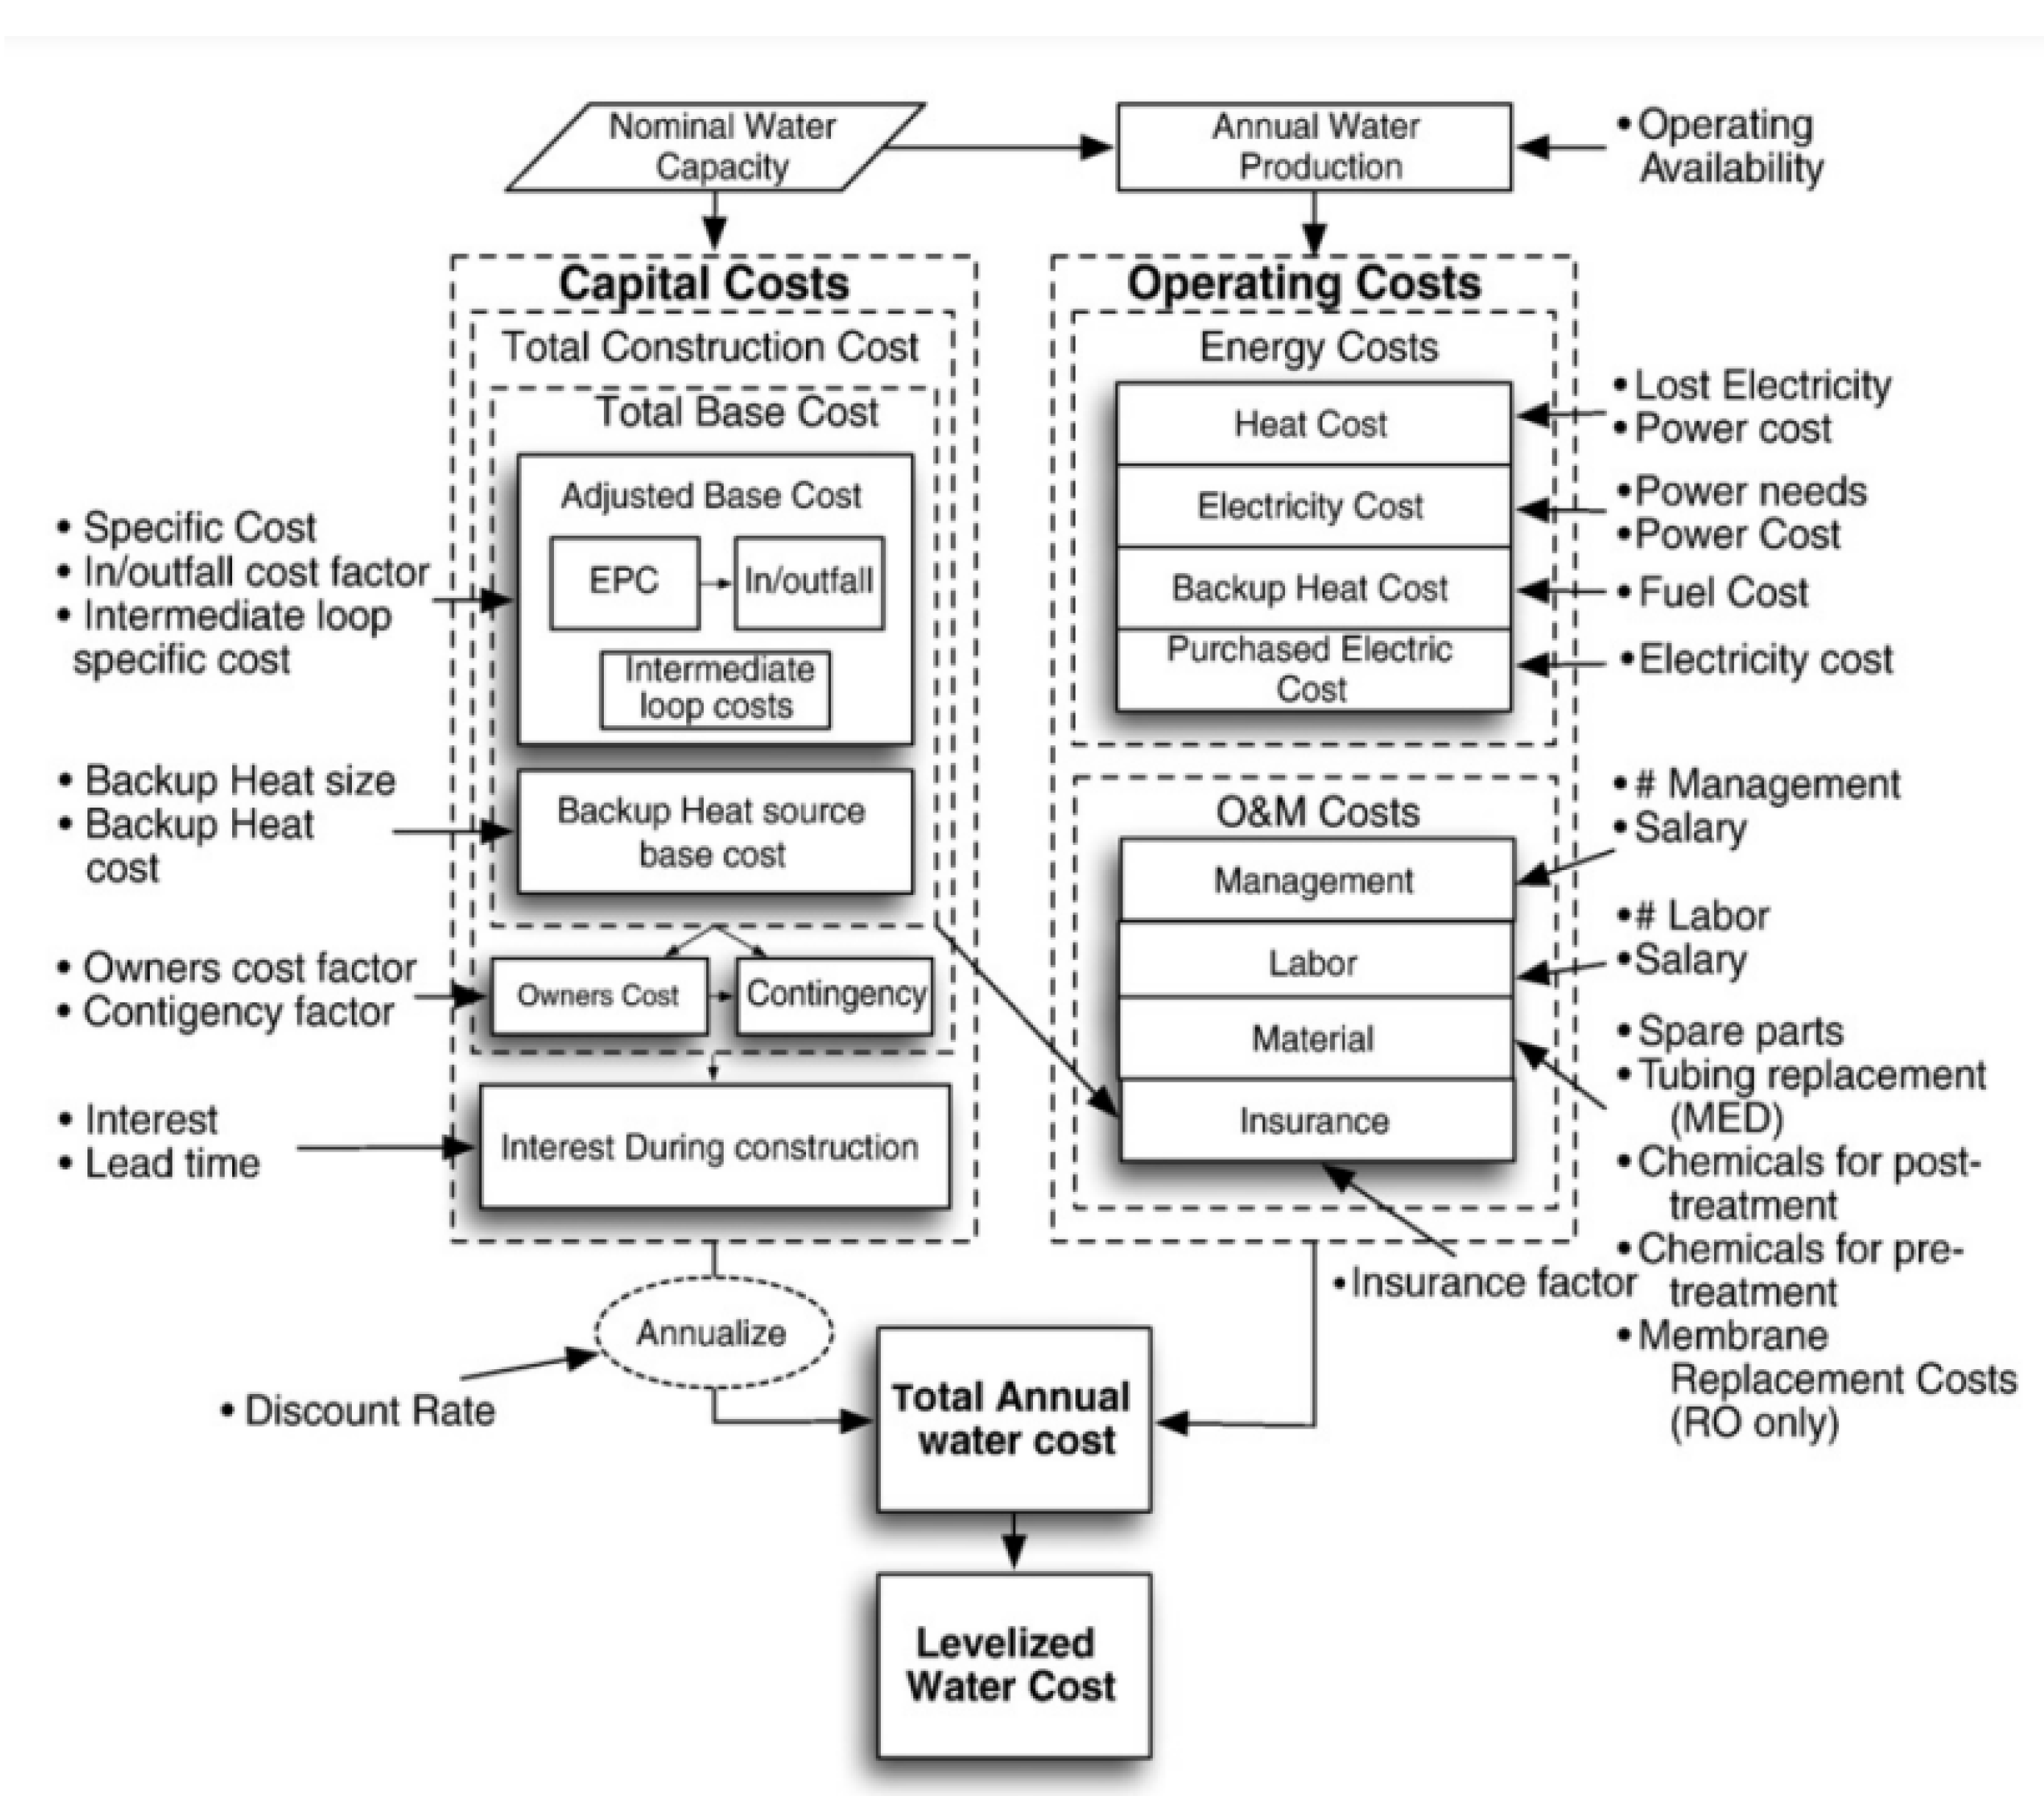
In contrast to WAVE, DEEP is a relatively more complex desalination modelling software platform that utilises Excel, developed by the International Atomic Energy Agency (IAEA) to highlight the potential of nuclear-powered desalination. DEEP was capable of modelling various electrical- and thermal-based desalination designs that run on alternative energy sources, including but not limited to renewables and/or nuclear power. DEEP could also generate high(er)-level economic information (and sensitivity analysis) via changes in input data, salinity, energy type(s), and plant capacity. Annual specific water cost (SWC), one of the key parameters, combined the operation and maintenance (O&M) costs with annual capital costs. DEEP has energy options for grid-connected renewables, though they were not intuitive to the model, even when using the v5.1 manual. Instead, the power type was simply set to combined cycle gas, without the utilisation of financial data (e.g., operating costs) via the outputs. Figure 5 summarises the economic evaluation capabilities and methodology of DEEP [29]. For the MCDM framework, the FAHP was utilised via Excel and MATLAB v24.1 to establish criteria weightings and subsequently rank twelve potential pathways for relatively small-scale, modular sustainable water desalination (Table 3).
A linguistic-based fuzzy pairwise comparison matrix was created to derive quantitative and qualitative criteria weightings in MATLAB v24.1, from the following criteria that encompass sustainability: C1—modularity, C2—sustainability, C3—standalone potential, C4—efficiency, and C5—cost (Figure 6). The FAHP framework was modified from Clara Bartram’s AHP analysis of sustainable water desalination in Oman. The FAHP included the capability of using linguistic “fuzzy” variables for non-numerical (i.e., qualitative) data in MCDM, as opposed to the standard AHP, so long as they were converted into their corresponding TFNs via Equation (1) (Table 4) [30]. The consistency ratio (CR) was calculated to be acceptable at 0.039 < 0.1 [31,32,33]. Local weights for each pathway were derived via a fuzzy pairwise comparison matrix as per the criterion in Excel. Local criteria weights (Table 5) were multiplied by the local matrix weights to generate the global weights (Table 6). The sum of the global weights for each pathway determined its ranking, with a greater sum value denoting a higher ranking.
a = a 1 + 4 a 2 + a 3 6

3. Results

3.1. WAVE and DEEP

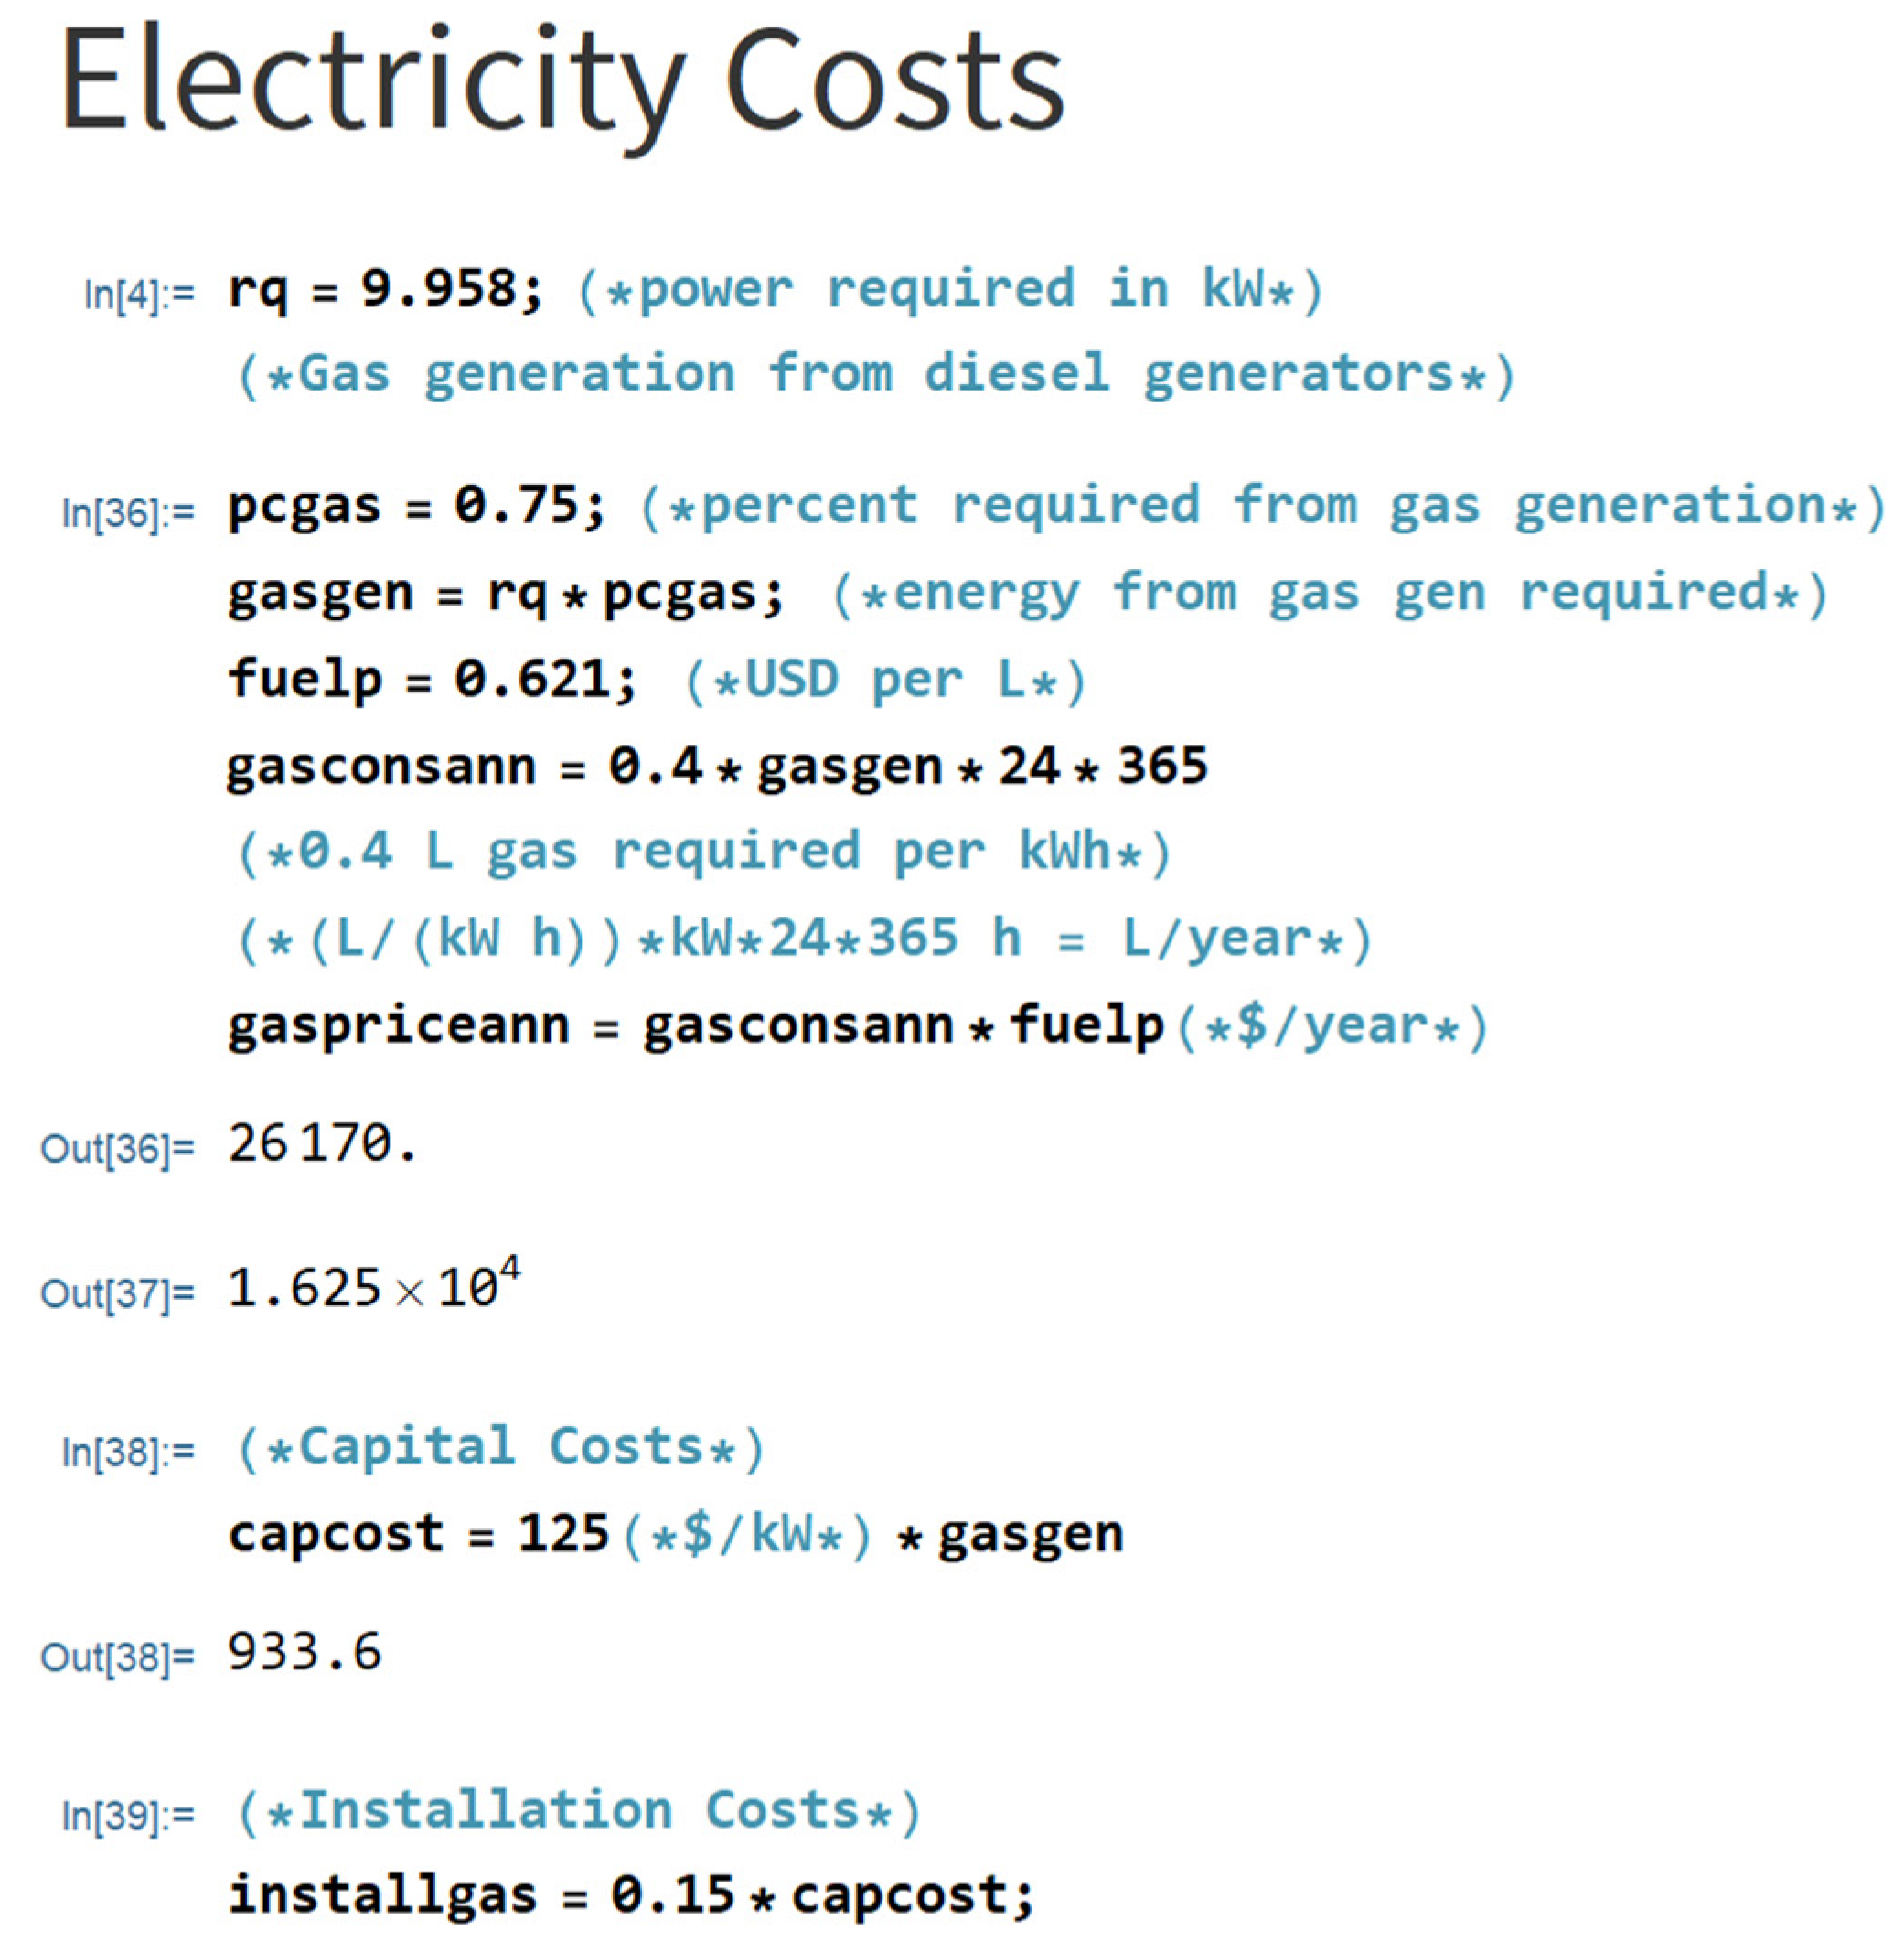
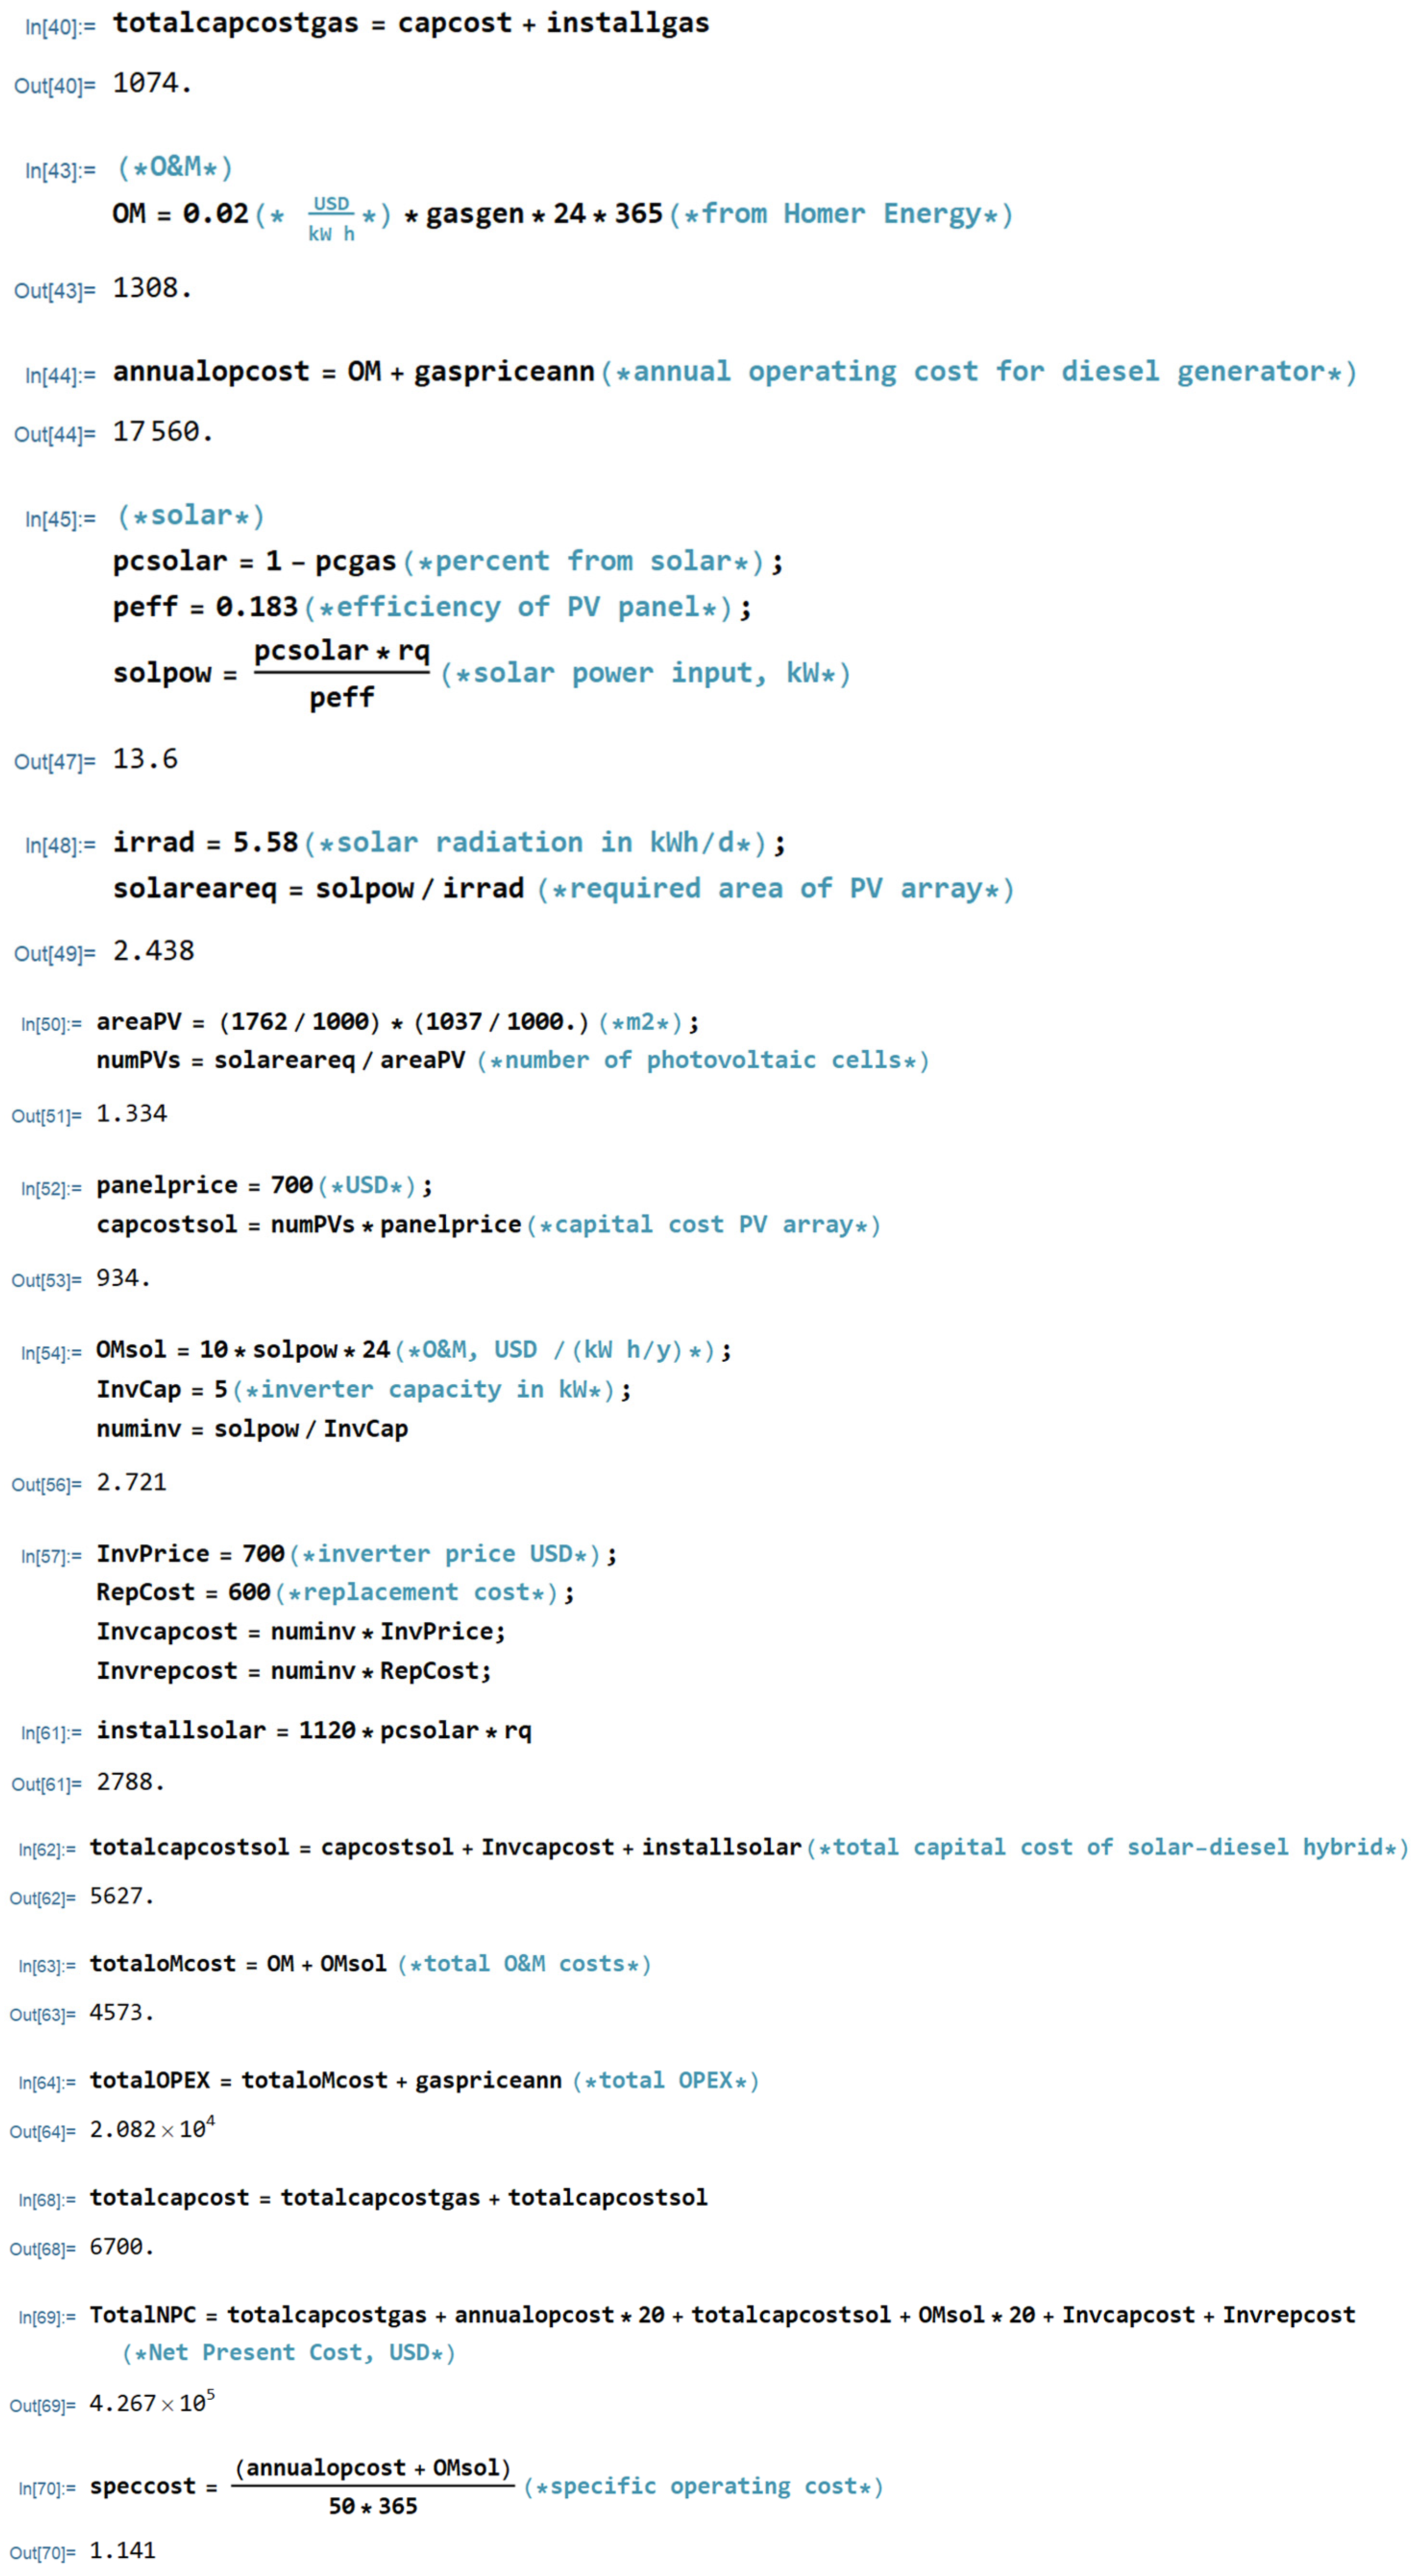
Specific water costs (in USD/m3) were generated via WAVE and DEEP simulations, as well as techno-economic analysis literature [33,34], to represent the operating expenses (including electricity costs) and operating (OPEX) and capital expenditures (CAPEX), respectively. Using the cost parameters established by [34], the CAPEX values for Cases A–D were as follows, in USD: 61,000, 244,000, 610,000, and 1,220,000 (Appendix D). Electricity costs were calculated via Wolfram Mathematica and MATLAB v24.1 code (Appendix E) and WAVE-derived specific energy outputs via Silfab Solar Prime series SIL-370-HC photovoltaic (PV) panels, when applicable. Appendix F lists the specific energy and total capital cost outputs for the desalination plant configurations of Cases A–D, with an assumed 20-year plant life. Total costs were derived via the multiplication of each OPEX/CAPEX parameter by the capacity of each case. Moreover, WAVE produced the water treatment parameters and specific energy cost (in kWh/m3). However, there were some operating cost inconsistences using DEEP, to the extent that more emphasis was placed upon WAVE’s economic analysis for Cases A–D (Table 6). For the sake of relative simplicity regarding remote-system operations, Cases A–D represent single-pass systems without recycle elements.
WAVE calculated a water recovery rate of 75.3% in the permeate flow, which indicates an incredibly high level of performance compared to typical RO industrial standards of 50–85% [35,36]. That said, it should be noted that the recovery rate is independent of the other variables, such as adjustments to the specific flow rate of permeate via membrane transport equations. As plant capacity increases, it is generally expected for the specific energy and water costs to fall, due to the latter being a function of water product quantity. However, this trend is far more evident among larger, dissimilar capacities (e.g., >1000–100,000 m3/day). Table 7 illustrates the specific costs produced via WAVE and DEEP, with a complete case-by-case representation relative to plant capacity in Figure 7.

DEEP Environmental Analysis

Sustainable desalination plant design must strive towards reducing energy use and CO2 emissions. For the sake of simplicity, this section excludes emissions via fuel transportation, solar power system land use, and material life cycles. In terms of specific energy consumption, industrial-scale seawater RO desalination plants can reach up to 3–6 kWh/m3 [7], as illustrated in Table 7 for Cases A–D. There is no strong evidence to suggest an inverse relationship between specific energy consumption and plant capacity. In fact, the specific energy consumption for Case A (50 m3/day) could imply that small-scale configurations are the key to minimising energy use, especially when applying intensified plant design. Contrastingly, according to WAVE, the energy configurations did not influence variations in specific energy consumption, since grid energy was considered and not the exact energy configurations (Appendices A-9 and A-10). The impacts of fuel (usage and cost) on desalination can be significantly reduced with solar hybridisation. On the other hand, more solar-leaning hybrid configurations are associated with high upfront capital cost.
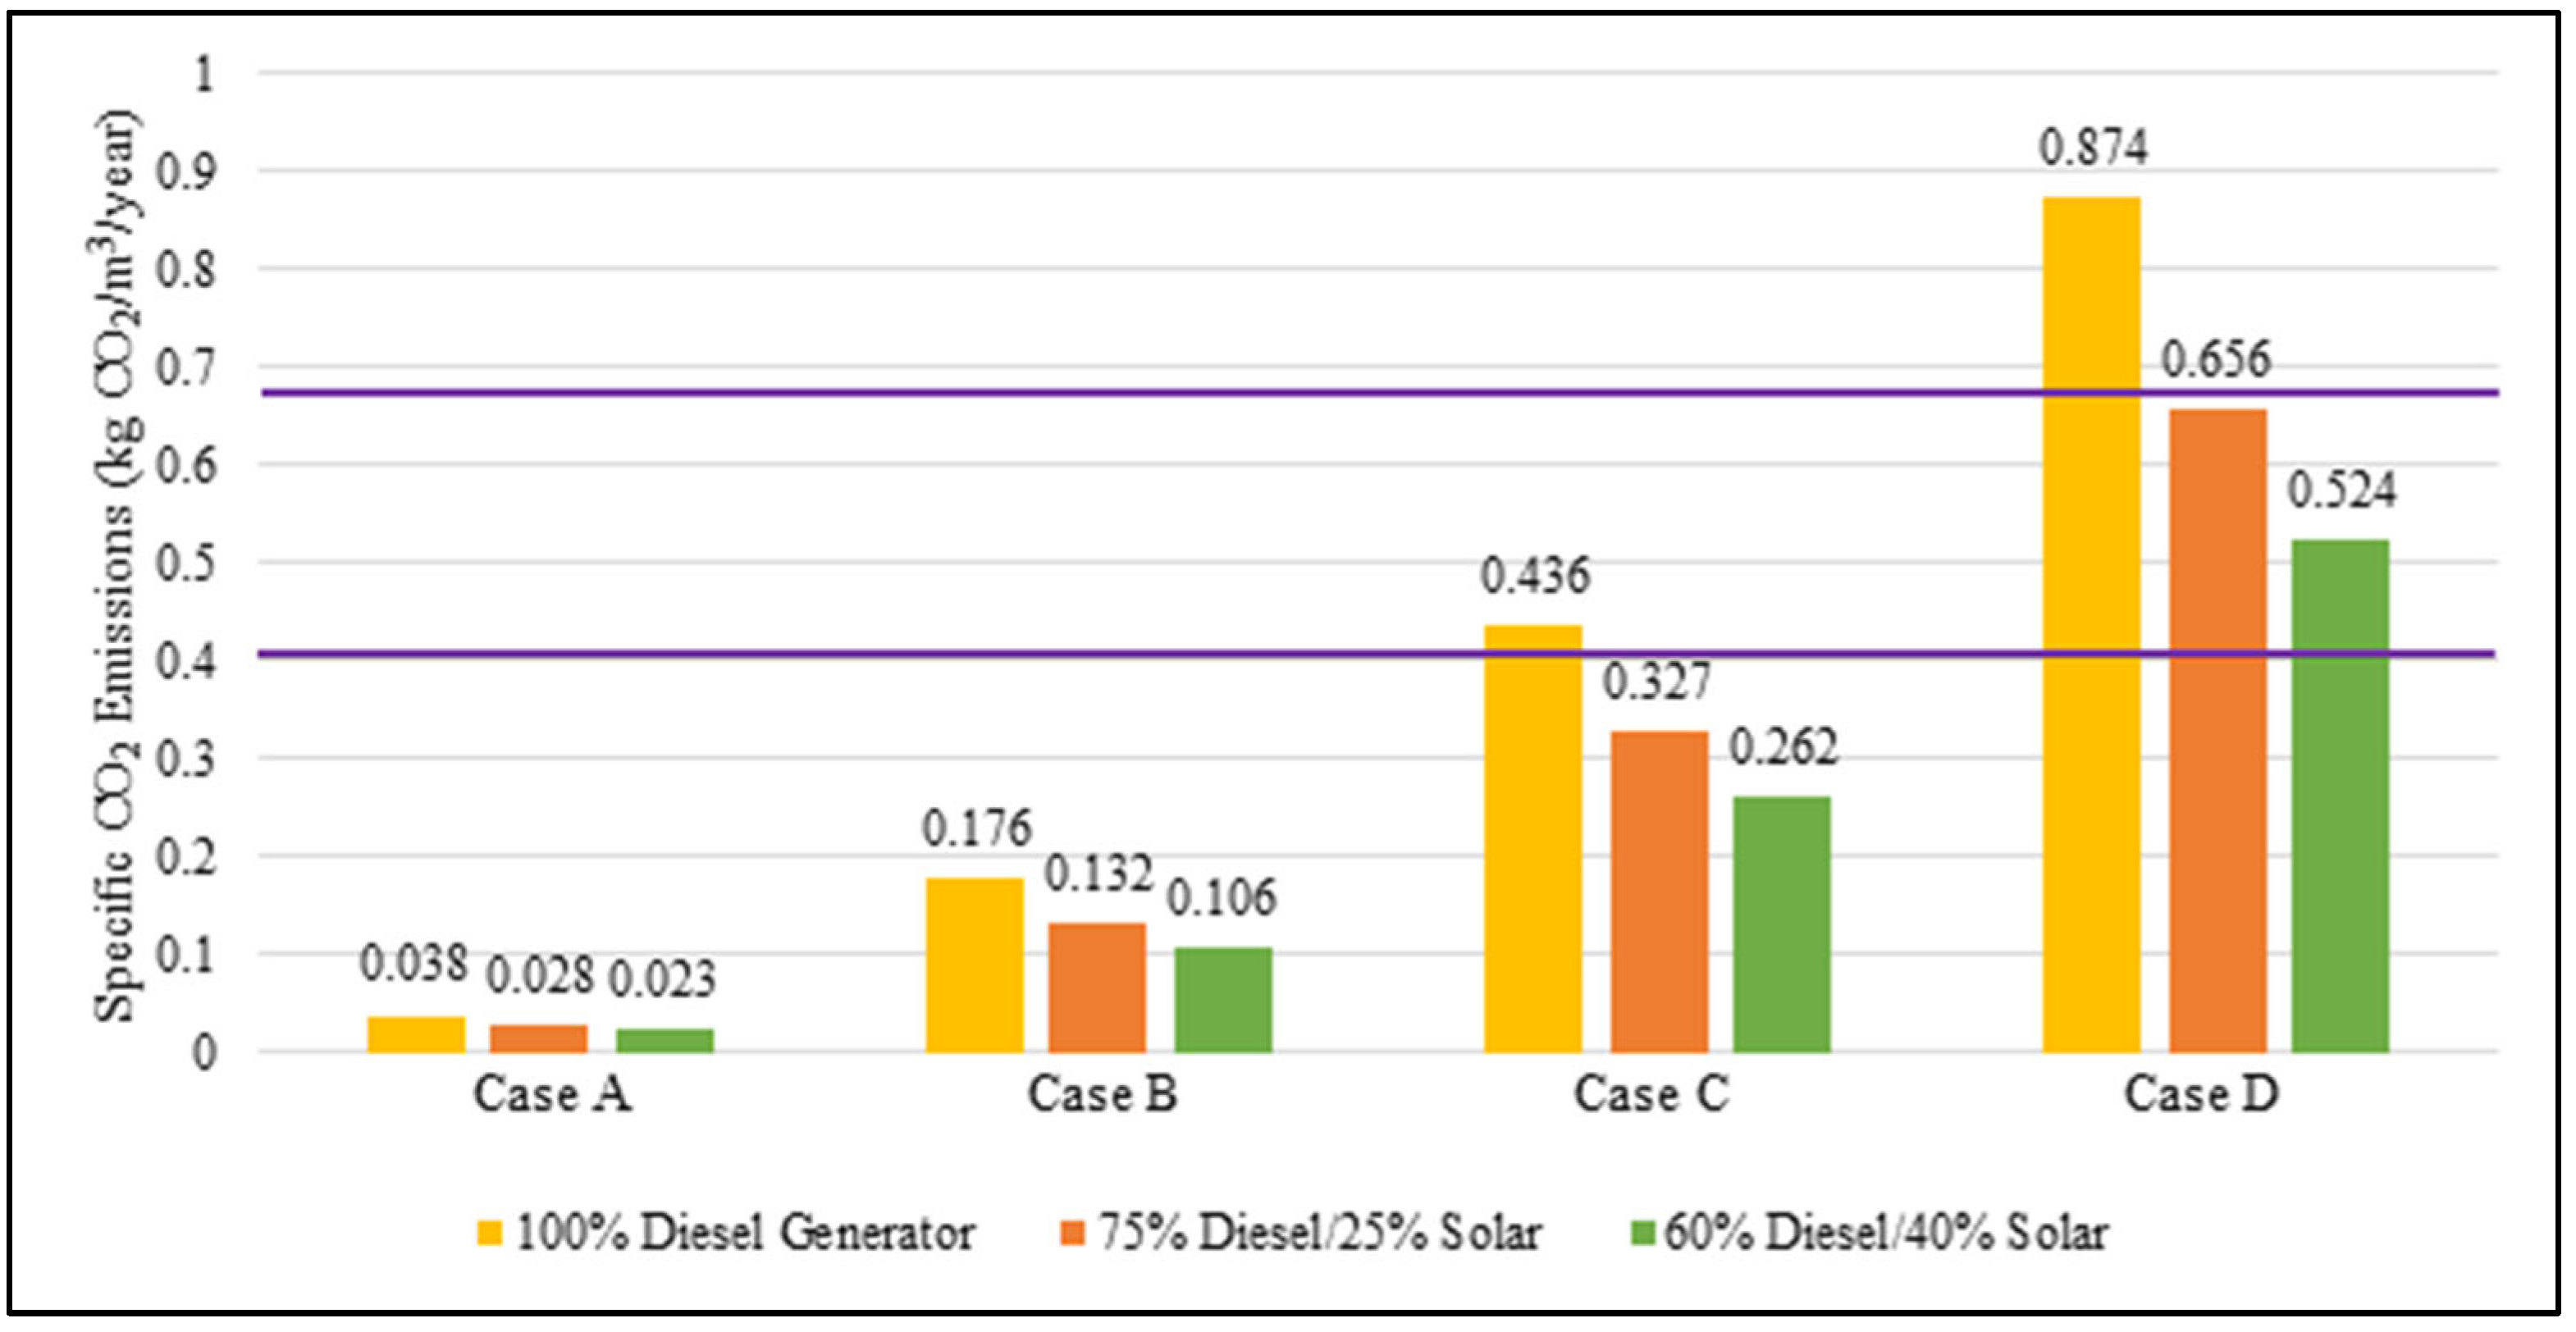
Fuel usage emissions via the diesel generators were calculated under the assumption that 19.76 g of CO2 was released per 1 L of combusted fuel [36]. The diesel–solar hybrid configurations demonstrated a proportional reduction in emissions to the %utilisation of solar power. That said, such a reduction is overstated by the assumption that the diesel generator is responsible for all emissions, when other factors must be considered, namely PV panel installation life cycle, maintenance, and recycling. Nevertheless, the CO2 emissions should be considered as reasonable in terms of the scale of operations. Large-scale operations should expect a specific emissions range of 0.4–0.67 kg CO2eq/m3 water [37]. Small(er)-scale desalination plants therefore seem to environmentally benefit from modular and intensified designs, relating to the reduction in specific CO2 (or equivalent) emissions per m3 of water per year (Figure 8).

3.2. FAHP

According to the FAHP rankings (Table 8), pathways with a more balanced diesel-to-solar ratio are ranked higher than the diesel(-leaning) configurations. Solely in terms of energy configuration, 60–40 pathways were ranked the highest, followed by 75–25 and 100% diesel. The high ranking of A1 (3rd) could be attributed to its relatively lower energy and fuel consumption, which had a significantly positive contribution towards its criteria weightings. Moreover, the hybridisation of diesel with solar PV (i.e., renewable energy) has been known to improve the sustainability, overall efficiency, and standalone potential in small-scale water delivery while also maintaining competitive costs [13,38,39].

4. Discussion

Sustainable water desalination should primarily aim towards reducing energy use and CO2 emissions, in comparison to conventional desalination. WAVE and DEEP software platforms were utilised to analyse and assess RO diesel–solar energy configurations in Oman, from economic and environmental dimensions (Figure 6). It was determined that smaller-scale, modular, intensified RO system designs could be the key towards (green and) sustainable water desalination, particularly with more balanced diesel–solar (i.e., 60–40% > 75–25%) energy configurations that utilise available stranded renewable energy sources (e.g., solar/wind) from within a/across region(s) [3,6,13,28,38]. Moreover, it was determined that the proposed sustainable water desalination can be cost-effective, with costs that are similar to their conventional counterparts (USD 0.49–2.89 per m3) [8]. In terms of specific energy costs (Figure 6), any significant differences between WAVE and DEEP may be (more) attributable to the calculation methods, as opposed to factors like plant capacity. On the other hand, while Figure 7 illustrates that the specific CO2 emissions per m3 of water per year were reasonable and in accordance with smaller-scale operations, the calculated reductions may have been overstated; diesel generators would not be responsible for all emissions, especially with factors associated with fuel transportation and PV maintenance/installation. Furthermore, from an economic perspective, DEEP (or similar software) may potentially overstate labour and management (L&M) costs, which can heavily skew the economic analysis of smaller-scale plant designs. Therefore, it is essential that the desalination software is optimised towards specific scale(s) of operations on a case-to-case basis, particularly if (significant) upwards scalability is planned in future endeavours [10,34]
Solar-leaning configuration pathways are ranked higher than their diesel(-leaning) pathways. Specifically, 60–40% pathways were ranked the highest, followed by 75–25% and 100% diesel. Reduced energy and fuel consumption appear to make a significantly positive contribution towards criteria weightings. Moreover, the hybridisation of diesel with renewable energy, such as solar, has been known to improve the sustainability, overall efficiency, and standalone potential [12,37,38]. That said, dimensions can also be over-represented and/or overweighted by decision makers. This is often due to potential biases and/or simply decision-based fatigue, particularly with regard to more subjective qualitative data and the economic dimension [29,31,32,35]. However, while possible [37], this would be more explicitly evident on a real-world, case-to-case basis. Furthermore, only the smallest-scale plant capacity (50 m3/day; A3 > A2 > A1) appears to be the most optimal, in terms of achieving overall sustainable water desalination, with the assignment of overall lower ranking to the larger plant capacities. Such an assignment of lower rankings appears to more disparate with increasing plant capacity. Thus, scalability would involve the hypothetical upscaling of relatively small-scale ~50 m3/day capacity configurations, with a key focus on (further) process modularisation and intensification [14]. This could potentially require modifications to the (overall) methodology framework, which is dependent on site-specific spatial and temporal variables, such as available sunlight hours (solar) [18,28,34,40] and/or brackish content [2,3,6,7], which may be beyond the current scope of the study. Weighting issues could be one of the potential limitations of the AHP/FAHP and upscaled methodology frameworks, which could be mitigated/removed by MCDM integration. Each MCDM method has its strengths, weaknesses, and limitations [40,41,42,43,44,45].
Therefore, further works should seek to develop and implement an integrated MCDM framework with more clearly defined criteria and sub-criteria (social, economic, environmental, and technical): FAHP with TOPSIS and/or VIKOR with PROMETHEE-II. Ideally, this would provide more balanced, holistically green, and sustainable perspectives for water desalination. The FAHP is incredibly adaptable, easy to use, and presents a clear hierarchical structure [29,30,31,32]. The integration of VIKOR would provide a more accurate representation of DM viewpoints via compromise solutions, while removing criterion units in a way that does not distort criteria data [30,40,41]. PROMETHEE-II is a relatively stable and straightforward MCDM method, which is commonly applied in sustainability-related fields, with the ability to provide relatively reliable and nuanced complete pathway rankings [42,43,44,45]. Its lack of versatility [41] could be mitigated by the high adaptability and flexibility of the FAHP, while the compromise solutions from VIKOR would maximise the conclusiveness and reliability of the results [42,43,44,45]. Additionally, further works should consider emission contributors, such as fuel transportation and PV maintenance/installation, in the criteria weightings and subsequent pathway rankings. Such pathways should also consider greater solar percentages, to analyse and evaluate key sustainability-related criteria from balanced perspectives (if possible). And for a truly holistic perspective on sustainable water desalination, the social dimension of sustainable water desalination should be addressed with greater depth. This could be achieved on a case-to-case basis via an eclectic range and quantity of open and closed socio-political surveys [46], and a systematic integration of established stakeholder engagement(s) with more personalised, general populace perspectives, i.e., how people (actual stakeholders, hypothetical or otherwise) respond and may/can influence case-specific policy, and vice versa. Further works would aim to avoid and/or minimise uncertainties within and among case-to-case criteria and sub-criteria, especially over time.

5. Conclusions

Ocean water desalination could be a crucial pathway towards addressing global water scarcity, in response to the growing demands of a progressively more urbanised global population. However, water desalination strives towards (green) sustainability, in order to address the weaknesses/limitations of conventional desalination: high energy intensity, limited scalability, and significant negative environmental impacts (primarily via emissions and brine disposal) [11]. Smaller-scale RO desalination plant configurations were assessed via an MCDM framework, known as the Fuzzy Analytical Hierarchy Process (FAHP), based on five key sustainability-related criteria: modularity, standalone potential, efficiency, cost, and sustainability (Figure 1).
A total of twelve plant configurations were assessed: four plant capacities (50, 100, 150, and 200 m3/day) per three diesel-to-solar PV energy configurations (100–0%, 75–25%, and 60–40%). It was determined that solar-leaning configurations were ranked higher than their diesel counterparts (i.e., 60–40 > 75–25 > 100–0), largely due to reductions in energy and fuel consumption. The hybridisation of diesel configurations with solar has demonstrated notable improvements in sustainability, overall efficiency, and standalone potential [36,37]. Such results also imply that smaller plant capacities (i.e., 50 m3/day) are the most optimal configurations, with regard to achieving overall sustainability. Thus, potential applications of scalability would ideally focus on modularised smaller plant capacities. That said, the exact extent is not completely clear; emission reductions may have been overstated without considering emission contributors, such as transportation and PV installation/maintenance. Moreover, the criteria can be over-represented and/or overweighted by decision makers with the FAHP, due to potential biases and/or simply decision-based fatigue.
Future research should seek to implement an integrated MCDM framework with more clearly defined sub-criteria per criteria (social, economic, environmental, and technical), while also addressing the individual limitations of the FAHP. This would involve the integration of other MCDM methods (TOPSIS, VIKOR, and PROMETHEE-II). Such methods would serve to promote greater reliability, stability, and accuracy in the results while avoiding/minimising uncertainties. Moreover, for truly holistically green and sustainable perspectives, the social dimension of water desalination could be explored, with consideration of an in-depth, systematic integration between established stakeholders and the general populace.
Author Contributions

Conceptualization, D.L., C.B., I.M.S. and M.G.H.-S.; methodology, C.B. and D.L.; software, M.G.H.-S.; validation, M.G.H.-S., I.M.S. and N.B.; formal analysis, D.L., C.B. and M.G.H.-S.; investigation, C.B.; resources, M.G.H.-S.; data curation, D.L. and C.B.; writing—original draft preparation, D.L. and C.B.; writing—review and editing, D.L. and C.B.; visualization, D.L., C.B. and M.G.H.-S.; supervision, M.G.H.-S. and N.B.; project administration, M.G.H.-S. All authors have read and agreed to the published version of the manuscript.

Funding

The authors extend their appreciation to the Deanship of Research and Graduate Studies at King Khalid University, KSA, for funding this work through small group research under grant number RGP1/70/46.

Data Availability Statement

The raw data supporting the conclusions of this article will be made available by the authors on request.

Acknowledgments

I would like to thank my supervisors, Mohamed G. Hassan-Sayed and Nuno Bimbo, for providing advice and mentorship over the course of my degree. Moreover, I would also like to thank Clara Bartram for their tremendous work and contributions. Last but not least, I would like to thank my family and friends for their continued support.

Conflicts of Interest

The authors declare no conflicts of interest.

Abbreviations

The following abbreviations are used in this manuscript:
MCDMMulti-Criteria Decision Making
ROReverse Osmosis
(F)AHP(Fuzzy) Analytical Hierarchy Process
MSFMulti-stage Flash
MEDMulti-effect Distillation
TFN(s)Triangular Fuzzy Number(s)
WAVEWave Application Value Engine
DEEPDesalination Economic Evaluation Program
IAEAInternational Atomic Energy Agency
SWCSpecific Water Cost
O&MOperation and Maintenance
CRConsistency Ratio
OPEXOperating Expenses
CAPEXCapital Expenditures
PVPhotovoltaic
L&MLabour & Management

Appendix A

Table A1. Model design parameters for water; TSS = Total Suspended Solids, SDI = Silt Density Index, TOC = Total Organic Compounds, DO = Dissolved Oxygen; NTU = Nephelometric Turbidity Unit [16,17,18].
ParameterMinMax
Water temperature (°C)21.326.9
Salinity (ppm)34,00034,400
pH7.58.1
Turbidity (NTU)1.51.65
TSS (mg/L)-1
SDI15 (mg/L)0.45-
TOC (mg/L)5.125.38
Conductivity (mS)52.3456.22
Table A2. Additional recommended design limits; GFD = Gallons/ft2/day [15].
Parameter Recommended Limit
SDI15 (mg/L)Max4
Turbidity (NTU)Typical0.1
Conservative7
System flux (GFD)Typical8
Aggressive10
Table A3. Quality parameters for drinking (product) water [47].
ParameterOmani Standard
TDS (mg/L)<1000
Chloride (mg/L)<600
Sodium (mg/L)<400
pH6.5–8.5
Turbidity (NTU)1–5
Table A4. Model parameters for ion concentrations.
IonConcentration (ppm)
K+555
Na+10,730
Mg2+1450
Ca2+678
CO32−160
HCO3791
Cl24,850
SO42−3060
Br99

Appendix B

Table A5. Optimised WAVE parameter data; permeate flow = 50 m3/day.
StagesPressure VesselsElementsMembrane TypeFlux (GFD)Price (USD/m3)Energy (kWh/m3)
114SW30XHR-4008.31.3256.72
212SW30XHR-4008.31.3276.72
122SW30XHR-4008.31.2956.53
114Seamaxx4407.51.1475.57
122Seamaxx4407.51.0324.78
Table A6. Optimised WAVE parameter data; permeate flow = 200 m3/day.
StagesPressure VesselsElementsMembrane TypeFlux (GFD)Price (USD/m3)Energy (kWh/m3)
136SW30XHR-4007.31.3256.56
224,5SW30XHR-4007.31.2996.55
163SW30XHR-4007.31.296.49
128SW30XHR-4008.31.3346.77
233SW30XHR-40071.2896.49
222SW30XHR-4007.91.3136.64
21,25SW30XHR-4008.31.3366.79
22,33Seamaxx44081.1565.63
135Seamaxx44081.1555.63
153Seamaxx44081.1555.63
223,4Seamaxx4408.61.1635.68
144Seamaxx4407.51.1475.57
Table A7. Optimised WAVE parameter data; permeate flow = 500 m3/day.
StagesPressure VesselsElementsMembrane TypeFlux (GFD)Price (USD/m3)Energy (kWh/m3)
176SW30XHR-4007.91.3196.68
23/4.6/6.SW30XHR-4007.91.326.68
185SW30XHR-4008.31.3356.78
254SW30XHR-4008.31.3336.77
1104SW30XHR-4008.31.3256.72
273SW30XHR-4008.31.3196.68
176SW30XFR-400/347.91.2816.43
176SW30XLE-4407.11.2296.1
176SW30-HRLE-4007.91.2786.41
185Seamaxx4407.51.1465.57
245Seamaxx4407.51.1415.53
176Seamaxx4407.11.1385.52
Table A8. Optimised WAVE parameter data; permeate flow = 1000 m3/day.
StagesPressure VesselsElementsMembrane TypeFlux (GFD)Price (USD/m3)Energy (kWh/m3)
364Seamaxx4408.31.1555.63
1136Seamaxx4407.71.1495.59
1136SW30HRLE-4407.71.2776.41
285Seamaxx4407.51.1415.53

Appendix C

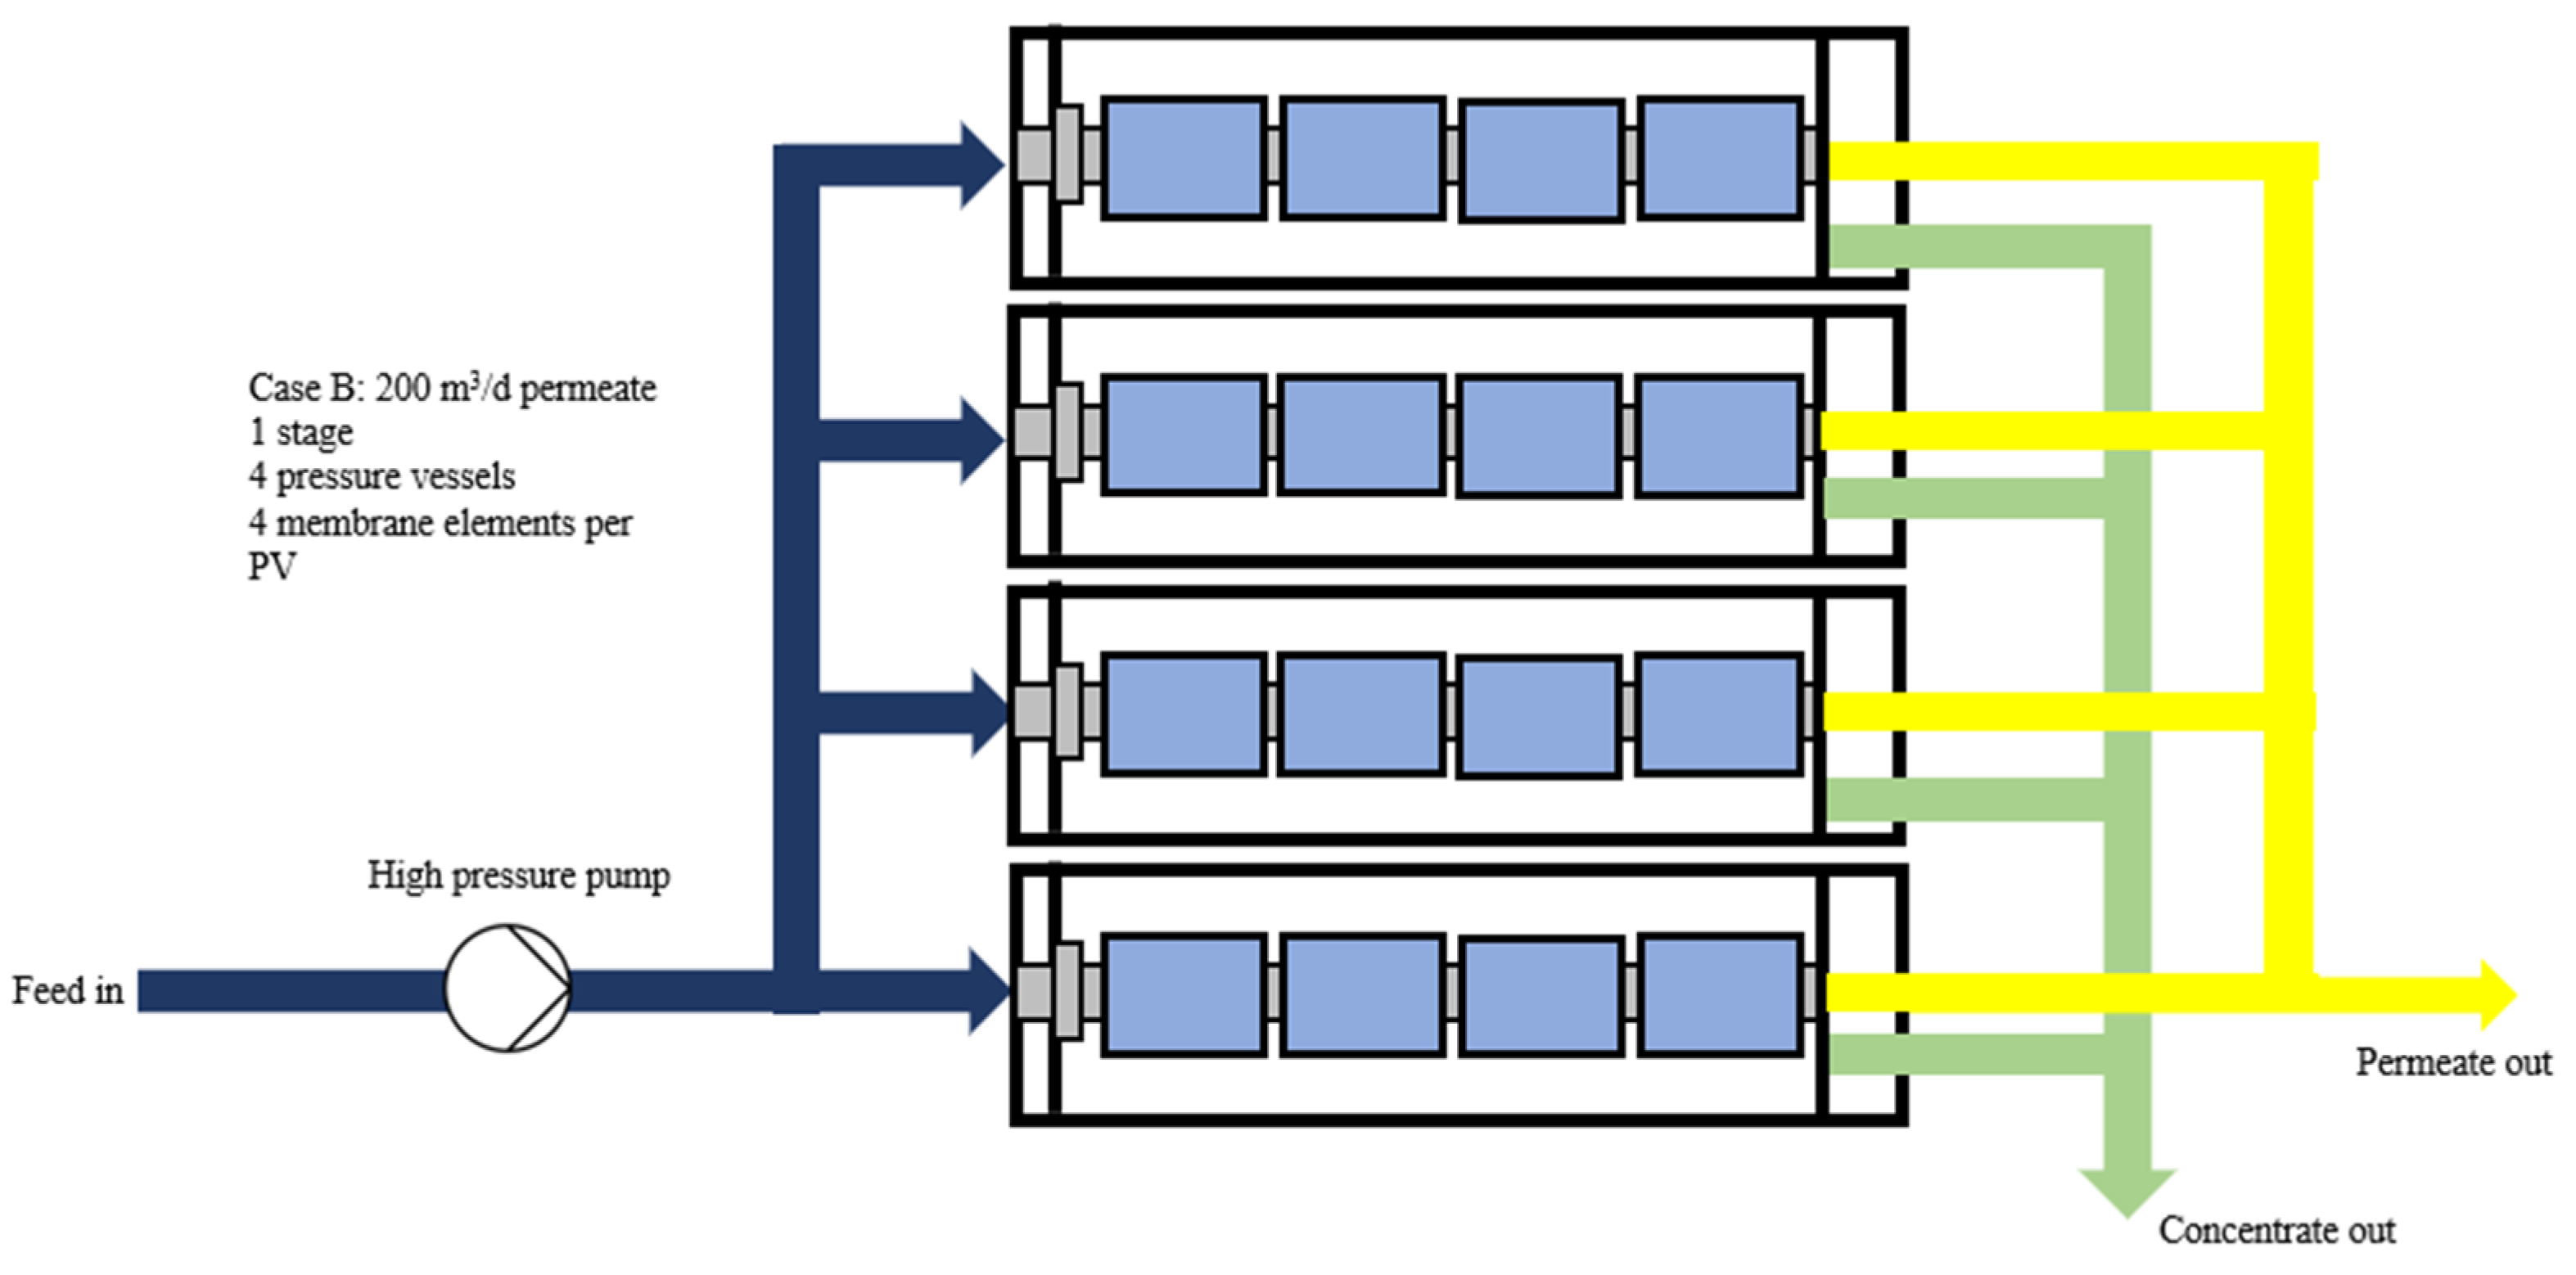
Figure A1. RO configuration for Case B.
Water 17 01729 g0a1
Figure A2. RO configuration for Case C.
Water 17 01729 g0a2
Figure A3. RO configuration for Case D.
Water 17 01729 g0a3

Appendix D

Table A9. Calculated CAPEX costs [34].
Cost Parameter (USD/(m3/day))Case ACase BCase CCase D
Total Cost (USD)Total Cost (USD)Total Cost (USD)Total Cost (USD)
RO modules70350014,00035,00070,000
Other equipment45022,50090,000225,000450,000
Seawater intake/brine reject100500020,00050,000100,000
Site preparation (construction)40020,00080,000200,000400,000
Other costs (engineering, shipping, legal costs)140700028,00070,000140,000
Total CAPEX (incl. 5% for contingency)122061,000244,000610,0001,220,000
Table A10. Calculated OPEX costs (without electricity) [34].
Cost Parameter (USD/m3)
Membrane Replacement (20%/year)0.30
Chemicals0.08
Maintenance and Spare Parts (2% total CAPEX)0.07
Brine Disposal and Other Externalities0.04
Insurance (0.5% total CAPEX/year)0.02
Labour0.05
Table A11. Specific electricity costs.
Electricity Costs (USD/kWh)
ConfigurationCase ACase BCase CCase D
100% Diesel0.2680.2680.2690.268
75% Diesel, 25% Solar0.2380.2390.2390.239
60% Diesel, 40% Solar0.2210.2210.2210.221

Appendix E

Figure A4. Code to calculate electricity costs; rq = required power, speccost = capacity/specific cost, pcgas = % gas generation.
Water 17 01729 g0a4aWater 17 01729 g0a4b

Appendix F

Table A12. Capital costs per energy configuration.
CaseEnergy ConfigurationElectricity GenerationDesal. EquipmentTotal
A100% Diesel143161,00062,431
75% Diesel, 25% Solar670061,00067,700
60% Diesel, 40% Solar986261,00070,862
B100% Diesel6673244,000250,673
75% Diesel, 25% Solar31,230244,000275,230
60% Diesel, 40% Solar45,970244,000289,970
C100% Diesel16,530610,000626,530
75% Diesel, 25% Solar77,380610,000687,380
60% Diesel, 40% Solar113,900610,000723,900
D100% Diesel33,1201,220,0001,253,120
75% Diesel, 25% Solar155,0001,220,0001,375,000
60% Diesel, 40% Solar228,2001,220,0001,448,200
Table A13. Specific energy costs per configuration.
Electricity Costs (USD/kWh)
ConfigurationCase ACase BCase CCase D
100% Diesel0.2680.2680.2690.268
75% Diesel, 25% Solar0.2380.2390.2390.239
60% Diesel, 40% Solar0.2210.2210.2210.221

References

  1. Nair, M.; Kumar, D. Water desalination and challenges: The Middle East perspective: A review. Desalination Water Treat. 2013, 51, 2030–2040. [Google Scholar] [CrossRef]
  2. Loutatidou, S.; Mavukkandy, M.O.; Chakraborty, S.; Arafat, H.A. Chapter 1—Introduction: What is Sustainable Desalination? In Desalination Sustainability; Arafat, H.A., Ed.; Elsevier: Amsterdam, The Netherlands, 2017. [Google Scholar]
  3. Mahmoudi, A.; Bostani, M.; Rashidi, S.; Valipour, M.S. Challenges and opportunities of desalination with renewable energy resources in Middle East countries. Renew. Sustain. Energy Rev. 2023, 184, 113543. [Google Scholar] [CrossRef]
  4. United Nations (UN). The Sustainable Development Goals Report. 2022. Available online: https://unstats.un.org/sdgs/report/2022/The-Sustainable-Development-Goals-Report-2022.pdf (accessed on 5 April 2024).
  5. Gude, V.G. Desalination and sustainability—An appraisal and current perspective. Water Res. 2016, 89, 87–106. [Google Scholar] [CrossRef]
  6. Belessiotis, V.; Kalogirou, S.; Delyannis, E. Chapter One—Desalination Methods and Technologies—Water and Energy. In Thermal Solar Desalination; Belessiotis, V., Kalogirou, S., Delyannis, E., Eds.; Academic Press: Cambridge, MA, USA, 2016. [Google Scholar]
  7. Roy, S.; Ragunath, S. Emerging Membrane Technologies for Water and Energy Sustainability: Future Prospects, Constrains and Challenges. Energies 2018, 11, 2997. [Google Scholar] [CrossRef]
  8. Panagopoulos, A.; Haralambous, K.-J.; Loizidou, M. Desalination brine disposal methods and treatment technologies—A review. Sci. Total Environ. 2019, 693, 133545. [Google Scholar] [CrossRef] [PubMed]
  9. Amaya-Vias, D.; López-Ramírez, J.A. Techno-Economic Assessment of Air and Water Gap Membrane Distillation for Seawater Desalination under Different Heat Source Scenarios. Water 2019, 11, 2117. [Google Scholar] [CrossRef]
  10. IEA. Desalinated Water Affects the Energy Equation in the Middle East. 2019. Available online: https://www.iea.org/commentaries/desalinated-water-affects-the-energy-equation-in-the-middle-east (accessed on 4 April 2024).
  11. Okampo, E.J.; Nwulu, N. Optimisation of renewable energy powered reverse osmosis desalination systems: A state-of-the-art review. Renew. Sustain. Energy Rev. 2021, 140, 110712. [Google Scholar] [CrossRef]
  12. Bienkowski. Desalination is an Expensive Energy Hog, But Improvements are on the Way. 2015. Available online: https://theworld.org/stories/2015/05/13/desalination (accessed on 4 April 2024).
  13. Do Thi, H.T.; Pasztor, T.; Fozer, D.; Manenti, F.; Toth, A.J. Comparison of Desalination Technologies Using Renewable Energy Sources with Life Cycle, PESTLE, and Multi-Criteria Decision Analyses. Water 2021, 13, 3023. [Google Scholar] [CrossRef]
  14. Kyriakarakos, G.; Papadakis, G. Is Small Scale Desalination Coupled with Renewable Energy a Cost-Effective Solution? Appl. Sci. 2021, 11, 5419. [Google Scholar] [CrossRef]
  15. Drioli, E.; Ali, A.; Macedonio, F. Membrane Operations for Process Intensification in Desalination. Appl. Sci. 2017, 7, 100. [Google Scholar] [CrossRef]
  16. Zaidi, S.J.; Saleem, H. Chapter 1—Introduction to Reverse Osmosis. In Reverse Osmosis Systems; Zaidi, S.J., Saleem, H., Eds.; Elsevier: Amsterdam, The Netherlands, 2022. [Google Scholar]
  17. Sana, A.; Al-Jamrah, A.; Claereboudt, M.; Al-Kindi, S.; Tanaka, H.; Kwarteng, A. Measurement of water quality in Gulf of Oman. In Proceedings of the 1st International Conference on Coastal zone management and engineering in the Middle East, Dubai, United Arab Emirates, 27–29 November 2005. [Google Scholar]
  18. Feroz, S.; Jahan, S.; Saha, R. Analysis of Seasonal Variations of Hydro-Meteorological, General and Particulates in Sea Water Along the Coastline of Sultanate of Oman. Int. J. Eng. Res. Technol. 2012, 1, 1–7. [Google Scholar]
  19. Joy, V.M.; Feroz, S.; Dutta, S. Solar nanophotocatalytic pretreatment of seawater: Process optimization and performance evaluation using response surface methodology and genetic algorithm. Appl. Water Sci. 2021, 11, 18. [Google Scholar] [CrossRef]
  20. She, Q.; Wang, R.; Fane, A.G.; Tang, C.Y. Membrane fouling in osmotically driven membrane processes: A review. J. Membr. Sci. 2016, 499, 201–233. [Google Scholar] [CrossRef]
  21. Jiang, S.; Li, Y.; Ladewig, B.P. A review of reverse osmosis membrane fouling and control strategies. Sci. Total Environ. 2017, 595, 567–583. [Google Scholar] [CrossRef]
  22. Goh, P.S.; Lau, W.J.; Othman, M.H.D.; Ismail, A.F. Membrane fouling in desalination and its mitigation strategies. Desalination 2018, 425, 130–155. [Google Scholar] [CrossRef]
  23. Toth, A.J. Modelling and Optimisation of Multi-Stage Flash Distillation and Reverse Osmosis for Desalination of Saline Process Wastewater Sources. Membranes 2020, 10, 265. [Google Scholar] [CrossRef]
  24. Dupont Water Solutions. Introduction to WAVE. 2022. Available online: https://www.dupont.com/Wave/Default.htm (accessed on 12 April 2024).
  25. Ruiz-García, A.; Nuez, I.; Khayet, M. Performance assessment and modeling of an SWRO pilot plant with an energy recovery device under variable operating conditions. Desalination 2023, 555, 116523. [Google Scholar] [CrossRef]
  26. Luong, V.T.; Cañas Kurz, E.E.; Hellriegel, U.; Dinh, D.N.; Tran, H.T.; Figoli, A.; Gabriele, B.; Luu, T.L.; Hoinkis, J. Modular desalination concept with low-pressure reverse osmosis and capacitive deionization: Performance study of a pilot plant in Vietnam in comparison to seawater reverse osmosis. J. Environ. Manag. 2023, 329, 117078. [Google Scholar] [CrossRef]
  27. Rodríguez-Calvo, A.; Silva-Castro, G.A.; Osorio, F.; González-López, J.; Calvo, C. Reverse osmosis seawater desalination: Current status of membrane systems. Desalination Water Treat. 2015, 56, 849–861. [Google Scholar] [CrossRef]
  28. Global Petrol Prices. Electricity Prices. 2022. Available online: https://www.globalpetrolprices.com/electricity_prices/ (accessed on 13 September 2022).
  29. Rahimi, B.; Shirvani, H.; Alamolhoda, A.A.; Farhadi, F.; Karimi, M. A feasibility study of solar-powered reverse osmosis processes. Desalination 2021, 500, 114885. [Google Scholar] [CrossRef]
  30. Awasthi, A.; Govindan, K.; Gold, S. Multi-tier sustainable global supplier selection using a fuzzy AHP-VIKOR based approach. Int. J. Prod. Econ. 2017, 195, 106–117. [Google Scholar] [CrossRef]
  31. Saaty, R.W. The analytic hierarchy process—What it is and how it is used. Math. Model. 1987, 9, 161–176. [Google Scholar] [CrossRef]
  32. Vaidya, O.; Kumar, S. Analytic Hierarchy Process: An Overview of Applications. Eur. J. Oper. Res. 2006, 169, 1–29. [Google Scholar] [CrossRef]
  33. Moser, M.; Trieb, F.; Fichter, T.; Kern, J.; Hess, D. A flexible techno-economic model for the assessment of desalination plants driven by renewable energies. Desalination Water Treat. 2015, 55, 3091–3105. [Google Scholar] [CrossRef]
  34. Kettani, M.; Bandelier, P. Techno-economic assessment of solar energy coupling with large-scale desalination plant: The case of Morocco. Desalination 2020, 494, 114627. [Google Scholar] [CrossRef]
  35. Indika, S.; Wei, Y.; Hu, D.; Ketharani, J.; Ritigala, T.; Cooray, T.; Hansima, M.A.C.K.; Makehelwala, M.; Jinadasa, K.B.S.N.; Weragoda, S.K.; et al. Evaluation of Performance of Existing RO Drinking Water Stations in the North Central Province, Sri Lanka. Membranes 2021, 11, 383. [Google Scholar] [CrossRef]
  36. Rezk, H.; Alamri, B.; Aly, M.; Fathy, A.; Olabi, A.G.; Abdelkareem, M.A.; Ziedan, H.A. Multicriteria Decision-Making to Determine the Optimal Energy Management Strategy of Hybrid PV–Diesel Battery-Based Desalination System. Sustainability 2021, 13, 4202. [Google Scholar] [CrossRef]
  37. Tal, A. Addressing Desalination’s Carbon Footprint: The Israeli Experience. Water 2018, 10, 197. [Google Scholar] [CrossRef]
  38. Gökçek, M. Integration of hybrid power (wind-photovoltaic-diesel-battery) and seawater reverse osmosis systems for small-scale desalination applications. Desalination 2018, 435, 210–220. [Google Scholar] [CrossRef]
  39. Jiang, Y.; Zhao, J.; Tong, Z. Optimum Design of a Solar-Wind-Diesel Hybrid Energy System with Multiple Types of Storage Devices Driving a Reverse Osmosis Desalination Process. Processes 2022, 10, 2199. [Google Scholar] [CrossRef]
  40. Opricovic, S.; Tzeng, G.-H. Extended VIKOR method in comparison with outranking methods. Eur. J. Oper. Res. 2007, 178, 514–529. [Google Scholar] [CrossRef]
  41. Kumar, A.; Sah, B.; Singh, A.R.; Deng, Y.; He, X.; Kumar, P.; Bansal, R.C. A review of multi criteria decision making (MCDM) towards sustainable renewable energy development. Renew. Sustain. Energy Rev. 2017, 69, 596–609. [Google Scholar] [CrossRef]
  42. Wu, Z.; Abdul-Nour, G. Comparison of Multi-Criteria Group Decision-Making Methods for Urban Sewer Network Plan Selection. CivilEng 2020, 1, 3. [Google Scholar] [CrossRef]
  43. Gilliams, S.; Raymaekers, D.; Muys, B.; Orshoven, J.V. Comparing multiple criteria decision methods to extend a geographical information system on afforestation. Comput. Electron. Agric. 2005, 49, 142–158. [Google Scholar] [CrossRef]
  44. Al-Majali, B.H.; Zobaa, A.F. Analyzing Bi-Objective Optimization Pareto Fronts Using Square Shape Slope Index and NSGA-II: A Multi-Criteria Decision-Making Approach. Expert Syst. Appl. 2025, 252, 126765. [Google Scholar] [CrossRef]
  45. Brans, J.P.; Vincke, P.; Mareschal, B. How to select and how to rank projects: The Promethee method. Eur. J. Oper. Res. 1986, 24, 228–238. [Google Scholar] [CrossRef]
  46. Guati-Rojo, A.; Demski, C.; Poortinga, W.; Valera-Medina, A. Public Attitudes and Concerns about Ammonia as an Energy Vector. Energies 2021, 14, 7296. [Google Scholar] [CrossRef]
  47. Petroleum Development Oman (PDO). Unbottled Drinking Water. 2012. Available online: https://www.pdo.co.om/hseforcontractors/LegalRequirements/OS%208-2012-E-Unbottled%20Drinking%20Water%20Standard.pdf (accessed on 5 April 2024).
Figure 1. Desalination cost breakdown by % [11].
Water 17 01729 g001
Figure 2. Flowchart of the present study. FAHP = Fuzzy Analytical Hierarchy Process; TFNs = Triangular Fuzzy Numbers.
Water 17 01729 g002
Figure 3. Detailed design for a conservative-to-typical RO train [27].
Water 17 01729 g003
Figure 4. RO configuration for Case A.
Water 17 01729 g004
Figure 5. DEEP economic analysis flowsheet, DEEP v5.1 user manual [29].
Water 17 01729 g005
Figure 6. Sustainable water desalination sub-criteria. CIFs = Critical Influencing Factors.
Water 17 01729 g006
Figure 7. (a) WAVE specific (energy and water) costs; (b) DEEP specific costs.
Water 17 01729 g007
Figure 8. Specific CO2 emissions per case and energy configuration.
Water 17 01729 g008
Table 1. Desalination water costs using method in [9].
Desalination MethodFeedwaterCapacity (m3/day)Costs (USD/m3)
ROSeawater<1001.07–13.39
Seawater250–10000.89–2.80
Seawater1000–48000.50–1.18
Seawater128,0000.21–0.44
Brackish water<204.02–9.21
Brackish water20–12000.55–0.95
Brackish water40,000–46,0000.19–0.38
-10001.46
MEDSeawater<1001.79–7.14
Seawater12,000–55,0000.68–1.07
-10001.13–1.18
Seawater91,000–320,0000.34–0.66
MSFSeawater23,000–528,0000.38–1.25
-10000.97–1.09
-50,000–70,0000.46–1.43
Table 2. Optimised RO WAVE modelling configurations. Conservative flux rates with acceptable industrial ranges for no. of stages, pressure vessels (per stage), and membrane elements.
ParameterCase ACase BCase CCase D
Permeate flow (m3/day)502005001000
Feed flow (m3/day)66.4265.4663.61327
Pressure vessels2478
No. of stages1112
Membrane elements2465
Mean flux (GFD)7.57.57.17.5
Table 3. The potential green and/or sustainable pathways for sustainable water desalination.
PathwayCapacity (m3/day)Diesel-to-Solar Ratio (%)
A150100–0
A275–25
A360–40
A4200100–0
A575–25
A660–40
A7500100–0
A875–25
A960–40
A101000100–0
A1175–25
A1260–40
Table 4. Linguistic-based fuzzy comparison matrix of crisp AHP values and correspondent TFNs.
Linguistic VariableCrisp Value (AHP)TFNReciprocal TFN
Equally important (E)1(1,1,1)(1,1,1)
Weakly important (W)2(1/2,1,3/2)(2/3,1,2)
Fairly important (F)3(1,3/2,2)(1/2,2/3,1)
Strongly important (S)4(3/2,2,5/2)(2/5,1/2,2/3)
Very strongly important (V)5(2,5/2,3)(1/3,2/5,1/2)
Extremely important (EI)6(5/2,3,7/2)(2/7,1/3,2/5)
Table 5. Local criteria weights. (+/−) denote whether the criterion is beneficial or non-beneficial.
CriteriaW
C1, modularity (+)0.188978145
C2, sustainability (+)0.187206578
C3, standalone potential (+)0.197255753
C4, efficiency (+)0.187206578
C5, cost (−)0.239352945
Table 6. Sum totals of global weights.
GlobalC1 × W1C2 × W2C3 × W3C4 × W4C5 × W5
A10.016346610.0213789910.0220926440.0260029940.021709312
A20.0219214650.0252916090.0251501080.0260029940.038320407
A30.0245482610.0355318090.034638110.0260029940.038392212
A40.0128316160.0088735920.0141037860.0075444250.007348135
A50.0197860120.0162869720.0186406690.0075444250.013906406
A60.0263813490.0198813390.0264914480.0075444250.020656159
A70.0109229370.0080686040.0068447750.0168111510.008209806
A80.0122835790.0118688970.0115591870.0168111510.013643118
A90.0184631650.0155568670.0142813170.0168111510.025682571
A100.0053102860.0041372650.0048919430.0120186620.008975735
A110.0078047970.0075818660.0086200760.0120186620.015246783
A120.0123213750.0127300470.0099219640.0120186620.027238365
Table 7. Optimised WAVE and DEEP specific costs. DEEP highlights the general trend of decreasing specific costs with increasing capacity, unlike WAVE, likely due to calculation methodologies.
ParameterCase ACase BCase CCase D
Capacity (m3/day)502005001000
WAVE specific water cost (USD/m3)1.0231.1471.1381.141
DEEP specific water cost (USD/m3)10.673.291.991.5
Specific energy (kWh/m3)4.785.575.525.53
Table 8. Pathway rankings based on sum totals of global weights. Higher sum denotes higher rank.
PathwaySUM of Global WeightsRank
A10.1083
A20.1372
A30.1591
A40.050711
A50.07626
A60.1014
A70.050910
A80.06628
A90.09085
A100.035312
A110.05139
A120.07427
Disclaimer/Publisher’s Note: The statements, opinions and data contained in all publications are solely those of the individual author(s) and contributor(s) and not of MDPI and/or the editor(s). MDPI and/or the editor(s) disclaim responsibility for any injury to people or property resulting from any ideas, methods, instructions or products referred to in the content.