1. Introduction
Groundwater constitutes a vital resource for drinking water supply, agricultural irrigation, and industrial activities, playing a pivotal role in sustaining public health and socioeconomic development globally [
1,
2]. However, increasing anthropogenic pressures—such as urbanization, intensive agriculture, and industrial discharges—coupled with climate change-induced variability in precipitation patterns threaten both the quantity and quality of groundwater resources [
3,
4,
5]. In semi-arid and arid regions, where surface water scarcity exacerbates reliance on groundwater, these challenges are particularly acute. Understanding the interplay between geogenic processes, anthropogenic contamination, and climatic factors is thus critical for ensuring sustainable groundwater management.
Water quality assessment requires a multidisciplinary approach integrating hydrochemical analyses [
6], isotopic tracers [
7,
8], advanced statistical techniques [
9], and GIS [
10,
11,
12].
According to global statistics, approximately half of the world’s population lacks access to adequate sanitation facilities, a critical issue linked to the spread of waterborne diseases and over 5 million annual deaths [
13]. Effective water quality assessment and monitoring are essential for sustainable water resource management, enabling policymakers to address challenges such as nutrient enrichment and eutrophication [
14,
15]. Given water’s fundamental role in sustaining life and ecological balance, researchers have prioritized developing robust methodologies to safeguard water quality and ensure equitable access [
16].
To assess and monitor groundwater quality, researchers have employed various methods and techniques, including the Water Quality Index (WQI) [
17], fuzzy logic [
17], and graphical representations such as Wilcox, Riverside, Stiff, Schöeller-Berkaloff, Piper, and Durov plots [
18]. Additional approaches, such as environmental tracers, irrigation indices [
19], machine learning models [
20,
21,
22], and artificial intelligence (AI) [
21,
23,
24,
25], have been utilized to identify and quantify exchange fluxes. Among these, environmental tracer methods are particularly advantageous due to their capacity to deliver both localized point measurements and broad-scale assessments [
26].
Groundwater vulnerability assesses the ability of contaminants to penetrate the aquifer. Vulnerability studies can provide valuable information to stakeholders working to prevent further environmental degradation [
3]. Many arid and semi-arid regions of North Africa suffer from limited water resources due to scarce rainfall and high evaporation rates, exacerbated by climate change [
17]. The management of water resources across many parts of Africa is facing significant challenges in quantitative and qualitative terms [
18].
Many studies conducted in Morocco, in different regions and areas, investigate the groundwater recharge process and its residence time using hydrochemical and isotopic tracers in the Errachidia basin (Central-Eastern Morocco) [
5], Hydrochemical and isotopic assessment for characterizing groundwater quality and recharge processes in Haouz plain aquifer (Central Morocco) [
19], Hydro-chemical study of water quality in the Oued Fez watershed (Saïs Basin, Morocco) [
20], Appraising seawater intrusion in the Moroccan Ghiss-Nekor coastal aquifer: Hydrochemical analysis coupled with GIS-based overlay approach [
21], Mapping the spatiotemporal evolution of seawater intrusion in the Moroccan coastal aquifer of Ghiss-Nekor using GIS-based modeling [
22], Identifying the origin of groundwater salinization in the Bokoya massif (central Rif, northern Morocco) using hydrogeochemical and isotopic tools [
23], Assessment of groundwater mineralization of alluvial coastal aquifer of Essaouira basin (Morocco) using the hydrochemical facies evolution diagram (HFE-Diagram) [
24], Identifying the effects of human pressure on groundwater quality to support water management strategies in coastal regions: A multi-tracer and statistical approach (Bou-Areg region, Morocco) [
25], Multiple stable isotopes and geochemical approaches to elucidate groundwater salinity and contamination in the critical coastal zone: A case from the Bou-areg and Gareb aquifers (North-Eastern Morocco) [
26], Characterization of groundwater in the arid Zenaga plain: Hydrochemical and environmental isotopes approaches [
27], A comprehensive overview of groundwater salinization and recharge processes in a semi-arid coastal aquifer (Essaouira, Morocco) [
28], The salinity origin and hydrogeochemical evolution of groundwater in the Oued Kert basin, north-eastern of Morocco [
29].
Geochemical processes controlling groundwater quality under semi-arid environment: A case study in central Morocco [
30], Index-based groundwater vulnerability and water quality assessment in the arid region of Tata city (Morocco) [
31], Multi-tracer approach for assessing complex aquifer systems under arid climate: A case study of the River Tata catchment in the Moroccan Anti-Atlas Mountains [
32], Geochemical and isotopic (oxygen, hydrogen, carbon, strontium) constraints for the origin, salinity, and residence time of groundwater from a carbonate aquifer in the Western Anti-Atlas Mountains, Morocco [
33], Origin and residence time of groundwater in the Tadla basin (Morocco) using multiple isotopic and geochemical tools [
34], Seawater intrusion assessment in the Bir Guendouz-Boulanoire coastal transboundary aquifers of Morocco and Mauritania [
35]. Hydrochemical studies of groundwater in the Oum Er Rbia region [
30,
36].
Other studies conducted in different regions and areas under semi-arid environments, in developing countries, Groundwater Sustainability in Arid Regions Using Environmental Isotopes Hydrology Cursors [
37], for example in Algeria, the authors studied groundwater quality in semi-arid areas of Algeria and Impacts on potable water supply and agricultural sustainability [
38], Integrated assessment of groundwater quality in Souk Ahras region [
39], using Geo-chemical and isotopic relationships between groundwater and rainwater in the Zaccar karst system (Northern Algeria) [
40]. In Tunisia, the authors studied the Groundwater recharge estimation under a semi-arid climate in the Northern Gafsa watershed [
41], via Geo-statistical Analyses and Groundwater Modelling [
42], Groundwater salinity in a semi-arid region of central-eastern Tunisia: insights from multivariate statistical techniques and geostatistical modeling [
43], Groundwater quality assessment for drinking and irrigation purposes by utilizing integrated water quality indexes in a semi-arid region, SE Sfax area, [
44] and Combined geophysical approach as a tool to identify spatial groundwater aquifer distribution in structurally complex area. Case study of the Kasserine aquifer system (central Tunisia) [
45].
Few studies in Libya, evaluate Challenges and Potentials Irrigation Water Resources [
46]. In Egypt, the researchers integrate conventional and remote sensing to map groundwater potential areas using the analytical hierarchy process method, North Wadi Diit,
https://doi.org/10.1038/s41598-025-94598-7 (accessed on 28 May 2025), Potentiality Delineation of Groundwater Recharge in Arid Regions Using Multi-Criteria Analysis
https://doi.org/10.3390/w17050766 (accessed on 28 May 2025), Combining Hydro-Geochemistry and Environ-mental Isotope Methods to Evaluate Groundwater Quality and Health Risk (Middle Nile Delta)
https://doi.org/10.3390/hydrology12040072 (accessed on 28 May 2025), Groundwater of the eastern Egyptian desert: Age and salinity patterns
https://doi.org/10.1016/j.apgeochem.2025.106367 (accessed on 28 May 2025) Innovative Machine Learning, Iso-topic, and Hydrogeochemical Techniques for Groundwater Analysis in Arid Land-scapes in Egypt’s Eastern Desert
https://doi.org/10.1007/s41748-025-00628-9 (accessed on 28 May 2025)and the hydrogeochemical processes and its impact on the quality of groundwater in the area between Abu Simbil and Tushka, Western Desert, Egypt
https://doi.org/10.1038/s41598-025-90669-x (accessed on 28 May 2025).
Stable isotopes
18O and
2H, integral components of the water molecule, are widely recognized environmental tracers. They provide critical insights into groundwater origin, flow pathways, and chemical evolution. Similarly, dissolved inorganic carbon (DIC) isotopes, such as
13C, serve as indicators of biogeochemical processes affecting groundwater [
30]. Strontium isotope ratios (
87Sr/
86Sr) are employed to assess the lithological composition of aquifer formations and the degree of water-rock interaction [
33].
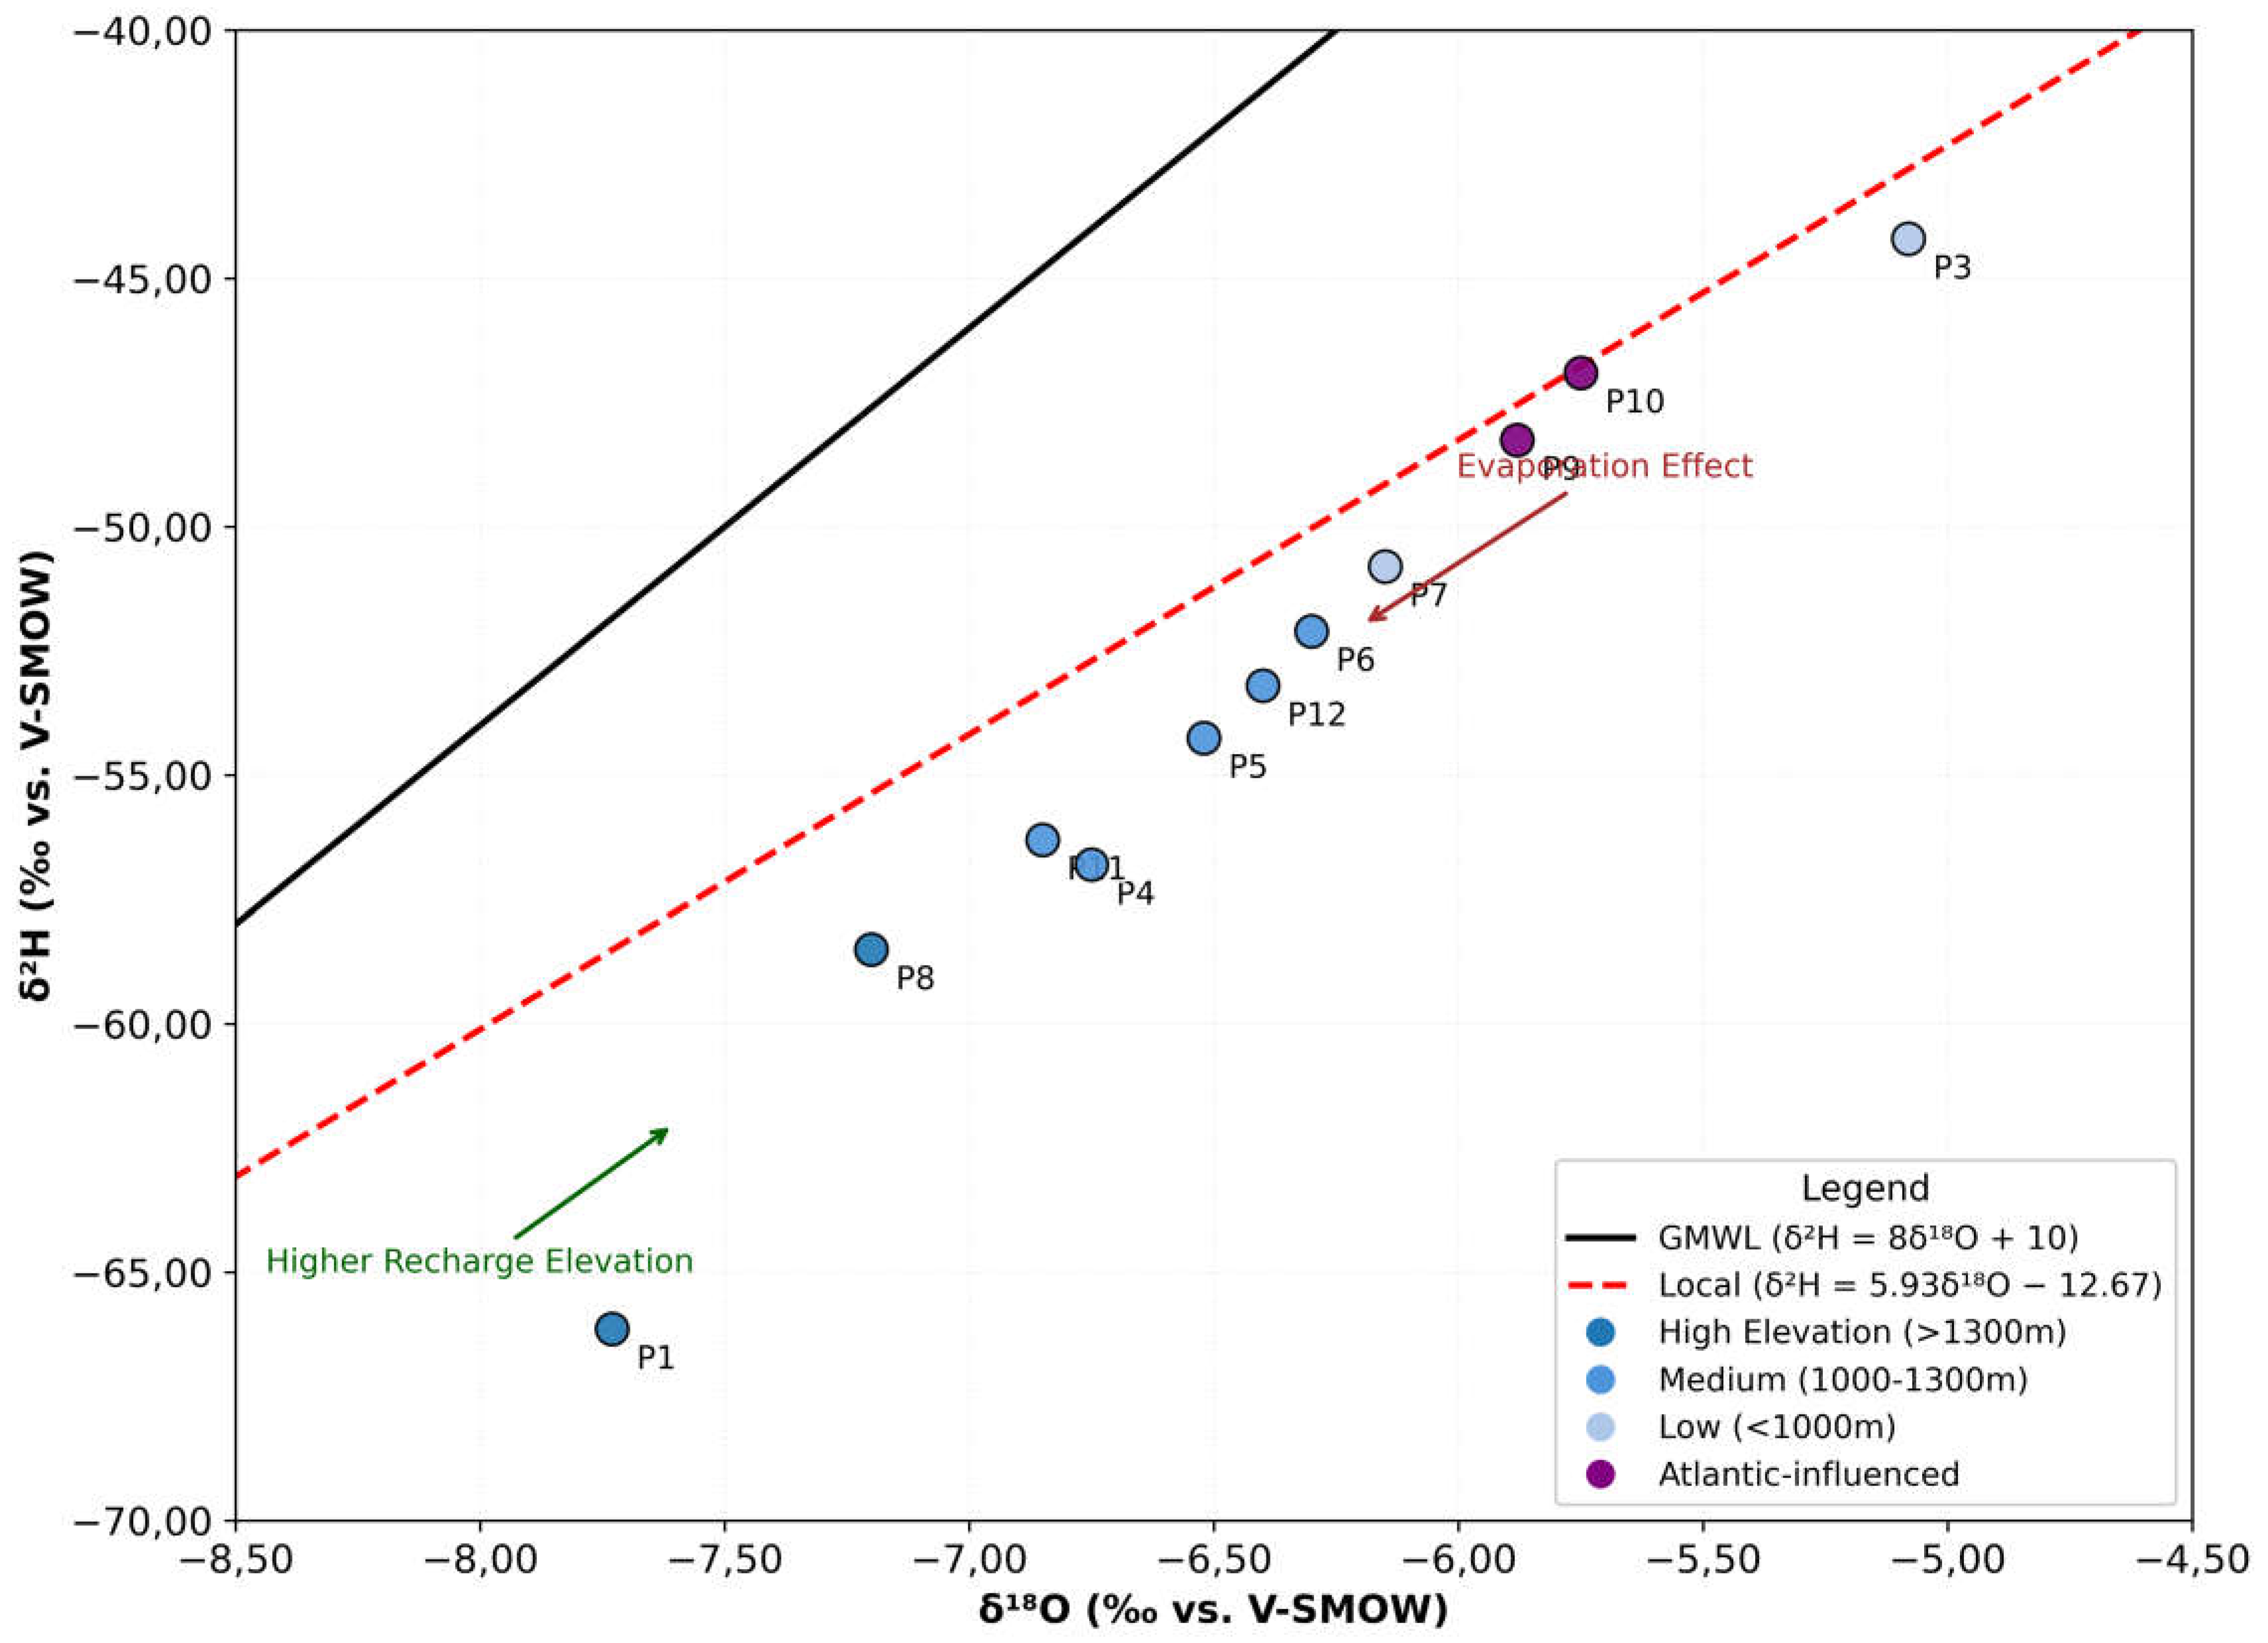
Precipitation typically falls along the meteoric water line (MWL), which has a slope of 8 and is defined by the equation δ
2H (‰) = 8δ
18O (‰) + 10, known as the Global Meteoric Water Line (GMWL). However, in semi-arid and arid environments, meteoric water isotopic signatures often deviate from this line due to evaporative enrichment either before or after infiltration, resulting in a slope lower than 8 in the δ
2H versus δ
18O relationship. This deviation reflects a relative enrichment in heavy isotopes. In other cases, a shift away from the GMWL can also be caused by the mixing of meteoric waters with ocean-derived waters, such as those from the Atlantic Ocean, which possess distinct isotopic signatures. Such mixing processes can alter both the slope and intercept of the δ
2H–δ
18O relationship, indicating the influence of multiple water sources [
34]. Isotope hydrology methodologies are increasingly vital in groundwater studies for characterizing water resources, both by analyzing the water molecule (δ
2H, δ
3H, and δ
18O) and the isotopic composition of dissolved compounds (e.g., δ
13C,
14C, δ
15N, and δ
34S), as well as for assessing groundwater contamination and refining resource characterization [
35].
Naturally occurring stable and radioactive isotopes in water enable the identification of their origin, average residence time, and recharge rates in groundwater systems, ensuring their long-term sustainability as reliable resources for human consumption, agriculture, irrigation, and industrial activities [
35]. To safeguard groundwater and promote sustainable local economic development, a comprehensive assessment of water quality in the Guire aquifer is imperative [
36]. This study focuses on evaluating groundwater quality in southern Morocco’s Guire aquifer, with results from a hydrochemical and multi-isotopic approach presented herein.
A multidisciplinary approach combining hydrochemistry, stable nitrate isotopes (δ15N<sub>NO3</sub>), multivariate statistical techniques, and GIS was employed to assess groundwater quality in the study area. This article underscores the role of environmental isotopic tracers in advancing the understanding of groundwater resources in southern Morocco.
Despite the growing body of research on groundwater in Morocco, the upper Guir Basin remains largely unexplored from a hydrogeological perspective. This study represents the first detailed investigation combining hydrochemical and isotopic characterization in this area, making it both exploratory and original. The selection of this zone was guided by its scientific, environmental, and socio-economic relevance. From a hydrological standpoint, aquifers in the region play a key role in recharging downstream basins, especially under conditions of increasing water stress in eastern Morocco. A thorough assessment of water quality and aquifer dynamics is thus essential for informed and sustainable groundwater resource management. Moreover, the area shows significant potential for future investment in irrigated agriculture, rural development, and ecotourism, all of which require a deep understanding of available water resources. This study therefore fills a critical knowledge gap while providing a foundation for future development and water governance strategies in the region.
2. Materials and Methods
2.1. Study Area
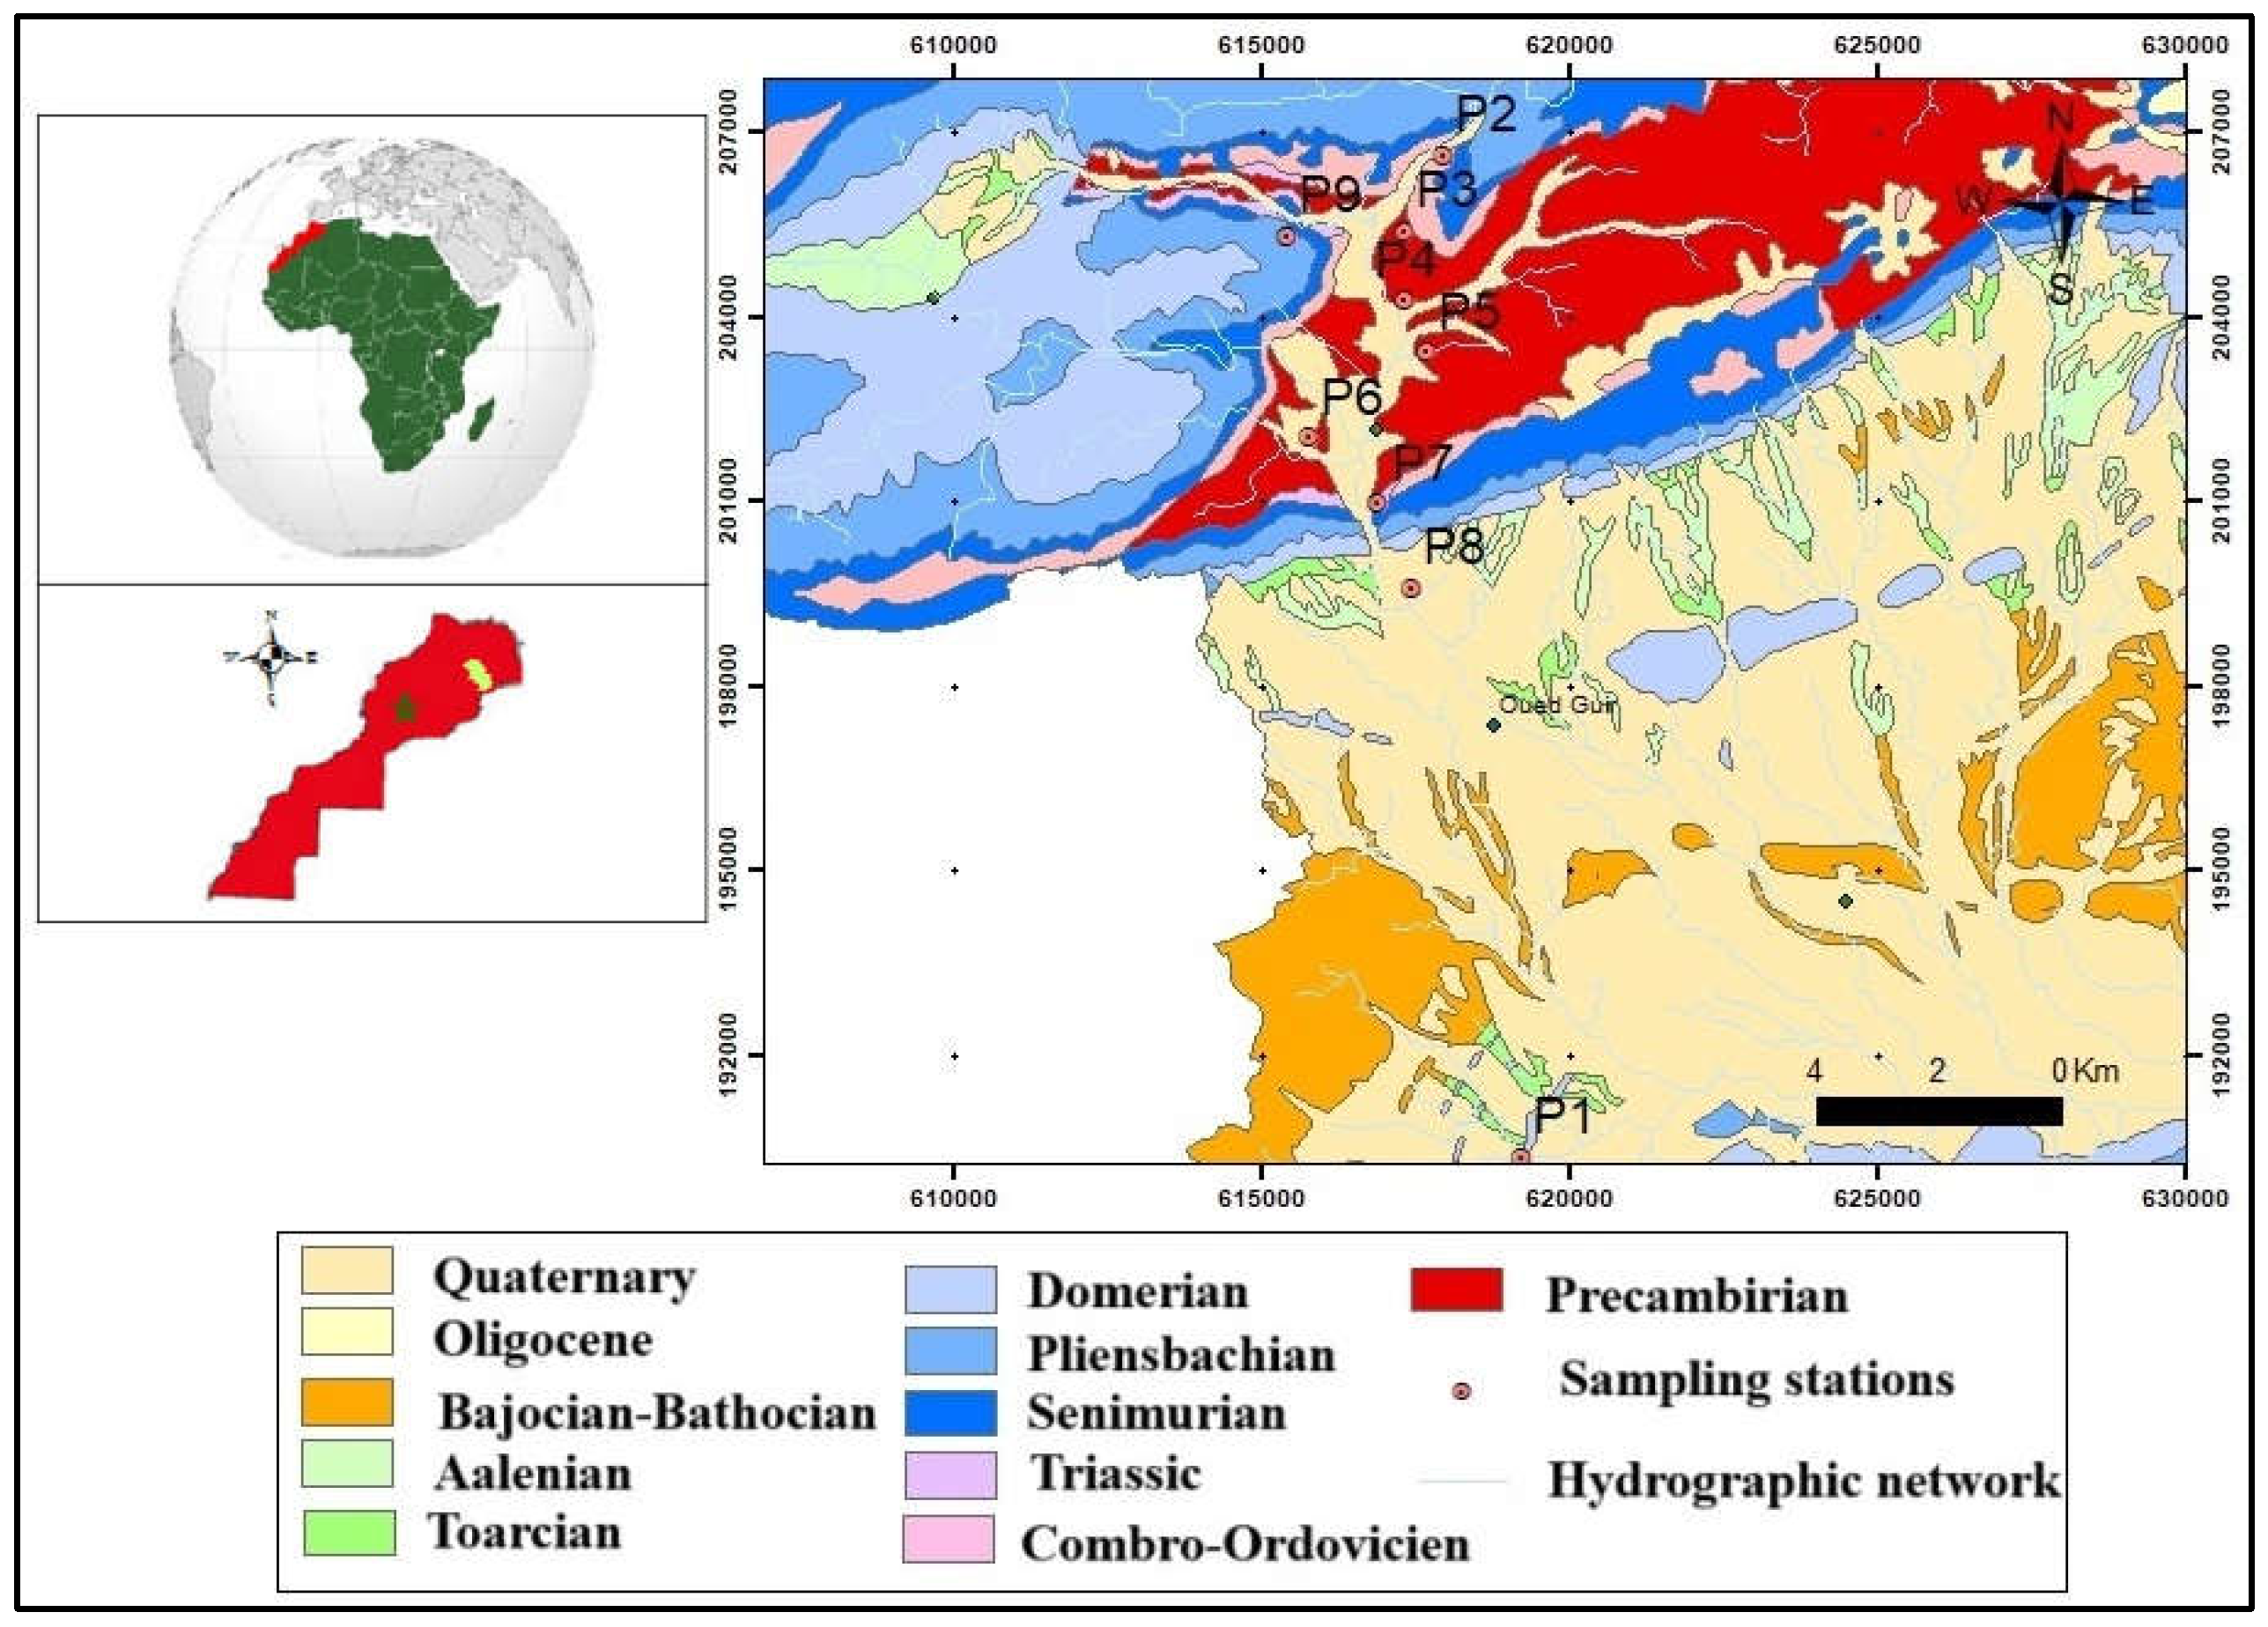
The study area lies within the Guir Basin, geographically situated between Lambert coordinates X (615,000–625,000 m) and Y (190,000–207,000 m) [
37] (
Figure 1). Administratively, it is located near Guerrama in the Errachidia Province.
The selection of this area is justified by several scientific and socio-economic factors. Hydrogeologically, the region remains poorly known, and this study constitutes the first detailed investigation of its groundwater characteristics, giving it a pioneering value. Moreover, the aquifers in this area play a key role in recharging downstream basins, especially under increasing water stress conditions in eastern Morocco.
In addition, the area holds significant potential for future investment, particularly in irrigated agriculture, rural development, and ecotourism. Understanding the quality and behavior of groundwater resources is essential for any future planning or sustainable development initiative in the region.
2.2. Geological Framework
The geological formations in the study area are predominantly Jurassic deposits influenced by faulting and folding during the Hercynian orogeny. As illustrated in
Figure 1, the Guir Basin comprises Triassic strata composed of detrital deposits and doleritic basalt interbedded with evaporite layers. These strata lie in angular unconformity above the deformed Paleozoic basement, which was structured by multiple tectonic phases, and are further characterized by Cambro-Ordovician paleothresholds and boutonnière structures (Mougger). The Jurassic series rests conformably on the Triassic-Lower Lias red formations. Their lithology consists primarily of dolomite, limestone, calcareous marl alternations, and siliciclastic detritus (
Figure 1).
2.3. Hydrological and Hydrogeological Frame
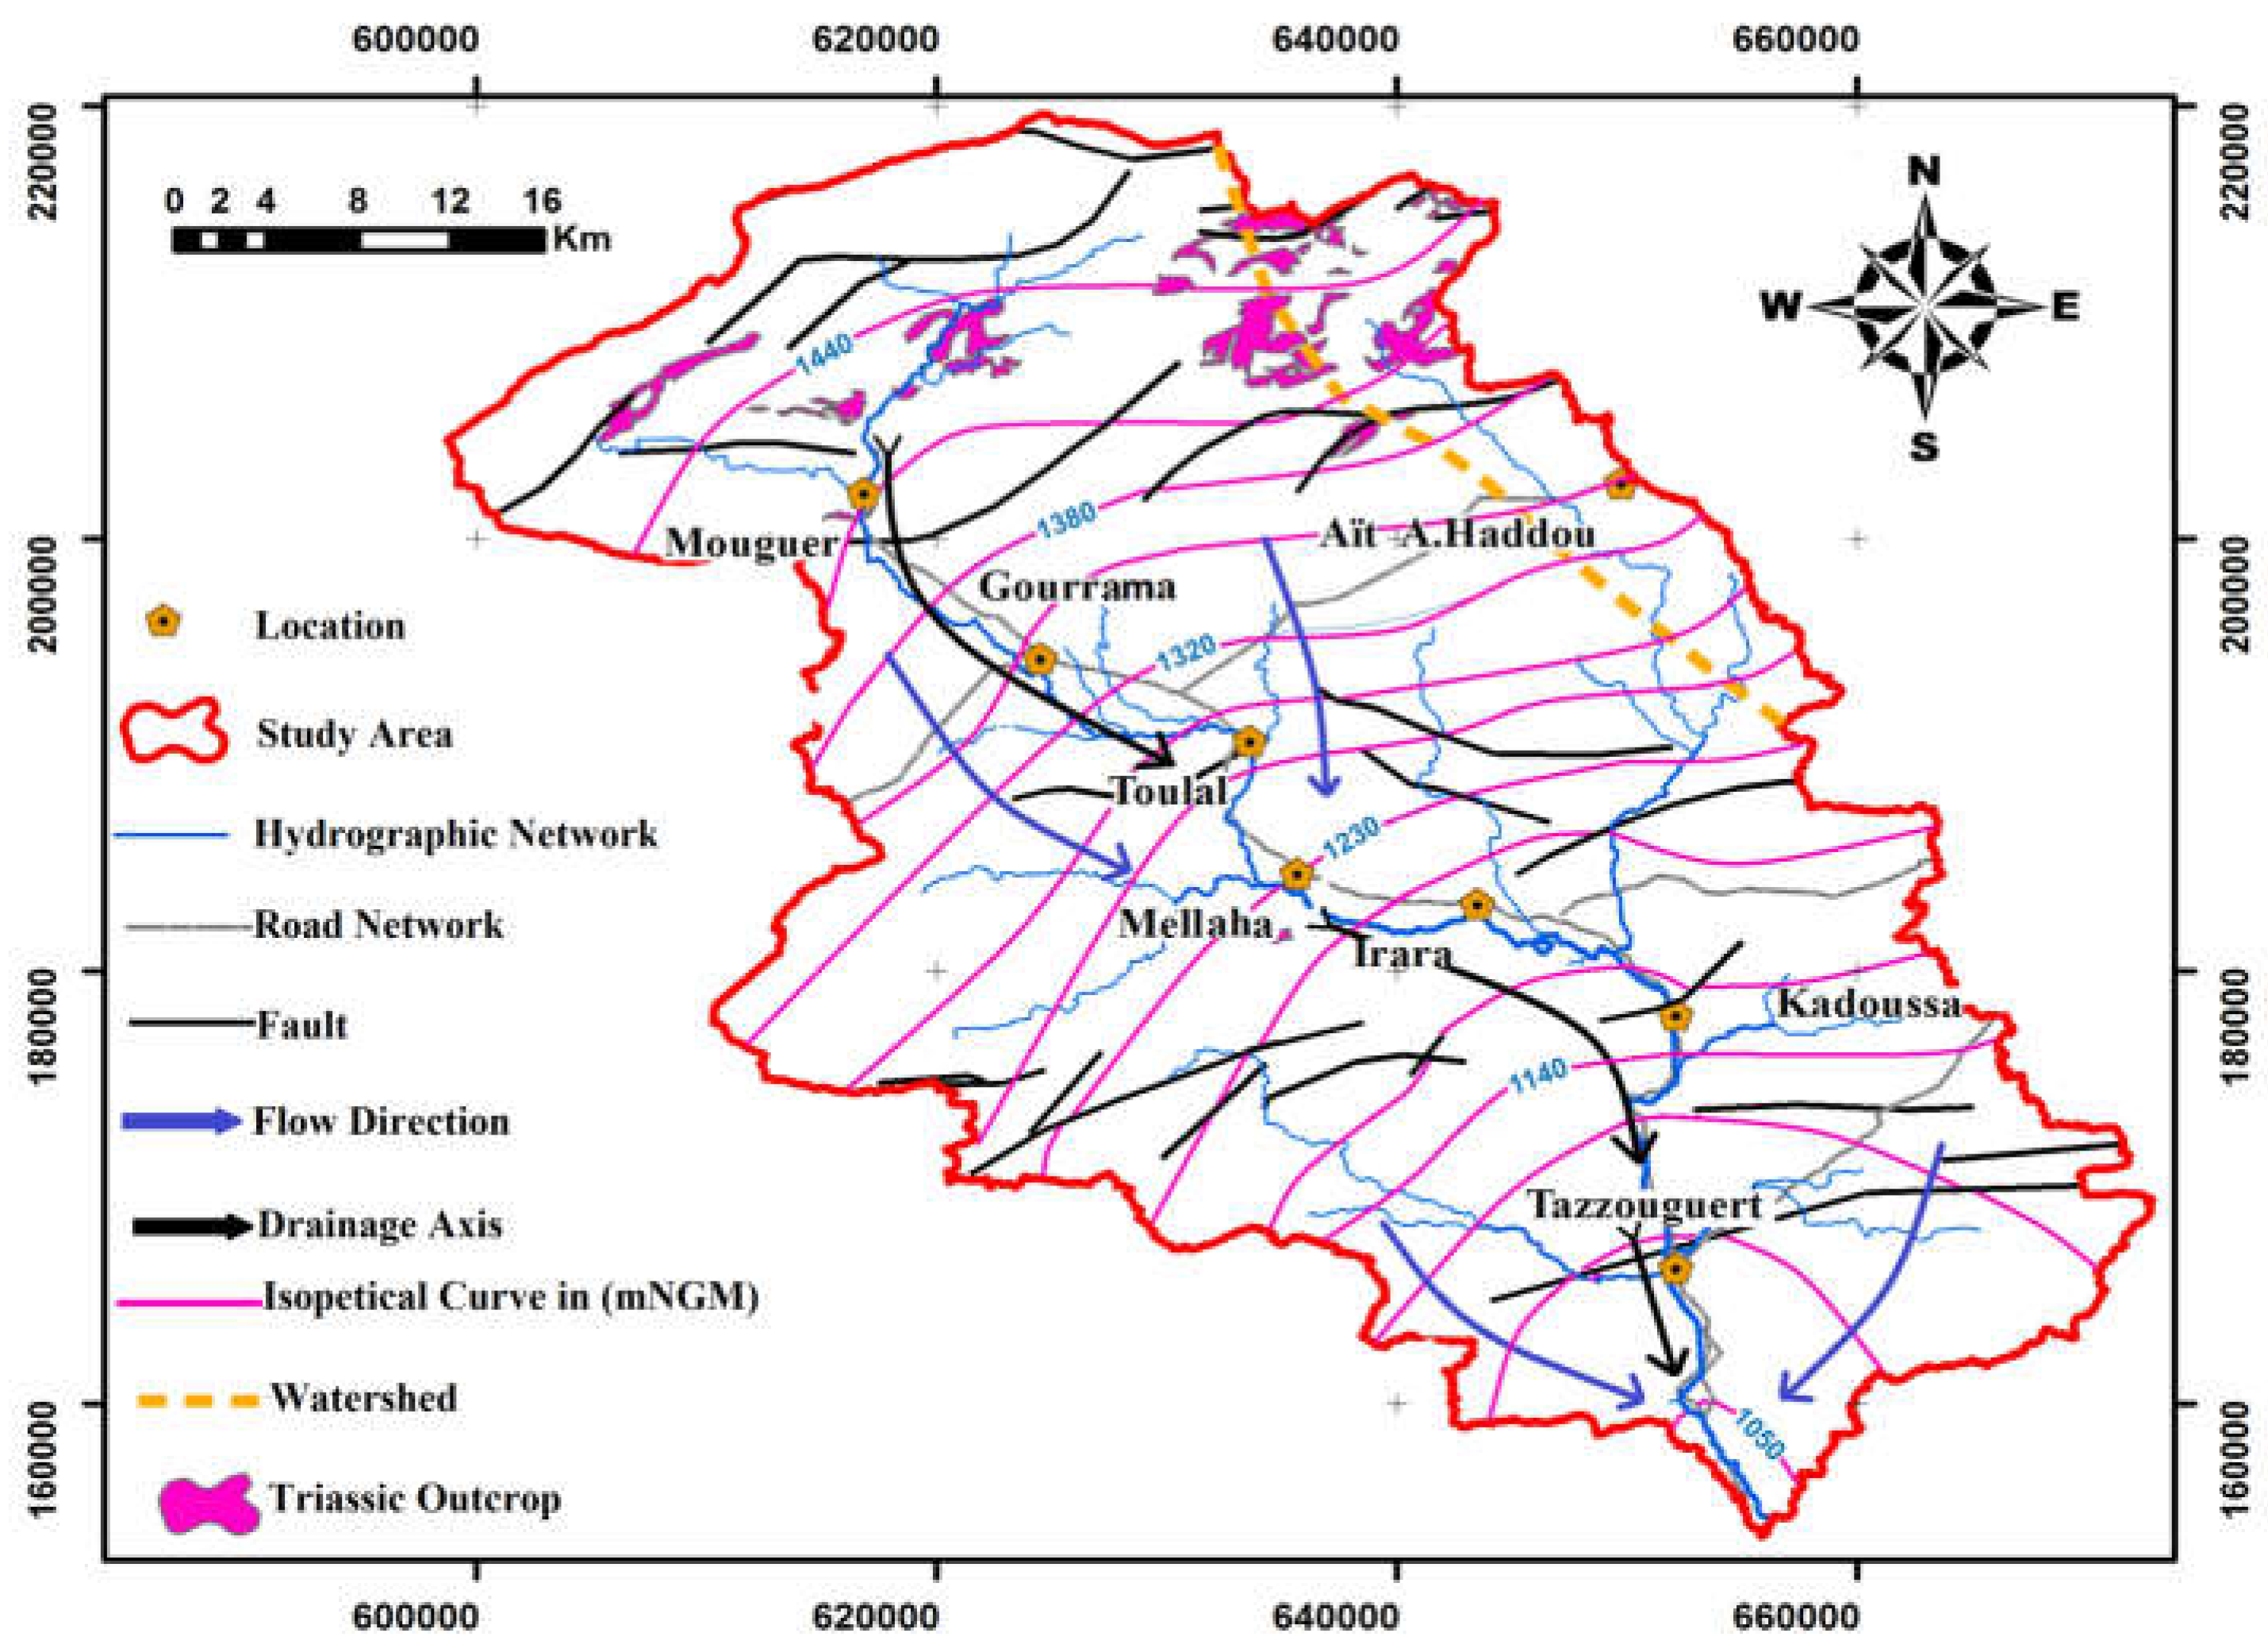
The upper Guir basin is located in a semi-desert bioclimatic zone. Temperatures there show significant seasonal variations, ranging from approximately −2 °C to 46 °C. Summer (June to September) is marked by very high temperatures, with maximums reaching 46 °C in July and August, while winter (December to February) experiences significantly lower temperatures, with minimums falling below 0 °C, particularly in January. These significant differences reflect a continental climate, accentuated by the aridity and continentality of the region. (
Figure 2).
The aquifer systems in the Rheris watershed are: (1) Plio-Quaternary alluvium aquifers containing essentially, conglomerates, gravels, and pebbles, located along the valleys; (2) Cretaceous Aquifer generally containing limestone with a karst behavior, sand, and sandstone; (3) Lias-Domerian lower aquifer with limestone and dolomite, often fractured and sometimes karstified; (4) Aalenian-Dogger aquifer with the limestonemarl with cracked and karst networks.
2.4. Study Objective
Characterize groundwater quality using conventional hydrochemical analyses and synthetic indices such as the Water Quality Index (WQI).
Identify the dominant geochemical processes (such as evaporite dissolution or ion exchange) controlling the chemical composition of the water.
Use stable isotope tracers (δ18O, δ2H) to trace the origin of groundwater and associated phenomena (evaporation or water mixing).
Apply multivariate statistical tools (PCA) and GIS techniques for spatialization and data interpretation, with a view to identifying vulnerable areas and potential sources of contamination.
Provide a solid scientific basis for the sustainable management of water resources in this region, with a view to territorial development and planning potential agricultural, tourism, or rural investments.
2.5. Methodology
2.5.1. Groundwater Sampling and Chemical Analysis
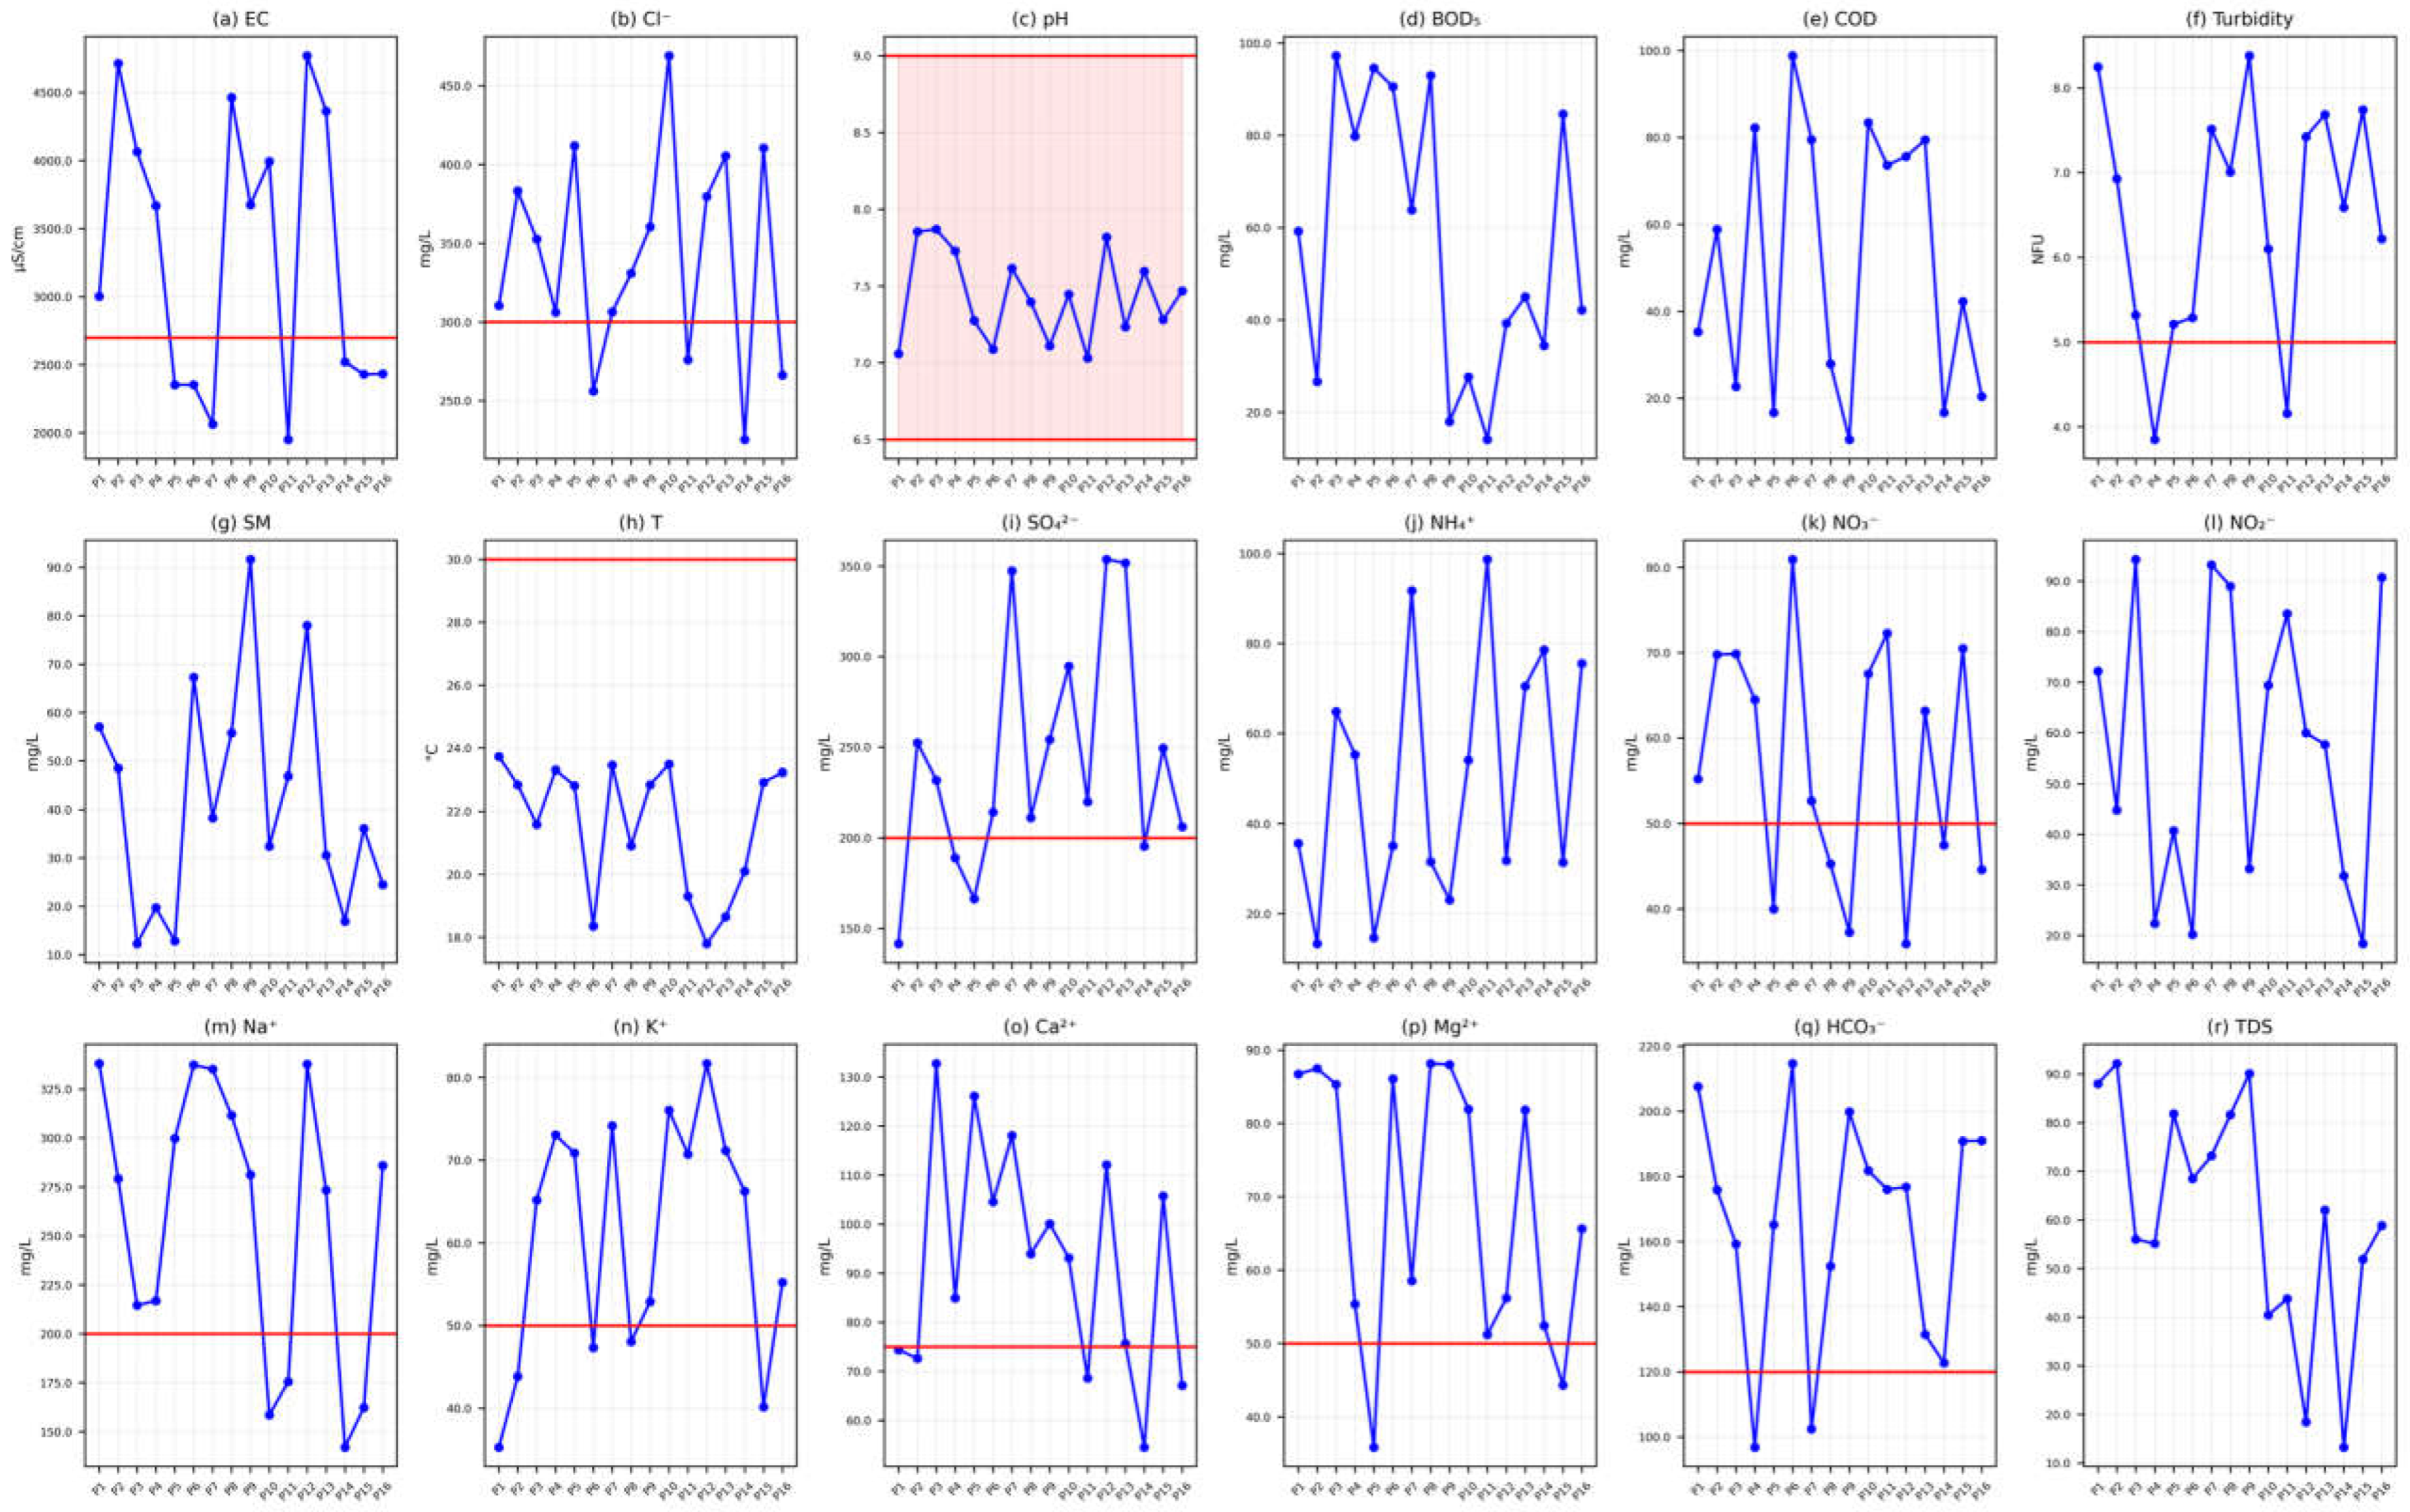
Groundwater samples were analyzed both in situ and in the laboratory for physicochemical and isotopic characterization. Field measurements of pH, temperature (T), turbidity, and electrical conductivity (EC) were conducted using a multiparameter probe (Hanna HI 9811-5, Hanna Instruments Inc., Woonsocket, RI, USA). Total dissolved solids (TDS) were calculated from EC values using the standard formula: TDS = EC × 0.65. Major ions—including calcium (Ca2+), magnesium (Mg2+), sodium (Na+), potassium (K+), ammonium (NH4+), bicarbonate (HCO3−), chloride (Cl−), sulfate (SO42−), nitrate (NO3−), and nitrite (NO2−)—were quantified following standard water quality protocols outlined by APHA (2012).
Calcium (Ca2+) and total hardness (TH) were determined via titration with a standardized EDTA solution (Merck KGaA, Darmstadt, Germany). Magnesium (Mg2+) concentrations were derived by subtracting Ca2+ values from TH. Bicarbonate (HCO3−) and chloride (Cl−) ions were analyzed using sulfuric acid (H2SO4, Sigma-Aldrich, St. Louis, MO, USA) and silver nitrate (AgNO3, Sigma-Aldrich, St. Louis, MO, USA) titration, respectively.
Sodium (Na+) and potassium (K+) levels were measured with a flame photometer (Model 130, Systronics, Ahmedabad, India). Sulfate (SO42−) concentrations were assessed via UV-visible spectrophotometry (Model 135, Systronics, Ahmedabad, India), while nitrate (NO3−) was quantified using a colorimeter (Model 112, Systronics, Ahmedabad, India).
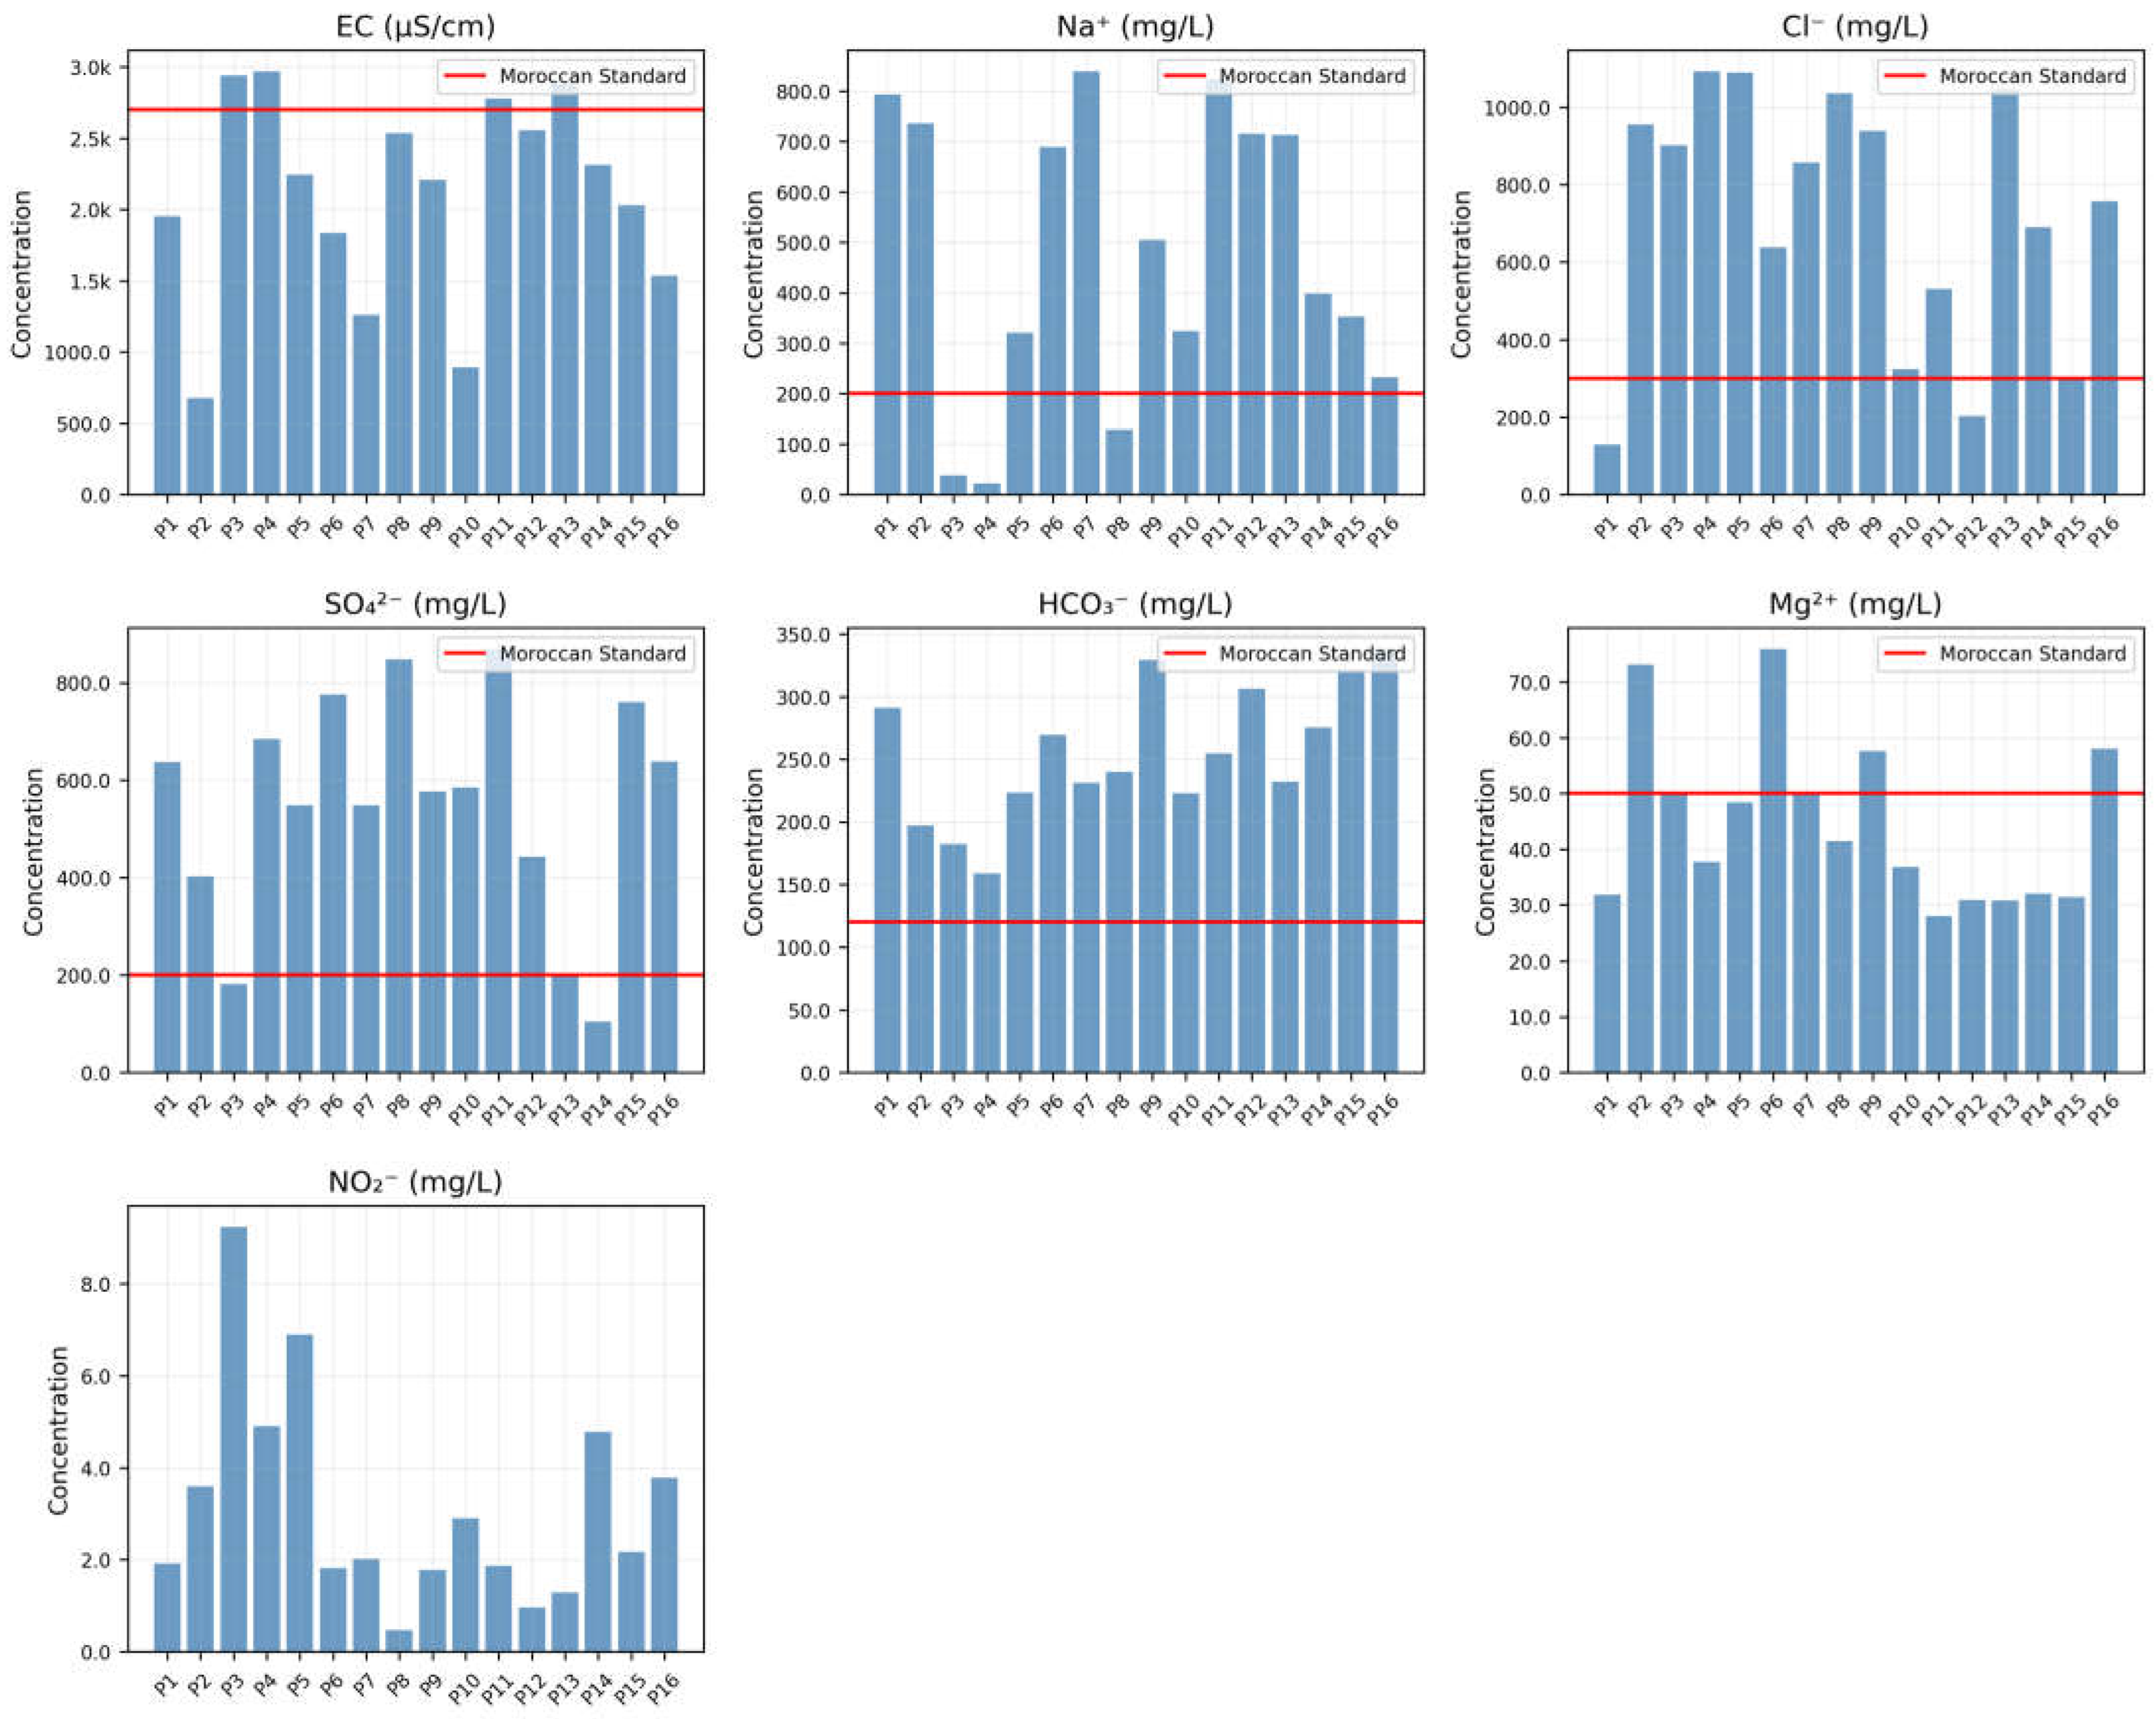
The analytical methods and corresponding Moroccan standard limits for each parameter are summarized in
Table 1.
2.5.2. The Ionic Balance Error (IBE)
The Ionic Balance Error (IBE) was calculated to assess the accuracy of the chemical analyses by comparing the total concentrations of cations (∑[cations]) and anions (∑[anions]) in each groundwater sample, expressed in meq/L. The IBE was computed using the following equation:
All samples exhibited an IBE of less than 5%, indicating acceptable analytical precision in the measured ionic composition.
2.5.3. Calculation of Chloro-Alkaline Indices
To differentiate between cation exchange and reverse ion exchange processes in the groundwater system, chloro-alkaline indices (CAI-I and CAI-II) were calculated using Equations (2) and (3). These indices determine the dominant ionic exchange mechanism: Cation exchange occurs when Ca
2+ and Mg
2+ ions in groundwater are replaced by Na
+ and K
+ ions from aquifer materials. Reverse ion exchange refers to the replacement of Na
+ and K
+ ions in groundwater by Ca
2+ and Mg
2+ ions from aquifer materials [
38].
2.5.4. Stable Isotope Analyses
Oxygen-18 and deuterium, tracers internal to the water molecule, offer the greatest probability of behaving like water in a given environment, thanks to their dimensions and peripheral electron densities close to those of the water molecule. Therefore, the reliability of isotope studies will be greater the wider the variation ranges of these tracers.
Taking into account the causes of variations in isotope contents in water, such as temperature, altitude, or the effect of continentality, regions characterized by very distinct climatic conditions, such as arid and semi-arid zones, are ideal study sites. Indeed, the study of stable isotopes of the water molecule will provide additional information on the origin of water masses as well as the history of their surface and subsurface movements, which are difficult to obtain using conventional methods.
2.5.5. Isotopic Content of Precipitation
Estimating aquifer recharge altitudes is particularly interesting for the Atlas Mountains, where recharge zones are poorly understood. Generally, isotopes of the water molecule (Oxygen-18, Deuterium) are among the most widely used in aquifer investigations. They are expressed using delta notation, defined by Craig (1961) as:
The isotopic abundance ratio (R) is defined as
18O/
16º or
2H/
1H. Positive δ-values denote enrichment of the sample relative to the reference standard, while negative values indicate depletion. For δ
18O and δ
2H (Deuterium), the reference standard is the Standard Mean Ocean Water (SMOW), where oceanic water is assigned a value of 0‰ by definition. Globally, the δ
18O and δ
2H composition of precipitation unaffected by evaporation follows a linear relationship, termed the Global Meteoric Water Line (GMWL). The GMWL is expressed as:
The intercept of the Global Meteoric Water Line (GMWL) represents the deuterium excess (d-excess), which is 10‰ for precipitation of oceanic origin. The slope (8) reflects equilibrium conditions during condensation at saturation. While no rainwater was sampled in this study, δ18O and δ2H values from precipitation in neighboring regions were analyzed:
- -
Middle Atlas (Fez-Meknes plain, >600 m altitude):
δ18O of precipitation: −5‰ vs. SMOW.
Recharge zone of the Liassic aquifer (limestone plateau): δ18O ≈ −7.3‰ vs. SMOW.
- -
Oulmes region (1260 m altitude, 100 km SE of Rabat):
δ18O of non-evaporated water: −6‰ to −7‰ vs. SMOW.
- -
Souss Valley (1000 m altitude):
δ18O of precipitation: −5.6‰ vs. SMOW.
- -
Western High Atlas (Agadir region):
δ18O of rainwater: −7‰ to −3.5‰ vs. SMOW.
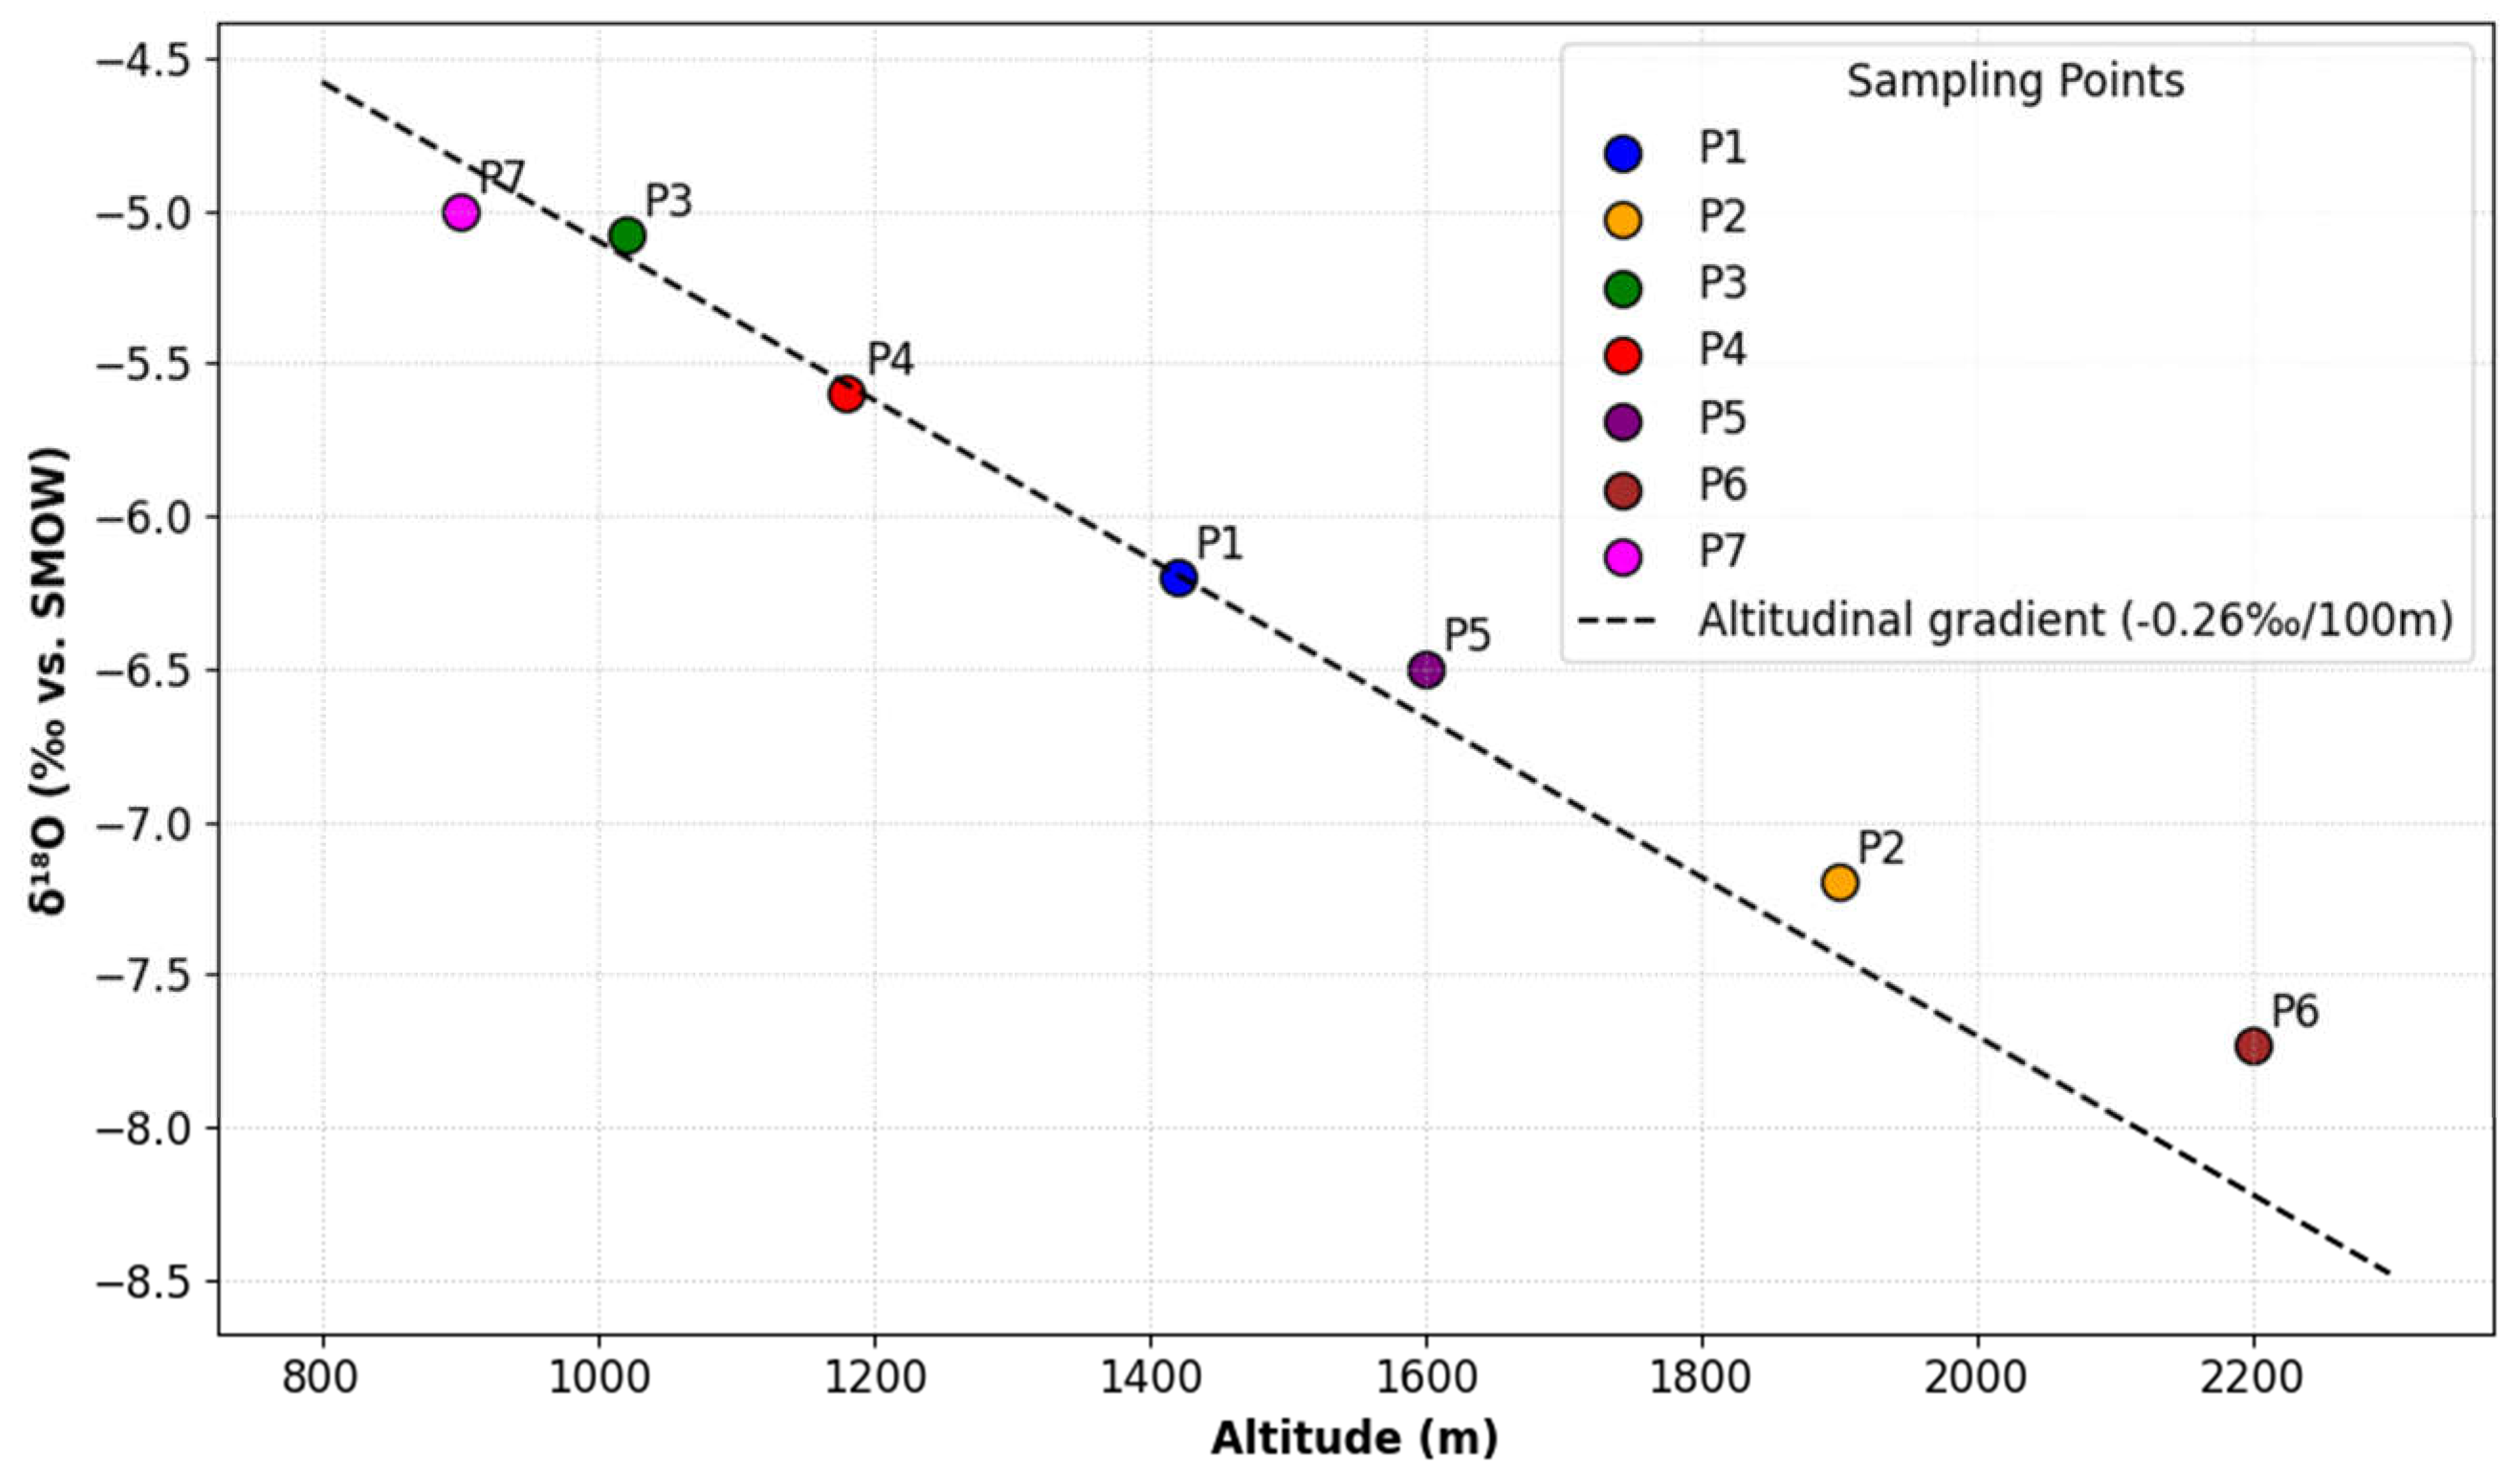
The most isotopically depleted waters (δ18O: −7‰ to −8‰ vs. SMOW) occur in high-altitude areas of the High and Middle Atlas ranges. This depletion aligns with the altitude effect, where δ18O decreases by −0.3‰ per 100 m in the Beni Mellal Atlas and −0.26‰ per 100 m in other Atlas regions, as documented in prior studies.
Morocco’s precipitation isotopic data closely follow the GMWL (δ2H = 8δ18O + 10), confirming its utility as a regional reference for isotopic hydrology. Precipitation in the Atlas Mountains (>1000 m altitude), predominantly of oceanic origin, exhibits δ18O values of −7‰ to −8‰ vs. SMOW, consistent with high-altitude isotopic fractionation.
2.6. Water Quality Index (WQI)
WQI is one of the most widely used tools for assessing water quality. It provides policymakers and stakeholders with a clear, comprehensive overview of a water body’s pollution status. The standard development process for a WQI involves four steps: (1) parameter selection, (2) weight assignment, (3) sub-index function development, and (4) aggregation of weighted sub-index values [
39].
Over the years, numerous WQI models have been developed to consolidate water quality datasets into a single cumulative value, enabling straightforward comparisons between different water sources and tracking changes over time or under varying conditions. This indexing system generates actionable insights for water managers, policymakers, and the public, aligning with frameworks like the EU Water Framework Directive (WFD). However, most WQIs focus narrowly on physicochemical parameters (e.g., nutrients, organic pollutants, dissolved oxygen levels), limiting their scope [
40].
While specific methodologies vary, WQI development generally follows four sequential steps:
Selection of water quality parameters
Generation of parameter sub-indices
Assignment of parameter weights
Aggregation of weighted sub-indices
Step-by-Step Development
WQI models typically include 8–11 parameters, though the total may range from 4 to 26.
Measured parameter values are converted into unitless sub-indices using methods such as linear interpolation, rating curves, or direct concentration ratios. While most models apply these techniques, some omit this step.
Parameters are assigned weights based on their environmental or health impacts, often using unequal weighting (e.g., Analytic Hierarchy Process [AHP] or House Index methods). Adjusting weights for specific applications enhances accuracy. Proper weighting improves model robustness by reducing uncertainty, whereas inappropriate weights compromise results.
Weighted sub-indices are combined via functions (additive, multiplicative, harmonic mean, etc.) to calculate a final WQI score. This score is categorized using model-specific rating scales.
The WQI has been widely adopted for freshwater monitoring, including in the Suquía River (Argentina), Bagmati River (Nepal), Sapanca Lake (Turkey), and Terengganu River (Malaysia). It effectively identifies pollution trends and facilitates spatial-temporal comparisons. However, methodologies vary: for example, the Bagmati River WQI uses 18 parameters, while the Suquía River model employs 20. Streamlined WQIs are increasingly favored to reduce redundancy (e.g., correlated variables) and analytical costs. Customized indices must also account for local factors like land use changes or anthropogenic activities [
41].
The WQI was first introduced by Horton in 1965, using 10 parameters to rate water quality. Brown later refined this into the NSF-WQI with support from the National Sanitation Foundation [
13]. A panel of 142 experts established its parameter selection and weighting criteria, paving the way for subsequent models [
13].
As a mathematical tool, the WQI simplifies complex water quality data into a single numeric value [
42,
43]. In Morocco, it has been applied to assess groundwater [
1,
17] and surface water [
45], including proposals for a “global pollution index” [
46,
47].
This study evaluates drinking water quality in 16 wells from the Guire aquifer using the WQI. Results were compared against Moroccan drinking water standards to identify contaminants and inform sustainable management strategies for local stakeholders.
The Weighted Arithmetic Water Quality Index (WQI) was applied to assess water quality in this study. This method assigns parameter-specific weights (
Wi) based on expert judgment of their relative health and environmental impacts [
47]. The WQI calculation followed five sequential steps:
Each parameter’s relative weight was determined using Equation (6):
where
Wi = assigned weight for parameter
, and
= total number of parameters.
- -
Quality Score (qi):
The quality score for each parameter was computed via Equation (7):
where
Ci = measured concentration and
Si = permissible limit (WHO/EPA standards).
- -
pH Adjustment (QpH):
For pH, a modified quality score (QpH ) was calculated using Equation (8):
where
CpH = measured pH value.
- -
Sub-index (SIi):
Sub-indices for each parameter were derived from Equation (9):
Based on the computed Groundwater
WQI (GWQI) and Surface Water
WQI (SWQI), water quality was categorized as per
Table 2.
2.7. Irrigation Water Quality (IWQI)
Water quality is thus an important element in the sustainable use of water for irrigation, particularly in cases where salinity development is expected to be a problem in an irrigated agricultural area. The hydrochemical characteristics of the main GW and SW variables are used in this evaluation to determine the suitability for irrigation. The next paragraph provides a number of calculations that may assist in establishing the suitability of irrigation water [
1].
Equation (6) is used to determine the sodium adsorption rate SAR [
47], which is defined as the salt risk associated with calcium and magnesium concentrations.
Equation (7) is used to calculate the RSC, that plays an important part of irrigation water. In addition, there is another approach, which is widely used to understand the effects of excess calcium and magnesium on soil and is calculated by the equation below [
1].
The risk of magnesium (MH) Equation (9) and the percentage of sodium (%Na) Equation (8) are important parameters that can be used to evaluate the quality of GW and its appropriateness for irrigation purposes. A well-known classification was developed by Wilcox which was documented and used in the literature for a long time. The GW and SW were classified into five classes of Equations (8) and (9). PI is an index for the permeability of water in soil (Equation (10)) [
1].
Sodium, compared to Ca
2+ and Mg
2+, KI > 1 indicates an excess of salt, whereas a KI < 2 indicates a shortfall in water (Equation (11)). Salinity Potential (PS) (Equation (12)) refers to the quantity of salt that builds up in the soil, which is constantly dissolved in irrigation water, increasing salinity as determined by the formula below. Since most natural waters do not have substantial levels of carbonate ions and bicarbonate ions do not precipitate magnesium ions, the alkalinity hazard will be measured by an indicator known as residual sodium bicarbonate (RSBC) and calculated using Equation (13). The calculation methods and classification criteria for irrigation quality parameters are provided in
Table 3. General hydrochemical characteristics of groundwater are summarized in
Table 4) [
1].
2.8. Multivariate Statistical Analysis
The water quality index provides a clear and comprehensive picture of groundwater quality. Principal component analysis provides a statistical basis for parameter reduction using a minimal number of parameters. Parameter selection is based on data availability [
49].
Principal components analysis (PCA) has been used to group together individual parameters to form a composite indicator with the motive to use the entire data set to capture maximum variance with a minimum number of parameters. This also requires individual indicators to have a common unit hence they have been normalized (by using the z-score in this study) prior to PCA. The factors estimated (using PCA) form clusters of indicators having the strongest associations amongst themselves. Therefore, the final aggregate is based on the “statistical” dimensions of the normalized dataset and is independent of the dimensionality of the original data set [
49].
In the final study after the parameter reduction step comes the important step of estimating weights in which some researchers prefer equal weights to all parameters, while others opt for either subjective or objective methods Following this sub-index is developed by using rating curves and other methods described in the literature [
49].
Multivariate statistical analyses such as principal component analysis (PCA) and correlation analysis were carried out by the XLSTAT (Version 2016, Addinsoft SARL, Paris, France). Generally, the PCA method in hydrogeochemical studies condenses a big collection of data into a few components that have comparable properties. In order to show relationships between data set variables and the influence of certain chemical parameters, a correlation analysis was also carried out [
50].
2.9. Geographic Information System (GIS)
The Geographic Information System (GIS) is a software-based technology to determine the spatial distribution of groundwater chemical quality. ArcGIS (Version 10.7, Esri Inc., Redlands, CA, USA) was used for the spatial distribution of parameter zones, using the inverse distance weighted interpolation technique [
51].
