
Hydrogeochemical Signatures and Spatiotemporal Variation of Groundwater Quality in the Upper and Lower Reaches of Rizhao Reservoir

Abstract
1. Introduction
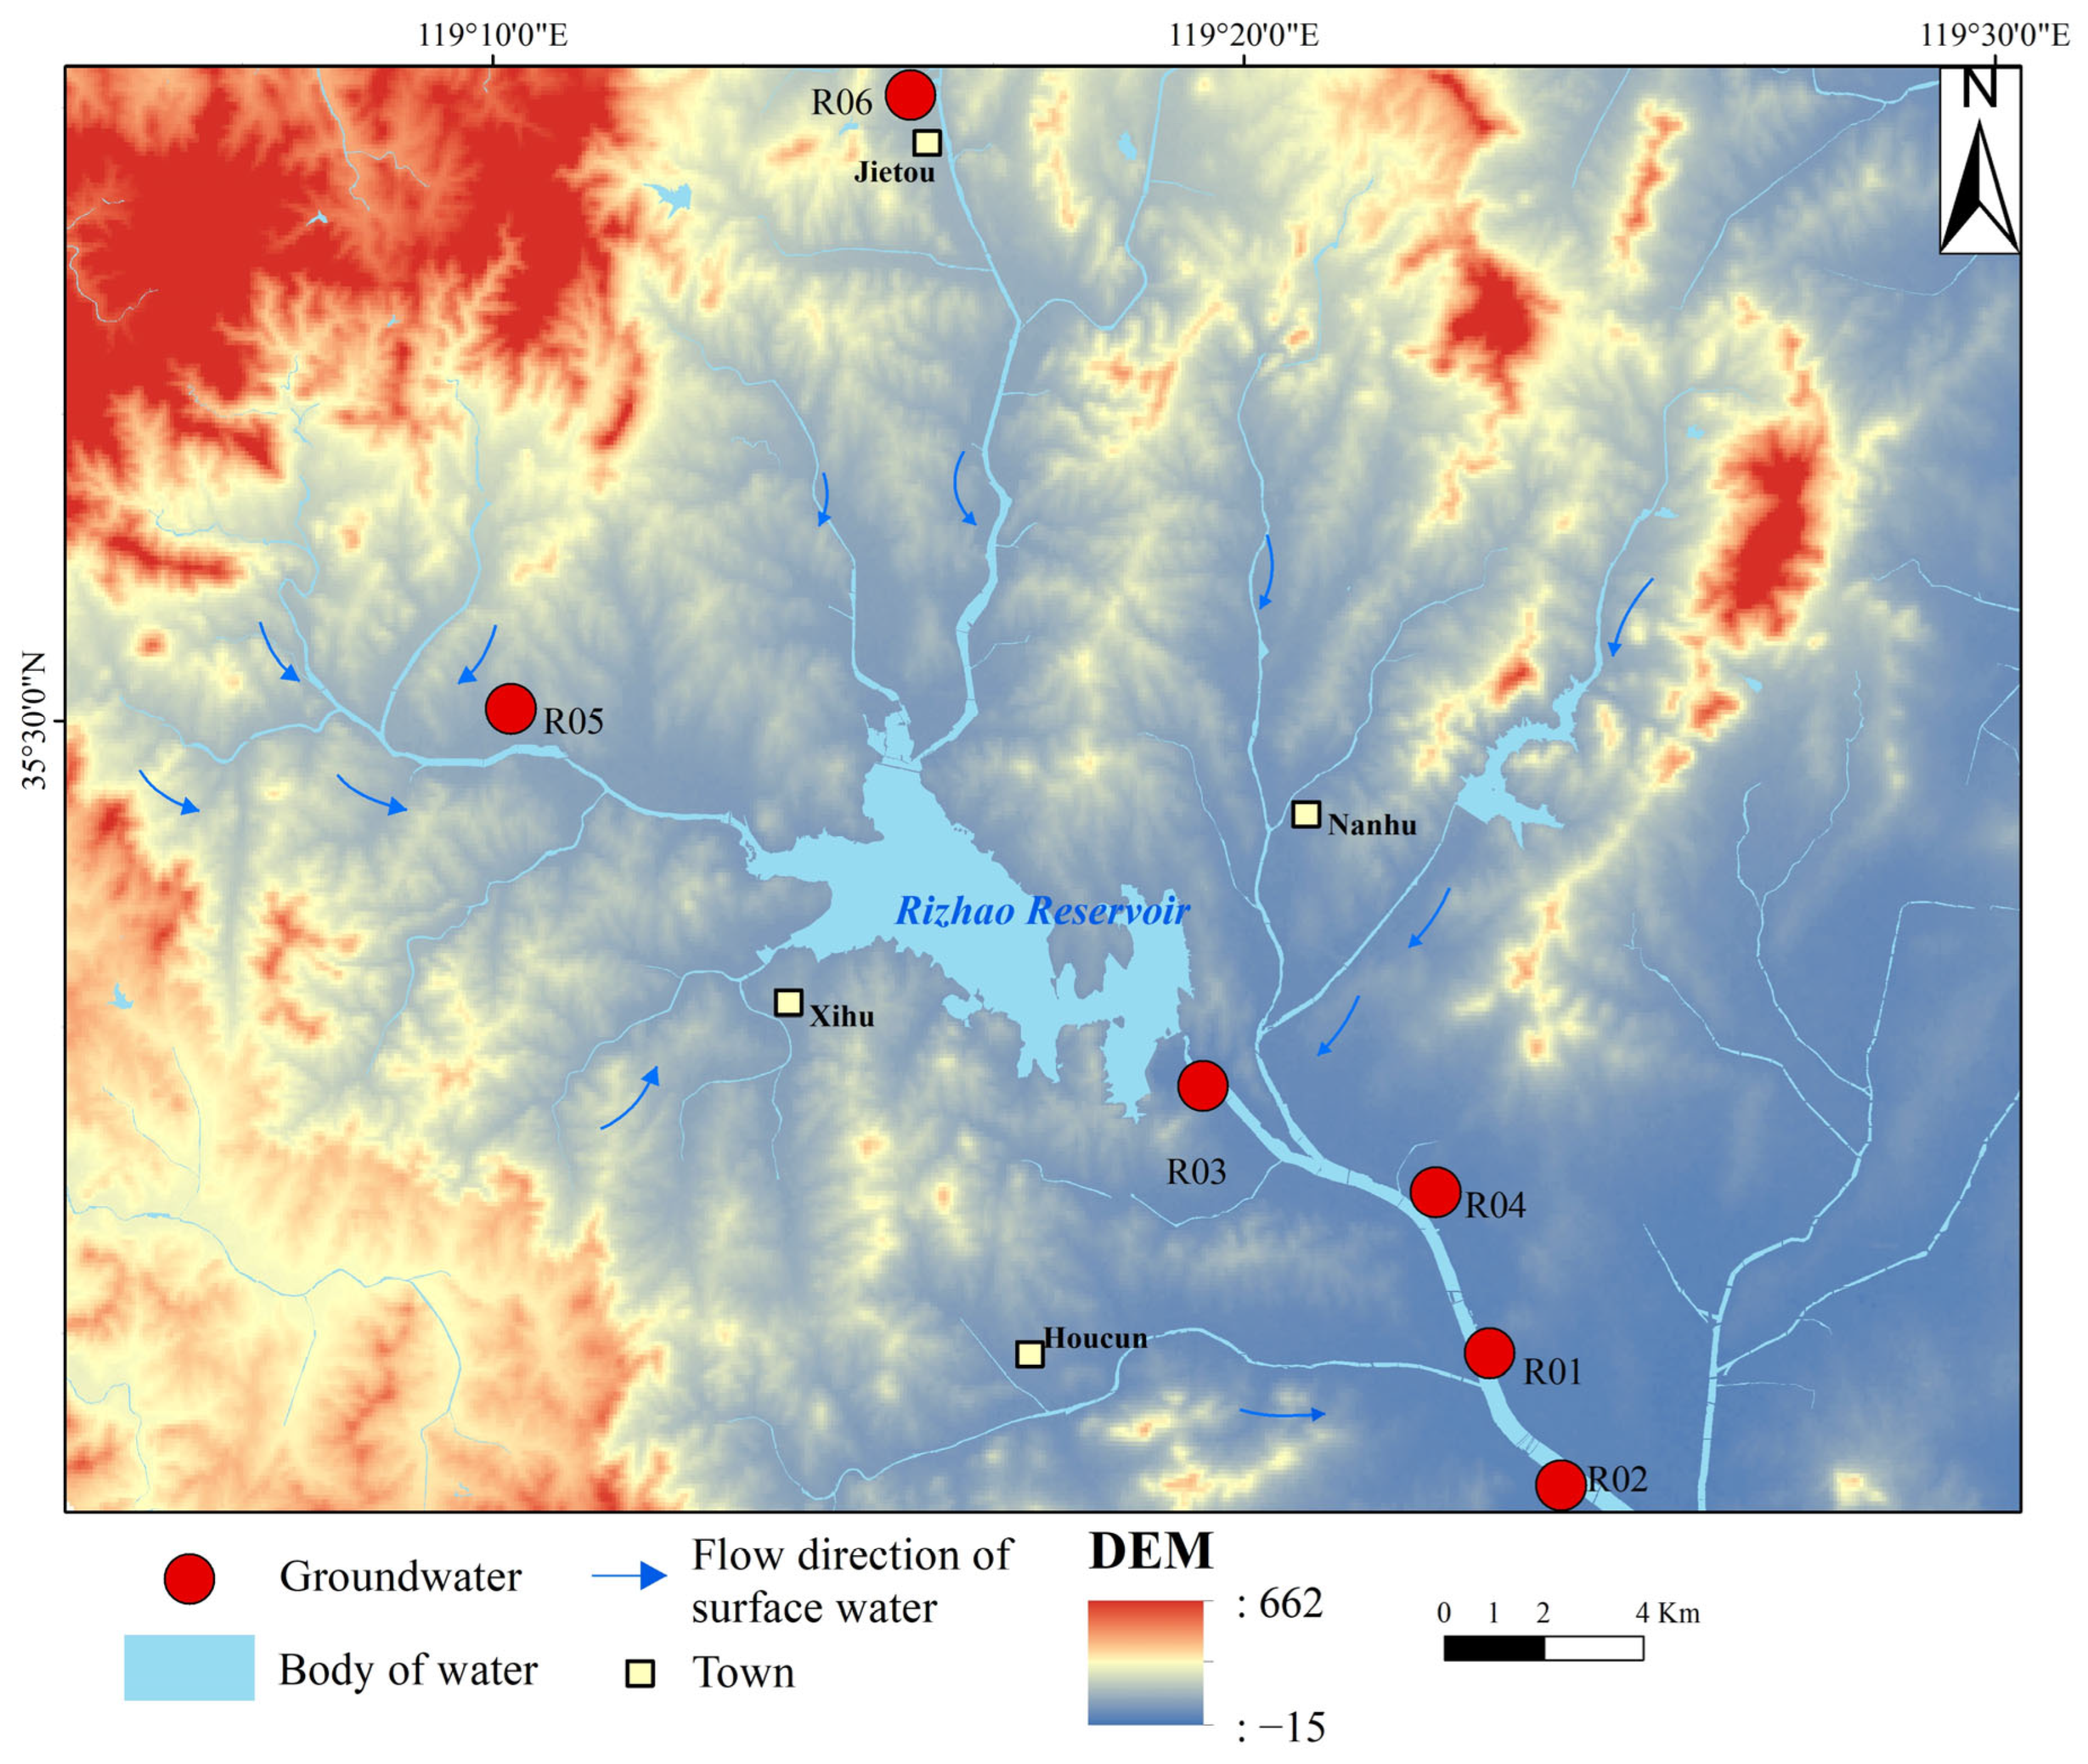
2. Study Area
3. Materials and Methods
3.1. Collecting and Measuring
3.2. Water Quality Assessment
- 1.
- Construct an initial water quality matrix:
- 2.
- Normalize data:
- 3.
- Here, min(xij) and max(xij) denote the minimum and maximum values of the corresponding water quality parameter across all samples.
- 4.
- Calculate the ratio, information entropy, and weight. The next steps involve calculating the information entropy (Ej), and the entropy weight (wj) using the following equations:
- 5.
- Determine the level of groundwater quality:where cij is the jth index measured in the ith sample, sj is the standard allowable value of the jth index of China’s groundwater quality standard, and qj is the quality evaluation quantity.
- 6.
- Calculate EWQI:
4. Results and Discussion
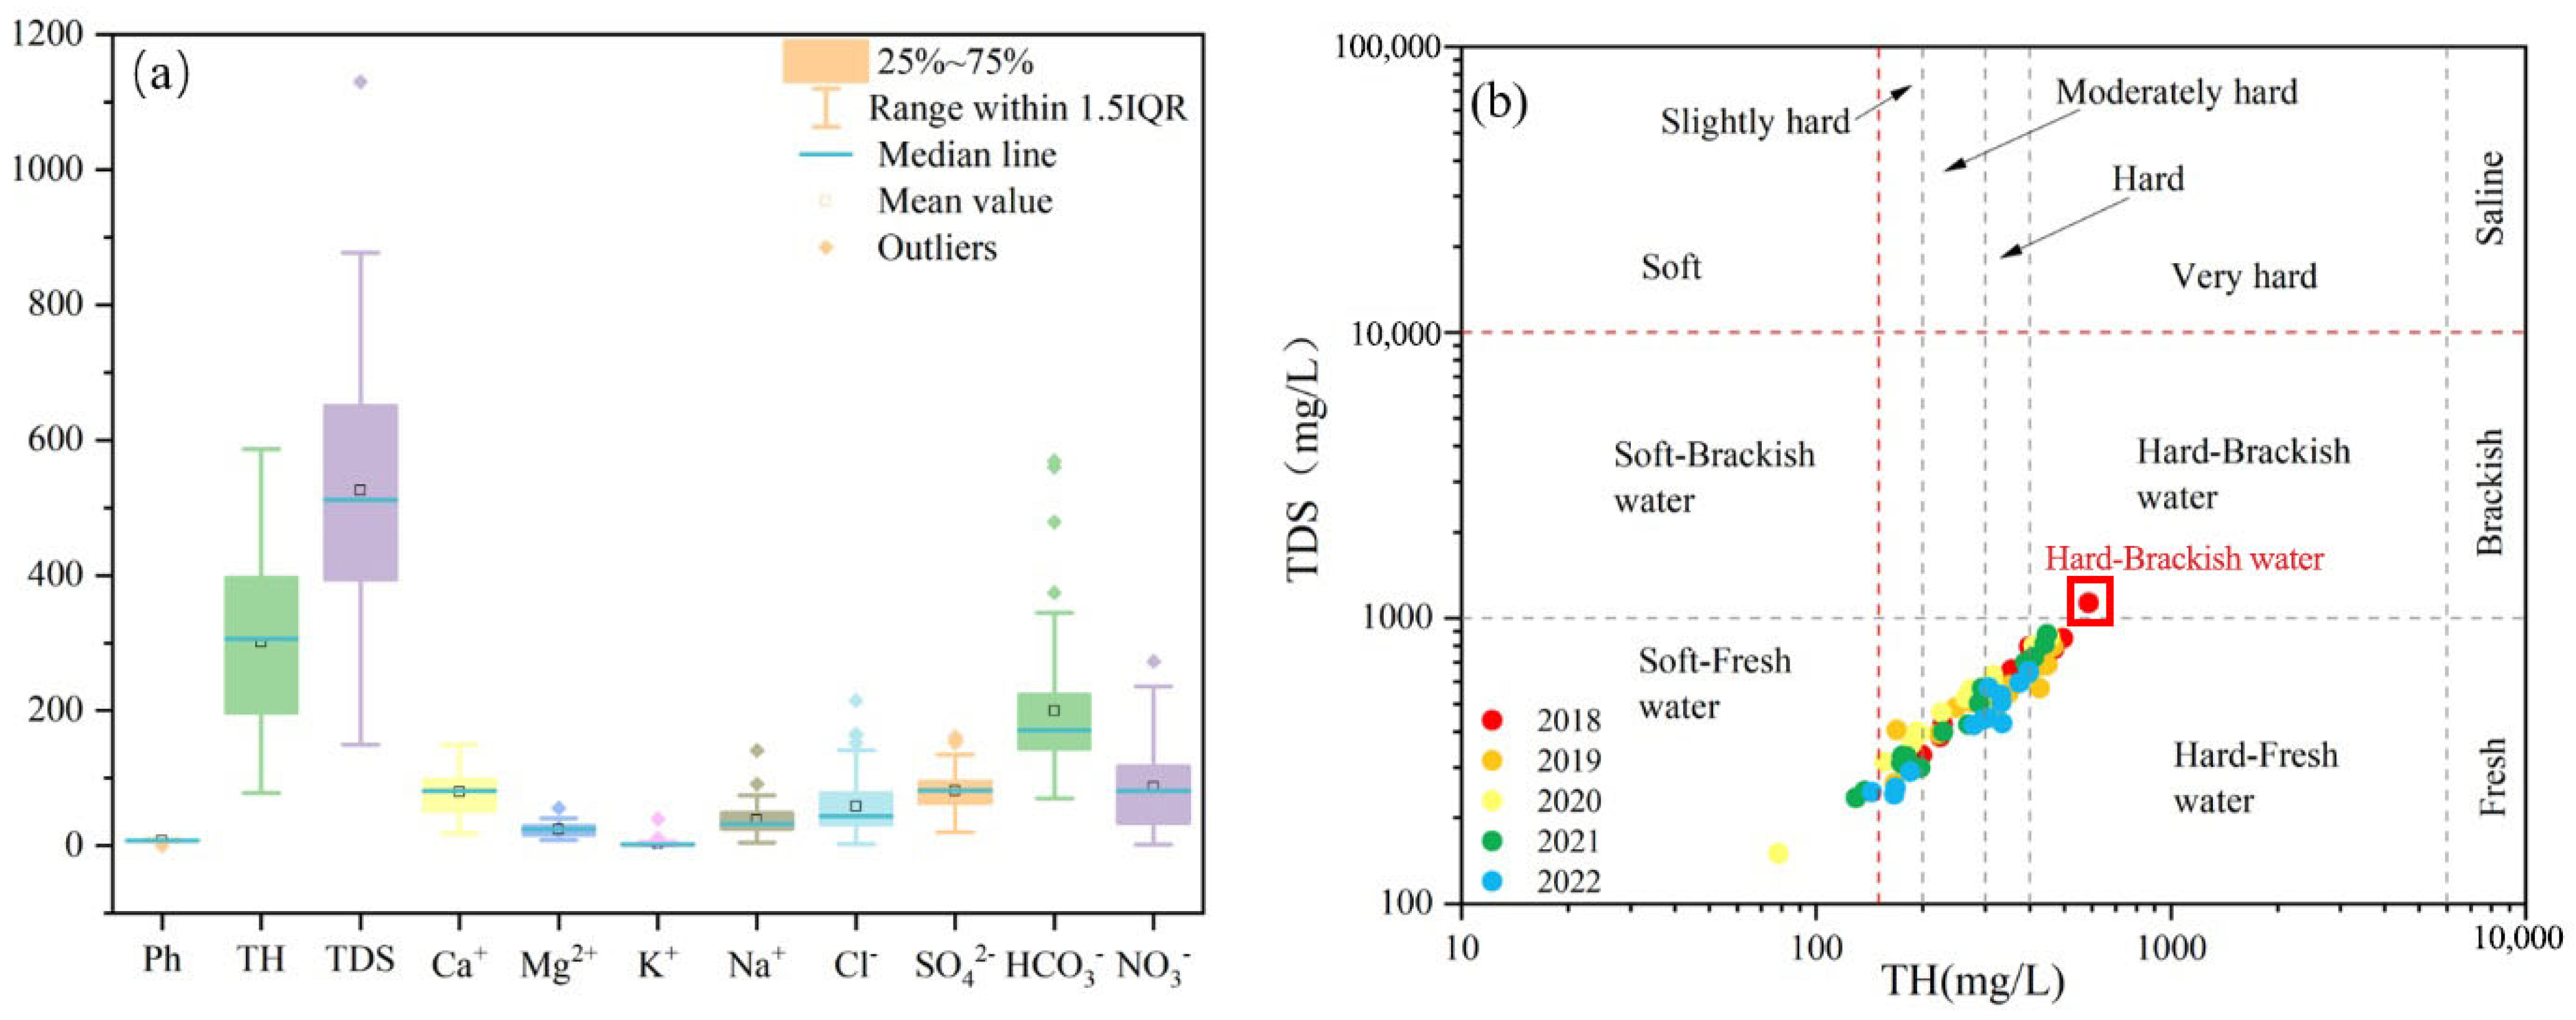
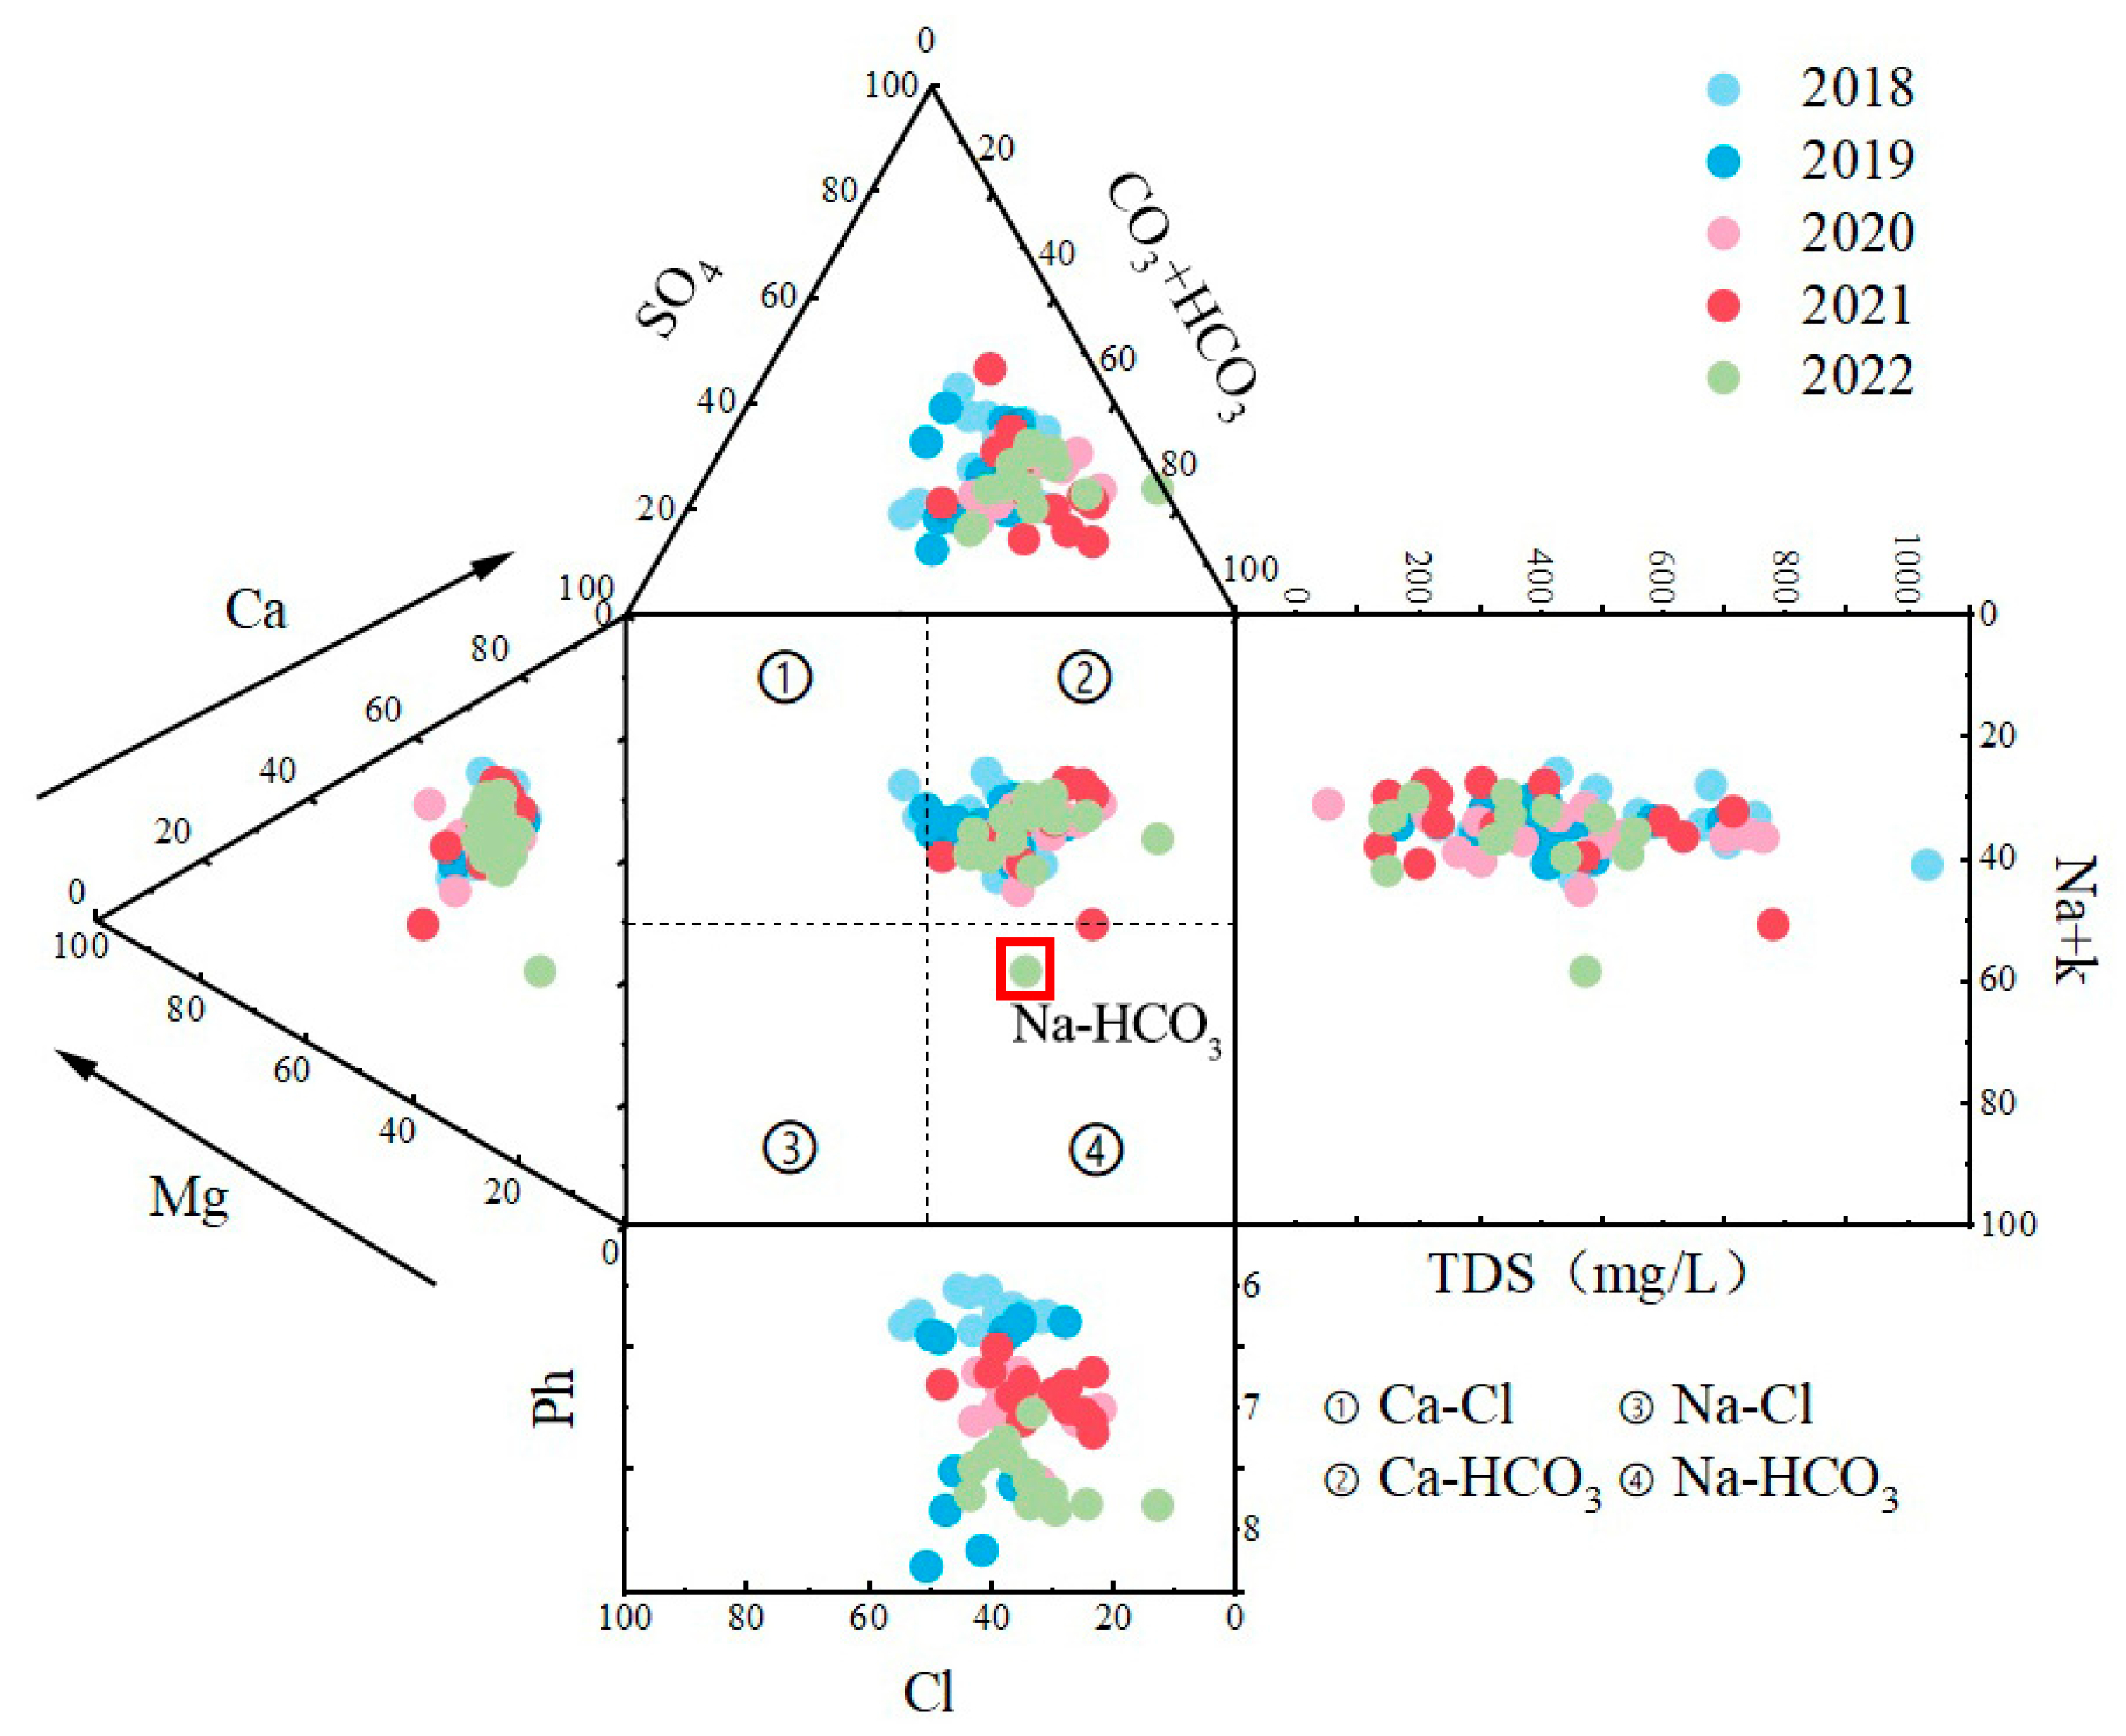
4.1. Statistical Characterisation
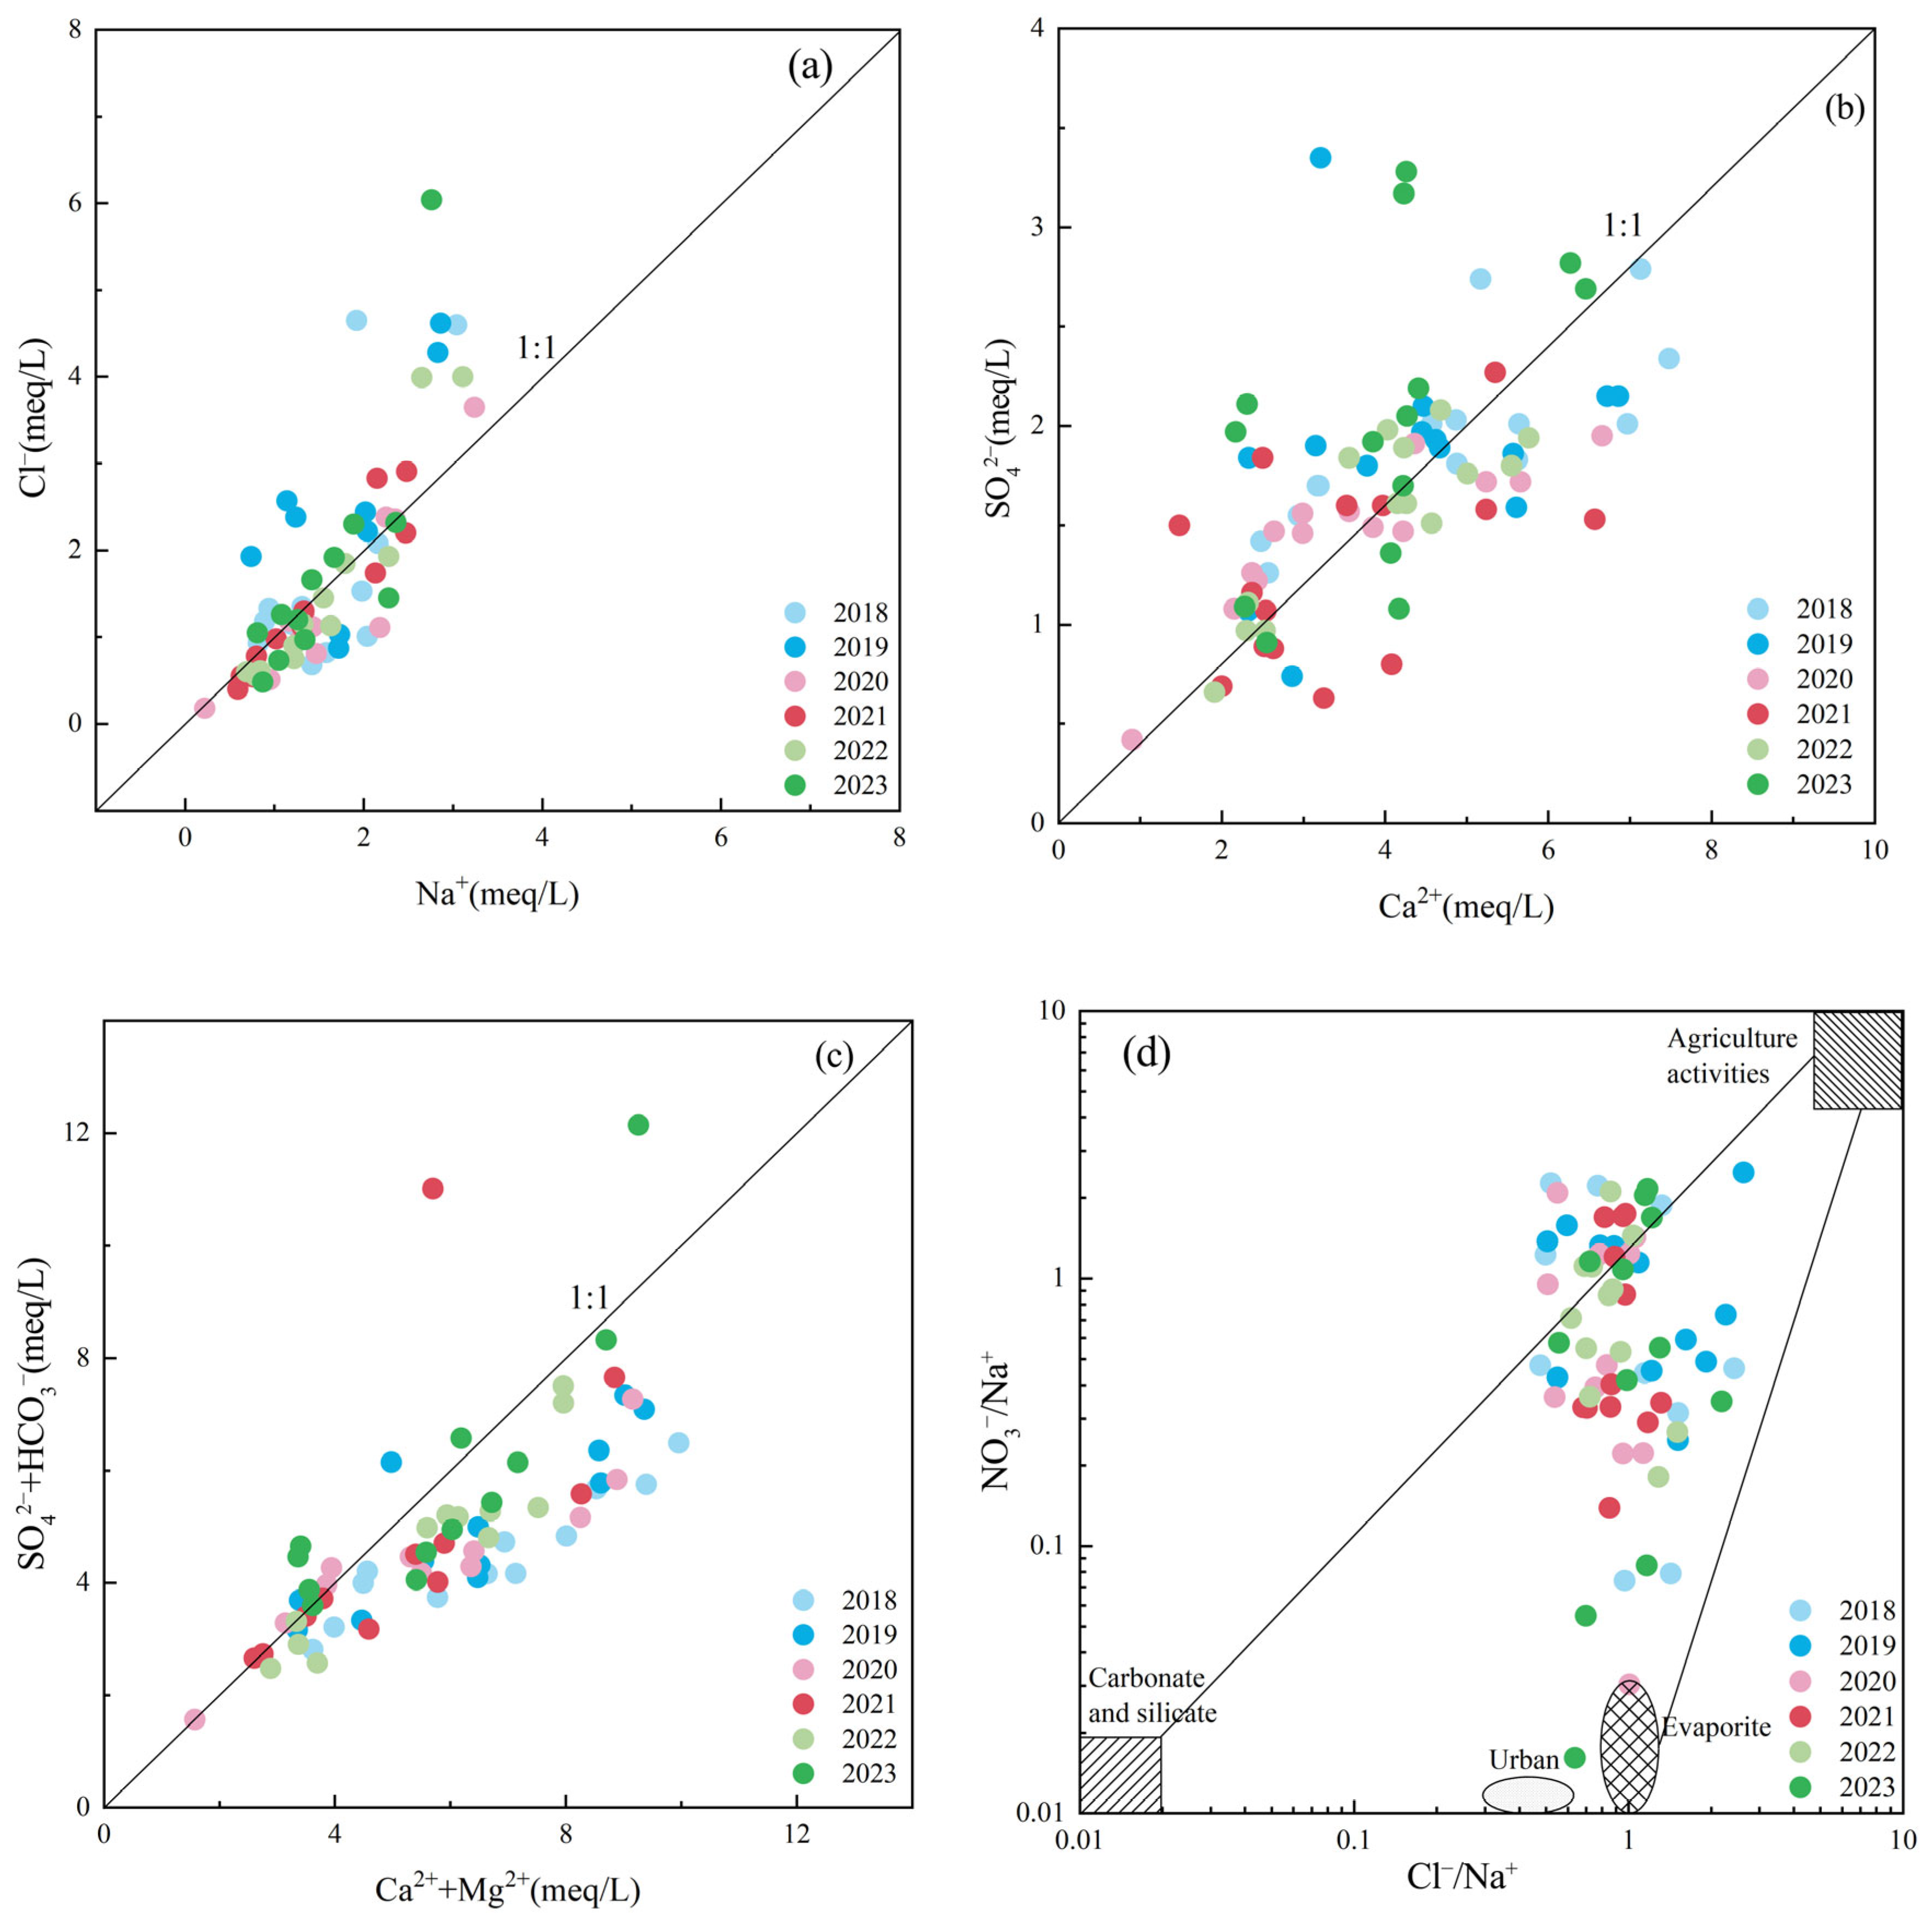
4.2. Factors Controlling Groundwater Hydrochemistry
Ion Ratio Analysis
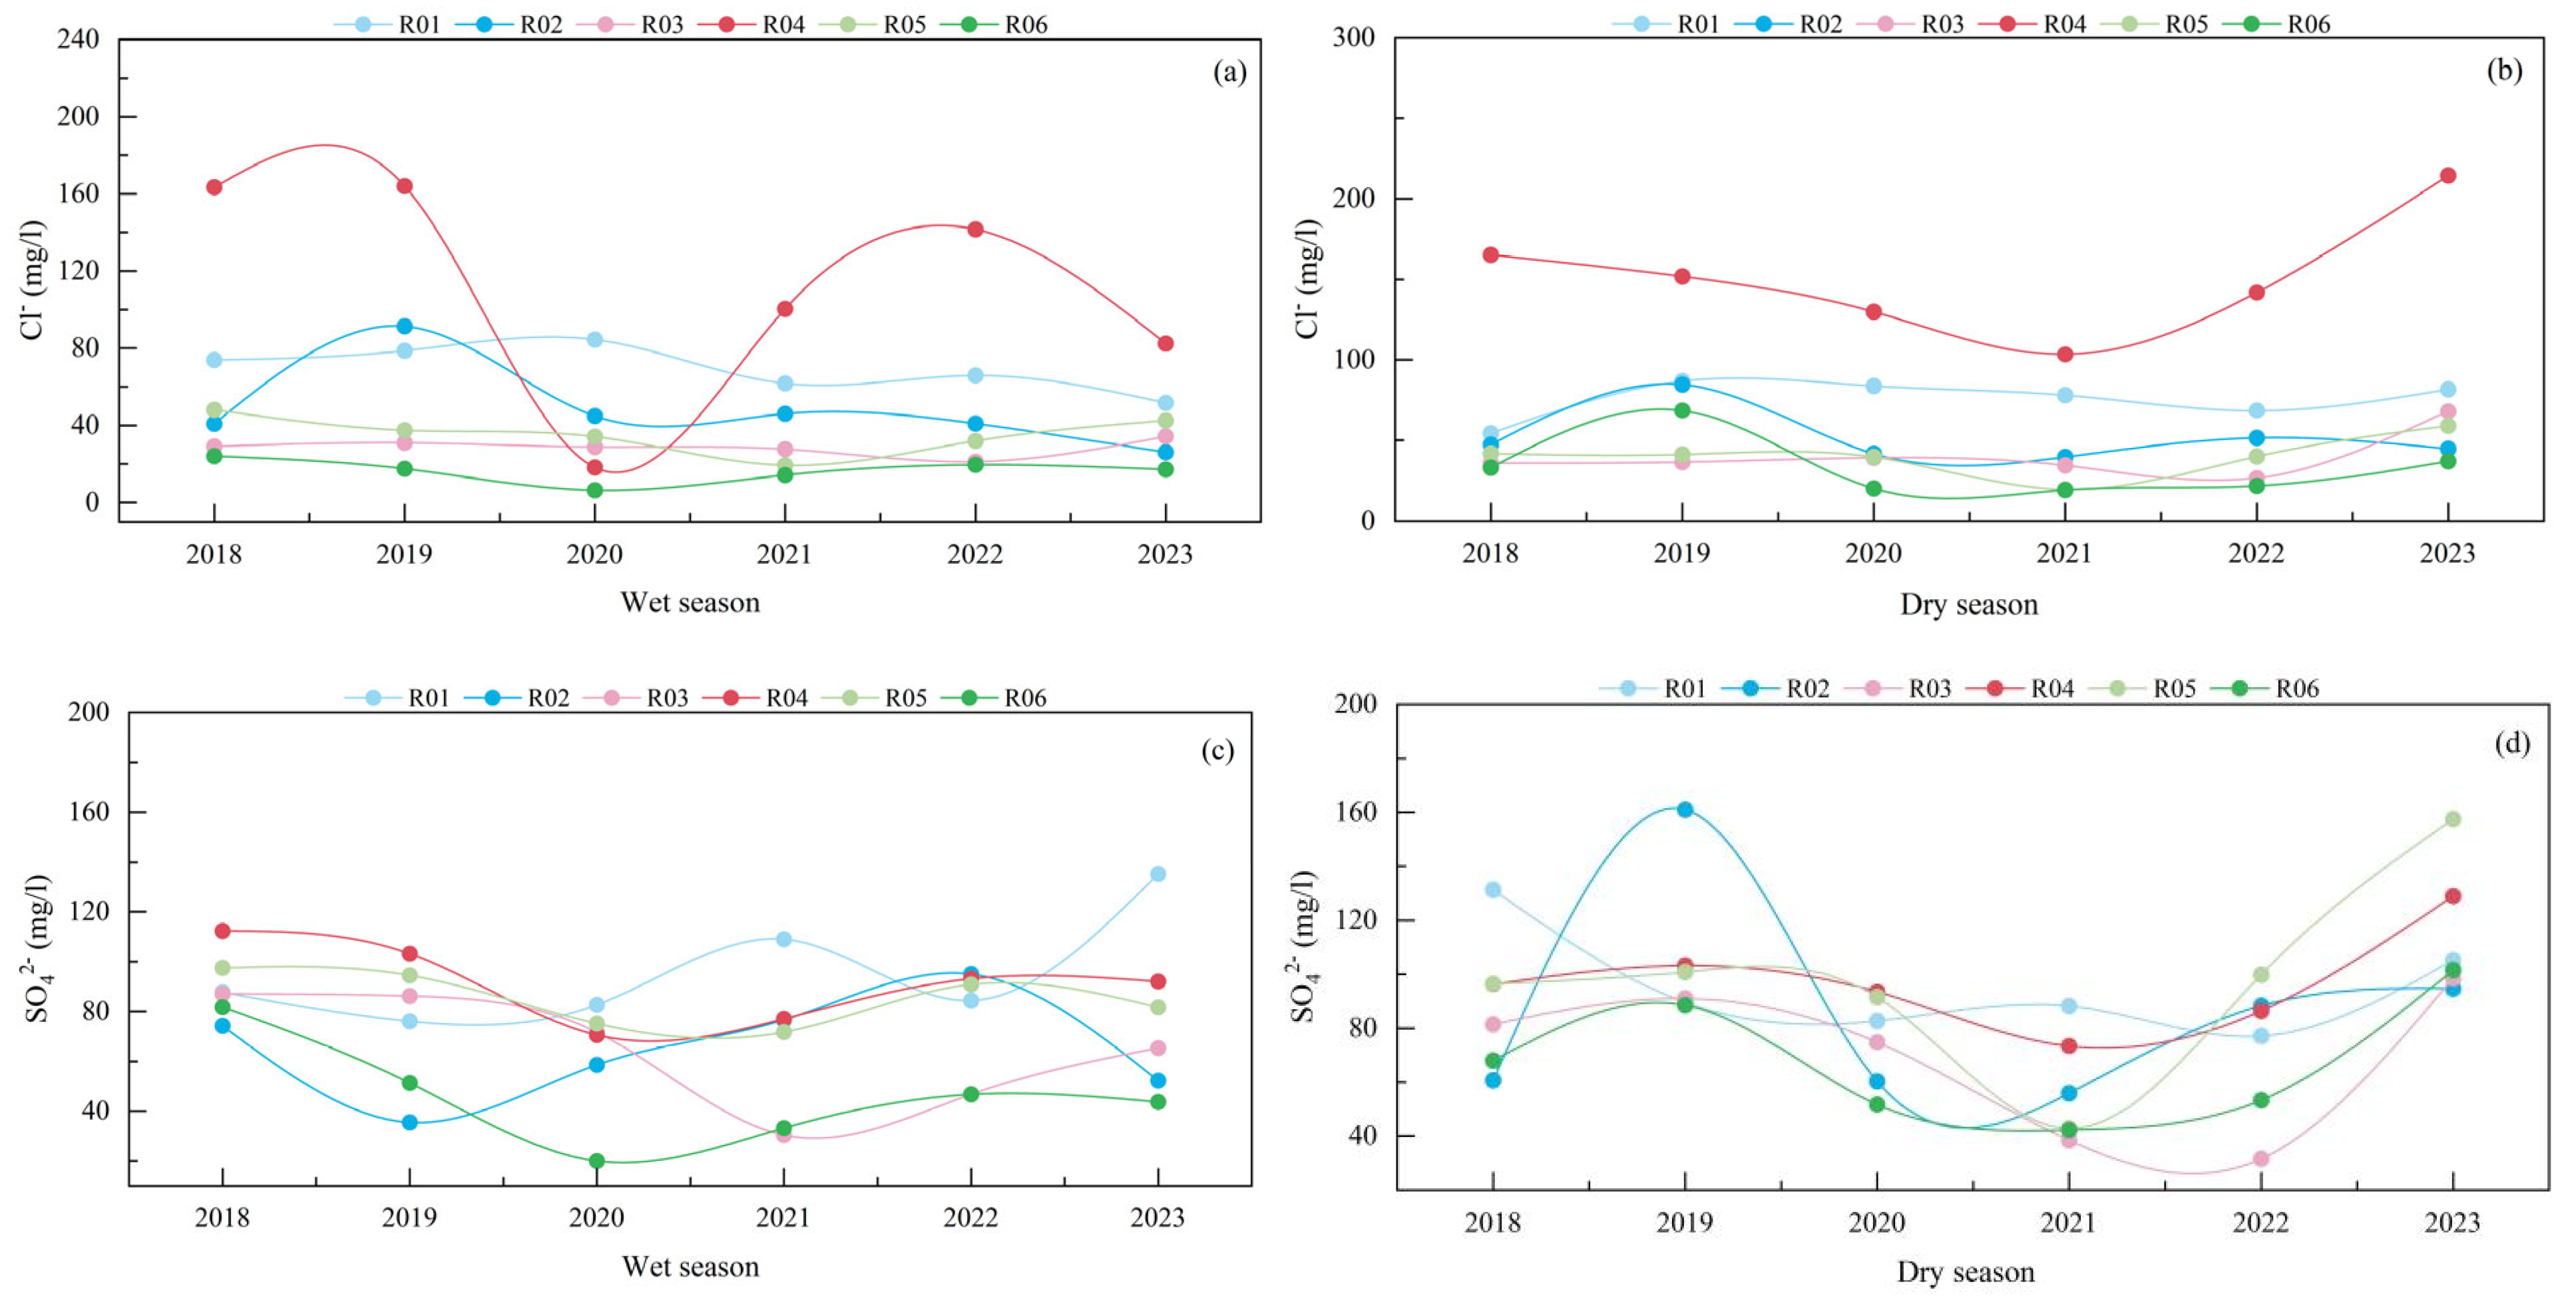
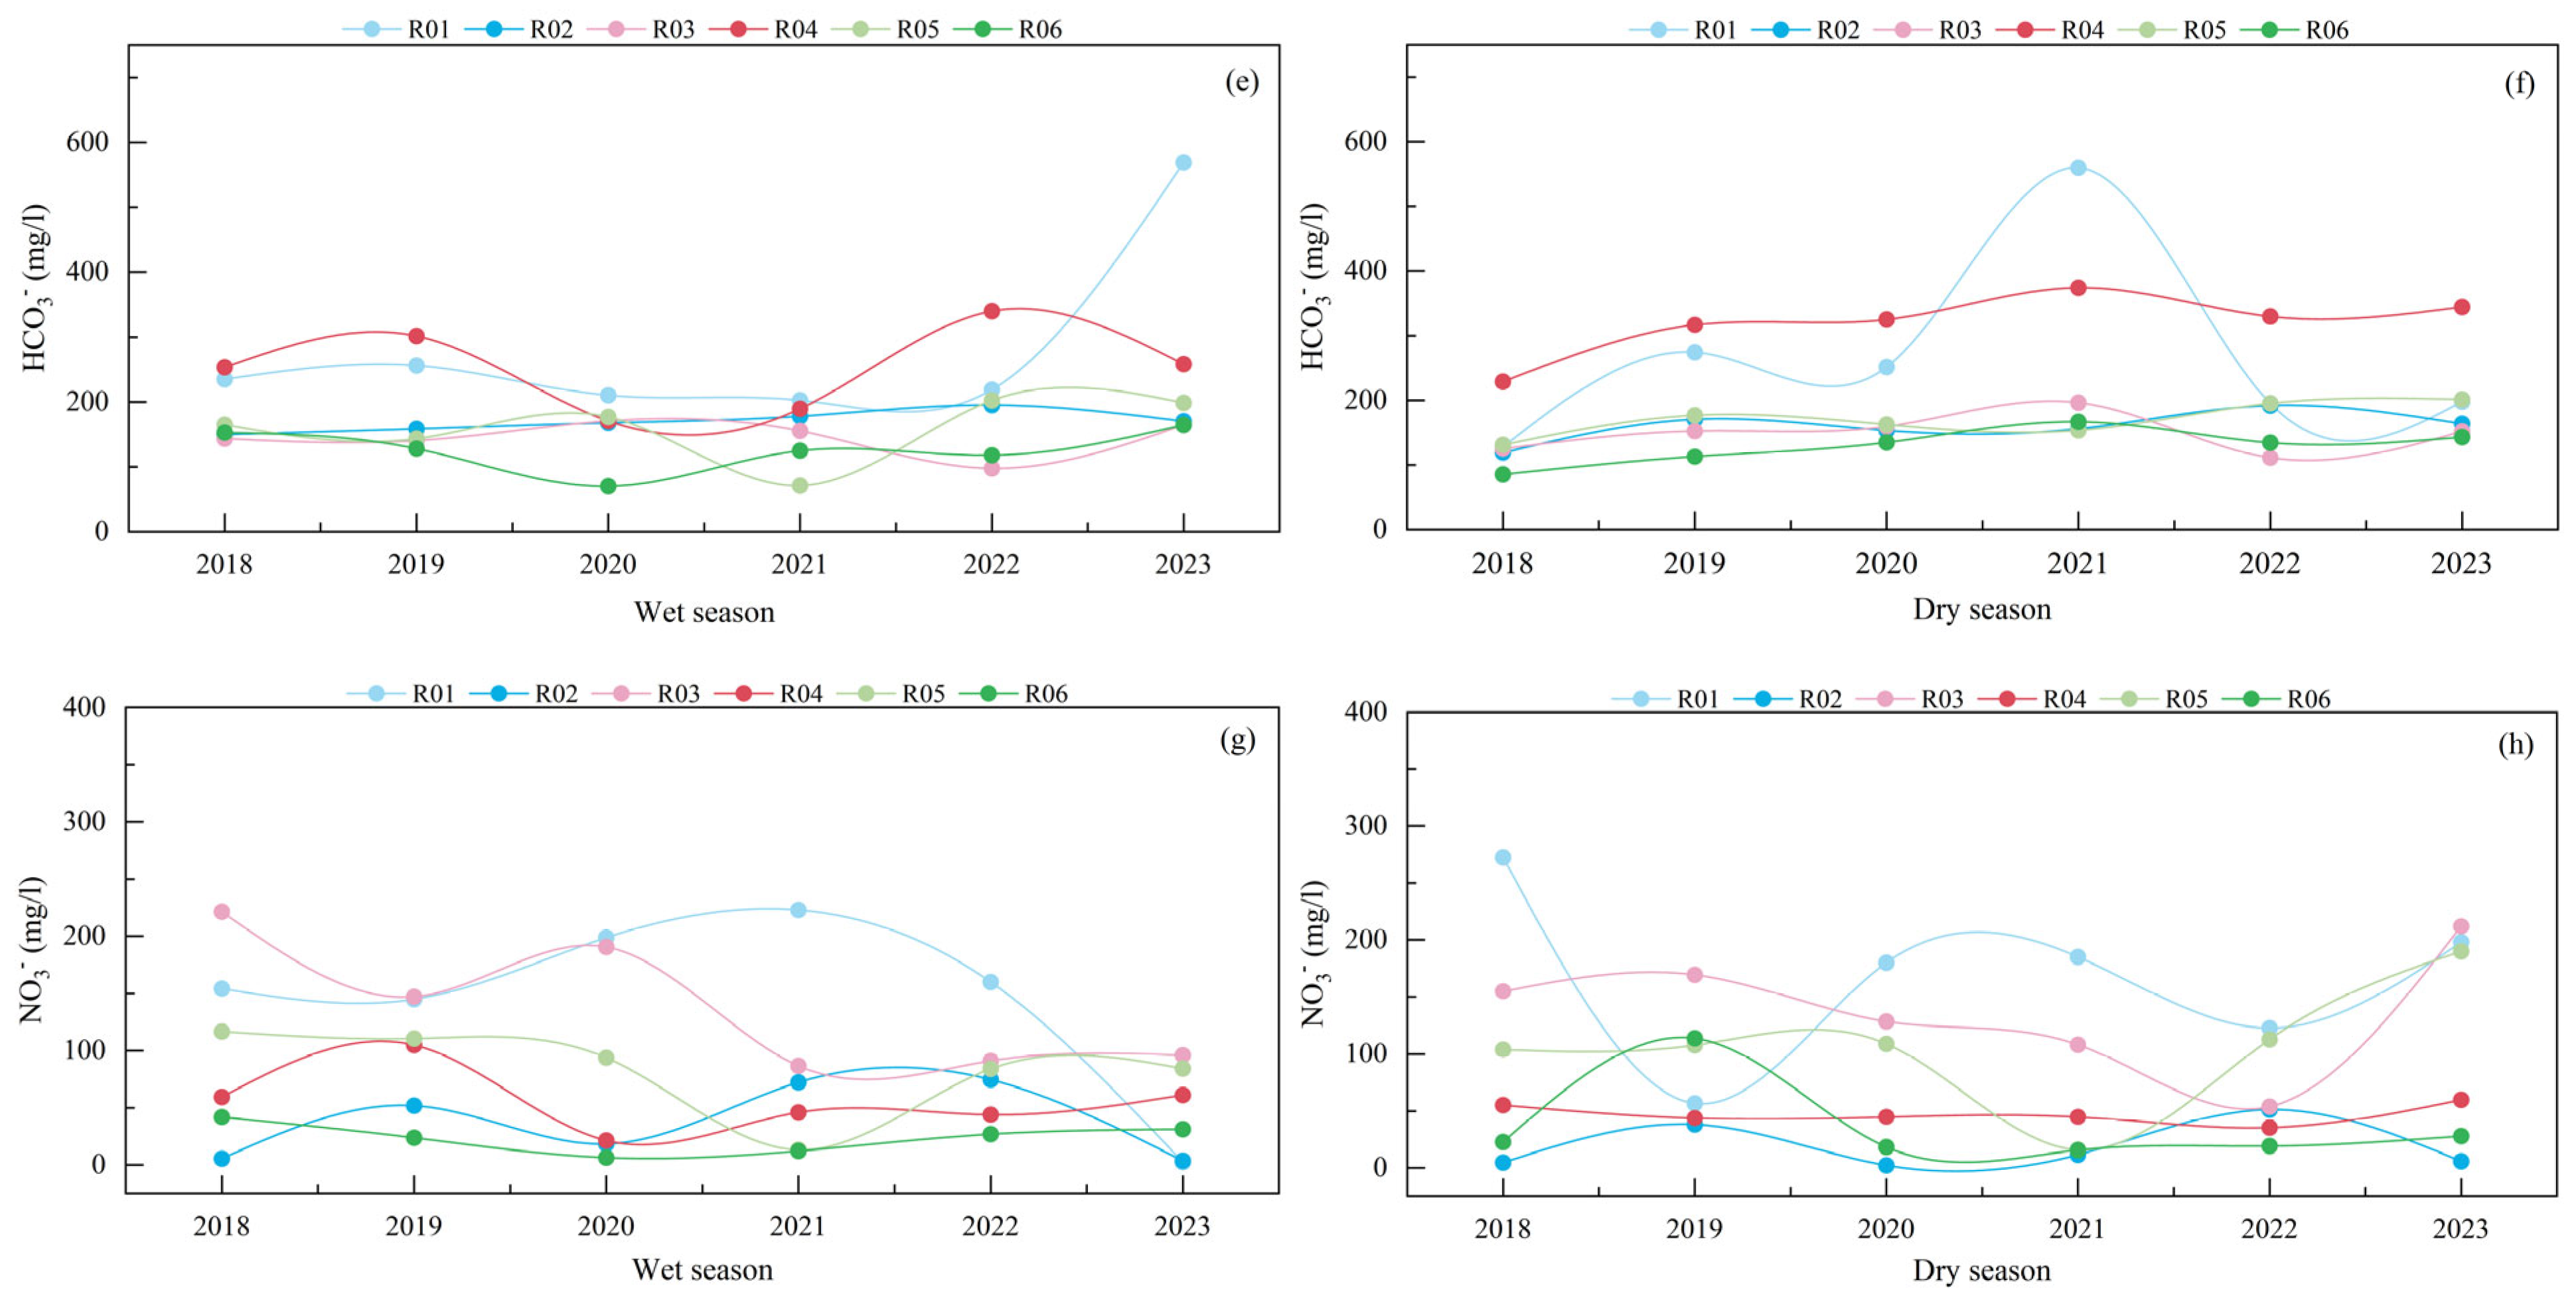
4.3. Characterization of Changes in the Content of Major Ions in Groundwater
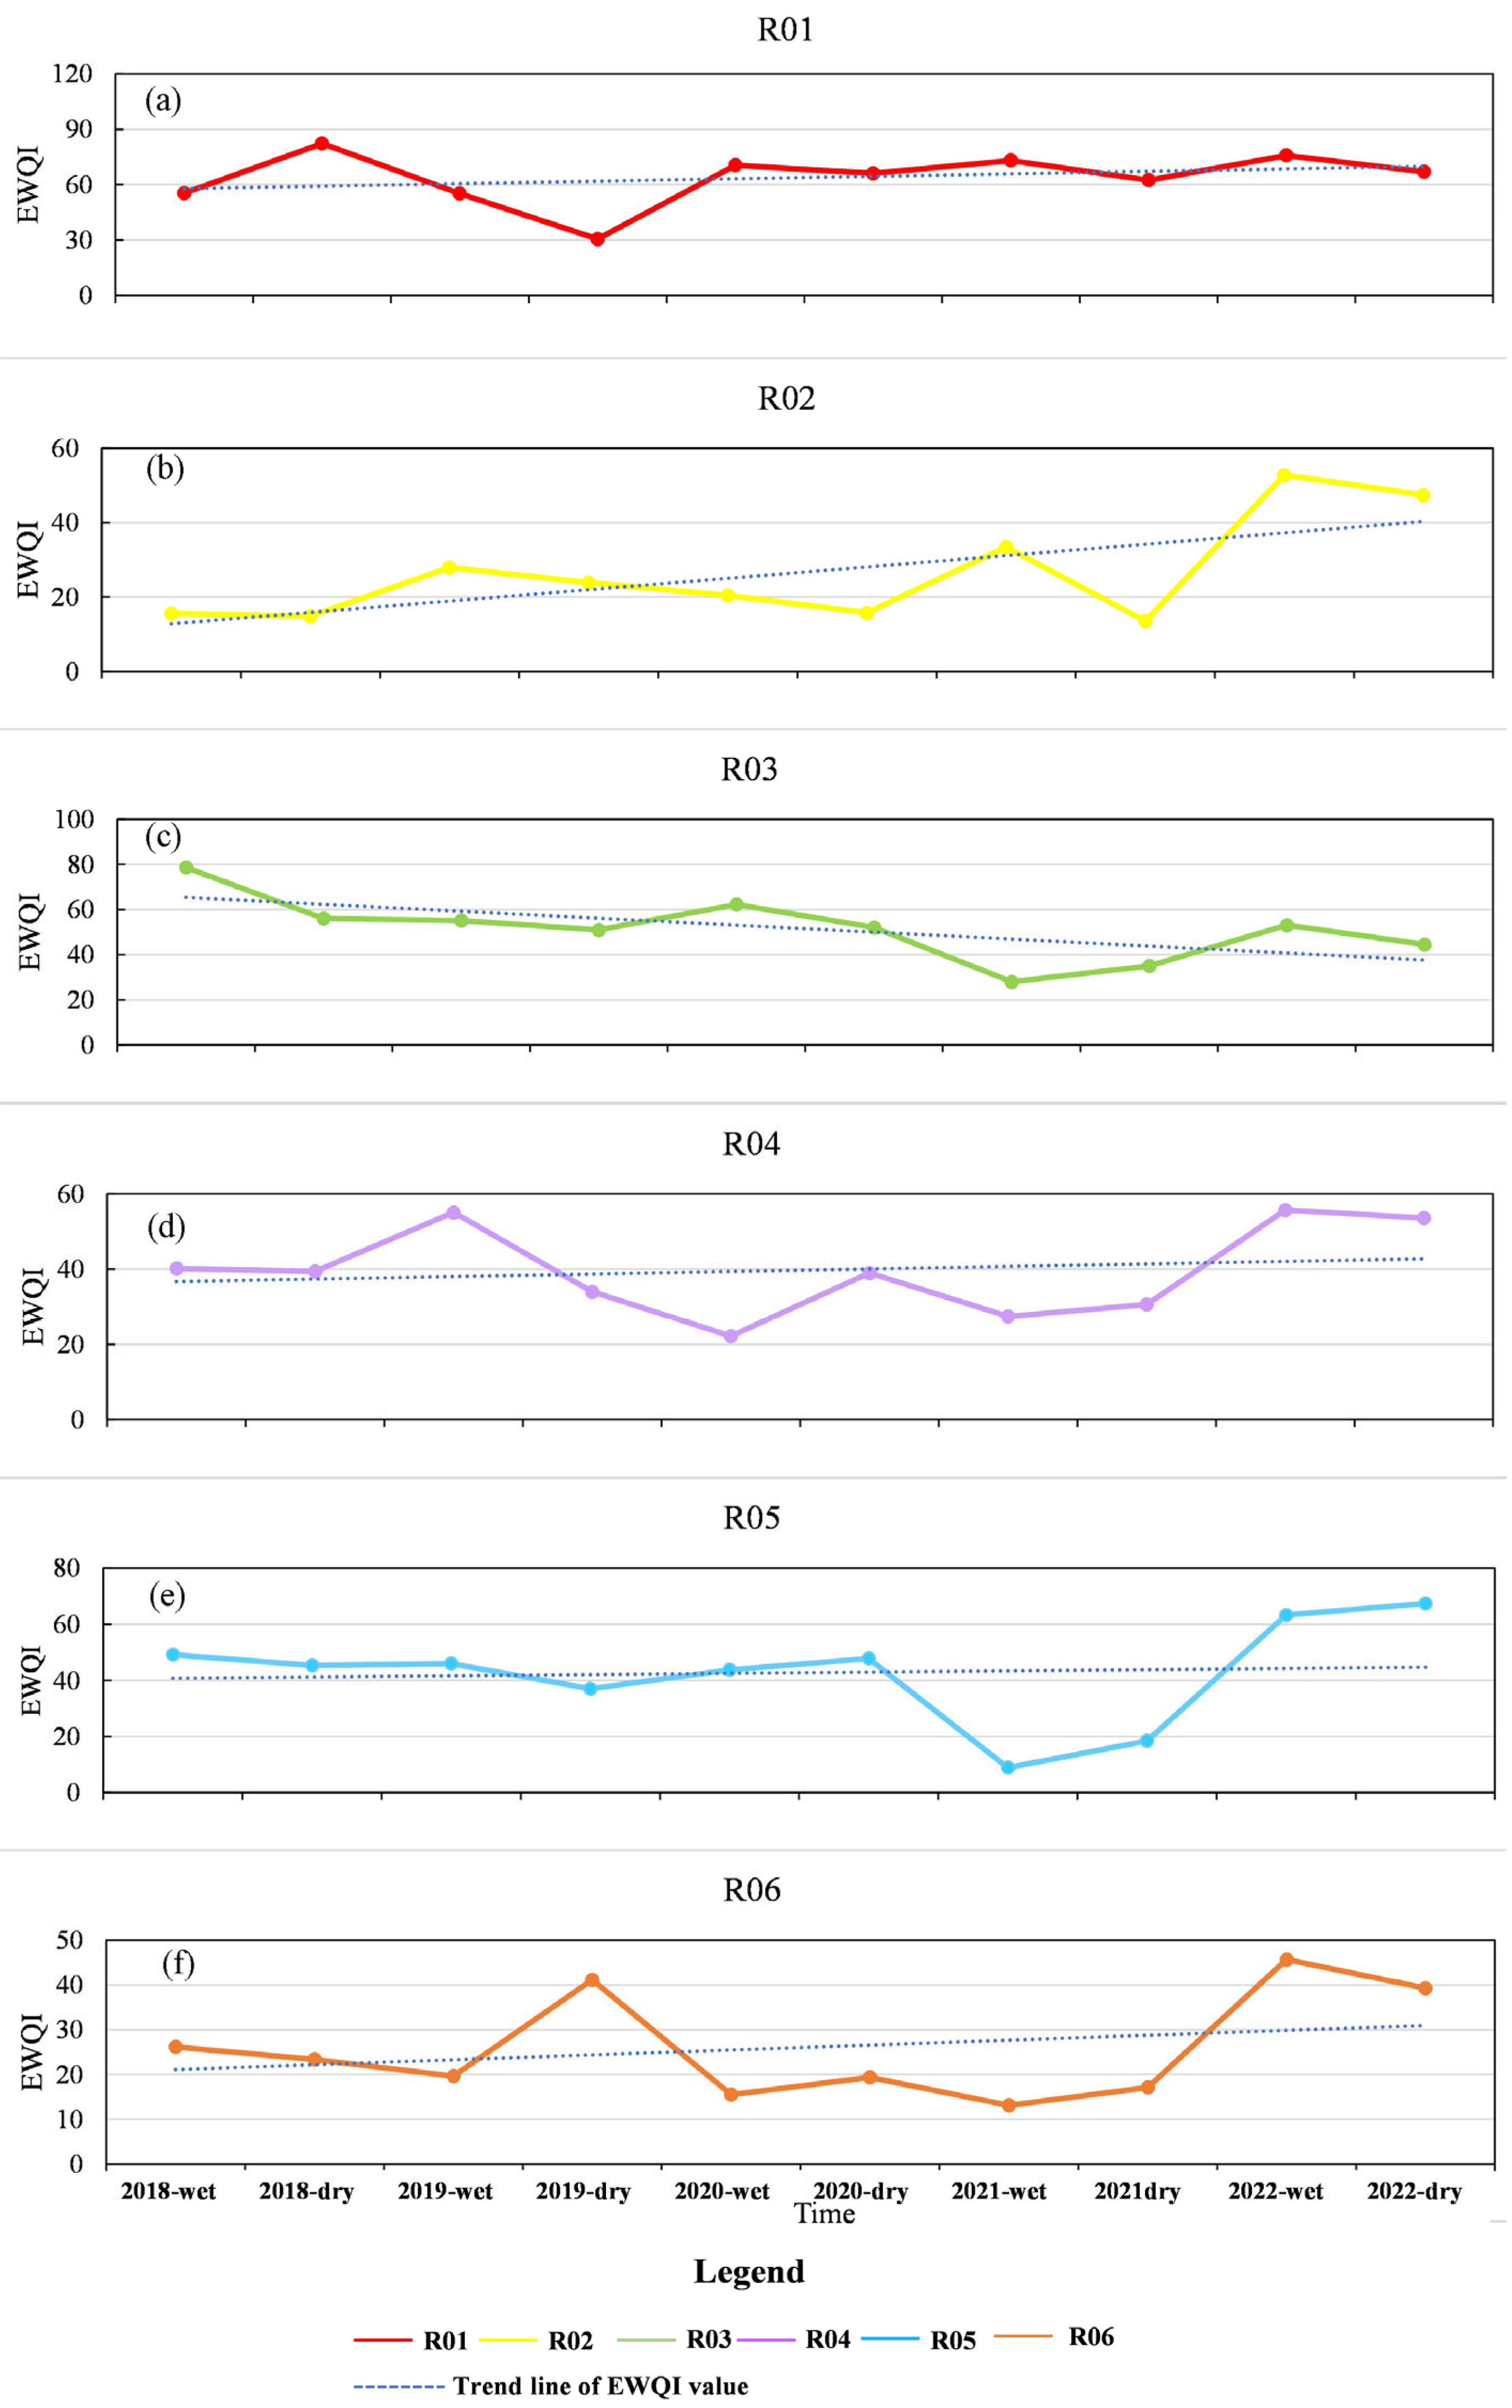
4.4. Variation Characteristics of Groundwater Quality
4.5. Results
4.6. Suggestions on Management, Utilization, and Protection of Groundwater Resources
- (1)
- Strengthen groundwater monitoring and resource assessment: clarify the objectives and tasks of groundwater monitoring. Scientifically plan the layout of the monitoring network, establishing groundwater monitoring wells in key areas and around urban centers. Regularly monitor groundwater levels, water quality, and other relevant indicators to promptly track dynamic changes in groundwater conditions [43]. Conduct comprehensive assessments of groundwater resources on a regular basis, covering aspects such as reserves, recharge, and extraction, to offer a scientific foundation for rational development and utilization [44].
- (2)
- Rational planning and management of groundwater: develop groundwater protection and utilization plans based on the carrying capacity of water resources and clearly define extraction restrictions and protection goals [44]. In areas with over-exploitation of groundwater and ecologically sensitive regions, delineate restricted and prohibited extraction zones to strictly control groundwater exploitation.
- (3)
- Strengthen pollution prevention and control: to address agricultural pollution, promote the adoption of scientific planting techniques, and minimize the application of chemical fertilizers and pesticides. For industrial pollution, enhance regulatory oversight to prevent the discharge of untreated wastewater [45]. Employ bioremediation and chemical remediation technologies to treat contaminated groundwater. Additionally, delineate key areas for groundwater pollution prevention and control, implement zoning management and graded prevention strategies, improve the groundwater environmental monitoring network, and conduct surveys and assessments of pollution status and risk mitigation.
- (4)
- Promote scientific and technological innovation: Increase investment in the research and development of technologies for groundwater monitoring, protection, and remediation to enhance groundwater management. Leverage big data and the Internet of Things to achieve the informatization and intelligent management of groundwater resources [46].
5. Conclusions
- (1)
- In RZR, the average groundwater pH was 7.46, indicating a weakly alkaline condition. According to water quality classification, the majority of water samples were categorized as hard freshwater. The dominant cations and anions were Ca2+ and HCO3−, characterizing the groundwater as primarily of the Ca-HCO3 type.
- (2)
- The ions in groundwater in RZR primarily originate from the dissolution of silicate and evaporite rocks. The elevated nitrate concentrations in RZR are mainly attributed to agricultural activities.
- (3)
- Ion concentrations at most monitoring sites exhibited a trend of initial decrease followed by an increase, with an overall upward trend from 2020 to 2023. Fluctuations in groundwater parameters were more pronounced during the wet season compared with the dry season. Upstream sites generally had lower ion concentrations than downstream sites, particularly at R06. NO3− concentrations showed significant fluctuations, reaching relatively high values that peaked during the 2023 wet season.
- (4)
- Although the overall EWQI values indicate that the water quality in the RZR is relatively good, an increasing trend in EWQI values was observed at most monitoring sites, with the most significant rise at R02. This trend warrants attention.
Author Contributions
Funding
Data Availability Statement
Conflicts of Interest
References
- Thierry, P. The United Nations World Water Development Report 2022, on groundwater, a synthesis. LHB 2022, 108, 2090867. [Google Scholar]
- Lu, Y.; Dai, L.; Yan, G.; Hu, T.; Chen, W.; Lan, J.; Zhang, C.; Xu, Q.; Deng, S.; Chen, J. Effects of various land utilization types on groundwater at different temporal scales: A case study of Huocheng plain, Xinjiang, China. Front. Environ. Sci. 2023, 11, 1225916. [Google Scholar] [CrossRef]
- Zhang, Q.; Sun, J.; Dai, C.; Zhang, G.; Wu, Y. Sustainable development of groundwater resources under the large-scale conversion of dry land into rice fields. Agric. Water Manag. 2024, 298, 108851. [Google Scholar] [CrossRef]
- Sidiropoulos, P. Groundwater Pollution: Sources, Mechanisms, and Prevention. Hydrology 2024, 11, 98. [Google Scholar] [CrossRef]
- Lv, X.; Liu, J.; Han, Z.; Zhu, L.; Li, H. Characteristics and Causes of High-manganese Groundwater in Pearl River Delta During Urbanization. Huan Jing Ke Xue 2022, 43, 4449–4458. [Google Scholar]
- Aghazadeh, N.; Chitsazan, M.; Golestan, Y. Hydrochemistry and quality assessment of groundwater in the Ardabil area, Iran. Appl. Water Sci. 2017, 7, 3599–3616. [Google Scholar] [CrossRef]
- Mainuddin, M.; Gaydon, D.; Janardhanan, S.; Kirby, J.; Mojid, M.; Kumar, S.; Davies, P.; Singh, S.; Penton, D. Sustainable groundwater use in the Eastern Gangetic Plains requires region-specific solutions. Groundw. Sustain. Dev. 2022, 18, 100798. [Google Scholar] [CrossRef]
- Aghamir, F. Priorities and potential challenges of sustainable management of ultra-deep groundwater resources in Iran. Groundw. Sustain. Dev. 2024, 26, 101192. [Google Scholar] [CrossRef]
- Li, B.; Xiang, X.; Wu, Q.; Wang, J.; Zeng, Y.; Li, T. Comparison of multiple methods for identifying water sources of mine water inrush and quantitative analysis of mixed water sources based on isotope theory. Earth Sci. Inform. 2024, 18, 26. [Google Scholar] [CrossRef]
- Liu, J.; Gao, Z.; Feng, J.; Wang, M. Identifification of the hydrochemical features, genesis, water quality and potential health hazards of groundwater in Dawen River Basin, North China. Ecol. Indic. 2023, 149, 110175. [Google Scholar] [CrossRef]
- Adamidis, A.; Gkiougkis, I.; Kallioras, A.; Angelidis, P.; Pliakas, F. Hydrochemical Assessment of Groundwater and Dominant Water-Rock Interactions in Ooeides Aquifer System, North Greece. J. Geosci. Environ. Prot. 2024, 12, 73–101. [Google Scholar] [CrossRef]
- Li, C.; Men, B.; Yin, S. Analysis of Groundwater Chemical Characteristics and Spatiotemporal Evolution Trends of Influencing Factors in Southern Beijing Plain. Front. Environ. Sci. 2022, 10, 913542. [Google Scholar] [CrossRef]
- Yang, J.; Tao, Y.; Gao, Y.; Wang, L.; Kang, B. Experimental study on the water–rock interaction mechanism in a groundwater heat pump reinjection process. J. Water Clim. Chang. 2022, 13, 1516–1533. [Google Scholar] [CrossRef]
- Zhu, M.; Chen, J.; He, C.; Ren, S.; Liu, G. Multi-method characterization of groundwater nitrate and sulfate contamination by karst mines in southwest China. Sci. Total Environ. 2024, 946, 174375. [Google Scholar] [CrossRef]
- Liu, W.; Xing, X.; Zou, Y.; Li, X.; Gao, Y.; Liu, Y.; Zhu, X.; Qi, S. Novel insights into PAHs accumulation and multi-method characterization of interaction between groundwater and surface water in middle Yangtze River: Hydrochemistry, isotope hydrology and fractionation effect. Sci. Total Environ. 2024, 958, 178023. [Google Scholar] [CrossRef]
- Ismail, A.H.; Shareef, M.A.; Hassan, G.; Alatar, F.M. Hydrochemistry and water quality of shallow groundwater in the Tikrit area of Salah Al Din Province, Iraq. Appl. Water Sci. 2023, 13, 197. [Google Scholar] [CrossRef]
- Yarlanki, K.; Vadithya, G.; Etikala, B.; Golla, V. Hydrogeochemical Characterization and Source Evaluation of Groundwater Contamination in Parts of the Uddanam CKDu Area, Southern India: Integrating Statistical, Geochemical Modeling, Pollution, and Health Indices. Int. J. Environ. Res. 2025, 19, 68. [Google Scholar] [CrossRef]
- Zhang, B.; Hu, X.; Yang, Y.; Deng, X.; Li, B.; Gong, X.; Xiang, X.; Cai, X.; Liu, T. Comprehensive evaluation of groundwater quality in population-dense and extensive agricultural regions and study on its relationship with agricultural production and human activities. Environ. Geochem. Health 2025, 47, 62. [Google Scholar] [CrossRef] [PubMed]
- Azat, S.; Kuldeyev, E.; Khalkhabay, B.; Baikadamova, A.; Sultakhan, S.; Berndtsson, R. Pathogen Contamination of Groundwater Affecting Drinking Water Quality with Potential Health Effects in Pavlodar Region, Kazakhstan. Water 2024, 16, 2970. [Google Scholar] [CrossRef]
- Das, C.; Das, S. Acceptability of MEREC criteria compared to existing weighted WQI models to assess coastal groundwater quality in eastern India. J. Coast. Conserv. 2023, 27, 44. [Google Scholar] [CrossRef]
- Al Saleh, H.; Nehaba, S. Evaluating groundwater vulnerability and assessing its quality for sustainable management, South African. J. Chem. Eng. 2024, 50, 291–298. [Google Scholar]
- Pan, L.; Huang, X.; Wei, X.; Zhang, L. A Comparative Analysis of Three Common Water Quality Evaluation Methods. China Rural. Water Hydropower 2019, 0, 51–55. [Google Scholar]
- Basharat, H.; Ahmed, T.; Ahmad, S.; Zahir, M.; Scholz, M. Integrating Water Quality Index and Advanced Geographic Information System for Groundwater Quantity and Quality Mapping: Insights from Islamabad’s Aquifer. Sustainability 2025, 17, 1373. [Google Scholar] [CrossRef]
- Li, C.; Gao, Z.; Chen, H.; Wang, J.; Liu, J.; Li, C.; Teng, Y.; Liu, C.; Xu, C. Hydrochemical analysis and quality assessment of groundwater in southeast North China Plain using hydrochemical, entropy-weight water quality index, and GIS techniques. Environ. Earth Sci. 2021, 80, 523. [Google Scholar] [CrossRef]
- Ahmad, S.; Umar, R.; Ahmad, I. Assessment of groundwater quality using Entropy-Weighted Quality Index (EWQI) and multivariate statistical techniques in Central Ganga plain, India. Environ. Dev. Sustain. 2024, 26, 1615–1643. [Google Scholar] [CrossRef]
- Xu, H.; Ma, C.; Lian, J.; Xu, K.; Chaima, E. Urban flooding risk assessment based on an integrated k-means cluster algorithm and improved entropy weight method in the region of Haikou, China. J. Hydrol. 2018, 563, 975–986. [Google Scholar] [CrossRef]
- Gao, Y.; Qian, H.; Ren, W.; Wang, H.; Liu, F.; Yang, F. Hydrogeochemical characterization and quality assessment of groundwater based on integrated-weight water quality index in a concentrated urban area. J. Clean. Prod. 2020, 260, 121006. [Google Scholar] [CrossRef]
- Wang, X.; Li, H.; Huang, L.; Zheng, Z. Study on the current status and changing trend of water quality in the Rizhao Reservoir water source. Anhui Agric. Sci. Bull. 2017, 23, 88–91. [Google Scholar]
- Wang, J.; Zhang, L.; Zhang, H.; Qin, P. Environmental impact assessment and protection of the Rizhao Reservoir. Shandong Land Resour. 2012, 28, 13–15+21. [Google Scholar]
- Ge, W.; Wang, J.; Xun, Z.; He, Z. Comprehensive geological analysis of the Rizhao Reservoir and surrounding areas. Shandong Land Resour. 2015, 31, 46–49+54. [Google Scholar]
- Wu, D.; Li, B.; Li, Y.; Li, Q.; Sheng, C.; Liu, J.; Wang, M.; Min, Y.; Feng, J.; Zhang, Y.; et al. Characterization of Groundwater Hydrochemistry and Temporal Dynamics of Water Quality in the Northern Baiquan Spring Basin. Water 2024, 16, 2519. [Google Scholar] [CrossRef]
- Nisar, U.; Rehman, W.; Saleem, S.; Taufail, K.; Rehman, F.; Farooq, M.; Ehsan, S. Assessment of water quality using entropy-weighted quality index, statistical methods and electrical resistivity tomography, Moti village, northern Pakistan. J. Contam. Hydrol. 2024, 264, 104368. [Google Scholar] [CrossRef]
- Liu, N.; Chen, M.; Gao, D.; Wu, Y.; Wang, X. Identification of hydrogeochemical processes in shallow groundwater using multivariate statistical analysis and inverse geochemical modeling. Environ. Monit. Assess. 2025, 197, 135. [Google Scholar] [CrossRef] [PubMed]
- Li, X.; Li, K.; Li, S.; Li, Z.; Wang, L.; Guo, W. Source tracing analysis of the exceedance of NH3-N and CODMn in shallow groundwater in the central typical area of the Yangtze River Delta. Sci. Rep. 2024, 14, 28544. [Google Scholar] [CrossRef]
- Alezabawy, K.; Eissa, M.; Salem, Z. Hydrogeochemical and isotopic investigations of groundwater in the reclaimed desert located between EL Nasr canal and Mariut Tableland, NW Coast, Egypt. Sci. Rep. 2024, 14, 21172. [Google Scholar] [CrossRef]
- He, Q.; Pan, Y.; Zeng, M.; Wang, S.; Shi, H.; Huang, C.; Peng, H. Assessment of groundwater hydrochemistry, water quality, and health risk in Hainan Island, China. Sci. Rep. 2023, 13, 12104. [Google Scholar]
- Zhou, Z.; Huang, Q.; Wang, Y.; Li, F.; Liang, J.; Xiong, J. Recharge Sources and Hydrochemical Evolution Mechanism of Surface Water and Groundwater in Typical Karst Mining Area. Huanjing Kexue 2024, 45, 5264–5276. [Google Scholar]
- Hua, K.; Xiao, J.; Li, S.; Li, Z. Analysis of hydrochemical characteristics and their controlling factors in the Fen River of China. Sustain. Cities Soc. 2020, 52, 101827. [Google Scholar] [CrossRef]
- Xiao, J.; Wang, L.; Chai, N.; Liu, T.; Jin, Z.; Rinklebe, J. Groundwater hydrochemistry, source identification and pollution assessment in intensive industrial areas, eastern Chinese loess plateau. Environ. Pollut. 2021, 278, 116930. [Google Scholar] [CrossRef]
- Reading, L.; Gurieff, L.; Catania, S. Sustainable Groundwater Management through Collaborative Local Scale Monitoring. Water Resour. Manag. 2024, 39, 725–740. [Google Scholar] [CrossRef]
- Neidhardt, H.; Shao, W. Impact of climate change-induced warming on groundwater temperatures and quality. Appl. Water Sci. 2023, 13, 235. [Google Scholar] [CrossRef]
- Yang, Y.; Li, P.; Elumalai, V.; Ning, J.; Xu, F.; Mu, D. Groundwater Quality Assessment Using EWQI With Updated Water Quality Classification Criteria: A Case Study in and Around Zhouzhi County, Guanzhong Basin (China). Expo. Health 2022, 15, 825–840. [Google Scholar] [CrossRef]
- Ge, A. Strategies for the sustainable development and utilization of groundwater resources in Yanggu County. Groundwater 2024, 46, 90–92. [Google Scholar]
- Yu, H. Discussion on Sustainable Development and Utilization of Groundwater Resources. Water Saf. 2024, 13, 98–100. [Google Scholar]
- Gao, H. Strategies for the sustainable utilization of groundwater resources. Agric. Disaster Res. 2024, 14, 246–248. [Google Scholar]
- Xu, D.; Guan, X.; Xu, S. Applications of big data analysis in water resource management. Inf. Syst. Eng. 2025, 1, 129–132. [Google Scholar]


| Max | Min | Mean | Standard Deviation | Coefficient of Variation(%) | |
|---|---|---|---|---|---|
| pH | 8.79 | 6.52 | 7.46 | 1.02 | 0.14 |
| TH | 586.47 | 78.18 | 300.90 | 159.63 | 0.38 |
| TDS | 1130.02 | 149.62 | 519.17 | 109.63 | 0.36 |
| Ca2+ (mg/L) | 149.50 | 18.05 | 79.91 | 29.86 | 0.37 |
| Mg2+ (mg/L) | 55.78 | 8.04 | 23.75 | 8.93 | 0.38 |
| K+ (mg/L) | 39.67 | 0.18 | 2.83 | 4.50 | 1.59 |
| Na+ (mg/L) | 141.00 | 4.96 | 38.47 | 20.22 | 0.53 |
| Cl− (mg/L) | 214.35 | 2.12 | 58.42 | 41.34 | 0.71 |
| SO42− (mg/L) | 160.99 | 19.99 | 81.10 | 28.10 | 0.35 |
| HCO3− (mg/L) | 569.05 | 70.06 | 199.35 | 93.61 | 0.47 |
| NO3− (mg/L) | 272.72 | 2.2 | 87.45 | 66.74 | 0.76 |
| EWQI | Level | Category |
|---|---|---|
| <25 | I | Very good |
| 25~50 | II | Good |
| 51~100 | III | Medium |
| 101~150 | IV | Poor |
| >150 | V | Very poor |
Disclaimer/Publisher’s Note: The statements, opinions and data contained in all publications are solely those of the individual author(s) and contributor(s) and not of MDPI and/or the editor(s). MDPI and/or the editor(s) disclaim responsibility for any injury to people or property resulting from any ideas, methods, instructions or products referred to in the content. |
© 2025 by the authors. Licensee MDPI, Basel, Switzerland. This article is an open access article distributed under the terms and conditions of the Creative Commons Attribution (CC BY) license (https://creativecommons.org/licenses/by/4.0/).
Share and Cite
Lv, Y.; Li, X.; Yuan, J.; Tian, H.; Wei, T.; Wang, M.; Dai, Y.; Feng, J.; Zhang, Y.; Yang, P. Hydrogeochemical Signatures and Spatiotemporal Variation of Groundwater Quality in the Upper and Lower Reaches of Rizhao Reservoir. Water 2025, 17, 1659. https://doi.org/10.3390/w17111659
Lv Y, Li X, Yuan J, Tian H, Wei T, Wang M, Dai Y, Feng J, Zhang Y, Yang P. Hydrogeochemical Signatures and Spatiotemporal Variation of Groundwater Quality in the Upper and Lower Reaches of Rizhao Reservoir. Water. 2025; 17(11):1659. https://doi.org/10.3390/w17111659
Chicago/Turabian StyleLv, Youcheng, Xiaodong Li, Jie Yuan, Hong Tian, Tongzheng Wei, Min Wang, Yuqiang Dai, Jianguo Feng, Yuqi Zhang, and Peng Yang. 2025. "Hydrogeochemical Signatures and Spatiotemporal Variation of Groundwater Quality in the Upper and Lower Reaches of Rizhao Reservoir" Water 17, no. 11: 1659. https://doi.org/10.3390/w17111659
APA StyleLv, Y., Li, X., Yuan, J., Tian, H., Wei, T., Wang, M., Dai, Y., Feng, J., Zhang, Y., & Yang, P. (2025). Hydrogeochemical Signatures and Spatiotemporal Variation of Groundwater Quality in the Upper and Lower Reaches of Rizhao Reservoir. Water, 17(11), 1659. https://doi.org/10.3390/w17111659