Article

Impact of Climate Change on Wheat Production in Algeria and Optimization of Irrigation Scheduling for Drought Periods

1
Department of Food Security and Agricultural Development, Kyungpook National University, Daegu 41566, Republic of Korea
2
Laboratory of Promotion in Agriculture in Arid Regions, University of Mohamed KHIDER, Biskra 07000, Algeria
3
Technical Institute for Field Crops (TIFC), 01 Street Pasteur-Hassen Badi, ElHarrach 16200, Algeria
4
Department of Agricultural Civil Engineering, Kyungpook National University, Daegu 41566, Republic of Korea
*
Author to whom correspondence should be addressed.
Water 2025, 17(11), 1658; https://doi.org/10.3390/w17111658
Submission received: 23 April 2025 / Revised: 25 May 2025 / Accepted: 28 May 2025 / Published: 29 May 2025
(This article belongs to the Section Water, Agriculture and Aquaculture)

Abstract

:
This study investigates the impact of climate variability on wheat production in Algeria’s semi-arid interior plains from 2014 to 2024, aiming to curb the challenges of rainfed wheat cultivation, optimize irrigation, and improve water productivity. The Soil–Water–Atmosphere–Plant (SWAP) model-driven approach refined irrigation scheduling to mitigate climate-induced losses and improve resource efficiency. Using historical climate data, soil properties, and wheat growth observations from the experimental farm of the Technical Institute for Field Crops, the SWAP model was calibrated and validated using one-factor-at-a-time sensitivity analysis, achieving a coefficient of determination (R2) of 0.93 and a Normalized Root Mean Squared Error (NRMSE) of 17.75. Two drought-based irrigation indices, Soil Moisture Drought Index (SMDI) and Crop Water Stress Index (CWSI), guided adaptive irrigation strategies, showing a significant reduction in crop failure during drought periods. Results revealed a strong link between rainfall variability and wheat yield. Adopting a 9-day irrigation interval could increase water productivity to 18.91 kg ha1 mm1, enhancing yield stability under varying climatic conditions. The SMDI approach maintained soil moisture during extreme drought, while CWSI optimized water use in normal and wet years. This study integrates SMDI and CWSI into a validated irrigation framework, offering data-driven strategies to enhance wheat production resilience. Findings support sustainable water management and provide practical insights for policymakers and farmers to refine irrigation planning and climate adaptation, contributing to long-term agricultural sustainability.

1. Introduction

Wheat is a staple crop and one of the top three cereals globally, alongside rice and maize, playing a vital role in food security. Its products, such as bread, pasta, and flour-based foods, are key dietary components across cultures [1,2]. Rising demand, driven by population growth and changing consumption patterns, underscores the need for increased productivity under diverse environmental conditions [3]. However, wheat production faces mounting challenges due to climate change, as increasing temperatures, shifting precipitation patterns, and extreme weather events disrupt growing seasons, reduce soil moisture, and heighten plant susceptibility to diseases and pests [4,5,6].
In Algeria, wheat plays a strategic role in national food security, yet the country remains heavily dependent on imports due to insufficient local production. The predominance of rainfed wheat farming, coupled with frequent droughts, poor soil fertility, and reliance on traditional farming methods, leads to inconsistent yields and low productivity [7,8,9]. Limited access to modern irrigation infrastructure and soil management techniques significantly constrains agricultural output and exacerbates the challenges posed by climate variability. While initiatives focusing on improved seed varieties, better soil management, and mechanization aim to increase production [10,11], harsh environmental conditions and water scarcity continue to hinder self-sufficiency [12].
Given the vulnerability of rainfed wheat cultivation to climate variability, efficient irrigation management is essential to stabilizing yields and ensuring sustainable production. However, water scarcity in Algeria necessitates the adoption of precision irrigation techniques to maximize water use efficiency [13,14]. Traditional irrigation methods often lead to water wastage, while precision techniques like drip and sprinkler systems offer more sustainable solutions [15,16]. By integrating soil moisture sensors and remote sensing technologies, farmers can monitor field conditions in real-time, improve decision-making, and optimize irrigation based on actual crop needs [17]. Research has highlighted the influence of these variables on wheat production, highlighting the need for efficient water management techniques to guarantee food security [18,19,20]. Nevertheless, further localized studies are needed to evaluate the effectiveness of irrigation techniques in water-scarce areas. Research on irrigation timing is also crucial for maximizing water efficiency and improving wheat production under drought conditions.
To enhance water-use efficiency in wheat farming, the Soil–Water–Atmosphere–Plant (SWAP) model is employed to optimize irrigation scheduling based on key drought and soil moisture indicators [21,22]. This model integrates soil, climate, and plant data to precisely estimate crop water needs and determine optimal irrigation timing [23]. The Soil Moisture Deficit Index (SMDI) and Crop Water Stress Index (CWSI) further refine irrigation strategies by assessing soil moisture anomalies and crop water stress levels, allowing for targeted interventions to prevent yield losses [24,25]. Implementing these indices within the SWAP framework enhances precision irrigation practices, promoting sustainable agricultural development in water-limited environments [26,27].
This study examines the impact of climate variability on wheat production in Algeria’s semi-arid regions and explores how optimizing irrigation practices can enhance yield, aiming to develop a sustainable irrigation method for wheat farming in Algeria by integrating simulation models with drought indicators, focusing on improving water management, wheat resilience to drought, and agricultural productivity. Given Algeria’s reliance on wheat imports and increasing water scarcity, enhancing irrigation efficiency is crucial for boosting local production and reducing agricultural risks. This study will offer crucial data to help decision-makers develop strategies that improve water management and reduce dependence on external wheat sources. It highlights the urgent need for innovative approaches to address water shortages, protecting the local economy and communities reliant on agriculture.

2. Materials and Methods

2.1. Study Area and Data

The study was conducted in Algeria’s interior plains, specifically at the experimental seed production farm of the Technical Institute for Field Crops (TIFC) in Beni Slimane, located 88 km southeast of Algiers (latitude: 36.2197° N, longitude: 3.6794° E), at an altitude of 680 m above sea level (Figure 1). The region has a semi-arid climate with cold, rainy winters, hot, dry summers, and unevenly distributed rainfall, mostly between autumn and early spring [28]. Agriculture in this area centers around cereal crops like wheat and barley, which depend on seasonal rainfall [29]. The soil is mainly soft clay and rocky, supporting moderate agricultural activity and cereal cultivation.
Climate data for the study area were obtained from the NASA Prediction of Worldwide Energy Resources (POWER) database (https://power.larc.nasa.gov/ (accessed on 22 April 2025)) from 2014 to 2024, including daily records of temperature (°C), precipitation (mm), solar radiation (MJ m2 d1), wind speed (m s1), and air humidity (kPa). Summers saw temperatures ranging from 20 °C to 35 °C with minimal rainfall, while most precipitation occurred from November to April, with an average annual precipitation of 395 mm [30]. These data are essential for the SWAP model simulations, as they are used to estimate soil moisture dynamics and optimize irrigation schedules based on actual climatic conditions. A comparative analysis was performed using temperature and precipitation records from the Imetos weather station located at the experimental farm to evaluate the agreement between NASA POWER data and ground-based measurements. The results showed strong consistency between the two datasets, supporting the use of NASA POWER data as a reliable input for the model.
Soil samples from the TIFC farm in Beni Slimane were collected at three depths (0–20 cm, 20–40 cm, and 40–60 cm) and analyzed for texture and bulk density (Table 1). The soil was classified as clay loam, and the ROSETTA model was used to estimate hydraulic properties for SWAP model simulations, which are essential for evaluating water retention and soil moisture behavior [31,32].
Wheat data of the Simeto variety at the TIFC experimental farm were collected over a decade (2014–2024). The crops were cultivated under natural rainfall, providing insights into yield responses to varying precipitation. Data on crop development, growth patterns, and sowing/maturity dates were essential for understanding how environmental conditions impacted yield and for calibrating predictive models.

2.2. SWAP Model

The Soil–Water–Atmosphere–Plant (SWAP) model is an advanced, one-dimensional numerical simulation tool used in hydrology and agriculture to predict soil moisture content and its temporal variations. This physically based model describes the intricate interactions within the soil–water–atmosphere–plant system using the Richards equation (Equation (1)), which models soil moisture dynamics across the soil profile. The equation is solved numerically using an implicit finite difference scheme [27,33]. The Richards equation is expressed as follows:
θ t = z K ( h ) h z S h
where theta θ represents the soil water content (cm3 cm3), t is time (day), z is the vertical soil depth (cm), K is the hydraulic conductivity (cm d1), h is the soil water pressure head (cm), and C is the differential water capacity (cm1). The S (h) is the actual soil moisture extraction rate by plant roots (cm3 cm3 d1), defined by the following:
S h = α ω   · T p o t   ·   Z r
where Tpot is the potential transpiration (cm d1), Zr is the rooting depth (cm), and αω is a reduction factor based on the pressure head h, accounting for water deficit and oxygen stress [34]. The model incorporates soil hydraulic functions for θ(h) and K(h), which are derived from the analytical expressions of [35,36]. These are given by the following:
S e = θ h θ r e s θ s a t θ r e s = 1 + α h n m
K h = K s a t   S e λ 1 ( 1 S e 1 m ) m 2
where Se is the relative saturation; θres and θsat are the residual and saturated soil water contents (cm3 cm3); α (cm1), n, m, and λ are shape parameters for the retention and conductivity functions; and Ksat is the saturated hydraulic conductivity (cm d1).
The SWAP model is highly versatile, simulating various factors such as soil texture, climate conditions, crop type, and irrigation practices. It uses the Penman–Monteith equation to estimate actual and potential transpiration, partitioned by the leaf area index (LAI) or soil cover fraction [37,38]. The model has been extensively validated and applied across a range of climatic and environmental contexts, integrating both basic and detailed crop growth models (WOFOST) and water management functions [22,39,40,41]. This study employed SWAP to simulate wheat growth, determining its water requirements and crop development stages. Using these results, the model was then integrated with the SMDI and CWSI, as shown in the workflow in Figure 2, to refine irrigation scheduling and optimize water use efficiency for wheat cultivation.

2.3. Model Calibration and Validation

Calibration and validation are crucial for improving the SWAP model’s accuracy in predicting wheat growth and soil water balance under various environmental conditions [42,43]. Calibration adjusts model parameters to align with real-world observations, ensuring the model accurately represents crop growth, soil–water interactions, and climate impacts [44,45]. Validation, in turn, assesses the model’s performance using independent data to evaluate its ability to predict crop yield [46,47]. In this study, calibration focused on refining crop-sensitive parameters, while validation tested the model’s long-term reliability from 2014 to 2024 [48]. The one-factor-at-a-time (OAT) method was used to optimize the model for local conditions by systematically modifying parameters and evaluating their impact [49,50,51].
Historical field data from the TIFC farm, including crop-specific observations like sowing day, growth stages, and yield measurements, were used for calibration, along with daily weather data and average soil hydraulic properties from the ROSETTA model [52,53]. These data covered drought and non-drought years, ensuring the model’s performance across different climatic conditions. Key parameters calibrated included crop coefficients, soil hydraulic properties, and leaf area index to simulate wheat’s water needs and growth accurately. Crop-sensitive parameters, such as root depth, dry matter partitioning, and biomass conversion efficiency, were iteratively refined. These adjustments were made to parameters like crop height, temperature sums from emergence to anthesis, temperature sums from anthesis to maturity, and biomass conversion efficiency, as presented in Table 2.
The calibration process involved adjusting sensitive parameters using the OAT method for the year 2014. The process began by synchronizing the emergence day with the first rainfall event after sowing to align simulated growth stages with field observations. Subsequently, sensitive parameters were systematically calibrated based on the default parameters in the SWAP model in accordance with the established literature [21,39,48,52,54,55,56], and adjusted within the suggested ranges in the literature [57,58], improving the model’s accuracy in predicting wheat yield under diverse climatic conditions.
Data from 2015 to 2024 were used to validate the model’s predictive accuracy. The model, once calibrated, was run using the modified parameters, and simulated crop yields and days to maturity were compared with observed data. Several statistical methods were applied to evaluate the calibration quality and the model’s overall performance, including the coefficient of determination (R2), Root Mean Squared Error (RMSE), Normalized Root Mean Squared Error (NRMSE), and mean relative error (MRE), which were calculated using the following equations:
R 2 = i = 1 n O i O S i S i = 1 n O i O 2 i = 1 n S i S 2
R M S E = 1 n i = 1 n S i O i 2
N R M S E = R M S E O ¯
M R E = 1 n i = 1 n S i O i 0 i × 100
where Oi and Si are the observed and simulated values, O and S are the averages of the observed and simulated values, respectively, and n is the number of data points.

2.4. Precipitation Scenario Analysis

Precipitation classification years categorize total rainfall during the wheat-growing season using Empirical Frequency Analysis (EFA) from 2014 to 2024. The EFA is crucial for understanding environmental and economic impacts and supports policy development and climate change adaptation plans [59]. Prior research has established dependability in utilizing EFA for categorizing precipitation years [60,61]. The methodology involves ranking yearly precipitation totals, assigning ranks, and applying the Weibull Equation (9) outlined by [62] to calculate the empirical probability (p) [63], as follows:
P = m n + 1 × 100 %
Based on the p value, precipitation years are classified into three categories: wet, normal, and dry years, using thresholds of 25%, 50%, and 75% p values, respectively.

2.5. Irrigation Strategy Evaluation

In this study, the decision to utilize the Soil Moisture Deficit Index (SMDI) and the Crop Water Stress Index (CWSI) was based on their complementary strengths in irrigation scheduling. The SMDI focuses on soil moisture levels within the root zone, providing a reliable indication of drought conditions and guiding irrigation to prevent moisture deficits [64,65,66]. In contrast, the CWSI evaluates the plant’s actual water stress, enabling more precise irrigation management by addressing the plant’s physiological needs [22,66,67]. These two indices were chosen because they address different but complementary aspects of irrigation: the SMDI helps manage soil moisture, while the CWSI ensures the crop’s water requirements are met without over-irrigation. To identify the best approach for irrigation scheduling, these indices were compared based on their ability to ensure stable production under changing climatic conditions and optimize water productivity. The dual approach optimizes water use, ensuring timely and efficient irrigation, thus improving crop resilience to drought and enhancing overall water productivity.

2.5.1. Soil Moisture Deficit Index (SMDI)

The SMDI is widely used to monitor agricultural drought and soil moisture conditions [68,69,70]. It provides valuable insights into soil moisture dynamics within the root zone, using daily soil moisture data from models like SWAP. The SMDI ranges from −4 (dry conditions) to +4 (wet conditions), with negative values indicating drought and positive values indicating higher soil moisture [64]. The index is calculated dynamically using a weighted average method that incorporates previous weeks’ soil moisture conditions. The general formula is as follows [71,72,73]:
S M D I m = 0.5 × S M D I m 1 + S D m 50
S D l , m = S W l , m M S W m M S W m m i n S W m × 100 ,   S W l , m M S W m S W l , m M S W m m a x S W m M S W m × 100 ,   S W l , m > M S W m  
where SDl,m is the soil moisture deficit value (%), SWl,m is the weekly average soil water content (mm), MSWm is the medium- and long-term average soil water content (mm), and minSWm and maxSWm are the long-term minimum and maximum weekly soil water contents (mm), respectively.

2.5.2. Crop Water Stress Index (CWSI)

The CWSI is a crucial tool for evaluating plant water stress, ranging from 0 (maximum transpiration and no stress) to 1 (no transpiration and severe water stress) [74]. It was calculated using the following equation:
C W S I = 1 T a T p
where Ta represents actual transpiration, and Tp represents potential transpiration. The Water Stress Index (WS) was calculated at different levels: 10%, 20%, 30%, 40%, and 50% of ETo, allowing for a more precise assessment of crop water stress and efficient management [22]. It was calculated using the following equation:
W S = 1 T a T p × 100
Analyzing different WS percentages helps identify the optimal threshold for irrigation, balancing water usage and plant needs. Lower WS values (10%) suggest sufficient soil moisture, while higher values (50%) indicate severe water stress requiring immediate irrigation. This approach is incorporated into the Irrigation Schedule Date (ISD), with further irrigation decisions based on continued high WS values if dry conditions persist [75]. The CWSI further irrigation decisions are made based on continued high WS values. CWSI is considered an index related to crop productivity, especially in arid areas [67].

2.6. Irrigation Water Productivity (IWP)

To assess the impact of irrigation water consumption on crop yield and determine its effectiveness in enhancing yield, irrigation water productivity (IWP, unit: kg ha1 mm1) was introduced, and marginal benefits were calculated as follows [76,77,78]:
I W P =   G Y G Y w W i r r
where GY is the grain yield under irrigation (kg ha−1), GYw is the grain yield under rainfed conditions (kg ha−1), and Wirr is the amount of irrigation water (mm).

3. Results

3.1. Model Validation

The SWAP model showed strong predictive performance in simulating wheat growth and soil water balance from 2014 to 2024, with validation confirming its accuracy in predicting wheat yield and growth duration under varying climatic conditions. Meanwhile, simulated yields were consistently higher than observed (Figure 3), likely due to idealized assumptions of optimal conditions [54]. Despite this, the model still provided reliable crop yield and growth predictions across different weather scenarios. It proved valuable for irrigation planning and water resource management, offering a close approximation to real-world conditions [74].
The performance evaluation revealed an MRE of 6.5%, indicating minimal deviation between simulated and observed wheat yields from 2014 to 2024. With an R2 value of 0.93, the model demonstrated a strong correlation between simulated and observed data, confirming its accuracy in predicting crop yield and other variables across different weather conditions [54,79,80]. The RMSE was 359.9 kg ha1, which is considered acceptable [54,57] compared to other studies that report higher RMSE values while still falling within acceptable error ranges for practical applications [80]. The NRMSE was 17.75%, well below the 25% threshold, indicating good model performance and predictive accuracy [21,81].
The model performed consistently throughout the study period, though some discrepancies were noted in specific years. In 2017, there was a strong correlation between simulated and observed days to maturity. However, in 2018 and 2019, there were more significant discrepancies of 25 and 26 days, likely due to substantial rainfall during the final growth stages, which affected the maturity timing. Despite these discrepancies, ANOVA analysis showed no significant difference between simulated and observed data, confirming that these minor differences did not affect the model’s overall accuracy.

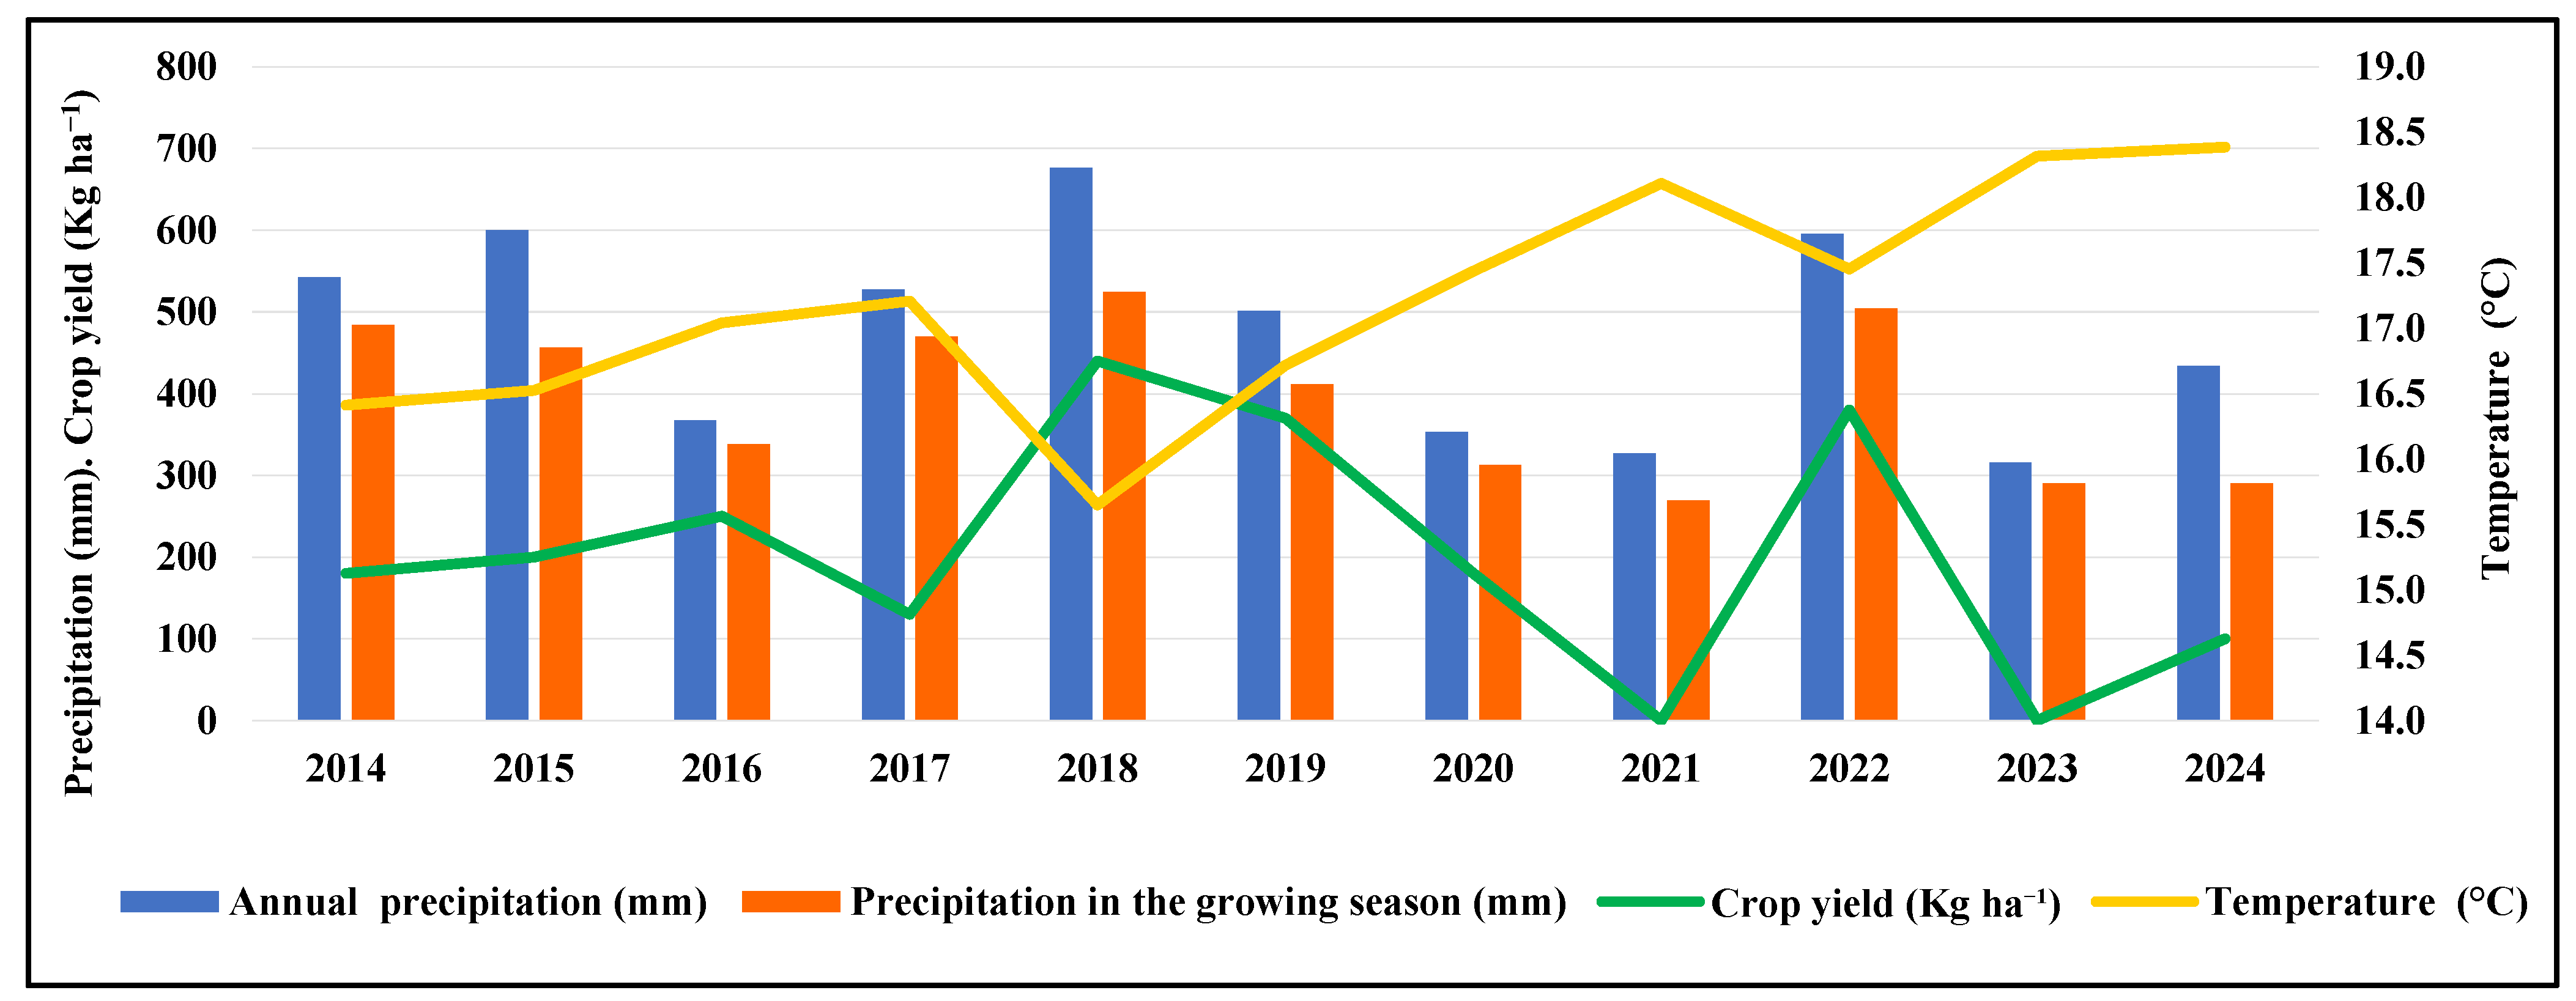
3.2. Climate Impact on Wheat Yield

The study area in Algeria’s interior plains has a semi-arid climate, with cold, rainy winters and hot, dry summers [82]. Climate data from 2014 to 2024 reveal significant variations in both rainfall and temperature during the wheat-growing season (Figure 4). From November to June, the wheat-growing season is characterized by fluctuating rainfall patterns [83], with some years receiving adequate rainfall while others experience prolonged dry spells. Additionally, rising temperatures, particularly during critical growth stages such as flowering and grain filling, coincide with periods of reduced rainfall. This combination of higher temperatures and limited rainfall during these sensitive stages has led to fluctuating soil moisture levels, essential for wheat growth [19,84]. Over the study period, the data show a clear warming trend, but rainfall patterns exhibited no consistent trend, which was instead marked by notable fluctuations from year to year. These climatic changes have increased challenges to the stability and yield of rainfed wheat [19,85,86].
Throughout the study period from 2014 to 2024, wheat yields varied significantly each year. The highest yield, 4400 Kg ha−1, was recorded in 2018, followed by 2022 and 2019 with 3800 and 3700 Kg ha−1, respectively, which were considered good yields under favorable rainy conditions (over 400 mm of rainfall). In contrast, production ranged from 1000 to 2500 Kg ha−1 in other years, with 2021 and 2023 seeing complete crop failure due to insufficient rainfall (below 290 mm) and prolonged drought (Figure 5). The Pearson correlation coefficient (r = 0.71) shows a strong positive relationship between rainfall and wheat yield. As a result, there is an urgent need for alternative solutions and the development of effective water management strategies to ensure the sustainability of agricultural production, especially in semi-arid regions with such significant climatic variability.

3.3. SMDI and EFA Drought Period Analysis

To examine drought conditions during the 2014–2024 period, the study applied the Empirical Frequency Analysis (EFA) method to classify rainfall years based on the total seasonal precipitation. According to the EFA results, 2014, 2015, 2016, 2017, 2019, and 2022 were classified as “normal”, with seasonal rainfall ranging between 338 mm and 505 mm. The year 2018 was categorized as “wet”, recording the highest rainfall (524 mm), while 2020, 2021, 2023, and 2024 were identified as “dry”, each with less than 312 mm of rainfall.
To complement the EFA classification, the Soil Moisture Drought Index (SMDI) was used to evaluate the duration and intensity of drought periods based on daily soil moisture data. SMDI analysis confirmed the EFA-based drought classifications and provided additional insight into the frequency and timing of drought episodes. Dry days were defined as those with SMDI values below zero.
In normal years, the number of dry days ranged from 41 to 91. Notably, 2018 recorded no dry days, indicating optimal moisture conditions throughout the wheat growth cycle. In contrast, dry years exhibited over 100 dry days, with 2023 reaching the highest count of 144. Most drought periods, as detected by SMDI, coincided with sensitive wheat growth stages, particularly from flowering to maturity, thereby affecting yield potential.
The strong agreement between EFA and SMDI classifications highlights the reliability of combining statistical and soil-based indicators for drought assessment. Table 3 presents detailed results, including rainfall amounts, EFA classification, SMDI-derived drought periods, and observed rainfed wheat yields.

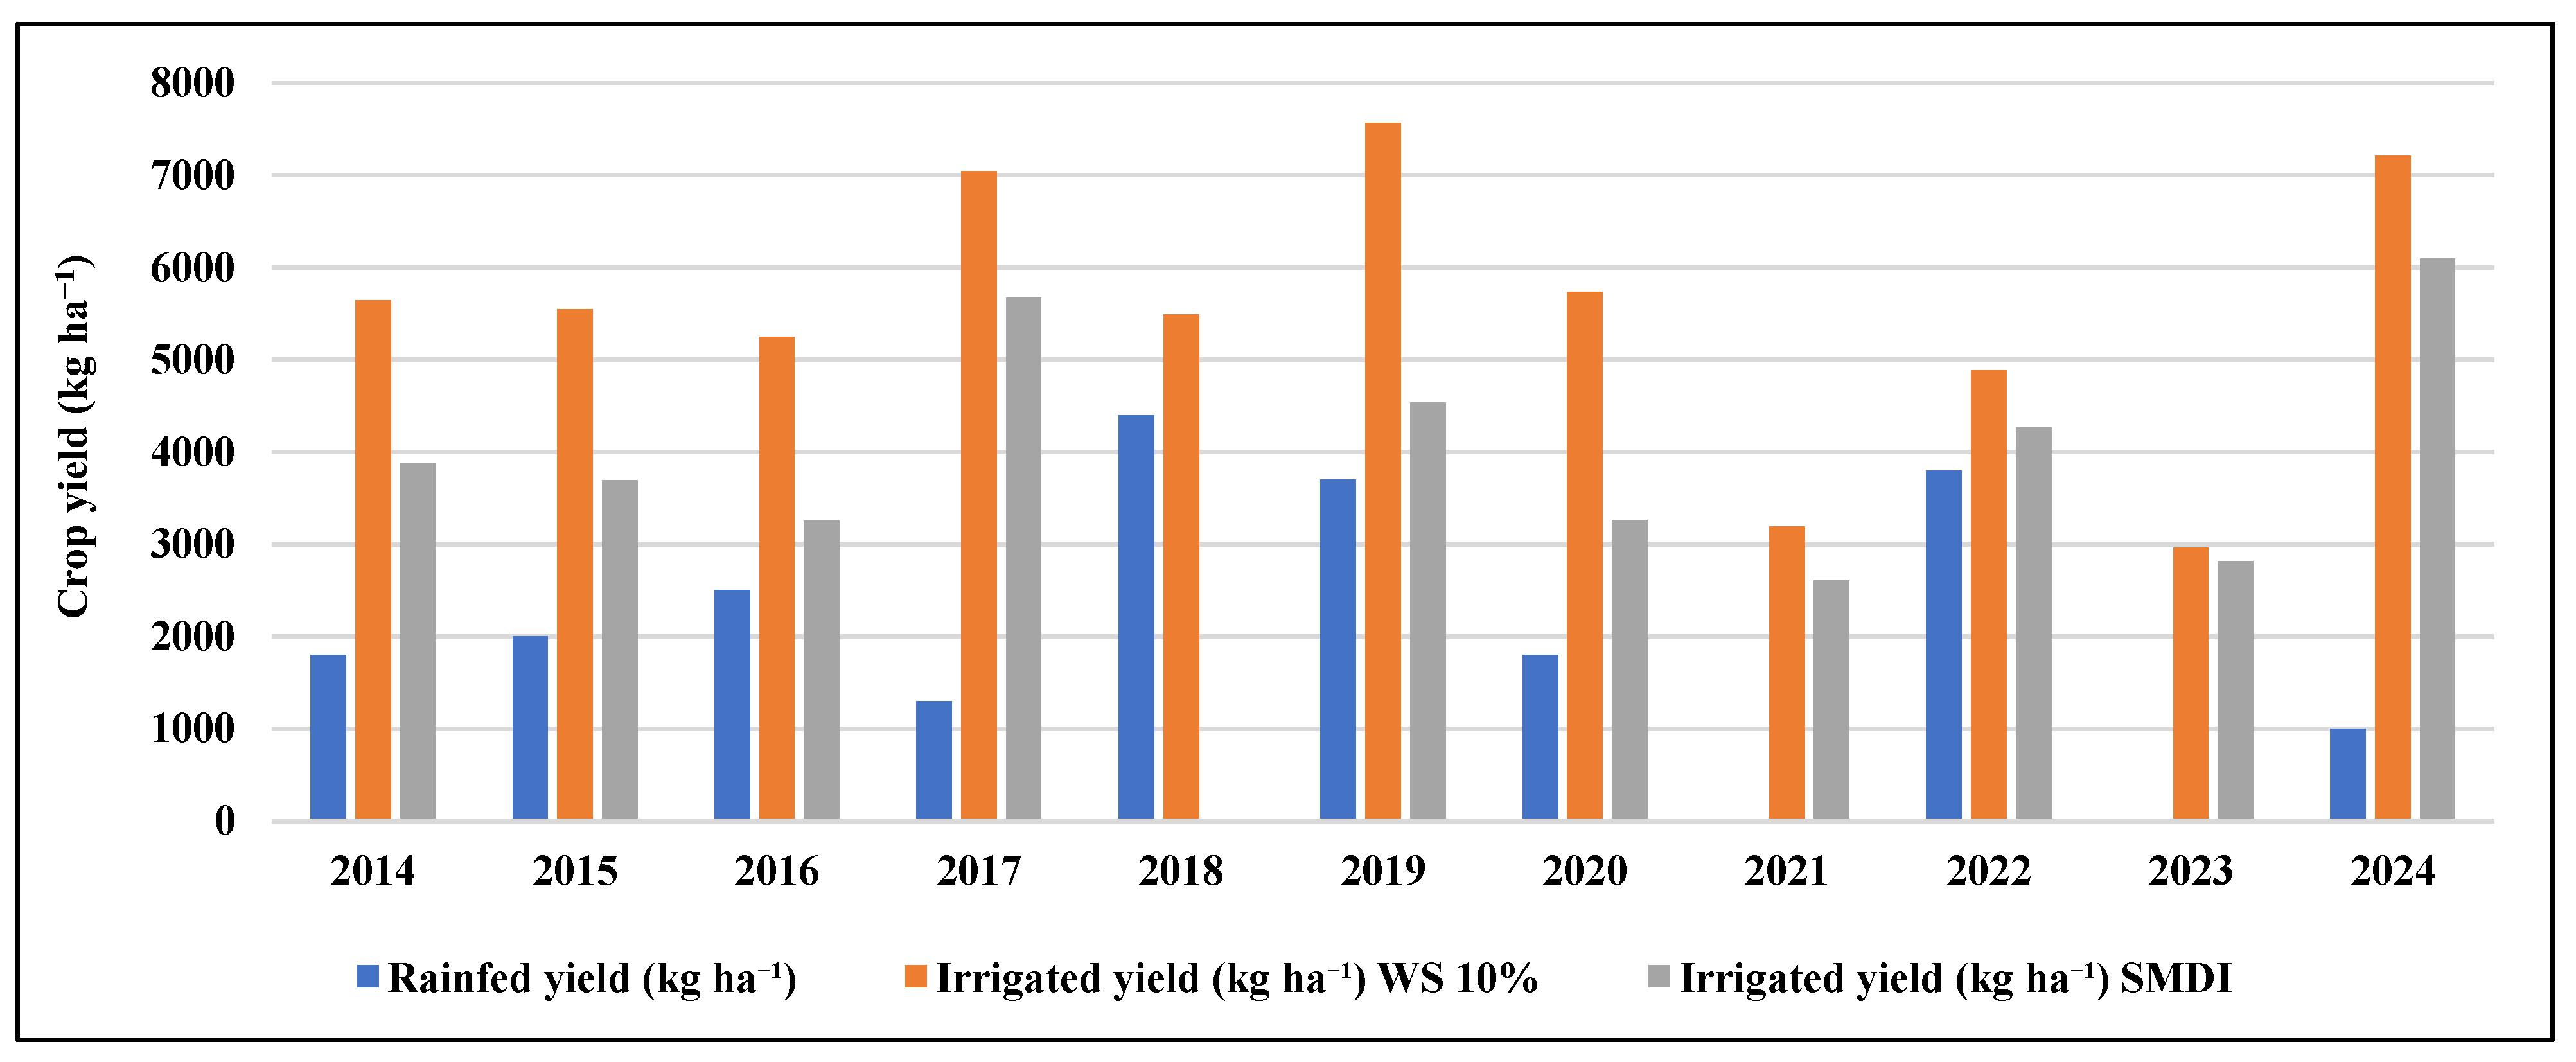
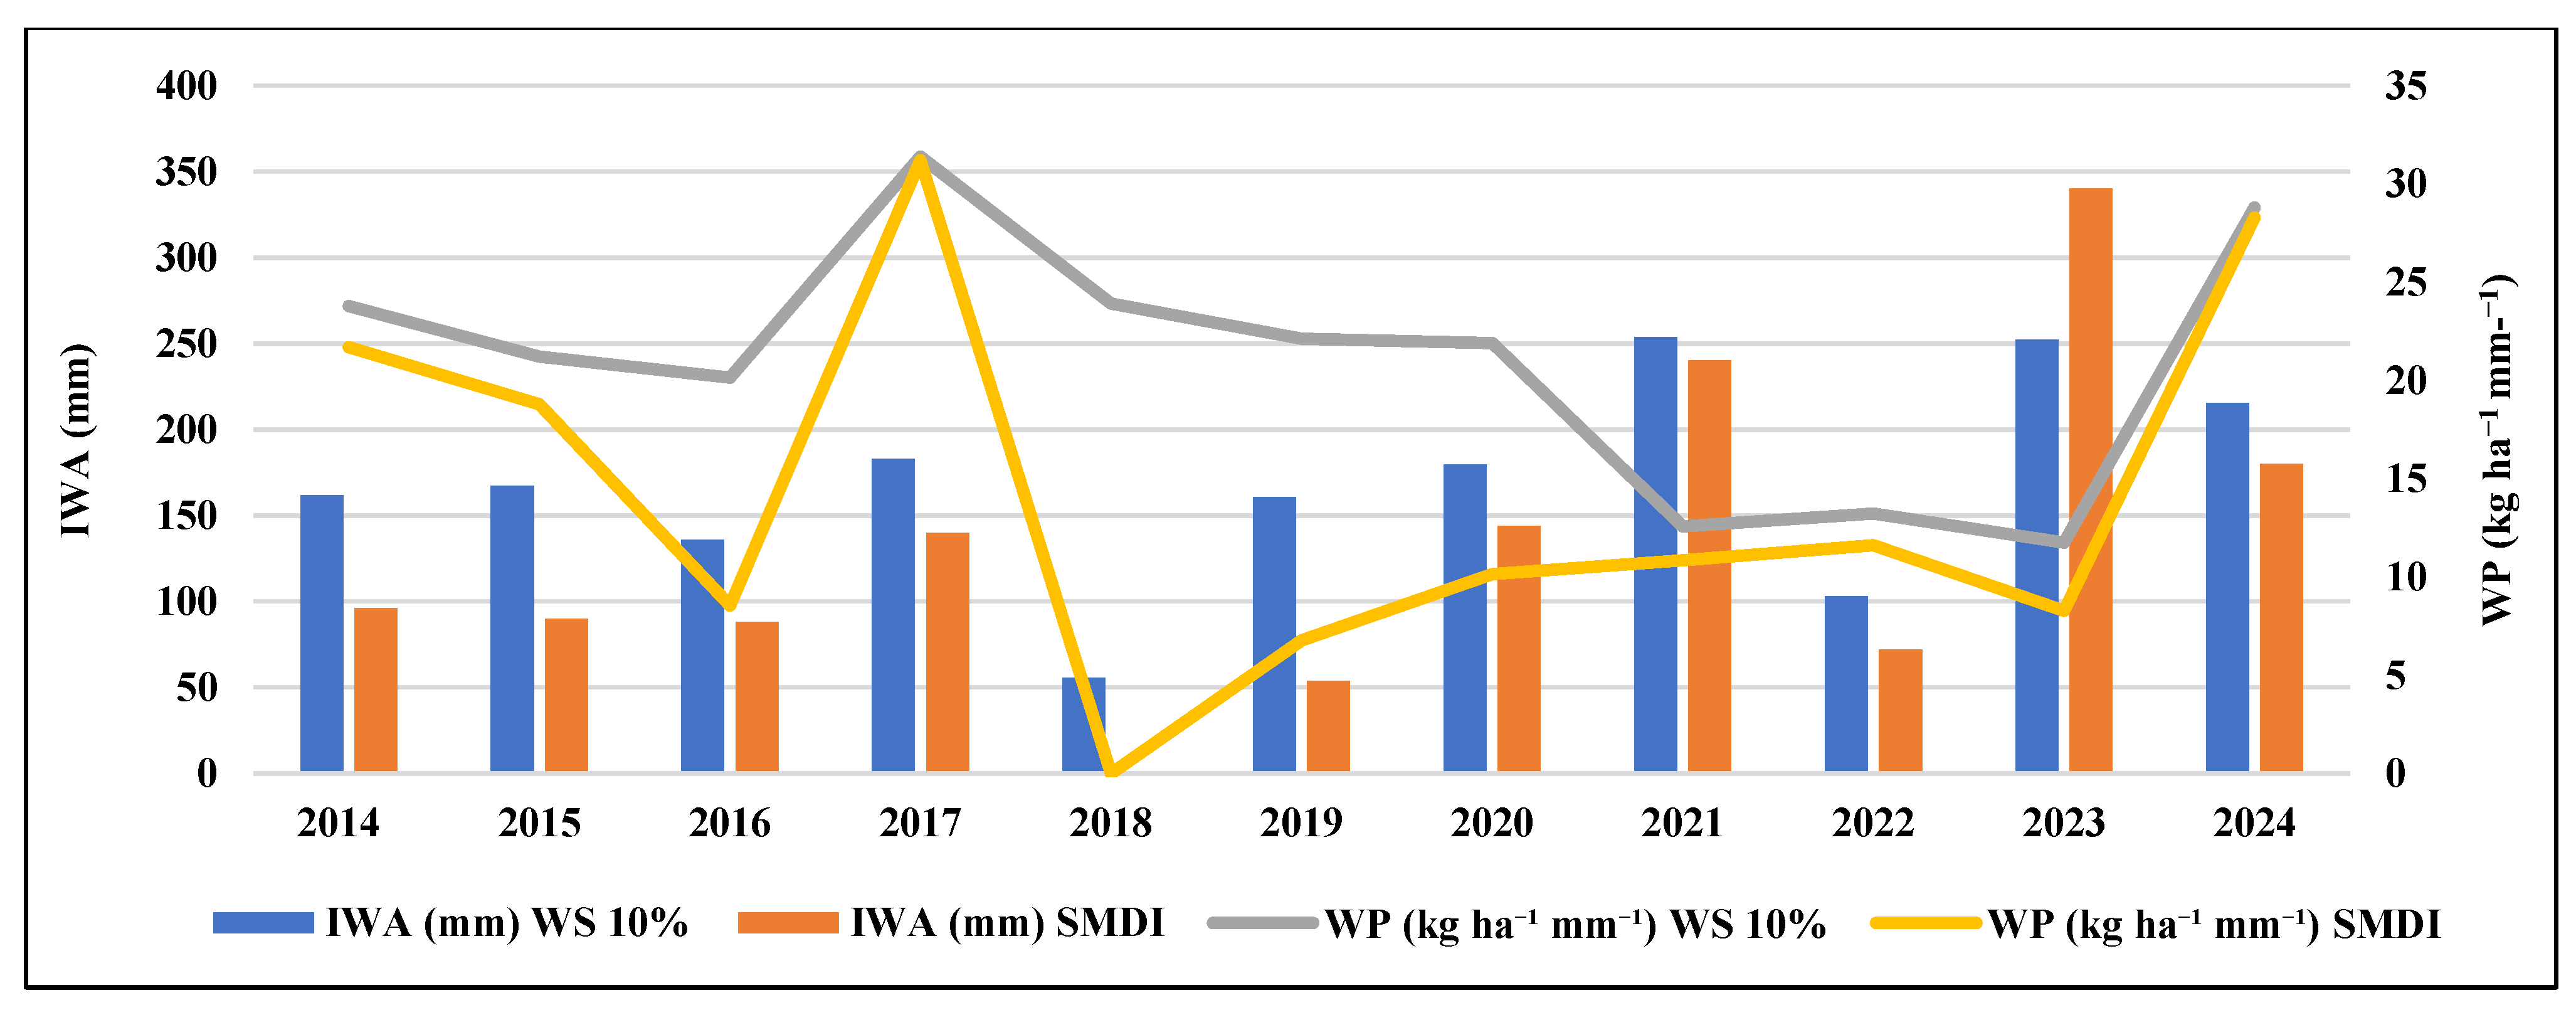
3.4. SMDI-Based Irrigation Strategy

This study evaluated the effects of different irrigation intervals (5, 7, 9, and 10 days) on Irrigation Water Amount (IWA) and water productivity (WP) by employing the SMDI over the period 2014–2024. Irrigation schedules were dynamically adjusted each year based on SMDI values, enabling timely and targeted responses to root zone moisture deficits during drought conditions. The SMDI functions by comparing weekly soil moisture content, generating index values ranging from −4 (severe drought) to +4 (excess moisture) [64]. Irrigation events are typically initiated when the index falls below zero (Figure 6), thereby maintaining soil moisture near optimal levels for crop growth and minimizing water stress to optimize yield (Figure 7).
Among the tested intervals, the 9-day irrigation interval delivered the highest average WP (15.62 kg ha1 mm1) with relatively stable outcomes; the 9-day irrigation schedule shows the lowest Coefficient of Variation (CV) of 47.8%, suggesting more excellent stability and reinforcing its suitability for optimizing irrigation in semi-arid wheat production. The 5-day interval resulted in over-irrigation, lowering WP to 13.68 kg ha1 mm1, while the 10-day interval showed occasional high WP but with notable variability across years (Table 4). Weekly monitoring of SMDI allowed irrigation to be triggered only when necessary, ensuring moisture remained close to optimal and minimizing crop stress. This approach significantly improved water-use efficiency without compromising yield.
The high performance of longer irrigation intervals was facilitated by the water retention capacity of clay loam soils, which sustained adequate moisture for extended periods [87]. In contrast, frequent irrigation caused soil saturation, impeding aeration and reducing root efficiency [88].
Overall, the SMDI-based strategy proved to be an effective and adaptive tool for irrigation management in semi-arid environments. Its integration with the SWAP model provided a responsive system that optimized water use by aligning irrigation timing with crop water demands, the moisture condition of the soil, and drought phases.

3.5. CWSI-Based Irrigation Strategy

This section evaluated the effects of varying irrigation intervals (5, 7, 9, and 10 days) on Irrigation Water Amount (IWA) and water productivity (WP) using the Crop Water Stress Index (CWSI) at different water stress (WS) thresholds (10%, 20%, 30%, 40%, and 50%) from 2014 to 2024. Irrigation schedules were dynamically adjusted each year based on CWSI values, enabling precise and responsive irrigation decisions that corresponded with the plant’s physiological needs during periods of different water stress. The CWSI operates by comparing potential transpiration (Tp) with actual transpiration (Ta) (Figure 8), assigning values from 0 (no stress) to 1 (severe water stress). In this study, we incorporated WS, as shown in Equation (13) with various thresholds, to define different conditions for irrigation intervention. By adjusting the Irrigation Water Amount (IWA) based on these WS thresholds, we aimed to identify the optimal irrigation strategy, ensuring the best possible crop performance under varying water stress conditions.
Results in Table 5 indicated that irrigation intervals based on lower WS thresholds (such as 10% and 20%) consistently resulted in higher and more stable WP values. Specifically, the highest WP (20.40 kg ha1 mm1) was achieved at the 10% WS threshold, while the lowest WP (14.79 kg ha1 mm1) was observed at 50% WS. This indicates that higher water stress reduces the crop’s ability to efficiently use water, leading to lower WP values [89], confirming that water stress during cereal grain development reduces the duration of grain filling, and when crops have sufficient water, they perform better. A more significant amount of water is effectively converted into yield [90].
Among the irrigation intervals tested, the 9-day interval consistently outperformed the other intervals, achieving the highest and most stable WP. This interval provided the best balance between avoiding over-irrigation, with the highest average WP (18.91 kg ha1 mm1) across all WS levels. The 9-day interval with a 10% WS threshold yielded the most efficient and sustainable WP outcomes, showcasing its optimal irrigation scheduling capabilities.
The CWSI-based irrigation strategy effectively enhanced water-use efficiency and improved crop resilience under varying climatic conditions. By integrating WS thresholds into irrigation scheduling, the study demonstrated how precise irrigation management optimizes productivity and ensures stable crop yield, particularly in drought-prone regions.

3.6. Evaluation of SMDI and CWSI

This study compared the effectiveness of SMDI and CWSI methods in irrigation scheduling, both using the 9-day irrigation interval and a 10% WS threshold for the CWSI. These settings were chosen because they provided the best WP results for both methods, allowing for a fair comparison of their performance in optimizing irrigation practices. The use of SMDI and CWSI in irrigation schedules helped maximize water-use efficiency and improve crop yields across different climatic conditions (Table 6).
The comparison between the SMDI and CWSI at WS 10% methods showed that the 9-day irrigation interval with WS 10% resulted in fewer dry days than the SMDI method. For instance, in 2022, the WS 10% method recorded 23 dry days, while the SMDI method had 49. Over the study period, the SMDI strategy led to more dry days, as it detected more severe drought conditions during water-scarce periods due to its real-time soil moisture deficit adjustments [91].
Over the 10-year study period, the SMDI and CWSI with 10% WS strategies outperformed rainfed crops. The WS 10% strategy generally produced higher yields (Figure 9), particularly in 2017 and 2024, with 7041 kg ha1 and 7210 kg ha1, respectively. The SMDI method, although yielding slightly lower, was more adaptive and consistent, especially during moderate water stress years. While the WS 10% strategy required more water, it resulted in higher productivity, whereas the SMDI strategy was more water-efficient, using less water but still maintaining competitive yields.
The Irrigation Water Amount (IWA) was generally higher under the WS 10% method, except in 2023, when the SMDI method required more water due to severe drought. The WS 10% strategy consistently outperformed the SMDI method regarding water productivity (WP), with the highest WP of 31.39 kg ha1 mm1 in 2017, compared to 31.20 kg ha1 mm1 under SMDI. However, both methods had the lowest WP values in 2023, with 11.75 kg ha1 mm1 for WS and 6.78 kg ha1 mm1 for SMDI (Figure 10). Despite requiring more water, the WS 10% method generally achieved better yields and higher WP, emphasizing the importance of minimizing water stress for better crop performance and water productivity.

4. Discussion

The SWAP model effectively simulated wheat growth and soil water balance under varying climatic conditions, with a high R2 value (>0.90) and low RMSE (17.75%), confirming its accuracy in capturing crop responses. Minor discrepancies in 2018 and 2019 were likely due to late-season rainfall affecting the growth cycle. Overall, the results validate the model’s reliability for optimizing irrigation planning and predicting wheat yield in changing climate conditions. However, the model faces challenges due to its reliance on precise, location-specific data, such as soil and weather conditions, which makes it difficult to generalize its results across different regions [40,43]. The model’s tendency to slightly overestimate yields is due to the assumption of optimal conditions and omission of real-world limitations like pest pressure or management variability. Coupling SWAP with specialized modules addressing nutrient limitations, pests, or disease pressures could improve prediction accuracy. Nonetheless, the model remains a robust tool for capturing yield trends and supporting efficient irrigation scheduling.
This study investigates the impact of climate change on wheat production in Algeria’s semi-arid plains from 2014 to 2024, highlighting the challenges posed by rising temperatures and fluctuating rainfall patterns. The findings show a strong correlation (0.71) between rainfall variability and wheat yield, with drought years like 2021 and 2023 causing crop failure, while higher rainfall in 2018 led to improved yields. Warming temperatures accelerated crop growth and shortened the grain-filling period, highlighting the need for supplemental irrigation to stabilize yields and mitigate climate-related risks [92]. The findings support previous research that rainfed wheat production is vulnerable to climate variability, stressing the importance of transitioning to irrigated agriculture in water-scarce regions to ensure stable and higher crop yields [93,94].
The SMDI and CWSI irrigation strategies significantly outperformed rainfed farming, showing marked yield improvements, especially during extreme weather events. This shows that advanced irrigation tools like the SWAP model and drought-based indices are essential for improving wheat resilience in semi-arid regions like Algeria [95,96]. In 2024, irrigated yields exceeded 6000 kg ha1, compared to just 1000 kg ha1 for rainfed crops, emphasizing irrigation’s critical role in mitigating crop failure risks [97].
The CWSI strategy consistently yielded higher yields than the SMDI method due to its fixed approach, which ensures crops receive sufficient water for optimal growth. In contrast, the SMDI method, which adapts to real-time soil moisture deficits, proved more water-efficient but yielded lower results in extreme drought years like 2023; this discrepancy is likely due to water limitations imposed by the SMDI approach, which does not always guarantee optimal yields while enhancing water use efficiency, particularly during severe droughts [98,99]. Both strategies were most effective with a 9-day irrigation interval, which balanced water stress and irrigation needs, proving more efficient than shorter or longer intervals and highlighting the importance of irrigation frequency in improving crop production [100,101]. However, this interval may need to be reconsidered under exceptional conditions, such as severe water scarcity or prolonged droughts. In extreme cases, adaptive irrigation scheduling based on real-time soil moisture and crop stress indicators could enhance resilience.

5. Conclusions

This study highlights the significant impact of climate change on wheat production in Algeria’s semi-arid regions, revealing how fluctuating rainfall and rising temperatures affect yields. The SWAP model, alongside the Soil Moisture Deficit Index (SMDI) and Crop Water Stress Index (CWSI), has proven effective in optimizing irrigation strategies and improving water productivity. Both the SMDI and CWSI strategies outperformed rainfed agriculture, with the CWSI with WS 10% strategy consistently yielding higher results, especially during droughts. While SMDI improved water use efficiency, it did not always match the yield performance of CWSI. The study emphasizes the critical role of efficient irrigation in stabilizing wheat production under variable climate conditions. It underscores the importance of transitioning from rainfed to irrigated agriculture in water-scarce regions. Integrating data-driven irrigation methods like SMDI and CWSI can enhance resilience, sustainability, and productivity in wheat farming, mitigating climate-related risks.
This research contributes to the growing body of knowledge on climate adaptation strategies in agriculture and provides valuable insights for policymakers and farmers in semi-arid regions of Algeria’s interior plain. It advocates for continued refinement of irrigation systems and models to address the challenges of climate change. Future studies should further optimize these strategies and integrate advanced technologies such as remote sensing and machine learning to enhance water management and ensure long-term agricultural sustainability.

Author Contributions

Conceptualization, Y.O., F.H., M.J.A. and K.-S.C.; methodology, Y.O. and M.J.A.; software, Y.O.; formal analysis, Y.O.; investigation, Y.O. and F.H.; resources, K.-S.C.; data curation, Y.O. and F.H.; writing—original draft preparation, Y.O.; writing—review and editing, Y.O., F.H., M.J.A. and K.-S.C.; visualization, F.H., M.J.A. and K.-S.C.; supervision, K.-S.C. All authors have read and agreed to the published version of the manuscript.

Funding

This research received no external funding.

Data Availability Statement

The data used to support the findings of this study are available for the corresponding authors upon request.

Acknowledgments

Gratitude is extended to the Korea International Cooperation Agency (KOICA) Scholarship Program and the Institute of International Research and Development at Kyungpook National University for their exceptional support in cultivating global leaders. Their invaluable guidance has significantly contributed to our academic development.

Conflicts of Interest

The authors declare no conflicts of interest.

References

  1. Voučko, B.; Bartkiene, E.; Rakszegi, M.; Rocha, J.M.F. Wheat: From nutrition to cultivation and technology. Front. Nutr. 2025, 12, 1563397. [Google Scholar] [CrossRef] [PubMed]
  2. Padhy, A.K.; Kaur, P.; Singh, S.; Kashyap, L.; Sharma, A. Colored wheat and derived products: Key to global nutritional security. Crit. Rev. Food Sci. Nutr. 2024, 64, 1894–1910. [Google Scholar] [CrossRef] [PubMed]
  3. Osei-Kusi, F.; Wu, C.S.; Akiti, S.O. Assessing the impacts of crop production on climate change: An in-depth analysis of long-term determinants and policy implications. Environ. Monit. Assess. 2024, 196, 479. [Google Scholar] [CrossRef]
  4. Shajitha, P.; Nisha, R.; Sivasamy, M.; Jayaprakash, P.; Vikas, V.; Gajalakshmi, K.; Mallick, N.; Babu, P.; Yadav, R.; Vijaishree, S. Integrating solid stem and multiple disease resistance for developing climate-resilient wheat (Triticum aestivum L.). Cereal Res. Commun. 2024, 1–13. [Google Scholar] [CrossRef]
  5. Wolfe, D.W.; DeGaetano, A.T.; Peck, G.M.; Carey, M.; Ziska, L.H.; Lea-Cox, J.; Kemanian, A.R.; Hoffmann, M.P.; Hollinger, D.Y. Unique challenges and opportunities for northeastern US crop production in a changing climate. Clim. Change 2018, 146, 231–245. [Google Scholar] [CrossRef]
  6. Sheehan, H.; Bentley, A. Changing times: Opportunities for altering winter wheat phenology. Plants People Planet 2021, 3, 113–123. [Google Scholar] [CrossRef]
  7. Baghdad, C. The Algerian agricultural sector between the question of food security and its implication in economic diversification strategy. World Food Policy 2022, 8, 263–275. [Google Scholar] [CrossRef]
  8. Lampietti, J.A.; Michaels, S.; Magnan, N.; McCalla, A.F.; Saade, M.; Khouri, N. A strategic framework for improving food security in Arab countries. Food Secur. 2011, 3, 7–22. [Google Scholar] [CrossRef]
  9. Nacef, M.; Keddaoui, A. Food security threats in Algeria and mechanisms to avoid them. Al-Riyada for Bus. Economics 2024, 10, 308–328. [Google Scholar]
  10. Sims, B.; Kienzle, J. Making mechanization accessible to smallholder farmers in sub-Saharan Africa. Environments 2016, 3, 11. [Google Scholar] [CrossRef]
  11. Baumüller, H.; Fatunbi, A.; von Braun, J. Innovations for Sustainable Food Systems in Africa. 2025. Available online: https://research4agrinnovation.org/publication/pari2014-2024/ (accessed on 18 April 2025).
  12. Falkenmark, M. Growing water scarcity in agriculture: Future challenge to global water security. Philos. Trans. R. Soc. A Math. Phys. Eng. Sci. 2013, 371, 20120410. [Google Scholar] [CrossRef] [PubMed]
  13. Kherbache, N. Water policy in Algeria: Limits of supply model and perspectives of water demand management (WDM). Desalination Water Treat. 2020, 180, 141–155. [Google Scholar] [CrossRef]
  14. Mokhtari, S.; Benmehaia, A.M.; Nourani, A.; Hadjeb, A. Future water requirements of the wheat crop in Northern Algeria under climate change scenarios. Reg. Environ. Change 2025, 25, 51. [Google Scholar] [CrossRef]
  15. Abioye, E.A.; Abidin, M.S.Z.; Mahmud, M.S.A.; Buyamin, S.; Ishak, M.H.I.; Abd Rahman, M.K.I.; Otuoze, A.O.; Onotu, P.; Ramli, M.S.A. A review on monitoring and advanced control strategies for precision irrigation. Comput. Electron. Agric. 2020, 173, 105441. [Google Scholar] [CrossRef]
  16. Nikolaou, G.; Neocleous, D.; Christou, A.; Kitta, E.; Katsoulas, N. Implementing sustainable irrigation in water-scarce regions under the impact of climate change. Agronomy 2020, 10, 1120. [Google Scholar] [CrossRef]
  17. Alvino, A.; Marino, S. Remote sensing for irrigation of horticultural crops. Horticulturae 2017, 3, 40. [Google Scholar] [CrossRef]
  18. Kourat, T.; Smadhi, D.; Madani, A. Modeling the impact of future climate change impacts on rainfed durum wheat production in Algeria. Climate 2022, 10, 50. [Google Scholar] [CrossRef]
  19. Chourghal, N.; Lhomme, J.P.; Huard, F.; Aidaoui, A. Climate change in Algeria and its impact on durum wheat. Reg. Environ. Change 2016, 16, 1623–1634. [Google Scholar] [CrossRef]
  20. Touchan, R.; Kherchouche, D.; Oudjehih, B.; Touchan, H.; Slimani, S.; Meko, D.M. Dendroclimatology and wheat production in Algeria. J. Arid Environ. 2016, 124, 102–110. [Google Scholar] [CrossRef]
  21. Ma, Y.; Feng, S.; Song, X. Evaluation of optimal irrigation scheduling and groundwater recharge at representative sites in the North China Plain with SWAP model and field experiments. Comput. Electron. Agric. 2015, 116, 125–136. [Google Scholar] [CrossRef]
  22. Lee, T.; Jang, W.S.; Chun, B.; Ahmad, M.J.; Jung, Y.; Kim, J.; Shin, Y. Development of irrigation schedule and management model for sustaining optimal crop production under agricultural drought. Paddy Water Environ. 2023, 21, 31–45. [Google Scholar] [CrossRef]
  23. Kroes, J.; Wesseling, J.; Van Dam, J. Integrated modelling of the soil–water–atmosphere–plant system using the model SWAP 2· 0 an overview of theory and an application. Hydrol. Process. 2000, 14, 1993–2002. [Google Scholar] [CrossRef]
  24. Abhishek, A.; Das, N.N.; Ines, A.V.; Andreadis, K.M.; Jayasinghe, S.; Granger, S.; Ellenburg, W.L.; Dutta, R.; Quyen, N.H.; Markert, A.M. Evaluating the impacts of drought on rice productivity over Cambodia in the Lower Mekong Basin. J. Hydrol. 2021, 599, 126291. [Google Scholar] [CrossRef]
  25. Copley, M.; Wiedemann, S. Corrigendum to: Environmental impacts of the Australian poultry industry. 1. Chicken meat production. Anim. Prod. Sci. 2023, 63, 522. [Google Scholar] [CrossRef]
  26. Smith, R.; Baillie, J.; McCarthy, A.; Raine, S.; Baillie, C. Review of precision irrigation technologies and their application. Natl. Cent. Eng. Agric. Publ. 2010, 1003017/1. USQ, Toowoomba. [Google Scholar]
  27. Heinen, M.; Mulder, M.; van Dam, J.; Bartholomeus, R.; van Lier, Q.d.J.; de Wit, J.; de Wit, A.; Hack-ten Broeke, M. SWAP 50 years: Advances in modelling soil-water-atmosphere-plant interactions. Agric. Water Manag. 2024, 298, 108883. [Google Scholar] [CrossRef]
  28. Bachir, H.; Semar, A.; Mazari, A. Statistical and geostatistical analysis related to geographical parameters for spatial and temporal representation of rainfall in semi-arid environments: The case of Algeria. Arab. J. Geosci. 2016, 9, 486. [Google Scholar] [CrossRef]
  29. Nelson, H.D. Algeria, a Country Study; [Department of Defense], Department of the Army: Washington, DC, USA, 1979; Volume 44.
  30. Climatestotravel. Climate in Algeria. Available online: https://www.climatestotravel.com/climate/algeria (accessed on 27 February 2025).
  31. Zhang, Y.; Schaap, M.G. Weighted recalibration of the Rosetta pedotransfer model with improved estimates of hydraulic parameter distributions and summary statistics (Rosetta3). J. Hydrol. 2017, 547, 39–53. [Google Scholar] [CrossRef]
  32. Rubio, C.M. Applicability of site-specific pedotransfer functions and rosetta model for the estimation of dynamic soil hydraulic properties under different vegetation covers. J. Soils Sediments 2008, 8, 137–145. [Google Scholar] [CrossRef]
  33. van Dam, J.C.; Groenendijk, P.; Hendriks, R.F.; Kroes, J.G. Advances of modeling water flow in variably saturated soils with SWAP. Vadose Zone J. 2008, 7, 640–653. [Google Scholar] [CrossRef]
  34. Feddes, R. 4.3 Simulation of Field Water Use and Crop Yield. 1978. Available online: https://edepot.wur.nl/172222 (accessed on 18 April 2025).
  35. Van Genuchten, M.T. A closed-form equation for predicting the hydraulic conductivity of unsaturated soils. Soil Sci. Soc. Am. J. 1980, 44, 892–898. [Google Scholar] [CrossRef]
  36. Mualem, Y. A new model for predicting the hydraulic conductivity of unsaturated porous media. Water Resour. Res. 1976, 12, 513–522. [Google Scholar] [CrossRef]
  37. Kroes, J.; Van Dam, J.; Bartholomeus, R.; Groenendijk, P.; Heinen, M.; Hendriks, R.; Mulder, H.; Supit, I.; Van Walsum, P. SWAP version 4; Wageningen Environmental Research: Wageningen, The Netherlands, 2017. [Google Scholar]
  38. Zhao, Y.; Mao, X.; Shukla, M.K.; Li, S. Modeling soil water–heat dynamic changes in seed-maize fields under film mulching and deficit irrigation conditions. Water 2020, 12, 1330. [Google Scholar] [CrossRef]
  39. Noory, H.; Van Der Zee, S.; Liaghat, A.-M.; Parsinejad, M.; Van Dam, J. Distributed agro-hydrological modeling with SWAP to improve water and salt management of the Voshmgir Irrigation and Drainage Network in Northern Iran. Agric. Water Manag. 2011, 98, 1062–1070. [Google Scholar] [CrossRef]
  40. Kephe, P.N.; Ayisi, K.K.; Petja, B.M. Challenges and opportunities in crop simulation modelling under seasonal and projected climate change scenarios for crop production in South Africa. Agric. Food Secur. 2021, 10, 10. [Google Scholar] [CrossRef]
  41. Pan, Y.; Yuan, C.; Jing, S. Simulation and optimization of irrigation schedule for summer maize based on SWAP model in saline region. Int. J. Agric. Biol. Eng. 2020, 13, 117–122. [Google Scholar] [CrossRef]
  42. van Lier, Q.d.J.; Wendroth, O.; van Dam, J.C. Prediction of winter wheat yield with the SWAP model using pedotransfer functions: An evaluation of sensitivity, parameterization and prediction accuracy. Agric. Water Manag. 2015, 154, 29–42. [Google Scholar] [CrossRef]
  43. Huang, J.; Ma, H.; Su, W.; Zhang, X.; Huang, Y.; Fan, J.; Wu, W. Jointly assimilating MODIS LAI and ET products into the SWAP model for winter wheat yield estimation. IEEE J. Sel. Top. Appl. Earth Obs. Remote Sens. 2015, 8, 4060–4071. [Google Scholar] [CrossRef]
  44. Daggupati, P.; Pai, N.; Ale, S.; Douglas-Mankin, K.R.; Zeckoski, R.W.; Jeong, J.; Parajuli, P.B.; Saraswat, D.; Youssef, M.A. A recommended calibration and validation strategy for hydrologic and water quality models. Trans. ASABE 2015, 58, 1705–1719. [Google Scholar] [CrossRef]
  45. Hunt, L.; Boote, K. Data for model operation, calibration, and evaluation. In Understanding Options for Agricultural Production; Springer: Berlin/Heidelberg, Germany, 1998; pp. 9–39. [Google Scholar] [CrossRef]
  46. PS, M.G. Performance evaluation of best feature subsets for crop yield prediction using machine learning algorithms. Appl. Artif. Intell. 2019, 33, 621–642. [Google Scholar] [CrossRef]
  47. Ulfa, F.; Orton, T.G.; Dang, Y.P.; Menzies, N.W. Developing and testing remote-sensing indices to represent within-field variation of wheat yields: Assessment of the variation explained by simple models. Agronomy 2022, 12, 384. [Google Scholar] [CrossRef]
  48. Boons-Prins, E.; De Koning, G.; Van Diepen, C. Crop-Specific Simulation Parameters for Yield Forecasting Across the European Community; CABO: Wageningen, Netherlands, 1993. [Google Scholar]
  49. Huang, X.; Liao, W.; Lei, X.; Jia, Y.; Wang, Y.; Wang, X.; Jiang, Y.; Wang, H. Parameter optimization of distributed hydrological model with a modified dynamically dimensioned search algorithm. Environ. Model. Softw. 2014, 52, 98–110. [Google Scholar] [CrossRef]
  50. Morris, M.D. Factorial sampling plans for preliminary computational experiments. Technometrics 1991, 33, 161–174. [Google Scholar] [CrossRef]
  51. Xue, J.; Ren, L. Evaluation of crop water productivity under sprinkler irrigation regime using a distributed agro-hydrological model in an irrigation district of China. Agric. Water Manag. 2016, 178, 350–365. [Google Scholar] [CrossRef]
  52. Shafiei, M.; Ghahraman, B.; Saghafian, B.; Davary, K.; Pande, S.; Vazifedoust, M. Uncertainty assessment of the agro-hydrological SWAP model application at field scale: A case study in a dry region. Agric. Water Manag. 2014, 146, 324–334. [Google Scholar] [CrossRef]
  53. Nasta, P.; Romano, N. Use of a flux-based field capacity criterion to identify effective hydraulic parameters of layered soil profiles subjected to synthetic drainage experiments. Water Resour. Res. 2016, 52, 566–584. [Google Scholar] [CrossRef]
  54. Jin, J.; Ding, Y.; Sun, B.; Li, S.; Guo, Z.; Zhu, L. Simulating the exploration of the optimal irrigation of spring wheat in drought areas based on SWAP model. Irrig. Drain. 2024; early view. [Google Scholar] [CrossRef]
  55. Vazifedoust, M.; Van Dam, J.; Feddes, R.A.; Feizi, M. Increasing water productivity of irrigated crops under limited water supply at field scale. Agric. Water Manag. 2008, 95, 89–102. [Google Scholar] [CrossRef]
  56. Verma, A.; Gupta, S.; Isaac, R. Use of saline water for irrigation in monsoon climate and deep water table regions: Simulation modeling with SWAP. Agric. Water Manag. 2012, 115, 186–193. [Google Scholar] [CrossRef]
  57. Li, P.; Ren, L. Evaluating the effects of limited irrigation on crop water productivity and reducing deep groundwater exploitation in the North China Plain using an agro-hydrological model: I. Parameter sensitivity analysis, calibration and model validation. J. Hydrol. 2019, 574, 497–516. [Google Scholar] [CrossRef]
  58. Xu, X.; Huang, G.; Sun, C.; Pereira, L.S.; Ramos, T.B.; Huang, Q.; Hao, Y. Assessing the effects of water table depth on water use, soil salinity and wheat yield: Searching for a target depth for irrigated areas in the upper Yellow River basin. Agric. Water Manag. 2013, 125, 46–60. [Google Scholar] [CrossRef]
  59. Van Campenhout, J.; Houbrechts, G.; Peeters, A.; Petit, F. Return period of characteristic discharges from the comparison between partial duration and annual series, application to the Walloon Rivers (Belgium). Water 2020, 12, 792. [Google Scholar] [CrossRef]
  60. Zhang, Q. Analysis of coupling degree between crop water requirement of aerobic rice and rainfall in Beijing areas. T CSAE 2007, 23, 51–56. [Google Scholar]
  61. Zhao, Y.; Xiao, D.; Qi, Y.; Bai, H. Crop yield and water consumption of different cropping patterns under different precipitation years in North China Plain. Nongye Gongcheng Xuebao 2018, 34, 108–116. [Google Scholar] [CrossRef]
  62. Chow, V. Applied Hydrology; McGraw-Hill: New York, NY, USA, 1971. [Google Scholar]
  63. Zhang, B.; Feng, G.; Read, J.J.; Kong, X.; Ouyang, Y.; Adeli, A.; Jenkins, J.N. Simulating soybean productivity under rainfed conditions for major soil types using APEX model in East Central Mississippi. Agric. Water Manag. 2016, 177, 379–391. [Google Scholar] [CrossRef]
  64. Narasimhan, B.; Srinivasan, R. Development and evaluation of Soil Moisture Deficit Index (SMDI) and Evapotranspiration Deficit Index (ETDI) for agricultural drought monitoring. Agric. For. Meteorol. 2005, 133, 69–88. [Google Scholar] [CrossRef]
  65. Watson, A.; Miller, J.; Künne, A.; Kralisch, S. Using soil-moisture drought indices to evaluate key indicators of agricultural drought in semi-arid Mediterranean Southern Africa. Sci. Total Environ. 2022, 812, 152464. [Google Scholar] [CrossRef]
  66. Fang, B.; Kansara, P.; Dandridge, C.; Lakshmi, V. Drought monitoring using high spatial resolution soil moisture data over Australia in 2015–2019. J. Hydrol. 2021, 594, 125960. [Google Scholar] [CrossRef]
  67. Ma, Z.-C.; Sun, P.; Zhang, Q.; Hu, Y.-Q.; Jiang, W. Characterization and evaluation of MODIS-derived crop water stress index (CWSI) for monitoring drought from 2001 to 2017 over Inner Mongolia. Sustainability 2021, 13, 916. [Google Scholar] [CrossRef]
  68. Kamali, B.; Abbaspour, K.; Lehmann, A.; Wehrli, B.; Yang, H. Identification of spatiotemporal patterns of biophysical droughts in semi-arid region–a case study of the Karkheh river basin in Iran. Hydrol. Earth Syst. Sci. Discuss. 2015, 12, 5187–5217. [Google Scholar] [CrossRef]
  69. Yang, H.; Wang, H.; Fu, G.; Yan, H.; Zhao, P.; Ma, M. A modified soil water deficit index (MSWDI) for agricultural drought monitoring: Case study of Songnen Plain, China. Agric. Water Manag. 2017, 194, 125–138. [Google Scholar] [CrossRef]
  70. Yirdaw, S.Z.; Snelgrove, K.R.; Agboma, C.O. GRACE satellite observations of terrestrial moisture changes for drought characterization in the Canadian Prairie. J. Hydrol. 2008, 356, 84–92. [Google Scholar] [CrossRef]
  71. Kamber, G.; McDonald, C.; Price, G. Drying Out: Investigating the Economic Effects of Drought in New Zealand; Reserve Bank of New Zealand Wellington: Wellington, New Zealand, 2013.
  72. Houcine, A.; Bargaoui, Z. Comparison of rainfall based SPI drought indices with SMDI and ETDI indices derived from a soil water budget model. In Proceedings of the EGU General Assembly Conference Abstracts, Vienna, Austria, 22–27 April 2012; p. 2666. [Google Scholar]
  73. Yao, N.; Li, Y.; Liu, Q.; Zhang, S.; Chen, X.; Ji, Y.; Liu, F.; Pulatov, A.; Feng, P. Response of wheat and maize growth-yields to meteorological and agricultural droughts based on standardized precipitation evapotranspiration indexes and soil moisture deficit indexes. Agric. Water Manag. 2022, 266, 107566. [Google Scholar] [CrossRef]
  74. Crescimanno, G.; Morga, F.; Ventrella, D. Application of the SWAP model to predict impact of climate change on soil water balance in a Sicilian vineyard. Ital. J. Agron. 2012, 7, e17. [Google Scholar] [CrossRef]
  75. Bonfante, A.; Alfieri, S.; Albrizio, R.; Basile, A.; De Mascellis, R.; Gambuti, A.; Giorio, P.; Langella, G.; Manna, P.; Monaco, E. Evaluation of the effects of future climate change on grape quality through a physically based model application: A case study for the Aglianico grapevine in Campania region, Italy. Agric. Syst. 2017, 152, 100–109. [Google Scholar] [CrossRef]
  76. Attia, A.; Rajan, N.; Xue, Q.; Nair, S.; Ibrahim, A.; Hays, D. Application of DSSAT-CERES-Wheat model to simulate winter wheat response to irrigation management in the Texas High Plains. Agric. Water Manag. 2016, 165, 50–60. [Google Scholar] [CrossRef]
  77. Sun, H.; Zhang, X.; Wang, E.; Chen, S.; Shao, L. Quantifying the impact of irrigation on groundwater reserve and crop production–a case study in the North China Plain. Eur. J. Agron. 2015, 70, 48–56. [Google Scholar] [CrossRef]
  78. Yang, X.; Wang, G.; Chen, Y.; Sui, P.; Pacenka, S.; Steenhuis, T.S.; Siddique, K.H. Reduced groundwater use and increased grain production by optimized irrigation scheduling in winter wheat–summer maize double cropping system—A 16-year field study in North China Plain. Field Crops Res. 2022, 275, 108364. [Google Scholar] [CrossRef]
  79. Kumar, P.; Sarangi, A.; Singh, D.; Parihar, S.; Sahoo, R. Simulation of salt dynamics in the root zone and yield of wheat crop under irrigated saline regimes using SWAP model. Agric. Water Manag. 2015, 148, 72–83. [Google Scholar] [CrossRef]
  80. Wang, B.; van Dam, J.; Yang, X.; Ritsema, C.; Du, T.; Kang, S. Reducing water productivity gap by optimizing irrigation regime for winter wheat-summer maize system in the North China Plain. Agric. Water Manag. 2023, 280, 108229. [Google Scholar] [CrossRef]
  81. Babaei, M.; Biglouei, M.; Pirmoradian, N.; Mohammadi, A. Optimizing agricultural water use through simulation of soil water content and water uptake under soil moisture and irrigation water salinity stresses: Case study of corn roots using SWAP model. Environ. Resour. Res. 2021, 9, 99–106. [Google Scholar] [CrossRef]
  82. Habibi, B.; Meddi, M. Meteorological drought hazard analysis of wheat production in the semi-arid basin of Cheliff–Zahrez Nord, Algeria. Arab. J. Geosci. 2021, 14, 1045. [Google Scholar] [CrossRef]
  83. Zerouali, B.; Chettih, M.; Abda, Z.; Mesbah, M.; Djemai, M. The use of hybrid methods for change points and trends detection in rainfall series of northern Algeria. Acta Geophys. 2020, 68, 1443–1460. [Google Scholar] [CrossRef]
  84. Berhail, S.; Tourki, M.; Merrouche, I.; Bendekiche, H. Geo-statistical assessment of meteorological drought in the context of climate change: Case of the Macta basin (Northwest of Algeria). Model. Earth Syst. Environ. 2021, 8, 81–101. [Google Scholar] [CrossRef]
  85. Tadesse, W.; Bishaw, Z.; Assefa, S. Wheat production and breeding in Sub-Saharan Africa: Challenges and opportunities in the face of climate change. Int. J. Clim. Change Strateg. Manag. 2019, 11, 696–715. [Google Scholar] [CrossRef]
  86. Bouregaa, T.; Chetioui, C. Assessment of climate change impact on wheat water demand and yield in Setif, Algeria. Water Conserv. Sci. Eng. 2025, 10, 1. [Google Scholar] [CrossRef]
  87. Bruand, A.; Tessier, D. Water retention properties of the clay in soils developed on clayey sediments: Significance of parent material and soil history. Eur. J. Soil Sci. 2000, 51, 679–688. [Google Scholar] [CrossRef]
  88. Mallareddy, M.; Thirumalaikumar, R.; Balasubramanian, P.; Naseeruddin, R.; Nithya, N.; Mariadoss, A.; Eazhilkrishna, N.; Choudhary, A.K.; Deiveegan, M.; Subramanian, E. Maximizing water use efficiency in rice farming: A comprehensive review of innovative irrigation management technologies. Water 2023, 15, 1802. [Google Scholar] [CrossRef]
  89. Doeffinger, T.; Hall, J.W. Water stress and productivity: An empirical analysis of trends and drivers. Water Resour. Res. 2020, 56, e2019WR025925. [Google Scholar] [CrossRef]
  90. Ali, M.; Talukder, M. Increasing water productivity in crop production—A synthesis. Agric. Water Manag. 2008, 95, 1201–1213. [Google Scholar] [CrossRef]
  91. Wu, X.; Xu, H.; He, H.; Wu, Z.; Lu, G.; Liao, T. Agricultural Drought Monitoring Using an Enhanced Soil Water Deficit Index Derived from Remote Sensing and Model Data Merging. Remote Sens. 2024, 16, 2156. [Google Scholar] [CrossRef]
  92. Wheeler, T.; Von Braun, J. Climate change impacts on global food security. Science 2013, 341, 508–513. [Google Scholar] [CrossRef] [PubMed]
  93. Yang, C.; Fraga, H.; van Ieperen, W.; Trindade, H.; Santos, J.A. Effects of climate change and adaptation options on winter wheat yield under rainfed Mediterranean conditions in southern Portugal. Clim. Change 2019, 154, 159–178. [Google Scholar] [CrossRef]
  94. Molden, D. Water for Food Water for Life: A Comprehensive Assessment of Water Management in Agriculture; Routledge: London, UK, 2013. [Google Scholar]
  95. Bazza, M.; Kay, M.; Knutson, C. Drought Characteristics and Management in North Africa and the Near East; FAO Water Reports; FAO: Rome, Italy, 2018. [Google Scholar]
  96. Ndayiragije, J.M.; Li, F. Effectiveness of drought indices in the assessment of different types of droughts, managing and mitigating their effects. Climate 2022, 10, 125. [Google Scholar] [CrossRef]
  97. Pereira, L.S.; Oweis, T.; Zairi, A. Irrigation management under water scarcity. Agric. Water Manag. 2002, 57, 175–206. [Google Scholar] [CrossRef]
  98. Hatfield, J.L.; Dold, C. Water-use efficiency: Advances and challenges in a changing climate. Front. Plant Sci. 2019, 10, 103. [Google Scholar] [CrossRef]
  99. Fereres, E.; Soriano, M.A. Deficit irrigation for reducing agricultural water use. J. Exp. Bot. 2007, 58, 147–159. [Google Scholar] [CrossRef]
  100. Liu, H.; Li, H.; Ning, H.; Zhang, X.; Li, S.; Pang, J.; Wang, G.; Sun, J. Optimizing irrigation frequency and amount to balance yield, fruit quality and water use efficiency of greenhouse tomato. Agric. Water Manag. 2019, 226, 105787. [Google Scholar] [CrossRef]
  101. Li, M.; Zhang, X.; Chen, Y.; Xu, Y.; Li, R.; Zhao, L.; Fu, Q. Multiobjective optimization of daily scale irrigation schedules for rice in irrigation districts considering joint uncertainties in water supply and demand. Comput. Electron. Agric. 2025, 231, 110054. [Google Scholar] [CrossRef]
Figure 1. Localization of the study area.
Water 17 01658 g001
Figure 2. Flowchart of the irrigation schedule using the SWAP model.
Water 17 01658 g002
Figure 3. Performances of the SWAP model during the calibration (2014) and validation (2015–2024) periods: (a) crop yield; (b) number of days to maturity during the study period.
Water 17 01658 g003
Figure 4. Monthly precipitation (mm) and monthly averaged temperature (°C) at the study area during the growing seasons (2014–2024).
Water 17 01658 g004
Figure 5. Annual precipitation, annual precipitation during the growing seasons (mm), annual average temperature (°C), and the crop yield (Kg ha−1) at the study area between 2014 and 2024. The yield data were divided by 10 to make the plot visually compatible.
Water 17 01658 g005
Figure 6. Weekly value variation of (a) SMDI and (b) soil moisture (cm3 cm−3) based on irrigation events during the year 2017.
Water 17 01658 g006
Figure 7. Crop yield variation based on irrigation events during the year 2017.
Water 17 01658 g007
Figure 8. Daily potential transpiration (Tp) and actual transpiration (Ta) variation with the rainfed condition during the growing seasons: (a) wet year 2018 and (b) dry year 2021, at 10% WS in the study area.
Water 17 01658 g008
Figure 9. Crop yields under a rainfed, 9-day irrigation interval with WS 10% and SMDI irrigation strategies.
Water 17 01658 g009
Figure 10. Comparison of Irrigation Water Amount (IWA) and water productivity (WP) with a 9-day irrigation interval (II) under WS 10% and SMDI strategies (2014–2024).
Water 17 01658 g010
Table 1. Physical and hydraulic properties of the soil for the experimental field.
Soil TextureRosetta Output
Layers (cm)Sand (%)Silt (%)Clay (%)Bulk Density
(g cm−3)
Theta_r
θr (cm3/cm3)
Theta_s
θs (cm3/cm3)
Alpha
α (cm−1)
nKsat
(cm/day)
Lamda
λ
0–2022.4038.5339.071.370.0910.4620.0121.41211.3990.5
20–4022.3138.7538.941.420.0890.4480.0121.4078.5540.5
40–6020.6440.4138.951.470.0880.4360.0121.4026.3710.5
Average21.7839.2338.991.420.0890.4490.0121.4078.7750.5
Table 2. Default and calibrated crop parameter values for the SWAP model.
Model ParametersDescription/UnitDefault ValuesCalibrated Values
SWCFCrop height (cm)10085
TSUMEATemperature sum from emergence to anthesis (°C)1255.01350
TSUMAMTemperature sum from anthesis to maturity (°C)909.01010
DTSMDaily maximum accumulated temperature (°C)30.030.0
KDIFExtinction coefficient for diffuse visible light0.600.60
KDIRExtinction coefficient for direct visible light0.750.75
EFFLight use efficiency of a single leaf (kg/ha/hr/[Jm2s])0.450.47
CVLEfficiency of conversion into leaves (kg/kg)0.6850.580
CVOEfficiency of conversion into storage organs (kg/kg)0.7090.729
CVREfficiency of conversion into roots (kg/kg)0.6940.674
CVSEfficiency of conversion into stems (kg/kg)0.6620.632
DVSENDDevelopment stage at harvest2.002.02
COFABPrecipitation interception coefficient0.250.25
Table 3. Empirical Frequency Analysis classification (EFA) and Soil Moisture Drought Index (SMDI) during the study period 2014–2024.
YearRainfall (mm)EFA %EFA
Classification
Number of Dry Days (SMDI)Period of Drought (SMDI)Observed Rainfed Crop Yield
(kg ha−1)
201448444Normal4918 April–5 June1800
201545652Normal4218 April–29 May2000
201633868Normal9126 November–5 March and 15 May–4 June2500
201747048Normal8428 February–22 May1300
201852420Wet0/4400
201941260Normal497 March–20 March and
9 May–12 June
3700
202031276Dry10527 December–9 January and 31 January–9 April and
8 May–28 May
1800
202126988Dry13324 January–5 June0
202250528Normal4910 January–27 February3800
202329084Dry14416 December–23 January and 7 February–22 May0
202429080Dry10517 January–20 February and 6 March–14 May1000
Table 4. Water productivity variation (kg ha−1 mm−1) based on variation of irrigation interval (day) during the study period 2014–2024.
Irrigation Interval (Days)Average WP
(kg ha−1 mm−1)
Coefficient of
Variation (CV %)
2014201520162017201920202021202220232024
513.6857.317.6014.416.8729.856.997.679.599.997.1926.65
714.9750.721.9117.1810.1731.774.388.4910.3011.336.7727.39
915.6247.821.6918.788.5531.206.7810.1410.8511.618.2828.29
1015.1651.524.9616.288.9031.765.359.4010.466.179.8128.52
Table 5. Average WP (2014–2024) based on WS thresholds and different irrigation intervals during the study period.
Irrigation Interval (Days)10% WS20% WS30% WS40% WS50% WSAverage WP
(kg ha−1 mm−1)
519.3318.1717.2514.0212.5416.26
720.2219.5818.6115.6613.9617.61
920.9820.5119.5716.8616.6218.91
1021.0619.8819.9216.9216.0318.76
Average WP
(kg ha−1 mm−1)
20.4019.5318.8415.8614.7917.88
Table 6. Comparison of wheat yields and IWP with a 9-day irrigation interval under WS 10% and SMDI strategies over the study period 2014–2024.
YearsRainfed
Yield
(kg ha−1)
9-Day Irrigation Interval, WS 10%9-Day Irrigation Interval, SMDI
Number of Dry DaysIWA
(mm)
Yield
(kg ha−1)
WP
(kg ha−1 mm−1)
Number of Dry DaysIWA
(mm)
Yield
(kg ha−1)
WP
(kg ha−1 mm−1)
2014180046161.7564523.794996388221.69
2015200044167.2554521.214290369018.78
2016250039136.1524320.15918832528.55
2017130053182.9704131.3984140566831.20
201844002055.6572823.9100//
2019370042160.6725522.13495440666.78
2020180067179.7573721.90105144326010.14
2021081253.6319112.58133240260510.85
2022380023103.2516613.234972463611.61
2023075252.3296511.7514434028168.28
2024100054215.6721028.80105180609328.29
Disclaimer/Publisher’s Note: The statements, opinions and data contained in all publications are solely those of the individual author(s) and contributor(s) and not of MDPI and/or the editor(s). MDPI and/or the editor(s) disclaim responsibility for any injury to people or property resulting from any ideas, methods, instructions or products referred to in the content.

