

Understanding Unsustainable Irrigation Practices in a Regionally Contested Large River Basin in Peninsular India Through the Lens of the Water–Energy–Food–Environment (WEFE) Nexus


Abstract
1. Introduction
- Map the factors influencing groundwater and energy use in irrigated agriculture.
- Quantify the spatial distribution of the energy consumed for groundwater pumping.
- Estimate the environmental impact of irrigation-related energy use, using carbon emissions as an indicator.
2. Study Area
2.1. Cauvery River Basin
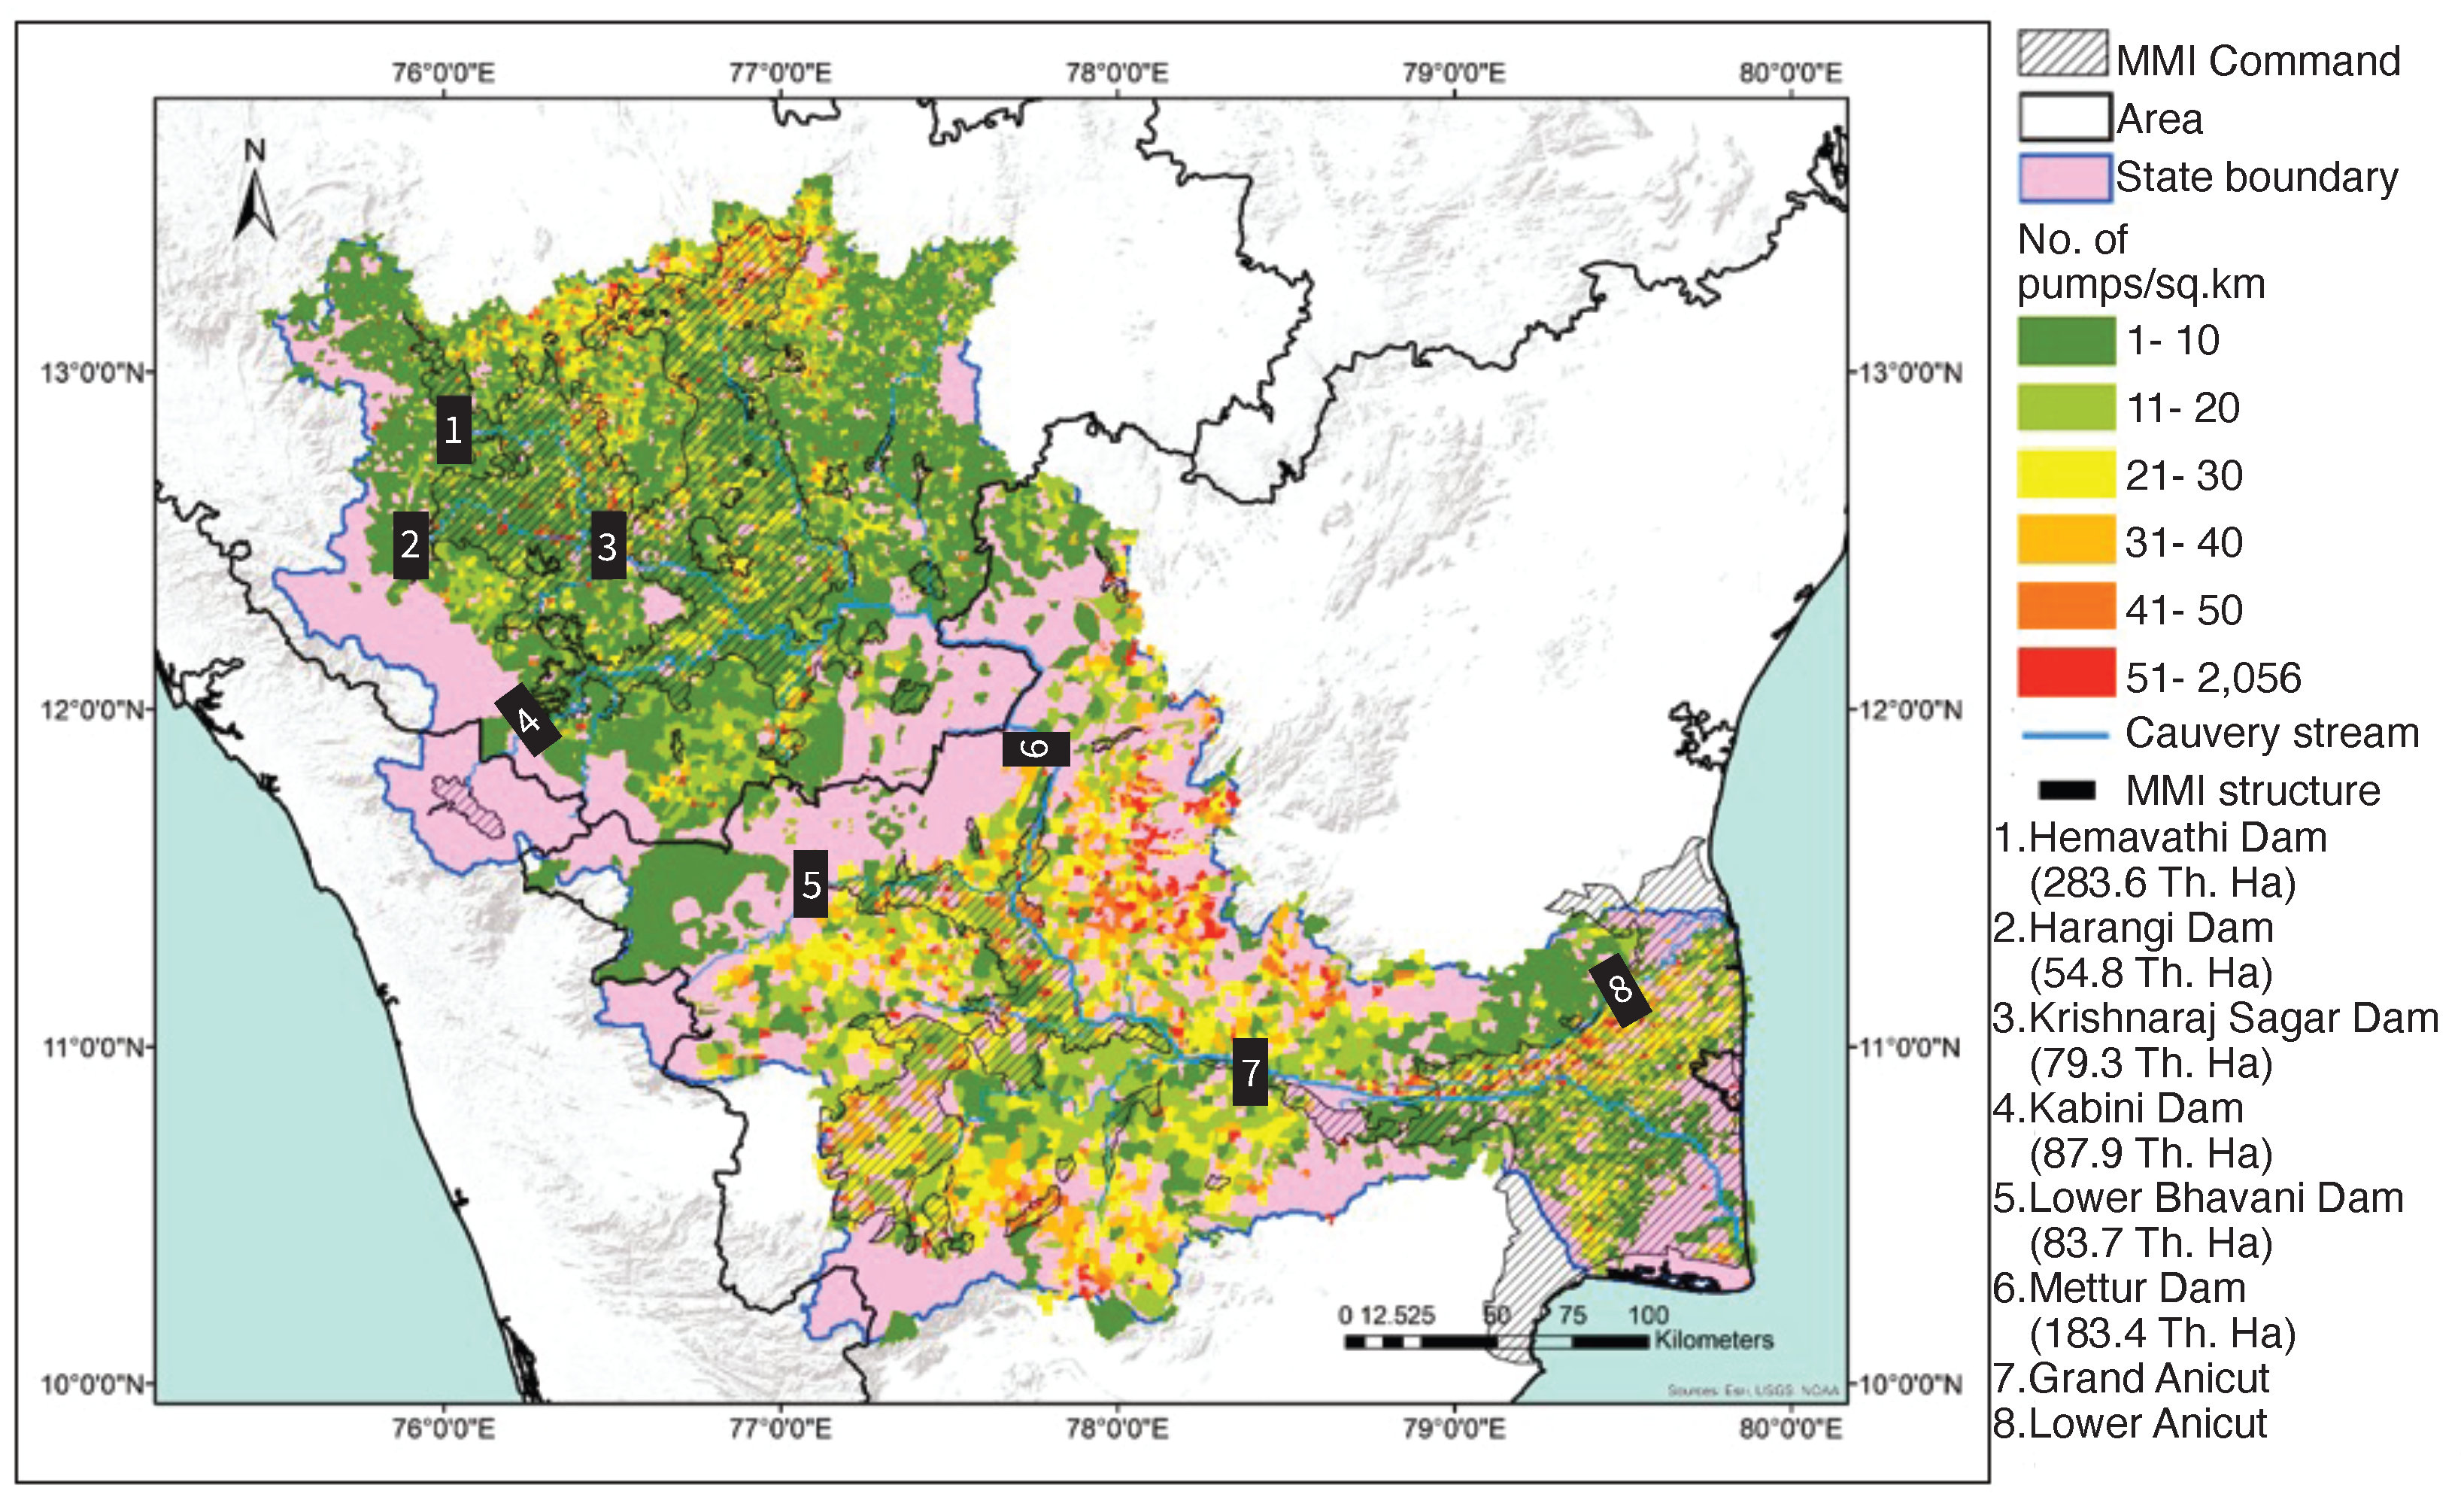
2.2. Water Resources Development
2.3. Geopolitical Context
3. Methods and Data
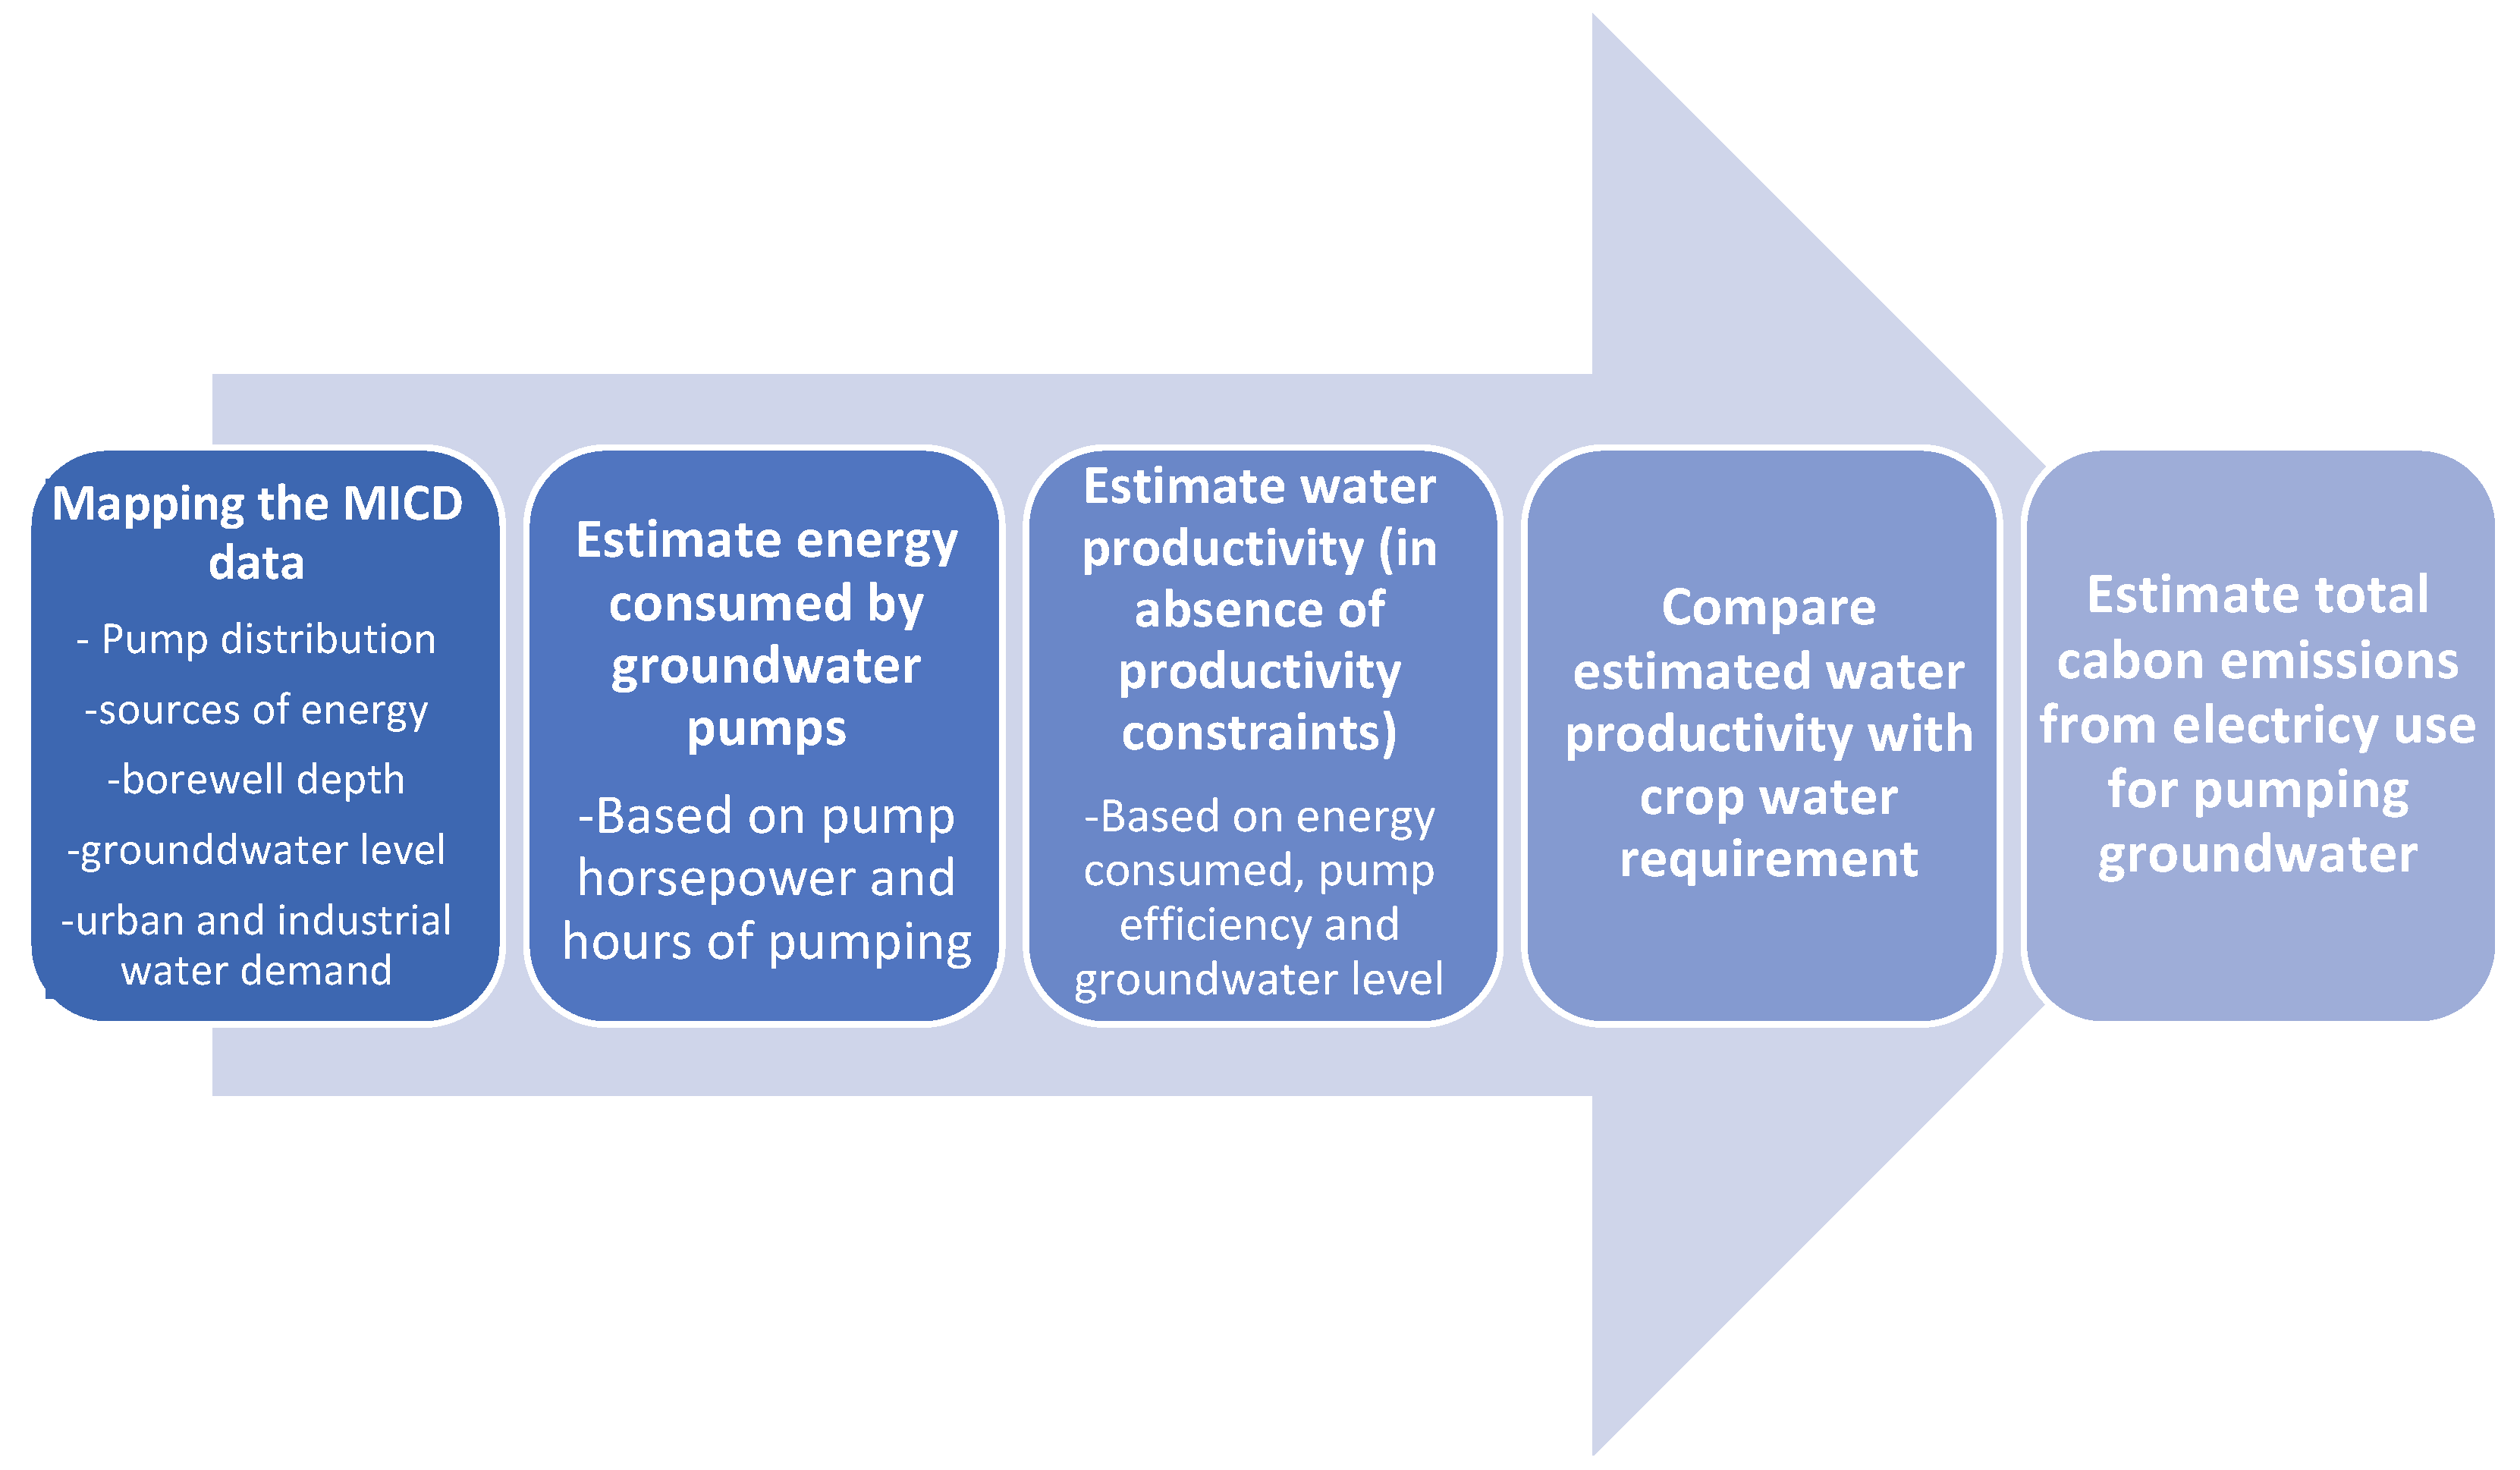
3.1. Methodology
3.2. Data
- i
- Farmer status data—We classified district-wide pumpset ownership data by farmer type according to their economic status in the agriculture census [39]. These data were aggregated for the whole basin and used to analyse the relationships between irrigation sources, access to groundwater pumping equipment, farmers’ economic status, and farm size.
- ii
- Groundwater table data—We obtained groundwater table data from the Central Groundwater Board (CGWB) portal (India-WRIS) [33] for all observation wells in basin districts from 1996 to 2016. Since the number of wells increased annually and seasonal data gaps were common, we calculated district-level averages to analyse 20-year groundwater trends. To approximate missing values, we used observations from the previous or following year for the same season.
- iii
- Rice Production data—We obtained district-scale rice production data from the National Agriculture Statistics archives [39] for the years 1997–2014 to estimate the correlation between rice production and groundwater availability.
- iv
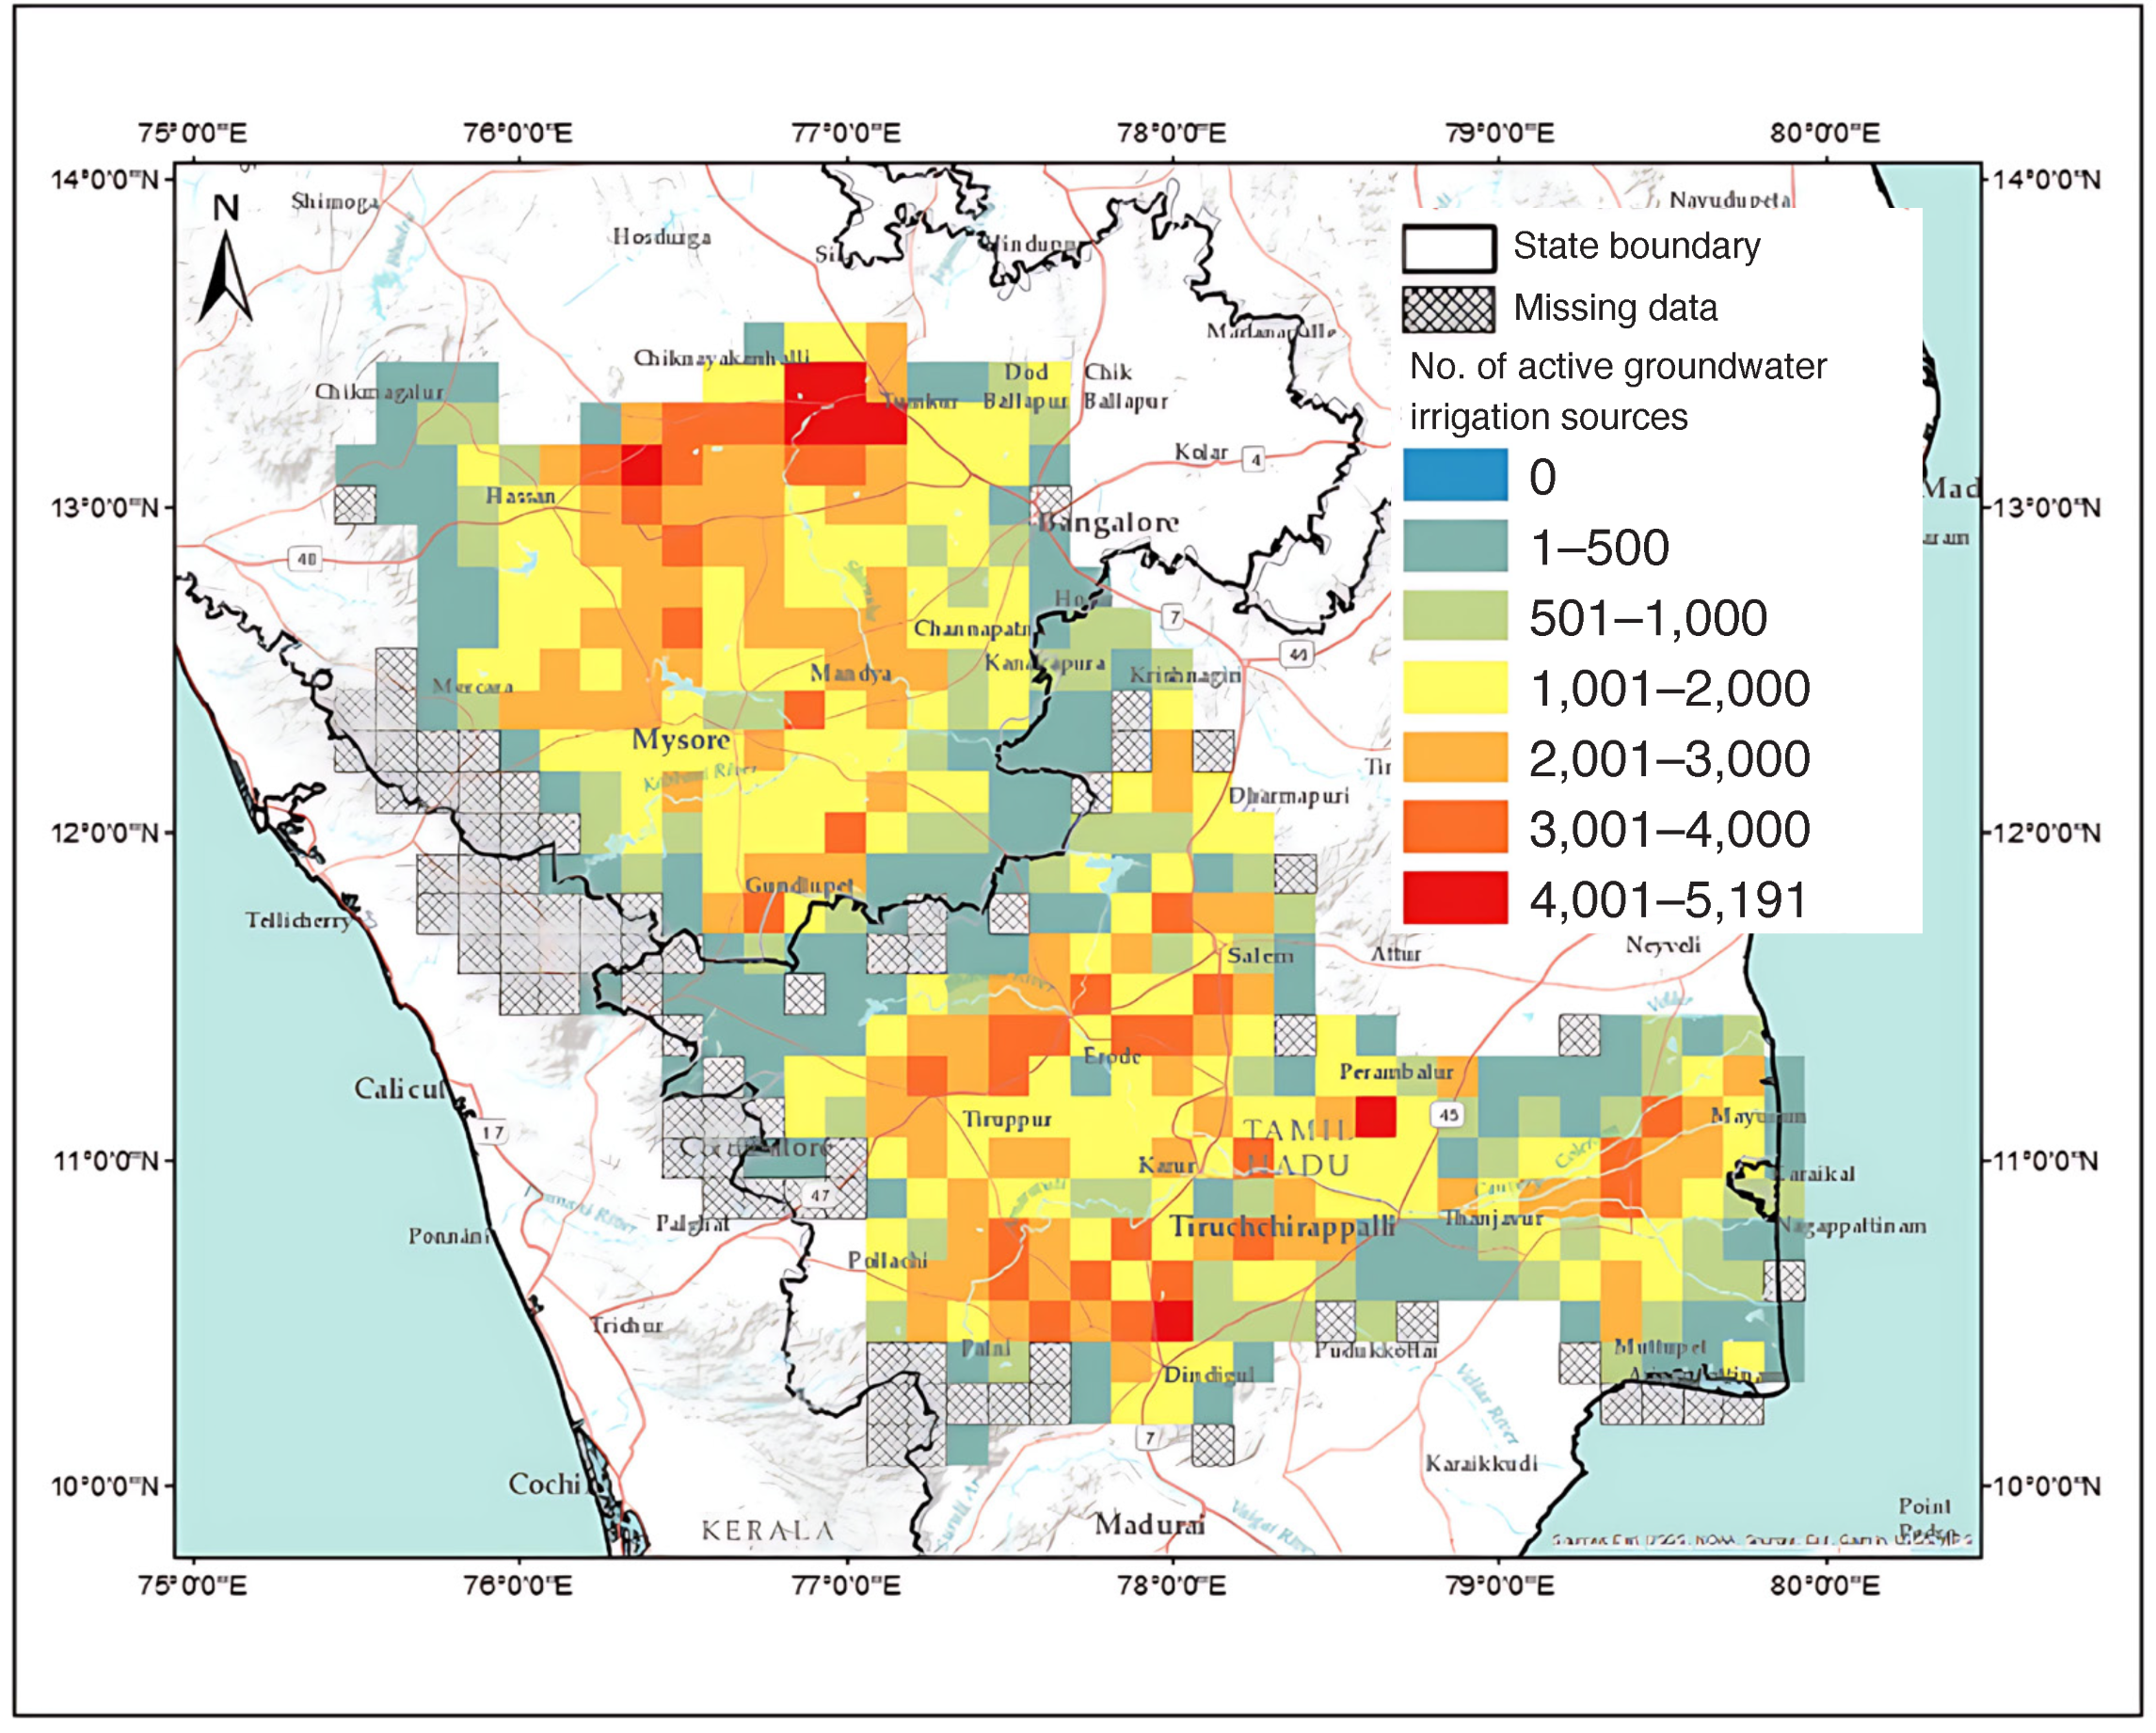
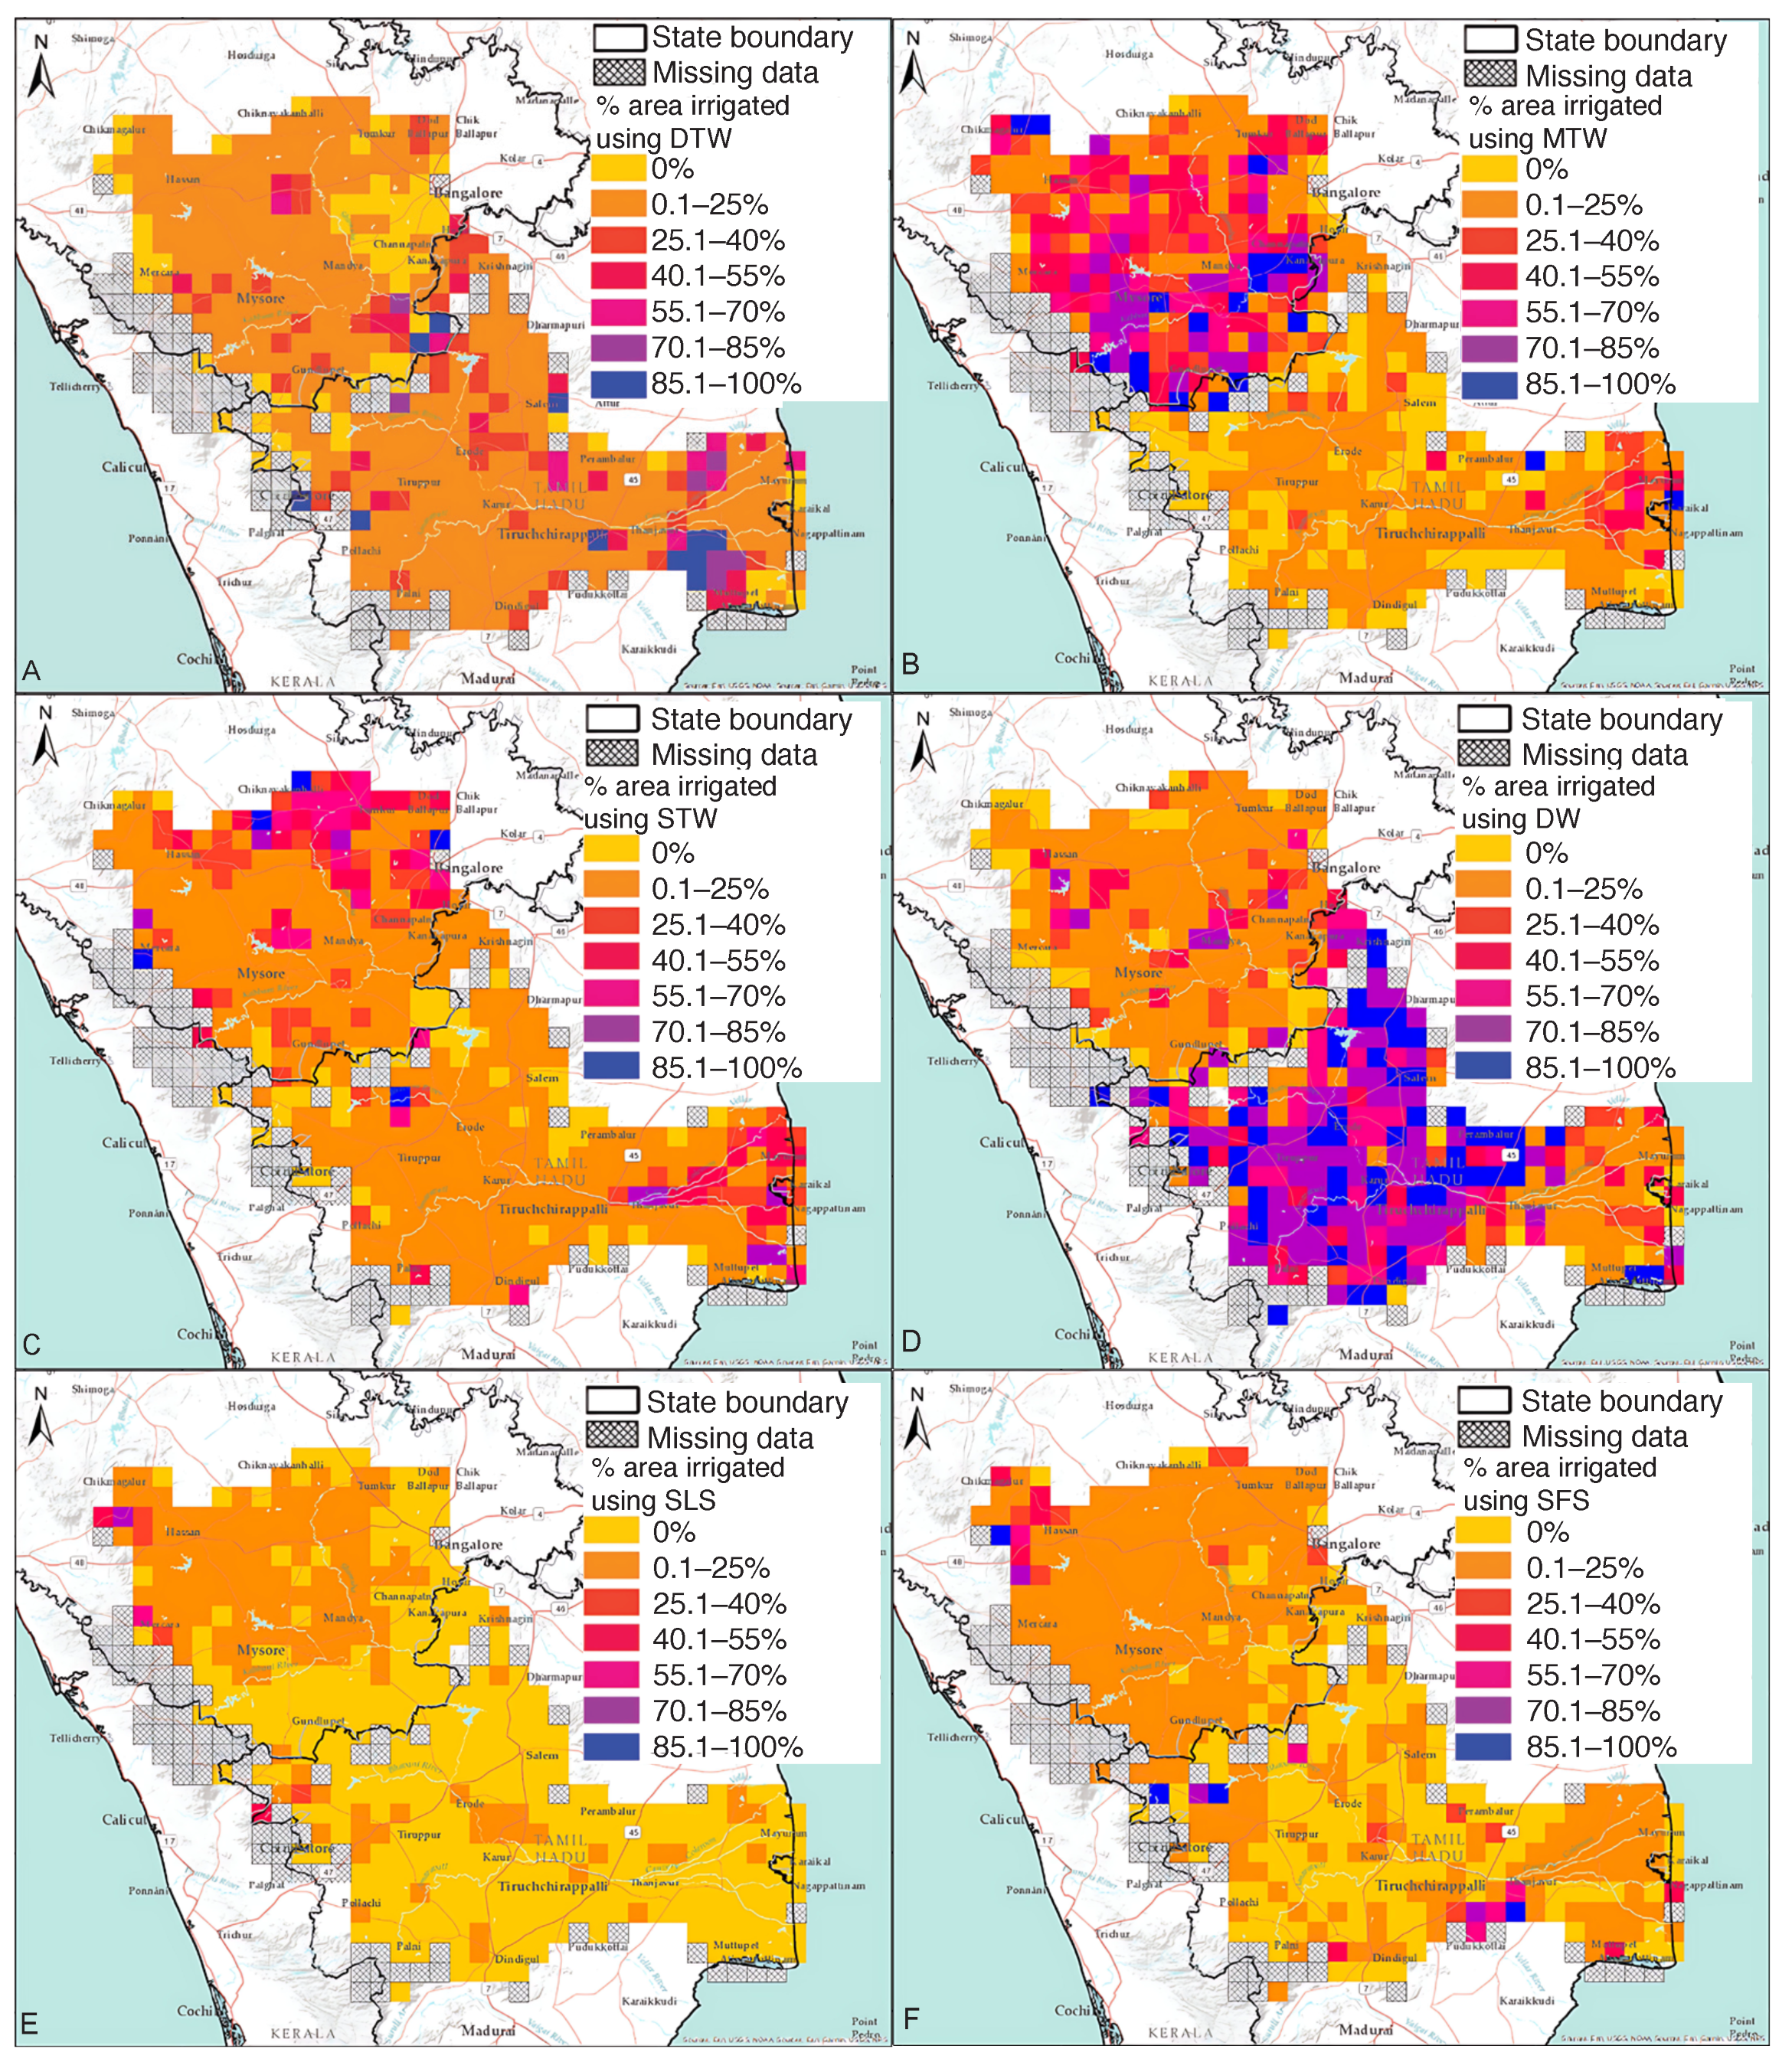
- Minor irrigation data—We obtained village-wise groundwater irrigation data for the year 2013–14 from the Minor Irrigation (MI) Census database, available through the Indian Statistical Data Dissemination Portal. This dataset included information on groundwater irrigation structures such as deep, medium and, shallow tube wells, dug wells, and minor surface water irrigation systems including surface-lift pumps and surface flow schemes. For each MI structure type, the dataset provided the number of structures, their operational status, average daily pumping hours during Rabi and Kharif seasons, the distribution of structures by pump horsepower, energy sources, and water distribution system (Table 1). The data were manually resampled for villages within the basin boundary and converted to geospatial format by joining tabular data with village shapefiles in ArcGIS 10.6 software.
- v
- Major and medium irrigation projects—We obtained data on the area of major and medium irrigation projects from India-WRIS web-map services [33]. To analyse the correlation between groundwater pumping and the availability of surface irrigation sources, we manually digitised the command areas of these projects in ArcGIS software.
3.3. Estimating Energy Consumption and Groundwater Productivity of Pumps
4. Results
4.1. Spatial Mapping of Irrigation Regimes
4.1.1. Density of Minor Irrigation Pumpsets
4.1.2. Seasonality of Pumpset Use
4.2. Drivers Influencing Water–Energy Dynamics in Irrigation Sector
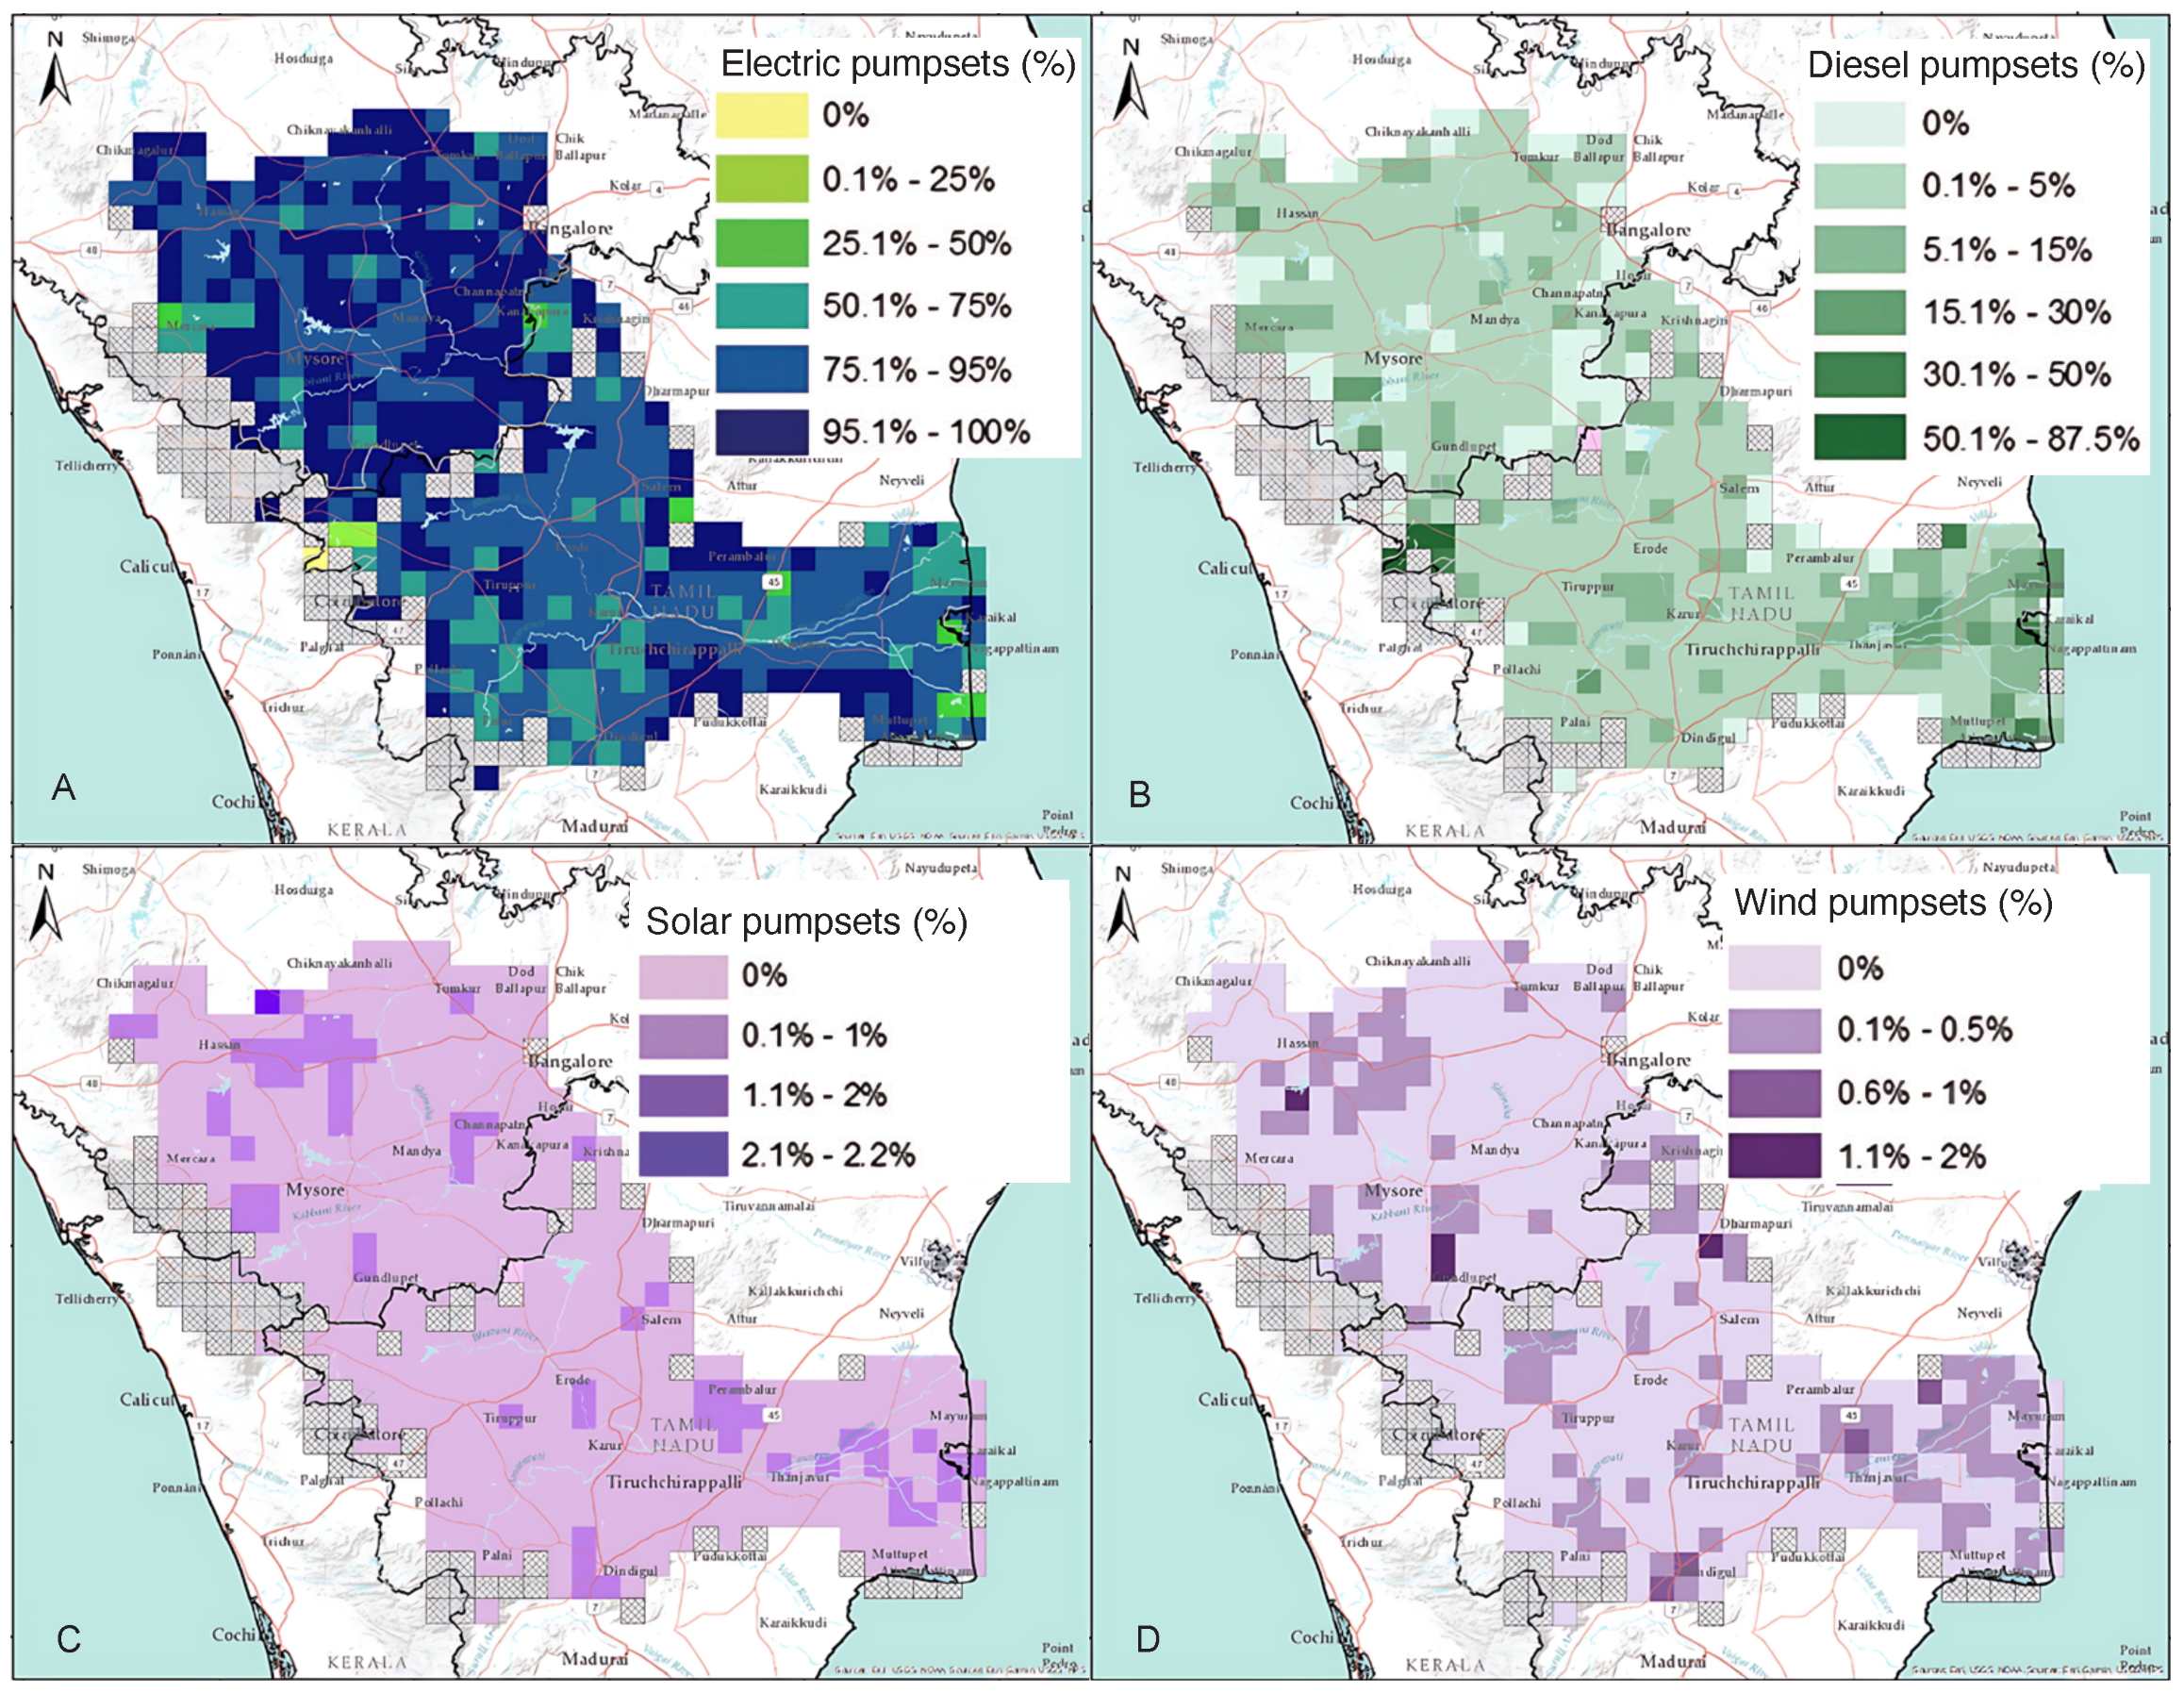
4.2.1. Sources of Energy for Irrigation Pumps
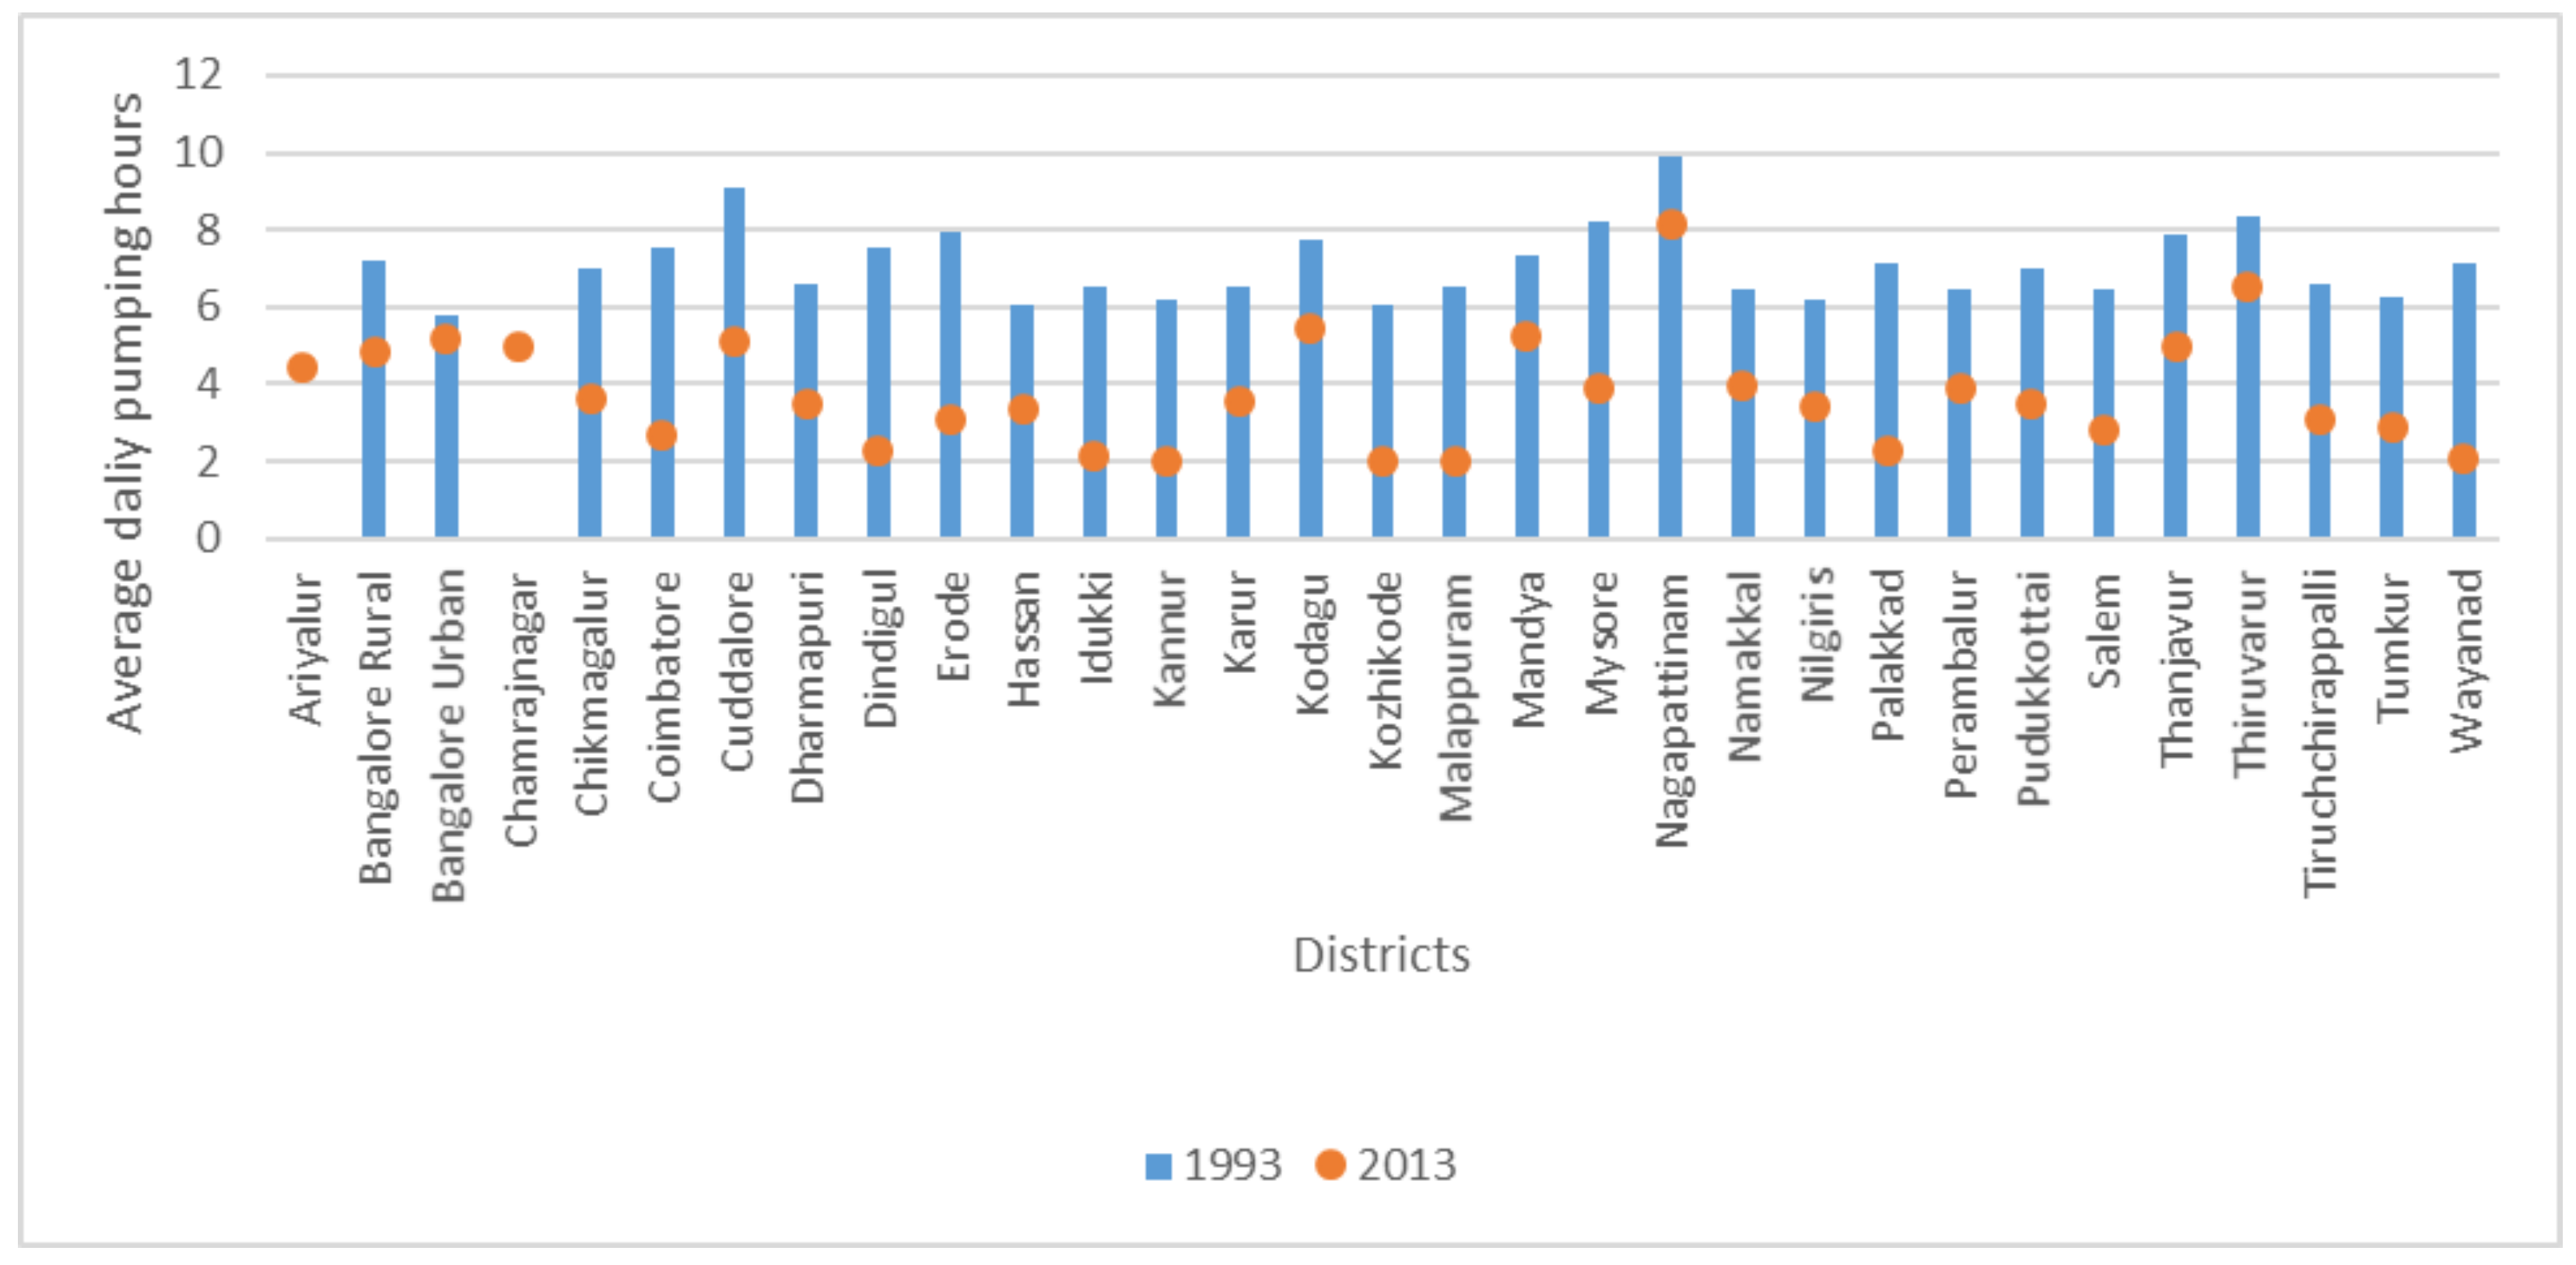
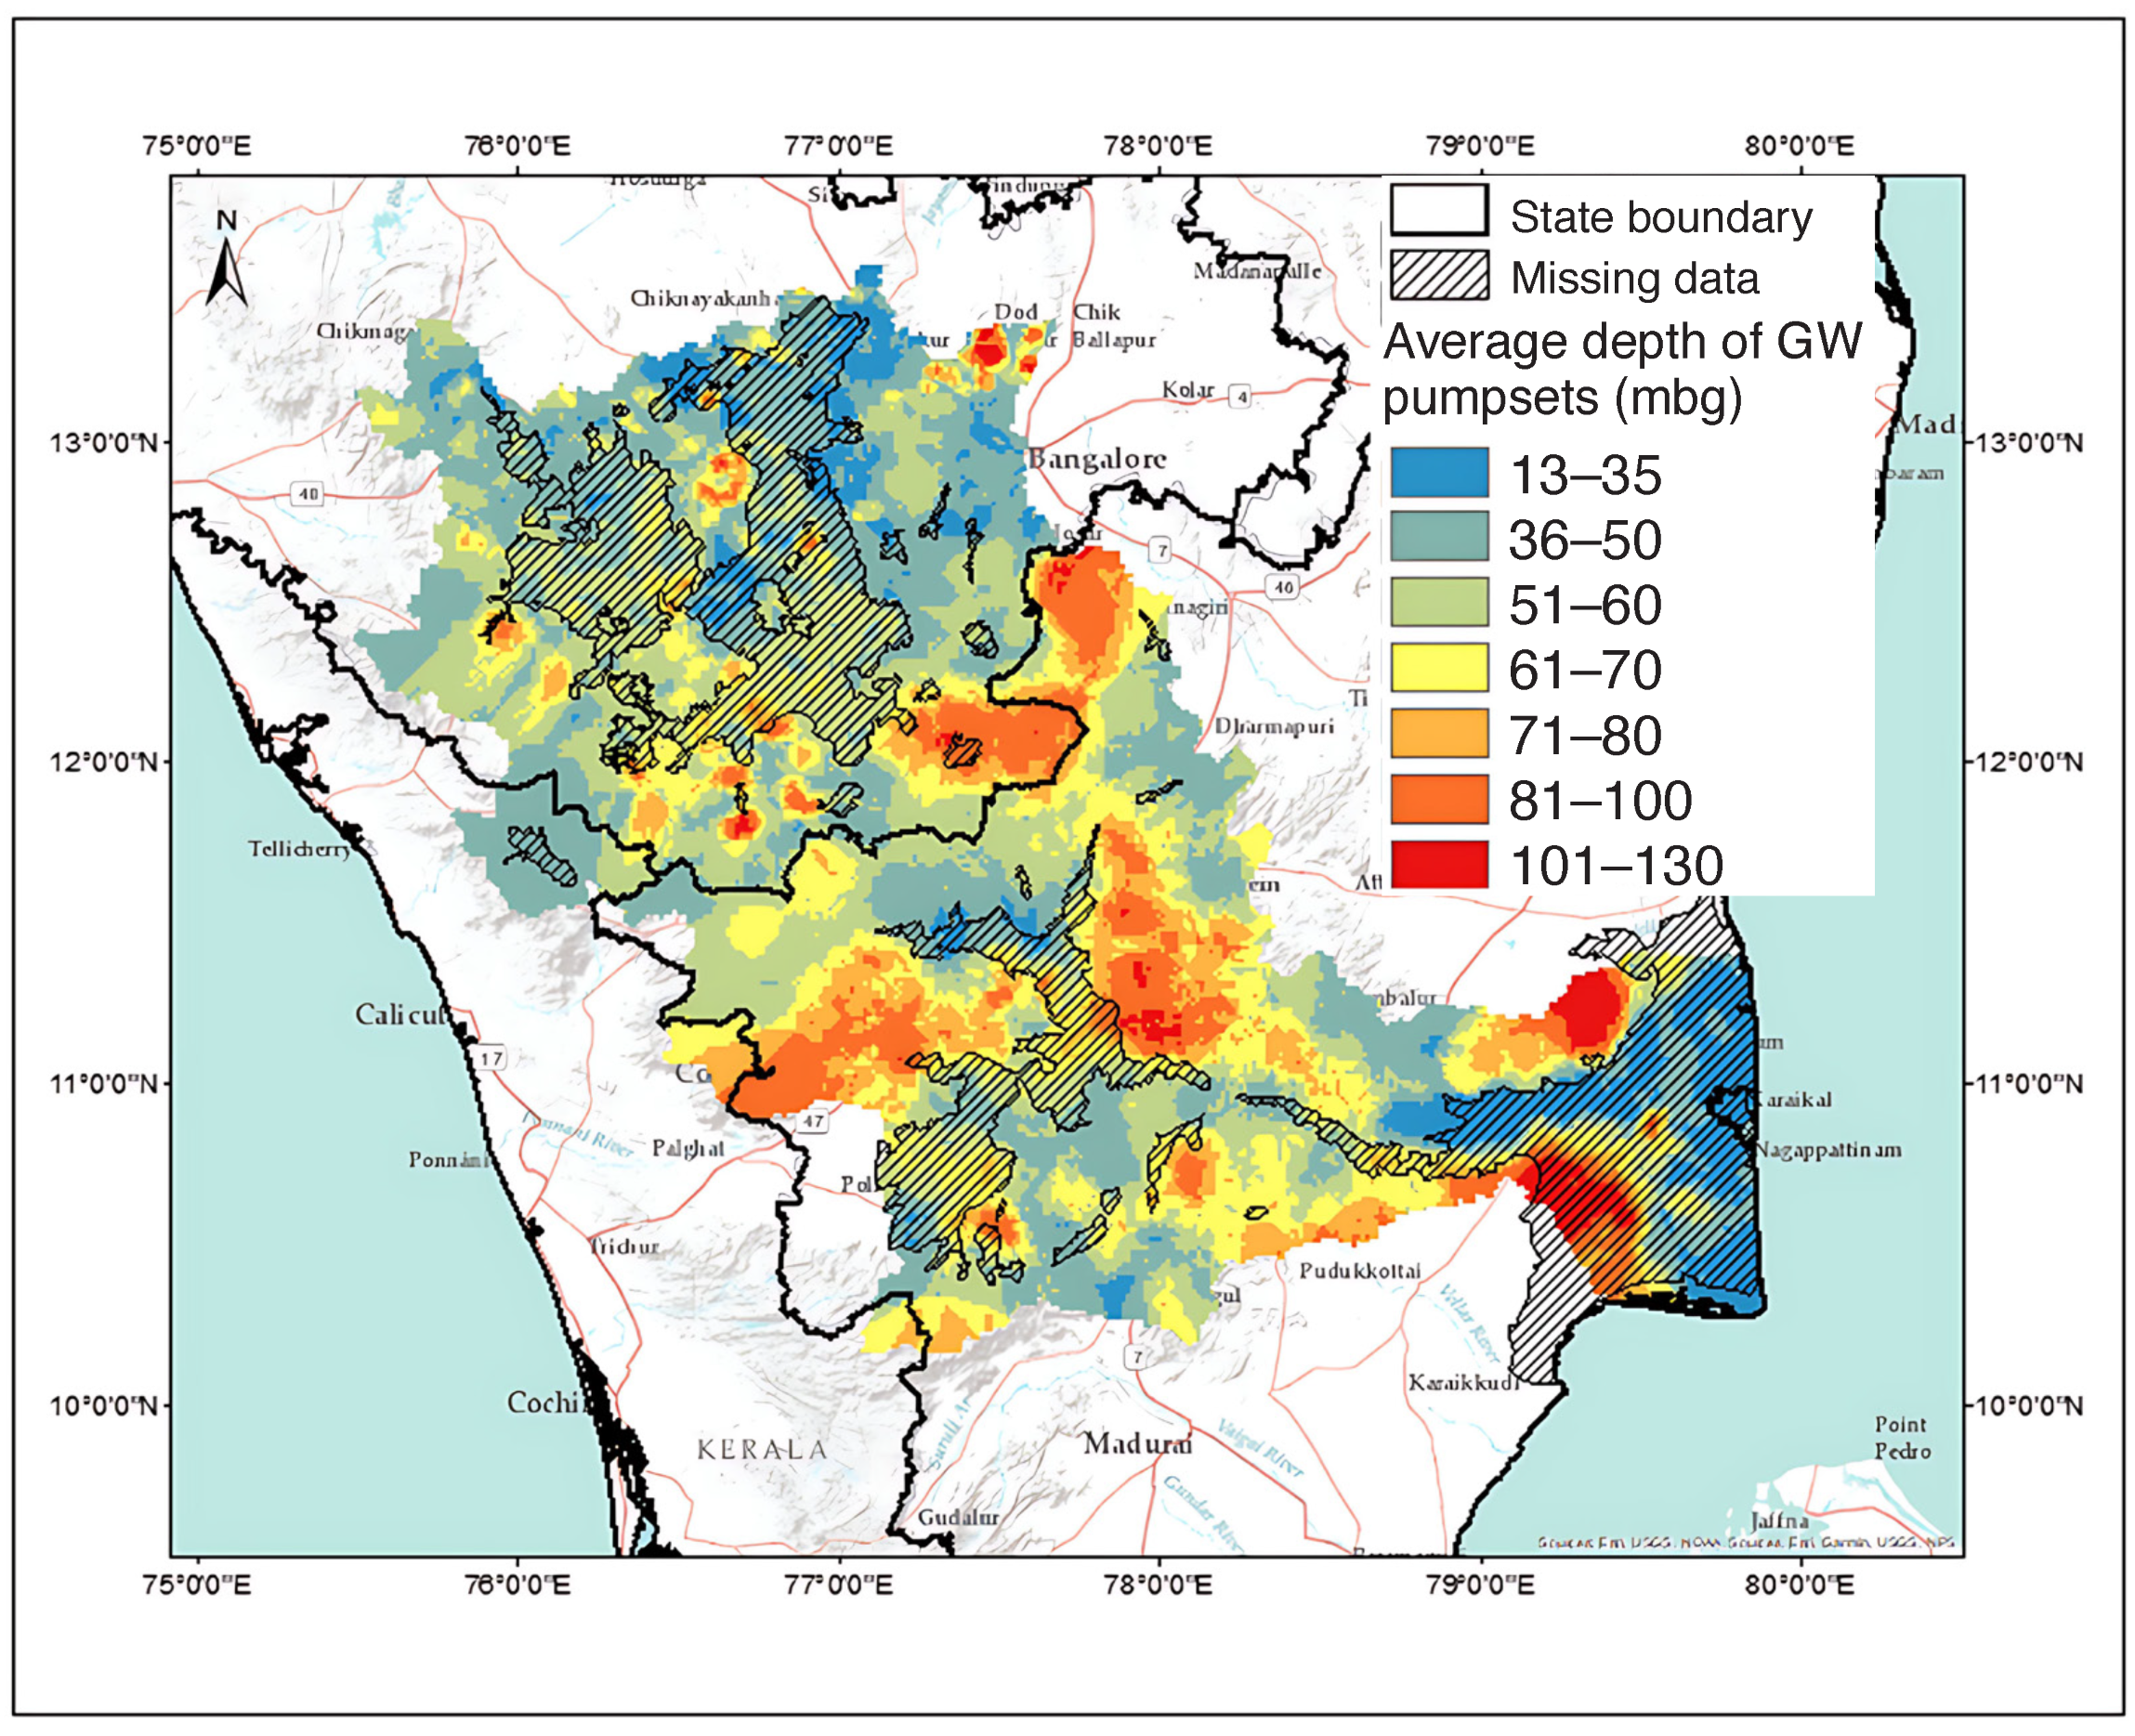
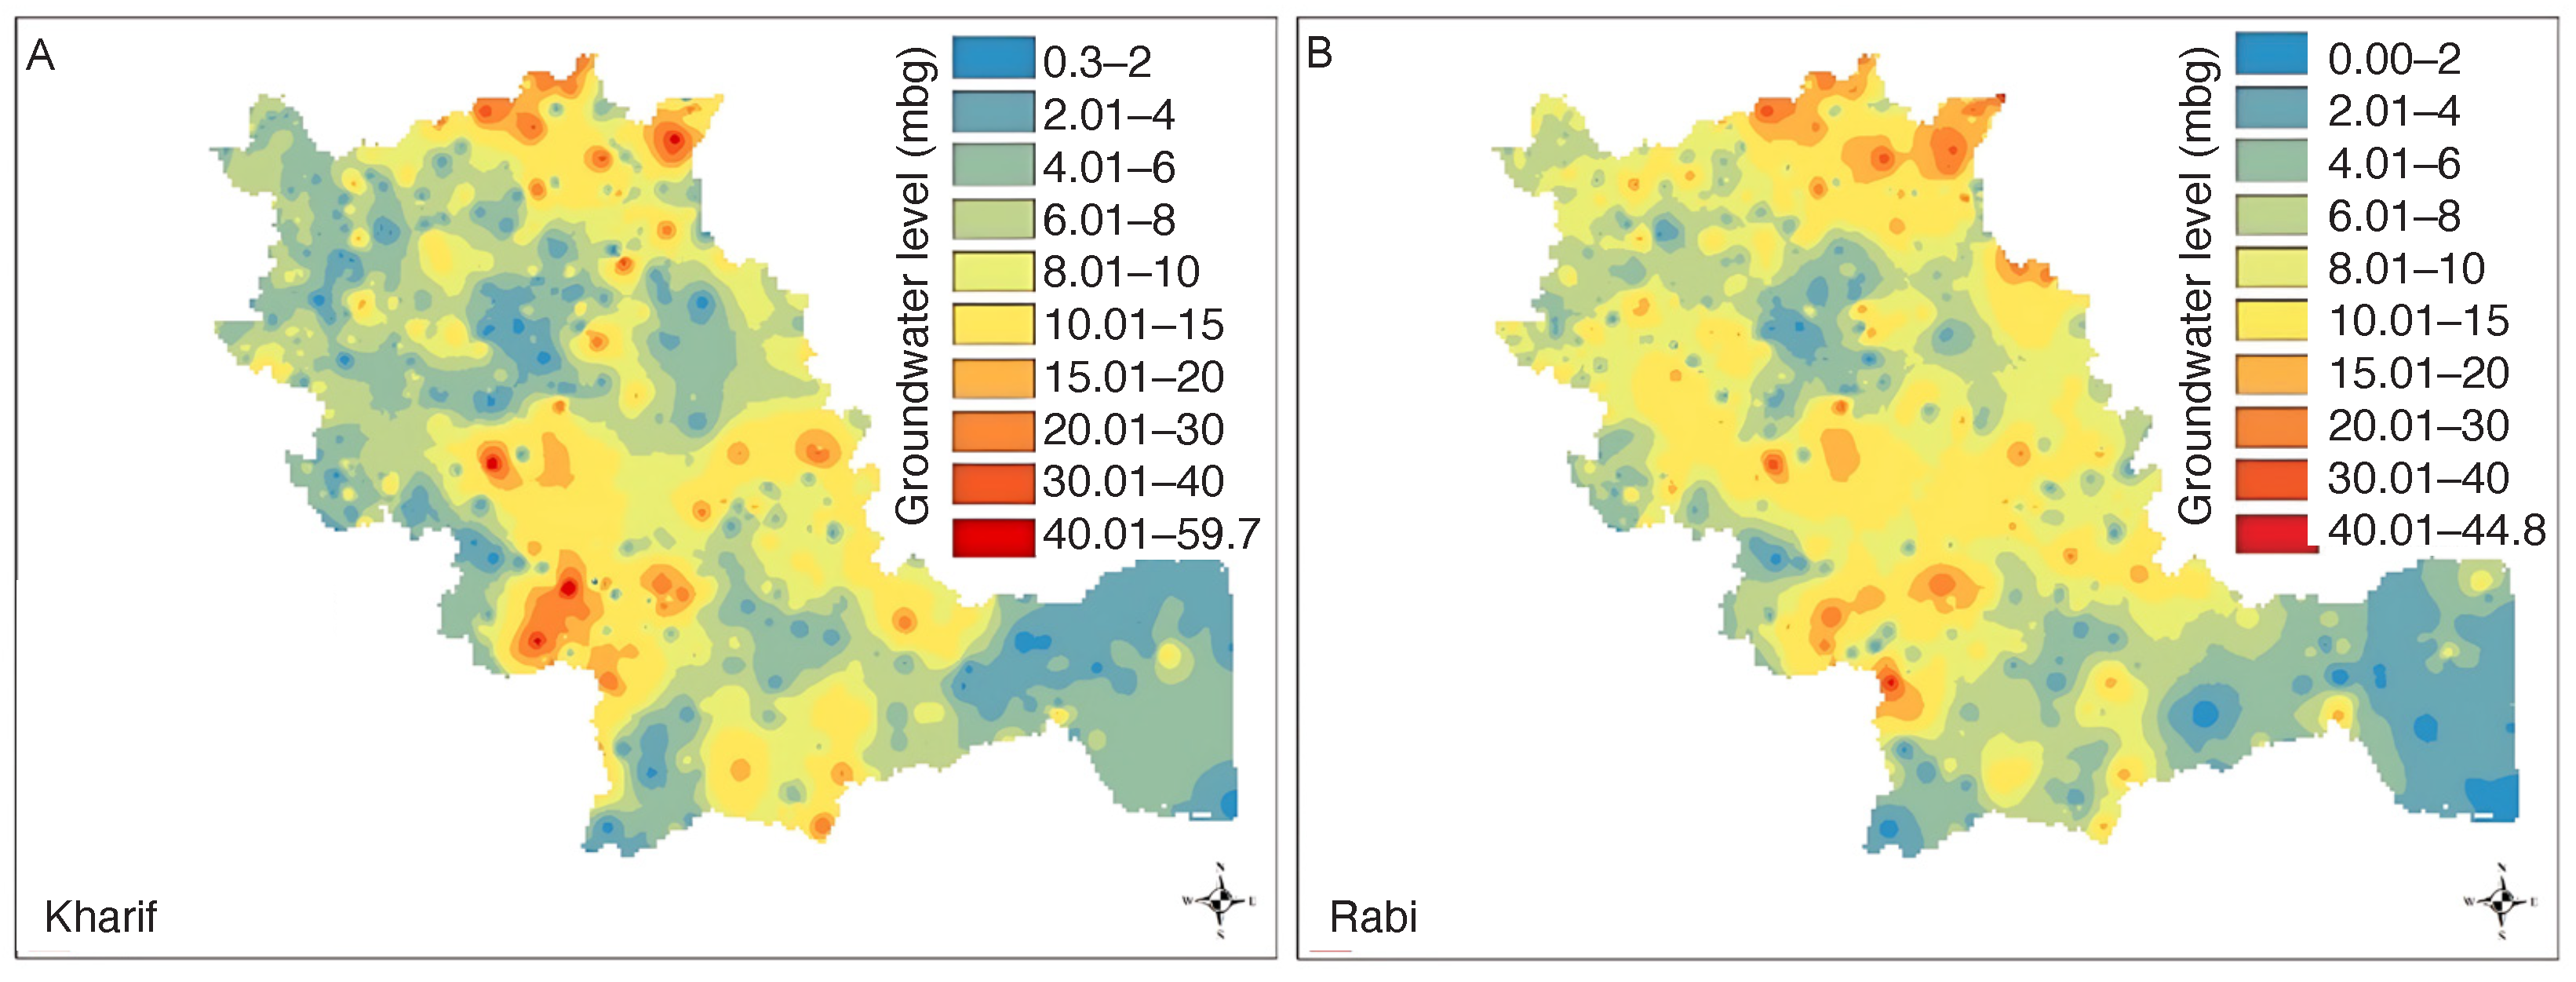
4.2.2. Deepening Borewells and Groundwater Level
4.2.3. Competition for Water and Crop Production
4.3. Spatial Analysis of Estimated Energy Consumption
4.3.1. Verification of Estimated Energy Consumption
4.3.2. Energy Consumption in Irrigated Agriculture
4.3.3. Estimating Groundwater Withdrawal
5. Discussion
5.1. The Nexus in Irrigated Agriculture
5.2. Challenges and Uncertainties in the Nexus
5.3. Limitations of This Study
6. Conclusions
- Accelerating the adoption of water-efficient irrigation methods by promoting drip irrigation and rainwater harvesting.
- Reforming electricity subsidies to reduce energy consumption while maintaining support for farmers.
- Strengthening water governance by improving inter-state water-sharing agreements and promoting integrated basin-level management.
- Investing in data-driven decision-making by building a robust data.
- Empowering farmers by providing financial and technical support for adopting sustainable agricultural practices.
Supplementary Materials
Author Contributions
Funding
Data Availability Statement
Conflicts of Interest
References
- Cullet, P.; Koonan, S. Water Law in India: An Introduction to Legal Instruments, 2nd ed.; Oxford University Press: Oxford, UK, 2017. [Google Scholar]
- Badiani, R.; Jessoe, K.K.; Plant, S. Development and the Environment. J. Environ. Dev. 2012, 21, 244–262. [Google Scholar] [CrossRef]
- Dubash, N. The Electricity-Groundwater Conundrum: Case for a Political Solution to a Political Problem. Econ. Polit. Wkly. 2007, 42, 45–55. [Google Scholar] [CrossRef]
- Dhawan, V. Water and Agriculture in India: Background Paper for the South Asia Expert Panel During the Global Forum for Food and Agriculture (GFFA) 2017; OAV German Asia-Pacific Business Association: Hamburg, Germany, 2017. [Google Scholar]
- Ragab, R.; Prudhomme, C. SW—Soil and Water: Climate Change and Water Resources Management in Arid and Semi-arid Regions: Prospective and Challenges for the 21st Century. Biosyst. Eng. 2002, 81, 3–34. [Google Scholar] [CrossRef]
- Prayag, A.G.; Zhou, Y.; Srinivasan, V.; Stigter, T.; Verzijl, A. Assessing the impact of groundwater abstractions on aquifer depletion in the Cauvery Delta, India. Agric. Water Manag. 2023, 279, 108191. [Google Scholar] [CrossRef]
- Brugere, C.; Lingard, J. Irrigation deficits and farmers’ vulnerability in Southern India. Agric. Syst. 2003, 77, 65–88. [Google Scholar] [CrossRef]
- Bhave, A.G.; Conway, D.; Dessai, S.; Stainforth, D.A. Water resource planning under future climate and socioeconomic uncertainty in the Cauvery River Basin in Karnataka, India. Water Resour. Res. 2018, 54, 708–728. [Google Scholar] [CrossRef]
- Guston, D.H. Understanding ‘anticipatory governance’. Soc. Stud. Sci. 2014, 44, 218–242. [Google Scholar] [CrossRef]
- Vanham, D.; Weingartner, R.; Rauch, W. The Cauvery river basin in Southern India: Major challenges and possible solutions in the 21st century. Water Sci. Technol. 2011, 64, 122–131. [Google Scholar] [CrossRef]
- Mukherji, A.; Verma, T.S.S. Electricity reforms and its impact on groundwater use: Evidence from India. In Re-Thinking Water and Food Security; CRC Press: Boca Raton, FL, USA, 2010. [Google Scholar]
- Howells, M.; Hermann, S.; Welsch, M.; Bazilian, M.; Segerström, R.; Alfstad, T.; Gielen, D.; Rogner, H.; Fischer, G.; Velthuizen, H.V. Integrated analysis of climate change, land-use, energy and water strategies. Nat. Clim. Chang. 2013, 3, 621–626. [Google Scholar] [CrossRef]
- Biggs, R.; Schlüter, M.; Schoon, M.L. Principles for Building Resilience: Sustaining Ecosystem Services in Social-Ecological Systems; Cambridge University Press: Cambridge, UK, 2015. [Google Scholar]
- Akinsete, E.; Koundouri, P.; Kartala, X.; Englezos, N.; Lautze, J.; Yihdego, Z.; Gibson, J.; Scholz, G.; Van Bers, C.; Sodoge, J. Sustainable WEF nexus management: A conceptual framework to integrate models of social, economic, policy, and institutional developments. Front. Water 2022, 4, 727772. [Google Scholar] [CrossRef]
- Simpson, G.; Jewitt, G.; Becker, W.; Badenhorst, J.; Neves, A.; Rovira, P.; Pascual, V. The Water-Energy-Food Nexus Index: A Tool to Support Integrated Resource Planning, Management and Security. Front. Water 2022, 4, 825854. [Google Scholar] [CrossRef]
- Sawant, N.; Kulkarni, S.; Sharma, P.; Doval, A.; Jadhav, P.J. Methodology to quantify crop, irrigation water, and energy linkages in small-holder irrigation systems. Energy Sustain. Dev. 2025, 86, 101719. [Google Scholar] [CrossRef]
- Chand, J.B.; Bimali, S. Exploration of the cropping pattern based on the irrigation water–energy–food and carbon emission nexus. Irrig. Drain. 2024, 73, 944–960. [Google Scholar] [CrossRef]
- Folke, S. Conflicts over Water and Land in South Indian Agriculture: A Political Economy Perspective. Econ. Polit. Wkly. 1998, 33, 341–349. Available online: http://www.jstor.org/stable/4406406 (accessed on 3 May 2025).
- Gurumurthy, R.; Xavier, S. The Cauvery Conundrum: Historical Roots of A Modern Dispute. J. Namib. Stud. Hist. Polit. Cult. 2023, 33, 4492–4505. [Google Scholar] [CrossRef]
- Ghosh, N.; Bandyopadhyay, J.; Thakur, J. Conflict over Cauvery Waters: Imperatives for Innovative Policy Options; Observer Research Foundation: New Delhi, India, 2018. [Google Scholar]
- Amjath Babu, T.S. Economic and Environmental Impacts of Political Non-Cooperative Strategies in Water Management: An Analysis of Prospective Policies in the Cauvery River Basin of India. Ph.D. Thesis, Justus-Liebig University Giessen, Giessen, Germany, 2008. [Google Scholar]
- Ferdin, M.; Görlitz, S.; Schwörer, S. Water stress in the Cauvery basin, south India. How current water management approaches and allocation conflict constrain reform. ASIEN Ger. J. Polit. Econ. Cult. 2010, 117, 27–44. [Google Scholar] [CrossRef]
- Sharma, A.; Hipel, K.W.; Schweizer, V. Strategic insights into the cauvery river dispute in India. Sustainability 2020, 12, 1286. [Google Scholar] [CrossRef]
- Garg, N.K.; Azad, S. Analysis of Cauvery water-sharing award using an analytical framework model. J. Hydrol. 2019, 579, 124214. [Google Scholar] [CrossRef]
- Shah, T. Taming the Anarchy: Groundwater Governance in South Asia; Routledge: Abingdon, UK, 2010. [Google Scholar]
- Kitterød, N.O. Hydrological challenges in the Cauvery River basin, South India. Siècles. Cahiers du Centre d’histoire «Espaces et Cultures» 2022, 53, 1–20. [Google Scholar] [CrossRef]
- Gowri, R.; Dey, P.; Mujumdar, P.P. A hydro-climatological outlook on the long-term availability of water resources in Cauvery river basin. Water Secur. 2021, 14, 100102. [Google Scholar] [CrossRef]
- Horan, R.; Gowri, R.; Wable, P.S.; Baron, H.; Keller, V.D.; Garg, K.K.; Mujumdar, P.P.; Houghton-Carr, H.; Rees, G. A comparative assessment of hydrological models in the Upper Cauvery catchment. Water 2021, 13, 151. [Google Scholar] [CrossRef]
- Sreelash, K.; Mathew, M.M.; Nisha, N.; Arulbalaji, P.; Bindu, A.G.; Sharma, R.K. Changes in the Hydrological Characteristics of Cauvery River draining the eastern side of southern Western Ghats, India. Int. J. River Basin Manag. 2020, 18, 153–166. [Google Scholar] [CrossRef]
- Wable, P.S.; Garg, K.K.; Nune, R.; Venkataradha, A.; KH, A.; Srinivasan, V.; Ragab, R.; Rowan, J.; Keller, V.; Majumdar, P. Impact of agricultural water management interventions on upstream–downstream trade-offs in the upper Cauvery catchment, southern India: A modelling study. Irrig. Drain. 2022, 71, 472–494. [Google Scholar] [CrossRef]
- Fishman, R.M.; Siegfried, T.; Raj, P.; Modi, V.; Lall, U. Over-extraction from shallow bedrock versus deep alluvial aquifers: Reliability versus sustainability considerations for India’s groundwater irrigation. Water Resour. Res. 2011, 47, 20. [Google Scholar] [CrossRef]
- Robert, M.; Thomas, A.; Sekhar, M.; Badiger, S.; Ruiz, L.; Willaume, M.; Leenhardt, D.; Bergez, J.E. Farm Typology in the Berambadi Watershed (India): Farming Systems Are Determined by Farm Size and Access to Groundwater. Water 2017, 9, 51. [Google Scholar] [CrossRef]
- Department of Water Resources. India-WRIS (Water Resource Information System); Department of Water Resources, River Development & Ganga Rejuvenation: New Delhi, India, 2020; Available online: https://nwic.in/wris/#/ (accessed on 3 May 2025).
- Ramesh, R.; Purvaja, R.; Lakshmi, A.; Newton, A.; Kremer, H.H.; Weichselgartner, J. South Asia Basins: LOICZ Global Change Assessment and Synthesis of River Catchment Coastal Sea Interaction and Human Dimensions: [land-ocean Interactions in the Coastal Zone (LOICZ), Core Project of the International Geosphere-biosphere Programme (IGBP) and International Human Dimensions Programme on Global Environmental Change (IHDP)]; LOICZ Research and Studies No. 32; GKSS Research Center: Geesthacht, Germany, 2009; 121p. [Google Scholar] [CrossRef]
- Subramani, T.; Badrinarayanan, S.; Prasath, K.; Sridhar, S. Performanance Evaluation of the Cauvery Irrigation System, India, Using Remote Sensing and Gis Technology. Int. J. Eng. Res. Appl. 2014, 4, 191–197. [Google Scholar]
- Ministry of Jal Shakti, Government of India. Fifth Vensus of Minor Irrigation Schemes Report; Department of Water Resources, River Development & Ganga Rejuvenation: New Delhi, India, 2017. Available online: https://www.data.gov.in/ (accessed on 3 May 2025).
- Ministry of Jal Shakti, Government of India. Cauvery Water Management Authority; Department of Water Resources, River Development & Ganga Rejuvenation: New Delhi, India, 2024. Available online: https://www.jalshakti-dowr.gov.in/cauvery-water-management-authority (accessed on 3 May 2025).
- Sivakumar, B. Hydropsychology: The human side of water research. Hydrol. Sci. J. 2011, 56, 719–732. [Google Scholar] [CrossRef]
- Department of Agriculture, Co-operation and Farmers Welfare. Agriculture Census 2015–16: All India Report on Number and Area of Operational Holdings; Ministry of Agriculture and Farmers Welfare, Government of India: New Delhi, India, 2019. Available online: https://www.agcensus.gov.in/ (accessed on 3 May 2025).
- Narayanamoorthy, A. Economics of drip irrigation in sugarcane cultivation: Case study of a farmer from Tamil Nadu. Indian J. Agric. Econ. 2005, 60, 235–248. [Google Scholar]
- Jackson, T.M.; Khan, S.; Hafeez, M. A comparative analysis of water application and energy consumption at the irrigated field level. Agric. Water Manag. 2010, 97, 1477–1485. [Google Scholar] [CrossRef]
- Karimi, P.; Qureshi, A.S.; Bahramloo, R.; Molden, D.J. Reducing carbon emissions through improved irrigation and groundwater management: A case study from Iran. Agric. Water Manag. 2012, 108, 52–60. [Google Scholar] [CrossRef]
- Wang, J.; Rothausen, S.; Conway, D.; Zhang, L.; Xiong, W.; Holman, I.; Li, Y. China’s water–energy nexus: Greenhouse-gas emissions from groundwater use for agriculture. Environ. Res. Lett. 2012, 7, 014035. [Google Scholar] [CrossRef]
- Patle, G.; Singh, D.K.; Sarangi, A.; Khanna, M. Managing CO2 emission from groundwater pumping for irrigating major crops in trans indo-gangetic plains of India. Clim. Chang. 2016, 136, 265–279. [Google Scholar] [CrossRef]
- Handa, D.; Frazier, R.S.; Taghvaeian, S.; Warren, J.G. The Efficiencies, Environmental Impacts and Economics of Energy Consumption for Groundwater-Based Irrigation in Oklahoma. Agriculture 2019, 9, 27. [Google Scholar] [CrossRef]
- Agrawal, S.; Jain, A. Solar Pumps for Sustainable Irrigation: A Budget Neutral Opportunity; Technical Report; Council on Energy, Environment and Water: New Delhi, India, 2015. [Google Scholar]
- Indian Council of Agricultural Research. Expert System for Paddy–Planting Seasons; Tamil Nadu Agricultural University: Tamil Nadu, India, 2018; Available online: https://tnau.ac.in/expert-system/ (accessed on 3 May 2025).
- Murari, K.; Mahato, S.; Jayaraman, T.; Swaminathan, M. Extreme Temperatures and Crop Yields in Karnataka, India. Rev. Agrar. Stud. 2019, 8, 92–114. [Google Scholar] [CrossRef]
- Khalid, M.; Laarabi, B.; Barhdadi, A. Solar Water Pumping Applications in Morocco: State of the Art. In Proceedings of the 6th International Renewable and Sustainable Energy Conference (IRSEC), Rabat, Morocco, 5–8 December 2018. [Google Scholar] [CrossRef]
- Shreedhar, G.; Gupta, N.; Pullabhotla, H.; Ganesh-Kumar, A.; Gulati, A. A Review of Input and Output Policies for Cereals Production in India; IFPRI Discussion Paper 1159; International Food Policy Research Institute (IFPRI): Washington, DC, USA, 2012. [Google Scholar]
- Cullet, P. Groundwater Law In India: Towards a Framework Ensuring Equitable Access and Aquifer Protection. J. Environ. Law 2014, 26, 55–81. [Google Scholar] [CrossRef]
- Kumar, M.D. Groundwater Management in India: Physical, Institutional and Policy Alternatives; Sage: New Delhi, India, 2007; p. 354. [Google Scholar]
- Hora, T.; Srinivasan, V.; Basu, N.B. The Groundwater Recovery Paradox in South India. Geophys. Res. Lett. 2019, 46, 9602–9611. [Google Scholar] [CrossRef]
- Barik, B.; Ghosh, S.; Sahana, A.S.; Pathak, A.; Sekhar, M. Water–food–energy nexus with changing agricultural scenarios in India during recent decades. Hydrol. Earth Syst. Sci. 2017, 21, 3041–3060. [Google Scholar] [CrossRef]
- Scott, C.A. Electricity for groundwater use: Constraints and opportunities for adaptive response to climate change. Environ. Res. Lett. 2013, 8, 035005. [Google Scholar] [CrossRef]
- Gupta, B.; Horan, R.; Rowan, J.; Allan, A. Hydrological modelling to assess the impacts of socio-economic development and climate change on water resources in Cauvery Basin, India. preprint 2022. [Google Scholar] [CrossRef]
- Bazilian, M.; Rogner, H.; Howells, M.; Hermann, S.; Arent, D.; Gielen, D.; Steduto, P.; Müller, A.; Komor, P.; Tol, R.; et al. Considering the energy, water and food nexus: Towards an integrated modelling approach. Energy Policy 2011, 39, 7896–7906. [Google Scholar] [CrossRef]
- Al-Saidi, M.; Elagib, N. Towards understanding the integrative approach of the water, energy and food nexus. Sci. Total Environ. 2017, 574, 1131–1139. [Google Scholar] [CrossRef] [PubMed]
- Benson, D.; Gain, A.; Rouillard, J.; Giupponi, C. Governing for the Nexus: Empirical, Theoretical, and Normative Dimensions. In Water-Energy-Food Nexus: Principles and Practices; John Wiley & Sons: Hoboken, NJ, USA, 2017; pp. 77–88. [Google Scholar] [CrossRef]
- Sadeghi, S.H.; Sharifi Moghadam, E.; Delavar, M.; Zarghami, M. Application of water-energy-food nexus approach for designating optimal agricultural management pattern at a watershed scale. Agric. Water Manag. 2020, 233, 106071. [Google Scholar] [CrossRef]
- Mirzaei, A.; Naserin, A.; Mardani Najafabadi, M. Optimizing water-energy-food nexus index, CO2 emissions, and chemical pollutants under irrigation water salinity scenarios. Environ. Sustain. Indic. 2024, 23, 100461. [Google Scholar] [CrossRef]
- Agrawal, A.; Bakshi, B.R.; Kodamana, H.; Ramteke, M. Multi-objective optimization of food-energy-water nexus via crops land allocation. Comput. Chem. Eng. 2024, 183, 108610. [Google Scholar] [CrossRef]
- Albrecht, T.R.; Scott, C.A. The water-energy-food nexus: Outlook on opportunities and challenges. In Handbook on the Governance and Politics of Water Resources; Edward Elgar Publishing: London, UK, 2024; pp. 143–157. [Google Scholar]
- Ali, F. The Water, Food, and Energy Nexus: The Inclusive Roles of Governance and Finance in South Asia. Land Degrad. Dev. 2024, 35, 5367–5385. [Google Scholar] [CrossRef]
- Zahedi, R.; Yousefi, H.; Aslani, A.; Ahmadi, R. Water, energy, food and environment nexus (WEFEN): Sustainable transition, gaps and Covering approaches. Energy Strategy Rev. 2024, 54, 101496. [Google Scholar] [CrossRef]
- Gupta, V.; Singh, S. Exploring the multiple dimensions of solar irrigation in South-Asian countries: Insights from a systematic review. Renew. Energy Focus 2025, 54, 100711. [Google Scholar] [CrossRef]
- Mohan, G.; Perarapu, L.N.; Chapagain, S.K.; Reddy, A.A.; Melts, I.; Mishra, R.; Avtar, R.; Fukushi, K. Assessing determinants, challenges and perceptions to adopting water-saving technologies among agricultural households in semi-arid states of India. Curr. Res. Environ. Sustain. 2024, 7, 100255. [Google Scholar] [CrossRef]
- Moharaj, P.; Rana, S.; Sahoo, D.; Kumar, K.K.; Nagaraj, G.; Borah, N.; Utagi, S. Dynamics of Water Stress in Bangalore, India: Exploring the Confluence of Geopolitical, Climatic, and Anthropogenic Factors. J. Asian Afr. Stud. 2025. [Google Scholar] [CrossRef]
- Nair, J.; Thomas, B.K.; Bahinipati, C.S. Cropping decisions under water stress: Evidence from Cauvery Delta Region, India. World Water Policy 2024, 10, 711–729. [Google Scholar] [CrossRef]
- Mohtar, R.; Assi, A.; Daher, B. Bridging the Water and Food Gap: The Role of the Water-Energy-Food Nexus; United Nations University: Tokyo, Japan, 2015. [Google Scholar]
- Bosu, S.S. Sharing of Inter-state River Water Resources: Case Studies of Two Major Irrigation Systems in Tamil Nadu, India. Int. J. Water Resour. Dev. 1995, 11, 443–456. [Google Scholar] [CrossRef]
- Sishodia, R.P.; Shukla, S.; Graham, W.D.; Wani, S.P.; Jones, J.W.; Heaney, J. Current and future groundwater withdrawals: Effects, management and energy policy options for a semi-arid Indian watershed. Adv. Water Resour. 2017, 110, 459–475. [Google Scholar] [CrossRef]
- Raghuvanshi, S.P.; Chandra, A.; Raghav, A.K. Carbon dioxide emissions from coal based power generation in India. Energy Convers. Manag. 2006, 47, 427–441. [Google Scholar] [CrossRef]
- Pownkumar, V.; Ananthan, P.; Ekka, A.; Qureshi, N.W.; T, V. Fisheries as ecosystem services: A case study of the Cauvery river basin, India. Front. Environ. Sci. 2022, 10, 892012. [Google Scholar] [CrossRef]


| Data | Spatial scale | Period | Used for | Source |
|---|---|---|---|---|
| Number of pumpsets under different irrigation sources | Village scale | 2013–2014 | Spatial mapping of irrigation systems and estimating energy consumed | [36] |
| Rice production | District scale | 1997–2014 | Estimating correlation between rice production and groundwater availability | [39] |
| Groundwater table | CGWB borewells | 1997–2014 | Estimating correlation between rice production and groundwater availability, estimating groundwater abstraction | [33] |
| Hours of pumping and pump horsepower | Village scale | 2013–2014 | Estimating energy consumed | [36] |
| Irrigation potential under different irrigation sources and water distribution methods | Village scale | 2013–2014 | Estimating irrigation efficiency | [36] |
| Pumpsets under different sources of energy and depth of borewells | Village scale | 2013–2014 | Spatial mapping of irrigation systems | [36] |
| Pumpset efficiency of 30% | - | - | Estimating groundwater abstraction | [3] |
| Irrigation source per farmers’ economic class | District scale | 2014 | Assessing economic factor in access to irrigation equipment | [39] |
| Pumping Hours/Day (Kharif) | Pumping Hours/Day (Rabi) | ||||||
|---|---|---|---|---|---|---|---|
| G.W Source | Mean | Standard Error 1 | Maximum | Mean | Standard Error 1 | Maximum | p Value |
| Deep tubewells | 4 | ±0.68 | 22 | 3.6 | ±0.47 | 22 | ≪0.05 |
| Medium tubewells | 4.4 | ±0.69 | 22 | 3.7 | ±0.5 | 22 | ≪0.05 |
| Shallow tubewells | 3.9 | ±0.46 | 22 | 3.4 | ±0.33 | 22 | ≪0.05 |
| Dug wells | 4 | ±0.4 | 22 | 3.5 | ±0.35 | 14 | ≪0.05 |
| Surface-lift schemes | 3 | ±0.48 | 22 | 2.7 | ±0.35 | 22 | ≪0.05 |
Disclaimer/Publisher’s Note: The statements, opinions and data contained in all publications are solely those of the individual author(s) and contributor(s) and not of MDPI and/or the editor(s). MDPI and/or the editor(s) disclaim responsibility for any injury to people or property resulting from any ideas, methods, instructions or products referred to in the content. |
© 2025 by the authors. Licensee MDPI, Basel, Switzerland. This article is an open access article distributed under the terms and conditions of the Creative Commons Attribution (CC BY) license (https://creativecommons.org/licenses/by/4.0/).
Share and Cite
Gupta, B.; Rowan, J.S. Understanding Unsustainable Irrigation Practices in a Regionally Contested Large River Basin in Peninsular India Through the Lens of the Water–Energy–Food–Environment (WEFE) Nexus. Water 2025, 17, 1644. https://doi.org/10.3390/w17111644
Gupta B, Rowan JS. Understanding Unsustainable Irrigation Practices in a Regionally Contested Large River Basin in Peninsular India Through the Lens of the Water–Energy–Food–Environment (WEFE) Nexus. Water. 2025; 17(11):1644. https://doi.org/10.3390/w17111644
Chicago/Turabian StyleGupta, Bhawana, and John S. Rowan. 2025. "Understanding Unsustainable Irrigation Practices in a Regionally Contested Large River Basin in Peninsular India Through the Lens of the Water–Energy–Food–Environment (WEFE) Nexus" Water 17, no. 11: 1644. https://doi.org/10.3390/w17111644
APA StyleGupta, B., & Rowan, J. S. (2025). Understanding Unsustainable Irrigation Practices in a Regionally Contested Large River Basin in Peninsular India Through the Lens of the Water–Energy–Food–Environment (WEFE) Nexus. Water, 17(11), 1644. https://doi.org/10.3390/w17111644