Article

Seasonal Variations of Hydraulic Exchange Between Surface Water and Groundwater in an Alluvial Plain Setting Using 222Rn

1
Yellow River Engineering Consulting Co., Ltd., Zhengzhou 450003, China
2
Key Laboratory of Water Management and Water Security for Yellow River Basin, Ministry of Water Resources (Under Construction), Zhengzhou 450003, China
3
The National Key Laboratory of Water Disaster Prevention, Hohai University, Nanjing 210098, China
4
Information Center of the Yellow River Conservancy Commission, Zhengzhou 450003, China
5
College of Hydrology and Water Resources, Hohai University, Nanjing 210098, China
6
Yellow River Conservancy Commission of the Ministry of Water Resources, Zhengzhou 450003, China
*
Author to whom correspondence should be addressed.
Water 2025, 17(11), 1639; https://doi.org/10.3390/w17111639
Submission received: 2 April 2025 / Revised: 23 May 2025 / Accepted: 23 May 2025 / Published: 28 May 2025
(This article belongs to the Section Hydraulics and Hydrodynamics)

Abstract

:
Understanding dynamic groundwater–surface water interactions in alluvial plains is critical for sustainable water resource management, yet seasonal variability and spatial heterogeneity of these exchanges remain imprecisely quantified. Here, we present an improved 222Rn mass balance model for evaluating the seasonal hydraulic exchange between groundwater and the Xintongyang Canal in the Taizhou alluvial plain over the course of a hydrologic year. To reduce the model uncertainty, the “background” 222Rn for non-groundwater sources was incorporated into the model to replace the influence of hyporheic exchange. The results indicate that the hydraulic exchange process of surface water and groundwater has significant spatiotemporal differences. Based on the calculations from the 222Rn mass balance model, the canal leakage flux follows the order of summer > autumn > winter > spring over the course of a hydrologic year. In contrast, the groundwater discharge flux follows the order of summer > spring > autumn > winter. During a hydrological year, summer demonstrated the most intense water exchange dynamics, with peak fluxes reaching 0.0455 m3/(s·m) for surface water leakage and 0.0013 m3/(s·m) for groundwater discharge, revealing pronounced spatial heterogeneity in dominant exchange processes. 222Rn activity in canal and groundwater varies significantly across different regions, with canal leakage being the dominant mode of hydraulic exchange within the study area. The change of the hydraulic exchange process was mainly affected by factors such as rainfall. In the process of promoting surface water leakage, precipitation will also strengthen the supplement of groundwater and contribute to the groundwater discharge in most of the canal sections. This study offers insight into the seasonal variations of groundwater and surface water interaction within an alluvial plain.

1. Introduction

Surface water and groundwater are an integral part of any hydrological system, where rivers and lakes often exchange water and solutes with adjacent aquifers. However, with the impact of climate change and human activities, the interaction between surface water and groundwater has changed. This transformation is particularly pronounced in alluvial plains, where the heterogeneity of aquifers and complex hydraulic exchanges create formidable challenges in quantifying surface water leakage and groundwater discharge fluxes. A comprehensive understanding of the interaction between these hydrological systems is vital to tracing pollutant migration routes and the management of water resources. The knowledge of this interaction promotes the efficient utilization of water resources and the prediction of environmental changes that provides important feedback for land surface hydrology and ecosystem dynamics [1,2].
Most studies of groundwater and surface water interactions range in time scales from hours to months [3,4,5]. Short-term studies on small scales can provide a high spatial and temporal resolution of groundwater and surface water interactions [6] and reveal the groundwater-driven interaction between hydrodynamics and hydrochemical processes [7,8,9,10]. Due to hydrological time lags and sampling time biases, short-term studies have large margins of error in determining groundwater contributions to the total water balance and are limited in promptly responding to unexpected events such as floods and extreme precipitation. Long-term annual-to-decadal observations provide insights into groundwater generation and its contribution to the hydrological system’s water balance [11,12,13]. In contrast, seasonal observations better describe the response of hydraulic exchange processes to changes in seasonal characteristics.
In general, groundwater flow follows Darcy’s law. According to Darcy’s law, groundwater flow is mainly determined by the hydraulic gradient and hydraulic conductivity of an aquifer [14]. Groundwater flow paths are principally governed by hydraulic gradients derived from spatial variations in hydraulic head, which may exhibit indirect correlations with surface topography in specific hydrogeologic settings (e.g., unconfined aquifers with homogeneous permeability). However, this relationship becomes decoupled in systems with anisotropic permeability or structural controls [15]. Due to the heterogeneous anisotropy of natural aquifers, the values of hydraulic conductivity and hydraulic gradient can span several orders of magnitude. The wide range and uncertainty in hydraulic conductivity and hydraulic gradient across different spatial scales make it difficult to estimate the hydraulic exchange flux between groundwater and surface water [16,17].
Because the hydraulic exchange between rivers, lakes, and groundwater is usually discrete and uneven, the detailed exchange processes often are not assessed thoroughly. The extent of interaction between groundwater and surface water depends on several factors, including topography, underlying lithology, the hydraulic properties of aquifers, temporal variations in precipitation, and local groundwater flow patterns [18]. Therefore, understanding the interaction between groundwater and surface water remains a unique challenge [19], especially in alluvial plains with relatively flat terrain, where the influence of topography on the hydraulic exchange is reduced. Moreover, the seasonal variations in precipitation and the fluctuations in rivers and groundwater complicate the hydraulic exchange between rivers and adjacent aquifers.
The hydrologic flow state of rivers on an alluvial plain is controlled by different sources of water, including the inflow of tributaries, runoff, and groundwater discharge. All these sources are ultimately driven by precipitation, topography, and aquifer properties. The water balance in the alluvial plain is highly dynamic due to the complex interactions between groundwater and surface water at different spatial and temporal scales. This problem is faced in the estimation of the interaction between groundwater and the Xintongyang Canal in the Taizhou alluvial plain, China. To better understand hyporheic exchange processes, widely used hydrological tracers such as radon (222Rn) and stable isotopes of hydrogen (δ2H) and oxygen (δ18O) are employed to identify and quantify water exchange fluxes between surface water and groundwater systems. These tracers combine complex and variable groundwater discharge patterns and reflect the average net groundwater discharge at each scale [20,21]. An important advantage of the tracer method is that it can synthesize groundwater tracer signals to provide a more representative estimate of the overall groundwater flow over a large area [22].
Among the many natural tracers used for estimating flux exchange between groundwater and surface water, radon (refer to 222Rn) is increasingly adopted [23,24,25,26,27,28,29,30,31,32]. This radioactive isotope (222Rn, T1/2 = 3.82 days) is produced through the decay chain of uranium in aquifers, with an activity value in groundwater about 2–3 orders of magnitude higher than in surface water [33,34]. This activity difference makes it an ideal tracer for estimating water exchange between groundwater and surface water. The conservative behavior of 222Rn in the hydrologic system gives it an advantage over other geochemical groundwater tracers, such as anions, cations, methane (CH4), and stable isotopes, which can be affected by evaporation, condensation, and biological and chemical transformations [35,36]. The relatively short half-life of 222Rn provides potential in the study of rapid mixing processes that occur between the groundwater and surface on time scales of hours to several days [37], especially during a short response to rainfall events. This potential can help in using detailed and relevant datasets for hydrological water budget modeling.
To clarify the complex hydraulic exchange methods between rivers containing tributaries and groundwater in the alluvial plain, here, we quantify the contribution of groundwater discharge and surface water leakage to the long-term water budget of the Xintongyang Canal in the Taizhou alluvial plain by monitoring 222Rn for one hydrologic year. The data are used to evaluate the seasonal hydrological exchange between the canal and the adjacent aquifer in the alluvial plain and to specify in which season the intense hydraulic exchange is occurring. Notably, the Xintongyang Canal functions as a third-class navigable waterway rather than an irrigation channel, exhibiting fundamental divergences in hydrological design principles and operational protocols compared to agricultural water delivery systems. The results will provide a reasonable basis for the regional water resource assessment.

2. Data

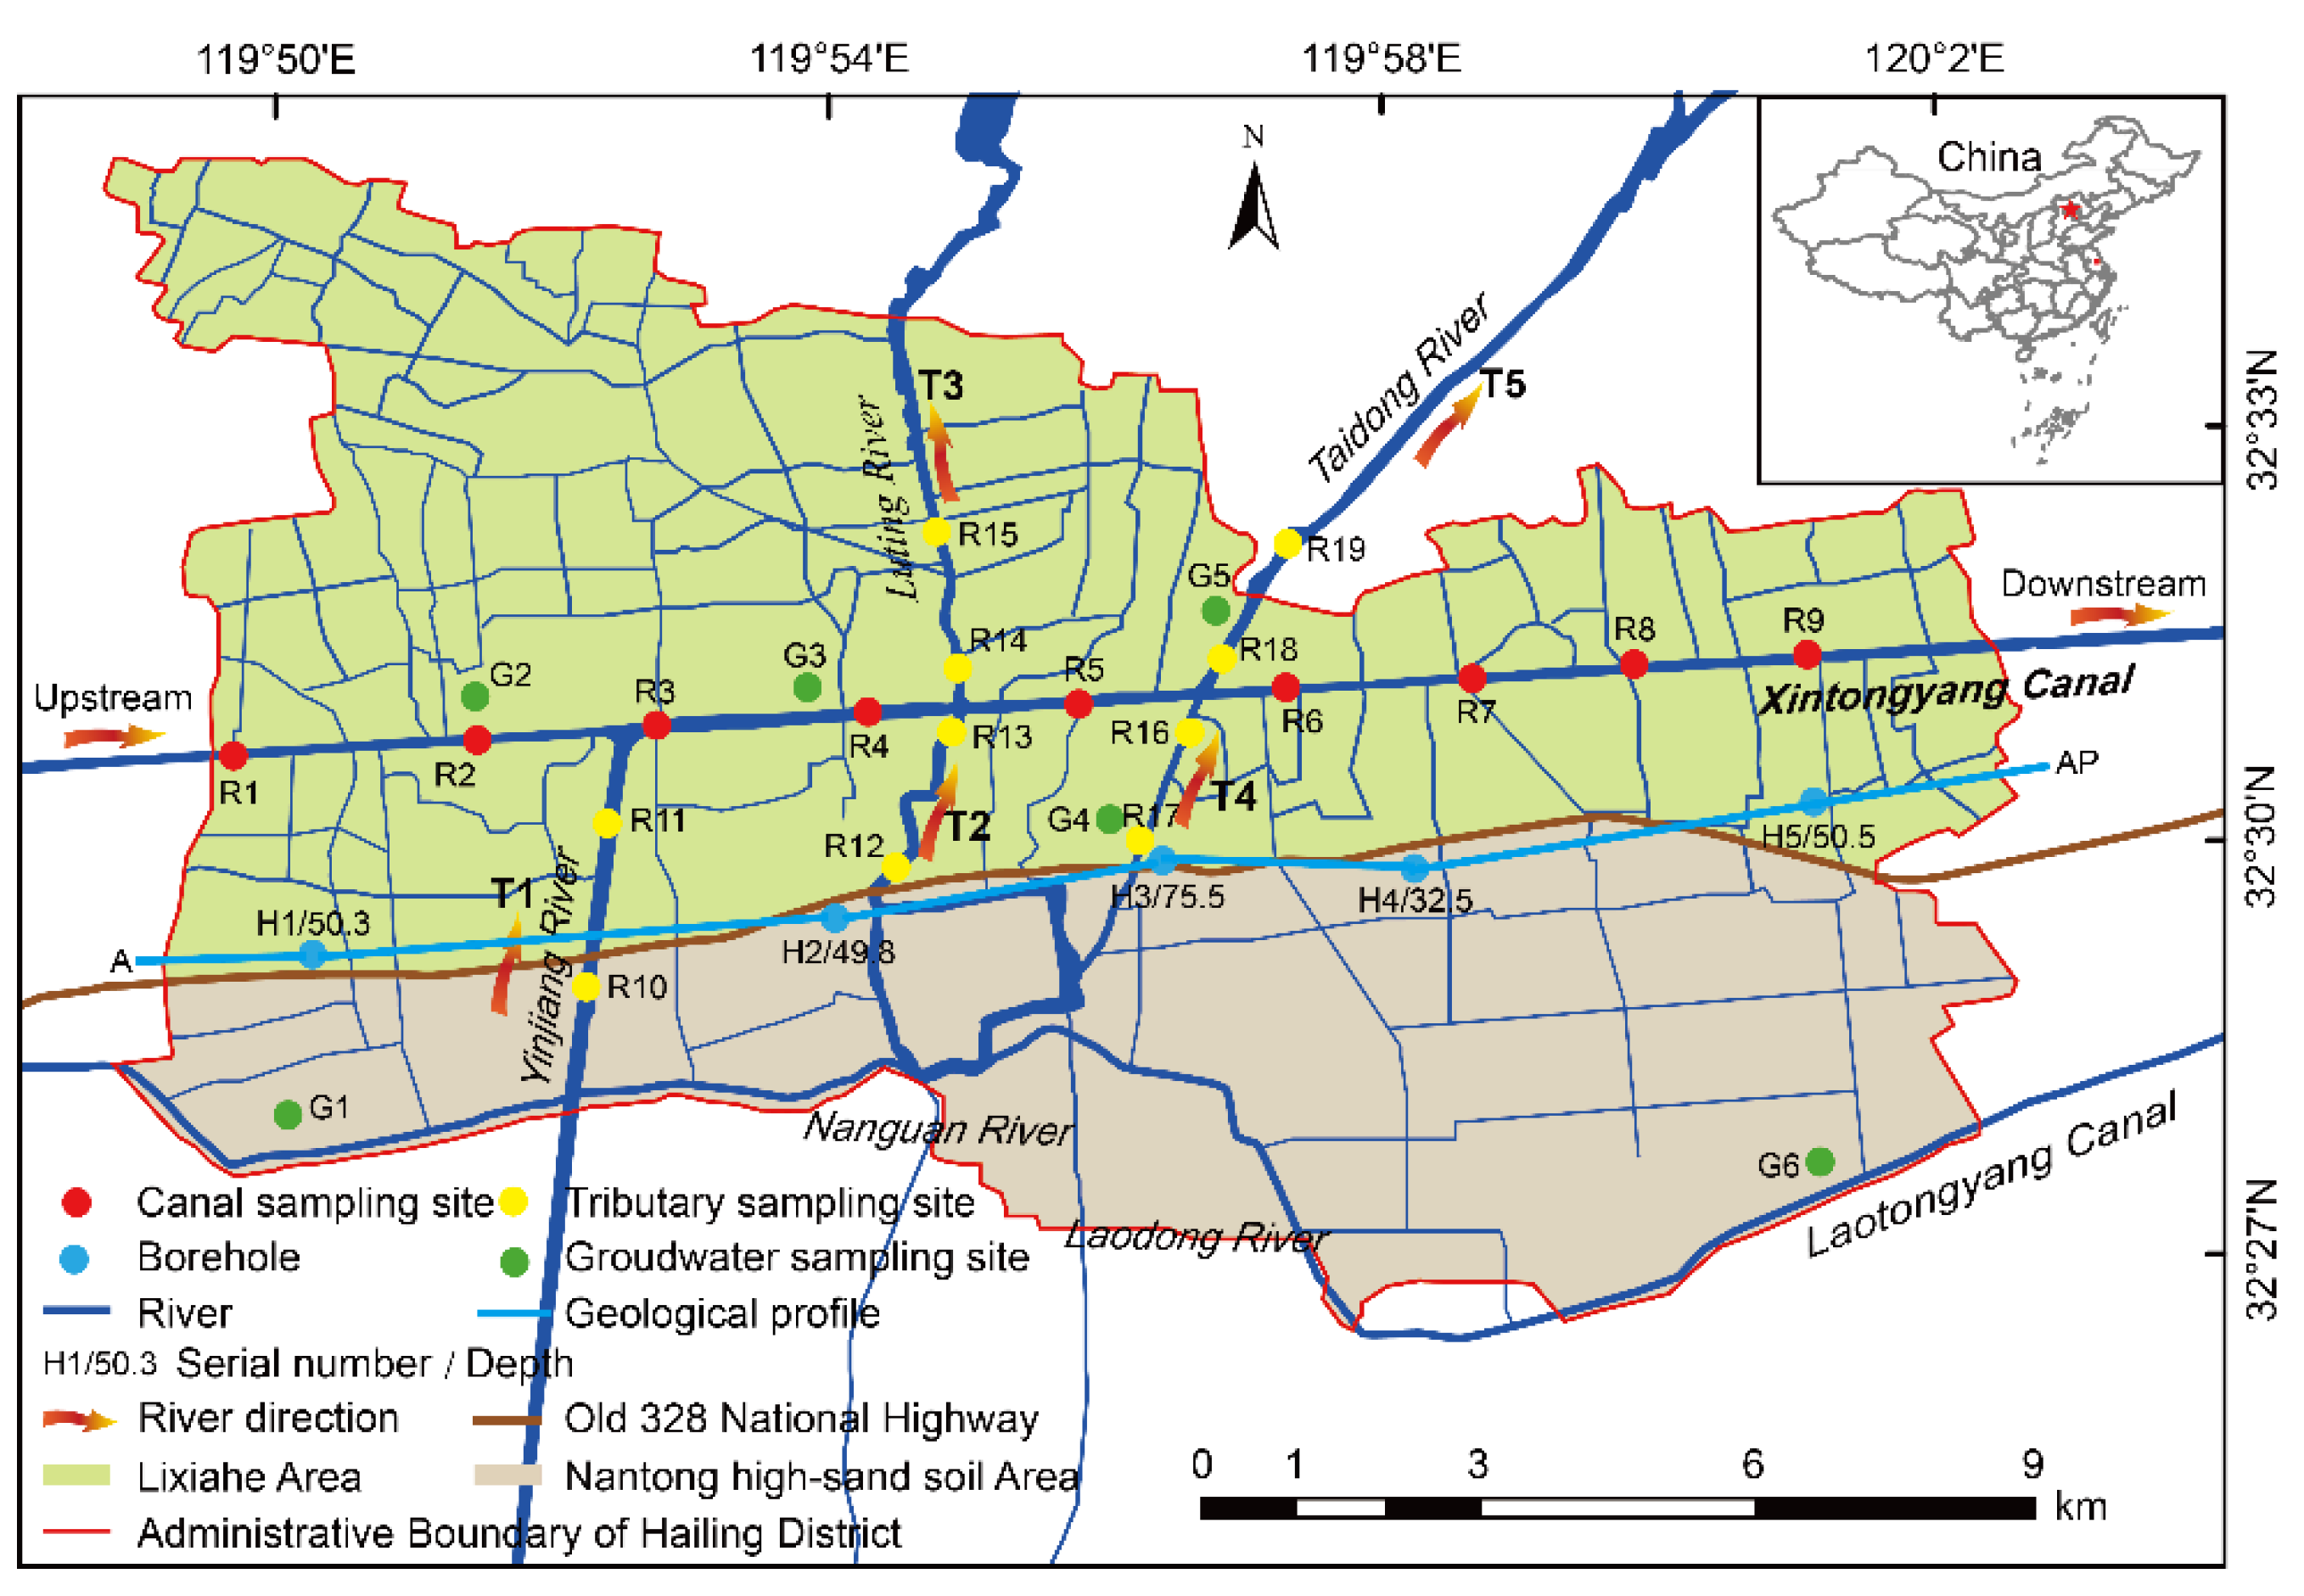
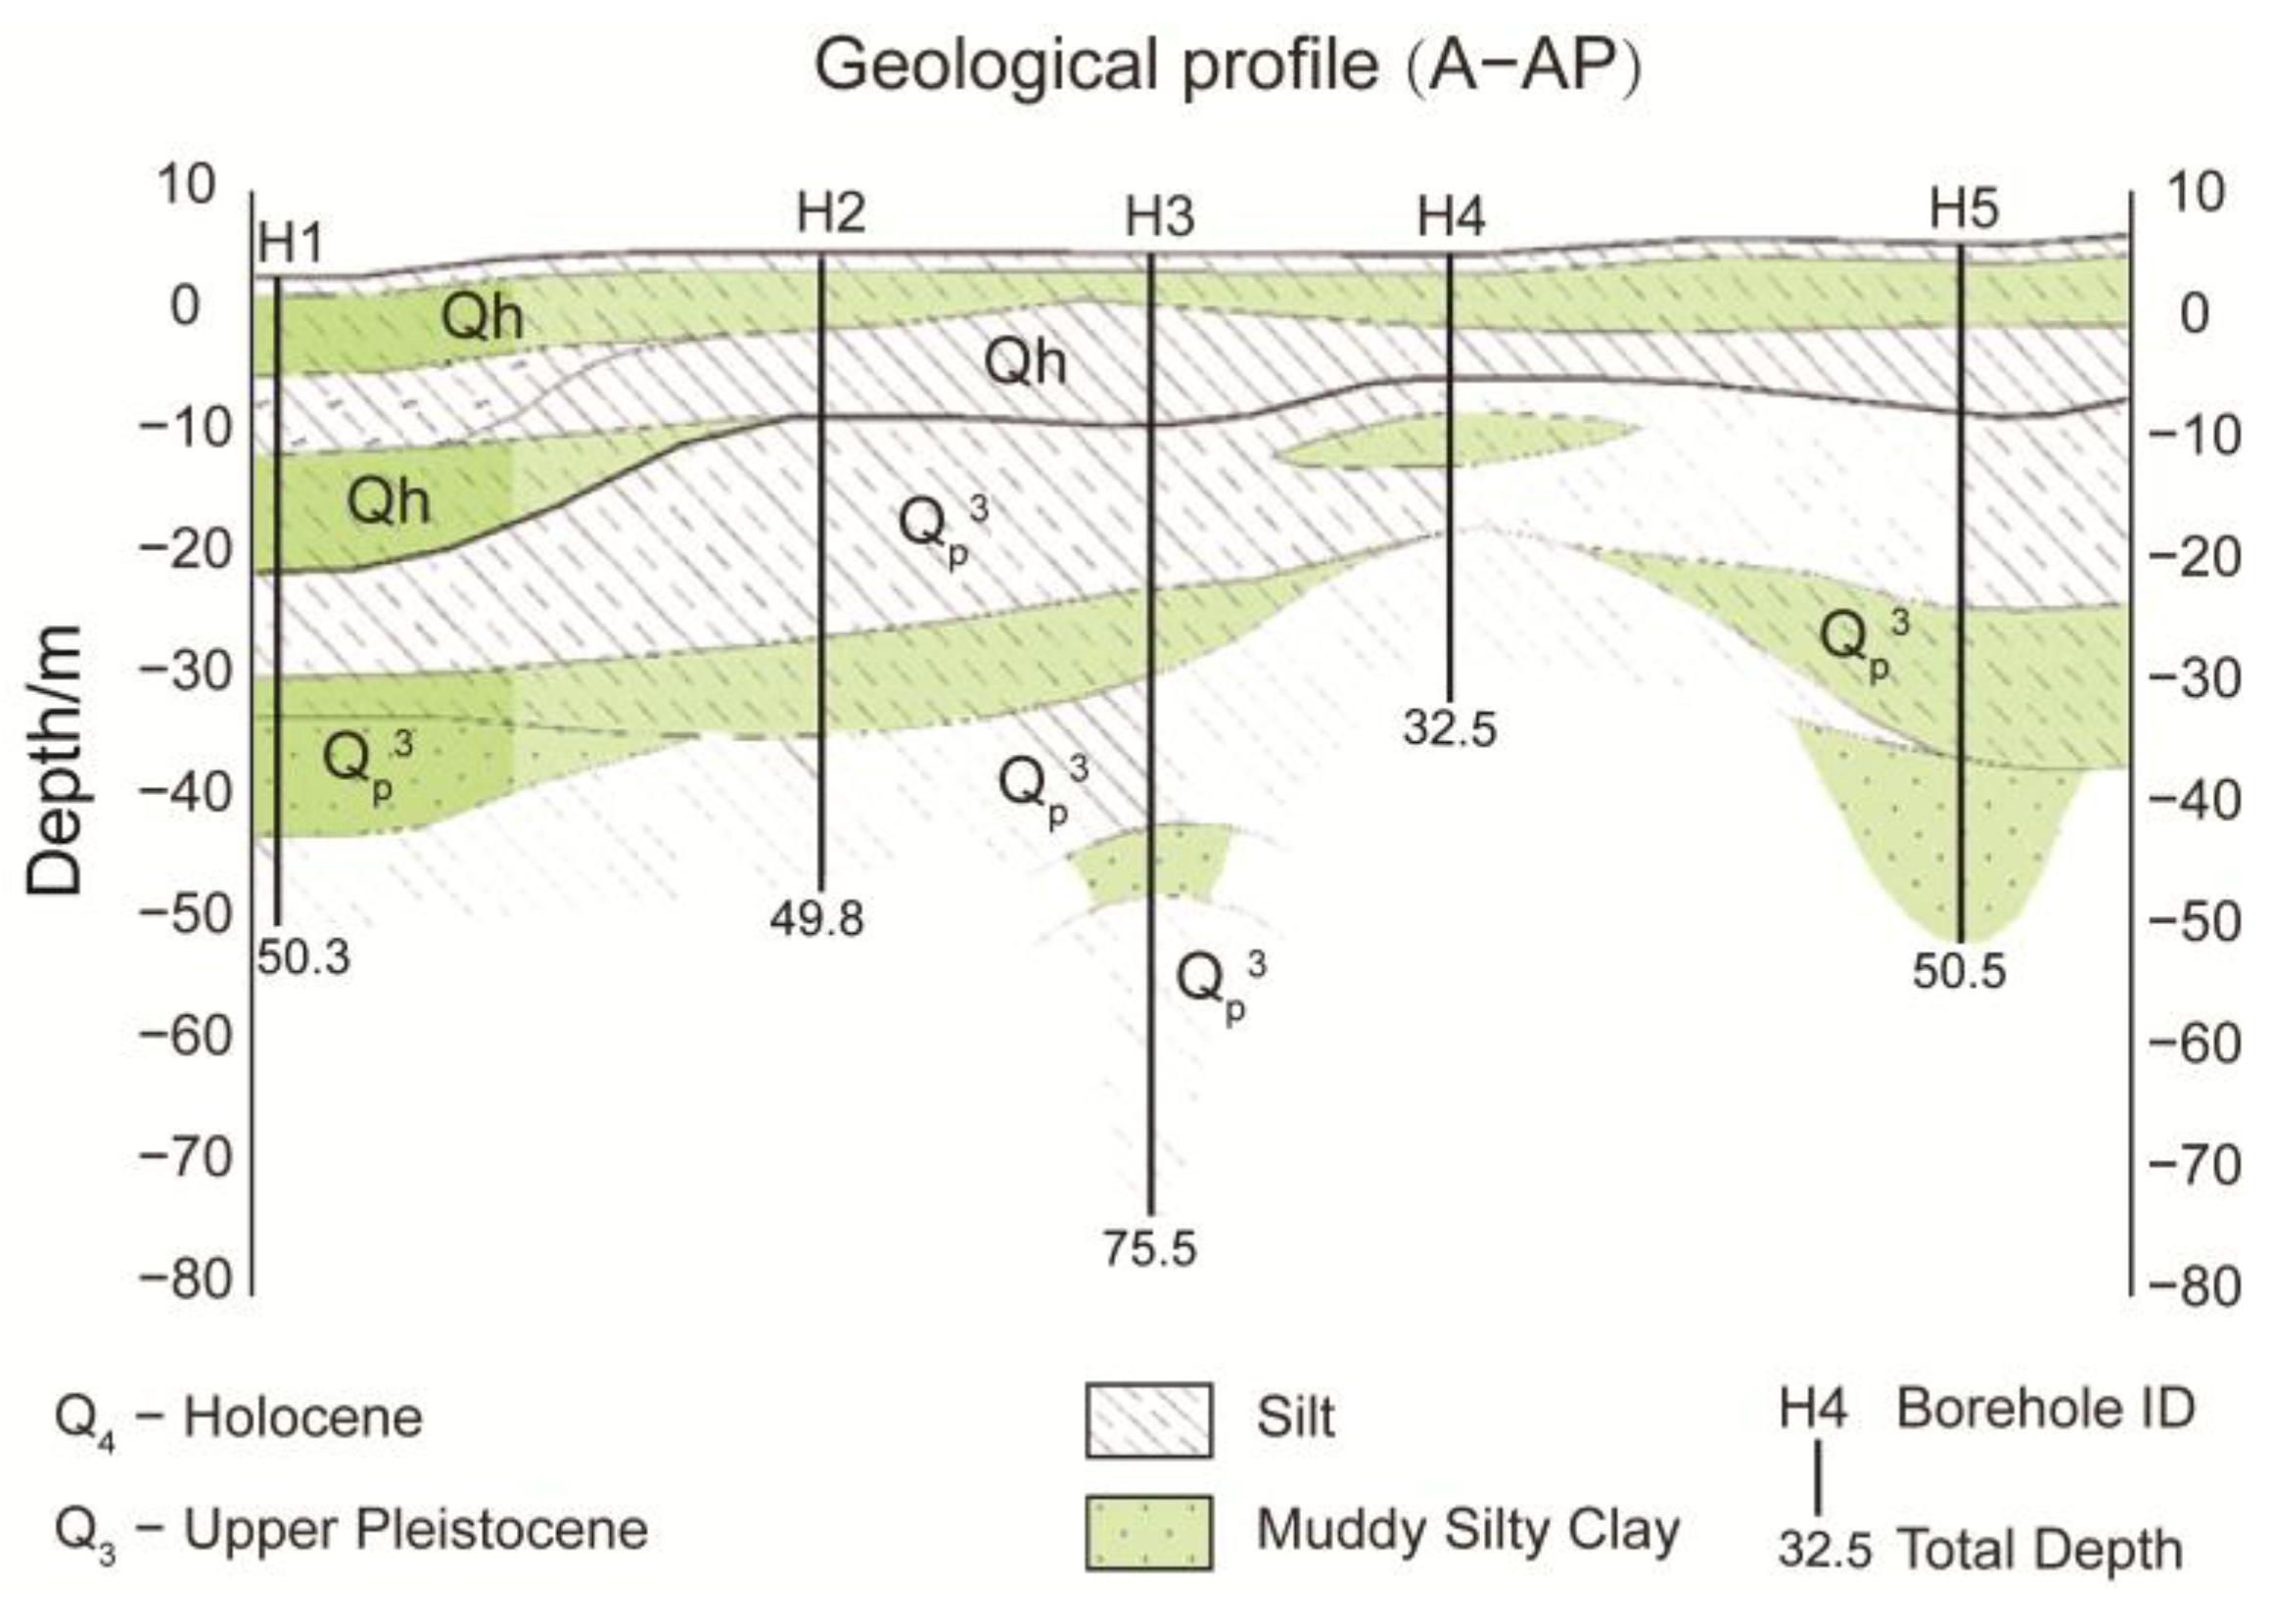
2.1. Site Description

The 21.7 km long Xintongyang Canal crosses the Taizhou alluvial plain (32°27′–32°34′ N and 119°48′–119°59′ E) in Jiangsu Province (Figure 1). The canal’s width and depth vary, at 80~190 m and 3.2~8.2 m, respectively. The canal, constructed in the 1950s with brick-lined sidewalls and a channel bed composed of sandy-clay soils, exhibits severe structural deterioration in its revetments due to six decades of hydrological aging and environmental stress. The canal is located at the confluence of the Yangtze and the Huai River systems and slopes from the southwest to the northeast, with an altitude of 5.5 to 7 m below sea level. The canal in the study area consists of five tributaries, of which three are inflow tributaries (T1, T2, and T4) and two are outflow tributaries (T3 and T5) (Figure 1). The flow of the tributaries is small, with an average velocity of 0.12 m/s. The directions of the tributaries are marked by arrows in Figure 1. A dense river network, which has complex interactions between groundwater and surface water, transects the alluvial plain area. There are few hydrologic studies related to the canal, and there is no long sequence flow dataset. Data on hydraulic gradient and hydraulic conductivity of aquifers in the area are also sparse. The alluvial plain is composed of Quaternary clastic materials (dominated by sand and mud) overlying weathered bedrocks. These aquifers control the hydrogeological conditions.
The study area’s hydrogeological architecture is controlled by deltaic facies associations, comprising interbedded sands and clays that form a multi-aquifer system with anisotropic permeability (Figure 2). The groundwater hydraulic gradient is typically within the range of 1 × 10⁻⁴–3.9 × 10⁻⁴ in similar deltaic aquifers, and the aquifer permeability is relatively low (e.g., hydraulic conductivity K ≈ 10−7–10−5 m/s for silt–clay mixtures), such that the groundwater flow is slow [38,39]. The thickness of the unconfined aquifer ranges from 20 to 50 m, and the buried depth of the groundwater is generally between 0.5 and 2.0 m from the ground surface. The bottom of the canal is connected with the adjacent unconfined aquifer and has a close hydraulic exchange. Therefore, this study focuses on the discussion of hydrology exchange between the canal and adjacent unconfined aquifer.
The climate of the study area belongs to the north subtropical humid monsoon climate zone, with four distinct seasons and abundant precipitation. The average annual temperature in the study area ranged from 13.9 °C to 15.7 °C, and the average precipitation and evaporation were 1027.6 mm and 848.53 mm, respectively. Southeasterly winds prevail throughout the year, with a perennial average wind speed of 3.4 m/s. Monthly precipitation in the study area during the sampling period is shown in Figure 3. In general, there is a peak of rainfall from May to September, with the maximum rainfall in July being 241 mm.

2.2. Sampling Methodology

Field measurements and water sampling campaigns along the canal and its tributaries (Figure 1) were conducted on four dates in 2022 (13 January, 31 March, 20 July, and 7 September) to capture seasonal variations in hydrological characteristics. Nineteen surface water samples and six groundwater samples were collected in each season (Table 1). Due to the complicated field conditions, the surface water sampling interval is about 2 to 3 km. In order to reduce the randomness and uncertainty of sampling, we conducted sampling experiments at multiple sites and selected some representative sampling points for calculation and discussion. At each sampling site, water samples were collected through a sampler at about 50 cm below the water surface, near the center of the canal cross-section (denoted as R samples in Figure 1). Here we assumed that all sources of 222Rn can be mixed instantaneously, and the 222Rn activity in the canal does not change over a short timescale, which means it reaches a stable state. Water samples collected at any point in the canal can represent the average of the section [36]. A similar procedure was used for the tributary water samples. Groundwater was sampled from wells in the unconfined aquifer (denoted as G samples in Figure 1). Groundwater sampling points are located within 2 km of the canal. All monitoring wells are fully penetrating, with screen tops positioned ≥1.5 m below the mean water table and screen lengths covering 75% of the aquifer thickness. Before sampling, about three times the well volume of groundwater was pumped by a submersible pump to ensure that all of the “old” groundwater in the well was removed. Therefore, the sampled groundwater from wells was actually “fresh” groundwater and hence representative for the aquifer. The groundwater samples were stored in 1000 mL PVC bottles, which were overflowed and tightened quickly to prevent contact with the air after sampling. These groundwater samples from unconfined aquifer wells nearby canal and tributaries were used to calculate the mass balance model.
The quantification of dissolved 222Rn in aqueous samples was performed using a RAD7 portable radon detector equipped with the RAD H2O accessory (Durridge Company, Billerica, MA, USA), which facilitates efficient radon extraction via a closed-loop aeration system. The core function of the system is to transfer radon from the water phase to the gas phase by dynamic aeration, which is then detected by a semiconductor alpha spectrometer. The detection range of RAD7 is 3.7–750,000 Bq/m3 (0.1–20,000 pCi/L) with a relative uncertainty of ±0.5 cpm, and its sensitivity is comparable to or better than that of the liquid scintillation method. All 222Rn activities reported herein represent water-phase activities expressed in Bq/m3, unless otherwise specified. Since the half-life of 222Rn is only 3.8 days, most samples are analyzed within a few hours after collection to reach an acceptable activity value. The mean delay time between sampling and measurement was about 6~12 h. Decay correction factor (DCF) was used to cover the period between sampling and measurement and is given by the formula DCF = EXP (T/132.4), where T is the decay time in hours [40].
During the sampling process, the longitude and latitude of the sampling points were recorded through the handheld GPS (eTrex 20, Garmin International Inc., Olathe, KS, USA). Parameters such as conductivity (EC), pH value, and water temperature were measured in situ (PHH-7200, OMEGA Engineering Inc., Norwalk, CT, USA). Data such as wind speed, temperature and relative humidity (RH) were collected on-site by the OMEGA multi-functional environmental meter (RH87, OMEGA Engineering Inc., Norwalk, CT, USA). The water flow velocity was measured by ADCP (Teledyne RD Instruments, Poway, CA, USA). The water depth of the canal was measured using a hydrological echo sounder (Syqwest Inc., North Falmouth, MA, USA). The geometric dimensions of each sampled section were estimated using remote sensing images from Landsat (http://www.gscloud.cn/, accessed on 13 January 2022). Other details of the canal (slope ratio and bottom width) were obtained from the government’s water department. The dataset on rainfall in the study area was obtained from the website of the National Meteorological Science Data Center (http://data.cma.cn/site/index.html, accessed on 19 March 2023).

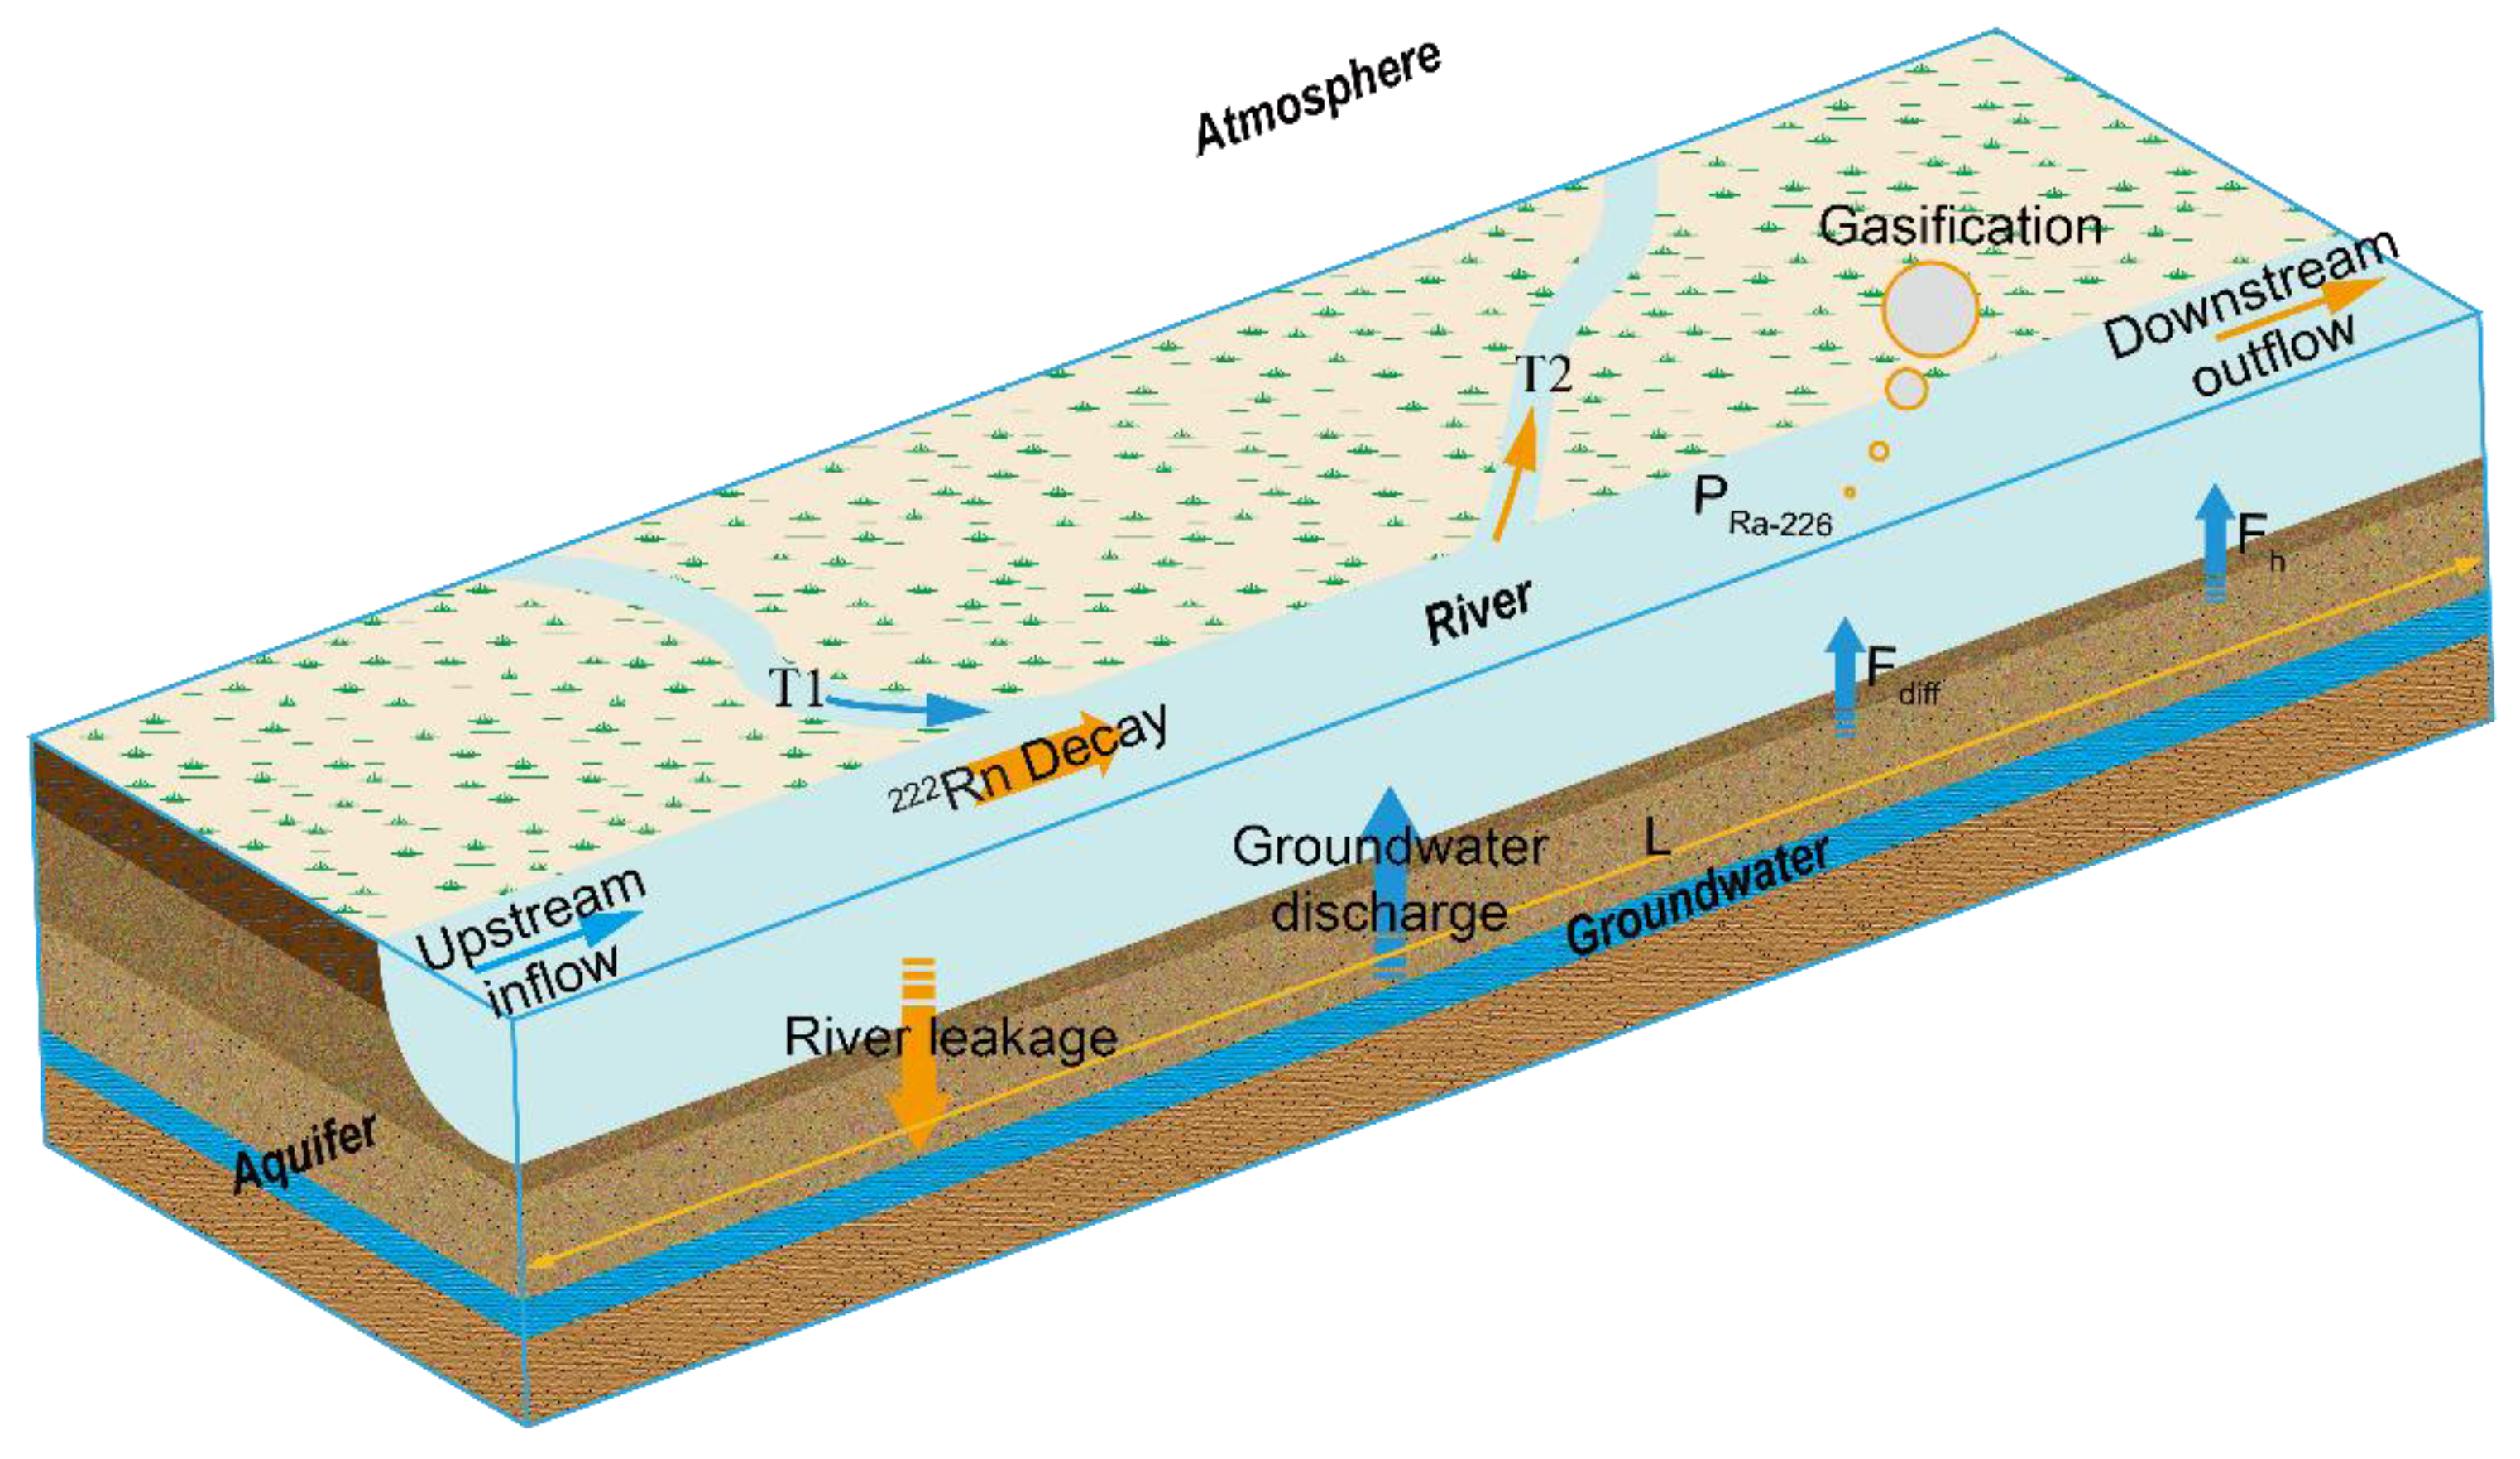
3. Modelling Methods

The flux of hydraulic exchange between groundwater and surface water was calculated by an improved 222Rn mass balance method. It is a mass balance model for radon in a river section, which takes into account all sink and source terms of 222Rn. A certain section of the canal is taken as the case object (Figure 4) to establish a 222Rn mass balance model with all source and sink terms required to be determined. 222Rn sources consist of several parts: (1) 222Rn activity from upstream inflow; (2) 222Rn activity due to in situ production from dissolved radium (here refer to 226Ra) and diffusion from sediment of the canal bed; (3) 222Rn activity derived from potential groundwater discharge; (4) 222Rn activity from hyporheic exchange of the canal bed sediments; and (5) 222Rn activity from inflow tributaries. 222Rn sinks include several pathways: (1) loss of 222Rn activity due to downstream outflow; (2) loss of 222Rn activity by atmospheric evasion; (3) loss of 222Rn activity from potential canal leakage; (4) 222Rn decay; and (5) loss of 222Rn activity due to outflow tributaries.
The detection of abnormally high 222Rn levels in the canal water is usually considered as a sign of groundwater discharge into the canal [41]. Due to the rapid mixing of 222Rn in water bodies, we consider that discharge of groundwater is rapidly mixed with the canal water, which increases the 222Rn activity in the canal. The vertical stratification and cross-section distribution of 222Rn activity are ignored here. The measured value of the collected water samples represents the 222Rn activity of the river section. It is assumed that the 222Rn inventory in river sections is a specific value without considering the influence of rainfall events. The sources and sinks of the section reach a stable state.
According to the mass conservation assumption of 222Rn in the canal, a 222Rn mass balance model in a one-dimensional stable state can be established to calculate the interaction between groundwater and canal water [34,42,43]. However, the model constructed by Su et al. [42] does not consider the impact of tributaries on the hydraulic exchange, especially when multiple tributaries cross each other. Yi et al. [43] analyzed the impact of tributaries on rivers; however, the model is only applicable to the situation of groundwater discharge into rivers. Moreover, Yi’s model does not consider the influence of hyporheic exchange, which may cause a large groundwater discharge or a small canal leakage estimate. In contrast to that model, other models do incorporate the hyporheic exchange [31].
Hyporheic exchange occurs between the water flow and the sediments in the canal. The area where hyporheic exchange occurs is called the hyporheic zone. The hyporheic zone will release a lot of 222Rn activity with canal water passing through; this process increases 222Rn activity in the canal water but does not affect the flux [36]. It is rather difficult to accurately estimate the effects of hyporheic exchange [42]. However, the relevant experiments about hyporheic exchange in this study were not completed, and thus we will use the “background” 222Rn activity to accommodate the influence of the hyporheic exchange [44,45].
In the absence of groundwater discharge, 222Rn activity in the canal water is generally close to a small value. Non-groundwater sources of 222Rn include sediment diffusion, 226Ra decay, and hyporheic exchange in the 222Rn mass balance model. Therefore, the lowest value of 222Rn activity in a section of a tributary or the canal in different seasons can be used as a “background” indicator and is expected to represent 222Rn from sources other than groundwater. Here, we assume that the difference of contribution from riverbed to overlying water on the spatial scale is ignored, and the “background” activity of 222Rn (Cb) in the canal to be constant in different seasons. In the absence of groundwater discharge, the 222Rn activity in surface water reaches its minimum value, corresponding to the background level. Therefore, our model calculations subtract this “background” activity from measured values to quantify both canal leakage and groundwater discharge.
Considering the influence of high-flow tributaries on the canal, we have added the effects of tributaries to the 222Rn balance model as follows:
When Q u + i = 1 n Q I i < Q d + j = 1 n Q O j ,   C u < C d , assuming that the major type of interaction is groundwater discharge, then the mass balance model of 222Rn can be approximated as
Q d ( C d C b ) = Q u ( C u C b ) e α L + 0 L q g C g e α x d x + T
where q g represents the calculated average flux per unit length of groundwater discharge to the canal [m3/(s·m)]. Q u and Q d stand for the water fluxes at the upstream and downstream sampling sites, respectively [m3/s]; C u , C d , and C g represent the 222Rn activity measured at the upstream and downstream sampling sites and groundwater, respectively [Bq/m3]; C b denotes the “background” activity, defined as the equilibrium 222Rn activity without groundwater discharge [Bq/m3]; and α refers to the total loss coefficient [m−1]. L stands for the distance between upstream and downstream sampling sites [m]; x represents the distance from the site where exchange occurs at the downstream sampling site, which is a continuous variable [m]; T refers to the variation of 222Rn activity in the canal that is caused by all tributaries’ input between the upstream and downstream [Bq/s]; Q I i and Q O j stand for the water fluxes at the No.i inflow and No.j outflow tributary, respectively [m3/s]; C I i is the 222Rn activity at the inflow tributary [Bq/m3].
When Q u + i = 1 n Q I i > Q d + j = 1 n Q O j ,   C u > C d , it is regarded as a canal leakage, then the mass balance model of 222Rn can be approximated as
Q d ( C d C b ) = Q u ( C u C b ) e α L 0 L q r ( C u C b ) e α L x d x + T
where q r represents the calculated average flux per unit length of the canal leakage [m3/(s·m)].
When Q u + i = 1 n Q I i > Q d + j = 1 n Q O j , C u < C d   o r   Q u + i = 1 n Q I i < Q d + j = 1 n Q O j , C u > C d , the interaction between the canal and the groundwater is complex, where canal leakage and groundwater discharge occur simultaneously, leading to a mass balance model of 222Rn approximation as
Q d ( C d C b ) = Q u ( C u C b ) e α L + 0 L q g C g e α x d x 0 L q r C u + C d 2 C b 2 e α L x d x + T
Because Equation (3) is difficult to solve, it is necessary to combine the water balance model as follows:
Q d = Q u + ( q g q r ) L
In Equations (1)–(3), ∆T refers to the effect of all the confluence of inflow and outflow tributaries on the canal, such that
T = i = 1 n Q I i C I i e α x i j = 1 n Q O j C u e α L x j
where x i and x j refer to the distance between the confluence of the No.i inflow and No.j outflow tributary and the downstream sampling site [m]. For instance, sampling points such as R14 and R18 of tributaries are directly involved in the calculation, and R15 and R19 of tributaries are for reference.
The left side of Equations (1)–(3) represents the 222Rn activity detected downstream without groundwater discharge. The right-hand terms in Equations (1)–(3) characterize the 222Rn activity components as follows: the first term represents the upstream-originated 222Rn activity unaffected by groundwater discharge; the second term in Equations (1) and (2) corresponds to groundwater discharge into tributaries and lateral leakage loss, respectively, while in Equation (3) the second and third terms describe groundwater discharge and canal leakage loss; the final term (ΔT, common to all equations) quantifies tributary inflow/outflow effects on canal 222Rn activity.
As the conceptual model of the actual case of the canal and groundwater interaction is visualized, several hypotheses are considered in the model, including the following: (1) the change of water flux and 222Rn activity in the canal were used to examine the change of source and sink; (2) sampling days with precipitation were avoided, which would have increased the difficulty of sampling and the uncertainty of 222Rn activity in water; and (3) due to the short sampling period, the effect of evaporation on the system was ignored.
Equations (1)–(3) correspond to three different types of surface water and groundwater interaction, respectively. When the solute (222Rn) is characterized by decay and degassing, the total solute loss due to radioactive decay and degassing needs to be considered [46]. The representation of this assumption in the 222Rn mass balance model is shown by Equation (6), where α refers to the total 222Rn loss coefficient, including radioactive decay and degassing:
α = β + γ
whereas β refers to the decay coefficient related to the average velocity of the canal (m−1), and γ represents the loss coefficient caused by degassing (m−1). β can be calculated as follows [42]:
β = λ R n v
The decay of 222Rn per unit time is related to the average flow velocity because the actual velocity is variable. Therefore, the upstream and downstream average velocity is generally taken to be a constant in the canal. λ R n is the radioactive decay coefficient of 222Rn,   λ R n = 2.08 × 10 6   s 1 ; v is the average flow velocity (m/s) of the canal, which determines the time from upstream to downstream.
Many models can be used to evaluate the 222Rn exchange between air and canal water due to degassing [47,48]. We consider here the surface renewal model to calculate the loss of 222Rn activity caused by the turbulent gas exchange in the canal. The degassing loss coefficient can be expressed as follows [49]:
γ = D 0.5 v 0.5 h 1.5
l o g D = 980 T a i r + 273.15 + 1.59
where D means the molecular diffusion coefficient for gas (m2/s); v is the average flow velocity (m/s); h refers to the average depth of the canal (m); and T a i r represents the air temperature (°C).
Substituting Equation (4) into Equations (1)–(3) and the integral method were used to solve the problem, respectively. The following analytical solutions can be obtained:
q g = Q d ( C d C b ) Q u ( C u C b ) e α L i = 1 n Q I i C I i e α x i + j = 1 n Q O j ( C u C b ) e α L x j C g · α 1 e α L
q r = Q d ( C d C b ) Q u ( C u C b ) e α L i = 1 n Q I i C I i e α x i + j = 1 n Q O j ( C u C b ) e α L x j C u C b · α e α L 1
q g = 2 α ( Q d ( C d C b ) Q u ( C u C b ) e α L i = 1 n Q I i C I i e α x i + j = 1 n Q O j ( C u C b ) e α L x j ) ( 1 e α L ) ( 2 C g C u C d + 2 C b ) C u + C d 2 C b Q d Q u L 2 C g C u C d + 2 C b q r = 2 α ( Q d ( C d C b ) Q u ( C u C b ) e α L i = 1 n Q I i C I i e α x i + j = 1 n Q O j ( C u C b ) e α L x j ) ( 1 e α L ) ( 2 C g C u C d + 2 C b ) 2 C g ( Q d Q u ) L ( 2 C g C u C d + 2 C b )
To cross-validate the 222Rn mass balance model, a flow balance analysis was implemented to quantify river–groundwater interactions. The net water flux (Equation (13)) determines the magnitude of exchange, with its sign (+/−) indicating the direction of water flux (groundwater discharge to the river or recharge to the aquifer).
q = Q u Q d + i = 1 n Q I i j = 1 n Q O j L

4. Results and Discussion

4.1. 222Rn Activity in the Canal and Groundwater

The 222Rn activity data of the canal and groundwater measured by multiple sampling are shown in Table 1. The four sampling times correspond to autumn, winter, spring, and summer, respectively. The range of 222Rn activity measured in the canal during the four sampling periods was 415~2425 Bq/m3, 291~2912 Bq/m3, 847~3435 Bq/m3, and 260~2789 Bq/m3, respectively. The boxplot of 222Rn activity of canal water and groundwater in the study area is shown in Figure 5. This reflects the dispersion degree of surface water and groundwater in the different sampling periods. 222Rn activity of the canal reached the highest value in spring, which was 3435 Bq/m3. The water 222Rn activity was generally lower in summer and autumn; this is attributed to dilution by precipitation and degassing by high temperature [48].
According to the source and sink terms in the radon balance model, the 222Rn activity in surface water is mainly affected by factors such as precipitation and groundwater discharge. Seasonal analysis reveals surface water 222Rn activities follow spring > winter > autumn > summer. The monthly precipitation variation within the year shows the greatest in summer and the least in winter. Therefore, the abundance of water in summer and autumn dilutes the radon in canal water, resulting in a low 222Rn activity. Notably, early September sampling coincided with the transitional period between summer and autumn, resulting in no significant difference in 222Rn activity between these seasons. In contrast, spring exhibits markedly higher 222Rn activities compared to autumn despite reduced rainfall, demonstrating that groundwater discharge contributions dominate over precipitation-driven dilution during this season.
The 222Rn activity of groundwater within one hydrologic year indicates a variation range from 11,366 Bq/m3 to 45,985 Bq/m3 (Table 1), which is 1–2 orders of magnitude higher than that of surface water. The reasons for the low 222Rn activity of groundwater in summer may come from two aspects. On the one hand, rainfall in summer accounts for 48.95% of the annual rainfall, and sufficient rainfall diluted 222Rn activity in the canal water and groundwater. On the other hand, the frequent exploitation of groundwater by residents in summer accelerates the regeneration rate and shortens the water–rock interaction time, which is also one of the reasons for the low 222Rn activity in groundwater in summer. Groundwater is the carrier of 222Rn in aquifers. The 222Rn activity of groundwater is lower in winter, which is primarily attributed to dilution from canal water recharge, with a secondary contribution from colder temperatures enhancing radon solubility and suppressing its degassing from water to air. In spring and autumn, as the recharge of surface water to groundwater is weakened, 222Rn activity is relatively high.
The dynamic variation of 222Rn activity in the canal water arises from continuous changes of local hydrological sources and sinks along the canal section, reflecting the hydraulic exchange process between surface water and adjacent aquifers. Therefore, defining the variation of 222Rn activity in the canal can indirectly reflect the change of sources and sinks. In the calculation of the 222Rn mass balance model, the whole canal is divided into four sections according to the distribution of sampling points.
The length of the first section (from the sampling points R1 to R3) is about 4650 m. The first section is connected with a T1, which is an inflow tributary. The second section (from sampling points R3 to R5) is 4510 m in length and contains two tributaries, T2 and T3. Among them, tributary T2 is the source of this section, and tributary T3 is the sink. The third section (from sampling points R5 to R7) with a length of 4890 m contains two tributaries, T4 and T5. Among them, T4 is the source of this section, and T5 is the sink. The length of the last section (from sampling points R7 to R9) is 3520 m.
The variation of 222Rn activity along the canal is shown in Figure 6. It can be seen from Figure 6 that 222Rn activity along the canal varies greatly in different seasons, indicating that there are frequent interactions between groundwater and canal water. The results of four seasons show that the 222Rn activity of the canal water in spring was higher than that in other seasons. The highest 222Rn activity (3335 Bq/m3) occurs at the sampling site R3, and the lowest (260 Bq/m3) was in summer and also at sampling site R5.
The variation of 222Rn activity along the canal in different seasons suggests that hydraulic exchange between groundwater and canal water may vary seasonally, which will be quantitatively calculated later. Besides, part of the variation in 222Rn activity may also be related to changes in weather conditions (air temperature and wind speed) of the different seasons [42,48]. High temperatures and high wind speeds in summer and autumn increase the degassing of 222Rn in the canal, reducing 222Rn activity. This feature is shown by the relatively consistent 222Rn activity in autumn and spring. The higher 222Rn activity in spring suggests discharge of groundwater to the canal. However, the higher water temperature in September promoted the active release of 222Rn from the water surface and thereby reduced activity in the autumn season. The variation of 222Rn activity along the canal in January indicates a rather stable range. The low temperature had likely reduced groundwater inflow and gas releases from the water surface.

4.2. The Effect of Hyporheic Exchange

In the 222Rn mass balance model calculation, the hyporheic exchange is a factor affecting 222Rn activity but is not an easily measured parameter. 222Rn activity of the surface water is expected to be close to the minimum value when there is an insignificant groundwater effect. Therefore, we consider the lowest activity of the discrete 222Rn measurements to represent the isotope activity of the surface water without a groundwater source. This parameter is also referred to as the “background” activity of 222Rn and is considered to reflect the hyporheic exchange to the canal.
The sources of the “background” 222Rn activity include sediment diffusion, 226Ra decay, and hyporheic exchange. A “sediment equilibrated” test was performed to analyze the effect of 226Ra decay in the canal bed sediments (sediment diffusion) [50]. A quantity of 200 g of canal bed sediment and 300 mL of canal water were sealed in a 500 mL conical flask. The conical flask was placed on a cyclotron vibrator and cultured continuously for 4 weeks. Both 226Ra and 222Rn in pore water and overlying water reached radioactivity equilibrium in 4 weeks. The contribution of sediment diffusion can be obtained by measuring the 222Rn activity in the overlying water. Since the equilibrium value of 222Rn measured in the experiment was low (46 Bq/m3), the effect of sediment diffusion on the canal water was negligible. Due to the low activity of 226Ra dissolved in the canal, the effects of sediment diffusion and 226Ra decay on the canal water were negligible. Thus, we consider the hyporheic exchange flux is roughly equal to the “background” activity of 222Rn in the canal. It represents the contribution of the riverbed to the overlying water.
The “background” activity of about 260 Bq/m3 was obtained from the field experimental dataset. This value of “background” 222Rn activity is considered constant in the whole canal and at different seasons. The same assumption has also been applied in other studies that have used minimum values as a “background” indicator of 222Rn activity [44,45].

4.3. Estimation of Surface Water–Groundwater Interaction

In the studied sections of the Xintongyang Canal, both flow balance and 222Rn mass balance methods were applied to assess the hydraulic exchange between groundwater and surface water. Canal/tributary parameters used in the calculations are presented in Table 2, with model outputs summarized in Table 3. While the flow balance method quantifies net water flux magnitudes (Equation (13)), it cannot identify the detailed exchange process of individual sections. Conversely, the 222Rn mass balance method describes the groundwater discharge and canal leakage of a specific canal section, resolving the direction of hydraulic exchange and the mixing mechanism.
As can be seen from Table 3, each canal section presents different changes in different sampling periods. The calculation results of the 222Rn one-dimensional steady flow model show that the hydraulic exchange process between canal and groundwater is very complex. Section 1 is characterized by canal leakage in autumn and winter, and groundwater discharge in spring and summer. In Section 2, canal leakage and groundwater discharge occur simultaneously in spring, while canal leakage is the main process in other seasons. Both canal leakage and groundwater leakage occurred in Section 3 in winter and summer, while only canal leakage occurred in spring and autumn. Section 4 is characterized by groundwater discharge in spring and autumn, canal leakage in winter, and both processes exist in summer. Thus, canal leakage and groundwater discharge occur simultaneously in some sections, such as Section 3 during sampling period 2, Section 2 during sampling period 3, and Section 3 and Section 4 during sampling period 4. Overall, the average canal leakage flux (0.0008 m3/(s·m) to 0.0045.5 m3/(s·m)) along the Xintongyang Canal is usually one order of magnitude larger than the average groundwater discharge flux (0.0002 m3/(s·m) to 0.0016 m3/(s·m)).
The fitting of the results calculated by the two models, respectively, is shown in Figure 7. The calculation results of two models in the same section are basically within an order of magnitude during the same season. As shown in Figure 7, most of the green and blue triangles in the same column are close together, which indicates that the quantitative calculation results of these two methods are similar, and it also verifies the reliability of the radon mass balance method. However, there are great differences in the calculation results of individual sections between the two methods. For example, in Section 2 during sampling period 2, the average flux of canal leakage calculated by the 222Rn model and flow model is 0.013 m3/(s·m) and 0.0062 m3/(s·m), respectively. The calculation results are in the same order of magnitude. In Section 2 during sampling period 4, the average flux of canal leakage calculated by the 222Rn model and flow model was 0.0455 m3/(s·m) and 0.0118 m3/(s·m), respectively. The field situation of Section 2 is complex, with the width of Section 2 being 120 m. The wind speed is relatively high at the crossing of tributaries (T2 and T3) and the canal. The degassing of 222Rn is unusually active under the influence of higher wind speeds. Thus, the escape of 222Rn is one of the main sources of uncertainty of the 222Rn mass balance model. It is necessary to reduce measurement error and improve model accuracy in field sampling and laboratory experiments.
When quantifying surface water–groundwater interactions, a comparison of the flow balance model and the 222Rn mass balance model reveals statistically consistent net exchange values between the two approaches. Furthermore, variations in 222Rn activity along the canal provide qualitative evidence of groundwater discharge dynamics. As exemplified by the significant 222Rn activity spikes observed in Reaches 1 and 4 during spring (Figure 6), these spatial anomalies directly indicate localized groundwater exfiltration hotspots, which is consistent with the results of our quantitative calculations. Therefore, through the mutual verification of various methods, the results show that the calculation results are reasonable. It is verified that the 222Rn one-dimensional stable model used in this paper has good operability and can more profoundly reveal the process of groundwater discharge and canal leakage of the alluvial plain.

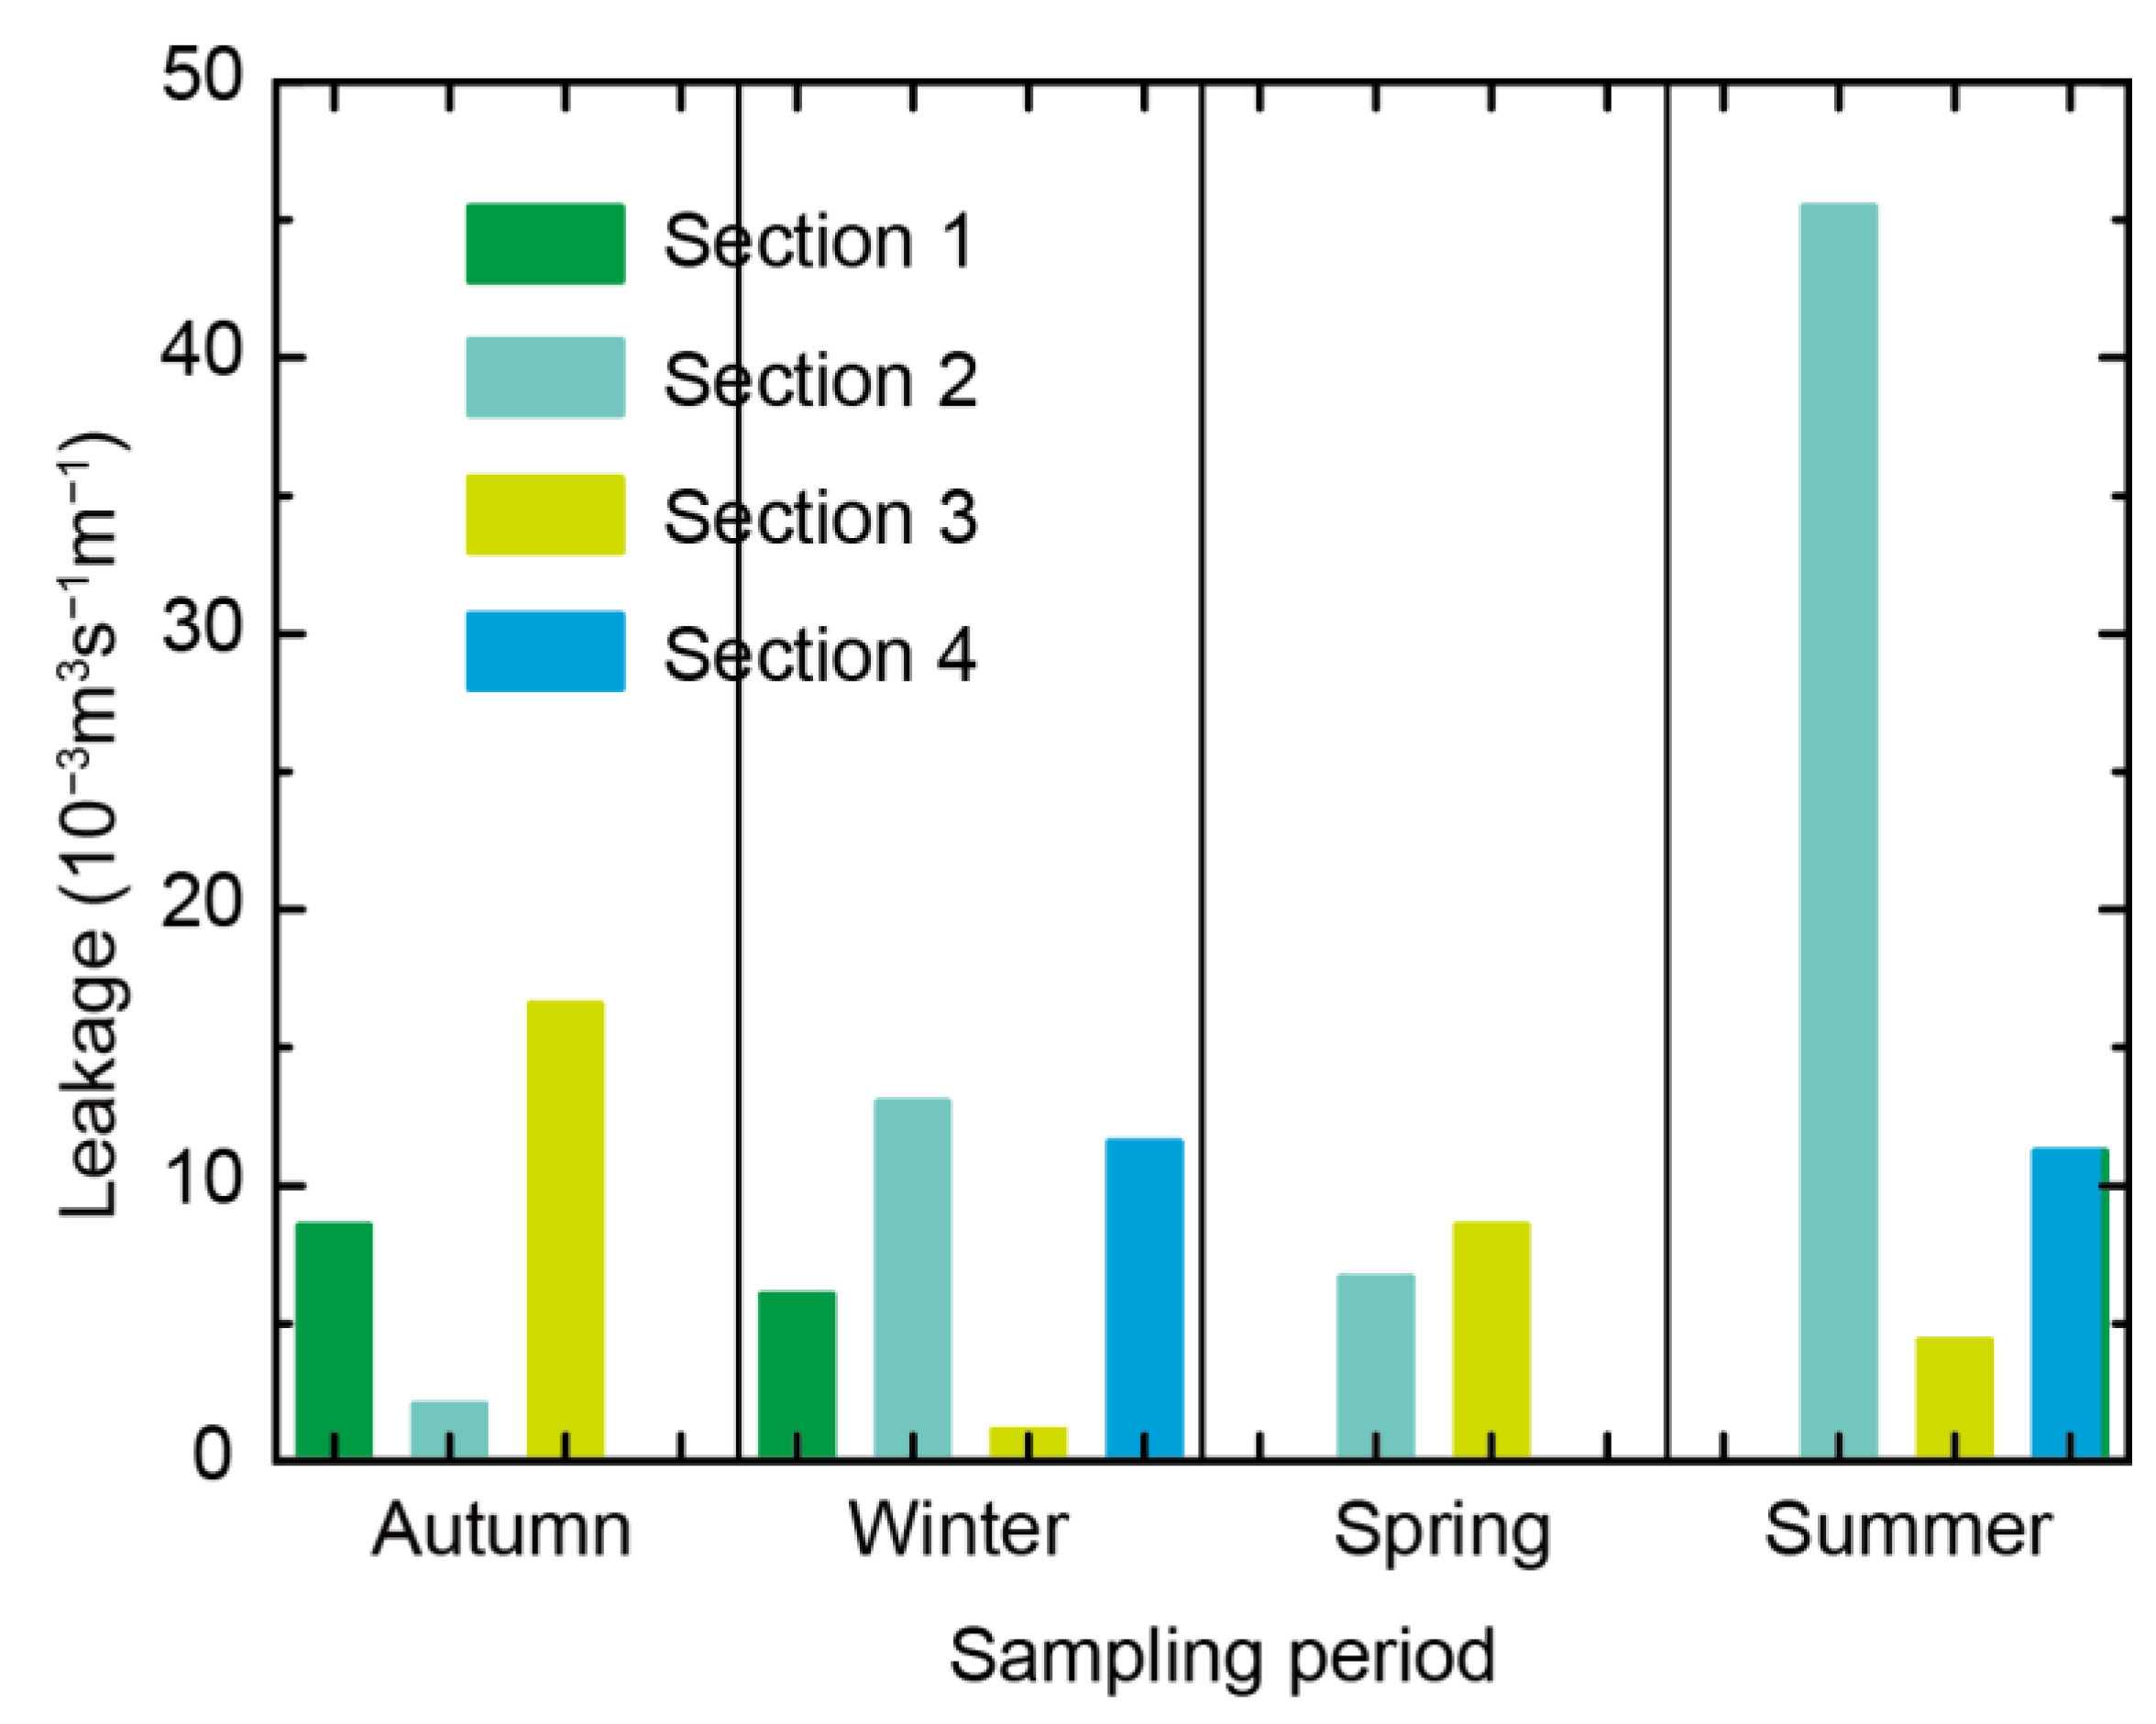
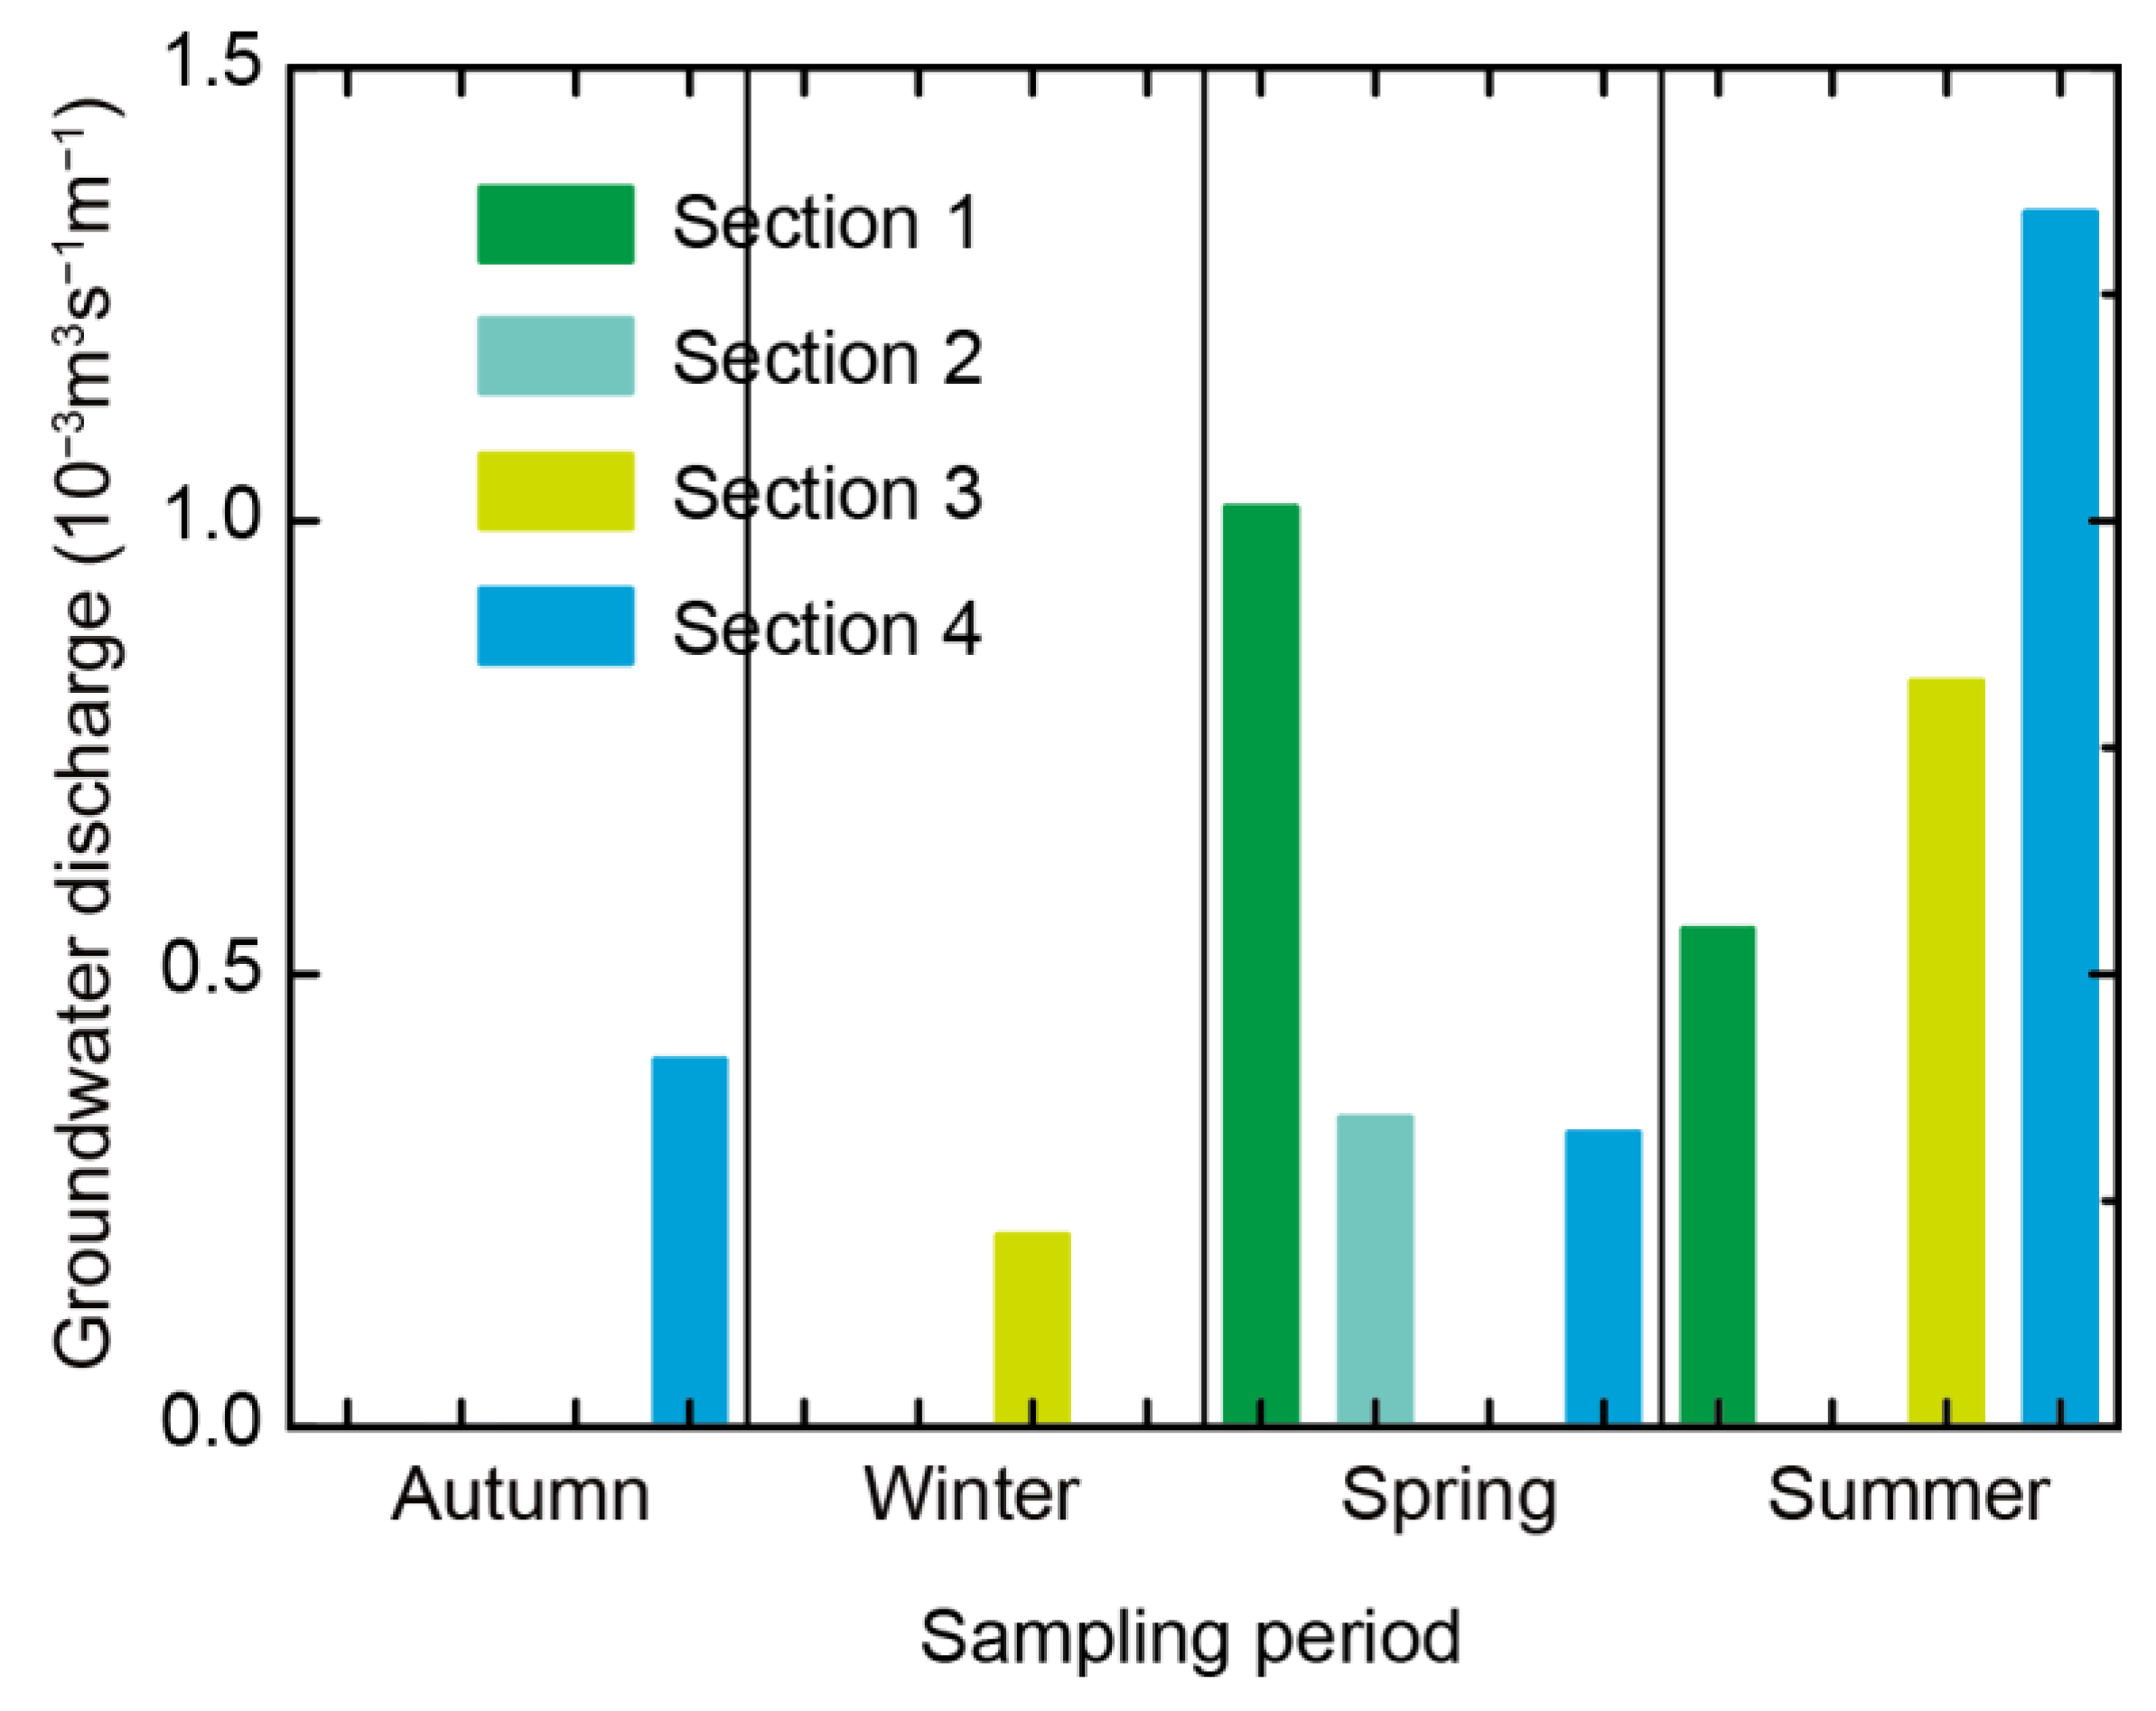
4.4. Seasonal Hydraulic Exchange Between the Canal and Groundwater

Due to the dynamic changes of hydrological conditions [51,52] in different seasons, the interaction between the canal and groundwater is expected to be variable in the different seasons. A sampling period with precipitation was avoided, and 222Rn inventory was considered to be unaffected by rainfall and in a stable state. Consequently, to estimate the specific interaction process of each section of the canal, we compared the change of canal flow and 222Rn activity for the upstream and downstream sections. The parameters of each canal section and tributary are shown in Table 2. The hydraulic exchange between groundwater and the canal water was estimated by the 222Rn balance method, and the results are shown in Table 3.
The results show that the interaction between groundwater and surface water is very complex and has many influencing factors. The types and intensities of hydraulic exchange are different in different seasons and different sections of the canal. The calculation results in Table 3 show that the average flux of canal leakage and groundwater discharge in different sections has seasonal characteristics. It is reflected that the seasonal variation of river leakage is mainly controlled by rainfall and temperature [42,48]. During the process of runoff generation and confluence, rainfall events dilute the 222Rn activity of surface water and groundwater and change the hydraulic gradient of seepage. In winter, lower temperatures induce soil freezing, leading to pore blockage and reduced hydraulic conductivity. Studies demonstrate that frozen layers decrease the lateral hydraulic conductivity of sandy soils from 10−4 cm/s to 10−6 cm/s, thereby inhibiting surface water–groundwater interactions [53]. This process not only reduces river–groundwater interfacial exchange fluxes by over 80% [53], but also increases the response time of hydraulic exchange [53,54]. The calculation results also support this point.
Figure 8 shows the average flux of canal leakage for different sampling periods. The average canal leakage flux of different sections within one hydrologic year indicates a variation range from 0.0011 m3/(s·m) to 0.0455 m3/(s·m). The largest leakage occurred in the second section of the canal in summer, with a maximum value of 0.0455 m3/(s·m). The minimum flux of canal leakage is 0.0011 m3/(s·m), which occurred in Section 3 of the canal in winter. Furthermore, the canal leakage reaches its maximum in summer and its minimum in spring, and the leakage flux within one hydrologic year is in the order of summer > autumn > winter > spring.
The canal leakage is more evident in summer than in other seasons. The rainy period is from mid-June to early July, and the accumulation of rainfall will lead to higher canal levels. Meanwhile, the infiltration of rainfall will also recharge the adjacent aquifer. Due to the influence of groundwater depth and soil permeability, there are evident differences between canal sections. The canal leakage in Section 2 in summer is particularly prominent, which is mainly caused by the inflow of tributary T2, with high 222Rn activity and high flow.
The groundwater discharge along the Xintongyang Canal is less evident than the water leakage. Figure 9 shows the average flux of groundwater discharge in different sampling periods. The average flux per unit length of groundwater discharge in different sections ranges from 0.0002 m3/(s·m) to 0.0013 m3/(s·m). The largest groundwater discharge occurred in Section 4 of the canal in summer, with a maximum value of 0.0013 m3/(s·m). The minimum groundwater discharge flux is 0.0002 m3/(s·m), which occurred in Section 3 of the canal in winter. The difference is that groundwater discharge reaches its maximum in summer and its minimum in winter. The groundwater discharge flux within one hydrologic year is in the order of summer > spring > autumn > winter. Increased precipitation in summer will strengthen the recharge of groundwater, which will promote groundwater discharge in most of the canal sections. In addition to being affected by rainfall, lower temperatures in winter may affect the flux of groundwater discharge. The canal sections where groundwater discharge occurs in autumn and winter were Section 4 and Section 3, respectively. With the increase of temperature in spring, the permeability of the aquifer changes, and the groundwater discharge increases evidently.
Overall, the seasonal hydraulic exchange between the canal and groundwater is complex, which depends on the season and hydrogeological conditions. Considering the heterogeneity of aquifer properties, the hydraulic exchange patterns between the canal and groundwater may vary several times.

4.5. Uncertainty Evaluation

The construction of the 222Rn mass balance model involved critical assumptions and simplifications regarding parameter selection and boundary conditions. For instance, the steady-state approach provides a temporally static representation of the system, which inherently fails to capture the dynamic nature of seasonal variations. While seasonal trends can be inferred, their discontinuous characterization requires iterative sampling campaigns to reconstruct transient hydrological processes across distinct time intervals. Meanwhile, the analysis avoids the influence of precipitation on the model. To improve the accuracy of the model, the disturbance items of the model can be reduced.
The uncertainty of hydraulic exchange flux between the canal and groundwater is determined by the propagation errors of different sources and sinks in the 222Rn mass balance model. The uncertainty of field measurement is an important aspect that affects the reliability of the calculated results.
The following statistical propagation error method is adopted to determine the uncertainty of hydraulic exchange flux calculated by the 222Rn mass balance model:
σ 2 = i = 1 k σ X i f X i 2
where σ is the standard deviation of each variable, which is assumed to be a normal distribution. The variables taken into consideration include each of the parameters of the Formulas (10)–(12). f X i is the partial derivative of this equation with respect to X i , and X i ( i = 1 k ) is the variable that causes the calculation error. The standard deviation of 222Rn measurements was calculated by RAD7 portable radon detector. The results for uncertainty are presented in Table 4.
The parameters in the 222Rn mass balance model that are considered constant and have no or negligible effect include the decay constant and the width and depth of the canal. The analytical uncertainty for 222Rn samples ranged from 11 to 34.8% for surface water and from 3.8 to 17.5% for groundwater. The degassing of 222Rn is mainly controlled by water temperature and water velocity, but some uncertainty may come from 222Rn loss during sampling.
The results of the calculation in Equation (13) give about a 19% error estimate using the average value of several measurements of surface water samples. Thus, in these cases, the large uncertainty of 222Rn values in the end-member groundwater dominates the main source of the errors of calculation results. The estimation of “background” 222Rn has an error of about 20%. According to the feedback of the calculation results, the error of the hydraulic exchange flux between the canal water and groundwater ranges from 4% to 39%, which points out 222Rn activity as the main source of error.

5. Conclusions

The purpose of this study is to quantitatively evaluate the seasonal hydraulic exchange of groundwater and the Xintongyang Canal in the Taizhou alluvial plain using an improved 222Rn balance method. To reduce the model uncertainty, the “background” 222Rn for non-groundwater sources was introduced into the model to replace the influence of hyporheic exchange. At the same time, the flow model was used to verify the calculated results of the 222Rn mass balance model.
The results indicate that the interaction between groundwater and the canal has been transformed several times, especially in different seasons, and canal leakage is dominant. The interlacing and dense distribution of tributaries in the alluvial plain make the hydraulic exchange quite complex and varied. This was verified by the large variability of 222Rn activity along the canal in different seasons. The 222Rn mass balance method can quantitatively evaluate the interaction between groundwater and surface water and effectively consider the influence of each tributary. During a hydrological year, summer demonstrated the most intense water exchange dynamics, with peak fluxes reaching 0.0455 m3/(s·m) for surface water leakage (Section 2) and 0.0013 m3/(s·m) for groundwater discharge (Section 4), revealing pronounced spatial heterogeneity in dominant exchange processes.
Rainfall concentration makes canal leakage and groundwater discharge more frequent. The canal leakage volume of the four seasons is in the order of summer > autumn > winter > spring. However, the groundwater discharge volume of the four seasons is in the order of summer > spring > autumn > winter. This study offers insight into the seasonal variations of groundwater and surface water interactions within an alluvial plain. The results will provide a reasonable basis for the rational planning and utilization of water.

Author Contributions

Conceptualization, J.Y.; Data curation, J.Y., M.L. (Minjuan Li), R.W. and M.L. (Mingjun Liu); Formal analysis, J.Y.; Funding acquisition, J.Y.; Investigation, M.L. (Minjuan Li) and R.W.; Methodology, J.Y.; Supervision, L.Y.; Visualization, J.Y. and M.L. (Mingjun Liu); Writing—original draft, J.Y.; Writing—review and editing, T.S., M.L. (Mingjun Liu) and L.Y. All authors have read and agreed to the published version of the manuscript.

Funding

This research was funded by the National Key R&D Program of China (Grant No. 2022YFC3202405), and the China Postdoctoral Science Foundation (Grant No. 2023M731261).

Data Availability Statement

Data is contained within the article.

Acknowledgments

We are grateful to the reviewers and editors for their valuable comments on this article.

Conflicts of Interest

Authors Jing Yang and Mingjun Liu were employed by Yellow River Engineering Consulting Co., Ltd., Zhengzhou 450003, China. The remaining authors declare that the research was conducted in the absence of any commercial or financial relationships that could be construed as a potential conflict of interest.

References

  1. Lewandowski, J.; Meinikmann, K.; Krause, S. Groundwater–Surface Water Interactions: Recent Advances and Interdisciplinary Challenges. Water 2020, 12, 296. [Google Scholar] [CrossRef]
  2. Shen, C.; Riley, W.J.; Smithgall, K.R.; Melack, J.M.; Fang, K. The fan of influence of streams and channel feedbacks to simulated land surface water and carbon dynamics. Water Resour. Res. 2016, 52, 880–902. [Google Scholar] [CrossRef]
  3. Jasechko, S.; Seybold, H.; Perrone, D.; Fan, Y.; Kirchner, J.W. Widespread potential loss of streamflow into underlying aquifers across the USA. Nature 2021, 591, 391–395. [Google Scholar] [CrossRef] [PubMed]
  4. Zhang, X.; Xu, X.; Xiang, Z.; Yang, D.; Zhang, X.; Xu, B. Distribution characteristics and influence factors of radium and radon isotopes in the lower reaches of the Yellow River. Mar. Environ. Sci. 2018, 37, 1–7. [Google Scholar]
  5. Luo, X.; Jiao, J.J.; Wang, X.-S.; Liu, K. Temporal 222Rn distributions to reveal groundwater discharge into desert lakes: Implication of water balance in the Badain Jaran Desert, China. J. Hydrol. 2016, 534, 87–103. [Google Scholar] [CrossRef]
  6. Sadat-Noori, M.; Santos, I.R.; Sanders, C.J.; Sanders, L.M.; Maher, D.T. Groundwater discharge into an estuary using spatially distributed 222Rn time series and radium isotopes. J. Hydrol. 2015, 528, 703–719. [Google Scholar] [CrossRef]
  7. Fleckenstein, J.H.; Krause, S.; Hannah, D.M.; Boano, F. Groundwater-surface water interactions: New methods and models to improve understanding of processes and dynamics. Adv. Water Resour. 2010, 33, 1291–1295. [Google Scholar] [CrossRef]
  8. Atkins, M.L.; Santos, I.R.; Ruiz-Halpern, S.; Maher, D.T. Carbon dioxide dynamics driven by groundwater discharge in a coastal floodplain creek. J. Hydrol. 2013, 493, 30–42. [Google Scholar] [CrossRef]
  9. Makings, U.; Santos, I.R.; Maher, D.T.; Golsby-Smith, L.; Eyre, B.D. Importance of budgets for estimating the input of groundwater-derived nutrients to an eutrophic tidal river and estuary. Estuar. Coast. Shelf Sci. 2014, 143, 65–76. [Google Scholar] [CrossRef]
  10. Stellato, L.; Di Rienzo, B.; Di Fusco, E.; Rubino, M.; Marzaioli, F.; Allocca, V.; Salluzzo, A.; Rimauro, J.; Romano, N. Surface water–groundwater connectivity implications on nitrate cycling assessed by means of hydrogeologic and isotopic techniques in the Alento river basin (Salerno, Italy): Preliminary data. J. Rend. Online Soc. Geol. 2016, 41, 80–83. [Google Scholar] [CrossRef]
  11. Harvey, J.W.; Newlin, J.T.; Krupa, S.L. Modeling decadal timescale interactions between surface water and ground water in the central Everglades, Florida, USA. J. Hydrol. 2006, 320, 400–420. [Google Scholar] [CrossRef]
  12. Wilcox, D.A.; Sweat, M.J.; Carlson, M.L.; Kowalski, K.P. A water-budget approach to restoring a sedge fen affected by diking and ditching. J. Hydrol. 2006, 320, 501–517. [Google Scholar] [CrossRef]
  13. Wolski, P.; Savenije, H.H.G. Dynamics of floodplain-island groundwater flow in the Okavango Delta, Botswana. J. Hydrol. 2006, 320, 283–301. [Google Scholar] [CrossRef]
  14. McBride, M.S.; Pfannkuch, H.O. Distribution of seepage within lakebeds. J. Res. U.S. Geol. Surv. 1975, 3, 505–512. [Google Scholar]
  15. Schiavo, M.; Riva, M.; Guadagnini, L.; Zehe, E.; Guadagnini, A. Probabilistic identification of Preferential Groundwater Networks. J. Hydrol. 2022, 610, 127906. [Google Scholar] [CrossRef]
  16. Kalbus, E.; Reinstorf, F.; Schirmer, M. Measuring methods for groundwater-surface water interactions: A review. Hydrol. Earth Syst. Sci. 2006, 10, 873–887. [Google Scholar] [CrossRef]
  17. Johnston, S.G.; Hirst, P.; Slavich, P.G.; Bush, R.T.; Aaso, T. Saturated hydraulic conductivity of sulfuric horizons in coastal floodplain acid sulfate soils: Variability and implications. Geoderma 2009, 151, 387–394. [Google Scholar] [CrossRef]
  18. Cey, E.E.; Rudolph, D.L.; Parkin, G.W.; Aravena, R. Quantifying groundwater discharge to a small perennial stream in southern Ontario, Canada. J. Hydrol. 1998, 210, 21–37. [Google Scholar] [CrossRef]
  19. Sophocleous, M. Interactions between groundwater and surface water: The state of the science. Hydrogeol. J. 2002, 10, 52–67. [Google Scholar] [CrossRef]
  20. Schmidt, A.; Schubert, M. Using 222Rn-222 for tracing groundwater discharge into an open-pit lignite mining lake—A case study. Isot. Environ. Health Stud. 2007, 43, 387–400. [Google Scholar] [CrossRef]
  21. Atkinson, A.P.; Cartwright, I.; Gilfedder, B.S.; Hofmann, H.; Unland, N.P.; Cendon, D.I.; Chisari, R. A multi-tracer approach to quantifying groundwater inflows to an upland tributory; assessing the influence of variable groundwater chemistry. Hydrol. Process. 2015, 29, 1–12. [Google Scholar] [CrossRef]
  22. Ortega, L.; Manzano, M.; Custodio, E.; Hornero, J.; Rodríguez-Arévalo, J. Using 222Rn to identify and quantify groundwater inflows to the Mundo River (SE Spain). Chem. Geol. 2015, 395, 67–79. [Google Scholar] [CrossRef]
  23. Irvine, D.J.; Singha, K.; Kurylyk, B.L.; Briggs, M.A.; Sebastian, Y.; Tait, D.R.; Helton, A.M. Groundwater-Surface water interactions research: Past trends and future directions. J. Hydrol. 2024, 644, 23. [Google Scholar] [CrossRef]
  24. Jing, Y.; Zhongbo, Y.; Peng, Y.; Ala, A. Assessment of groundwater quality and 222Rn distribution in the Xuzhou region, China. Environ. Monit. Assess. 2018, 190, 549. [Google Scholar]
  25. Dulaiova, H.; Burnett, W.C. Are groundwater inputs into river-dominated areas important? The Chao Phraya River–Gulf of Thailand. Limnol. Oceanogr. 2006, 51, 2232–2247. [Google Scholar] [CrossRef]
  26. Burnett, W.C.; Peterson, R.N.; Santos, I.R.; Hicks, R.W. Use of automated 222Rn measurements for rapid assessment of groundwater flow into Florida streams. J. Hydrol. 2010, 380, 298–304. [Google Scholar] [CrossRef]
  27. Peterson, R.N.; Santos, I.R.; Burnett, W.C. Evaluating groundwater discharge to tidal rivers based on a Rn-222 time-series approach. Estuar. Coast. Shelf Sci. 2010, 86, 165–178. [Google Scholar] [CrossRef]
  28. Cartwright, I.; Hofmann, H.; Sirianos, M.A.; Weaver, T.R.; Simmons, C.T. Geochemical and 222Rn constraints on baseflow to the Murray River, Australia, and timescales for the decay of low-salinity groundwater lenses. J. Hydrol. 2011, 405, 333–343. [Google Scholar] [CrossRef]
  29. Smerdon, B.D.; Gardner, W.P.; Harrington, G.A.; Tickell, S.J. Identifying the contribution of regional groundwater to the baseflow of a tropical river (Daly River, Australia). J. Hydrol. 2012, 464–465, 107–115. [Google Scholar] [CrossRef]
  30. Unland, N.P.; Cartwright, I.; Andersen, M.S.; Rau, G.C.; Reed, J.; Gilfedder, B.S.; Atkinson, A.P.; Hofmann, H. Investigating the spatio-temporal variability in groundwater and surface water interactions: A multi-technical approach. Hydrol. Earth Syst. Sci. Discuss. 2013, 10, 3795–3842. [Google Scholar]
  31. Frei, S.; Gilfedder, B.S. FINIFLUX: An implicit finite element model for quantification of groundwater fluxes and hyporheic. Water Resour. Res. 2015, 51, 6776–6786. [Google Scholar] [CrossRef]
  32. Webb, J.R.; Santos, I.R.; Robson, B.; Macdonald, B.; Jeffrey, L.; Maher, D.T. Constraining the annual groundwater contribution to the water balance of an agricultural floodplain using 222Rn: The importance of floods. Water Resour. Res. 2017, 53, 544–562. [Google Scholar] [CrossRef]
  33. Xie, Y.; Cook, P.G.; Shanafield, M.; Simmons, C.T.; Zheng, C. Uncertainty of natural tracer methods for quantifying river–aquifer interaction in a large river. J. Hydrol. 2016, 535, 135–147. [Google Scholar] [CrossRef]
  34. Yang, J.; Yu, Z.; Yi, P.; Frape, S.K.; Gong, M.; Zhang, Y. Evaluation of surface water and groundwater interactions in the upstream of Kui river and Yunlong lake, Xuzhou. J. Hydrol. 2020, 583, 124549. [Google Scholar] [CrossRef]
  35. Santos, I.R.; De Weys, J.; Eyre, B.D. Groundwater or floodwater? Assessing the pathways of metal exports from a coastal acid sulfate soil catchment. Environ. Sci. Technol. 2011, 45, 9641–9648. [Google Scholar] [CrossRef]
  36. Cook, P.G. Estimating groundwater discharge to rivers from river chemistry surveys. Hydrol. Process. 2013, 27, 3694–3707. [Google Scholar] [CrossRef]
  37. Zheng, M.J.; Wan, C.W.; Du, M.D.; Zhou, X.D.; Yi, P.; Aldahan, A.; Jin, H.J.; Luo, D.L.; Yu, Z.B.; Gong, M. Application of Rn-222 isotope for the interaction between surface water and groundwater in the Source Area of the Yellow River. Nord. Hydrol. 2016, 47, 1253–1262. [Google Scholar] [CrossRef]
  38. Anderson, A.M.; Allen, D.M.; Venditti, J.G. Sensitivity of Subsurface Permeability in Coastal Deltas to Their Morphodynamic and Geomorphic Characteristics. Water Resour. Res. 2023, 59, e2022WR034136. [Google Scholar] [CrossRef]
  39. Xu, Y. Experimental Investigation of Flow Characteristics in Porous Media at Low Reynolds Numbers (Re→0) under Different Constant Hydraulic Heads. Water 2019, 11, 2317. [Google Scholar] [CrossRef]
  40. Dimova, N.T.; Burnett, W.C.; Chanton, J.P.; Corbett, J. Application of 222Rn-222 to investigate groundwater fluxes into small shallow lakes. J. Hydrol. 2013, 486, 112–122. [Google Scholar] [CrossRef]
  41. Cook, P.G.; Favreau, G.; Dighton, J.C.; Tickell, S. Determining natural groundwater influx to a tropical river using radon, chlorofluorocarbons and ionic environmental tracers. J. Hydrol. 2003, 277, 74–88. [Google Scholar] [CrossRef]
  42. Su, X.; Xu, W.; Yang, F.; Zhu, P. Using new mass balance methods to estimate gross surface water and groundwater exchange with naturally occurring tracer 222Rn in data poor regions: A case study in northwest China. Hydrol. Process. 2015, 29, 979–990. [Google Scholar] [CrossRef]
  43. Yi, P.; Yang, J.; Wang, Y.; de Paul Mugwanezal, V.; Chen, L.; Aldahan, A. Detecting the leakage source of a reservoir using isotopes. J. Environ. Radioact. 2018, 187. [Google Scholar] [CrossRef] [PubMed]
  44. Peterson, R.N.; Burnett, W.C.; Taniguchi, M.; Chen, J.; Santos, I.R.; Ishitobi, T. 222Rn and radium isotope assessment of submarine groundwater discharge in the Yellow River delta, China. J. Geophys. Res. 2008, 113, C09021. [Google Scholar] [CrossRef]
  45. Schmidt, A.; Gibson, J.; Santos, I.R.; Schubert, M.; Tattrie, K.; Weiss, H. The contribution of groundwater discharge to the overall water budget of two typical Boreal lakes in Alberta/Canada estimated from a 222Rn mass balance. Hydrol. Earth Syst. Sci. 2010, 14, 79–89. [Google Scholar] [CrossRef]
  46. Ellins, K.E.; Roman-Mas, A.; Lee, R. Using 222 Rn to examine groundwater/surface discharge interaction in the Rio Grande de Manati, Puerto Rico. J. Hydrol. 1990, 115, 319–341. [Google Scholar] [CrossRef]
  47. Peng, T.H.; Takahashi, T.; Broecker, W.S. Surface 222Rn measurements in the North Pacific Ocean station Papa. J. Geophys. Res. 1974, 79, 1772–1780. [Google Scholar] [CrossRef]
  48. MacIntyre, S.; Wanninkhof, R.; Chanton, J.P. Trace gas exchange across the air–water interface in freshwater and coastal marine environments. In Biogenic Trace Gases: Measuring Emissions from Soil and Water; Matson, P.A., Hariss, R.C., Eds.; Blackwell Science: Hoboken, NJ, USA, 1995; pp. 52–57. [Google Scholar]
  49. Stellato, L.; Petrella, E.; Terrasi, F.; Belloni, P.; Belli, M.; Sansone, U.; Celico, F. Some limitations in using 222Rn to assess river–groundwater interactions: The case of Castel di Sangro alluvial plain (central Italy). Hydrogeol. J. 2008, 16, 701–712. [Google Scholar] [CrossRef]
  50. Corbett, D.R.; Burnett, W.C.; Cable, P.H.; Clark, S. A multiple approach to the determination of radon fluxes from sediments. J. Radioanal. Nucl. Chem. 1998, 236, 247–253. [Google Scholar] [CrossRef]
  51. Oh, Y.H.; Kim, G. Large seasonal changes in the recharge of seawater in a subterranean estuary revealed by a 222Rn tracer. Hydrol. Process. 2016, 30, 2525–2532. [Google Scholar] [CrossRef]
  52. Perrier, F.; Richon, P.; Gautam, U.; Tiwari, D.R.; Shrestha, P.; Sapkota, S.N. Seasonal variations of natural ventilation and 222Rn-222 exhalation in a slightly rising dead-end tunnel. J. Environ. Radioact. 2007, 97, 220–235. [Google Scholar] [CrossRef] [PubMed]
  53. Hejduk, S.; Kasprzak, K. Specific features of water infiltration into soil with different management in winter and early spring period. J. Hydrol. Hydromech. 2010, 58, 175–180. [Google Scholar] [CrossRef]
  54. Wang, S. Freezing Temperature Controls Winter Water Discharge for Cold Region Watershed. Water Resour. Res. 2019, 55, 10479–10493. [Google Scholar] [CrossRef]
Figure 1. Location map of the study area showing the distribution of sampling sites. The solid circles of different colors are the sampling sites of the surface water (R sites) and groundwater (G sites). The tributaries of the canal are labeled T (T1~T5). The blue solid circles refer to the borehole s for lithologic. The red arrows represent the direction of the river.
Water 17 01639 g001
Figure 2. Geological profile of the study area. H represents the ID of five boreholes and the depth of the boreholes.
Water 17 01639 g002
Figure 3. The monthly average distribution of precipitation in the study area in 2022. The value above the bar chart corresponds to the average annual rainfall per month.
Water 17 01639 g003
Figure 4. Conceptual diagram of the 222Rn mass balance model for the Xintongyang Canal (XTY canal). In this model, PRa-226 is the 222Rn activity produced by the decay of dissolved parent radium. Fdiff represents 222Rn activity due to the diffusion of the canal bed sediments. Fh stands for 222Rn activity caused by the hyporheic exchange. The symbol T denotes tributary/discharge channels (both inflowing and outflowing branches).
Water 17 01639 g004
Figure 5. The boxplot of 222Rn activity of canal water and groundwater in the study area.
Water 17 01639 g005
Figure 6. The variation of 222Rn activity along the Xintongyang Canal. The horizontal axis represents the distance from the sampling site to the upstream of the canal. 222Rn activity of samples from the same season is connected by dotted lines of different colors. 222Rn activity at the same sampling site in different seasons is represented by a rectangle.
Water 17 01639 g006
Figure 7. Comparison diagram of calculation results of the 222Rn mass balance model and flow model. The upward triangle represents groundwater discharge, and the downward triangle refers to canal leakage. The solid triangle represents the calculated results of the 222Rn mass balance model, while the hollow triangle refers to the calculated results of the flow model.
Water 17 01639 g007
Figure 8. The average flux of canal leakage in different sampling periods.
Water 17 01639 g008
Figure 9. The average flux of groundwater discharge for different sampling periods.
Water 17 01639 g009
Table 1. Data on 222Rn activity in the canal and groundwater measured by several surveys. ±σ refers to the standard deviation of the 222Rn activity.
222Rn (Bq/m3)±σ222Rn (Bq/m3)±σ222Rn (Bq/m3)±σ222Rn (Bq/m3)±σ
SeasonsAutumnWinterSpringSummer
Location
R1203927121573522255340745216
R243075252174021182402366270
R31287213204922634354161381315
R4175537618334402250540681240
R5169625613862373384492265.148
R641575148441025743601731410
R7429114174153717144301837282
R8124616629110216604022166402
R9214039389831332654132626413
R10242569320134409192401536440
R1113993721725196847120511144
R1223997921725340847310511190
R131740536235643820295561385198
R144291471890295216251230786
R158622788751692593769586169
R161282221170045533506762789327
R174181022912540221154028690
R18874246143023823684031898210
R198472632335610298261026090
G136,155200514,530124134,825248012,7892239
G231,684339821,207227545,985234116,8271766
G327,755196915,202124037,620243012,983949
G430,447245620,683142245,339242611,366966
G529,122260919,892157645,794255415,6321711
G629,651159217,51266938,912270119,0921488
Table 2. 222Rn activity and other parameters of the sampling sites of the canal and tributaries. t1 (autumn), t2 (winter), t3 (spring), and t4 (summer) represent the four sampling seasons. ±σ refers to the standard deviation of the 222Rn activity.
No.DateDistanceWidthDepthTVelocityFlux222Rn±σ
(m)(m)(m)(°C)(m/s)(m3/s)(Bq/m3)
R1t101004.0628.60.0520.302039271
R3t146501206.2428.80.0859.901287213
R5t191601155.5128.80.0850.691696256
R7t114,05084527.80.0521.00429114
R9t117,570874.3528.30.0622.712140393
R11t142621204.8528.10.1269.771399372
R13t17980764.63300.0931.681740536
R14t17980924.7527.20.0834.94429147
R16t110,611664.527.10.1544.551282221
R18t110,611604.21270.0820.20874246
R1t201004.066.10.0728.422157352
R3t246501206.246.70.1289.862049226
R5t291601155.517.10.0850.691386237
R7t214,05084570.1146.201741537
R9t217,570874.3570.027.57898313
R11t242621204.858.40.1796.901725196
R13t27980764.637.20.0828.162356438
R14t27980924.7570.0939.311890295
R16t210,611664.570.1235.641700455
R18t210,611604.217.40.1436.071430238
R1t301004.0615.70.0728.422255340
R3t346501206.2413.30.1182.373435416
R5t391601155.5114.70.08553.863384492
R7t314,05084516.10.0521.001714430
R9t317,570874.3515.80.0622.713265413
R11t342621204.85150.0846.51847120
R13t37980764.6314.90.1345.762029556
R14t37980924.7515.20.143.682162512
R16t310,611664.516.40.0411.883350676
R18t310,611604.2115.60.0512.622368403
R1t401004.0627.40.1664.96745216
R3t446501206.24270.1289.861381315
R5t491601155.5127.60.16101.38265.148
R7t414,05084528.40.284.001837282
R9t417,570874.3528.20.1349.202626413
R11t442621204.8527.50.12572.68511144
R13t47980764.63270.32112.631385198
R14t47980924.75270.1148.0530786
R16t410,611664.5280.1647.522789327
R18t410,611604.2127.60.1742.081898210
Table 3. The calculated results and detailed interaction processes for hydraulic exchange between the canal and groundwater obtained by the 222Rn mass balance model and flow model. qr and qg represent the calculated average flux per unit length of the canal leakage and the calculated average flux per unit length of groundwater discharge, respectively. Hydraulic exchange processes (a) and (b) refer to canal leakage and groundwater discharge, respectively.
Sampling PeriodSectionCanal Tract Calculation by Radon Mass BalanceCalculation by Flow Balance
qr (10−3·m3/
(s·m))
qg (10−3·m3/(s·m))Interaction Processesqr (10−3·m3/
(s·m))
qg (10−3·m3/(s·m))Interaction Processes
autumn1R1–R38.50.0(a)6.50.0(a)
2R3–R52.00.0(a)1.30.0(a)
3R5–R716.50.0(a)11.10.0(a)
4R7–R90.00.4(b)0.00.5(b)
winter1R1–R36.00.0(a)7.60.0(a)
2R3–R513.00.0(a)6.20.0(a)
3R5–R71.10.2(a)/(b)0.80.0(a)
4R7–R911.60.0(a)11.00.0(a)
spring1R1–R30.01.0(b)0.01.6(b)
2R3–R56.70.3(a)/(b)6.80.0(a)
3R5–R78.60.0(a)6.60.0(a)
4R7–R90.00.3(b)0.00.5(b)
summer1R1–R30.00.5(b)10.30.0(a)
2R3–R545.50.0(a)11.80.0(a)
3R5–R74.40.8(a)/(b)4.70.0(a)
4R7–R911.21.3(a)/(b)9.90.0(a)
Table 4. The uncertainty of hydraulic exchange flux calculated by the 222Rn mass balance model.
222Rn Samples for Surface Water222Rn Samples for Groundwater“Background” 222RnHydraulic Exchange Flux
11–34.8%3.8–17.5%20%4–39%
Disclaimer/Publisher’s Note: The statements, opinions and data contained in all publications are solely those of the individual author(s) and contributor(s) and not of MDPI and/or the editor(s). MDPI and/or the editor(s) disclaim responsibility for any injury to people or property resulting from any ideas, methods, instructions or products referred to in the content.

