Article

Sediment Transport Constraints for Restoration of the Ebro Delta

by
Francisco Martin-Carrasco
1,
David Santillán
1,
David López-Gómez
2,
Ana Iglesias
3 and
Luis Garrote
1,*
1
Department of Civil Engineering, Hydraulics, Energy and Environment, Universidad Politécnica de Madrid, 28040 Madrid, Spain
2
Hydraulics Laboratory, Centre for Hydrographic Studies of CEDEX, 28005 Madrid, Spain
3
Department of Agricultural Economics, Statistics and Business Management, Universidad Politécnica de Madrid, 28040 Madrid, Spain
*
Author to whom correspondence should be addressed.
Water 2025, 17(11), 1620; https://doi.org/10.3390/w17111620
Submission received: 24 April 2025 / Revised: 23 May 2025 / Accepted: 24 May 2025 / Published: 27 May 2025
(This article belongs to the Section Hydraulics and Hydrodynamics)

Abstract

:
The natural flow of sediment in the Ebro River has been altered by a variety of factors that have impacted the geomorphic and ecological balance of the delta. Ongoing restoration efforts in the delta would benefit if the flow of sediment in the river could be increased. Understanding the dynamics of sediment flow in the Ebro River is an important component in the design of effective management strategies for the Ebro Delta. This study estimates the sediment transport potential of the Ebro River under current and future conditions through numerical simulation. Historical data from the late 19th century indicate that the river once transported up to 28.1 million tons of sediment per year. However, due to water abstractions and flow regulations, the current sediment transport capacity is limited to 9 million tons annually, a reduction of 67%. Future projections suggest further decreases in flow and sediment transport potential, with reductions of up to 30% by 2060 and 50% by 2100, depending on climate conditions and water management practices. The findings underscore the need for integrated management strategies to mitigate the impacts of reduced sediment flow, emphasizing the importance of restoring sediment transport as a crucial component of the delta restoration efforts.

1. Introduction

The rivers in the Mediterranean region have undergone significant transformations due to human activities, particularly through the construction of dams, which profoundly impacts their hydrology and ecology. One of the most affected rivers is the Ebro River in Spain, which serves as a compelling case study of how large-scale damming disrupts natural sediment transport and flow regimes [1,2]. The Ebro, one of the longest rivers in the Iberian Peninsula, has been heavily dammed, with over one hundred reservoirs altering its natural dynamics. These dams regulate the flow of water to support irrigation, hydroelectric power, and urban water supplies, but they also cause severe disruptions in the river sediment load.
Under natural conditions, the Ebro transported large amounts of sediment to its delta, nourishing wetlands and maintaining coastal stability [3]. However, with the retention of sediment behind dams, the downstream portions of the river have become sediment-starved, leading to bed armoring, erosion of riverbanks, and a significant retreat of the Ebro Delta, which is now highly vulnerable to rising sea levels [4,5,6]. Furthermore, the alteration of flow regimes has negatively affected aquatic ecosystems by reducing seasonal flooding. The disruption of these natural processes has weakened the delta’s ability to act as a natural buffer against storms and coastal erosion [7]. Similar patterns of river alteration can be observed in the Mediterranean, where the balance between human water demands and environmental sustainability remains a contentious issue [8]. The case of the Ebro River underscores the long-term consequences of intensive river regulation, emphasizing the need for integrated water management strategies that consider not only human needs but also the ecological integrity of river systems.
Alterations in sediment dynamics due to river regulation and climate change have been documented in other large river systems. In the Mississippi River Delta, human interventions and reduced sediment supply have led to extensive land loss and increased vulnerability to sea level rise and hurricanes [9]. The Mekong River Delta has also experienced a decrease in sediment loads, which has been exacerbated by dam construction upstream and is projected to worsen under future climate scenarios, posing risks to food security and livelihoods [10]. Similarly, in the Changjiang Estuary, Xie et al. [11] documented how reduced sediment input altered estuarine transport patterns and depositional dynamics. In Europe, the Rhône River Delta exhibits signs of sediment starvation and morphological changes due to both hydropower development and climatic changes [12]. The Nile Delta, once nourished by seasonal floods, now suffers subsidence and erosion as a consequence of the Aswan High Dam and reduced discharge [13]. These cases highlight the global relevance of sediment management and emphasize the need for integrated approaches that consider future climatic variability and flow alteration. Under climate change scenarios, many studies anticipate a reduction in river discharge and sediment transport potential. For example, in the Ganges–Brahmaputra–Meghna system, changes in monsoonal patterns and upstream dams could lead to major disruptions in sediment delivery to the delta, with potential socioecological consequences [14]. These studies highlight the broader implications of disrupted sediment continuity in large river systems, reinforcing the need to understand how sediment availability and flow regimes affect downstream channel morphology and ecological integrity. They provide relevant context for assessing the sediment dynamics of the Ebro River and offer comparative insights into restoration and management strategies under changing climatic and anthropogenic pressures.
The existing literature on sediment transport highlights the critical role of sediment dynamics in maintaining the ecological and geomorphological integrity of river systems. Hauer et al. [15] emphasize that natural rivers operate in a delicate balance between sediment erosion, transport, and deposition, a process essential to maintaining riverbanks, floodplains, and deltas. Research has consistently shown that the construction of dams along the Ebro has severely disrupted the sediment balance by trapping significant amounts of sediment in reservoirs, thereby reducing the availability of sediment downstream. Studies by Guillén and Palanques [16], Batalla and Vericat [17], Tena and Batalla [18], and Polo et al. [19] demonstrate that sediment load has drastically decreased since the mid-20th century due to damming, leading to intensified coastal erosion, delta retreat, and habitat degradation. As a result of the construction of the upstream dams and the regulation of flow, the current sediment supply to the Ebro Delta has declined dramatically, with current estimates indicating suspended sediment loads of only 30,000 to 50,000 t/yr [18]. This represents a reduction of more than 99% compared to pre-dam conditions. Furthermore, sediment retention in reservoirs alters the morphology of the riverbed [20], affecting aquatic habitats and the distribution of nutrients [21].
Restoring sediment transport is crucial for preserving both the physical structure and ecological health of the Ebro River, making it an essential consideration in future water management policies. Some scholars advocate for sediment bypass systems or controlled sediment releases as potential solutions to restore sediment continuity in the Ebro River [22]. Bathymetric surveys of the Mequinenza (1961–2012) and Ribarroja (1967–2007) reservoirs show significant sediment retention. The loss in capacity was 5.8 × 10⁶ m3/yr initially, later estimated at 1.5 to 2 × 10⁶ m3/yr over 48 years. Ribarroja accumulated 0.34–0.94 × 10⁶ m3/yr. Mequinenza traps nearly 100% of sediment, while Ribarroja retains approximately 40% [23]. Historical sediment transport upstream of the reservoirs of the Lower Ebro River decreased from 8 Mt/yr in the 1960s–1970s to 5 Mt/yr due to land use and climate change. The total sediment accumulation is estimated at 320 Mt in Mequinenza and 64 Mt in Ribarroja. Given the configuration of the reservoirs, the most promising options for sediment mobilization in the Mequinenza–Ribarroja–Flix system are hydrodynamic removal by flushing or sluicing and mechanical removal by excavation or dredging. Flushing is technically possible in the Ribarroja and Flix reservoirs, but it raises environmental, economic, and social concerns, including water quality issues, impacts on hydropower production, and disruptions to water users. Mechanical removal, especially hydraulic dredging, is always feasible, but it is costly. Given these challenges, sediment management requires careful planning to balance feasibility and potential negative effects. The Ebro River Basin Management Plan includes funding for pilot tests for sediment mobilization in collaboration with all relevant stakeholders [24]. These tests will be carried out with appropriate environmental, safety, and economic safeguards. The proposed pilot studies will take place in the Mequinenza regatta area, a rowing course located at the tail end of the Ribarroja reservoir. The project will assess different sediment mobilization techniques, focusing on mechanical methods and hydraulic dredging to determine their feasibility and effectiveness in managing accumulated sediments.
The interplay between flow regime and sediment transport capacity is a critical factor in determining the success of management strategies aimed at restoring sediment flow in the Lower Ebro River, where sediment bypass operations are being explored. Under natural conditions, sediment transport is governed by river discharge, with higher flows having the energy needed to mobilize and carry sediment downstream. However, in a regulated river such as the Ebro, dam-induced flow alterations have significantly reduced river discharge, which in turn lowers the flow energy and sediment transport capacity. Even when successful sediment bypass systems or controlled sediment releases are implemented, their effectiveness depends on whether the discharge levels are sufficient to maintain suspended sediment in motion and prevent deposition before reaching the Ebro Delta. Studies such as those by Tena et al. [25] highlight that sediment transport efficiency is directly related to flow magnitude and variability, which means that without adequate discharges, sediment restoration efforts may fail. Additionally, low-energy flows encourage the accumulation of fine sediment, promoting vegetation encroachment and further stabilizing riverbeds, making it even more difficult to restore dynamic sediment transport processes. Therefore, management strategies for sediment bypass in the Lower Ebro must consider not only sediment supply but also ensure that flow releases are powerful enough to maintain sediment in suspension and transport it to the delta. Without addressing this key interaction between flow and transport capacity, restoration efforts risk being ineffective, reinforcing the need for integrated strategies that align sediment management with hydrological restoration.
In recent years, a variety of sediment management strategies have emerged to mitigate the impacts of sediment retention in regulated rivers. Among these, sediment augmentation, which involves adding sediment downstream of barriers, has been applied in rivers such as the Rhine to partially restore geomorphic and ecological functions [26,27]. In mountainous rivers, artificial sediment pulses have been released to simulate natural transport events and to support riverbed dynamics [28]. These interventions are often supported by detailed modeling, field monitoring, and laboratory experimentation to assess their effectiveness [29]. At the delta scale, eco-engineering and nature-based solutions are increasingly integrated into restoration projects to enhance sediment retention, restore natural hydromorphological processes, and improve ecosystem resilience to sea-level rise and climate impacts [7,30]. These approaches often involve multi-stakeholder processes and adaptive management frameworks, highlighting the need for integrated strategies that combine engineering feasibility with ecological functionality. Incorporating such approaches in the context of the Ebro River is crucial, particularly given the magnitude of the sediment deficit and the vulnerability of the delta. This study contributes to that effort by assessing the current and future potential for sediment transport as a prerequisite for evaluating the feasibility of sediment management interventions.
The sediment flow restoration strategy consists of two key components: mobilizing accumulated reservoir sediments and transporting them to the Ebro Delta. The first component is primarily an economic challenge, addressed through pilot tests to identify the most effective sediment mobilization techniques. The second component relies on natural transport capacity, though uncertainties remain due to the altered hydrological regime caused by water abstractions and regulation. The objective of the work presented here is to assess whether the current and future flow regime of the river will be sufficient to transport the sediments that can be released from the reservoirs. Since the current sediment transport is very low, the adopted methodology is based on hydrodynamic simulation. Hydrodynamic and sediment transport models have become essential tools, providing critical information on sediment dynamics that can be used in forming more effective river management strategies. These models simulate complex interactions among water flow, sediment transport, and river morphology, allowing scientists to predict how sediment moves through the system under various conditions.
The purpose of this study is to estimate the sediment transport capacity of the Lower Ebro River using a sediment transport rating curve based on hydrodynamic simulation. The specific objectives of this study are to (1) develop a sediment transport rating curve for the Lower Ebro River based on available data and hydrodynamic simulation; (2) quantify sediment transport capacity under current, natural and projected future hydrological conditions; and (3) assess whether future flow regimes, under climate change and water management scenarios, will be sufficient to support the restoration of sediment delivery to the Ebro Delta. Section 2 details the modeling approach, including the study area, the development of a sediment transport rating curve through numerical simulation, and the calibration of the model using observed data. This is followed by Section 3, which are structured into subsections that analyze sediment transport capacity under current, natural, and projected future flow regimes using climate scenarios. The results compare natural versus altered conditions, assess seasonal and long-term trends, and discuss the interplay between flow regulation and sediment mobility. Section 4 summarizes key findings, including a projected reduction in sediment transport capacity and its implications for delta restoration. Appendix A provides the mathematical foundation of the hydrodynamic and sediment transport models used in the study.

2. Materials and Methods
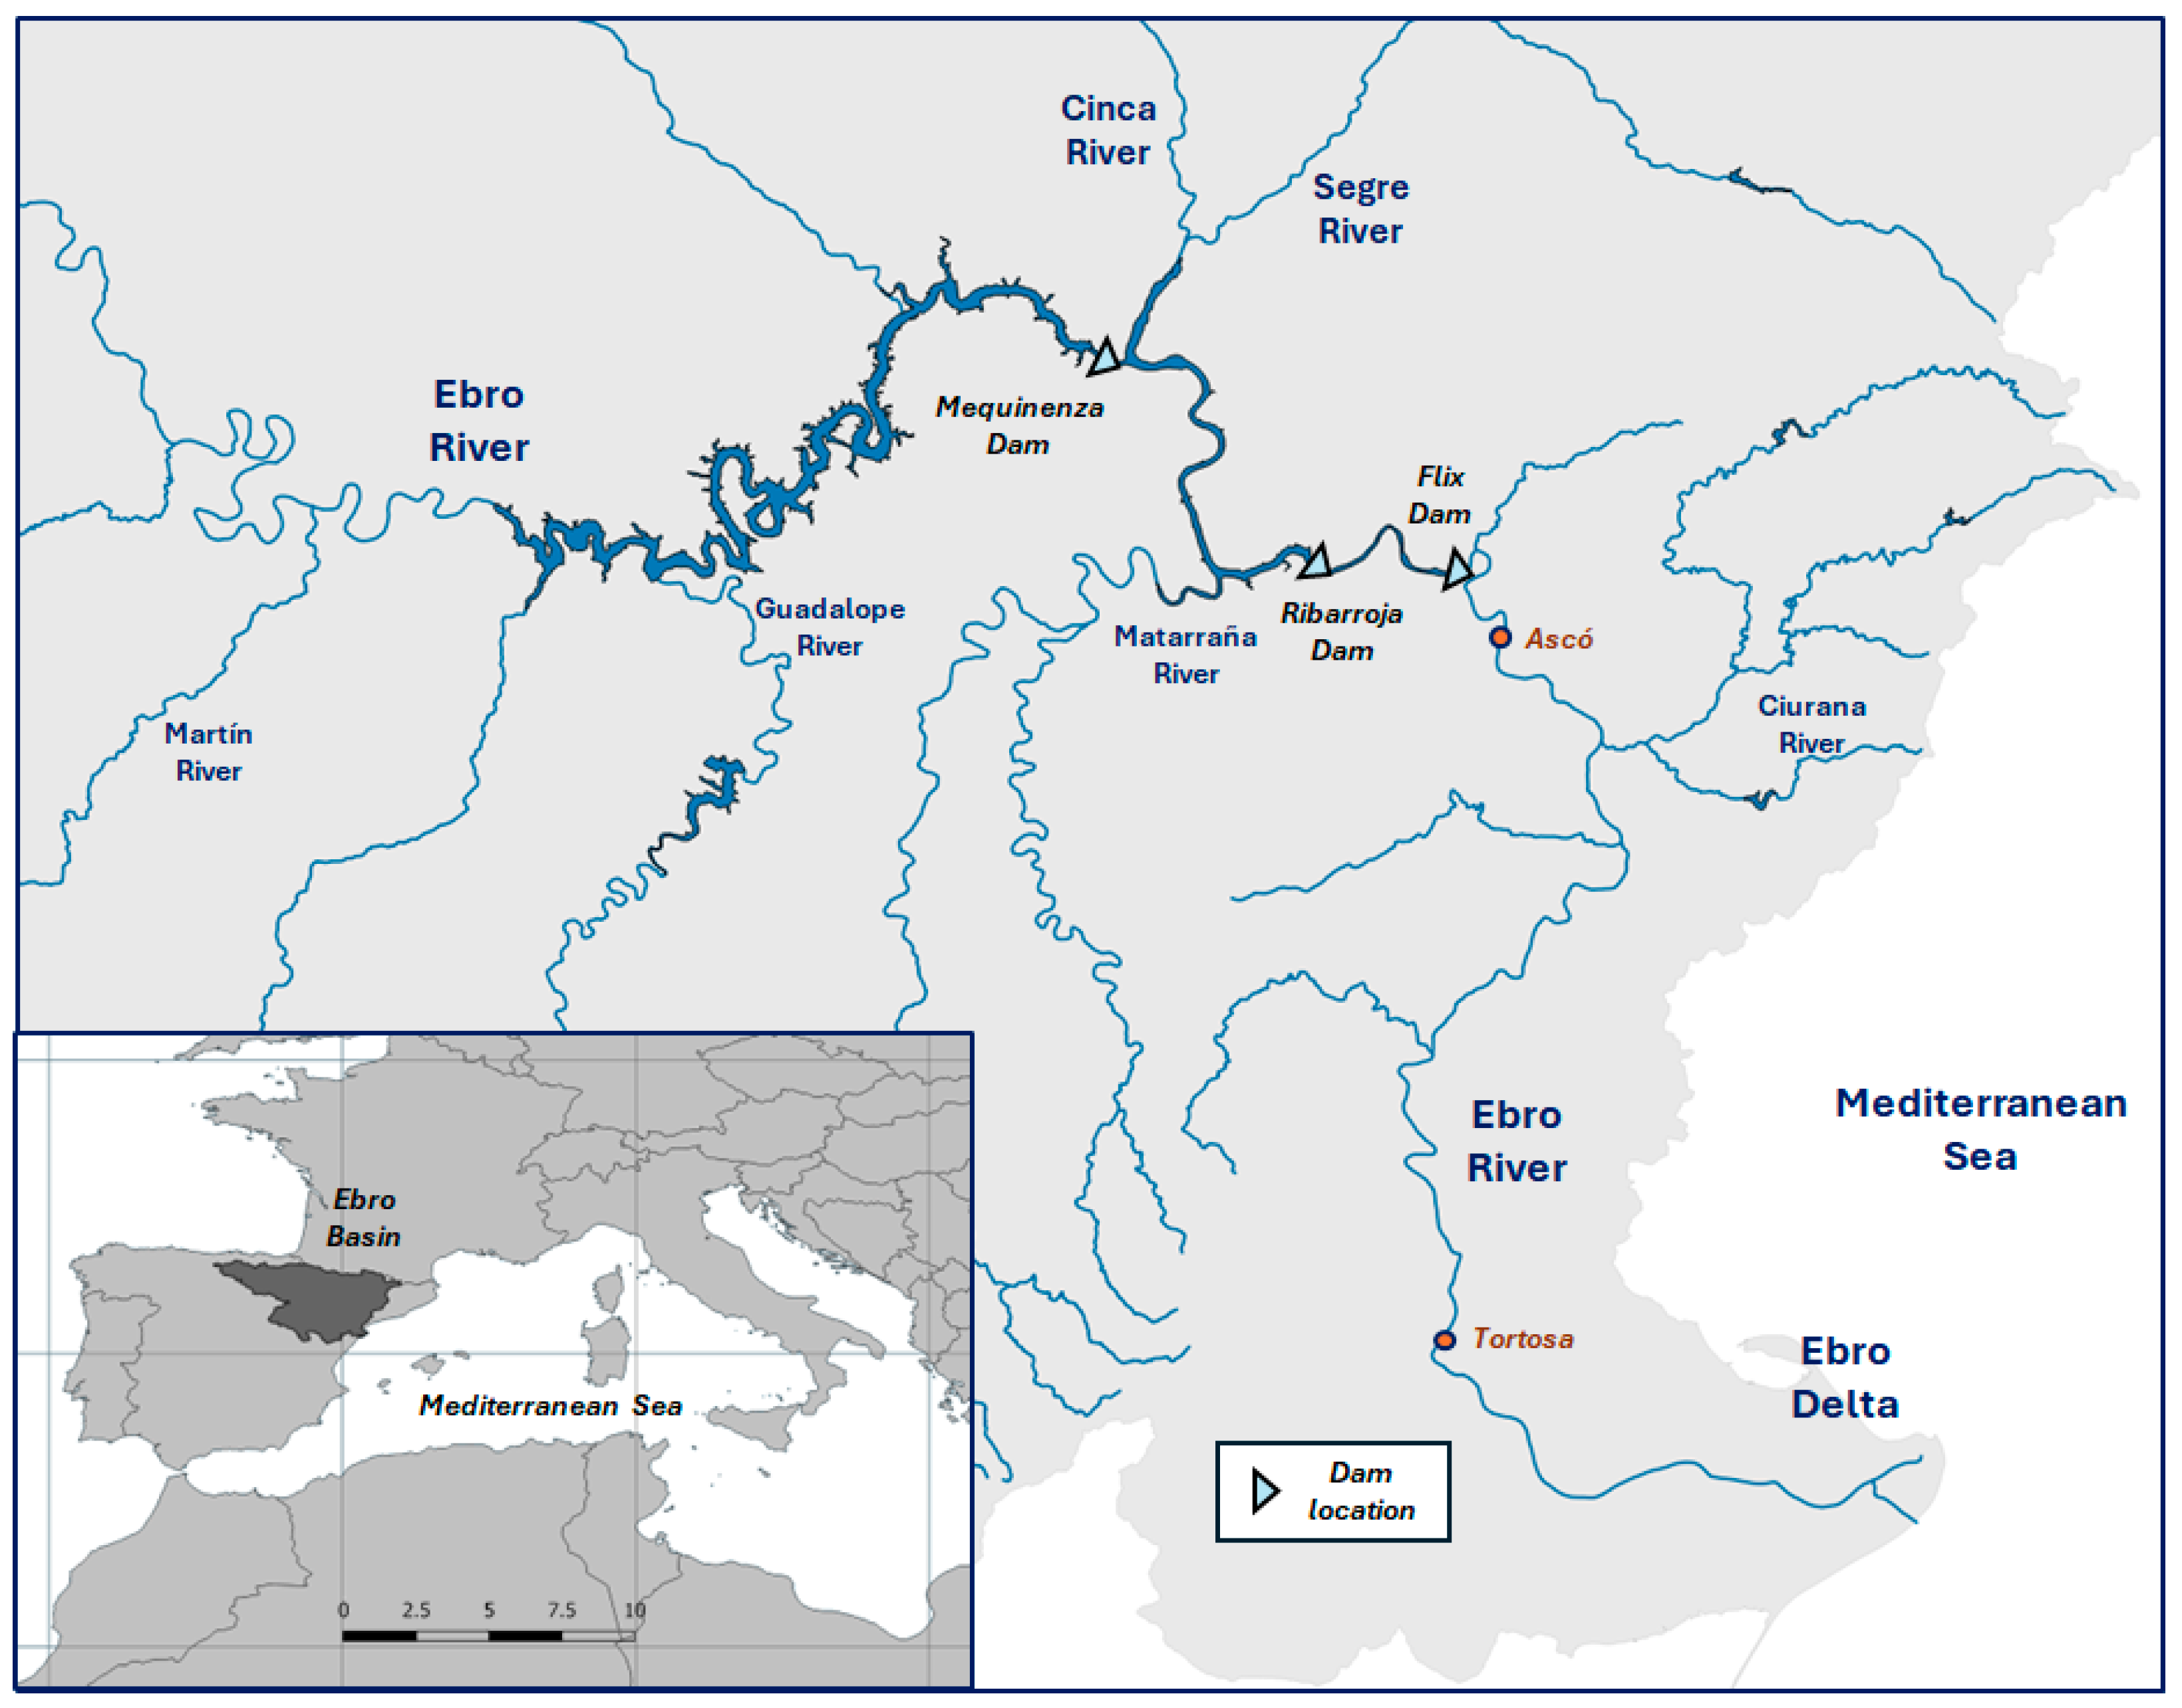
This section outlines the methodological approach of the study. The methodology consists of two main steps: (1) constructing a rating curve by simulating sediment transport under different discharges and (2) applying the rating curve to estimate sediment transport under various flow scenarios.

2.1. Study Area

The Lower Ebro River extends from the Mequinenza Reservoir to the Ebro Delta, encompassing a series of reservoirs and natural river stretches that shape its hydrology and sediment dynamics (Figure 1). The Mequinenza Reservoir, the largest in the system with a storage capacity of 1.5 km3, is located at the confluence of the Segre and Ebro rivers. It spans more than 110 km, with a high sediment trapping efficiency due to its storage capacity and elongated shape. Downstream, the Ribarroja Reservoir follows, smaller in size (0.21 km3) but still significantly affecting sediment transport. It stretches for 30 km and serves as a secondary barrier to sediment movement. Further downstream, the Flix Reservoir is a smaller impoundment (0.011 km3), located just before the natural river reaches, used primarily for hydroelectric purposes. It has a history of industrial pollution that requires careful sediment management interventions. Below Flix Reservoir, the Lower Ebro flows freely for approximately 100 km toward the Mediterranean Sea.
Figure 2 illustrates the development of reservoir storage in the Ebro Basin, based on data from the ICOLD World Register of Dams [31]. According to this dataset, the Basin contains 142 reservoirs, with a storage capacity exceeding 106 m3 and totaling 8.438 km3. Reservoir construction peaked in the 1950s and 1960s, accounting for 54% of the total capacity.

2.2. Development of the Sediment Transport Rating Curve

The first step is to establish a quantitative relationship between river discharge and sediment transport using a hydrodynamic and sediment transport model. River simulations were performed with the Iber v3.1 code [32,33]. Iber is a two-dimensional (2D), freely available code that solves the 2D hydrodynamic equations coupled to the sediment transport equations using a finite volume approach applied to the shallow water equations (SWE). The model can handle steady and unsteady flows in 2D and includes multiple modules for different physical processes. Iber has been used successfully for modeling sediment transport in environments such as that analyzed in this study. Santillán et al. [34] benchmarked the hydrodynamic and erosion modules of Iber against laboratory experiments with satisfactory results. Their study included simulations of erosion processes at open-channel junctions based on experimental data available in the literature. The numerical results closely matched the observed erosion patterns. In addition, the model was applied to a real-world case study involving erosion at a river junction. Furthermore, the hydrodynamic module of Iber was validated using laboratory experiments and classical one-dimensional, open-channel contraction theory [35]. Iber has been used to simulate the hydrodynamic behavior of the Lower Ebro and other Mediterranean rivers. Dehghan-Souraki et al. [36] applied it to the Ribarroja reservoir. López-Gómez et al. [37] used Iber to simulate flushing flows in the Lower Ebro River. López Gómez et al. [38] also applied Iber to analyze sediment management options for the Marmolejo Reservoir in the Guadalquivir River. Due to computational requirements, the recently developed parallel computing version of the model was used [39]. The hydrodynamic equations and the erosion model are described in Appendix A. The model setup is described in the next section in terms of the model configuration data: topography, hydrodynamic parameters, and boundary conditions. The calibration of the hydrodynamic numerical model with controlled flood observations is described in the following section. The methodology for constructing the rating curve is presented in the last section.

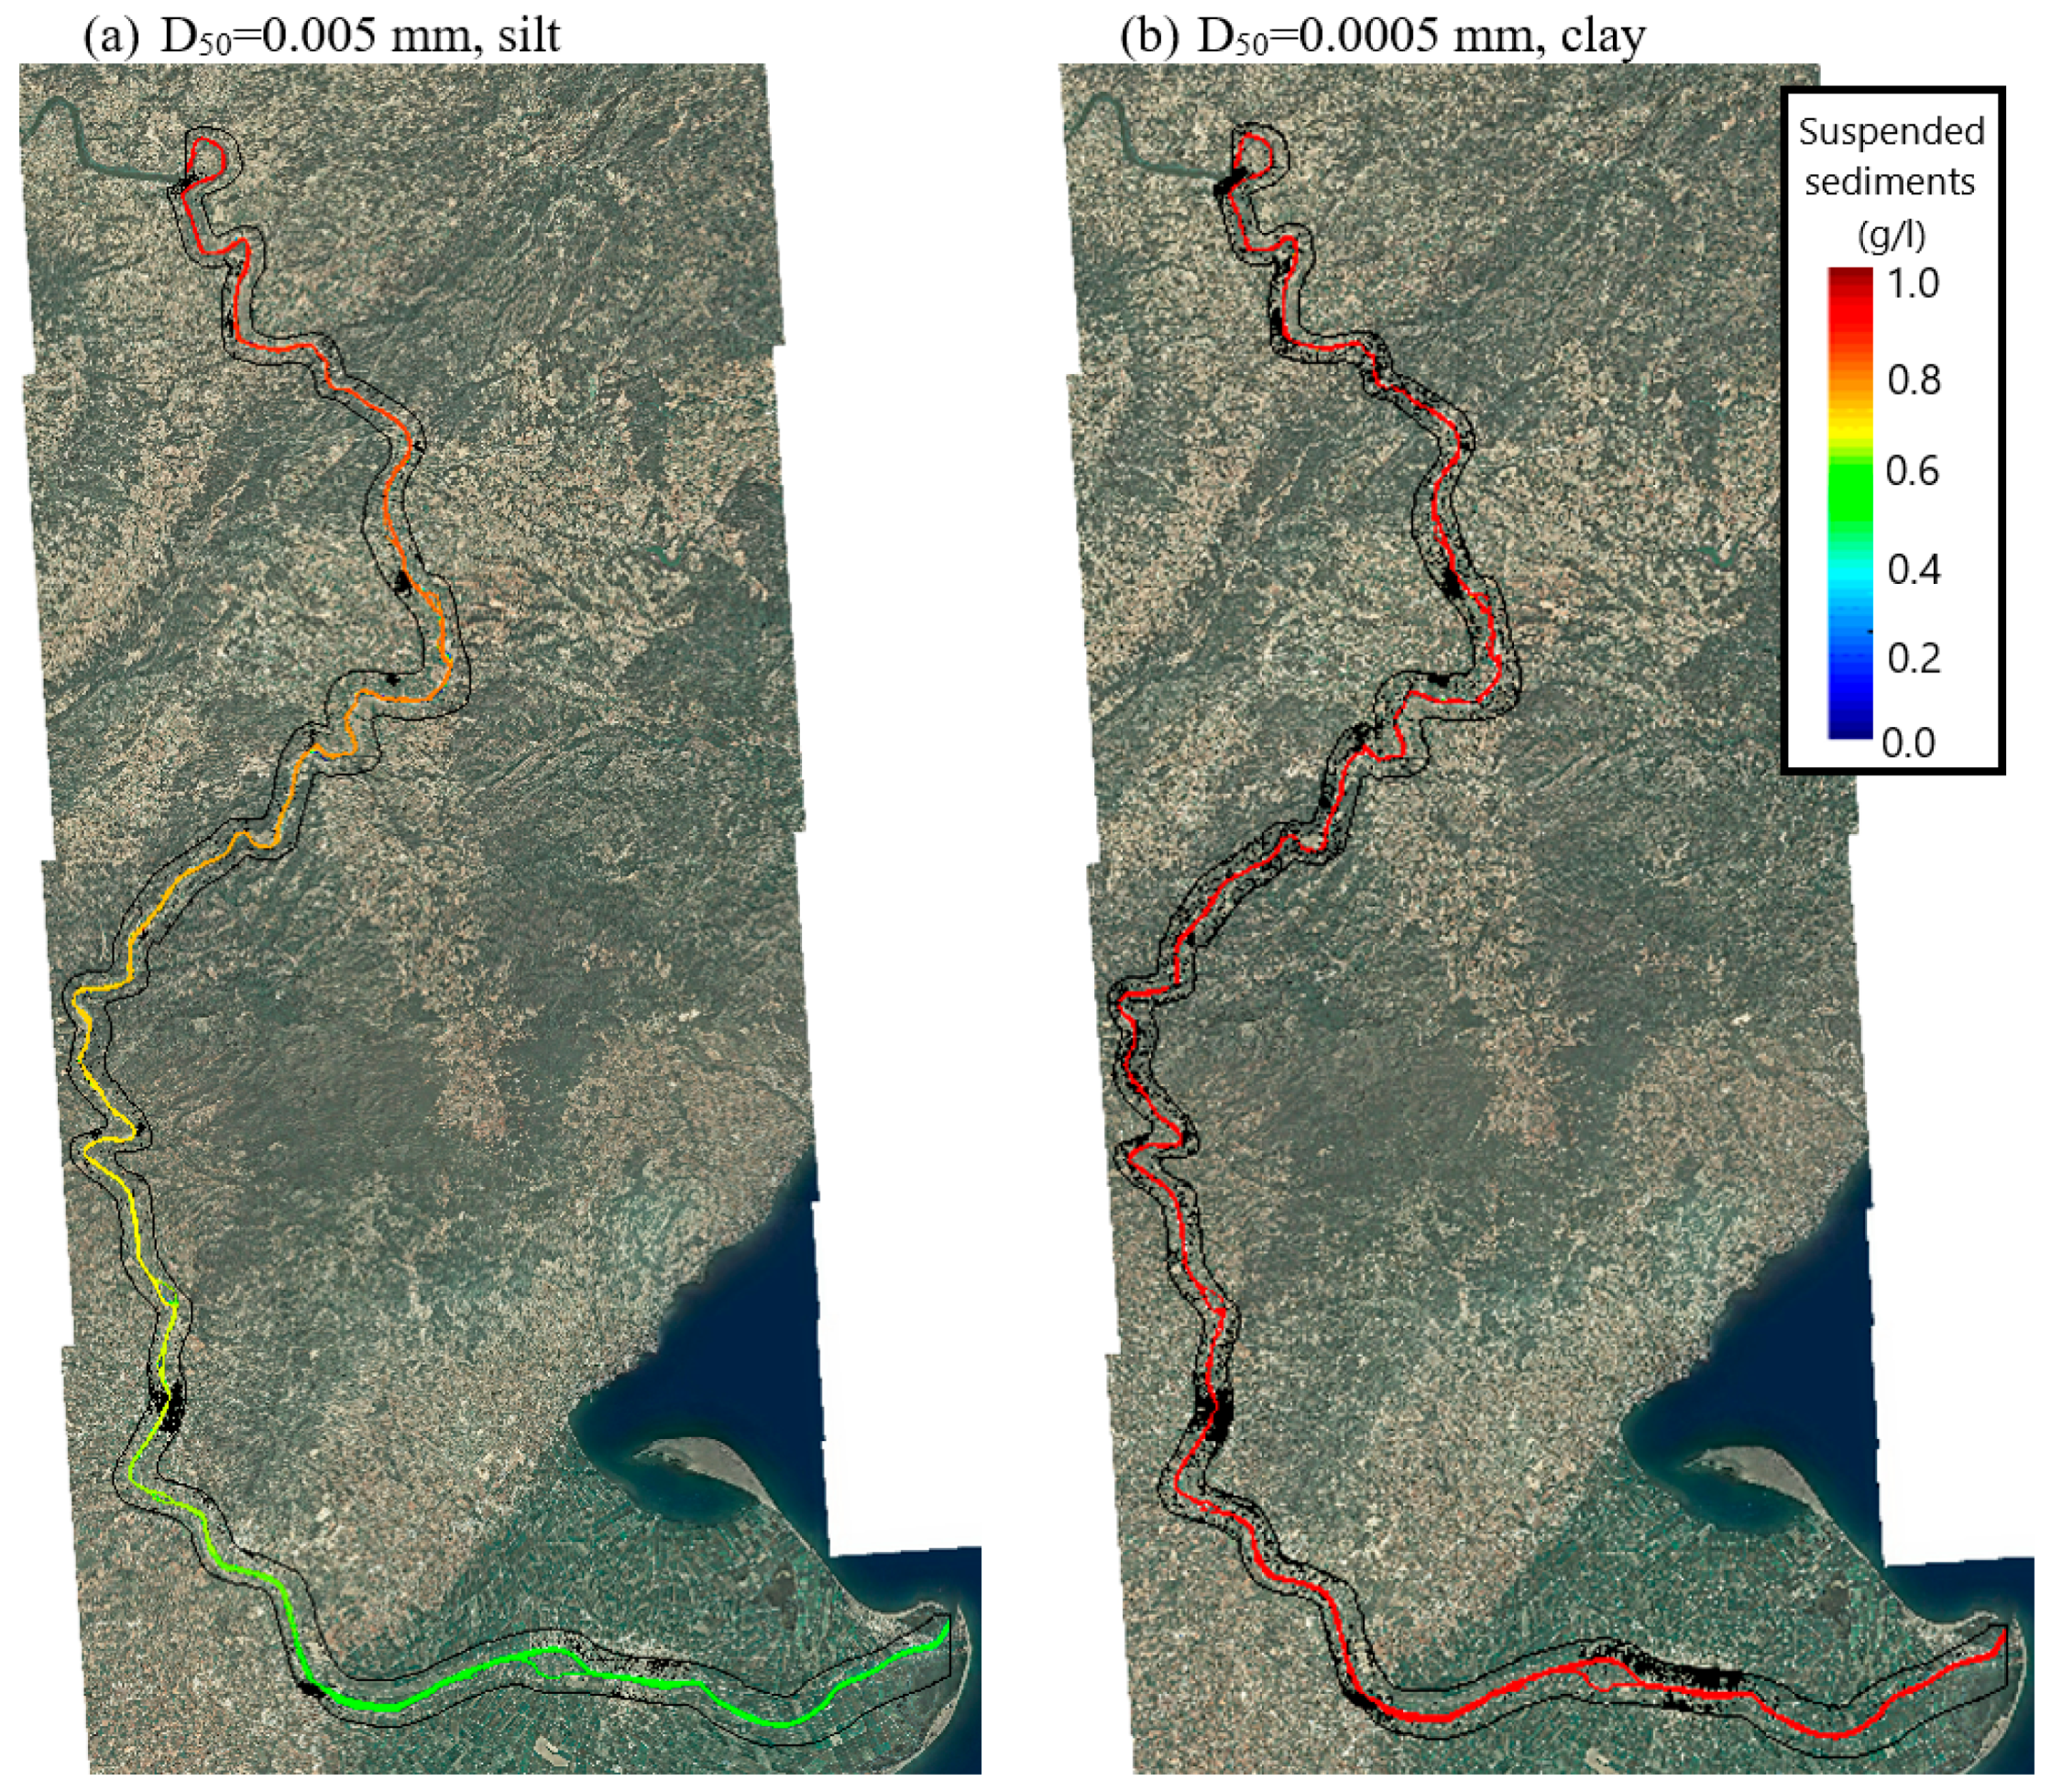
2.2.1. Hydrodynamic Model Setup

The domain of numerical simulations to model the transport of sediment to the Ebro Delta includes the reach of the river between the reservoir system and the delta. The modeling objectives are as follows: (1) to study alternatives to restore, at least in part, the sediment flow; (2) to estimate the quantity of sediments that can be mobilized; (3) to determine how long the sediments would take to reach the delta site; and (4) to know how the sediment would be delivered to the delta system.
The topography of the simulated reach is shown in Figure 3. Fluid flow and sediment transport are simulated from the Flix reservoir, located in the Tarragona province at 41.1 m above sea level, to the delta site, located in the mouth of the river at 0 m above mean sea level. The Flix dam is the last sediment barrier on the Ebro River and is located about 100 km from the river mouth. The domain topography was obtained from a high-resolution digital terrain model (DTM) with a 0.5 m resolution of the Ebro River that includes river bathymetry. A triangulated irregular network (TIN) model of the river was built using this DTM, with a tolerance of 0.1 m, a maximum side of 2000 m, and a minimum side of 12 m. The model includes about 100 km of the topography of the Ebro River and is composed of approximately 5 million triangles. An unstructured computational mesh was generated from the TIN, composed of about 2.5 million triangles; each triangle of the TIN model is one finite volume in the numerical model, i.e., the TIN model coincides with the computational mesh. The picture to the left in Figure 3 shows the coverage of the TIN model of the Ebro topography in blue. Two detailed snapshots of the computational mesh are shown on the right.
The hydrodynamics boundary conditions for the numerical model are (1) the imposed flow rate in Flix in the subcritical regime, and (2) the outlet boundary condition at the level imposed by the sea.

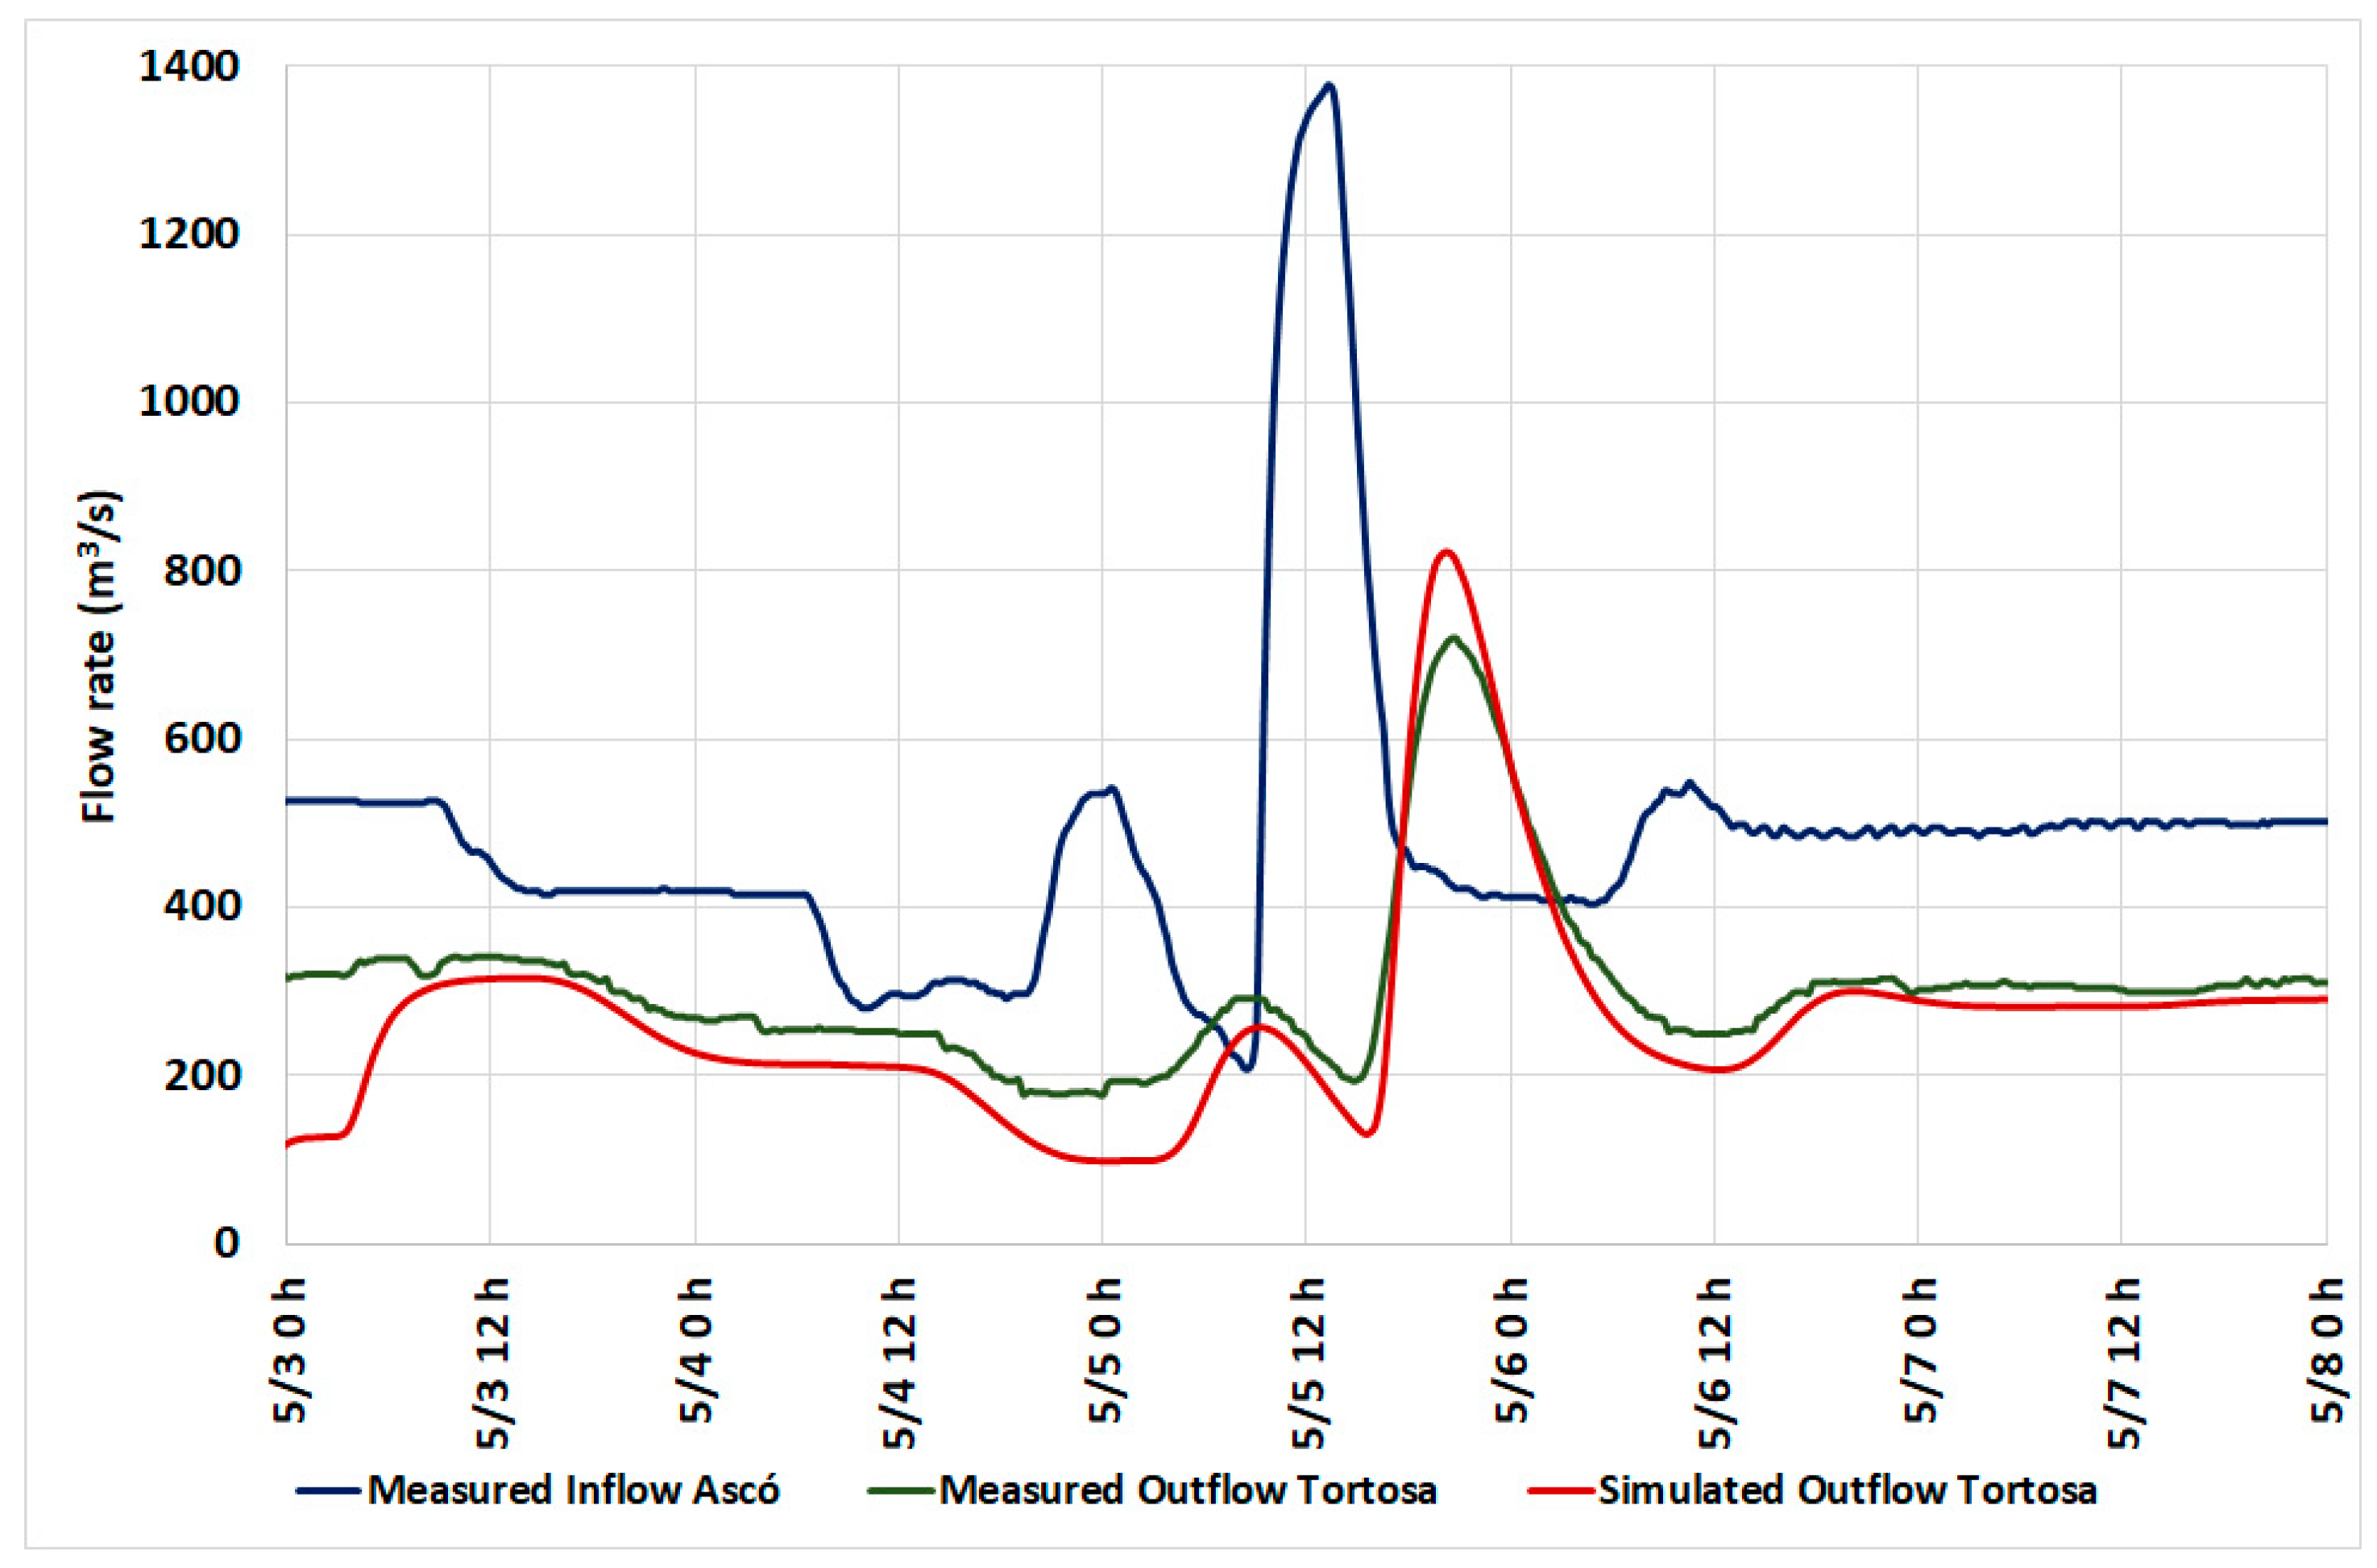
2.2.2. Model Calibration

The riverbed roughness, given by the Manning coefficient, was calibrated with the observed flood event on 5 May 2022. This event also allowed testing of the performance of the hydrodynamic model [37]. The Ebro Automatic Hydrological Information System (SAIH) provided 30-min flow rate observations at two points on the river: Ascó and Tortosa (see Figure 1). A set of numerical simulations with several values of the Manning coefficient was run. The best agreement between the simulated and observed flow rates in Tortosa was obtained with a Manning coefficient equal to 0.03. The results are shown in Figure 4. The model can capture the propagation of the flood wave along the river in terms of time and the flood peak downstream of the inlet.

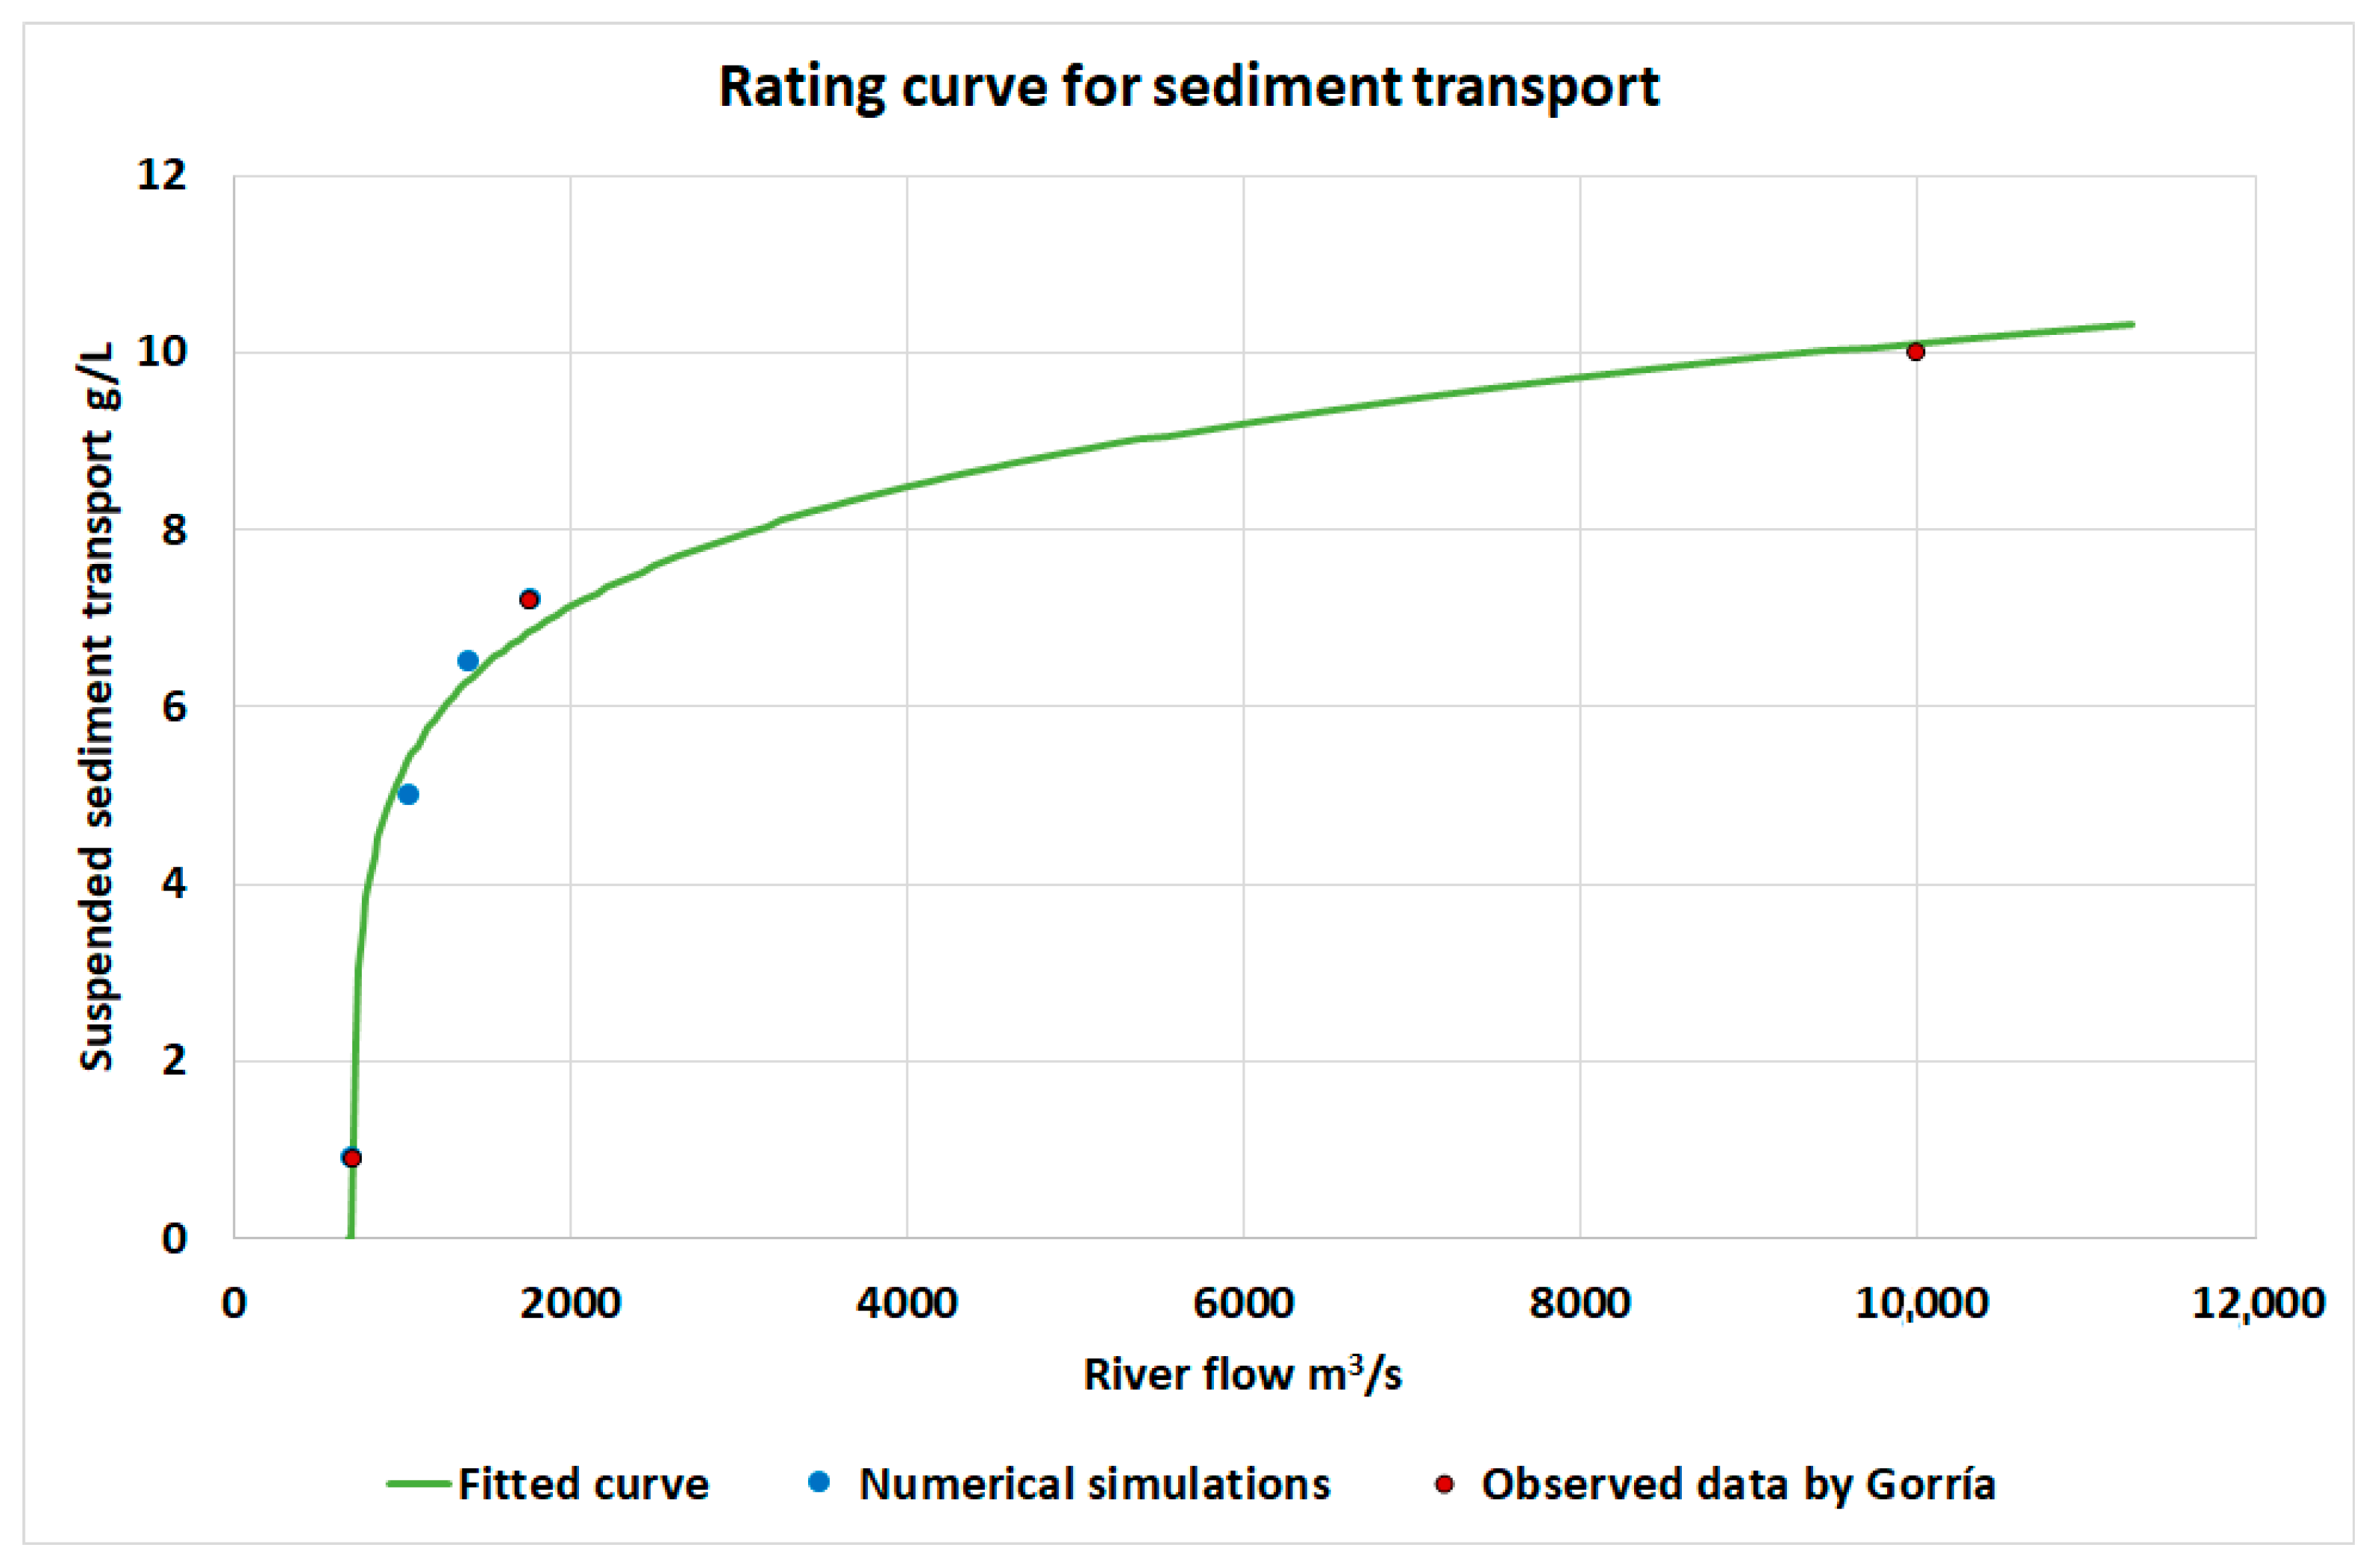
2.2.3. Rating Curve for Sediment Transport

A rating curve for sediment transport was built in the Lower Ebro River with the aid of the numerical model described above. The sediment transport part was calibrated using data compiled by Ibàñez et al. [40]. They provided estimates of the annual transport of suspended sediments for several flow ranges in the Ebro. Data were obtained from Gorria’s experiments, conducted in 1877, well before the dam construction period. They identified the following two representative regimes: normal flow, between 300 m3/s and 1500 m3/s, with an estimated mean flow of 710 m3/s, a duration of 256 days, and an average sediment concentration of 0.9 g/L; and annual flood, for discharge larger than 1500 m3/s, with a mean flow of 1764 m3/s, a mean duration of 11 days, and an estimated sediment concentration of 7.2 g/L. Sediment transport was estimated to be 14.1 Mt/yr for normal flow and 12.1 Mt/yr for annual flood. They added a contribution to the mean sediment transport of 1.7 Mt/yr from exceptional floods. The remaining 0.2 Mt/yr corresponds to flows of less than 300 m3/s. These values imply a total annual volume of 19.29 km3/yr and sediment transport of 28.1 Mt/yr.
Numerical simulations were performed for the two identified flow regimes, estimating sediment transport parameters to fit the observed data until a good agreement was obtained. In numerical experiments, the suspended sediment concentration corresponding to the flow regimes was specified at the upstream boundary condition. The numerical simulations are aimed at analyzing whether the Ebro River can transport those sediment concentrations down to the Ebro Delta. The analysis focused on the size of the suspended particles, characterized in the model with the median diameter D 50 . The parameter D 50 was estimated with a calibration process for the two representative regimes. A set of simulations was run, varying the value of D 50 and checking for the evolution of suspended sediment concentration along the river. The adopted value for D 50 was the maximum diameter that does not produce substantial net sedimentation in the river and is able to carry the suspended load to the delta. The following characteristics were adopted for the sediment: a relative density of 2.65, a friction angle of 30 degrees, a suspended sediment dispersion coefficient of 0.001 m2/s, and a Schmidt number of 1.1. The best performance was obtained for a D 50 value equal to 0.0005 mm, clay.
A sample of the results obtained in the simulations performed during the calibration process is presented in Figure 5. The figure shows two contour plots of the suspended sediment concentration for two D 50 values: 0.005 mm—silt and 0.0005 mm—clay after 1.5 days of simulation. The flow is 710 m3/s in both cases. The flow cannot convey the suspended silt load, and net sedimentation occurs during the transport process. The silt concentration decreases to approximately 0.5 g/L in the delta, as shown in Figure 5a. However, the flow can transport the suspended clay load with the given concentration, 0.9 g/L, down to the delta without net sedimentation, as shown in Figure 5b.
The resulting rating curve is presented in Figure 6. The curve was fitted to data compiled by Gorría in 1877 and to the results of the numerical simulations. The sediment transport rating curve was fitted using a third-degree polynomial function of the logarithm of the excess discharge above a threshold (Q0). The function includes four parameters: a0, a 1 , a 2 , and Q 0 .
The best fit was obtained with the following equation:
C = 0.8778 + 0.8648 log Q 709 + 0.3688 l o g Q 709 2 .
where C is the sediment concentration in g/L and Q is the discharge in m3/s. The expression is valid for Q > 709 m3/s. The sediment concentration for Q 709 m3/s is null.
The parameter Q 0 = 709 m3/s corresponds to the minimum discharge above which the fitted curve predicts non-zero sediment concentrations. While the rating curve assigns a value of zero to sediment concentration for Q 709 m3/s, this does not imply that no transport occurs under lower flows. Historical observations compiled by [40] describe sediment transport for discharges as low as 300 m3/s, with a mean concentration of 0.9 g/L in the range of 300–1500 m3/s.
The chosen functional form simplifies the fitting process and allows for an explicit threshold representation, which matches the steep nonlinearity observed in sediment transport behavior. While alternative formulations, such as logistic curves, could represent a gradual onset of sediment transport, they would require additional parameters and would not substantially change the aggregate results, as sediment transport is predominantly controlled by high-flow events. Furthermore, the hydrodynamic simulations confirm that sediment transport for discharges below 700 m3/s is minimal, a finding consistent with current field conditions in the Lower Ebro River, where sediment loads are extremely low under typical flow regimes.
The threshold discharge Q 0 = 709 m3/s was empirically determined during the fitting of the rating curve by combining historical sediment transport data and numerical simulation outputs. This threshold is consistent with the mean annual discharge from the Lower Ebro River and can be interpreted in light of the concept of bed formation discharge, which, as described by Xie et al. [41], refers to a specific range of river discharges that are optimal for the formation and stabilization of inner sandbars in convergent estuarine settings. These discharges are sufficient to mobilize and transport bed material without inducing dominant erosional processes, thereby supporting the development of key morphological features such as mid-channel bars or shoals. In summary, the bed formation discharge represents the minimum flow required to initiate and maintain morphodynamic processes that contribute to the evolution of the bed. As such, Q0 not only serves as a statistical fitting parameter but may also reflect a physically meaningful threshold that delineates active sediment transport regimes from background low-flow conditions with negligible geomorphic effect.

2.3. Potential Sediment Transport

The rating curve was applied to estimate the potential sediment transport capacity under natural conditions and the current flow regime. Furthermore, future trends in transport capacity were analyzed by incorporating climate projections and assessing potential changes in water use within the basin. This approach provides insight into how sediment dynamics may evolve over time, helping inform sustainable river management strategies.

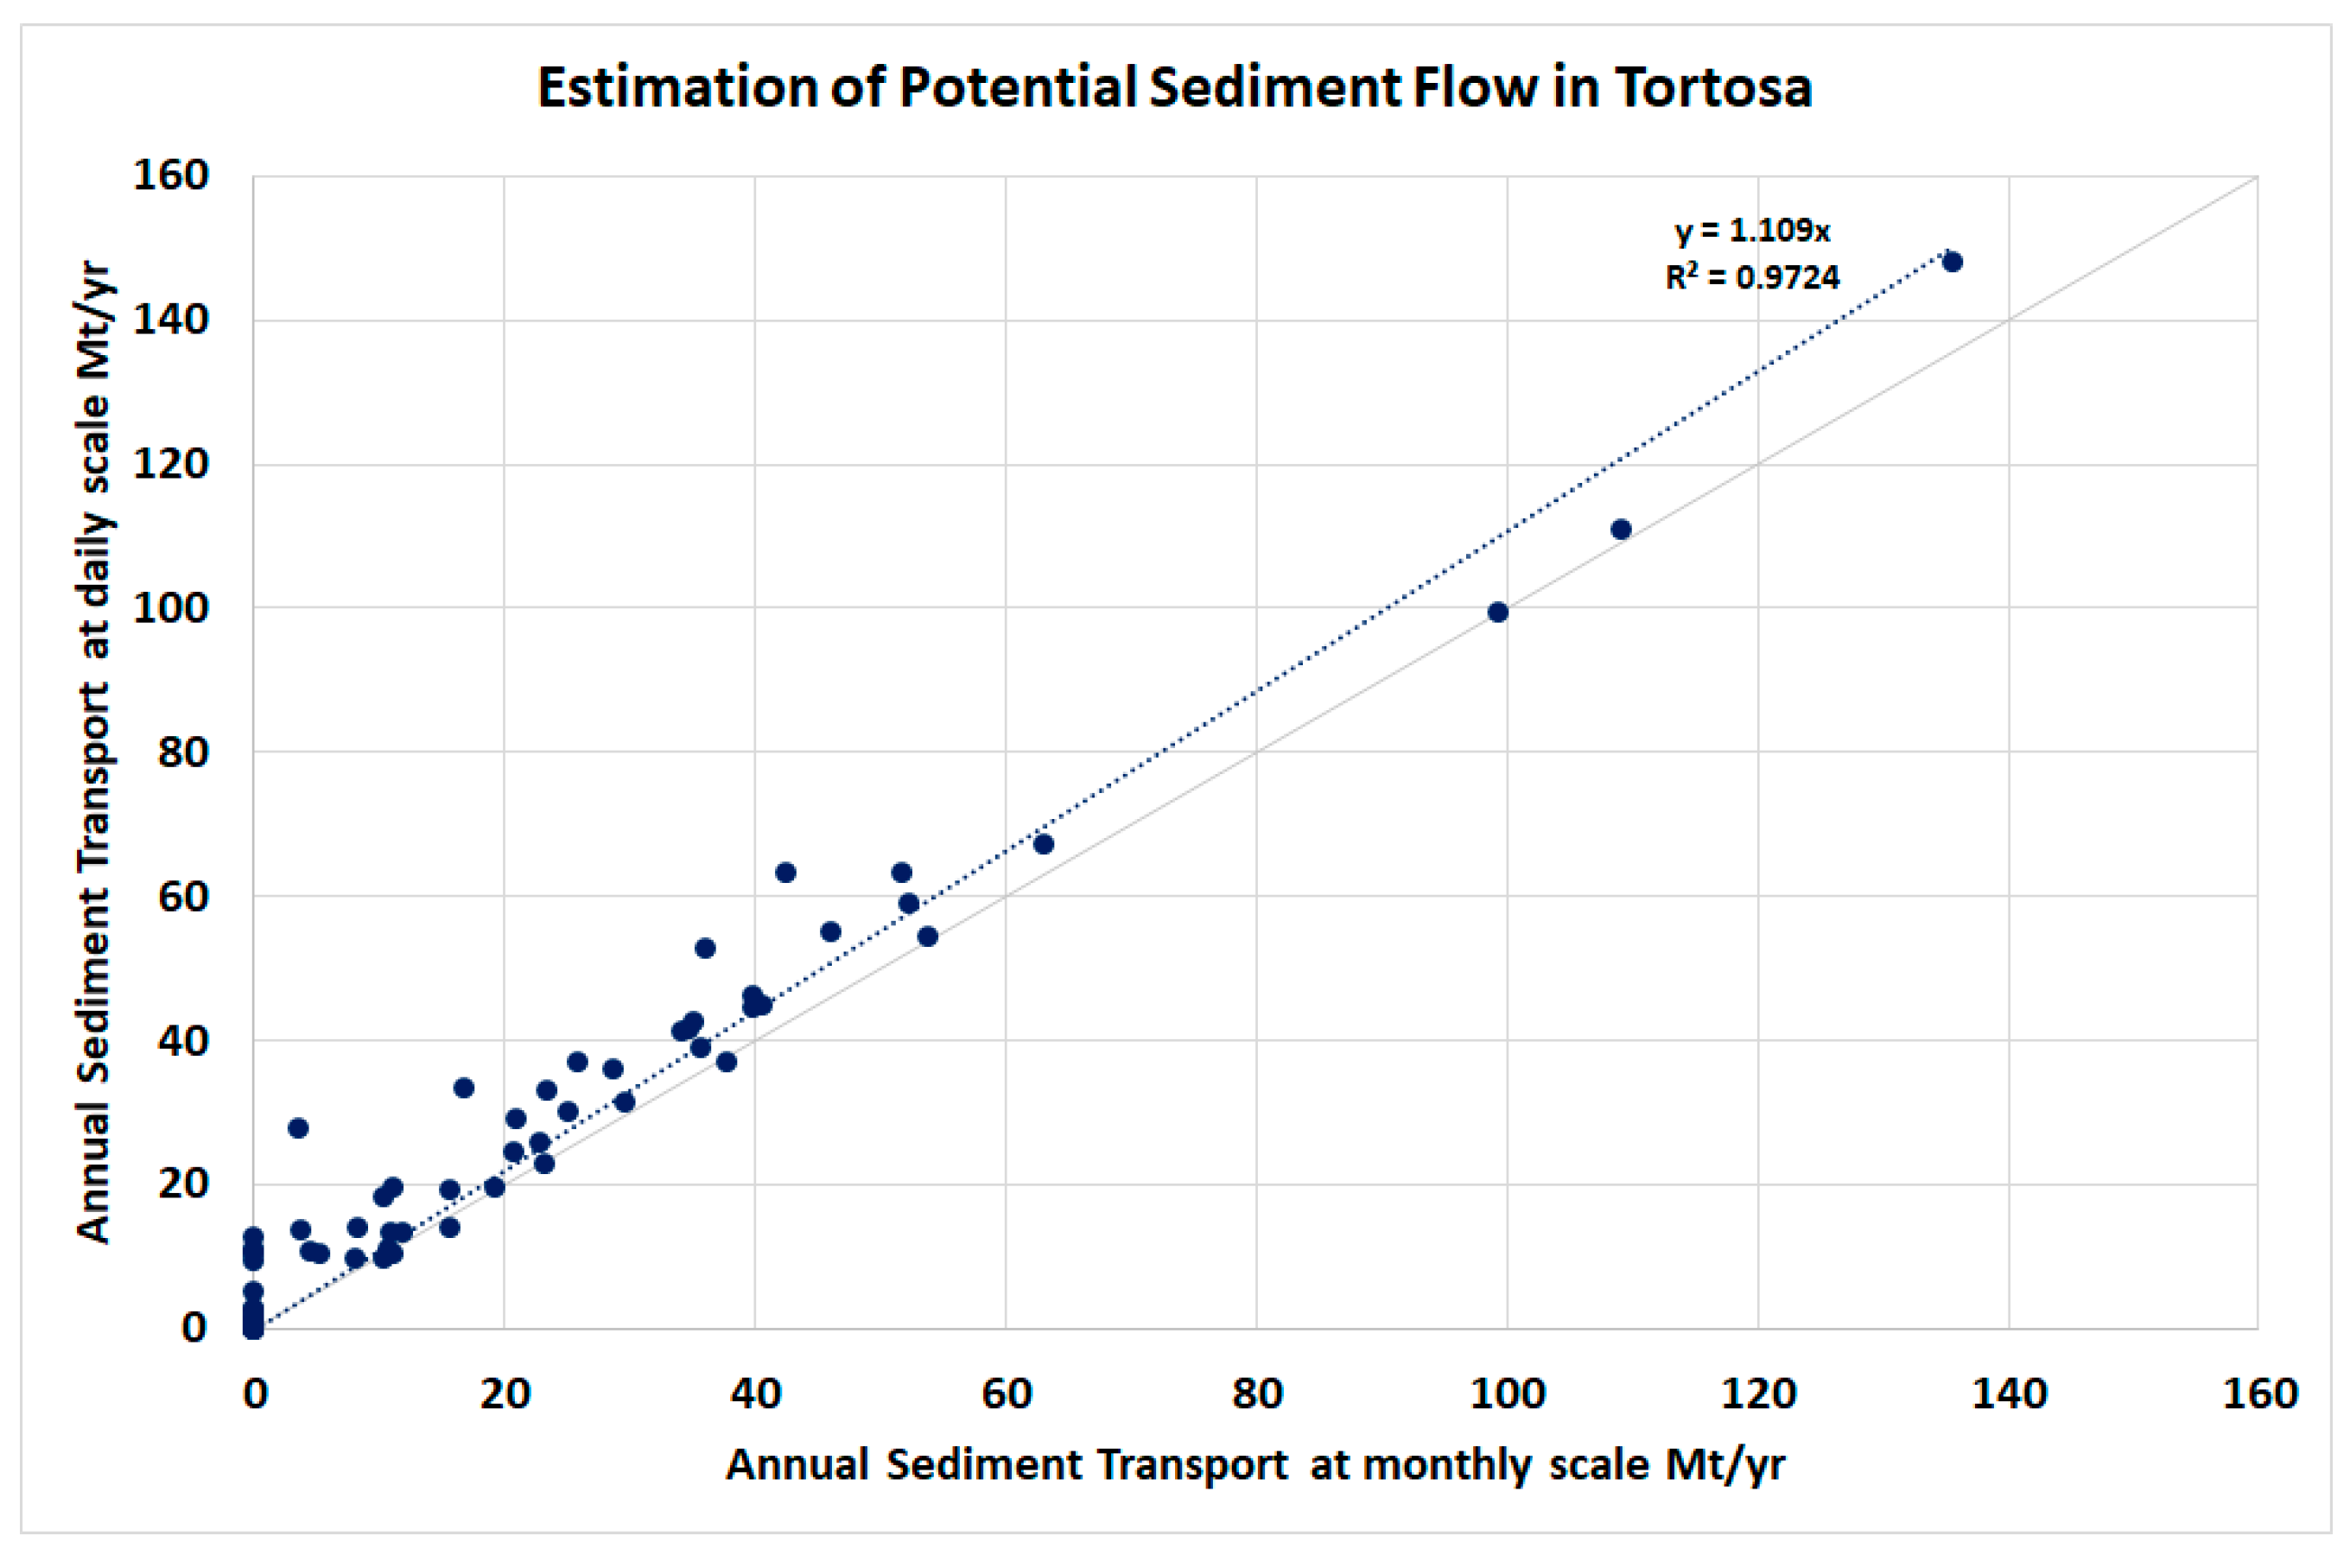
2.3.1. Potential Sediment Transport Under Observed Hydrologic Regime

The low sediment transport rate currently observed in the Lower Ebro River is mainly attributed to the limited availability of sediments. To estimate the potential sediment transport, observed flow data were combined with the sediment transport rating curve derived from numerical simulations. Daily flow data under actual conditions were obtained from the Tortosa gauging station, with records dating back to 1912. However, the dataset contains minor gaps and a significant interruption between 1936 and 1951. Continuous data is available in two periods: from the 1912–1913 hydrological year to 1930–1931 and from 1953–1954 to 2019–2020. The first period of data in Tortosa reflects near-natural conditions, as the storage capacity was relatively small (about 2.65% of the mean annual flow) and was primarily located in upstream areas. The second period encompasses the main phase of reservoir development and a prolonged period of change in flow.

2.3.2. Potential Sediment Transport Under a Natural Hydrologic Regime

To assess the impact of hydrological alteration, the potential transport of sediment was also estimated under natural flow conditions, excluding the effects of regulation and water abstraction. Flow data for the natural hydrological regime were obtained from the SIMPA model (Integrated System for Precipitation–Runoff Modeling), a conceptual distributed hydrological model that simulates average monthly flows under natural conditions at any point in the hydrographic network of Spain [42]. SIMPA is a conceptual and distributed hydrological model that operates on a monthly scale on a regular grid of 500 × 500 m and covers the entire Spanish peninsular territory. Its conceptual structure combines a water balance model with a runoff scheme based on regionally calibrated parameters. The most recent version of the model and its application to the Spanish basins are described in [43]. The available simulated dataset spans from the 1940–1941 hydrological year to 2019–2020, providing a long-term perspective on the unaltered flow regime and its influence on sediment transport.

2.3.3. Projected Potential Sediment Transport Under a Natural Hydrologic Regime

Estimates of potential sediment transport under future scenarios were derived from climate projections. These projections were obtained from a report produced as part of the AGWAMED project, which analyzed the climate trends in Mediterranean basins [44]. The study considered three IPCC AR6 emission scenarios: SSP1-2.6, SSP3-7.0, and SSP5-8.5. The necessary climate data was sourced from the ISIMIP repository (Inter-Sectoral Impact Model Intercomparison Project), a collaborative research initiative that assesses the impacts of climate change in multiple sectors [45]. For hydrological modeling, projections for the Ebro Basin were taken from two global hydrological models: H08 and CwatM, available in the ISIMIP repository. Two sets of climate scenarios were used: past and future. The past scenarios, used for model validation and reference, were of two types: obsclim and historical. The obsclim scenario is based on observed climate reanalysis data, enabling comparison of runoff estimates from the global models against the SIMPA model results. It covers the period from 1901 to 2019. The historical scenario, in contrast, uses climate model simulations to provide a reference for assessing future changes in sediment transport potential. It provides results from 1901 to 2014.
Future scenarios correspond to the selected AR6 emission pathways (SSP1-2.6, SSP3-7.0, and SSP5-8.5), with climate models forced by their respective projected greenhouse gas emission patterns. Simulations span from 2015 to 2100, using climate drivers tailored to each scenario. The climate driver GSWP3 (Global Soil Wetness Project Phase 3) represents a set of observed climate data, typically derived from historical climate records, reanalysis datasets, and other observational sources [46]. The climate driver GFDL-ESM is a state-of-the-art Earth system model developed by the Geophysical Fluid Dynamics Laboratory, which is part of the National Oceanic and Atmospheric Administration of the United States [47]. The climate driver MRI-ESM is a model of the Earth system developed by the Japan Meteorological Research Institute [48]. The climate driver IPSL-ESM is a comprehensive Earth system model developed by the Institut Pierre-Simon Laplace Climate Modelling Centre in France [49]. The climate driver MPI-ESM is a model of the Earth system developed by the Max Planck Institute for Meteorology [50]. The climate driver UKSM-ESM is a state-of-the-art ground system model developed by the Hadley Centre of the UK Met Office in collaboration with several research institutions [51].
The GSWP3 driver, based on observational data, was used in the obsclim scenario, while drivers based on climate models—including GFDL, MRI, IPSL, MPI, and UKSM1—were used for both historical and future scenarios.
Two global hydrological models have been used in the ISIMIP3b project: H08 and CWatM. H08 is a global hydrological model that consists of six submodels: hydrology of the Earth’s surface, transport in rivers, operation of reservoirs, crop growth, environmental flow, and water extraction. The formulations of the submodels are described in detail in [52,53]. CWatM is a global hydrological model that is used to assess the impacts of climate change on water resources, including runoff, river flow, and soil moisture [54].

2.3.4. Projected Potential Sediment Transport Under an Altered Hydrologic Regime

An estimate of future flow of the Ebro River under altered conditions was also derived from the results of the AGWAMED project [44]. This project evaluated the potential availability of water in the Ebro Basin under various climate scenarios. To achieve this, a water resource management simulation model was developed that incorporates the maximum potential water demand at each location.
The Water Availability and Adaptation Policy Analysis (WAAPA) model was applied to assess water availability. WAAPA is a GIS-based modeling framework that leverages high-resolution datasets to incorporate key hydrological and management components [55,56,57]. It enables detailed representation of river networks, reservoirs, and water demand, taking into account factors such as ecological flows, losses from evaporation, and reliability of supply. The delineation of subbasins and the configuration of the river network were based on the high-resolution topographical data provided by the HydroSHEDS dataset [58]. Reservoir information was sourced from a georeferenced dataset derived from the ICOLD World Register of Large Dams [30].
Potential water availability is defined as the maximum demand that can be met at a given point in the river network, considering the existing regulation infrastructure and management conditions, including ecological flow requirements, reservoir operation rules, evaporation losses, monthly demand modulation, and specified supply reliability criteria. This maximum allowable demand is calculated for each node within the basin’s data structure. The required inputs include the monthly distribution of demand, the presence of return flows, applicable reliability criteria, failure thresholds, and acceptable reliability levels.
At each node, the WAAPA model applies an iterative procedure, initially setting demand equal to the average annual inflow at that location. The system is then simulated to evaluate the resulting reliability of supply. If the specified reliability criterion is not met, the demand is reduced; otherwise, it is increased. At each iteration, the absolute value of the demand adjustment is halved. This process continues until the change in demand falls below a predefined precision threshold. The final value that satisfies the reliability criterion is considered the maximum allowable demand for that river segment under the given management conditions. Once the maximum allowable demand has been determined at all nodes of the model, the resulting simulation yields the corresponding flow patterns throughout the river network under those conditions. In this study, the flow on the final stretch of the Ebro River was taken as the representative circulation for each scenario. The resulting flow projections for the Lower Ebro provide an estimate of the minimum transport capacity of the river, since they assume the maximum possible utilization of available water resources in each climate scenario.

3. Results and Discussion

This section presents the results of the sediment transport simulations and discusses their implications for the Ebro River and Delta under various hydrological conditions. The analysis is structured in four parts. First, we characterize the current sediment transport capacity based on model calibration and the development of a rating curve. Second, we compare sediment transport under natural (pre-regulation) and current flow regimes to quantify the impact of river regulation. Third, we evaluate future projections of sediment transport capacity under climate change scenarios using hydrological inputs from both the SIMPA and ISIMIP3b models. Finally, we evaluate seasonal patterns and explore the potential for sediment delivery to the Delta under both present and future conditions.

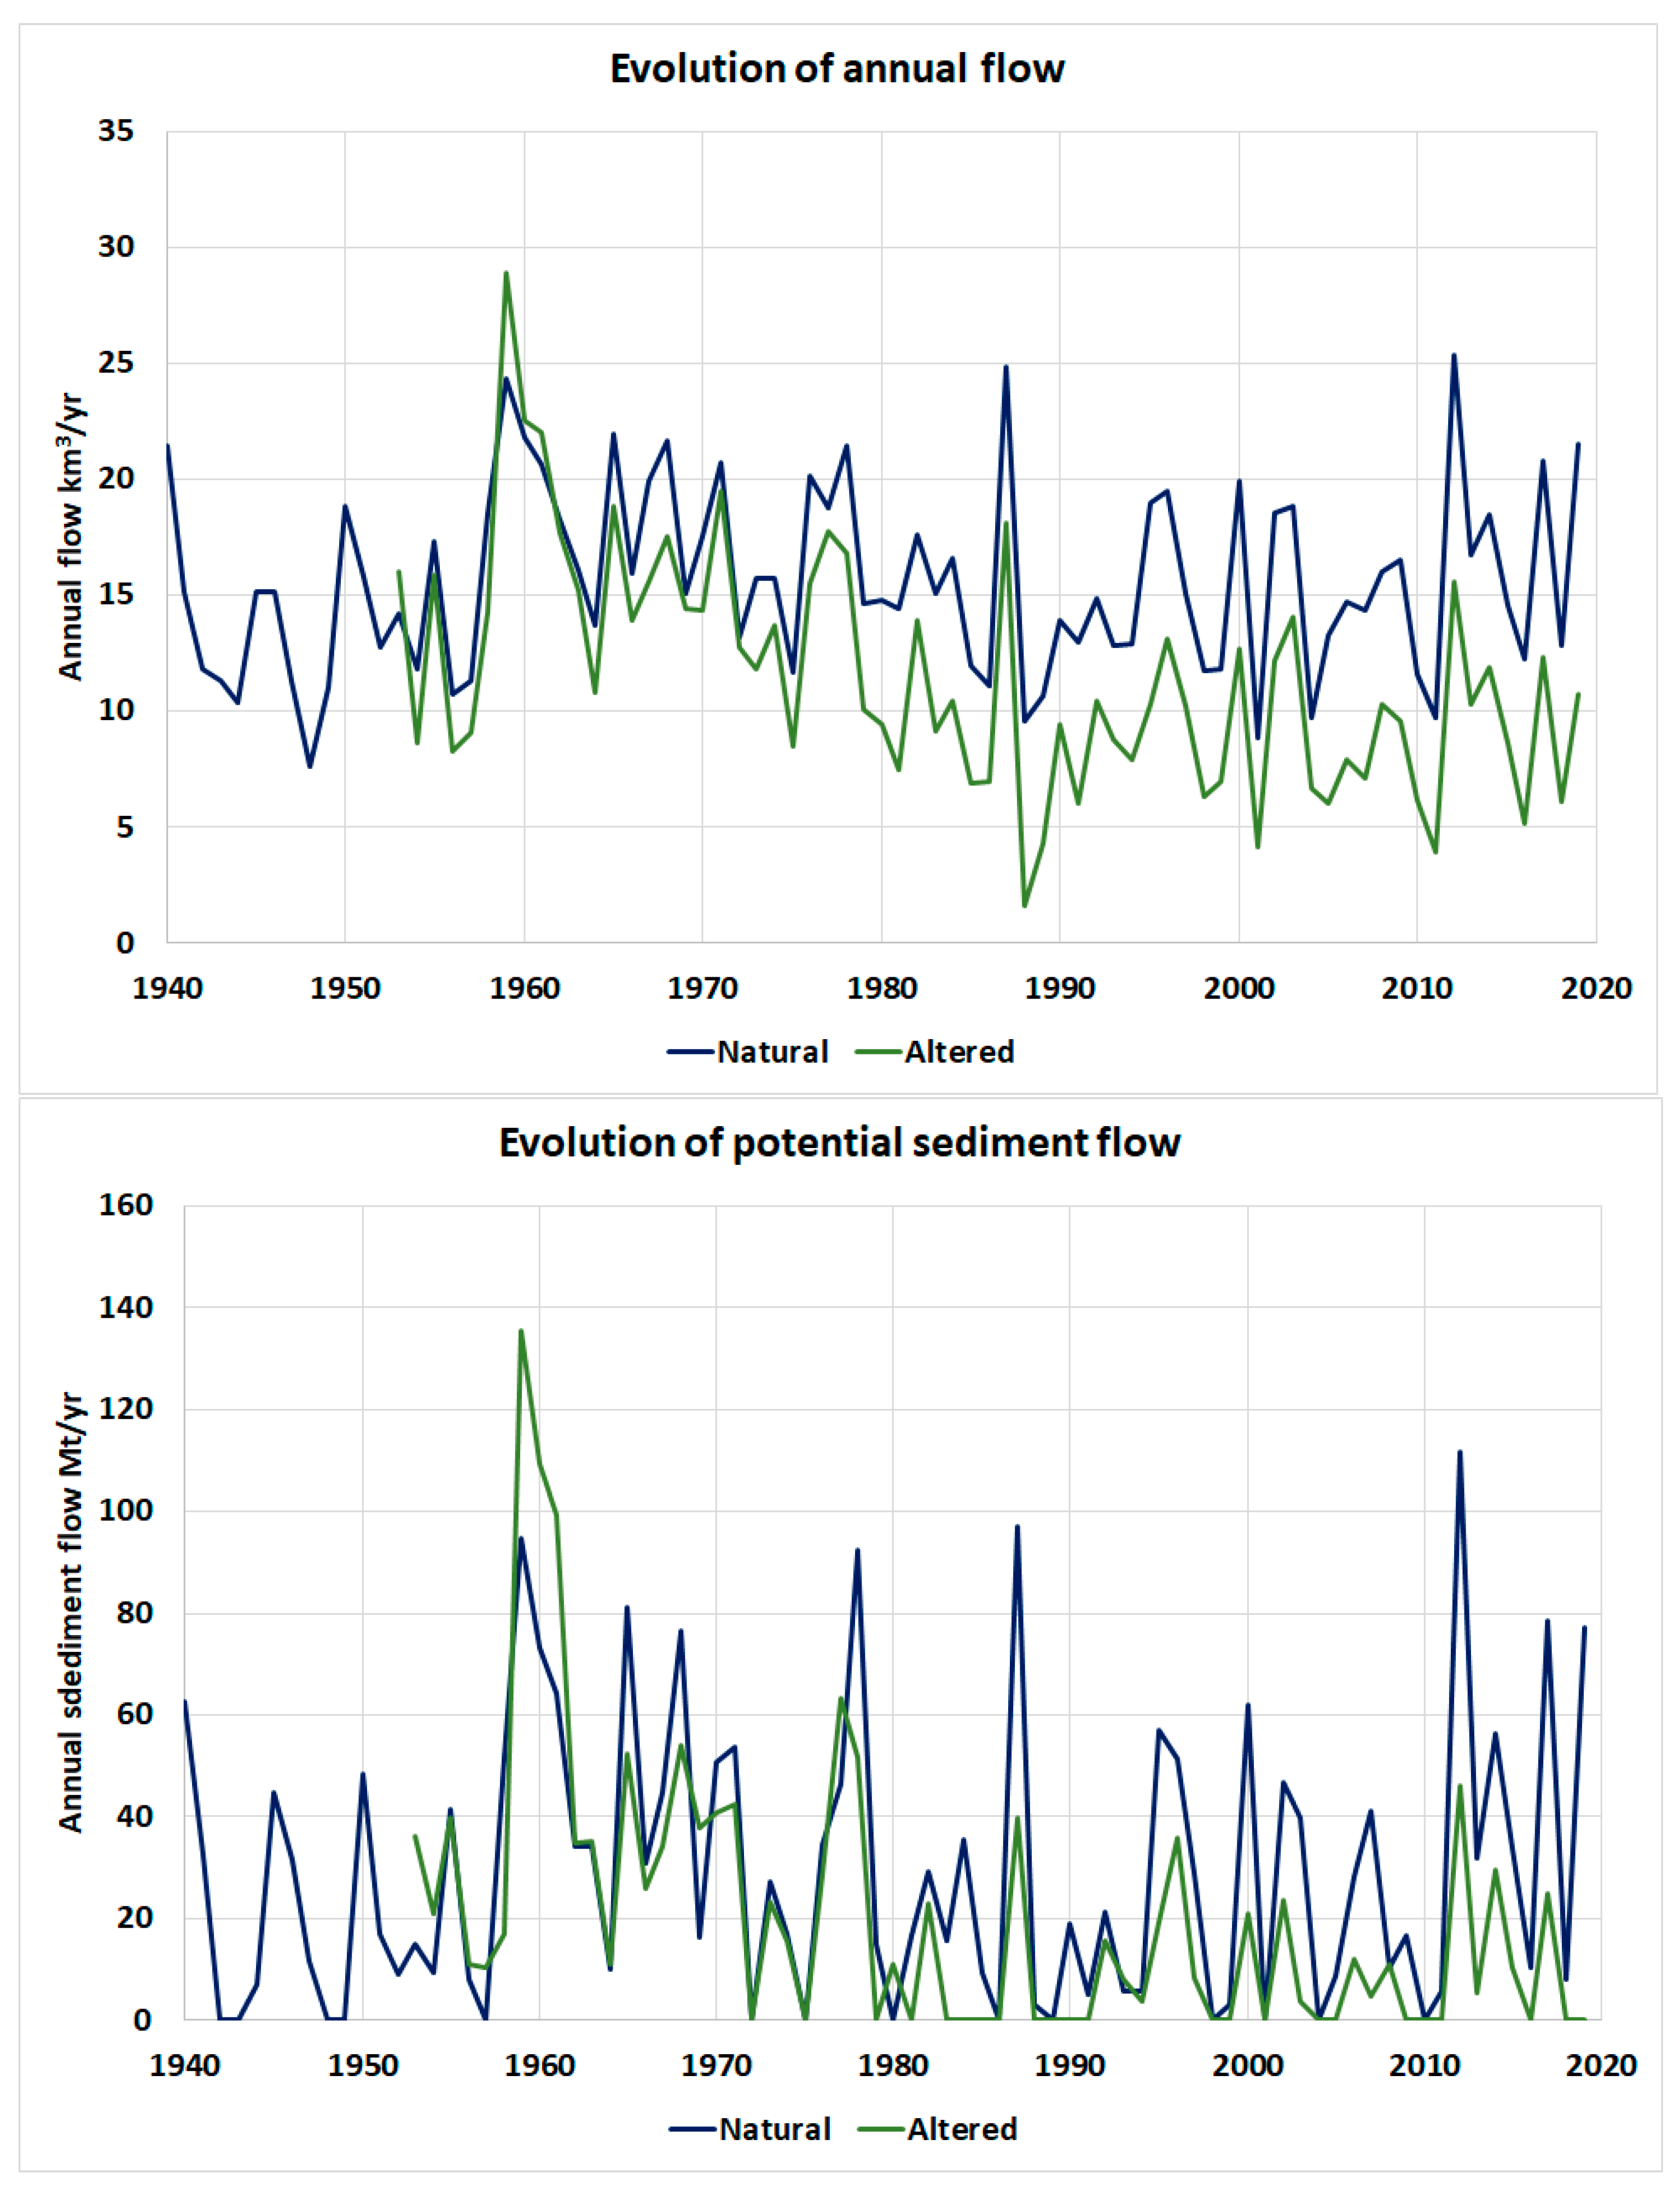
3.1. Current Potential Sediment Transport Under Natural and Altered Conditions

The term ‘current potential sediment transport’ refers to the sediment transport capacity of the river under current morphological and hydraulic conditions, assuming that sufficient sediment is available. It reflects the maximum theoretical transport that the present-day regulated river could support, rather than observed transport or natural pre-dam conditions.
The potential sediment transport for the period from 1953–1954 to 2019–2020 was estimated by applying the sediment transport rating curve to daily flow measurements from the Tortosa station. The average mean annual flow was 365.6 m3/s. The average potential sediment transport resulting from the sediment transport rating curve was 25.6 Mt/yr, a value significantly higher than the sediment flow currently observed in the river. The monthly flow time series for the entire Ebro Basin were derived from runoff maps generated by the SIMPA model. The available data covers the period from 1940–1941 to 2019–2020. The average annual flow in this period is 493.6 m3/s. The average potential sediment transport capacity was estimated at 29.5 Mt/yr. This estimate is very close to the 28.1 Mt/yr reported by Gorría in the late 19th century.
Naturalized flows are only available on a monthly time scale, whereas observed flows are recorded daily. To compare the potential transport of sediments under natural and altered conditions, monthly average flows must be used, which introduces an error due to the nonlinearity of the sediment transport rating curve. To estimate the magnitude of this error, we compared annual sediment transport rates calculated using daily and monthly data from the Tortosa gauging station. Figure 7 presents the results, showing both the time series comparison and a linear fit scatter plot. The difference between the two calculations appears moderate, with a linear fit slope of 1.11 and a coefficient of determination (R2) of 0.97. These results suggest that the use of a monthly time scale is acceptable, but sediment transport rates estimated on this scale should be increased by 11% to account for the underestimation caused by averaging.
The comparison between natural and altered conditions for annual flow and potential sediment transport computed on the monthly time scale is presented in Figure 8. A comparison of natural annual flows estimated with the SIMPA model with recorded flows measured at the Tortosa gauge station reveals a clear divergence between naturalized and observed flows starting in the 1960s, coinciding with the construction of reservoirs that enabled large-scale irrigation and increased water extractions. Although some irrigation development continues, most major irrigation districts were completed in the 1980s. Therefore, the period selected for comparison was from 1980–1981 to 2019–2020. During the last 40 years of available data, the average measured flow in Tortosa was 8.98 km3/yr, while the SIMPA model estimates a natural flow of 15.14 km3/yr. The resulting difference of 6.16 km3/yr is primarily attributed to irrigation abstractions. The Ebro River Basin Management Plan for 2022–2027 accounts for 924,400 ha of irrigated land with an annual demand of 8.141 km3/yr [59]. The estimated net loss of water to evapotranspiration, approximately 76% of the total abstraction, aligns with the expected values.
The impact of water abstractions on sediment transport is significantly greater than on annual flow. Potential sediment transport was estimated using the sediment transport rating curve applied to monthly flows, producing an average of 26.76 Mt/yr under natural conditions and only 8.91 Mt/yr under altered conditions over the last 40 years, which is a 67% reduction, compared to a 41% decrease in annual flow. Due to the non-linearity of the rating curve, estimates differ when applied to daily versus monthly flows. The curve indicates that sediment transport requires a minimum flow of approximately 709 m3/s, a threshold exceeded in 86 months (18% of the time) under natural conditions, but only in 34 months (7% of the time) under altered conditions.
Figure 9 presents the monthly average values of flow and potential sediment transport under natural and altered conditions. The figure shows that, in addition to water abstractions, flow regulation is also relevant to determine the potential transport of sediments under altered conditions. The seasonality of the flow shows that most water abstractions occur during the spring, summer, and fall months, leaving the average winter flows almost unchanged. However, altered winter flows are concentrated in wet years, when reservoirs release excess water. This leads to an increase in potential sediment transport under altered conditions during the winter months, which can be used to effectively manage sediment bypasses in reservoirs.
In conclusion, the potential for sediment transport is significantly reduced under current conditions of water management in the Ebro River Basin, but there is still capacity to transport almost 9 Mt/yr, which is a figure much larger than the sediment transport currently observed and exceeds what can be realistically expected to be bypassed from the reservoirs. However, it should be noted that in 20 of the 40 years analyzed, there would be no sediment transport because the discharges measured in Tortosa do not reach the transport activation threshold.

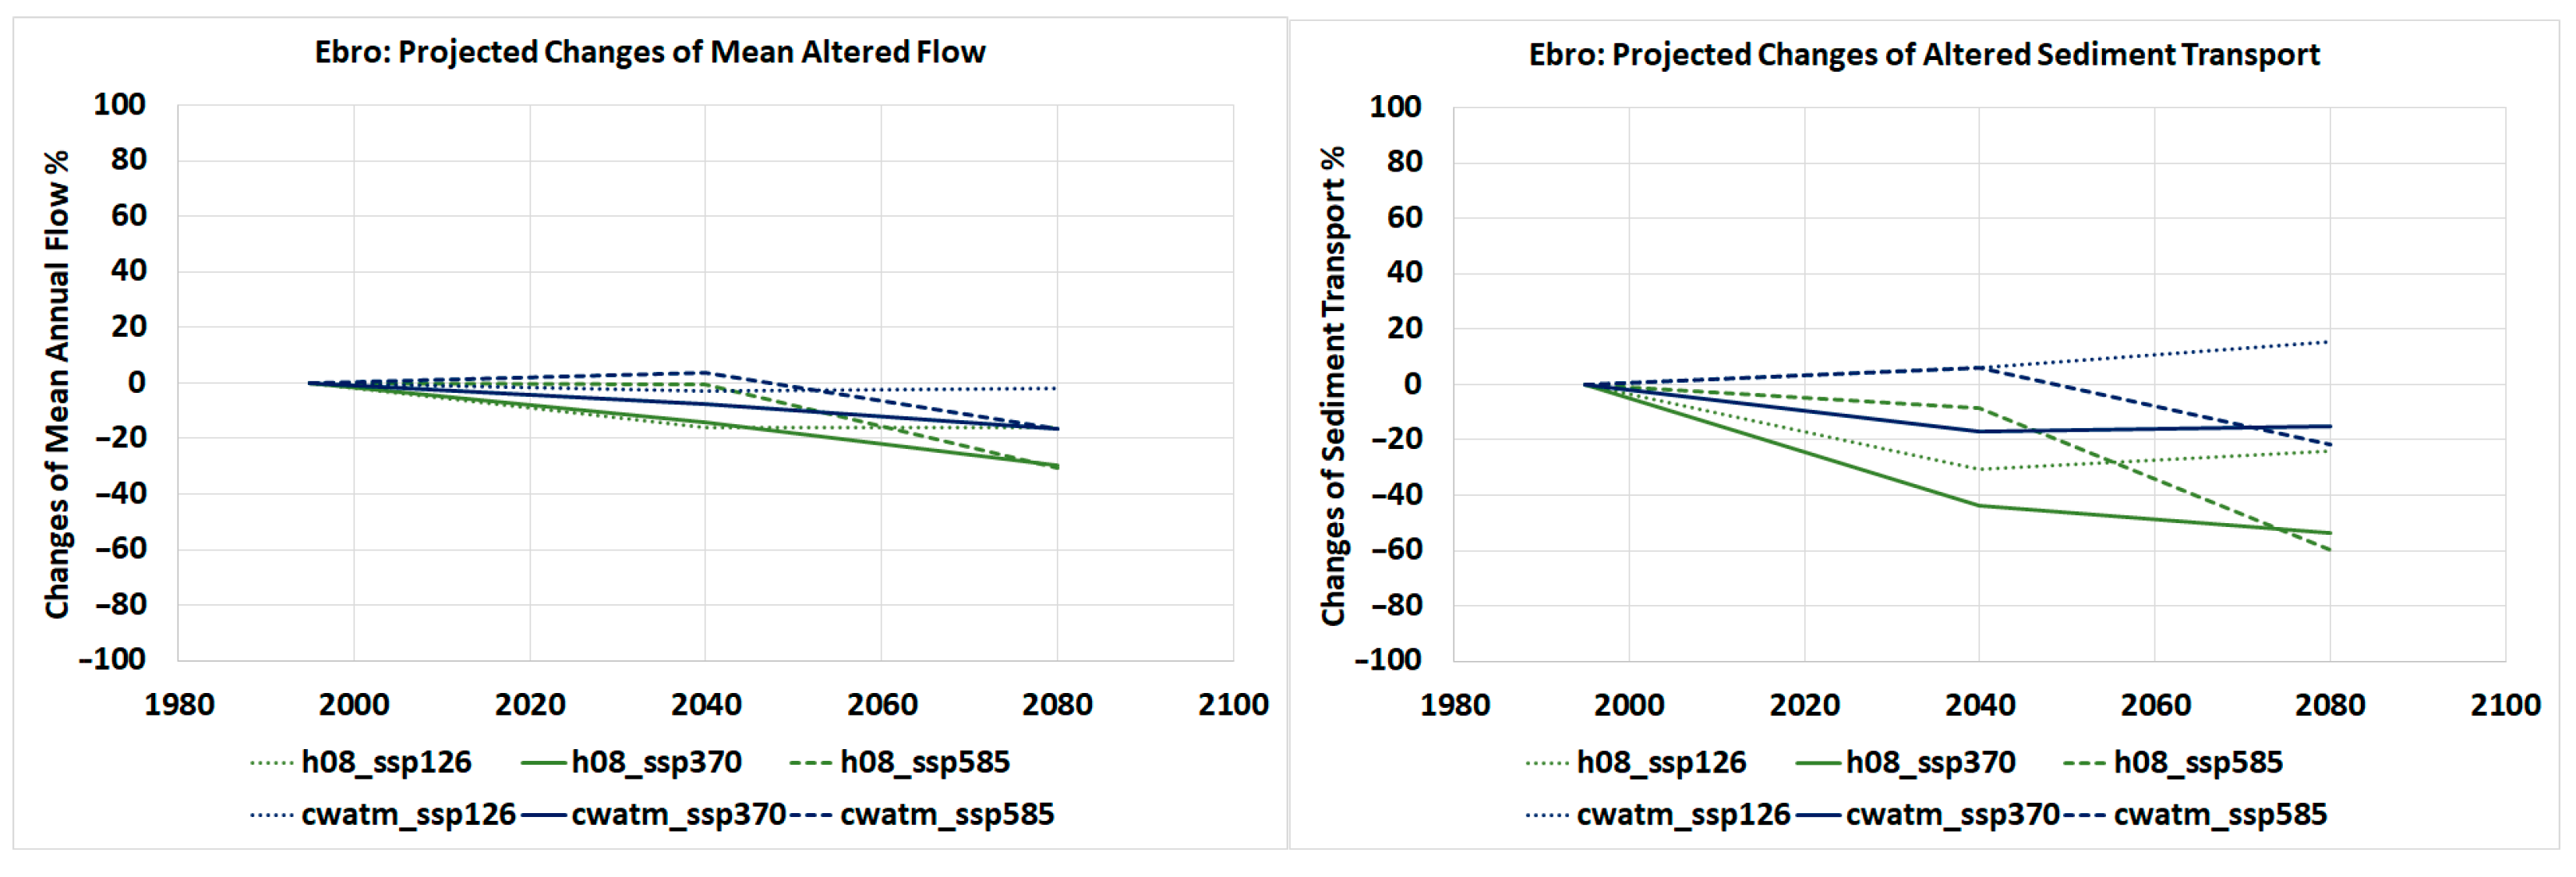
3.2. Potential Sediment Transport Under Climate Projections

This section studies how the transport capacity of the Ebro River is expected to evolve in the future using climate projections. First, the results under natural conditions are presented. The results corresponding to altered conditions are later analyzed under the hypothesis of maximum water use in the basin.

3.2.1. Sediment Transport Under Natural Conditions

The results produced by the SIMPA model and the ISIMIP hydrological models for the mean annual flow in all scenarios analyzed are presented in Table 1. Each row of Table 1 corresponds to a specific combination of a hydrological model forced with an observed dataset or a global climate model, while each column corresponds to a specific scenario. The values reported in the table are averages of mean annual flows taken over 40-year periods, expressed in km3/yr. The time period for SIMPA and the obsclim scenario spans from 1979–80 to 2018–19. This scenario corresponds to impact models forced with the observed climate in the actual time sequence, based on reanalysis data. This option was selected to validate the runoff obtained with the two global climate models against the results of the SIMPA model. The historical denomination corresponds to impact models forced with results from climate models, though not necessarily in the observed time sequence. This option was selected as a reference to estimate changes in potential sediment transport in the future. The time series of the historical scenario only covers up to the year 2014, so the time period selected for this scenario is from 1974–1975 to 2013–2014. To facilitate comparison, results for the obsclim scenario in the time window from 1974–1975 to 2013–2014 are also presented. Three future climate projections are included: ssp126, which corresponds to the SSP1-2.6 scenario; ssp370, which corresponds to the SSP3-7.0 scenario; and ssp585, which corresponds to the SSP5-8.5 scenario. Two time periods were selected for each climate projection: from 2020–2021 to 2059–2060 and from 2060–2061 to 2099–2100. Average values over the five climate drivers for the H08 and CWatM models are also included in the table.
The results show a significant difference between the mean annual flow estimated with the two global hydrological models. For the obsclim scenario, H08 provides a mean annual flow for the Ebro River of 12.63 km3/yr, while the estimate of CWatM is 15.17 km3/yr. The estimate of the SIMPA model, 14.97 km3/yr, is almost coincident with that of the CWatM model. The values for the average over the five climate drivers of the historical scenario are 13.49 km3/yr for the H08 model and 15.62 km3/yr for the CWatM model. The corresponding values of the obsclim scenario for the historical period, from 1974–75 to 2013–2014, are 13.19 km3/yr for the H08 model and 15.63 km3/yr for the CWatM model, which means that there is an excellent agreement between the obsclim and the average of the results obtained with the five climate drivers used in the historical scenario. The projections for future scenarios show some sensitivity to the climate drivers used but provide a consistent picture of the expected evolution of mean annual flow in the Ebro Basin. The mean annual flow is expected to decrease in the Ebro Basin for most scenarios.
The comparison of the time sequence of annual flows in the Ebro River produced by the SIMPA model and the average results of the two ISIMIP hydrological models is shown in Figure 10. Both ISIMIP models show good agreement with SIMPA in the overlapping period 1940–2019 for annual flows. The agreement of the CWatM model appears to be better. Figure 11 shows the scatter plot of annual flows in the Ebro River. The plot on the left shows the comparison between the H08 model and the SIMPA model, and the plot on the right shows the comparison between the CWatM model and the SIMPA model. For the H08 model, the slope of the linear regression fit is 0.89, suggesting an underestimation of the annual flow values for the H08 model compared to the SIMPA model. The coefficient of determination is very high, 0.986. For the CWatM model, the results are much better. The slope of the linear regression fit is 1.04, suggesting only a small bias. The coefficient of determination is excellent, 0.994.
The agreement between the SIMPA model and the ISIMIP models on the annual time scale is generally good. However, there is a significant discrepancy in their representation of seasonality. Figure 12 illustrates the average monthly flow rates simulated by the three models. The left-hand graph compares the mean flow values, while the right-hand graph compares the mean potential sediment transport values derived from flow rates using the estimated rating curve. As shown, the ISIMIP models simulate peak flows during the autumn and winter months, whereas the SIMPA model simulates peak flows in spring. This divergence is likely due to the inadequate representation of snow accumulation in the ISIMIP models. The Ebro River exhibits a pluvio-nival regime, characterized by snow accumulation in the Pyrenees during winter, leading to peak flows in spring during snowmelt. The SIMPA model accurately captures this behavior, whereas the ISIMIP models appear to inadequately simulate the snow accumulation and melt processes. The right-hand graph indicates that this misrepresentation of the seasonal flow distribution results in a significant bias in estimating the potential sediment transport capacity. Specifically, the ISIMIP models produce disproportionately high sediment transport values in autumn and spring compared to those obtained with the SIMPA model. The average potential sediment transport produced by the SIMPA model in the period from 1978–79 to 2018–19 is 26.76 Mt/yr. The result obtained with the H08 model is 17.74 Mt/yr, while the result with the CWatM model is 46.89 Mt/yr.
A bias correction procedure was applied to improve the alignment between the ISIMIP models and the SIMPA model. This involved adjusting the monthly flow values by multiplying them by the ratio of the average monthly values of the ISIMIP model to those of the SIMPA model over the period from 1978–1979 to 2018–2019. After applying this correction, the potential sediment transport obtained with the H08 model is 32.79 Mt/yr, while the result with the CWatM model is 42.97 Mt/yr
The time series produced by the SIMPA model and the ISIMIP hydrological models in all scenarios analyzed were processed using the sediment transport rating curve to obtain projections of potential sediment transport under natural conditions. The analysis was performed on the bias-corrected series. The results are presented in Table 2. The values correspond to the same periods shown in Table 1. Table 2 presents the values of mean annual potential sediment transport obtained for the SIMPA and the average values obtained with all climate drivers in each ISIMIP model and scenario. The rows and columns in Table 2 follow the same structure as in Table 1.
The results show a significant difference between the mean potential sediment transport estimated with the SIMPA model and those estimated with the two global hydrological models, despite bias correction. For the obsclim scenario, the estimate of the SIMPA model is 26.76 Mt/yr. H08 provides a mean sediment transport for the Ebro River of 23.83 Mt/yr (11% less than SIMPA), while the estimate of CWatM is 37.87 Mt/yr (41% more than SIMPA). Therefore, these estimates are highly uncertain. The values for the average over the five climate drivers of the historical scenario are 31.11 Mt/yr for the H08 model and 43.12 Mt/yr for the CWatM model. The corresponding values of the obsclim scenario for the historical period from 1974–75 to 2013–2014 are 28.58 Mt/yr for the H08 model and 42.09 Mt/yr for the CWatM model. The projections for future scenarios show more variability than in the case of annual flows. The potential for sediment transport under natural conditions is expected to decrease dramatically in some scenarios.
Figure 13 shows a summary of projected changes in mean annual flow and potential sediment transport under natural conditions. The projected reductions in mean annual flow will dramatically reduce the potential sediment transport capacity of the Ebro River under natural conditions, due to the non-linearity of the sediment transport rating curve. Although the H08 and CWatM models produce different absolute figures, the relative projected evolution is similar in both models. In the first time period, 2020–2059, the expected reduction projected by H08 ranges between 14% and 22% for mean annual flow and between 34% and 54% for sediment transport. The CWatM model projects a reduction between 5% and 11% for mean annual flow and between 4% and 20% for sediment transport.

3.2.2. Sediment Transport Under Altered Conditions

The impact of projected reductions on the potential sediment transport capacity of the Ebro River under altered conditions will depend on how the Ebro River is managed in the future. Under the current management strategy, roughly 6 km3/yr are abstracted from the 15 km3/yr of natural flow, leaving 9 km3/yr in Tortosa. This reduces the potential sediment transport capacity from 27 Mt/yr under natural conditions to 9 Mt/yr, but this figure is still enough to transport the sediment required by the delta. The projected reductions suggest a future mean annual flow between 12 km3/yr and 14 km3/yr. The potential sediment transport capacity for the natural regime is expected to be reduced to between 14 Mt/yr and 25 Mt/yr. If the potential sediment transport under altered conditions was similarly reduced, it would fall to a range between 4.5 km3/yr and 8 km3/yr, and some carrying capacity would remain in the river. However, if current abstractions of 6 km3/yr were maintained in the future, available flow would be reduced to a range between 6 km3/yr and 8 km3/yr, which represents a larger reduction than that of natural flow. Therefore, it is very likely that the potential for sediment transport under altered conditions will be reduced more than under natural conditions.
The results produced by the AgWaMed project for the mean annual flow under the hypothesis of maximum use of water resources under each climate scenario are presented in Table 3, following the same structure as in previous tables. It should be noted that the water demand is different in each of the scenarios since it has been assumed that the water resources corresponding to each scenario are used to the maximum.
The results show that the estimate of the CWatM model fits the observed flow in Tortosa better than that of the H08 model, but H08 is closer to the results provided by the SIMPA model. For the obsclim scenario, H08 provides a mean annual flow for the Ebro River of 6.21 km3/yr, while the estimate of CWatM is 8.91 km3/yr. The estimate of the SIMPA model, 6.57 km3/yr, is similar to that of the H08 model, while the observed flow in Tortosa, 8.96 km3/yr, is almost coincident with that of the CWatM model. The values for the average over the five climate drivers of the historical scenario are 6.72 km3/yr for the H08 model and 9.35 km3/yr for the CWatM model.
The time series produced by the water resources simulation model in all scenarios analyzed were processed using the sediment transport rating curve to obtain projections of potential sediment transport in altered conditions. The results are shown in Table 4, which presents the values of the mean annual potential sediment transport obtained for each scenario, following the same structure as in previous tables. The results show a significant difference between the mean potential sediment transport estimated with the results of the water resources model under the hypothesis of maximum water use and those estimated with the observed flow in Tortosa. The differences are due to uncertainty in modeling and to the fact that current water use in the Ebro Basin is not at maximum.
The results obtained in the analysis of altered flow in future projections are summarized in Figure 14. The effects are similar to those shown in Figure 13, but with a larger spread between the hydrological models and the climate scenarios. In the first time period, 2020–2059, the expected reductions projected by the H08 model range between 0% and 16% for mean annual flow and between 8% and 44% for sediment transport. The changes projected by the CWatM model for mean annual flow range between an increase of 3% and a decrease of 3%. These changes result in a range between an increase of 6% and a decrease of 17% for potential sediment transport.

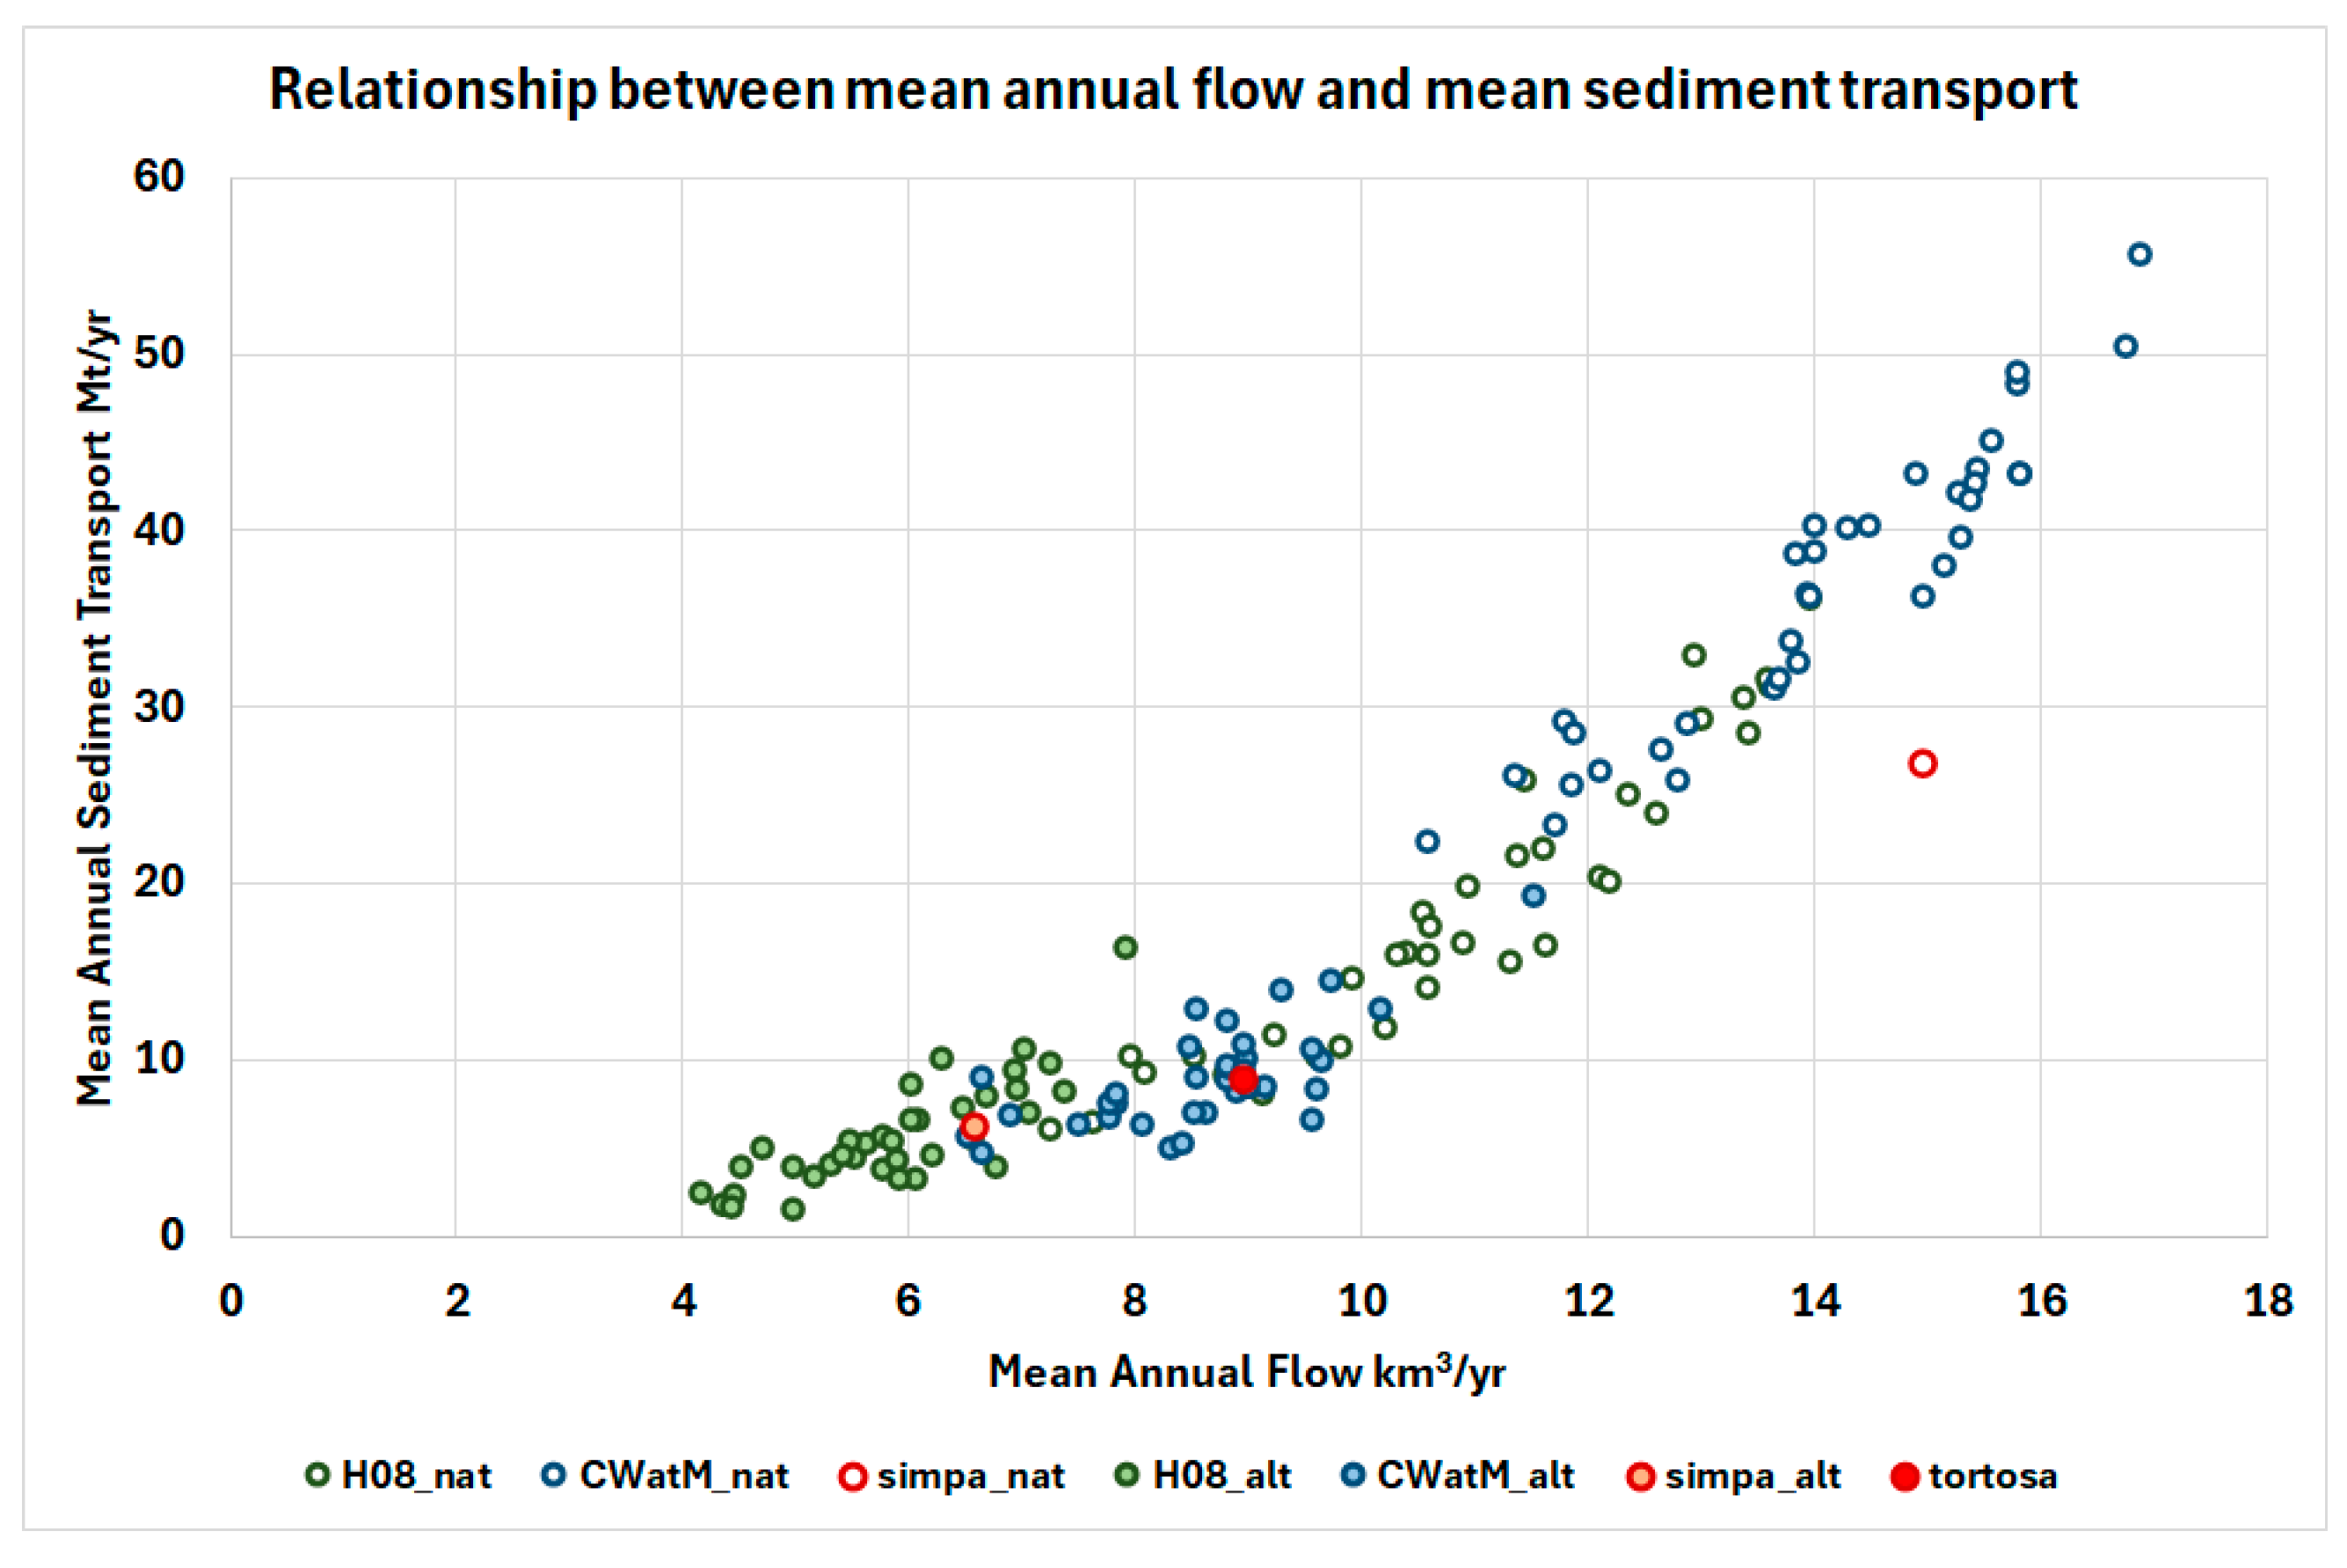
3.3. Relationship Between Annual Flow and Sediment Transport

The analyses conducted in this study allow us to characterize the relationship between average annual river flow and potential sediment transport capacity. Figure 15 synthesizes the results of all simulations, showing the mean potential sediment transport capacity as a function of the mean annual flow across the various scenarios and models evaluated. The figure clearly illustrates a non-linear relationship between these two variables. The most reliable data correspond to the observed flow at Tortosa and the results derived from the natural and altered flow scenarios simulated with the SIMPA model.
In particular, the SIMPA estimate for natural flow deviates from the trend suggested by the ISIMIP model outputs. This discrepancy arises from differences in the seasonal distribution of flow: in the ISIMIP models, discharge is concentrated in just a few months of the year, whereas in the SIMPA model, flow is more evenly distributed throughout the year. Since sediment transport is most effective during high-flow periods, ISIMIP models yield a higher potential transport capacity than that of SIMPA under equivalent annual flow volumes.
The comparison between SIMPA and Tortosa results under altered conditions indicates that the assumption of maximum water use adopted in the modeling is conservative for the observed period. Both the observed flow and sediment transport at Tortosa are higher than those estimated by the SIMPA model. However, given that full utilization of available water resources in the Ebro Basin is likely to occur in the future, it is appropriate to base the analysis on this conservative assumption.

3.4. Limitations of the Analysis

As with any complex modeling and scenario-based study, our analysis presents certain limitations that should be acknowledged. These limitations relate to methodological assumptions, data availability, spatial and temporal resolution, and the inherent uncertainties associated with climate projections and hydrological modeling. Recognizing these constraints is essential to properly contextualize the results and guide future improvements.
One limitation of this study is the use of monthly flow averages in sediment transport estimations, which introduces a nonlinear bias due to the shape of the transport rating curve. A comparative analysis using daily and monthly observed data at the Tortosa station showed an average underestimation of 11% in annual sediment transport when using monthly data. This effect is systematic and reflects the loss of information on flow variability, particularly during short-duration, high-flow events that are critical for sediment mobilization. Although this bias is relatively small in the context of long-term average transport capacity, it could become significant over decadal projections, particularly if absolute values are required for infrastructure design or sediment management planning. In our case, since the same time resolution is applied across all scenarios, the relative comparisons and trends remain consistent and reliable. Future studies could incorporate event-based or daily-resolution modeling, particularly focused on flood events or controlled releases, to better capture episodic sediment pulses that dominate delta sediment budgets. Such approaches would be especially relevant to evaluate the feasibility and efficiency of sediment flushing or augmentation strategies.
The analysis presented in this study focuses on the transport of suspended sediment, using a calibrated median grain size of D50 = 0.0005 mm (clay), which was found to be the largest particle size that could be transported to the delta without significant deposition under current flow conditions. Simulations carried out with coarser fractions (silt with D50 = 0.005 mm) resulted in substantial sedimentation within the first few kilometers downstream of the Flix dam, confirming that current discharges are insufficient to transport such material over long distances. This modeling choice reflects the dominant transport dynamics in the current hydrological regime of the Lower Ebro River, where coarse sediment is largely trapped in reservoirs and where downstream sediment delivery is predominantly composed of fine suspended material. As noted by [21], the interruption of coarse sediment flow has significantly altered the morphology of the riverbed and the patterns of delta accretion.
Although this focus allows for a reliable assessment of the present and future suspended sediment transport potential, it constitutes a conservative estimate of total sediment flux, as bedload transport is not considered. Coarse fractions (silt and sand), although largely immobilized today, are crucial for long-term delta morphodynamics and restoration strategies. Future work should integrate bedload transport modeling and explore the feasibility of restoring coarse sediment connectivity through sediment augmentation or engineered flushing schemes [25]. These approaches are critical to address the sediment deficit in the delta and to recover the full range of sedimentary processes necessary for the sustainability of the delta.

4. Conclusions

This study provides a comprehensive assessment of the sediment transport potential of the Ebro River under historical, current, and future hydrological conditions. Using a sediment transport rating curve developed through hydrodynamic modeling, the analysis quantifies the impacts of flow regulation and climate change on the river’s capacity to deliver sediment to the delta.
The results reveal a significant decline in sediment transport capacity due to anthropogenic interventions. Compared to late-19th-century’s natural reference conditions, when the river transported an estimated 28.1 Mt of sediment annually, the current capacity has declined by about 67%, with present-day flows able to convey only around 9 Mt/yr. This reduction results from a 41% drop in mean annual flow, primarily attributed to water abstractions and flow regulation throughout the Basin.
Projections for the mid- and late-21st century indicate further declines in both natural and altered flow regimes. Between 2020 and 2060, natural flows are expected to decrease by 10–15%, leading to reductions of 15–30% in sediment transport capacity. Under altered flow conditions, assuming maximum water use, an additional 10% reduction in flow could result in up to 30% further decline in sediment transport. These trends become more pronounced between 2060 and 2100, with potential decreases of up to 30% in natural flows and up to 50% in transport capacity.
Despite these reductions, current flow conditions still offer sufficient capacity to transport more sediment than is currently observed reaching the delta, suggesting that improving sediment supply (through bypass systems or sediment releases) could be effective if it is synchronized with appropriate flow management. However, the strong non-linear relationship between discharge and transport underscores the need for strategic planning, ensuring that flow releases are timed and scaled to activate sediment mobilization.
The presented analysis should be taken only as a first approximation to the problem, since future projections show a highly uncertain scenario. The main sources of uncertainty of the analysis carried out are the variations between the emission scenarios and between the climate models, the limitations of the hydrological models to capture the real hydrology of the basin, and the non-linearity of the relationship between flow and sediment transport capacity.
In general, the findings highlight the urgent need for integrated sediment and flow restoration strategies in the Ebro River Basin. Such efforts are critical to restoring sediment continuity, protecting the Ebro Delta, and enhancing resilience to ongoing and future climate pressures.

Supplementary Materials

The following supporting information can be downloaded at https://www.mdpi.com/article/10.3390/w17111620/s1, Data.xlsx: A spreadsheet that contains projections of monthly flows in the Ebro River under natural conditions and under maximum water use for all the scenarios analyzed.

Author Contributions

Conceptualization, L.G. and F.M.-C.; methodology, L.G.; software, D.S. and D.L.-G.; validation, A.I. and D.S.; data curation, D.S. and D.L.-G.; writing—original draft preparation, F.M.-C.; writing—review and editing, L.G.; supervision, A.I.; funding acquisition, A.I. and L.G. All authors have read and agreed to the published version of the manuscript.

Funding

This research was funded by the European Union’s Horizon 2020 research and innovation program under grant agreement No 101037097 (REST-COAST project).

Data Availability Statement

Daily flow data in the Tortosa gauging station may be downloaded from https://ceh.cedex.es/anuarioaforos/afo/estaf-datos.asp?indroea=9027, last accessed on 11 April 2025. The monthly series of flow in the Ebro River used in the analysis are shared as Supplementary Materials.

Acknowledgments

We gratefully acknowledge Carles Ibàñez of the Institute of Agrifood Research and Technology for his insightful suggestion to perform the analyses presented in this paper. We also thank Javier Sánchez Martínez of the Directorate General for Water for leading and funding the bathymetric survey of the lower Ebro River, which was commissioned to TRAGSA and carried out by Ecohydros. We further acknowledge Rogelio Galván of the Ebro River Basin Authority for facilitating access to the data, and Miguel Ángel García Vera for his assistance in coordinating the data request. We also extend our sincere thanks to the rest of the REST-COAST team for their fruitful discussions, which played a significant role in refining our ideas and shaping the final work. During the preparation of this manuscript/study, the authors used Writefull for Word and ChatGPT, version 4 for the purposes of proofreading, grammar and style correction. The authors have reviewed and edited the output and take full responsibility for the content of this publication.

Conflicts of Interest

The authors declare no conflicts of interest.

Abbreviations

The following abbreviations are used in this manuscript:
AR66th Assessment Report
CHEConfederación Hidrográfica del Ebro (Ebro Basin Authority)
CWatMCommunity Water Model
ICOLDInternational Commission on Large Dams
IPCCIntergovernmental Panel on Climate Change
ISIMIPInter-Sectoral Impact Model Intercomparison Project
SAIHAutomated Hydrologic Information System
SIMPAIntegrated System for Rainfall–Runoff Modelling
SSPShared Socioeconomic Pathway
SWEShallow Water Equations

Appendix A

Description of the Hydrodynamic Model

Iber solves the 2-D depth-integrated shallow-water equations (SWE) using a finite volume scheme. This scheme can manage unstructured meshes, irregular topographies, friction losses, and wet-dry fronts [60]. The 2-D SWEs are derived from the Navier–Stokes equations by assuming quasihydrostatic flow and incompressibility of water. The 2D mass conservation equation in a Cartesian coordinate system is given by:
h t + h U x x + h U y y = 0 ,
The momentum balance equations in conservative form with source terms in a Cartesian coordinate system are:
t h U x + x h U x 2 + g h 2 2 + y h U x U y                                                               = g h z b x + τ s , x ρ τ b , x ρ + x ν t h U x x + y ν t h U x y ,
and
t ( h U y ) + y h U y 2 + g h 2 2 + x h U y U x                                                               = g h z b y + τ s , y ρ τ b , y ρ + x ν t h U y x + y ν t h U y y .
In the previous equations, h is the water depth, U i is the depth-averaged velocity along the i direction, ρ is the density of the water, z b is the channel-bottom elevation, g is the acceleration of gravity, τ b , i is the bed friction along the i direction, τ s , i is the free-water surface friction along the i direction (i.e., wind traction), and ν t is the turbulent eddy viscosity. Molecular and eddy viscosities, wind traction and Coriolis acceleration were neglected in the simulations performed.
The bed friction terms, τ b , i , read:
τ b , i = ρ g h n 2 U i 2 h 4 / 3 = 0 ,
where j = x ,   y , and n is the Manning’s coefficient.
Iber erosion and sediment transport module solves the non-cohesive sediment transport equations with uniform granulometries, in a non-stationary regime. The hydrodynamics, sediment transport processes, and river morphology interplay at mobile-bed simulations. Iber v3.1 software couples these three processes, simulating sediment transport as bedload and suspended load.
The sediment transport process is simulated through the 2-D Exner equation [61,62,63]. The equation provides the bed elevation evolution in response to the erosion and sedimentation and is given in the form of bedload and suspended load. It reads:
( 1 ϕ ) z b t + q b , x x + q b , y y + E D = 0 ,
where ϕ is the porosity, q b , i is the bedload discharge along the i direction, E is the entrainment deposition term of suspended sediment on the bed, and D is the deposition term of suspended sediment on the bed.
The bedload solid flow rate due to the bedload transport is simulated using the van Rijn equation [64], as it provides satisfactory results compared with laboratory experiments [33]. The equation reads:
q b * = 0.053 D * 0.3 τ * τ c r i t * 1 2.1 ,
where q b * is the dimensionless bedload solid volumetric flow rate, D * is the dimensionless diameter of solid particles, τ * is the dimensionless shear stress acting on the particles, and τ c r i t * is the dimensionless critical shear stress. The dimensionless bedload solid volumetric flow rate, q b * , reads:
q b * = q b s 1 g D 3 ,
where q b is the bedload solid volumetric flow rate, s is the ratio between the densities of the particles and water, s = ρ _ S ρ , and D is the characteristic diameter of sediments, usually taken as the median diameter D = D 50 .
The dimensionless diameter of solid particles is given by:
D * = D g ( s 1 ) ν 2 1 / 3 ,
ν being the kinematic viscosity of water.
The dimensionless shear stress reads:
τ * = τ b ρ s 1 g D ,
τ b being the bed friction shear stress, given by Equation (A4).
The dimensionless critical shear stress τ c r i t * is given by the Soulsby-Whitehouse equation [65], based on the experiments of Shields [66]. It is given by:
τ c r i t * = 0.3 1 + 1.2 D * + 0.055 1 e 0.02 D * .
Iber simulates the suspended sediment transport with the depth-averaged convection-diffusion equation for the sediment concentration. The model accounts for the turbulent diffusion and the equilibrium suspended concentration, and is given by:
h C t + h U x C x + h U y C y = x Γ + ν t S c h C x + y Γ + ν t S c h C y + D s , x x + D s , y y + E D ,
where C is the depth-averaged concentration of suspended solids, Γ is the molecular diffusion coefficient for suspended solids, S c is the Schmidt number, which relates the momentum turbulent diffusion coefficient with the suspended turbulent diffusion coefficient, and D s , i is the suspended sediment dispersion along the i direction due to the non-homogeneous vertical velocity profile and sediment concentration.
The Entrainment/Deposition term, (E-D), models the bedload grains that become suspended (entrainment) and deposited from suspended sediments to the bed layer. We simulate the Entrainment/Deposition term with the van Rijn formula [67], given by:
E D = α ω s C * C ,
where α is a coefficient that relates the mean suspended particle concentration and the river bedload concentration, ω s is the fall velocity of the suspended sediments, C * is the depth-averaged suspended load concentration at equilibrium conditions, and C is the depth-averaged suspended load concentration.
The fall velocity of the suspended sediments for sand particles is computed using van Rijn [68] recommendations. For particles smaller than about 0.1 mm, ω s is given by:
ω s = s 1 g D 50 2 18 ν ,
for suspended sand particles in the range 0.1 to 1 mm, the fall velocity is:
ω s = 10 ν D 50 1 + 0.01 s 1 g D 50 3 ν 2 0.5 1 ,
and for particles larger than 1 mm, the following equation is used:
ω s = 1.1 ( s 1 ) g D 50 0.5 .
The depth-averaged suspended load concentration at equilibrium conditions, C^*, reads [68]:
C * = 1 α 0.005 T 1.5 D * 0.3 ,
where T is the transport stage parameter given by:
T = U * 2 U c r i t * 2 U c r i t * 2 ,
in which U c r i t * is the critical bed-shear velocity, that according to Shields [65] reads:
U c r i t * = τ c r i t * ρ ,
and bed-shear velocity, U * , reads [67]:
U * = g C U ¯ ,
in which C = 18 l o g ( ( 12 R b ) ( 3 D 90   ) ) is the Chézy-coefficient related to grains, R b is the hydraulic radius related to the bed according to Vanoni-Brooks [69], and U ¯ is the mean flow velocity.
The system of partial differential equations is solved using a first-order finite volume scheme based on the Monotonic Upwind Scheme for Conservation Laws [70].

References

  1. Batalla, R.J.; Vericat, D.; Tena, A. The fluvial geomorphology of the lower Ebro (2002–2013): Bridging gaps between management and research. Cuad. Investig. Geográfica 2014, 40, 29–51. [Google Scholar] [CrossRef]
  2. Vericat, D.; Batalla, R.J. Sediment transport in a large impounded river: The lower Ebro, NE Iberian Peninsula. Geomorphology 2006, 79, 72–92. [Google Scholar] [CrossRef]
  3. Palanques, A.; Plana, F.; Maldonado, A. Recent influence of man on the Ebro margin sedimentation system, northwestern Mediterranean Sea. Mar. Geol. 1990, 95, 247–263. [Google Scholar] [CrossRef]
  4. Mikhailova, M.V. Transformation of the Ebro River Delta under the impact of intense human-induced reduction of sediment runoff. Water Resour. 2003, 30, 370–378. [Google Scholar] [CrossRef]
  5. Batalla, R.J.; Gómez, C.M.; Kondolf, G.M. Reservoir-induced hydrological changes in the Ebro River basin (NE Spain). J. Hydrol. 2004, 290, 117–136. [Google Scholar] [CrossRef]
  6. Rodríguez-Santalla, I.; Navarro, N. Main threats in mediterranean coastal wetlands. The Ebro delta case. J. Mar. Sci. Eng. 2021, 9, 1190. [Google Scholar] [CrossRef]
  7. Sánchez-Arcilla, A.; Cáceres, I.; Roux, X.L.; Hinkel, J.; Schuerch, M.; Nicholls, R.J.; Otero, d.M.; Staneva, J.; de Vries, M.; Pernice, U.; et al. Barriers and enablers for upscaling coastal restoration. Nat. Based Solut. 2022, 2, 100032. [Google Scholar] [CrossRef]
  8. Day, J.W.; Ibáñez, C.; Pont, D.; Scarton, F. Status and Sustainability of Mediterranean Deltas: The Case of the Ebro, Rhône, and Po Deltas and Venice Lagoon. In Coasts and Estuaries: The Future; Elsevier: Amsterdam, The Netherlands, 2019; pp. 237–249. [Google Scholar] [CrossRef]
  9. Blum, M.D.; Roberts, H.H. Drowning of the Mississippi Delta due to insufficient sediment supply and global sea-level rise. Nat. Geosci. 2009, 2, 488–491. [Google Scholar] [CrossRef]
  10. Kondolf, G.M.; Rubin, Z.K.; Minear, J.T. Dams on the Mekong: Cumulative sediment starvation. Water Resour. Res. 2018, 50, 5158–5169. [Google Scholar] [CrossRef]
  11. Xie, D.; Pan, C.; Wu, X.; Gao, S.; Wang, Z. The variations of sediment transport patterns in the outer Changjiang Estuary and Hangzhou Bay over the last 30 years. J. Geophys. Res. Ocean. 2017, 122, 2999–3020. [Google Scholar] [CrossRef]
  12. Syvitski, J.P.M.; Vörösmarty, C.J.; Kettner, A.J.; Green, P. Impact of humans on the flux of terrestrial sediment to the global coastal ocean. Science 2005, 308, 376–380. [Google Scholar] [CrossRef]
  13. Stanley, D.J.; Warne, A.G. Nile Delta in its destruction phase. J. Coast. Res. 1998, 14, 794–825. [Google Scholar]
  14. Darby, S.E.; Dunn, F.E.; Nicholls, R.J.; Cohen, S.; Zarfl, C.; Fekete, B.M. Fluvial sediment supply to a mega-delta reduced by shifting tropical-cyclone activity. Nat. Clim. Change 2015, 5, 494–498. [Google Scholar] [CrossRef]
  15. Hauer, C.; Leitner, P.; Unfer, G.; Pulg, U.; Habersack, H.; Graf, W. The Role of Sediment and Sediment Dynamics in the Aquatic Environment. In Riverine Ecosystem Management; Aquatic Ecology Series; Schmutz, S., Sendzimir, J., Eds.; Springer: Cham, Switzerland, 2018; Volume 8. [Google Scholar] [CrossRef]
  16. Guillén, J.; Palanques, A. Sediment dynamics and hydrodynamics in the lower course of a river highly regulated by dams: The Ebro River. Sedimentology 1992, 39, 567–579. [Google Scholar] [CrossRef]
  17. Batalla, R.J.; Vericat, D. A review of sediment quantity issues: Examples from the river Ebro and adjacent basins (Northeastern Spain). Integr. Environ. Assess. Manag. 2011, 7, 256–268. [Google Scholar] [CrossRef]
  18. Tena, A.; Batalla, R.J. The sediment budget of a large river regulated by dams (The lower River Ebro, NE Spain). J. Soils Sediments 2013, 13, 966–980. [Google Scholar] [CrossRef]
  19. Polo, M.J.; Rovira, A.; García-Contreras, D.; Contreras, E.; Millares, A.; Aguilar, C.; Losada, M.A. Reservoir impacts downstream in highly regulated river basins: The Ebro delta and the Guadalquivir estuary in Spain. IAHS-AISH Proc. Rep. 2016, 373, 45–49. [Google Scholar] [CrossRef]
  20. Vericat, D.; Batalla, R.J.; Garcia, C. Breakup and reestablishment of the armour layer in a large gravel-bed river below dams: The lower Ebro. Geomorphology 2006, 76, 122–136. [Google Scholar] [CrossRef]
  21. Ibàñez, C.; Alcaraz, C.; Caiola, N.; Rovira, A.; Trobajo, R.; Alonso, M.; Duran, C.; Jiménez, P.J.; Munné, A.; Prat, N. Regime shift from phytoplankton to macrophyte dominance in a large river: Top-down versus bottom-up effects. Sci. Total Environ. 2012, 416, 314–322. [Google Scholar] [CrossRef]
  22. Rovira, A.; Ibàñez, C. Sediment management options for the lower Ebro River and its Delta. J. Soils Sediments 2007, 7, 285–295. [Google Scholar] [CrossRef]
  23. Galván, R. Plan de Acción Sobre el Delta del Ebro: Caracterización de los Sedimentos Existentes en los Embalses de Mequineza y Ribarroja. Technical Report Confederación Hidrográfica del Ebro. 2023. Available online: https://www.chebro.es/documents/20121/1548903/MEM01O2101381_MEQ_RIB_RG_v02.pdf/f44341b3-cf99-6bfd-f3a0-63e090a581f9?t=1709034433504 (accessed on 8 March 2024).
  24. CHE. Plan de Actuación para la Mejora de la Gestión del Régimen Sedimentario en el Ámbito del Delta del Ebro. Technical Report Confederación Hidrográfica del Ebro. 2021. Available online: https://www.chebro.es/documents/20121/1523790/Plan+Delta+gesti%C3%B3n+del+sedimento+Ebro+Documento+DGA_2_2_2021.pdf/6c3949e3-517e-830c-a5d5-dc886a2ebadc?t=1711959506330 (accessed on 24 March 2025).
  25. Tena, A.; Batalla, R.J.; Vericat, D.; López-Tarazón, J.A. Suspended sediment dynamics in a large regulated river over a 10-year period (the lower Ebro, NE Iberian Peninsula). Geomorphology 2011, 125, 73–84. [Google Scholar] [CrossRef]
  26. Kondolf, G.M.; Gao, Y.; Annandale, G.W.; Morris, G.L.; Jiang, E.; Zhang, J.; Cao, Y.; Carling, P.; Fu, K.; Guo, Q.; et al. Sustainable sediment management in reservoirs and regulated rivers: Experiences from five continents. Earth’s Future 2014, 2, 256–280. [Google Scholar] [CrossRef]
  27. Arnaud, F.; Piégay, H.; Béal, D.; Collery, P.; Vaudor, L.; Rollet, A.-J. Monitoring gravel augmentation in a large regulated river and implications for process-based restoration. Earth Surf. Process. Landf. 2017, 42, 2147–2166. [Google Scholar] [CrossRef]
  28. Reiterer, K.; Gold, T.; Hauer, C.; Habersack, H.; Sindelar, C. Sediment Replenishment Along Rivers—Advection and Dispersion of Gravel Inputs. In Proceedings of the IAHR World Congress, Granada, Spain, 19–24 June 2022; pp. 805–813. [Google Scholar] [CrossRef]
  29. Battisacco, E.; Franca, M.J.; Schleiss, A.J. Sediment replenishment: Influence of the geometrical configuration on the morphological evolution of channel-bed. Water Resour. Res. 2016, 52, 8879–8894. [Google Scholar] [CrossRef]
  30. Anthony, E.; Syvitski, J.; Zăinescu, F.; Nicholls, R.J.; Cohen, K.M.; Marriner, N.; Saito, Y.; Day, J.; Minderhoud, P.S.J.; Amorosi, A.; et al. Delta sustainability from the Holocene to the Anthropocene and envisioning the future. Nat. Sustain. 2024, 7, 1235–1246. [Google Scholar] [CrossRef]
  31. ICOLD. World Register of Dams. 2023. Available online: http://www.icold-cigb.net/ (accessed on 9 July 2020).
  32. Bladé, E.; Cea, L.; Corestein, G.; Escolano, E.; Puertas, J.; Vázquez-Cendón, E.; Dolz, J.; Coll, A. Iber: Herramienta de simulación numérica del flujo en ríos. Rev. Int. Metodos Numer. Para Calc. Diseno Ingenieria 2014, 30, 1–10. [Google Scholar] [CrossRef]
  33. Bladé Castellet, E.; Cea, L.; Corestein, G. Numerical modelling of river inundations. Ing. Agua 2014, 18, 68. [Google Scholar] [CrossRef]
  34. Santillán, D.; Cueto-Felgueroso, L.; Sordo-Ward, A.; Garrote, L. Influence of Erodible Beds on Shallow Water Hydrodynamics during Flood Events. Water 2020, 12, 3340. [Google Scholar] [CrossRef]
  35. Cueto-Felgueroso, L.; Santillán, D.; García-Palacios, J.H.; Garrote, L. Comparison between 2D shallow-water simulations and energy-momentum computations for transcritical flow past channel contractions. Water 2019, 11, 1476. [Google Scholar] [CrossRef]
  36. Dehghan-Souraki, D.; López-Gómez, D.; Bladé-Castellet, E.; Larese, A.; Sanz-Ramos, M. Optimizing sediment transport models by using the Monte Carlo simulation and deep neural network (DNN): A case study of the Riba-Roja reservoir. Environ. Model. Softw. 2024, 175, 105979. [Google Scholar] [CrossRef]
  37. López-Gómez, D.; de Blas-Moncalvillo, M.; Castejón-Zapata, M.; Gassó-Sánchez, Á.; Bladé, E.; Sanz-Ramos, M.; Dehghan-Souraki, D.; Garrote-de Marco, L.; Santillán-Sánchez, D.; Soria-García, J.M.; et al. Análisis del transporte de sedimentos en el curso bajo del río Ebro mediante modelización numérica de una avenida controlada. Ing. Agua 2024, 28, 246–262. [Google Scholar] [CrossRef]
  38. López-Gómez, D.; de Blas-Moncalvillo, M.; Cuéllar-Moro, V. Herramientas para la gestión sostenible de la sedimentación en el embalse de Marmolejo (España). Ing. Agua 2024, 28, 1–16. [Google Scholar] [CrossRef]
  39. Sanz-Ramos, M.; López-Gómez, D.; Bladé, E.; Dehghan-Souraki, D. A CUDA Fortran GPU-parallelised hydrodynamic tool for high-resolution and long-term eco-hydraulic modelling. Environ. Model. Softw. 2023, 161, 105628. [Google Scholar] [CrossRef]
  40. Ibàñez, C.; Prat, N.; Canicio, A. Changes in the hydrology and sediment transport produced by large dams on the lower Ebro river and its estuary. Regul. Rivers Res. Manag. 1996, 12, 51–62. [Google Scholar] [CrossRef]
  41. Xie, D.; Gao, S.; Wang, Z.; Pan, C.; Wu, X.; Wang, Q. Morphodynamic modeling of a large inside sand bar and its dextral morphology in a convergent estuary: Qiantang Estuary, China. J. Geophys. Res. Earth Surf. 2017, 122, 1434–1452. [Google Scholar] [CrossRef]
  42. Estrela, T.y.L. Quintas El sistema integrado de modelización precipitación-aportación SIMPA. Ing. Civ. 1996, 104, 43–52. [Google Scholar]
  43. CEDEX. Evaluación de Recursos Hídricos en Régimen Natural en España (1940/41–2017/18). Centro de Estudios y Experimentación de Obras Públicas. Ministerio de Fomento y Ministerio para la Transición Ecológica. 2020. Available online: https://www.miteco.gob.es/content/dam/miteco/es/agua/temas/evaluacion-de-los-recursos-hidricos/cedex-informeerh2019_tcm30-518171.pdf (accessed on 19 May 2021).
  44. Garrote, L.; Sordo-Ward, A.; Bianucci, P. Assessment of Blue Water Availability for Agriculture in the Mediterranean. Proceedings of the 8th IAHR European Congress (Lisbon, 2024). 2024. Available online: https://www.iahr.org/library/infor?pid=30970 (accessed on 26 March 2025).
  45. Warszawski, L.; Frieler, K.; Huber, V.; Piontek, F.; Serdeczny, O.; Schewe, J. The inter-sectoral impact model intercomparison project (ISI-MIP): Project framework. Proc. Natl. Acad. Sci. USA 2014, 111, 3228–3232. [Google Scholar] [CrossRef]
  46. Weedon, G.P.; Balsamo, G.; Bellouin, N.; Gomes, S.; Best, M.J.; Viterbo, P. The WFDEI meteorological forcing data set: WATCH Forcing Data methodology applied to ERA-Interim reanalysis data. Water Resour. Res. 2014, 50, 7505–7514. [Google Scholar] [CrossRef]
  47. Zhao, M.; Zeng, Y.; Wyman, B.; Dunne, J.P.; Horowitz, L.W.; Adcroft, A.J.; Ginoux, P.; Held, I.M.; John, J.G.; Krasting, J.P.; et al. The GFDL Earth System Model Version 4.1 (GFDL-ESM 4.1): Overall Coupled Model Description and Simulation Characteristics. J. Adv. Model. Earth Syst. 2020, 12, e2019MS002015. [Google Scholar] [CrossRef]
  48. Yukimoto, S.; Yoshimura, H.; Hosaka, M.; Sakami, T.; Tanaka, T.Y.; Shindo, E.; Tsujino, H.; Deushi, M.; Mizuta, R.; Yabu, S.; et al. Meteorological Research Institute-Earth System Model Version 1 (MRI-ESM1)—Model Description. In Technical Reports of the Meteorological Research Institute, No. 64; Meteorological Research Institute, Japan Meteorological Agency: Tsukuba, Japan, 2011. [Google Scholar]
  49. Sepulchre, P.; Caubel, A.; Ladant, J.-B.; Bopp, L.; Boucher, O.; Braconnot, P.; Brockmann, P.; Cozic, A.; Donnadieu, Y.; Dufresne, J.-L.; et al. IPSL-CM5A2—An Earth system model designed for multi-millennial climate simulations. Geosci. Model Dev. 2020, 13, 3011–3053. [Google Scholar] [CrossRef]
  50. Gutjahr, O.; Putrasahan, D.; Lohmann, K.; Jungclaus, J.H.; von Storch, J.-S.; Brüggemann, N.; Haak, H.; Stössel, A. Max Planck Institute Earth System Model (MPI-ESM1.2) for the High-Resolution Model Intercomparison Project (HighResMIP). Geosci. Model Dev. 2019, 12, 3241–3281. [Google Scholar] [CrossRef]
  51. Sellar, A.A.; Jones, C.G.; Mulcahy, J.P.; Tang, Y.; Yool, A.; Wiltshire, A.; O’Connor, F.M.; Stringer, M.; Hill, R.; Palmier, J.; et al. UKESM1: Description and Evaluation of the U.K. Earth System Model. J. Adv. Model. Earth Syst. 2019, 11, 4513–4558. [Google Scholar] [CrossRef]
  52. Hanasaki, N.; Kanae, S.; Oki, T.; Masuda, K.; Motoya, K.; Shirakawa, N.; Shen, Y.; Tanaka, K. An integrated model for the assessment of global water resources—Part 1: Model description and input meteorological forcing. Hydrol. Earth Syst. Sci. 2008, 12, 1007–1025. [Google Scholar] [CrossRef]
  53. Hanasaki, N.; Kanae, S.; Oki, T.; Masuda, K.; Motoya, K.; Shirakawa, N.; Shen, Y.; Tanaka, K. An estimation of global virtual water flow and sources of water for major crops and livestock products using a global hydrological model. J. Hydrol. 2010, 384, 232–244. [Google Scholar] [CrossRef]
  54. Burek, P.; Satoh, Y.; Kahil, T.; Tang, T.; Greve, P.; Smilovic, M.; Guillaumot, L.; Zhao, F.; Wada, Y. Development of the Community Water Model (CWatM v1.04)—A high-resolution hydrological model for global and regional assessment of integrated water resources management. Geosci. Model Dev. 2020, 13, 3267–3298. [Google Scholar] [CrossRef]
  55. Sordo-Ward, A.; Granados, A.; Iglesias, I.; Garrote, L.; Bejarano, M.D. Adaptation Effort and Performance of Water Management Strategies to Face Climate Change Impacts in Six Representative Basins of Southern Europe. Water 2019, 11, 1078. [Google Scholar] [CrossRef]
  56. Bianucci, P.; Sordo-Ward, A.; Lama-Pedrosa, B.; Garrote, L. How do environmental flows impact on water availability under climate change scenarios in European basins? Sci. Total Environ. 2024, 911, 168566. [Google Scholar] [CrossRef]
  57. Paredes-Beltran, B.E.; Sordo-Ward, Á.; Martín-Carrasco, F.; Garrote, L. High-resolution estimates of water availability for the Iberian Peninsula under climate scenarios. Appl. Water Sci. 2024, 14, 167. [Google Scholar] [CrossRef]
  58. Lehner, B.; Verdin, K.; Jarvis, A. New global hydrography derived from spaceborne elevation data. Eos Trans. Am. Geophys. Union 2008, 89, 93–94. [Google Scholar] [CrossRef]
  59. CHE. Plan Hidrológico de la parte Española de la Demarcación Hidrográfica del Ebro Revisión para el Tercer Ciclo: 2022–2027. Memoria. Technical Report Confederación Hidrográfica del Ebro. 2022. Available online: https://www.chebro.es/documents/20121/1027081/00_PH3c_091_2023-01_Memoria_v01.pdf/f3036ada-67bf-9294-23ae-c627760a89cc?t=1675946692886 (accessed on 16 April 2025).
  60. Cea, L.; Puertas, J.; Vázquez-Cendón, M.E. Depth Averaged Modelling of Turbulent Shallow Water Flow with Wet-Dry Fronts. Arch. Comput. Methods Eng. 2007, 14, 303–341. [Google Scholar] [CrossRef]
  61. Anderson, R.S. Modeling the tor-dotted crests, bedrock edges, and parabolic profiles of high alpine surfaces of the Wind River Range, Wyoming. Geomorphology 2002, 46, 35–58. [Google Scholar] [CrossRef]
  62. Mudd, S.M.; Furbish, D.J. Influence of chemical denudation on hillslope morphology. J. Geophys. Res. Earth Surf. 2004, 109, F02001. [Google Scholar] [CrossRef]
  63. Paola, C.; Voller, V.R. A generalized Exner equation for sediment mass balance. J. Geophys. Res. Earth Surf. 2005, 110, F04014. [Google Scholar] [CrossRef]
  64. van Rijn, L.C. Sediment Transport, Part I: Bed Load Transport. J. Hydraul. Eng. 1984, 110, 1431–1456. [Google Scholar] [CrossRef]
  65. Soulsby, R.L.; Whitehouse, R.J.S. Threshold of sediment motion in coastal environments. In Pacific Coasts and Ports’ 97: Proceedings of the 13th Australasian Coastal and Ocean Engineering Conference and the 6th Australasian Port and Harbour Conference; Centre for Advanced Engineering, University of Canterbury: Christchurch, New Zealand, 1997; Volume 1, pp. 145–150. [Google Scholar]
  66. Shields, A. Anwendung Der Aehnlichkeitsmechanik und der Turbulenzforschung Auf Die Geschiebebewegung. Ph.D. Thesis, Technical University Berlin, Berlin, Germany, 1936. [Google Scholar]
  67. van Rijn, L.C. Mathematical Modelling of Morphological Processes in the Case of Suspended Sediment Transport; Delft Hydraulics Laboratory: Delft, The Netherlands, 1987. [Google Scholar]
  68. van Rijn, L.C. Sediment Transport, Part II: Suspended Load Transport. J. Hydraul. Eng. 1984, 110, 1613–1641. [Google Scholar] [CrossRef]
  69. Vanoni, V.A.; Brooks, N.H. Laboratory Studies of the Roughness and Suspended Load of Alluvial Streams; California Institute of Technology, Report E-68; Sedimentation Laboratory: Pasadena, CA, USA, 1957. [Google Scholar]
  70. van Leer, B. Towards the Ultimate Conservative Difference Scheme, V. A Second Order Sequel to Godunov’s Method. J. Comput. Phys. 1979, 32, 101–136. [Google Scholar] [CrossRef]
Figure 1. Location of the study areas.
Water 17 01620 g001
Figure 2. Development of reservoir storage in the Ebro Basin.
Water 17 01620 g002
Figure 3. Domain of the numerical simulations in the Ebro River.
Water 17 01620 g003
Figure 4. Observed inflow in Ascó and observed and simulated flow rate in Tortosa for the controlled flood of May 2022.
Water 17 01620 g004
Figure 5. Suspended sediment concentration for the normal flow regime of the Ebro River after 1.5 days. Water flow is 710 m3/s, and the sediment concentration at the inlet is 0.9 g/L. Plot (a) shows a sediment concentration for D 50 equal to 0.005 mm. Plot (b) shows a sediment concentration for D 50 equal to 0.0005 mm, ten times smaller.
Water 17 01620 g005
Figure 6. Rating curve for sediment transport. Data compiled by Gorría in 1877 are shown in red, and numerical simulations are shown in blue.
Water 17 01620 g006
Figure 7. Comparison of annual sediment transport computed at daily and monthly time scales for data measured in Tortosa in the period from 1953–1954 to 2019–2020.
Water 17 01620 g007
Figure 8. Evolution of annual flow and potential sediment transport in the Lower Ebro River under natural and altered conditions. (Above): annual flow. (Below): sediment transport.
Water 17 01620 g008
Figure 9. Mean seasonality of flow and potential sediment transport in the Lower Ebro River under natural and altered conditions during the period from 1980–1981 to 2019–2020. (Left): annual flow. (Right): annual potential sediment transport.
Water 17 01620 g009
Figure 10. Comparison of the time sequence of annual flows and potential sediment transport in the Ebro River produced by the SIMPA model and the ISIMIP global hydrologic models.
Water 17 01620 g010
Figure 11. Comparison of annual flows in the Ebro River produced by the ISIMIP global hydrologic models and the SIMPA model. (Left): H08 model. (Right): CWatM model.
Water 17 01620 g011
Figure 12. Comparison of seasonality of flows and potential sediment transport in the Ebro River produced by ISIMIP global hydrologic models and the SIMPA model. (Left): Seasonality of flows. (Right): Seasonality of potential sediment transport.
Water 17 01620 g012
Figure 13. Projected changes in mean annual flow and potential sediment transport in the Ebro River under ISIMIP climate scenarios. (Left): Changes in mean annual flow. (Right): Changes in potential sediment transport.
Water 17 01620 g013
Figure 14. Projected changes in mean annual flow and potential sediment transport in the Ebro River under altered conditions in future climate scenarios. (Left): Changes in mean annual flow. (Right): Changes in potential sediment transport.
Water 17 01620 g014
Figure 15. Relationship between mean annual flow and mean potential sediment transport for all scenarios examined.
Water 17 01620 g015
Table 1. Mean annual flow obtained in the simulations of the scenarios for the Ebro Basin, in km3/yr. Figures highlighted in bold correspond to the mean over the climate models.
Scenarioobsclimobsclimhistoricssp126ssp370ssp585ssp126ssp370ssp585
Period79–1874–1374–1320–5920–5920–5960–9960–9960–99
SIMPA14.9715.19
H08
gswp312.6313.19
gfdl 13.4512.1210.6111.6412.2010.229.14
mrl 13.4012.3711.3312.9713.6211.459.94
ipsl 13.6110.9110.429.8310.578.107.27
mpi 13.0310.9510.3310.6111.398.808.55
ukesm1 13.9811.639.639.2410.627.647.97
mean12.6313.1913.4911.5910.4610.8611.689.248.57
CWatM
gswp315.1715.63
gfdl 15.8415.3113.6614.9815.4613.8812.66
mrl 15.5915.8115.2816.9016.7815.8114.03
ipsl 15.8413.9513.9812.8113.8411.8210.60
mpi 15.4414.0212.9013.7114.4911.7311.87
ukesm1 15.4014.9213.8212.1314.3011.8911.38
mean15.1715.6315.6214.8013.9114.1114.9813.0312.11
Table 2. Mean potential sediment transport obtained in the simulations of the scenarios for the Ebro Basin, in Mt/yr. Figures highlighted in bold correspond to the mean over the climate models.
Scenarioobsclimobsclimhistoricssp126ssp370ssp585ssp126ssp370ssp585
Period79–1874–1374–1320–5920–5920–5960–9960–9960–99
SIMPA26.7625.29
H08
gswp323.8328.58
gfdl 28.4020.2313.9916.4019.9911.778.00
mrl 30.3624.9115.4132.7931.0525.7414.54
ipsl 31.5516.5515.9510.6118.269.175.91
mpi 29.2719.7215.8615.8321.468.9810.11
ukesm1 35.9821.8910.1711.3717.506.3910.10
mean23.8328.5831.1120.6614.2817.4021.6512.419.73
CWatM
gswp337.8742.09
gfdl 43.1339.5130.9936.1543.3632.4427.52
mrl 45.0648.2242.0655.6250.3848.9338.74
ipsl 43.1336.3536.1725.7338.5229.1022.32
mpi 42.5840.1628.9631.5240.1323.1925.52
ukesm1 41.7243.0933.5726.2840.0728.4026.07
mean37.8742.0943.1241.4734.3535.0642.4932.4128.03
Table 3. Mean annual flow obtained under the hypothesis of maximum use of water resources in the Ebro Basin, in km3/yr. Figures highlighted in bold correspond to the mean over the climate models.
Scenarioobsclimobsclimhistoricssp126ssp370ssp585ssp126ssp370ssp585
Period79–1874–1374–1320–5920–5920–5960–9960–9960–99
Tortosa8.969.66
SIMPA6.576.75
H08
gswp36.216.72
gfdl 7.085.545.336.575.635.004.36
mrl 6.506.036.087.937.046.315.17
ipsl 6.945.786.696.795.504.544.47
mpi 6.975.795.887.386.104.455.43
ukesm1 7.276.035.935.924.994.184.72
mean6.216.726.955.845.986.925.854.904.83
CWatM
gswp38.919.35
gfdl 9.028.648.089.618.838.337.52
mrl 9.669.319.1711.5510.199.758.85
ipsl 9.028.539.008.448.506.926.53
mpi 8.978.567.789.598.846.677.85
ukesm1 9.119.358.368.248.616.557.47
mean8.919.359.158.888.489.498.997.647.64
Table 4. Mean potential sediment transport obtained under the hypothesis of maximum use of water resources in the Ebro Basin, in Mt/yr. Figures highlighted in bold correspond to the mean over the climate models.
Scenarioobsclimobsclimhistoricssp126ssp370ssp585ssp126ssp370ssp585
Period79–1874–1374–1320–5920–5920–5960–9960–9960–99
Tortosa8.9111.26
SIMPA6.266.01
H08
gswp34.496.46
gfdl 6.954.333.995.455.211.461.71
mrl 7.198.543.1116.3210.539.973.30
ipsl 9.323.747.803.765.323.812.24
mpi 8.185.575.348.076.481.604.48
ukesm1 9.746.503.114.263.822.334.96
mean4.496.468.275.744.677.576.273.833.34
CWatM
gswp38.099.30
gfdl 8.316.846.278.208.814.926.25
mrl 9.8813.918.3619.1612.7614.349.42
ipsl 8.316.9310.015.1210.656.775.59
mpi 10.818.936.6510.569.584.607.39
ukesm1 9.3012.767.496.4412.128.947.94
mean8.099.309.329.877.759.9010.787.917.32
Disclaimer/Publisher’s Note: The statements, opinions and data contained in all publications are solely those of the individual author(s) and contributor(s) and not of MDPI and/or the editor(s). MDPI and/or the editor(s) disclaim responsibility for any injury to people or property resulting from any ideas, methods, instructions or products referred to in the content.

