Article

Variations in Pore Pressure and Effective Stress Induced by Wave and Current Around Monopile Foundations on Coral Reef Sloping Seabeds

1
China Harbour Engineering Company Ltd., Beijing 100027, China
2
College of Harbour, Coastal and Offshore Engineering, Hohai University, Nanjing 210024, China
3
Key Laboratory of Ministry of Education for Coastal Disaster and Protection, Hohai University, Nanjing 210024, China
*
Author to whom correspondence should be addressed.
Water 2025, 17(11), 1621; https://doi.org/10.3390/w17111621
Submission received: 19 April 2025 / Revised: 19 May 2025 / Accepted: 22 May 2025 / Published: 27 May 2025
(This article belongs to the Section Oceans and Coastal Zones)

Abstract

:
Sloping seabeds are widely found in offshore areas, especially around coral reefs, where complex topography significantly affects wave–current propagation characteristics and seabed dynamic responses. However, previous studies have mainly focused on flat seabed cases, while investigations of sloping seabed responses around piles under wave–current interaction is limited. In this study, a three-dimensional numerical model is used to investigate the wave–current-induced sloping seabed response around a monopile. By comparing the variations in pore pressure and effective stress around the pile, the spatial heterogeneity of the seabed dynamic response was revealed. The results show that the variation in current velocity significantly affected the distribution of pore pressure and effective stress. Moreover, the disturbances on both lateral sides of the pile tended to stabilize as the current velocity increased, and the amplitude of the free surface gradually approached a steady state. This research fills the gap in the field of wave–current-induced sloping seabed response around piles and provides a theoretical basis for the analysis of offshore pile foundation stability under complex terrain conditions.

1. Introduction

Coral reefs are formed by coral communities and are one of the most diverse ecosystems on Earth. Although they cover less than 0.1% of the global ocean area, they provide habitat for more than 25% of all marine species and possess unique economic value [1]. In tropical and subtropical island reef regions, the fore-reef slope serves as a significant depositional environment for coral-derived detritus. Driven by wave-induced transport processes, coral sand tends to accumulate along these sloping seabed geomorphologies, resulting in the formation of substantial sedimentary deposits [2,3]. Meanwhile, sloped seabed regions are often considered favorable locations for the arrangement of offshore structures (e.g., piers, tourism facilities, and offshore platforms) due to their moderate water depths [4]. Among these, pile-supported structures are widely used due to their excellent adaptability to various complex seabed topographies and minimal impact on the hydrodynamic environment [5,6,7]. However, the topography of coral reef regions is not flat. Due to the varying depths of coastal water, these areas are frequently exposed to strong wave conditions, which poses challenges to the stability of pile foundations for such facilities.
The study of the stability of pile foundations constructed on coral reefs under wave action is a typical wave–seabed–structure interaction problem. The primary failure modes of pile foundations include direct structural damage caused by wave forces, as well as seabed instability around the structure—such as scour, shear failure, and liquefaction—induced by wave action, which undermines the seabed’s ability to provide adequate support and leads to structural overturning [8,9]. Due to the different mechanisms of these failure modes, this study focuses on the impact of wave-induced seabed liquefaction near these structures on their stability. Seabed liquefaction may occur when excess pore pressure exceeds the effective weight of the overlying soil, resulting in a complete loss of soil bearing capacity in the liquefied zone [10]. Based on the variation pattern of excess pore pressure, liquefaction can be classified into residual liquefaction and oscillatory liquefaction. Residual liquefaction occurs when the soil skeleton of the seabed is continuously compressed under wave action, causing the pore pressure to accumulate, and typically requires several wave cycles to develop. Oscillatory liquefaction is caused by oscillating pore pressure, which is usually accompanied by a decrease in the amplitude and phase delay of the excess pore pressure along the depth direction [9]. Previous studies have shown that under short-period wave loading and small-strain conditions, the pore pressure response in sandy seabeds is often dominated by its oscillatory component [11,12]. This is particularly relevant for coral sand, a type of calcareous sand commonly found in reef environments, which typically exhibits high permeability and low compressibility. These properties tend to suppress residual pore pressure buildup and favor oscillatory behavior. Moreover, several recent studies have specifically focused on the oscillatory pore pressure response in coral sand [13,14], further validating the applicability of this approach in reef environments. Therefore, this study focuses on the research of the oscillatory pore pressure variation mechanism caused by waves.
Theoretical analysis of wave-induced oscillatory responses in the seabed is primarily based on Biot’s theory, which uses Hooke’s law to describe soil deformation [15]. Over years of development, the mainstream theoretical approaches of soil have evolved into three main formulations: the full dynamic (FD) formulation developed by Biot, which includes inertial forces associated with both the pore fluid and the soil skeleton [16,17]; the partly dynamic (PD) formulation—also known as the u-p approximation—which neglects the acceleration of the pore fluid [18,19]; and the quasi-static (QS) formulation, which neglects the inertial effects of both the pore fluid and the soil [20]. Based on the above theories, many researchers have conducted extensive research using analytical solutions by altering initial values, boundary conditions, and parameter values [21,22,23,24,25,26]. However, analytical solutions are limited in their ability to describe complex geometric boundaries, unconstant soil parameters, and other issues. As a result, most analytical solutions are only applicable to wave–seabed interaction problems. For practical engineering, the dynamic response of the seabed near structures is the key focus of research.
Recent advances in computational technology have made it feasible to solve the above equations on large-scale grids through numerical discretizations. Numerical simulations have begun to be widely applied in the field of wave–seabed–pile interaction. Some commercial software, such as FLAC, ABAQUS, and COMSOL, have been widely used. Zhao et al. [27] studied the wave-induced residual seabed response around a large-diameter pile. However, they did not consider the impact of current. Later, Lin et al. [28] considered the effect of current velocity on the seabed response around a monopile. Then, they extended this framework to the case of crossing wave–current [29]. All the aforementioned studies assumed the seabed to be an isotropic medium. However, cross-anisotropy is a typical feature of marine sediments, which can have a significant impact on seabed mechanical behavior, especially under wave–current loadings. Recently, Tong et al. [30] considered nonlinear monopile–soil contact behaviour and developed a hydro-mechanical model to study the monopile–seabed interaction. However, these software packages focus more on solving soil and structural problems with relatively limited capabilities in hydrodynamic analysis. At present, FssiCAS software (Version 3.5) [31] is capable of calculating wave–seabed–structure interactions within a unified framework, but it is quite expensive. For these reasons, open-source software has gained increasing popularity among researchers. OpenFOAM [32] is a typical example; many research studies have been conducted based on this platform [33,34,35,36]. Li et al. [37] employed numerical simulations to study the seabed response around a monopile under wave action, but they did not consider the effect of the pile on the flow field. Instead, they used the analytical solution of second-order Stokes wave pressure as the boundary condition for the seabed, and the pile was simplified as a rigid body with no displacement. Chang and Jeng [38] developed a three-dimensional model to simulate the seabed response around the multi-pile structure foundation of an offshore wind farm. They suggested the use of coarser sand around the pile foundations rather than the seabed material to reduce the risk of seabed liquefaction near the piles. Sui et al. [39] established a numerical program to solve the wave–seabed–pile interaction. The wave pressure was computed using FUNWAVE [40], which is based on the solution of the Boussinesq equations. Then, the dynamic responses of the seabed and pile, as well as their interaction, were solved using the FD formulation. However, their study did not fully consider the nonlinear processes involved in wave–pile interaction, leading to inaccuracies in wave pressure estimation at the seabed and structural surfaces. To improve this situation, Lin et al. [41] developed another solver for calculating wave–seabed–pile interactions based on the OpenFOAM framework. The flow field near the structure was simulated by solving Navier–Stokes equations, and the wave interface was accurately captured using the VOF method. On this basis, the PORO-FSSI-FOAM solver was developed to consider the impact of wave–current interaction, and effects of the wave–current angle was discussed [42,43]. This work was later extended to the case of pile groups [44]. However, they only investigated cases where the wave–current angle did not exceed 90°. Compared with Lin and Guo [29], this appears to be insufficiently comprehensive, as the latter systematically examined seabed response under a wider range of wave–current interaction angles.
The aforementioned studies were conducted on flat seabeds, while research on sloping seabeds remains limited. Recently, Rafiei et al. [45] established an almost fully coupled model to investigate the effects of the coupling approach on seabed response and liquefaction around marine hydrokinetic devices (MHKs). Fan et al. [46] and Lin et al. [47] investigated oscillatory and residual pore pressure on a sloping seabed around pipelines, respectively. Some scholars studied the stability of coral reef sloping seabed under seismic loading [48,49]. To the authors’ best knowledge, the phenomenon of wave–current-induced sloping seabed response around piles has not been fully understood. This study aimed to investigate the dynamic response of a sloping seabed around a monopile under combined wave–current loading. Firstly, the numerical model for the wave–current–seabed–structure interaction around the monopile and its validation are outlined in Section 2. Then, the computational domain, mesh generation, and parameter settings are introduced in Section 3. Finally, the effects of sloping gradient, wave height, and current velocity on the seabed response are examined in Section 4.

2. Numerical Model

2.1. Wave Model

In this study, the flow field in the wave region was computed using Reynolds-averaged Navier–Stokes (RANS) equations, which were derived by time-averaging Navier–Stokes equations to account for turbulent effects in the flow. The equations decompose instantaneous quantities into mean and fluctuating components, leading to a balance between mean momentum change and various forces, including pressure, viscosity, and Reynolds stresses, which represent the turbulence-induced velocity fluctuations. The RANS equations are as follows:
· U ¯ = 0
ρ U ¯ t + · ( ρ U ¯ U ¯ ) = p ¯ + · T ¯ · ( ρ U ˜ U ˜ ¯ ) + f b ¯
where the superscript “∼” denotes the fluctuating value and “−” denotes the time-averaged value. The velocity vector is represented as U = [ u , v , w ] , where ρ is the fluid density and p is the pressure. The second-order tensor ρ U ˜ U ˜ ¯ represents the Reynolds stress, and f denotes the body force, which is the sum of the gravitational force and the wave-induced force.
The Reynolds stress arises from the time-averaging of the inertial forces associated with turbulence and is considered an inertial force. It is only meaningful from a statistical perspective. According to the Boussinesq eddy viscosity hypothesis [50], the Reynolds stress tensor can be approximated as follows:
U ˜ U ˜ ¯ = ν t ( U ¯ + U ¯ T ) 2 3 k I
where ν t is the turbulent kinematic viscosity, defined in terms of turbulent kinetic energy k and the turbulent kinetic energy dissipation rate ε by the formula ν t = C μ k 2 ε . The values of k and ε are calculated using the k ε turbulence model, which is widely used in wave–structure interaction. The equations are as follows:
t ( ρ k ) + · ( ρ U ¯ k ) · ρ D k k = ρ G 2 3 ρ ( · U ¯ ) k ρ ε k k + S k
t ( ρ ε ) + · ( ρ U ¯ ε ) · ρ D ε ε = C 1 ρ G ε k ( 2 3 C 1 C 3 ) ρ ( · U ¯ ) ε C 2 ρ ε k ε + S ε
Here, D k = ν + ν t / σ k and D ε = ν + ν t / σ ε are the effective kinematic viscosities for the k ε turbulence model, respectively. G represents the turbulence kinetic energy generation rate due to the anisotropic part of the Reynolds stress tensor, expressed as follows:
G = ν t ( U ¯ + U ¯ T 2 3 ( · U ¯ ) I ) : U ¯
S k and S ε are the source terms for the k and ε equations, respectively. C 1 , C 2 , C 3 , σ k , and σ ε are the empirical constants in the equations. In this model, the relevant empirical coefficients are adopted from standard values widely used in fluid–structure interaction (FSI) problems, proposed by Launder and Spalding [51], and also implemented as default settings in commercial CFD solvers such as ANSYS Fluent 2022 [52]. Their applicability has been validated in various offshore and coastal flow simulations, including those around monopile foundations [53,54,55]:
C μ = 0.09 , C 1 = 1.44 , C 2 = 1.92 , C 3 = 0 , σ k = 1 , σ ε = 1.3
The above equations consider only the flow field. The whole wave domain is a two-phase flow consisting of seawater and air. To capture the wave interface, the Volume of Fluid (VOF) method, which is widely used in wave calculations, is applied in this study. For every cell in the computational domain, the volume fraction of seawater is denoted as α , which α = 0 represents a cell fully occupied by air, and α = 1 represents a cell fully occupied by seawater. The governing equation for the volume fraction used in this study is a modified form proposed by Rusche [56], which enhances the sharpness of the air–water interface through an additional compressive term:
α t + · ( U α ) + · U r ( 1 α ) α = 0
where U r represents the relative velocity of water with respect to air. Due to the presence of the water–air interface, the body force in the RANS equations should account for surface tension at the interface. The value is determined based on the continuum surface force (CSF) model proposed by Brackbill et al. [57], with the expression as follows:
f σ = σ κ α
where σ is the surface tension between water and air, taken as a constant provided externally. This approximation is necessary because, in the CSF method, the interface position and shape cannot be explicitly tracked, making it challenging to apply precise boundary conditions at the interface. Therefore, σ is approximated as a constant. κ represents the curvature of the interface and can be expressed as
κ = · α | α |

2.2. Seabed Model

Coral sand is primarily made of calcium carbonate (CaCO3), which gives it relatively high hardness. When acting as the seabed, it can still be classified as a porous medium, and its dynamic response can be described using Biot’s theory. In this study, the “u-p” approximation of the dynamic Biot equation is used as the governing equation for the three-dimensional porous seabed, as proposed by Zienkiewicz et al. [18], and is expressed as follows:
σ x x + τ x y y + τ x z z = p s x + ρ 2 u s t 2
τ x y x + σ y y + τ y z z = p s y + ρ 2 v s t 2
τ x z x + τ y z y + σ z z + ρ g = p s z + ρ 2 w s t 2
where p s is the pore pressure, ρ = n ρ f + ( 1 n ) ρ s is the seabed density, g is the gravity acceleration, u s , v s , and w s are the soil displacements in the x-, y-, and z-directions, σ represents the effective normal stresses, and τ represents the effective shear stresses. The effective stresses are defined as follows:
σ x = 2 G u s x + μ s ϵ v 1 2 μ s
σ y = 2 G v s y + μ s ϵ v 1 2 μ s
σ z = 2 G w s z + μ s ϵ v 1 2 μ s
τ x z = τ z x = G u s z + w s x
τ y z = τ z y = G v s z + w s y
τ x y = τ y x = G u s y + v s x
where G is the shear modulus, μ s is Poisson’s ratio, and ϵ v is the volumetric strain which is defined as ϵ v = u s / x + v s / y + w s / z .
The pore pressure is described by Darcy’s law. The governing equation is as follows:
k s 2 p s γ f n β p s t + k s ρ f 2 ϵ v t 2 = γ f ϵ v t .
where γ f is the unit weight of the pore water, k s is the permeability coefficient, and ρ f is the density of the pore water. The compressibility of the pore fluid β can be calculated by the formulation proposed by Vafai and Tien [58]:
β = 1 K f + 1 S r P w 0
In which K f is the bulk modulus of the pore fluid, S r is the degree of saturation, and P w 0 is the absolute pore pressure.

2.3. Pile Model

To simplify the calculation, the pile is considered an ideal elastic body, where its stress–strain relationship follows Hooke’s law. The governing equation is as follows:
σ x x + τ x y y + τ x z z = ρ 2 u s t 2
τ x y x + σ y y + τ y z z = ρ 2 v s t 2
τ x z x + τ y z y + σ z z + ρ g = ρ 2 w s t 2
The displacement is still represented by u s in the above equation, and the stress calculation is consistent with the seabed model described above.

2.4. Boundary Conditions

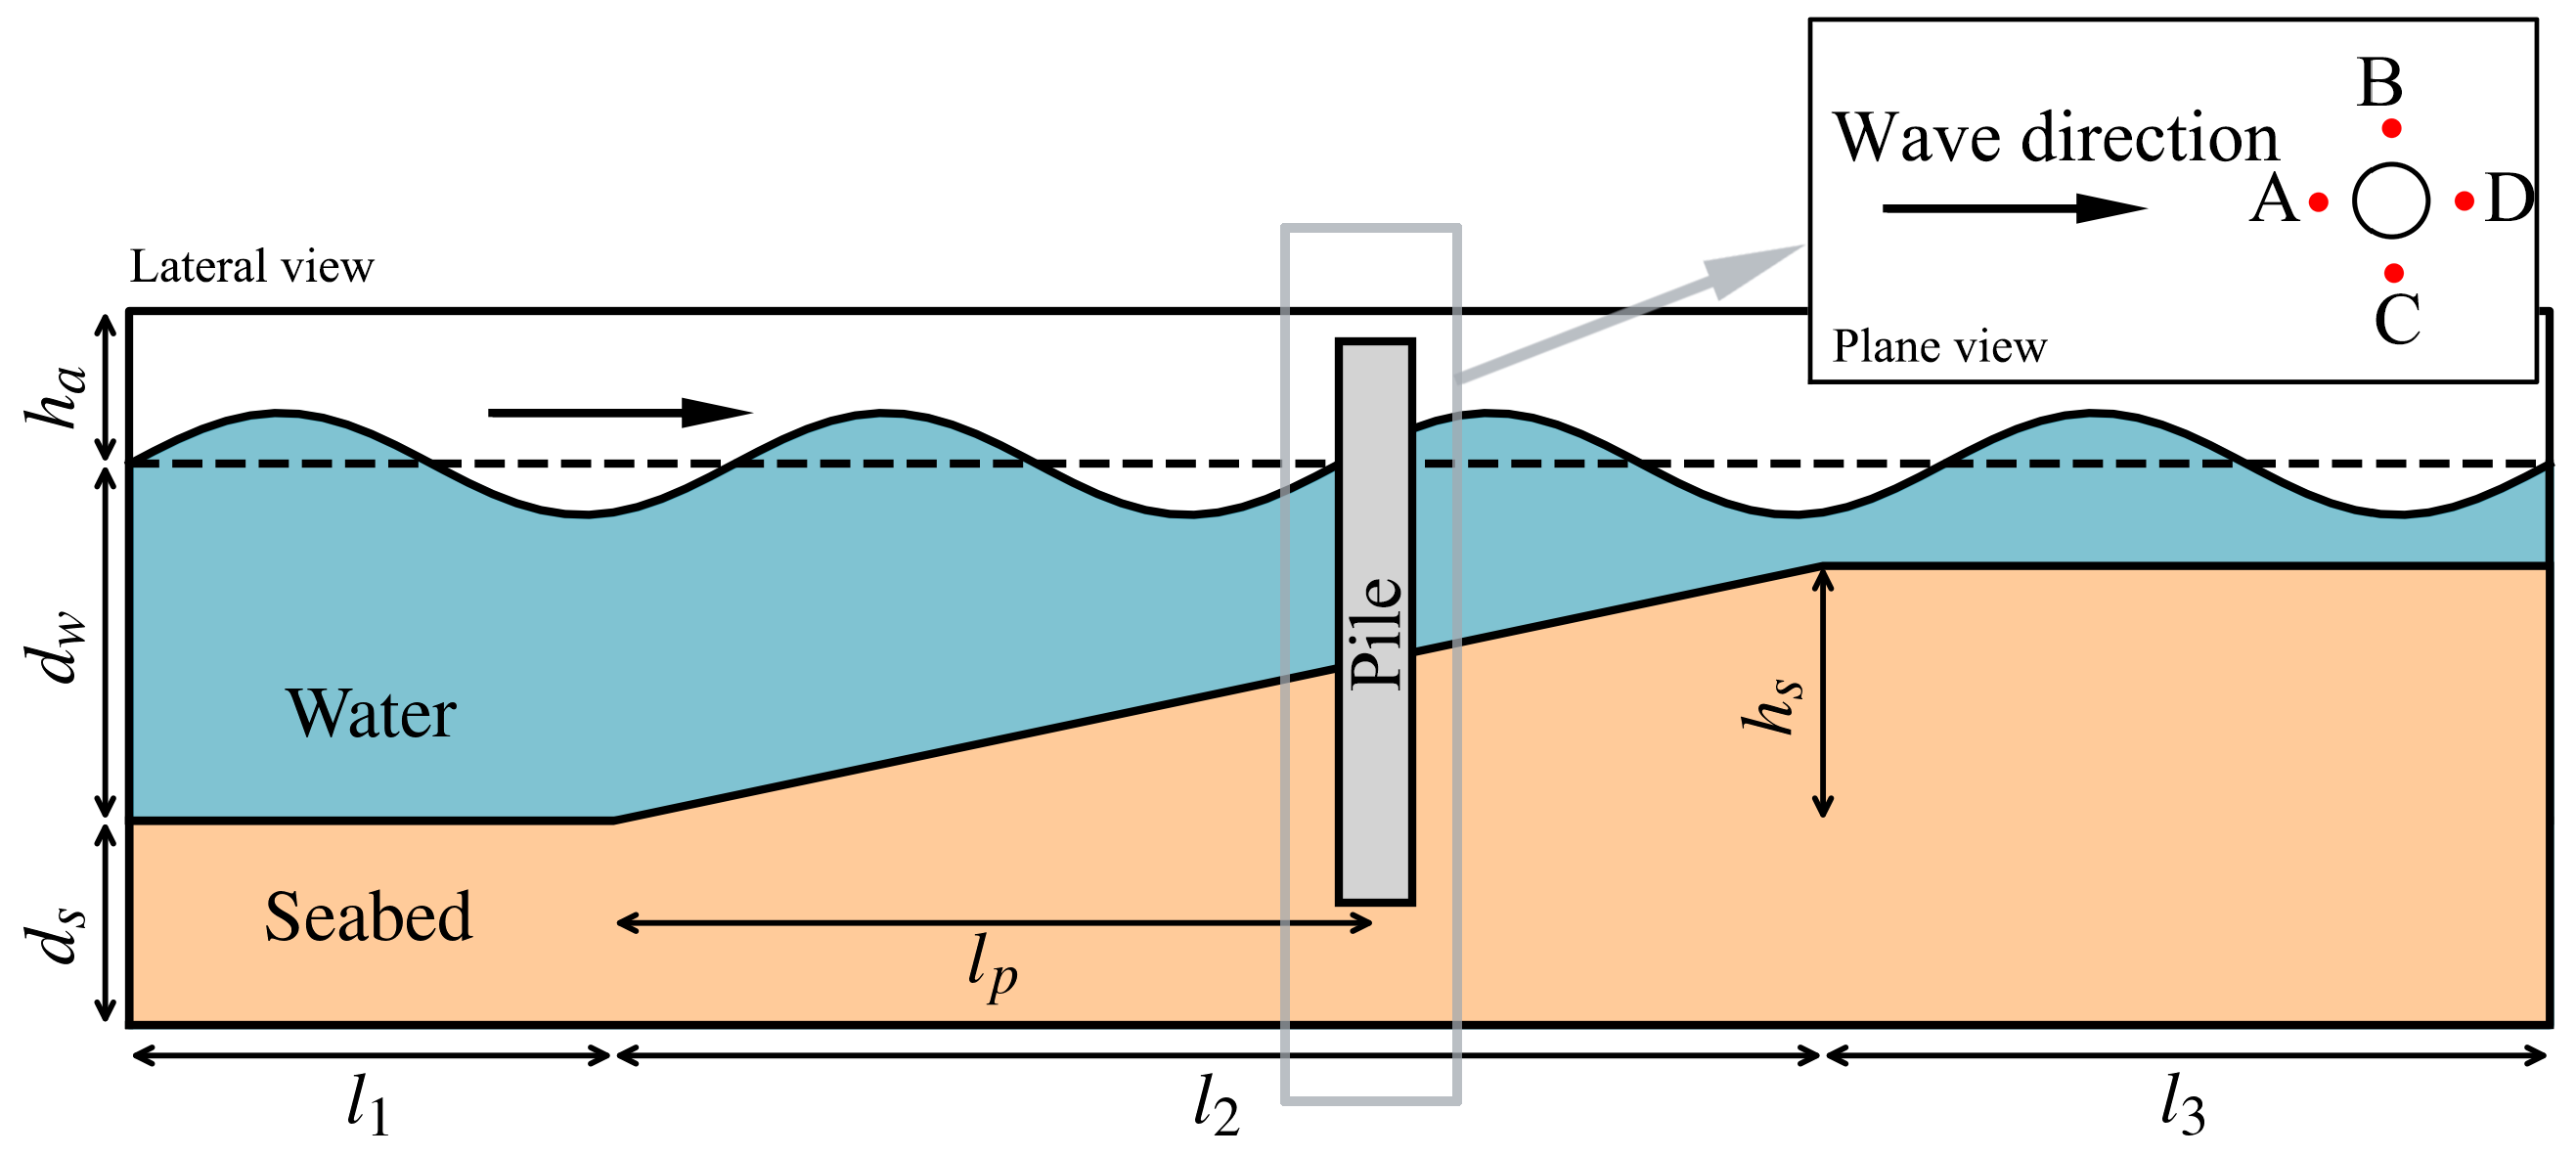
A typical computation domain for wave–seabed–pile interaction is shown in Figure 1. The boundaries are represented by the symbol Γ n (where n = 1 , 2 , 3 , ). The corresponding boundary conditions for each model are then discussed individually.
In the wave model, the key aspects are the implementation of wave generation and absorption boundaries. The boundaries Γ 1 and Γ 3 represent the wave inlet and outlet conditions, respectively. In this study, the velocity boundary conditions from the olaFlow library [59], based on the openFOAM framework and designed for simulating wave–structure interactions in coastal and offshore environments, were used for implementation. Readers can refer to the manual for more detailed information. At the seabed boundaries of the wave domain, Γ 4 , Γ 5 , and Γ 6 , considering the small seepage at the interface, are set as impermeable fixed boundaries ( U = 0 , p / n = 0 ). For the boundary Γ 7 , it is assumed that the pile has no displacement, and thus the boundary is also a fixed boundary ( U = 0 , p / n = 0 ). For the upper air outlet boundary, it is set as a free-outflow boundary condition ( U / n = 0 , p / n = 0 ).
In the seabed model, the mudline refers to the boundary where the seabed meets the seawater, including Γ 4 , Γ 5 , and Γ 6 . The effect of wave-induced shear stress is neglected, and the seawater pressure is assumed to be fully supported by the pore pressure ( σ N = 0 , τ = 0 , p s = p ). The bottom and lateral boundaries of the seabed, Γ 9 , Γ 10 , and Γ 11 , are set as impermeable fixed boundaries ( u s = v s = w s = 0 , p / n = 0 ). At the interface between the seabed and the monopile ( Γ 8 ), stress continuity boundaries are applied ( σ s e a b e d = σ p i l e , p s = 0 ).
In the pile model, the interface Γ 7 , where the pile is in contact with water or air, is subjected to wave pressure, while the effect of wave-induced shear stress is neglected ( σ N = p , τ = 0 ). The displacement at boundary Γ 8 , where the pile contacts the seabed, is assumed to be identical to that of the seabed ( u s , p i l e = u s , s e a b e d , v s , p i l e = v s , s e a b e d , w s , p i l e = w s , s e a b e d ).

2.5. Computation Process

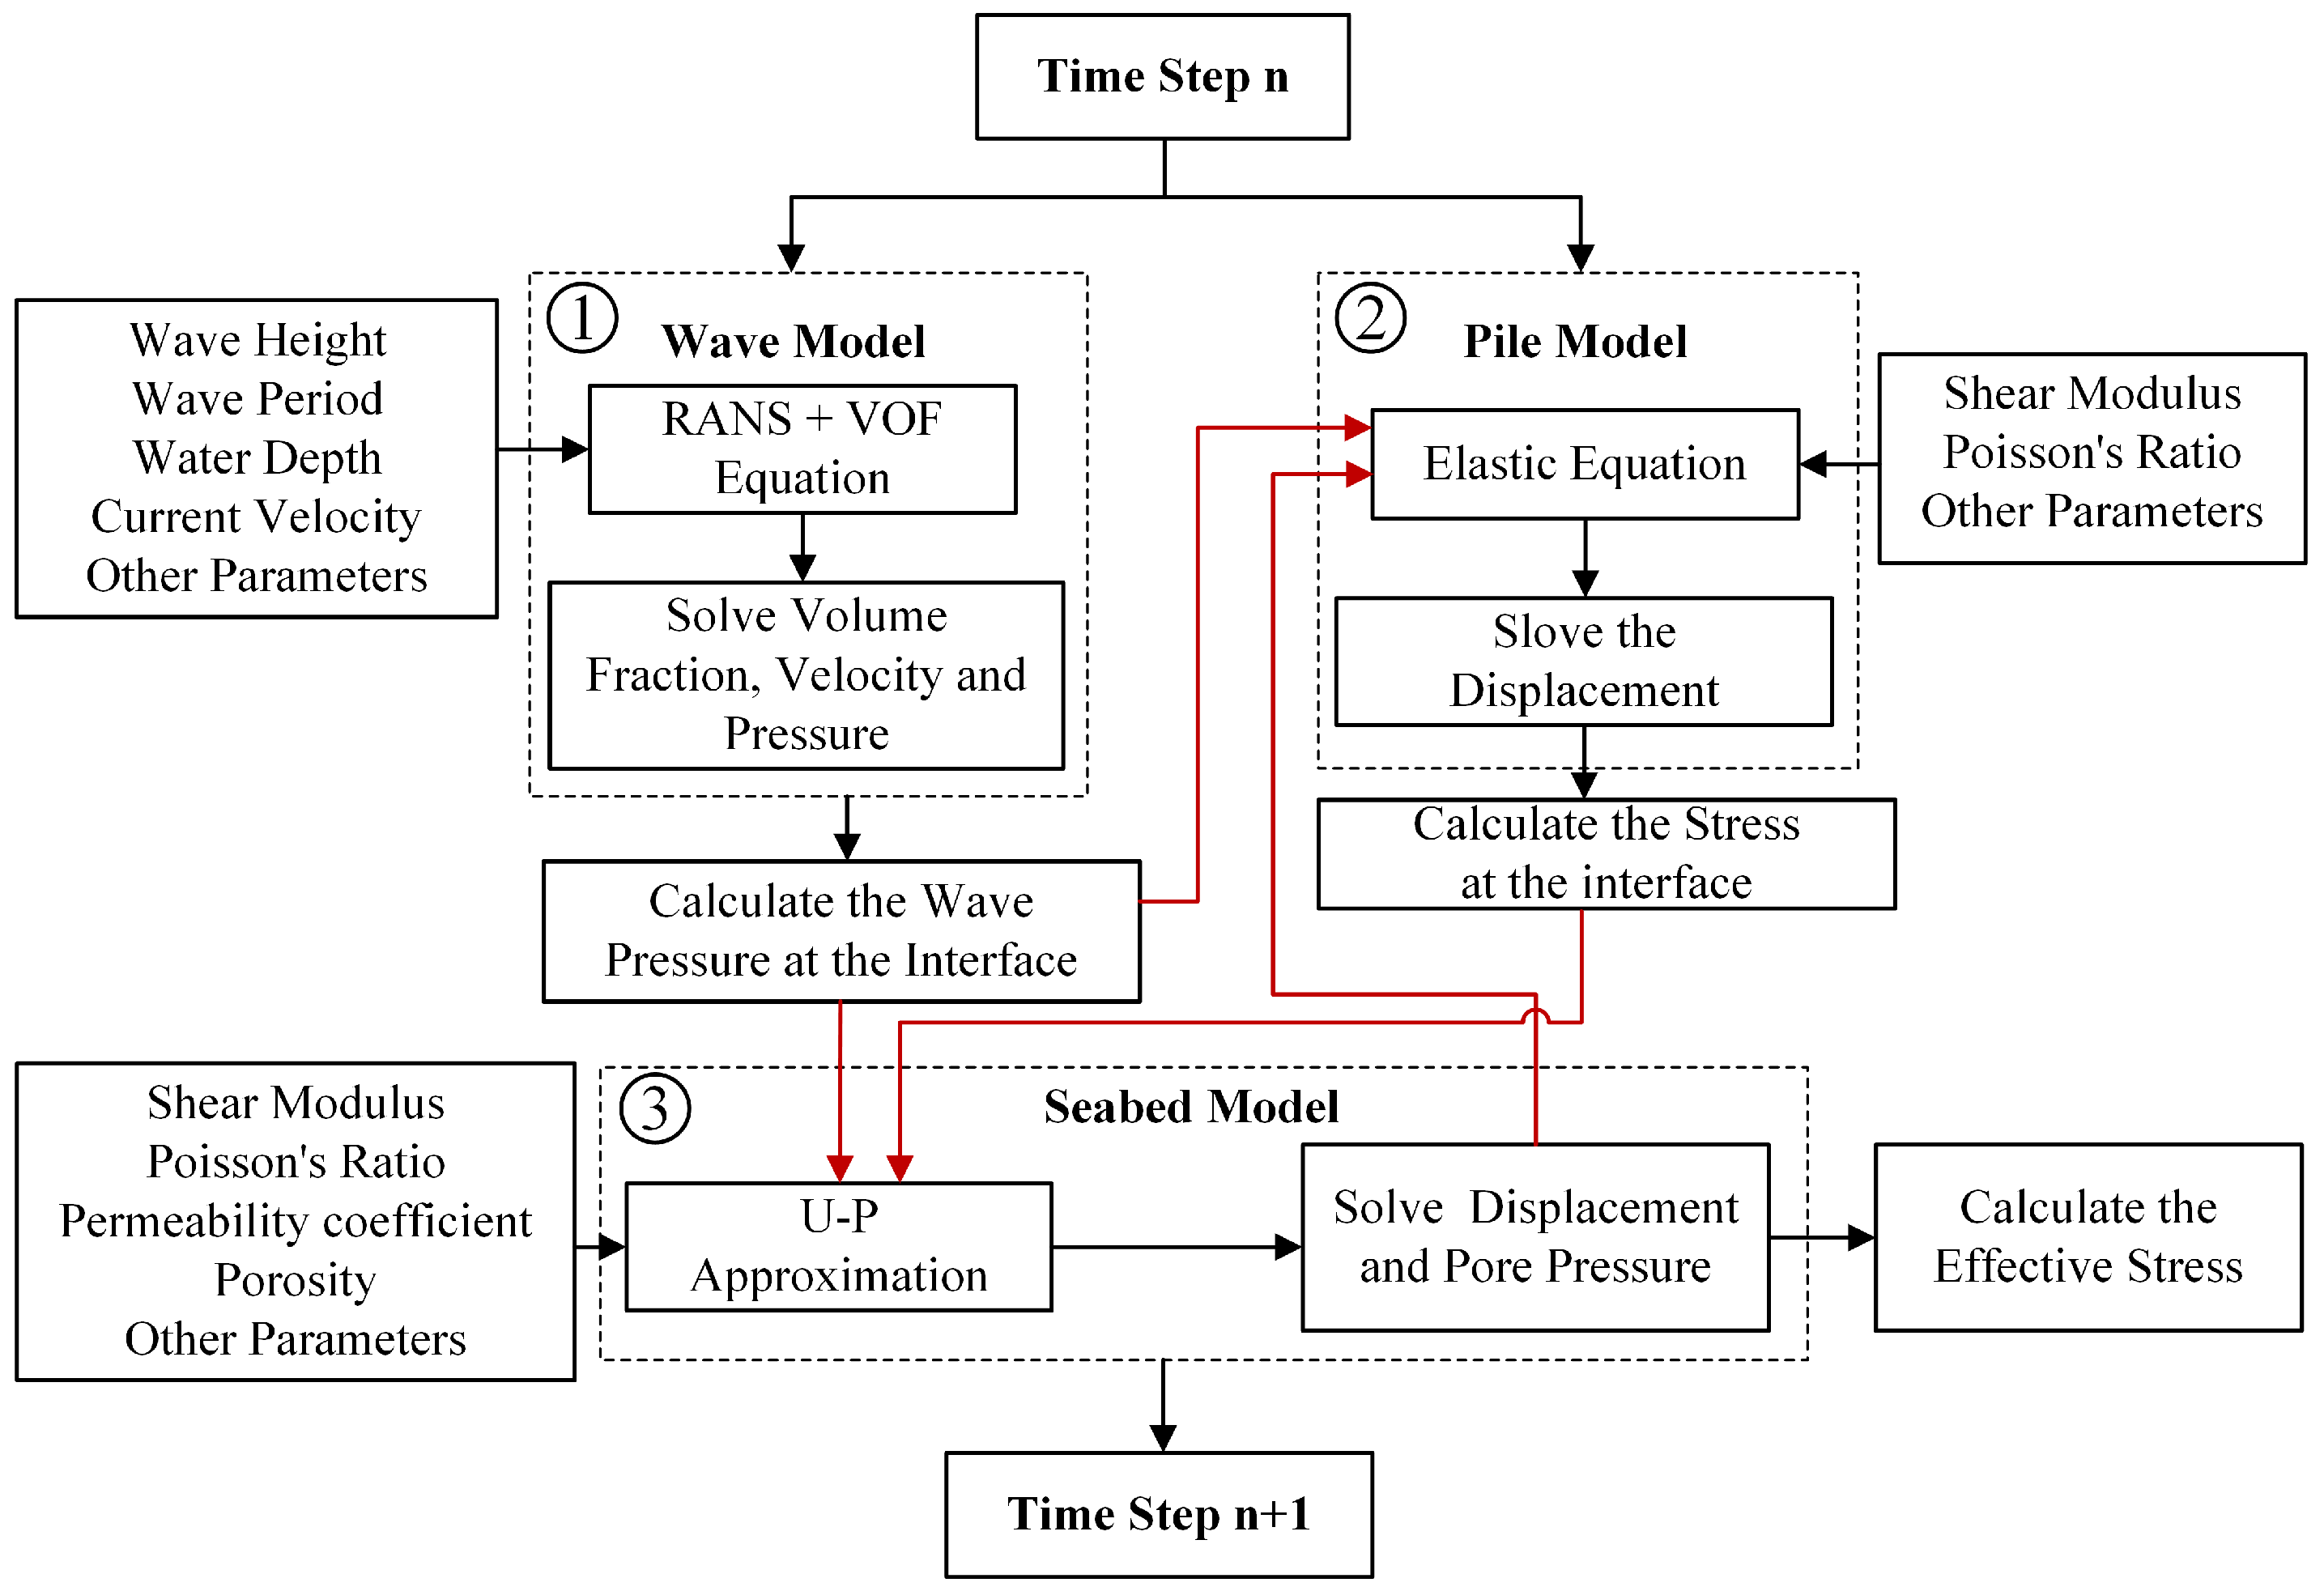
The solution of the wave–seabed–pile interaction involves data exchange between multiple physical fields. Figure 2 illustrates the numerical solution process for a single time step. In the n-th time step, the wave model is first solved to calculate the flow field and pressure field. Then, the boundary conditions related to the seabed and pile–wave pressure are updated. Next, the pile model is solved to obtain the pile displacement and stress field, and the stress on the interface between the seabed and the pile is updated. Finally, the seabed model is solved to obtain the seabed displacement, stress, and pore pressure. Based on the seabed displacement, the displacement on the pile–soil contact surface is updated as the boundary condition for the next time step. In this way, the numerical model can be iteratively solved until the final solution time is reached.
The numerical time step for the wave model is automatically adjusted based on stability constraints derived from nonlinear advection–diffusion theory. Following the criteria proposed by Ye et al. [60], the time step Δ t f must satisfy
Δ t f = min 3 10 min Δ x Δ u , Δ z Δ v , 2 3 min 1 ν + ν t ( Δ x ) 2 ( Δ z ) 2 ( Δ x ) 2 + ( Δ z ) 2
where Δ u and Δ v are the characteristic velocity components in the x- and z-directions, respectively, and ν and ν t are the kinematic viscosity and turbulent kinematic viscosity. This ensures that the wave model remains numerically stable under transient flow conditions.
For the seabed and pile model, a segregated iterative scheme is adopted. The displacement field is solved component-wise, and the updated displacements are then substituted into the fluid storage equation to update the pore pressure. This inner coupling loop continues until a predefined convergence tolerance is achieved. This approach ensures the robust convergence of the seabed and pile solution while allowing the time step to be governed primarily by the wave model. The details of the discretization and coupling process can be referred to in Liu and García [61].
The total simulation time is set to 16 wave periods ( 16 T ), which is sufficient for the wave field around the monopile to fully develop and stabilize.

2.6. Numerical Model Validation

This section selects two wave flume experiments conducted by Chen et al. [62] and Wang et al. [63] to verify the accuracy of the numerical model developed in this study, including the water surface profile around the pile caused by waves, wave pressure, and seabed pore pressure.
To quantitatively assess the accuracy of the numerical model, two widely accepted evaluation metrics are adopted: the Nash–Sutcliffe efficiency coefficient (NSE) and the RMSE-observations standard deviation ratio (RSR), as recommended by Moriasi, D.N. et al. [64]. These indicators are defined as
N S E = 1 i = 1 n ( Y i o b s Y i s i m ) 2 i = 1 n ( Y i o b s Y o b s ¯ ) 2
R S R = i = 1 n ( Y i o b s Y i s i m ) 2 i = 1 n ( Y i o b s Y o b s ¯ ) 2
Here, Y i obs and Y i sim represent the i-th observed and simulated values (e.g., wave surface elevation or pressure), respectively, and Y obs ¯ is the mean of the observed data. A higher NSE (closer to 1) and a lower RSR (closer to 0) indicate better agreement between the model and experimental results. The general performance ratings for model evaluation using these indicators are listed in Table 1.
Chen et al. [62] conducted a series of experiments in the shallow water basin of the Danish Hydraulic Institute. The entire area has a length of 35 m, a width of 25 m, and a constant water depth of 0.505 m. Segmental piston-type wave generators were placed at the water inlet to generate waves. The pile’s diameter was 0.25 m, and it was positioned at the center, 7.52 m from the inlet. Additionally, 19 wave gauges were arranged to measure the wave patterns around the pile. In this study, the data from wave gauges 1 (0.77 m from the inlet) and 9 (0.002 m in front of the pile) were used to validate the wave generation results of the numerical model. The wave parameters were set with a wave height of H = 0.14 m and a period of T = 1.22 s. The numerical computation used a geometry consistent with the experimental setup as the calculation domain, and the comparison of the wave height data from wave gauges 1 and 9 is shown in Figure 3. Because the numerical model uses a boundary velocity wave generation method, which is different from the piston-type wave generation used in the laboratory, some differences in the wave generation results were inevitable. In the numerical calculation, the initial phase of wave gauge 1 was adjusted to match the experimental results. The comparison at wave gauge 9 demonstrated that the numerical model provided a reliable representation of the wave surface near the pile. To quantitatively validate the accuracy of surface elevation prediction, NSE and RSR values were calculated for gauge 1 and gauge 9. The results showed that for gauge 1, NSE = 0.7363 and RSR = 0.5122, indicating “good” performance; for gauge 9, NSE = 0.9088 and RSR = 0.3016, corresponding to “very good” performance. These findings further support the model’s capability to simulate wave transformation and surface evolution in the vicinity of the pile.
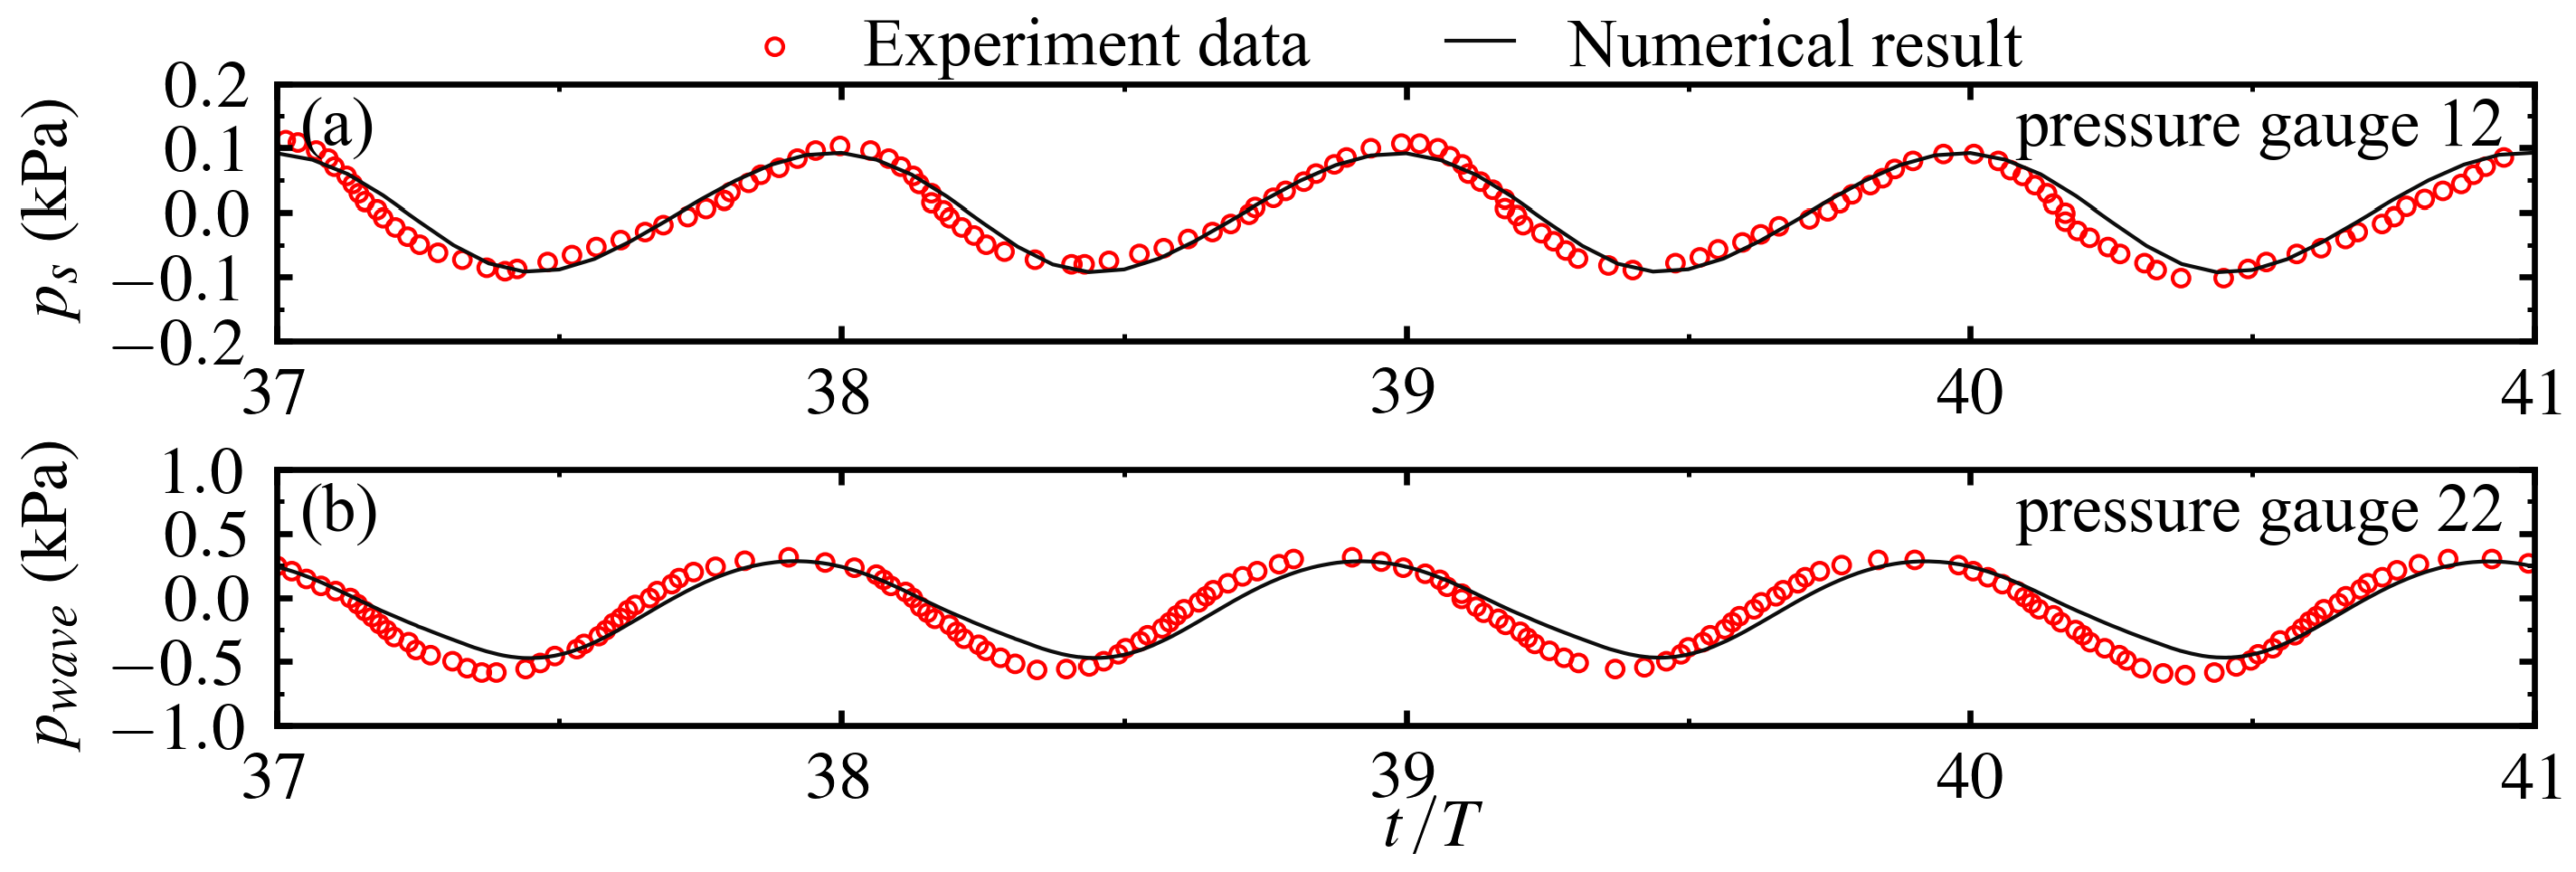
The wave flume used in the experiment by Wang et al. [63] had dimensions of 60 m in length, 2.0 m in width, and 1.8 m in height. A piston-type wave generator was placed at the inlet, and a wave absorber was used at the outlet. A sand trench was excavated in the middle of the flume to simulate the seabed. A PVC cylinder with a diameter of 0.3 m was placed at the center of the sand trench, and both ends of the pile were strictly fixed to prevent displacement. During the experiment, pore pressure sensors were used to measure the wave pressure acting on the upper part of the pile and the surrounding seabed pore pressure. The water depth was maintained at 0.6 m throughout the experiment. In this study, data from pressure sensors 22 (located on the side of the pile, 0.44 m above the mudline) and 12 (located on the leeward side of the pile, 0.15 m below the mudline) were used to validate the accuracy of the numerical model’s wave pressure and pore pressure. In the numerical model, the seabed parameters were set to be exactly the same as those in the experiment: shear modulus, G = 8.58 × 10 6 Pa; permeability coefficient, k s = 2.382 × 10 5 m/s; soil particle density, ρ s = 2679 kg/m3; and porosity, n = 0.448 . The final comparison results of the wave pressure on the pile and the pore pressure at the pile bottom after the calculations are shown in Figure 4. The numerical simulation results effectively reflect the periodic effects of waves on the pile. However, there are certain differences in the wave crests, troughs, and wave phase compared to those in the experimental data. This may be due to the difference in the wave generation method: the experiment used a piston-type wave generator, while the numerical model employed a boundary velocity wave generation method. Additionally, the pile, water, and soil in the experiment exhibited some frictional resistance, which affected the transmission of the wave troughs and peaks. Despite these minor differences, the simulation still demonstrated strong capability in reproducing the wave pressure and pore pressure around the pile. Similarly, NSE and RSR were computed for the comparison at gauges 12 and 22. The results yielded an NSE = 0.9065 and RSR = 0.3048 for gauge 12 and an NSE = 0.8388 and RSR = 0.4006 for gauge 22. Both sets of metrics fell within the “very good” performance range, further confirming the model’s accuracy in capturing wave-induced pressures on the pile and pore pressure responses in the seabed.

3. Numerical Model Setup

This section introduces the establishment of the numerical model used in this study from three aspects: geometry selection, mesh generation, and numerical parameter settings.

3.1. Computational Domain

This study aimed to investigate the dynamic response of piles constructed on a coral sand seabed. A typical coral sand seabed profile features a steep fore slope and a reltively flat nearshore section known as the reef flat [65]. In this study, the coral sand seabed was simplified as a sloped terrain, with both offshore and nearshore areas treated as flat. A sloping surface was used to simulate the reef slope. This simplification has been applied in many numerical studies [66,67,68]. The computational domain used in this study is shown in Figure 5.
Based on observational data from natural coral reefs, slope gradients typically range from 1:250 to 1:1, with reef heights between 6 and 30 m and water depths on the reef top between 1 and 5 m, and wave periods generally fall within the range of 3 to 7 s [69,70]. In this study, to ensure numerical feasibility and avoid the construction challenges associated with pile installation on steep slopes, the seabed slope gradient was set between 1:20 and 1:2.5, and the seabed slope height was taken as 15 m. A flat seabed case with zero slope gradient was also included for comparison. The water depth was fixed at 5 m, and a representative wave period of 6 s was used.
Wave was assumed to propagate steadily and perpendicularly to the reef front. This simplification is commonly adopted in wave–pile–seabed interaction studies [27,71] and allows clearer assessment of the effects of coral reef topography and monopile foundation response. A pile was placed on a sloped surface, with a fixed embedment depth of 40 m into the soil. This depth corresponded to an embedment length-to-diameter (L/D) ratio of 8, considering the pile diameter of 5 m. Such an L/D ratio is within the typical range of 4 to 8 recommended for offshore monopile foundations [72]. The numerical calculation for the pile was a three-dimensional model, with only the front view shown in Figure 5. In this study, four observation points were arranged around the seabed. Points B and D were positioned on the lateral sides of the pile, while Points A and C were located on the upstream and the lee-side of the pile, respectively. In the simulation, the pile was placed in the middle of the width direction, and the width of the computational domain was set to 20 times the diameter of the pile to avoid boundary effects [41,73]. The relevant geometric parameters are shown in Table 2.

3.2. Mesh Generation

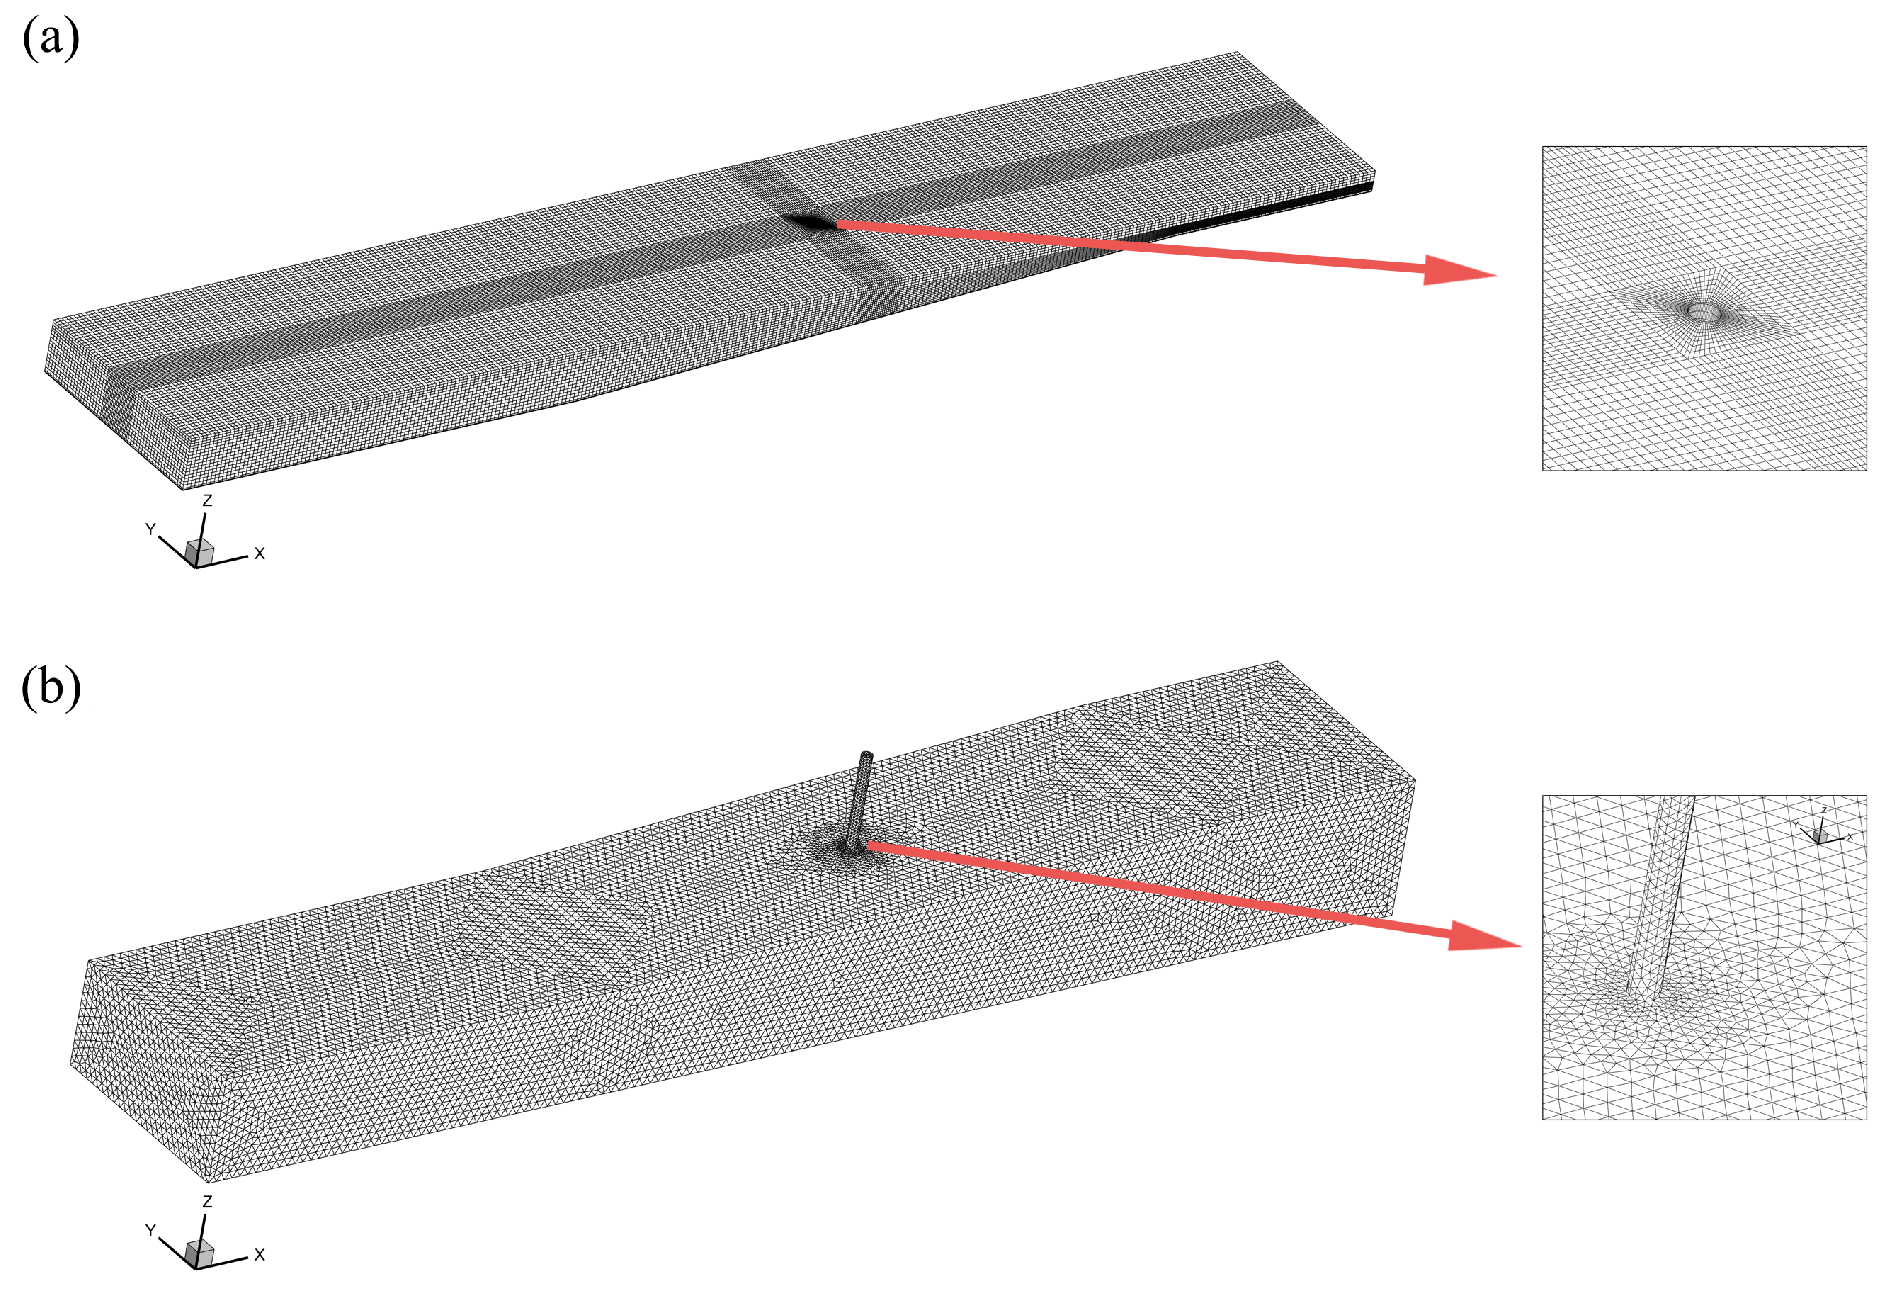
Mesh generation is a critical step in numerical simulations. A well-designed mesh not only ensures the accuracy of the result but also optimizes computational efficiency. In this study, the mesh was divided into three regions: the wave region, seabed region, and pile region. In general, fluid simulations require a more refined and extensive mesh than those used in solid mechanics. To achieve better convergence, a highly orthogonal structured mesh was employed in the wave region, while triangular meshes were used in the seabed and pile regions for better fitting characteristics.
According to Huang et al. [74], the mesh size Δ z at the air–water interface should be no greater than 1/15 of the wave height H in wave–structure interaction simulations. In this study, the mesh size in the region near the air–water interface was controlled to be Δ z H / 20 . In the direction of wave propagation (x-direction, the mesh size Δ x was set to 1/100 of the wavelength L at locations far from the pile, with local refinement near the pile ensuring that Δ x L / 200 . In the width direction (y-direction), since the model did not account for the wave propagation angle, waves were assumed to be incident perpendicular to the inlet boundary. Therefore, the mesh along the y-direction could be extended, with a mesh size of Δ y = Δ x / 2 . Local mesh refinement was applied around the pile to improve the flow field and wave pressure around the pile and seabed.
For the seabed region, the mesh size in the x-direction was set to Δ x L / 40 based on the mesh partitioning approach of Zhao et al. [75]. In the z-direction, local refinement was applied near the seabed surface, while coarser meshes were used near the seabed bottom and far from the pile. The mesh cell size satisfied Δ x / 3 Δ z Δ x , while the mesh size in the y-direction was set to Δ x / 2 Δ y Δ x .
For the pile region, the mesh size was matched as closely as possible with the seabed mesh. The cross-section of the pile was divided into 20 meshes along the circumference, and meshes were refined towards the center of the pile with a scaling ratio not exceeding 1.1. The mesh size Δ z for the pile was consistent with that in the wave and seabed regions.
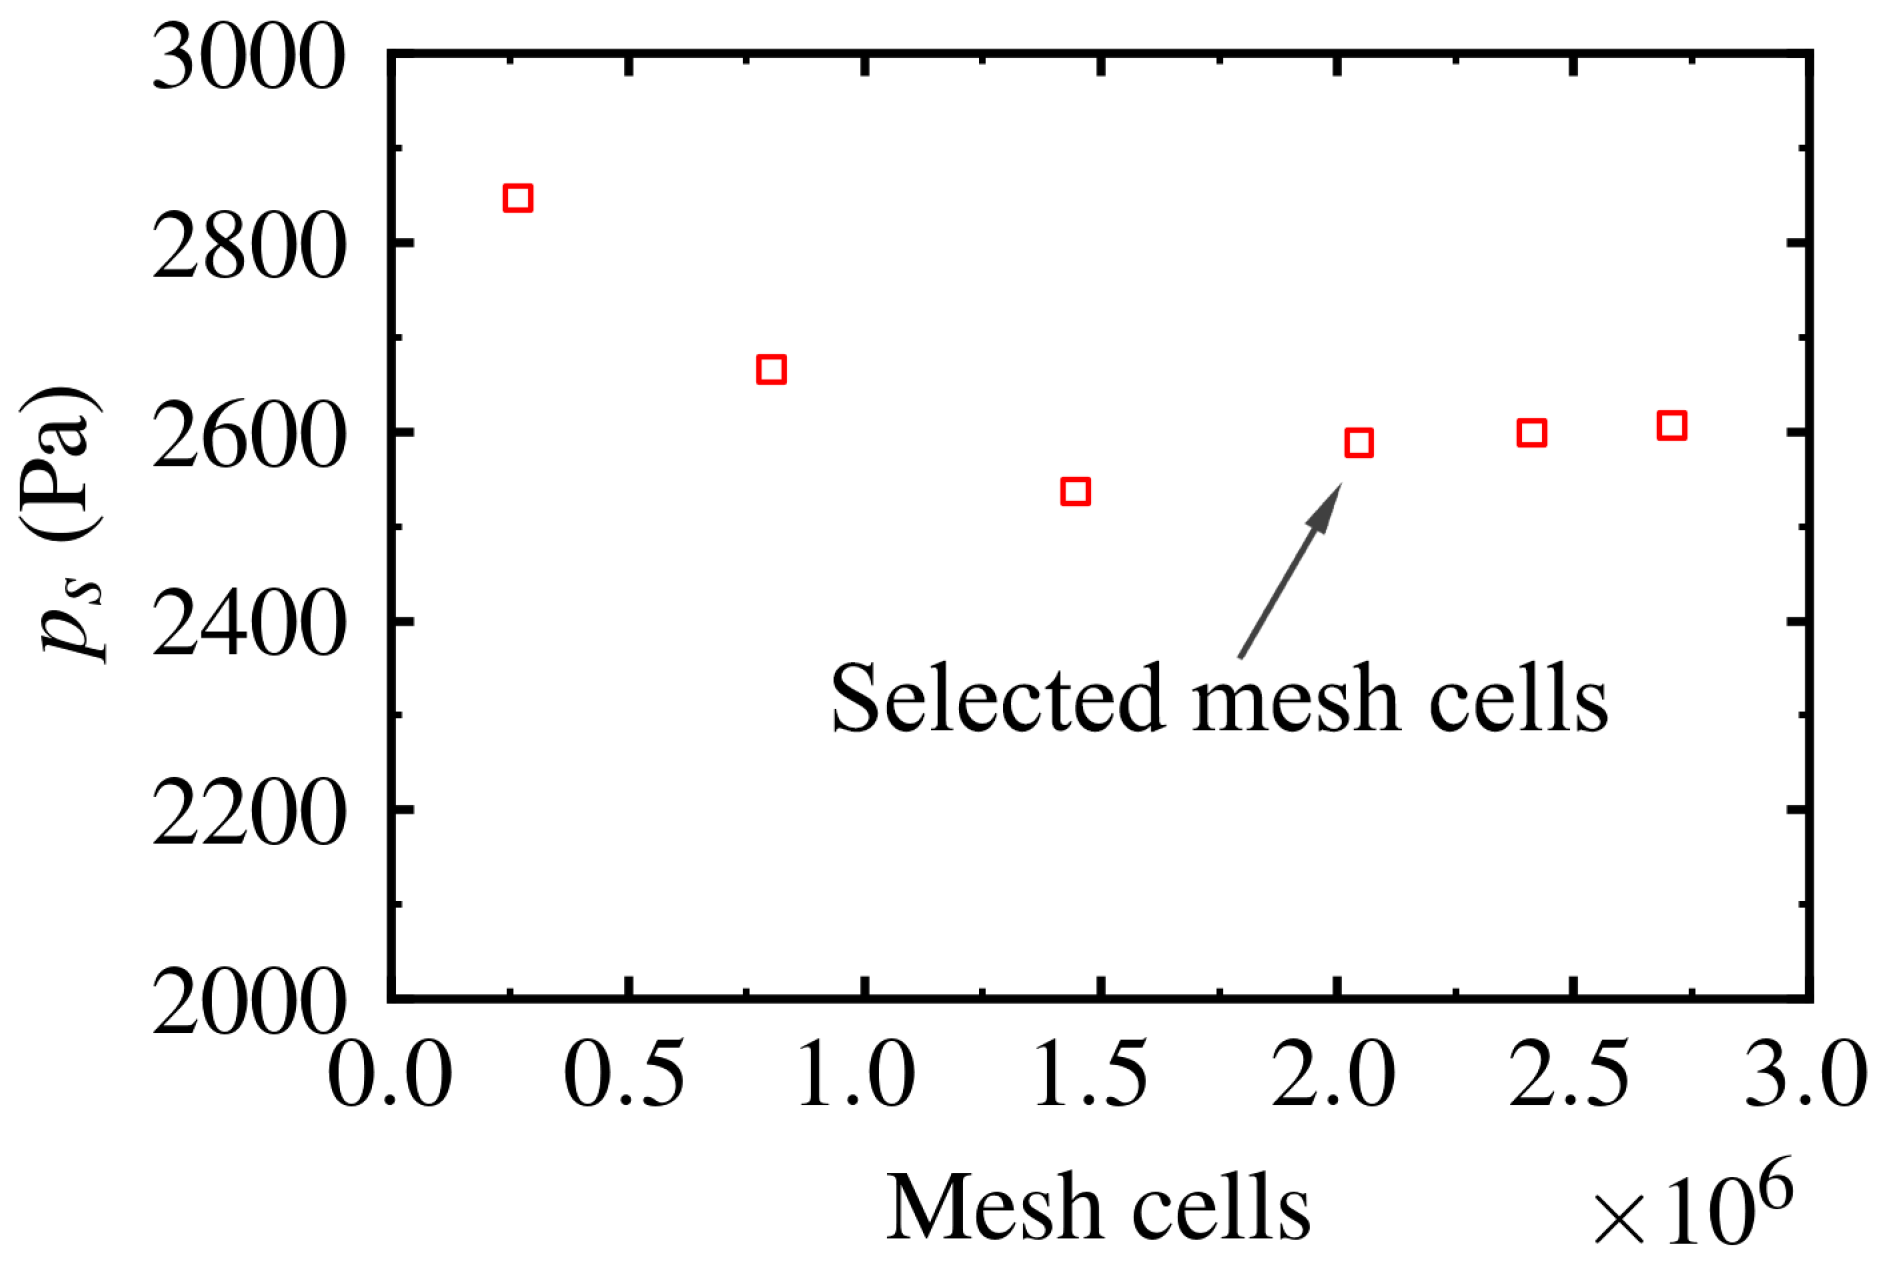
The mesh partitioning results are illustrated in Figure 6. To evaluate the influence of mesh resolution on numerical accuracy, a sensitivity analysis was conducted using six different mesh configurations, with total mesh cell numbers of 268,029, 805,156, 1,448,456, 2,047,550, 2,413,266, and 2,709,493, respectively. The pore pressure amplitude induced by wave loading was extracted at a point located 2 m below the seabed surface along the vertical cross-section at point A, which was positioned in front of the pile. As shown in Figure 7, the pore pressure amplitude gradually stabilized with mesh refinement. Based on this trend, the fourth mesh configuration (2,047,550 total cells) was adopted in this study as a balance between computational efficiency and numerical accuracy.

3.3. Parameter Setting

The present model did not account for particle breakage or the associated evolution of soil fabric and permeability. Instead, coral sand was modeled as an equivalent homogeneous porous medium with constant mechanical properties, consistent with assumptions commonly adopted in numerical studies focused on short-term wave-induced responses. Nevertheless, recent research (e.g., Li et al. [76]) has underscored the significance of particle crushing in calcareous sand, and such effects will be incorporated in future developments of the model.
The purpose of this study was to consider the effects of slope gradient, wave, and current parameters on the sloping seabed response. The monopile was a construction consisting of a steel pipe driven into the seabed using a hydraulic hammer. Here, we simplified the pile as a homogeneous elastic body. Similarly, isotropic parameters were adopted in seabed. The input parameters for the numerical model are shown in the Table 3.

4. Results and Discussion

4.1. Consolidation of Seabed Around Pile

In practical engineering, the seabed around the monopile is subjected to gravity and water pressure, leading to a certain degree of consolidation. With the progress of consolidation, the excess pore pressure in the seabed dissipates, resulting in compression of the soil skeleton and the formation of a nonzero initial effective stress field. The magnitude of this initial stress field is significantly influenced by material density. Since the pile has a much higher density than the seabed, its presence substantially affects the distribution of effective stress around it. In general, neglecting initial consolidation and directly applying wave loading may lead to inaccurate predictions of seabed displacement, stress, and pore pressure, which do not reflect practical engineering conditions [77].
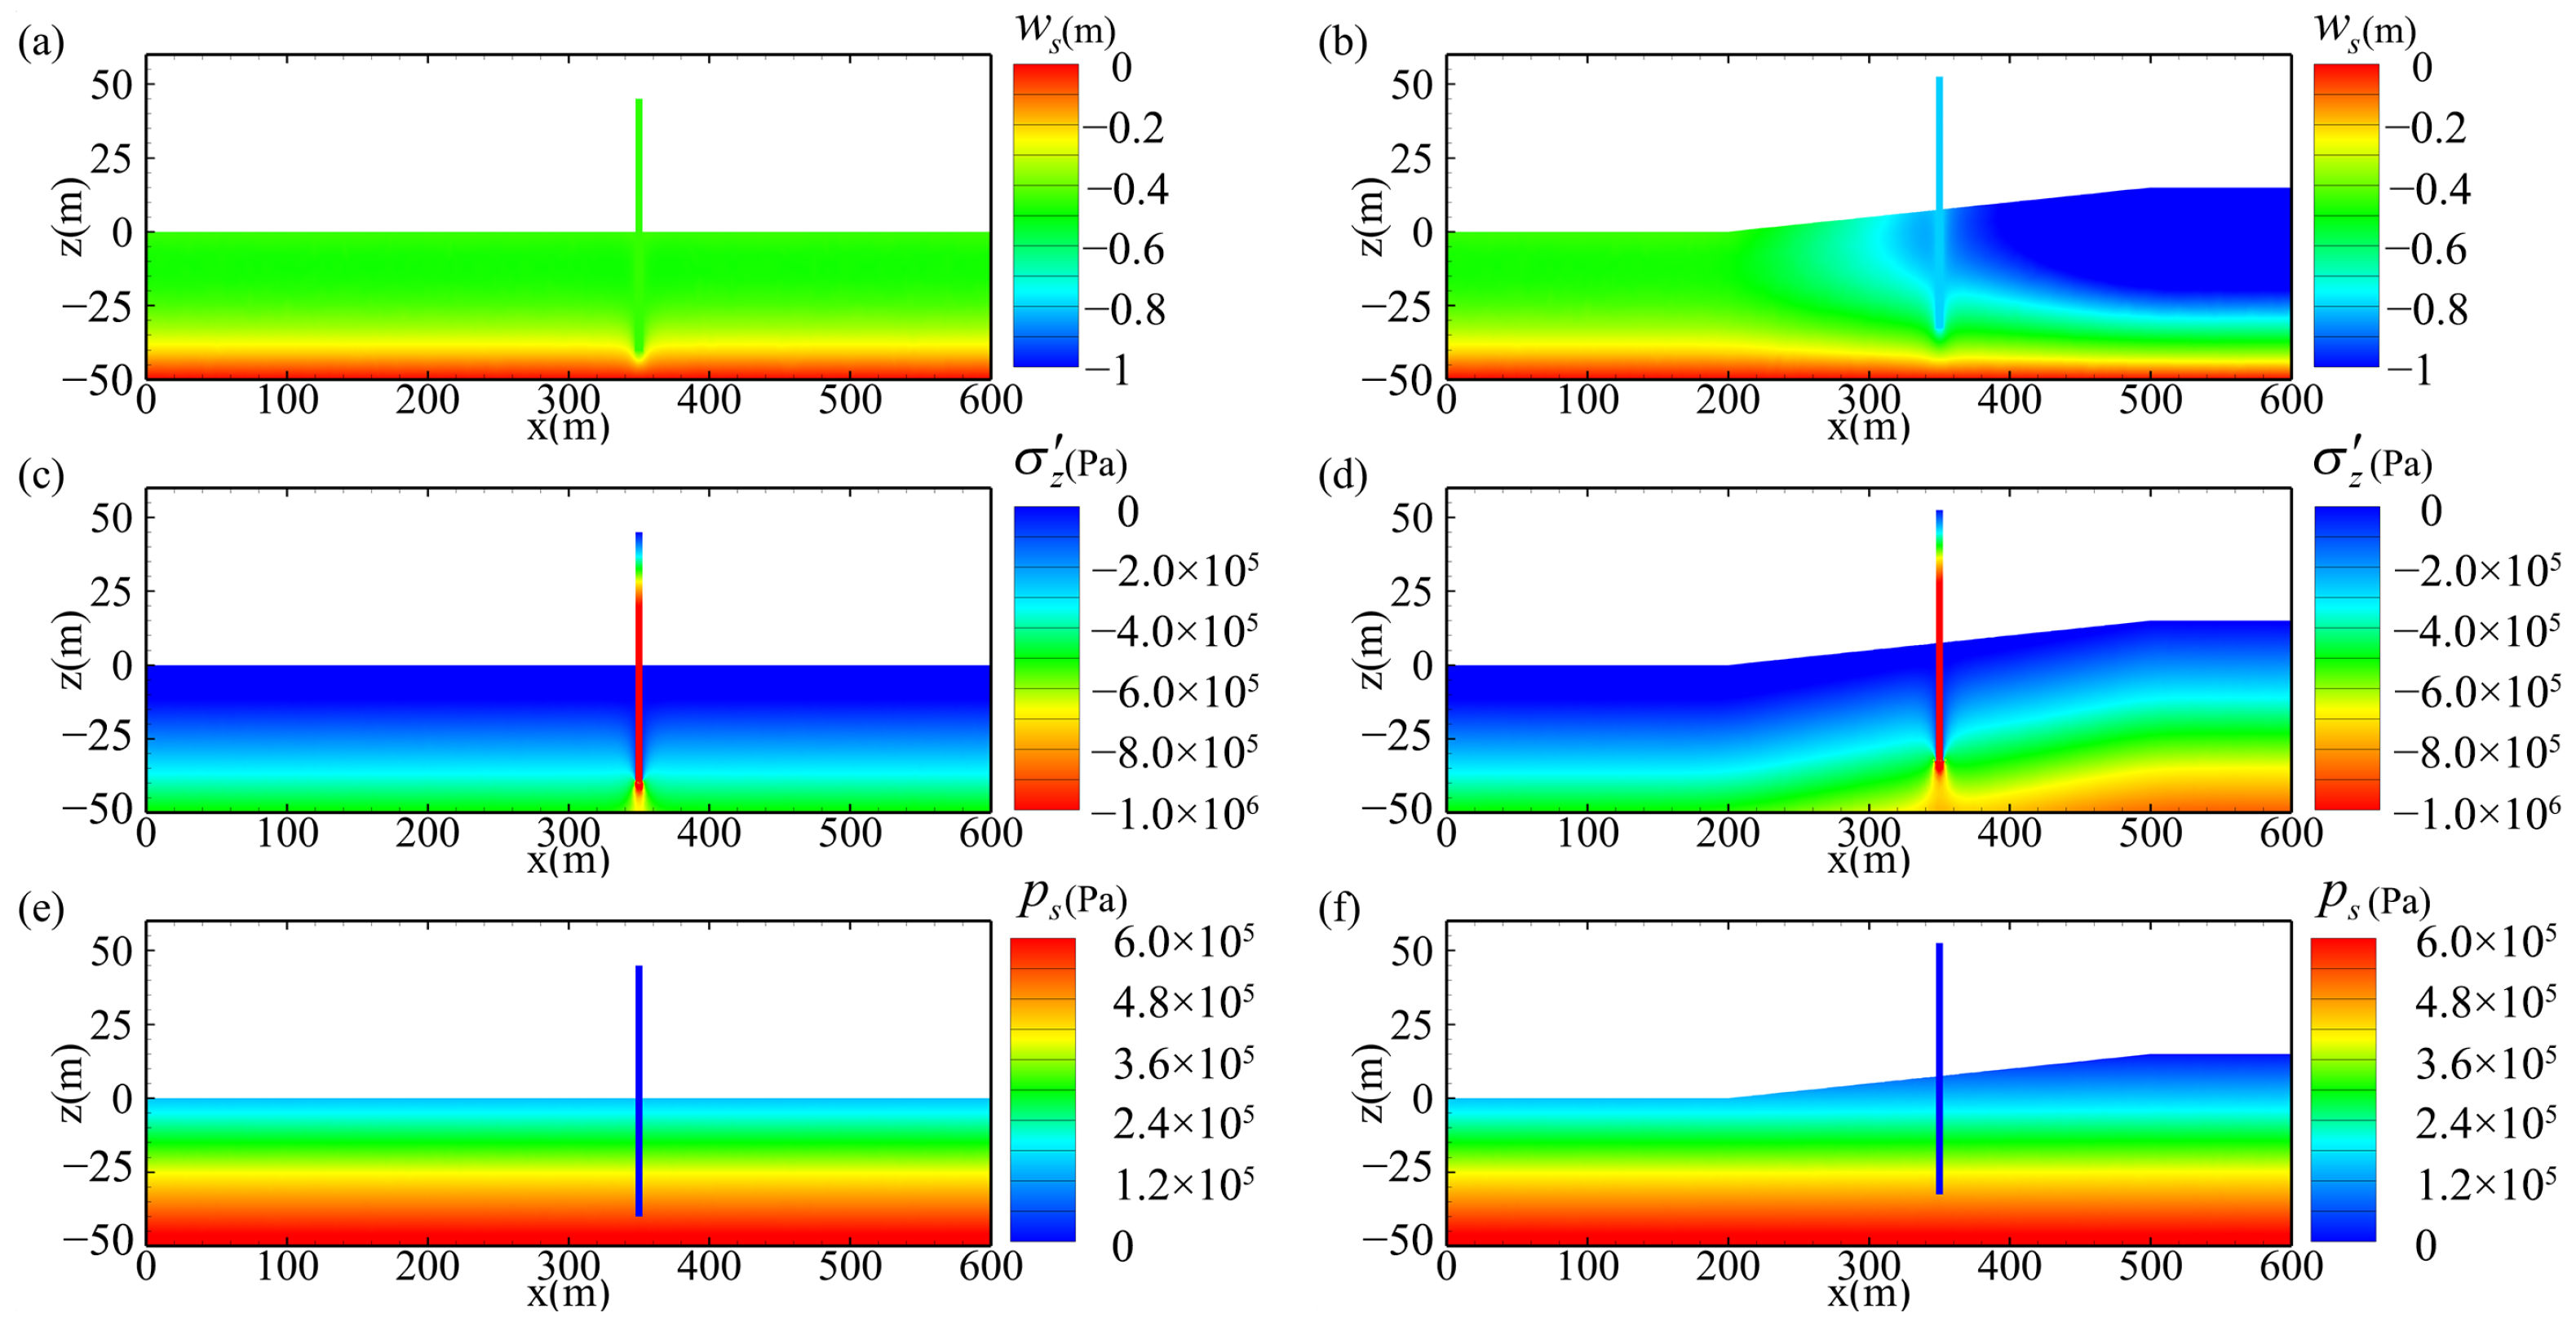
In the numerical simulations conducted in this study, an initial consolidation calculation was performed as the first step for all cases. The water level remained static until the excess pore pressure was fully dissipated and the soil displacement stabilized without further changes. Figure 8 illustrates the distribution of vertical displacement w s , vertical effective stress σ z , and seabed pore pressure p s after the consolidation process. To better explain the effect of the slope, a case without a slope is included for comparison, with the pile embedment depth kept constant. After initial consolidation, the seabed pore pressure was approximately equal to the theoretical hydrostatic pore pressure ρ g d , which was linearly related to the local water depth d. In this stage, the hydraulic load was transferred from the pore water to the soil skeleton, leading to an increase in effective stress and inducing vertical settlement. The settlement at the seabed surface was greater than that at the seabed bottom. Furthermore, the presence of the slope led to greater settlement on the nearshore side, where the soil layer was thicker than that on the offshore side. The presence of the pile further influenced seabed deformation, resulting in greater vertical displacement in the vicinity of the pile compared to regions farther away. A distinct zone of high vertical stress was observed at the lower end of the pile.

4.2. Comparison of Slope and Flat Seabed

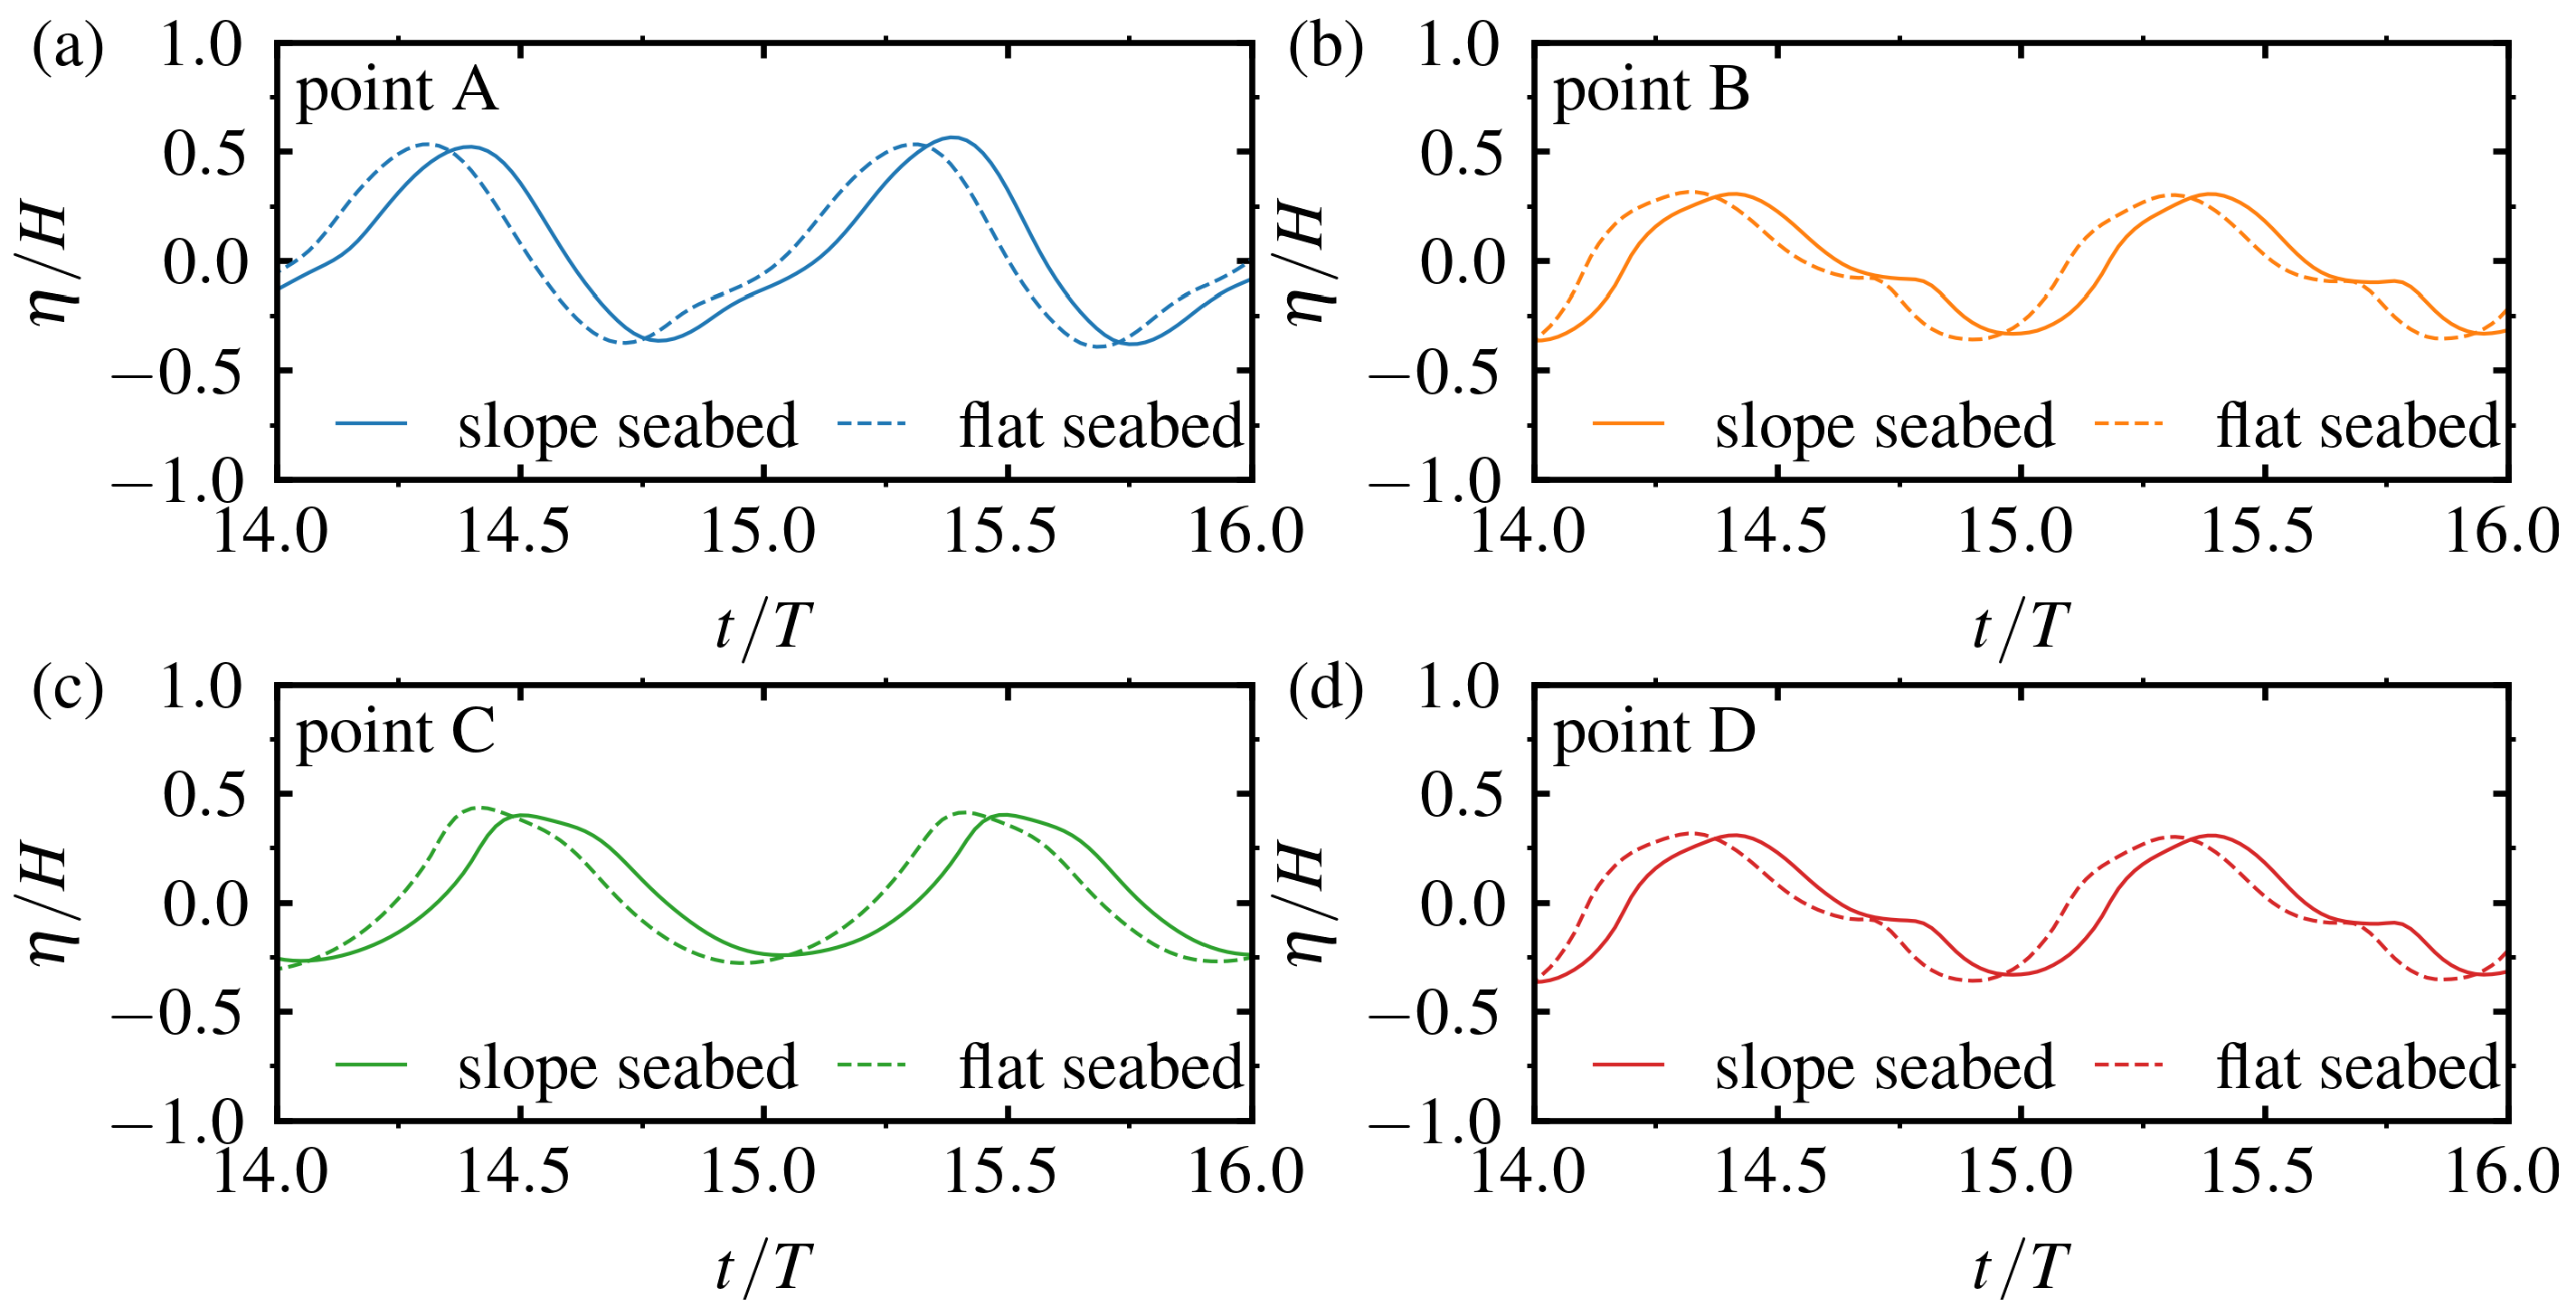
Figure 9 shows the comparison of water surface elevation around the pile under different seabed conditions. To provide a clearer understanding of the wave–pile interaction under varying bathymetric profiles, only the most representative time instant, t / T = 15.5, is selected for detailed analysis. At this moment, only Point A exhibited a slightly higher free surface elevation under the sloping seabed condition compared to the flat seabed, while the other three points showed slightly lower values. This variation can be attributed to the modified wave transformation processes caused by the sloping seabed, particularly the shoaling and refraction effects. The enhanced shallow water effect on the sloping seabed led to wave height amplification as waves propagated into shallower regions. The upstream of the pile, located in the wave convergence zone, experienced a local intensification of wave energy, resulting in greater free surface disturbances. Due to the wave deformation and refraction induced by the sloped seabed, part of the wave energy was dissipated or diffracted around the pile’s upstream side. As a result, the wave energy on the lateral and lee-side of the pile was relatively weakened, leading to lower free surface elevation compared to that in the flat seabed case. In addition, it can be seen that the water surface elevation at Point A was higher than that at Point C in both seabed cases, which was more evident under the sloping seabed condition. Taking the case of a sloping seabed as example, the value of η / H at Point A was 0.5 when t / T = 14.5, while the value at Point C was 0.38. This is because the sloping seabed enhanced the nonlinear characteristics of the wave propagation toward the pile, which led to a greater difference in water surface elevation between the upstream and lee-side of pile.
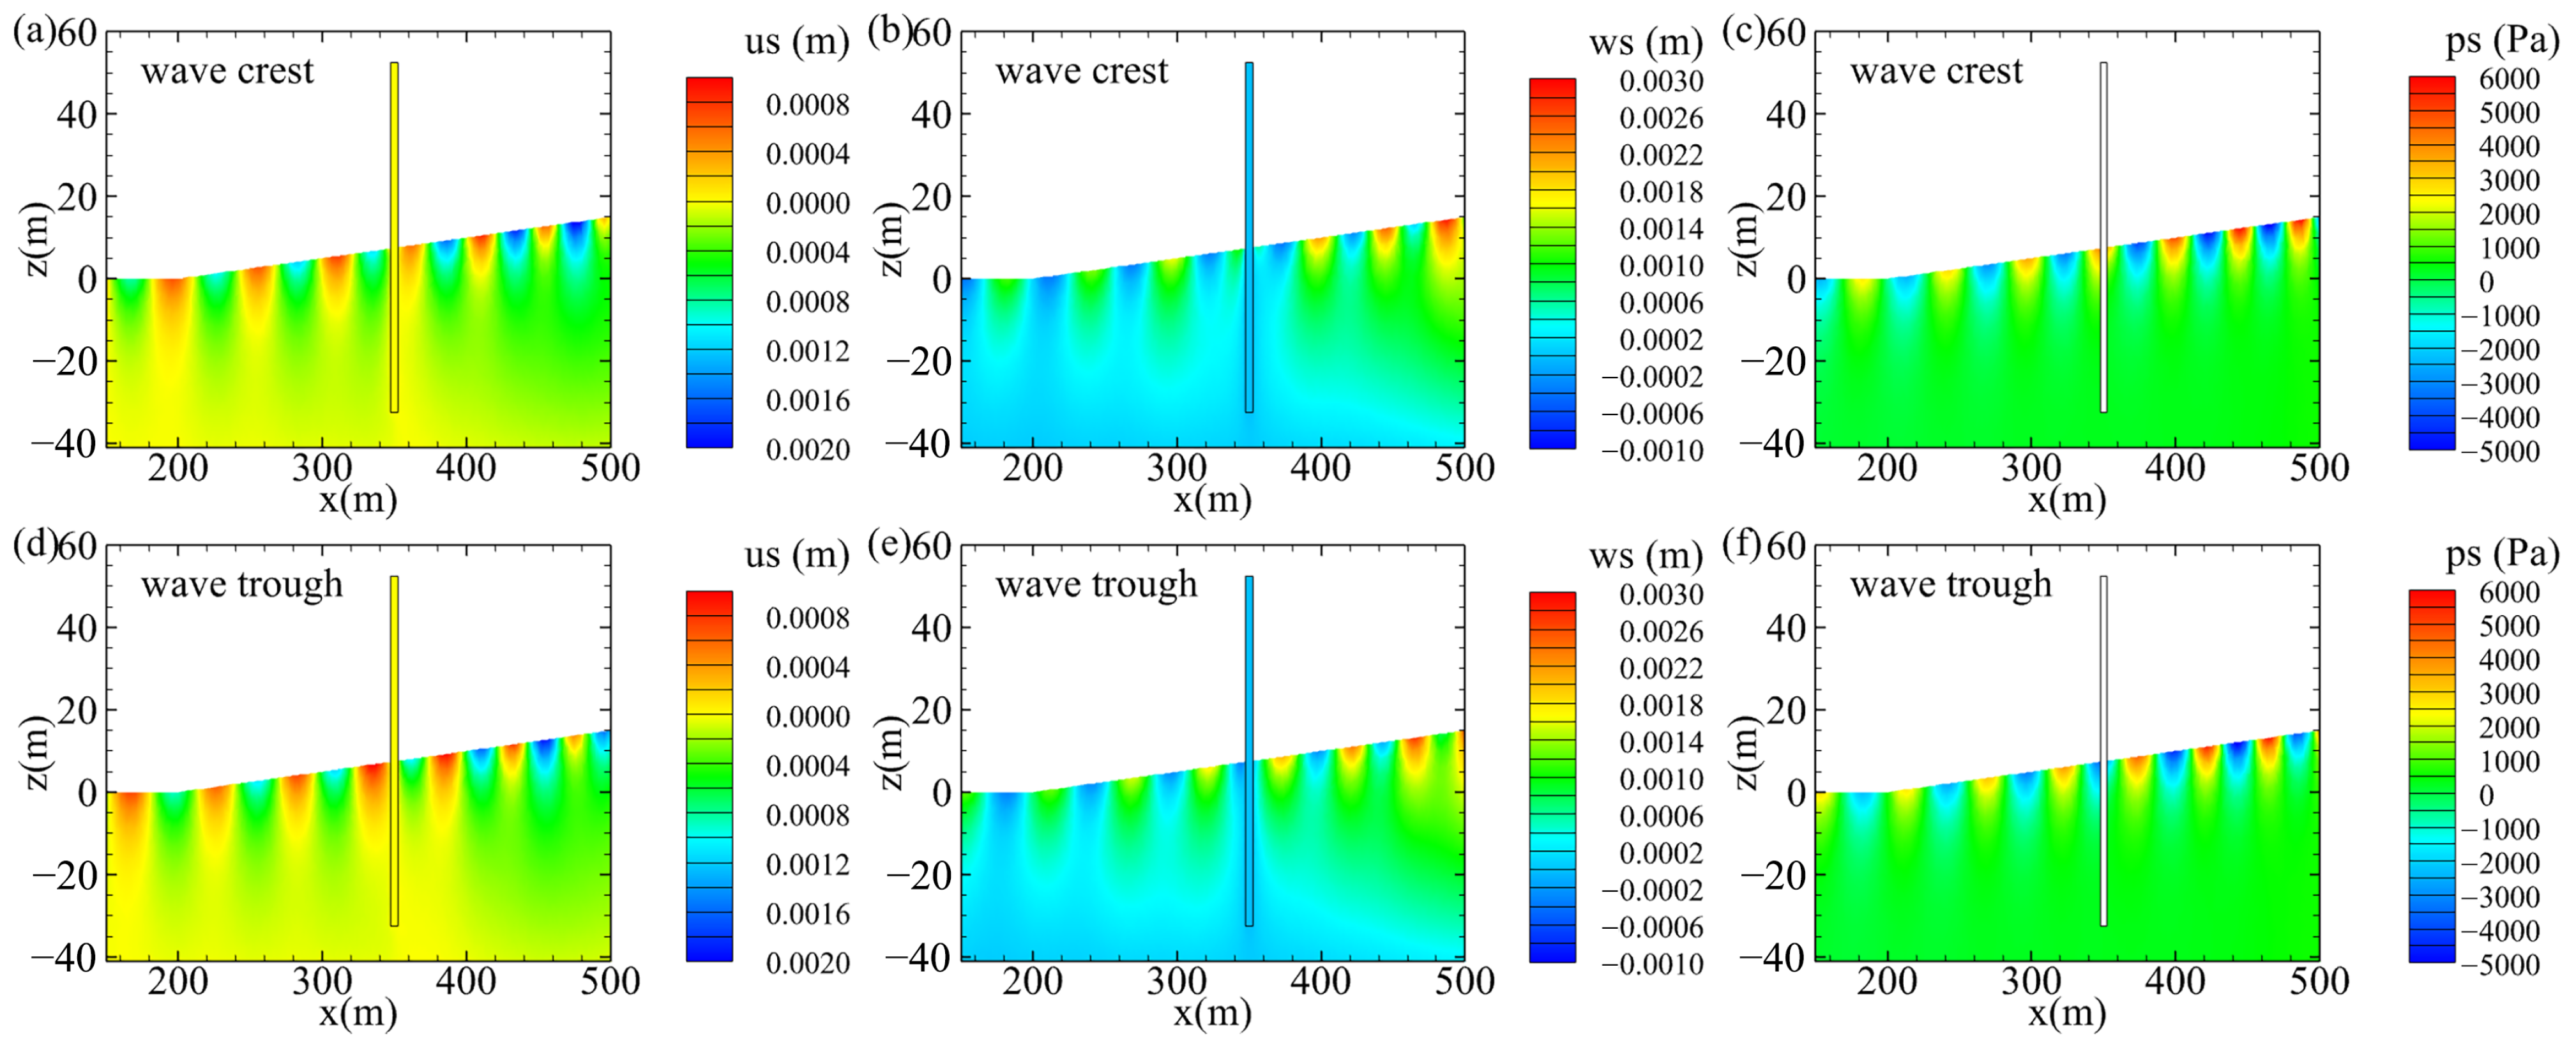
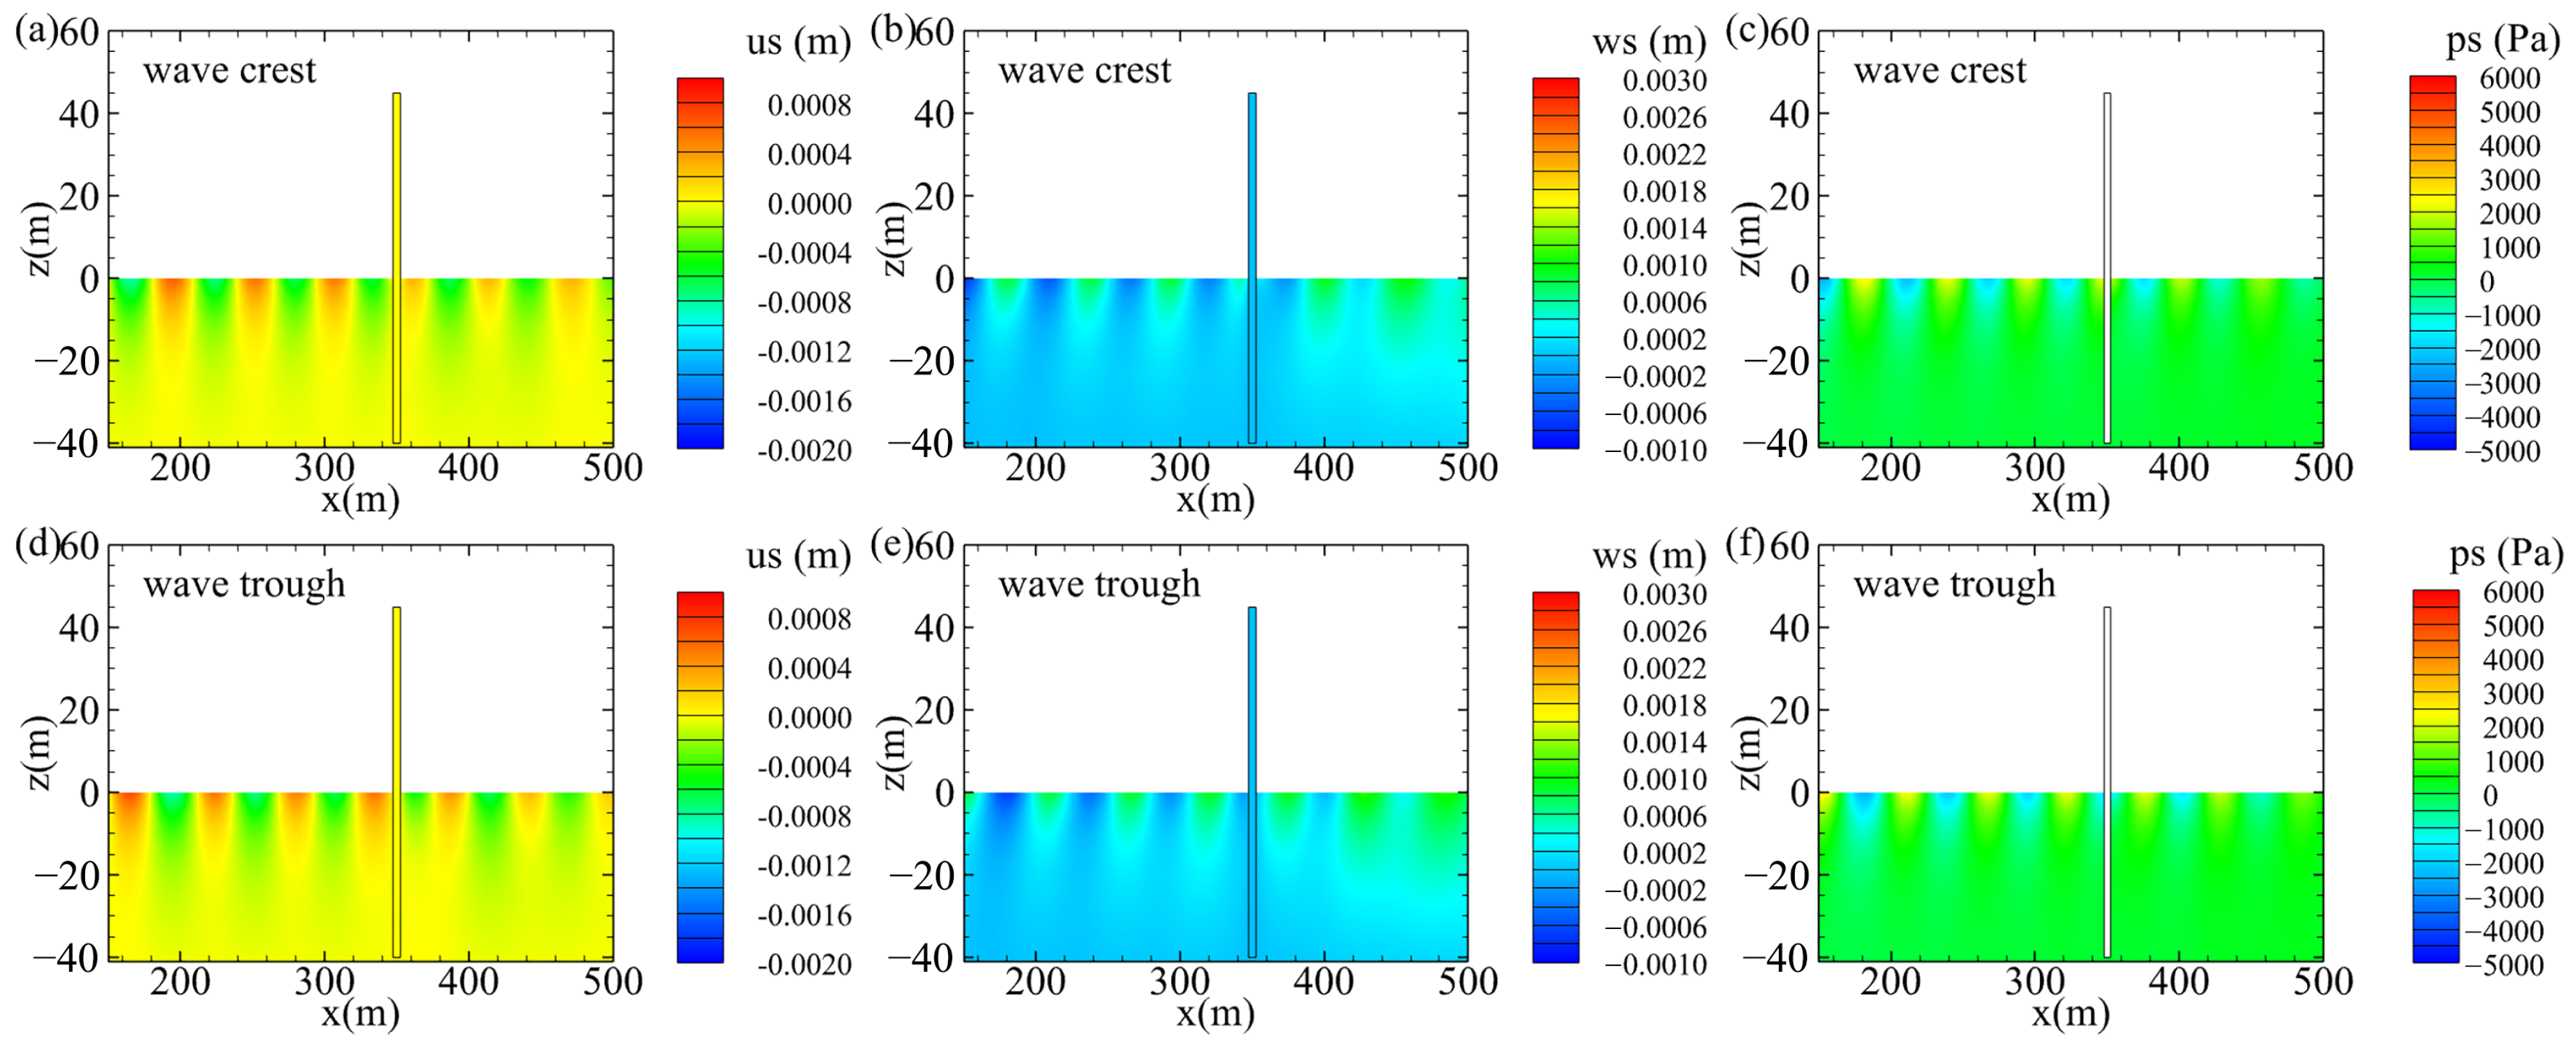
Figure 10 and Figure 11 illustrate the pore pressure and soil displacement around the pile for the flat seabed and sloping seabed, respectively. By comparing the pore pressure between the sloping seabed and flat seabed, it is evident that the distributions of pore pressure in the two seabeds were significantly different. In the case of the flat seabed, the pore pressure upstream of the pile was significantly larger than that on the lee-side. However, the pore pressure upstream of the pile was smaller than that on the lee-side in the case of the sloping seabed. This is because the water depth on the lee-side of the pile was shallower than that on the upstream side in the case of the sloping seabed, resulting in an opposite pattern of pore pressure variation. Similarly, the pattern of soil displacement followed the same trend.
According to previous studies, the variations of effective stress within the seabed are one of the main causes of seabed instability. Therefore, the effective stress distribution around the pile for the flat seabed and the sloping seabed are depicted in Figure 12 and Figure 13, respectively. It can be seen from the figure that the value of effective stress in the y-direction is the smallest, while the effective stress is the largest in z-direction for both two seabed cases. By comparing the effective stress values of two kinds of seabed at the same location, it can be seen that the variation in effective stress in all three directions was the same. That is to say that the effective stress of the flat seabed was greater than that of the sloping seabed upstream of the pile, while the variation trend was opposite on the lee-side of the pile. The reason for the variation in effective stress on the lee-side of the pile is consistent with that for the pore pressure, which is not repeated here. However, the reduced effective stress observed on the upstream side under the sloping seabed condition can be attributed to the misalignment between the gravitational vector and the local slope direction. This geometric inconsistency impaired vertical drainage pathways, resulting in delayed pore pressure dissipation and localized excess pore pressure accumulation. Such a mechanism ultimately led to a redistribution of and reduction in effective stress in that region. These findings reinforce the importance of incorporating seabed inclination effects into seabed stability analyses, particularly for foundation design in sloped offshore environments.
Figure 14 illustrates the distribution of the seepage force in the z-direction at the wave trough phase. It can be observed that a significant upward seepage force (positive j z ) developed on the left side of the structure, particularly in the upper region of the seabed (approximately x = 330–340 m). This phenomenon is attributed to the wave-induced pressure gradient, where the negative pore pressure generated during the wave trough drove pore water upward. Such an upward-directed seepage force may have reduced the the specific weight of soil particles and contributed to the onset of liquefaction or scour in the seabed. In contrast, the right side of the structure showed a relatively milder and more uniformly distributed seepage pattern. The overall distribution of j z aligned with the slope of the free surface, suggesting that the wave-induced pressure variation played a dominant role in controlling the vertical seepage behavior near the seabed.
In this paper, the liquefaction criteria proposed by Jeng [9] are adopted, which has been widely applied in the study of transient liquefaction.
1 3 ( γ s γ f ) ( 1 + 2 K 0 ) z p s p b
in which γ s denotes the unit weight of the soil and p b represents the wave pressure.
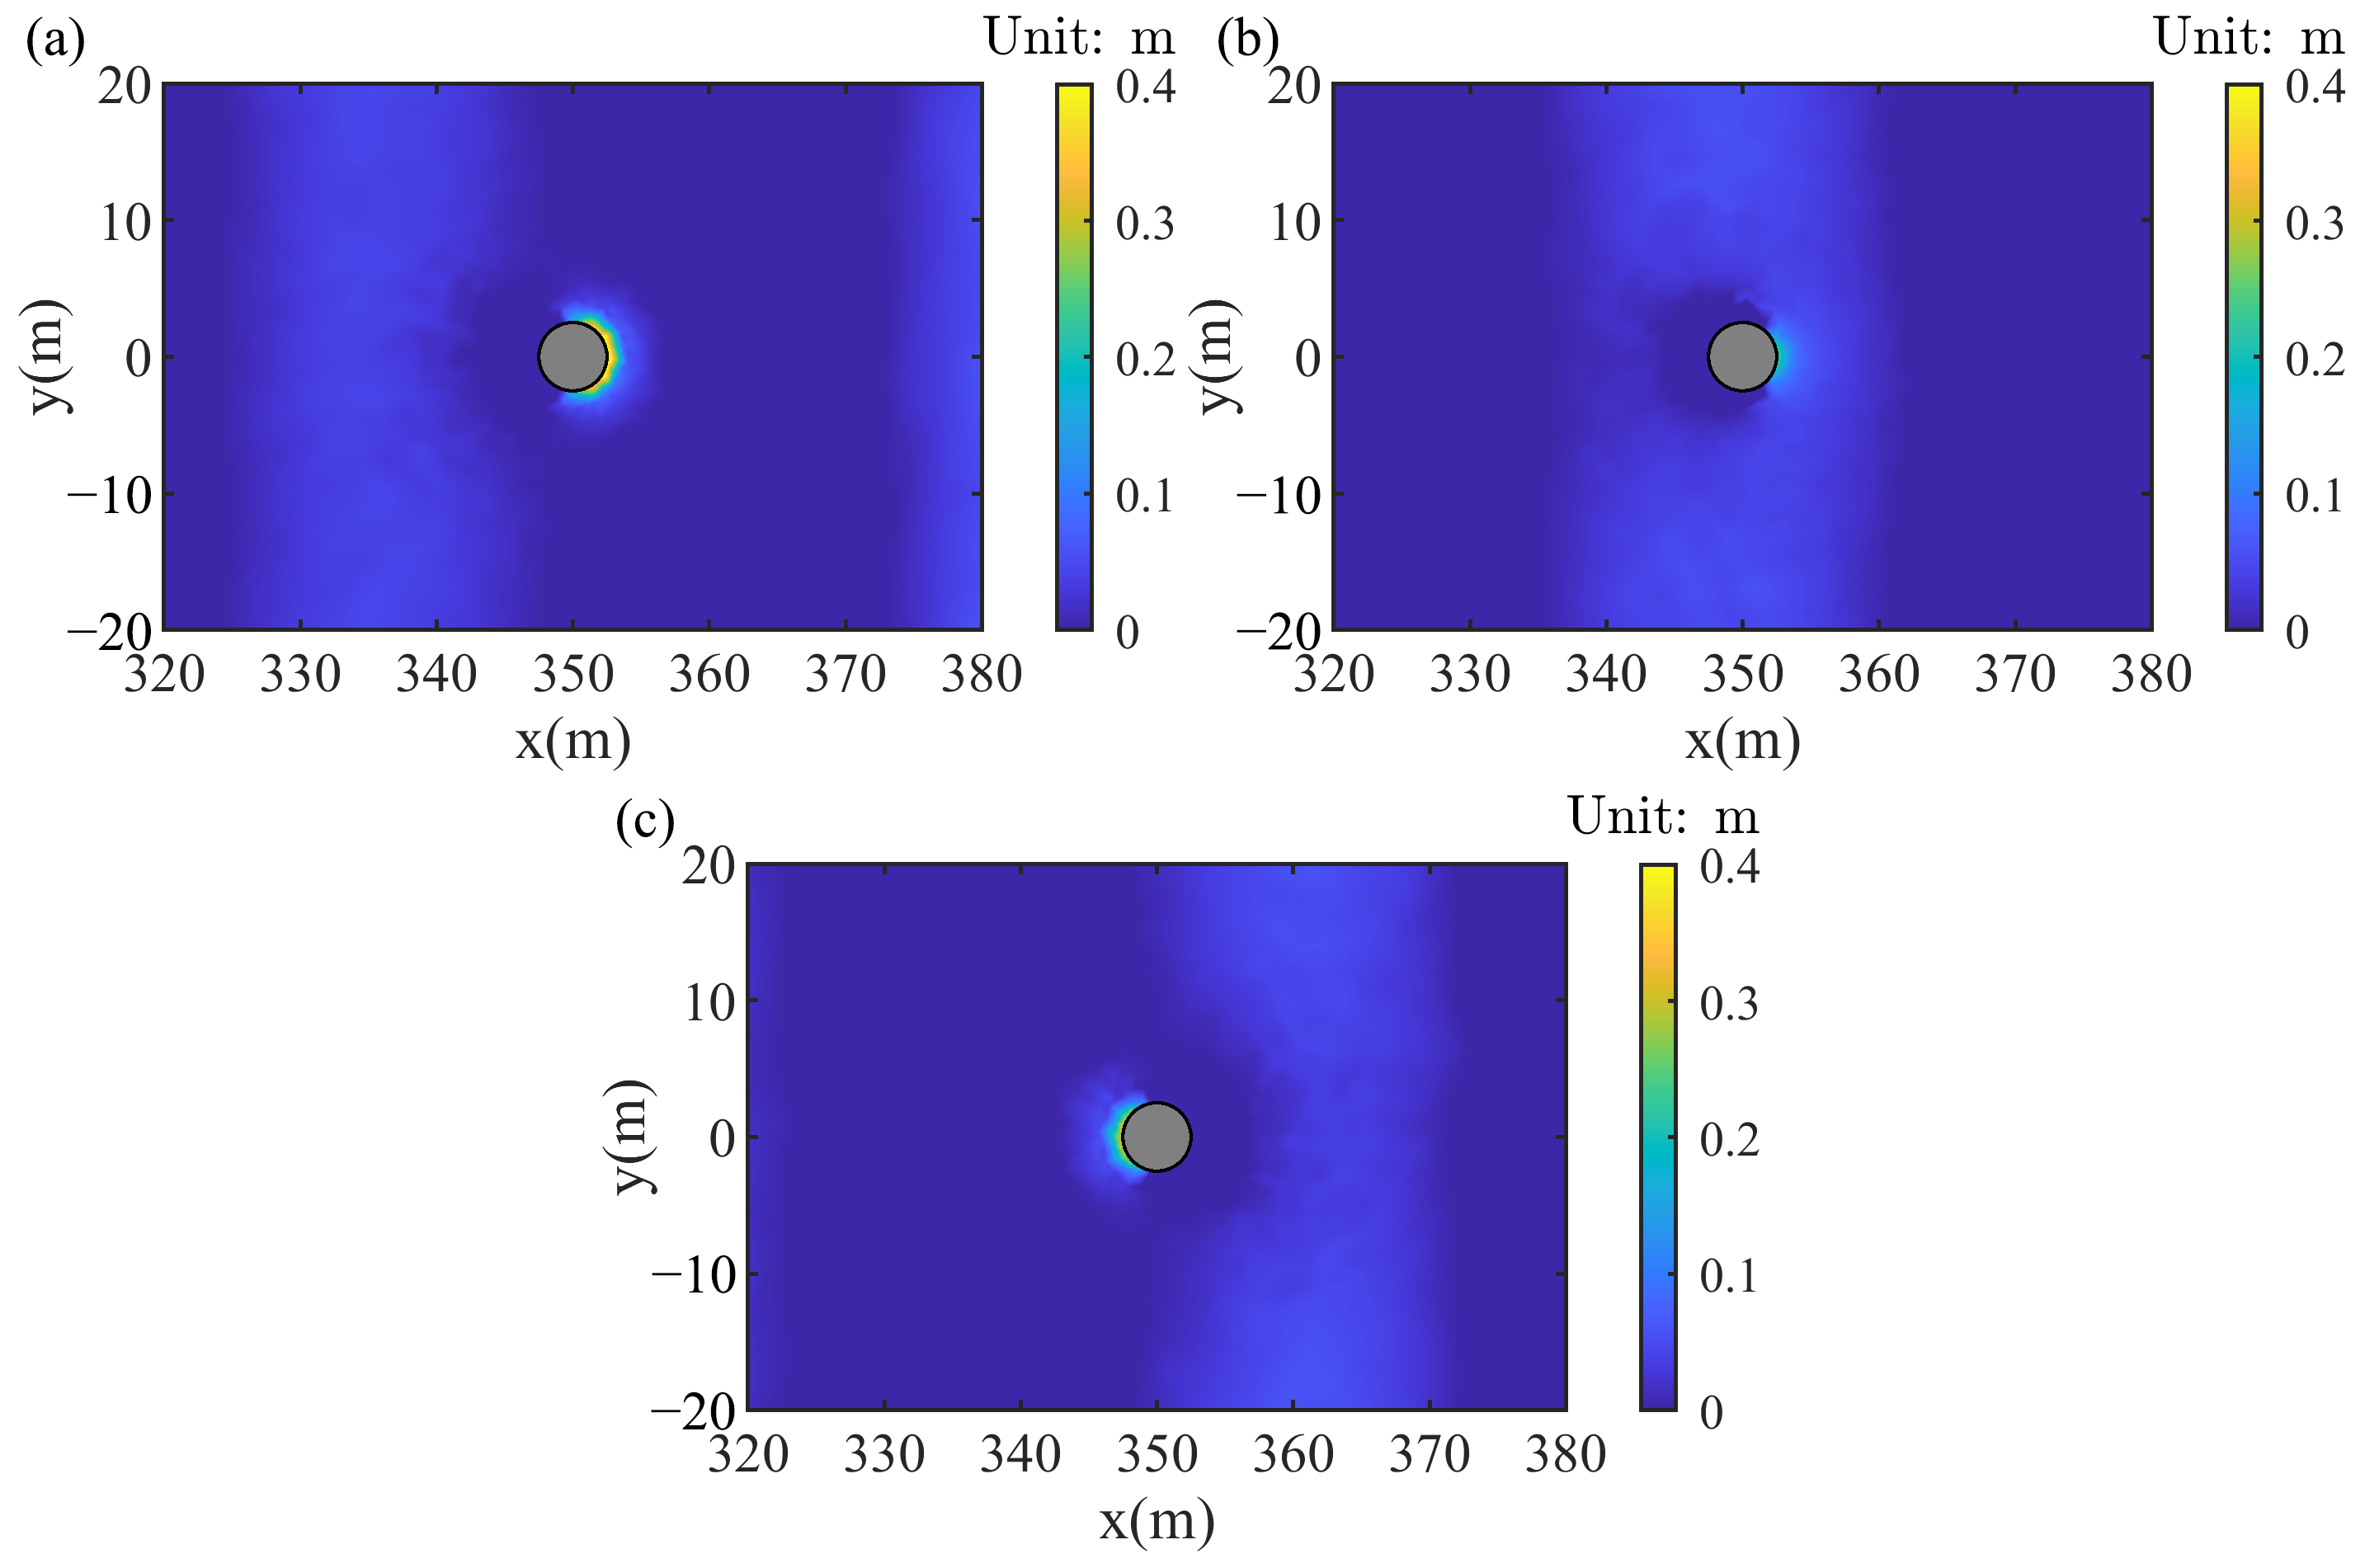
Figure 15 presents the development of transient liquefaction around the pile during a wave cycle. At t = T/8, liquefaction began to occur, with a limited affected area and shallow depth. When wave trough passed through the pile, a notable expansion in the liquefied area occurred, with a increased depth close to 0.4 m (see Figure 15b). This peak response is attributed to the upward seepage forces and pore pressure induced by the negative pressure gradient during the wave trough phase. At t = 3T/8, the liquefaction zone continued to expand slightly but showed reduced intensity, suggesting the beginning of pressure dissipation or stress recovery. The results highlight the critical role of wave phase in governing the transient liquefaction response, with the most severe liquefaction occurring at the wave trough.

4.3. Influence of Slope Gradient

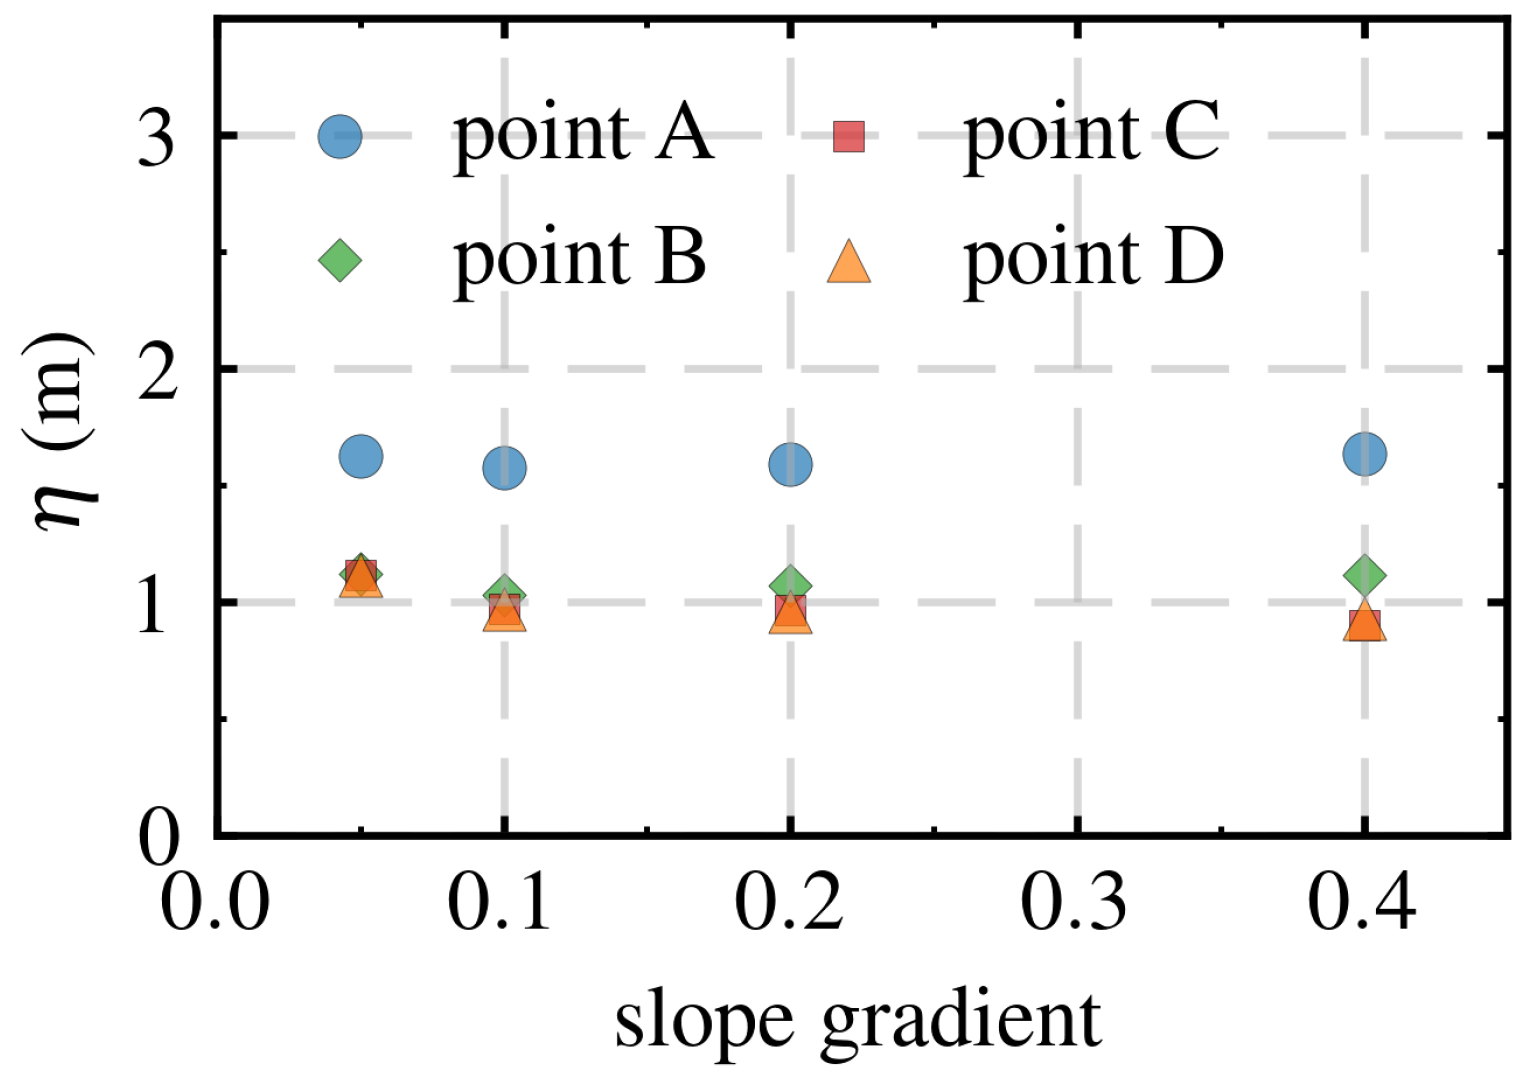
The seabed slope is a critical factor influencing seabed stability, exerting a direct impact on submarine landslides, sediment redistribution, and the safety of subsea infrastructure. Under different slope cases, significant differences were observed in the stress state of seabed soil and the evolution of potential slip surfaces. Therefore, the effect of slope on the distribution of pore pressure and effective stress are explored in this section. To investigate the development patterns of oscillatory pore pressure and effective stress in the seabed around a monopile under the wave and current loadings, Figure 16 illustrates the influence of different slope gradients on the amplitude of the water surface. As shown in the figure, with the increase in the seabed slope, the amplitude of the water surface around the pile initially decreased and then gradually approached a stable value. In addition, it can also be found that the amplitude of the water surface at Point A was much larger than that at the other three locations, and the gap between Point A and the other three locations gradually increased with the increase in the slope. This is primarily attributed to the presence of the pile, which caused the strong reflection of the incident waves on the upstream side. The superposition of the reflected wave and the incident wave may have formed a local standing wave effect, which further amplified the amplitude of the water surface on the upstream side.
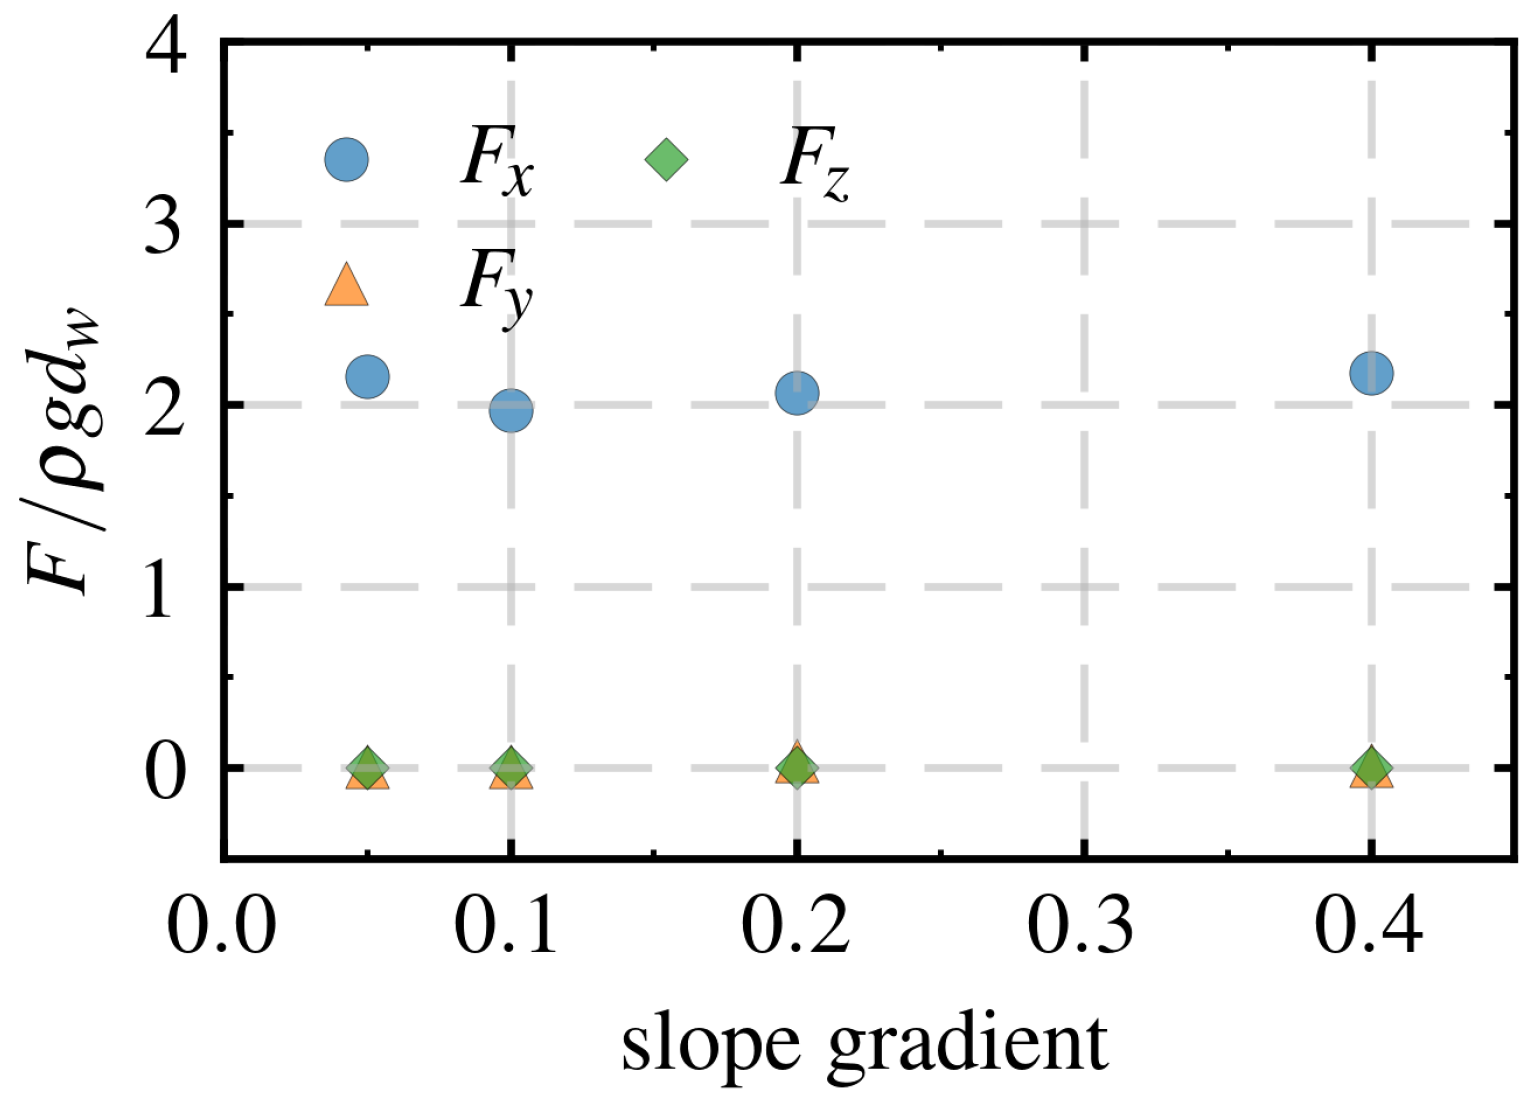
Figure 17 shows the influence of different slope gradients on the wave forces acting on the pile in various directions. It can be seen from the figure that the wave forces acting on the pile were predominantly in the x-direction. The variation in the wave force in the x-direction followed a similar trend to that of the water surface amplitude. Specifically, as the seabed slope increased, the wave force acting on the pile in the x-direction first decreased and then gradually approached a stable value. This is because as the seabed slope increased, the wave propagation was increasingly influenced by the seabed topography, resulting in a dispersion of wave energy and consequent reduction in the x-direction component of the wave force acting on the pile. When the slope gradient reached a certain threshold, the wave propagation pattern and the flow field around the pile tended to stabilize, leading to a diminished variation in the wave force.
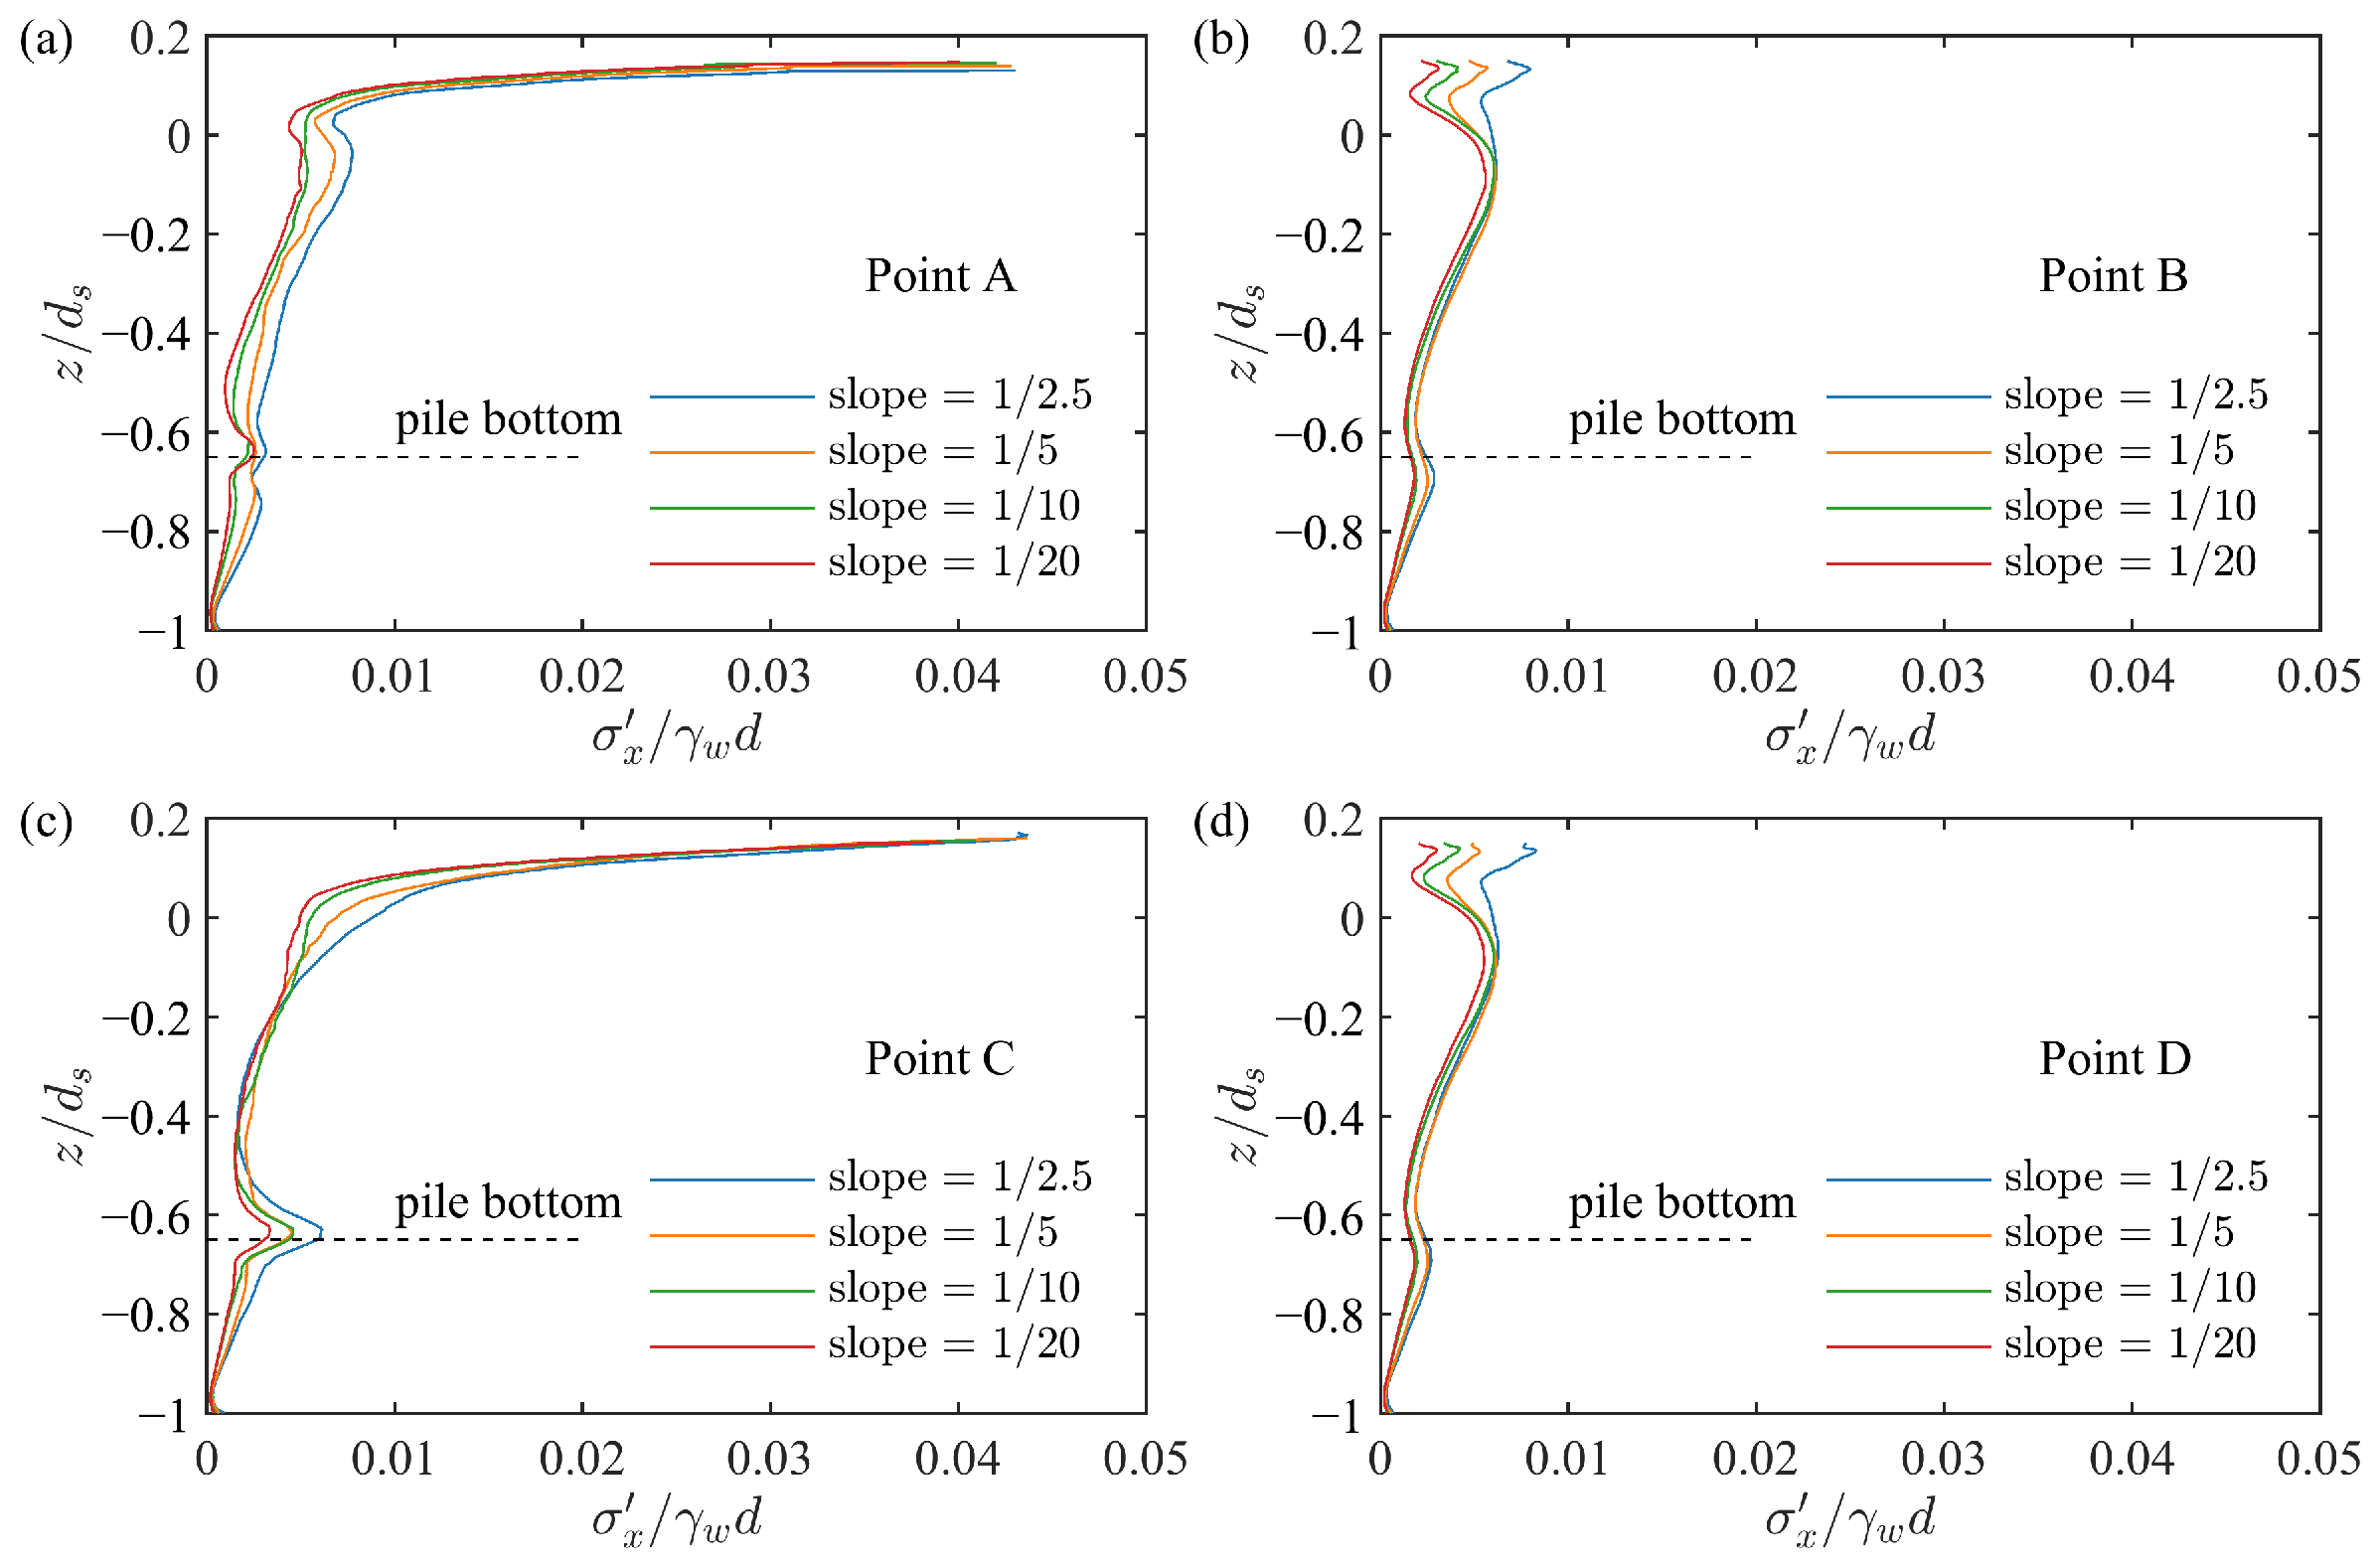
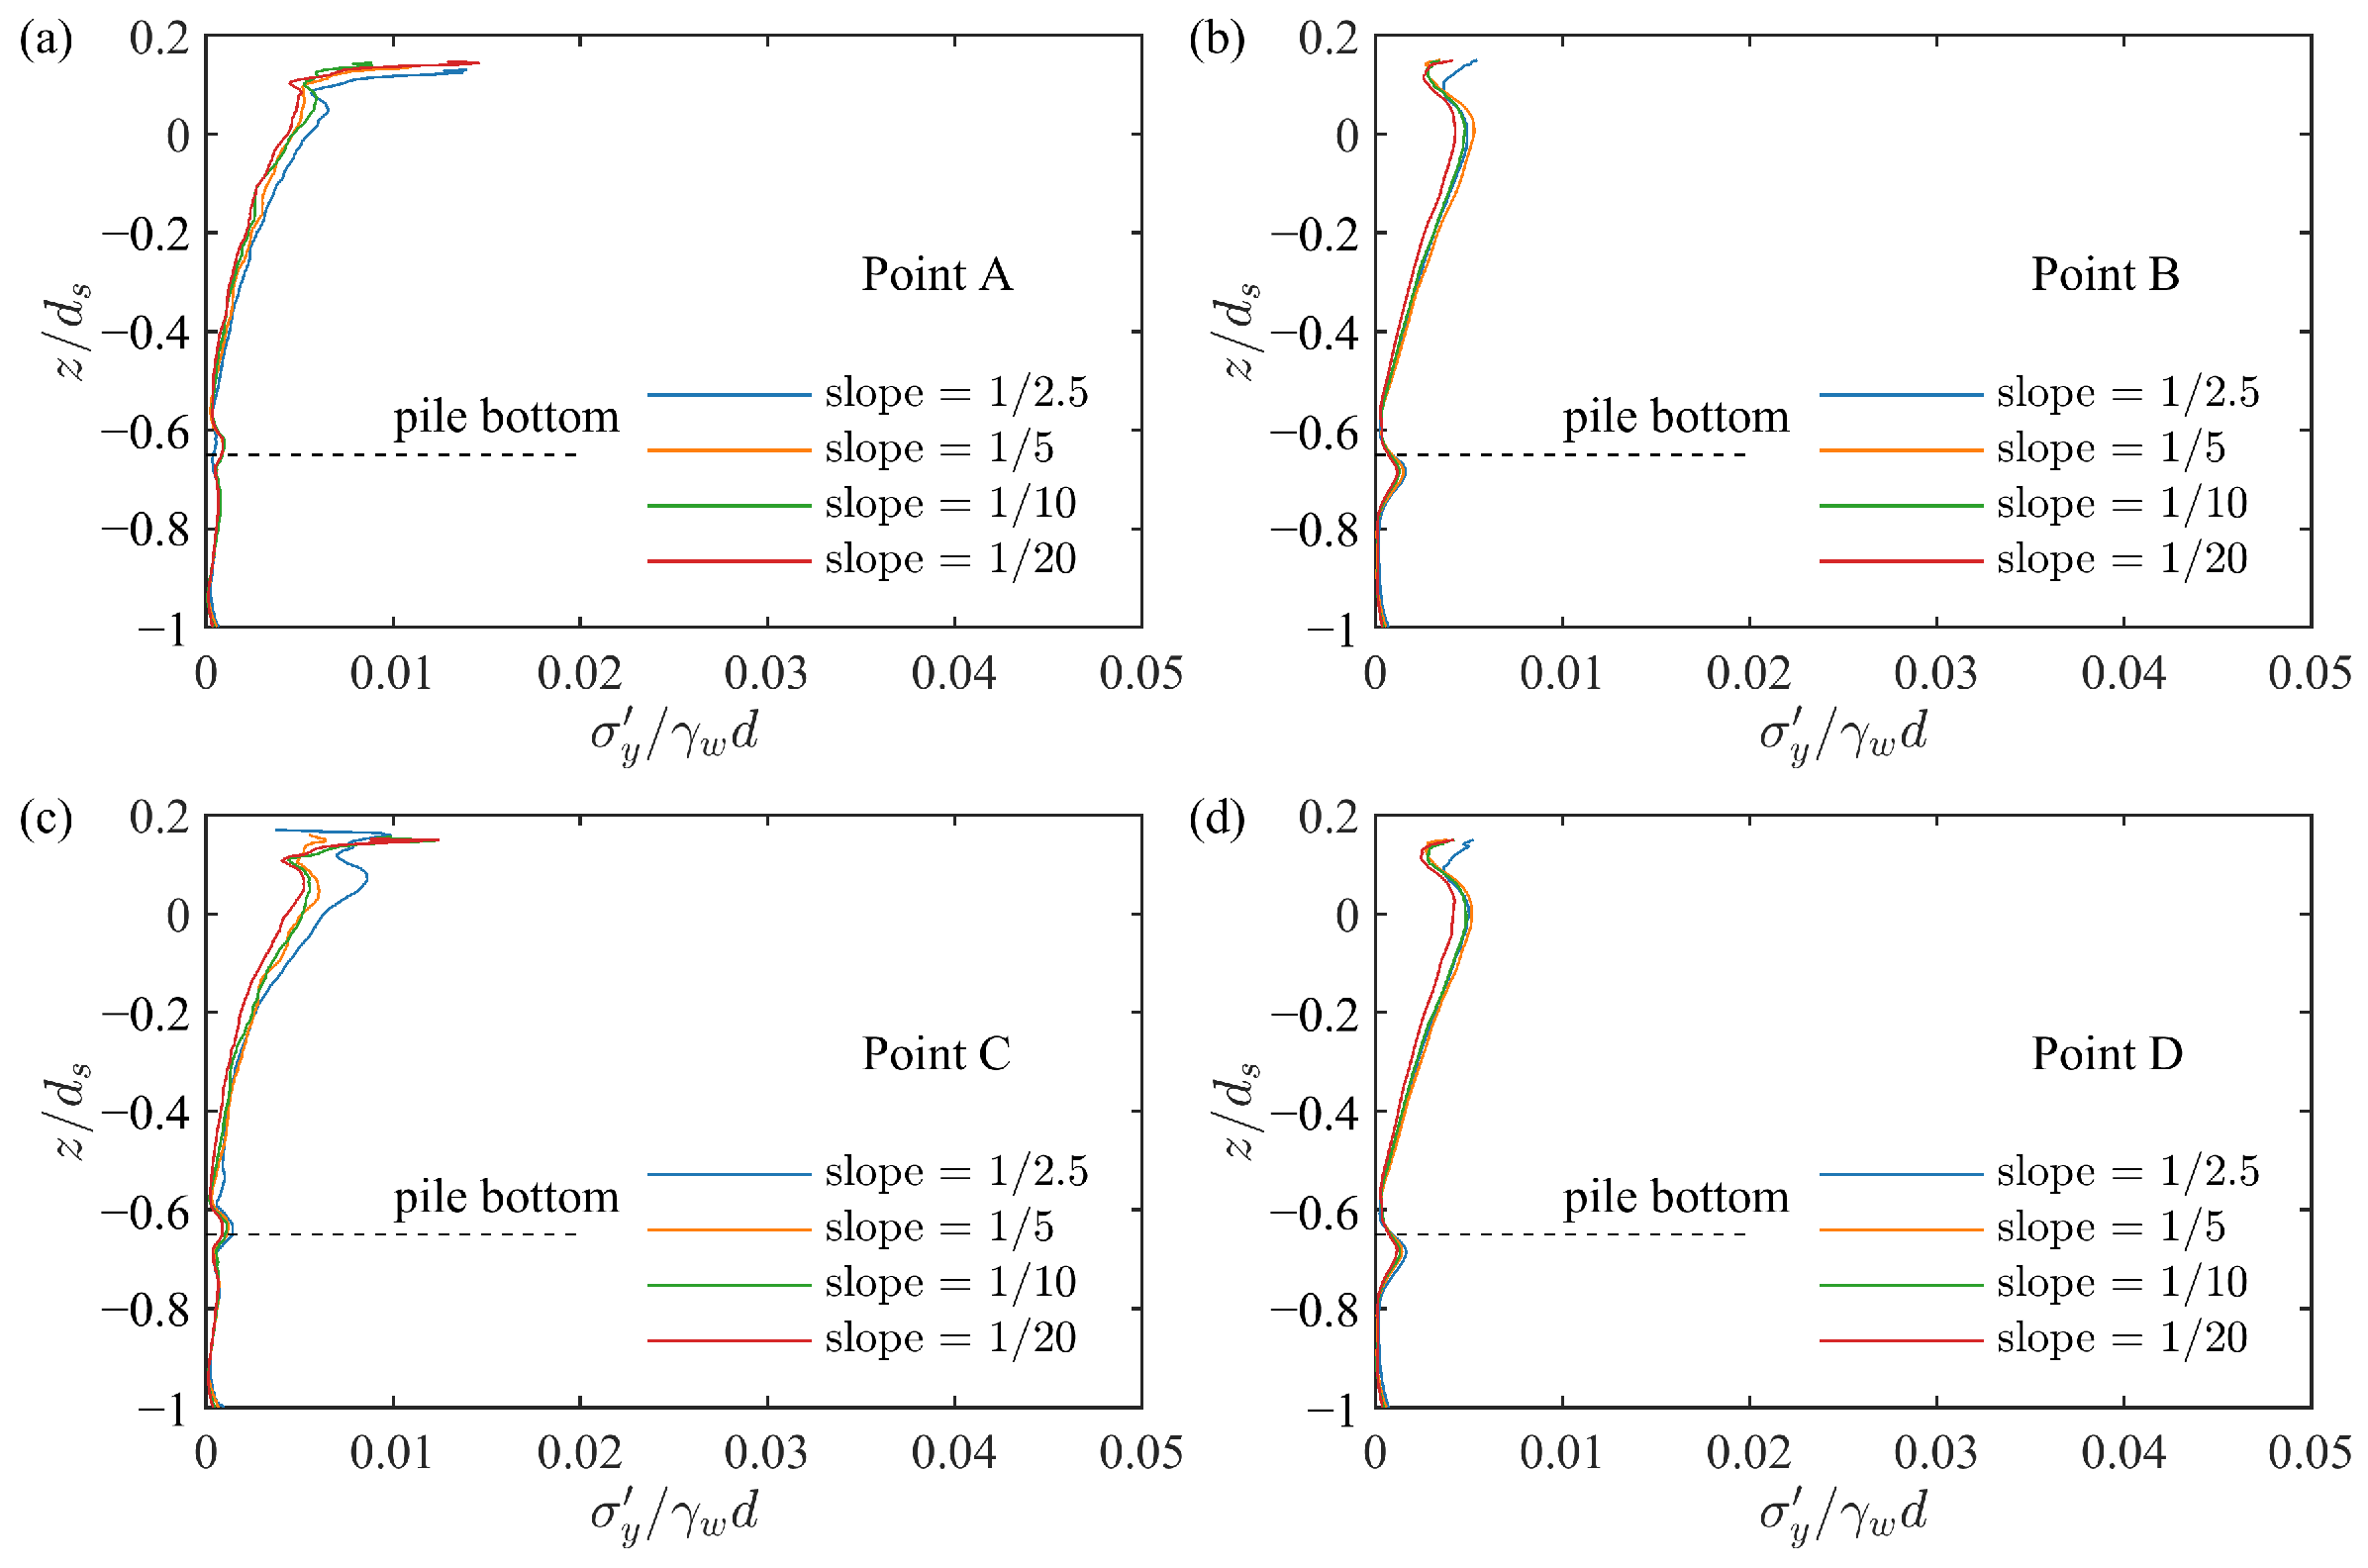
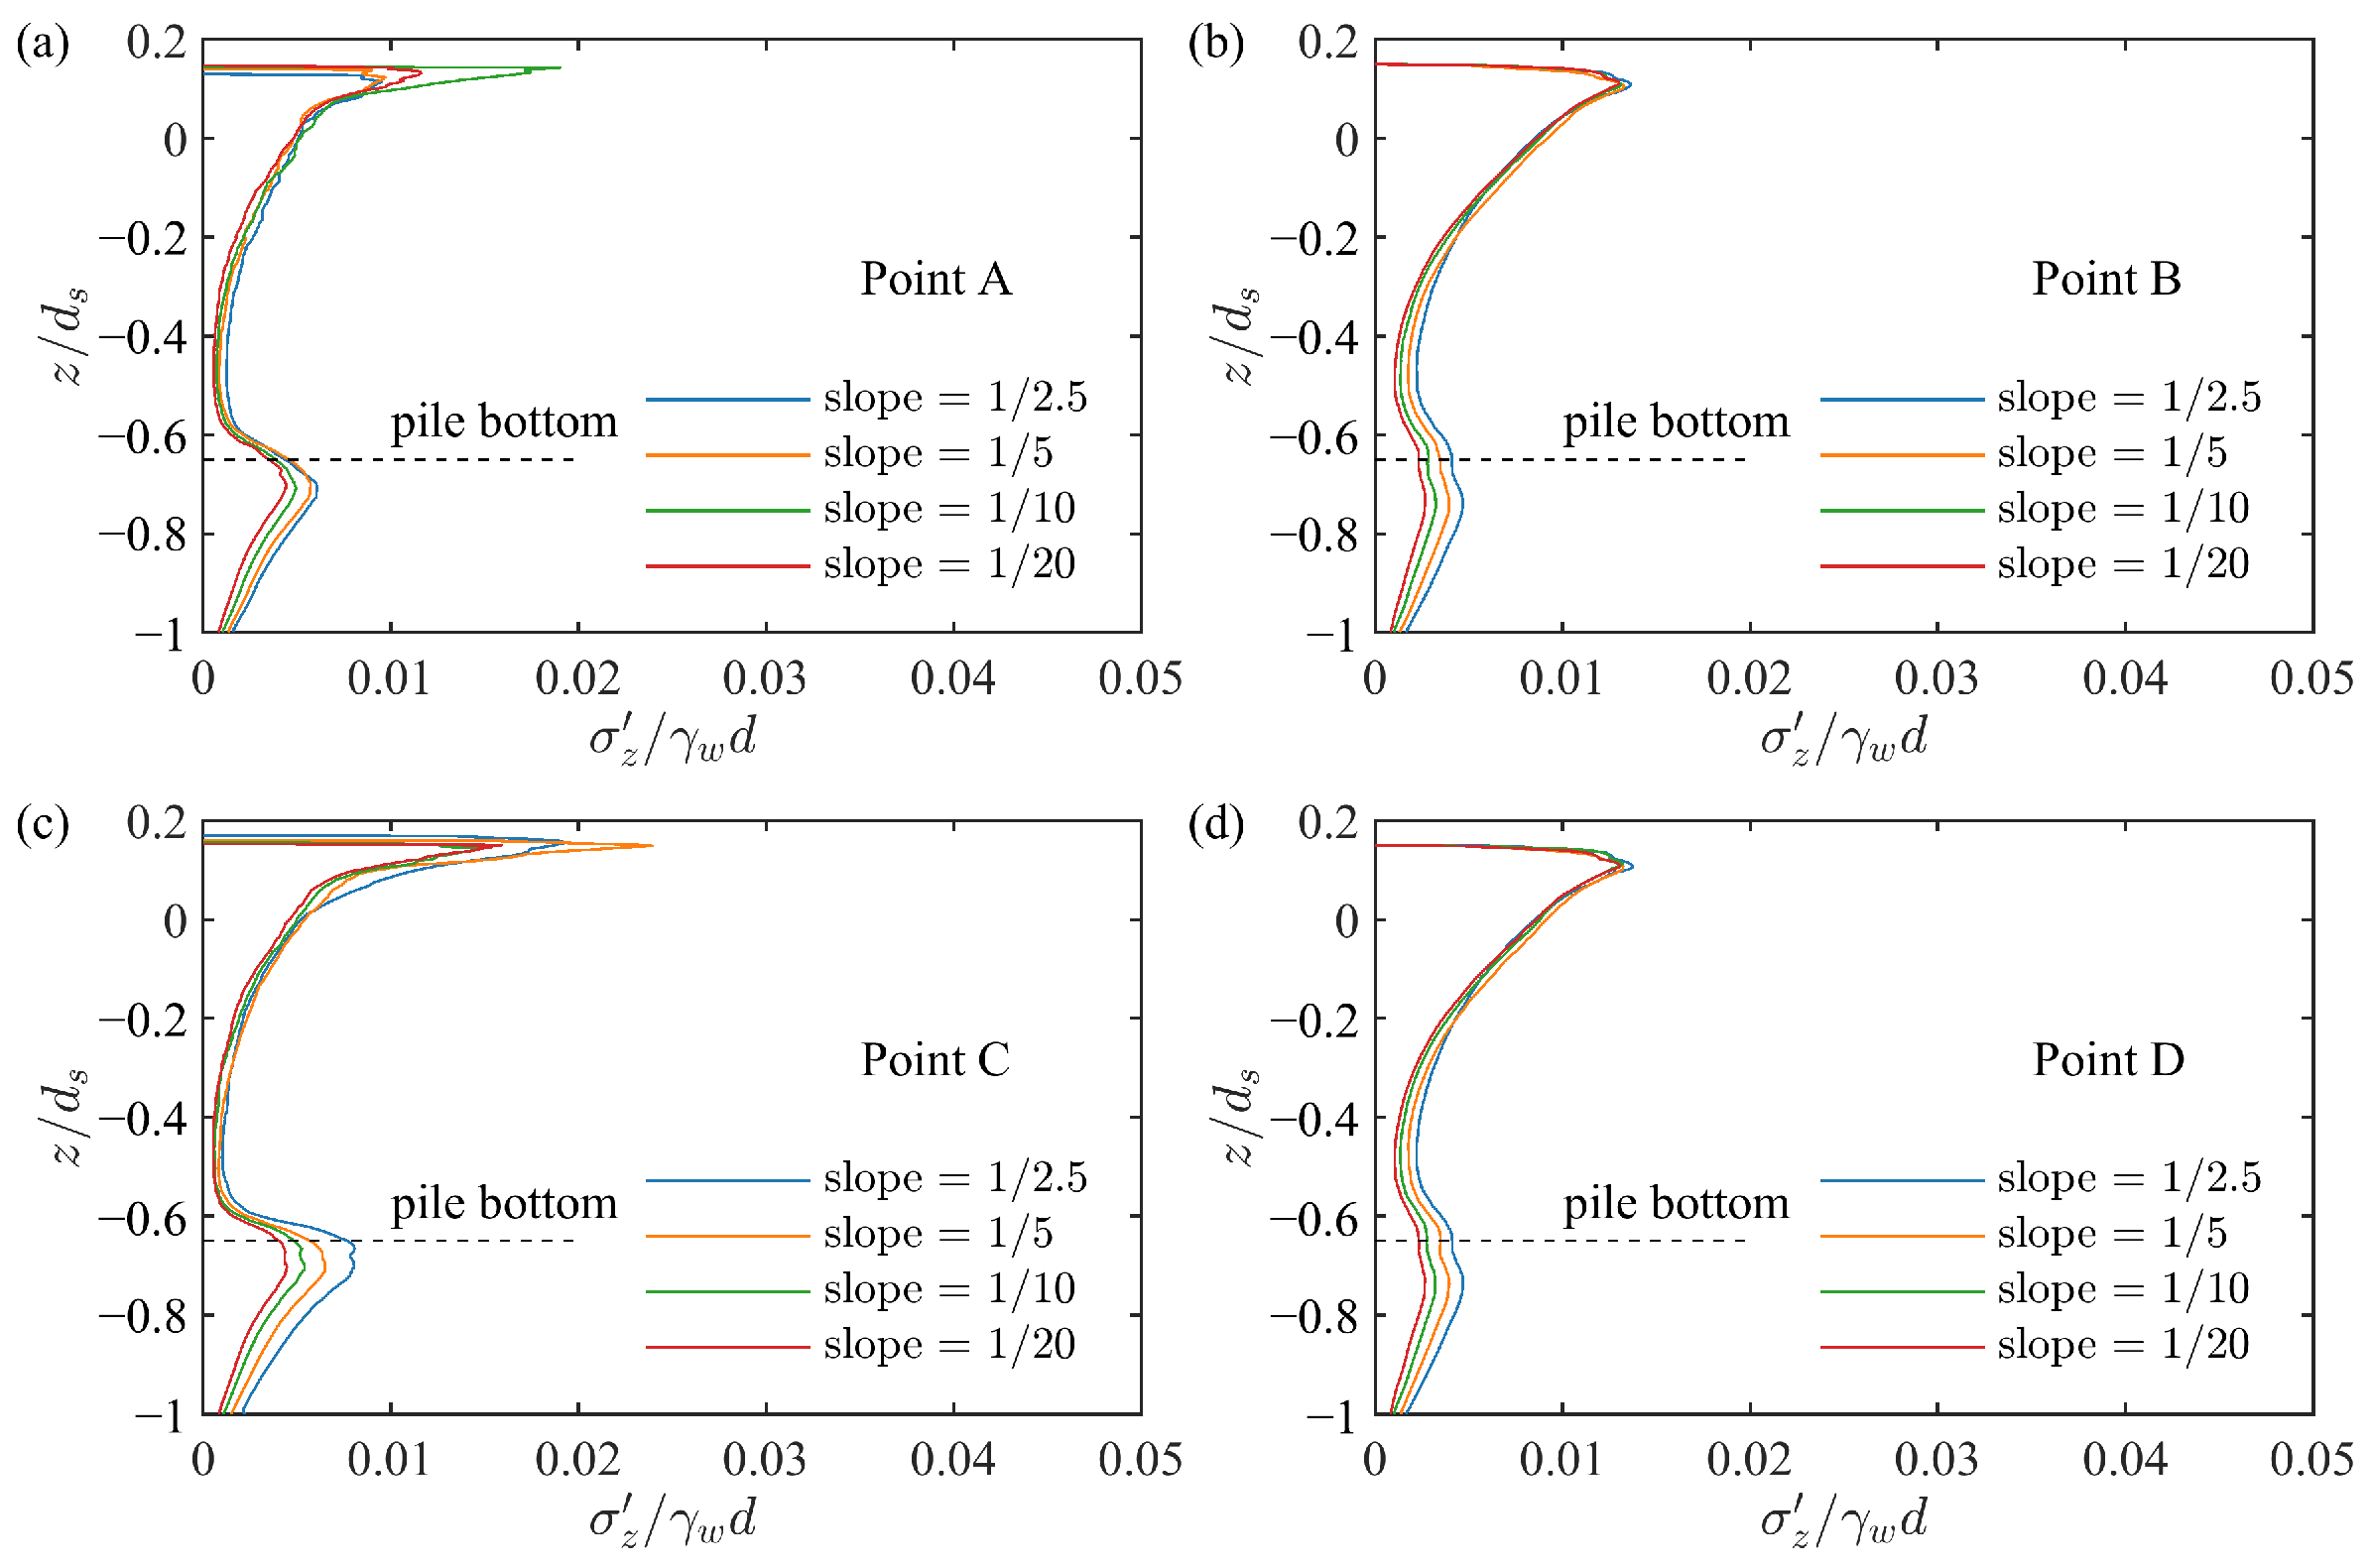
To further investigate the influence of seabed slope on the depth-wise distribution of the oscillatory response of seabed soil, Figure 18, Figure 19 and Figure 20 illustrate the distributions of the maximum effective stresses in three directions at various depths along points A, B, C, and D. It is evident that the distributions of effective stress in both the x- and y-directions exhibited similar trends, increasing with the seabed slope. However, the effective stress values on the sides of the pile were smaller compared to those on the upstream and lee-sides. This is because the upstream of the pile was directly impacted by concentrated wave energy, resulting in higher effective stress. Similarly, flow convergence on the lee-side induced a strong stress response. In contrast, the lateral regions received oblique or diffracted wave energy, resulting in weaker hydrodynamic forcing and reduced effective stress. Another interesting observation is that the effective stress in the z-direction did not exhibit a linear variation with changes in slope (see Figure 20). For example, the effective stress in the z-direction at point A presented a maximum value when the slope was 0.1, while the maximum effective stress at point C occurred when the slope was 0.2. This irregularity arose from the complex interplay between wave reflection, local standing wave formation, and slope-induced wave refraction, which altered the vertical load transfer at different locations. Such localized energy concentration may have amplified downward pressure at specific slopes, leading to position-dependent peak responses. These observations underscore the non-uniform impact of seabed inclination on the effective stress field around monopiles. From a design perspective, they highlight the need to account for localized peak stresses when evaluating bearing capacity and potential failure zones under oscillatory loading. The findings also contribute to refining current theories on seabed–structure interaction, particularly in environments with variable bathymetric features.
Figure 21 shows the vertical distributions of the pore pressure along the seabed depth. It can be seen from the figure that the decreasing rate of pore pressure in seabed depth around the pile decreased with the increase in seabed slope. Moreover, the pore pressure at the seabed surface remained relatively constant regardless of the slope angle. This is because the surface of the seabed slope had better drainage conditions. With the increase in slope, pore water could be discharged more quickly along the slope or sideways so that the pore pressure at the surface of sloping seabed was maintained at a relatively stable level. These results highlight the dual effect of seabed slope. While a steeper slope enhances surface drainage, it can simultaneously hinder vertical pore pressure dissipation in deeper layers. This condition may result in the accumulation of excess pore water pressure and increase the potential for seabed instability. From an engineering perspective, these findings are critical for evaluating liquefaction risks and for designing effective drainage or stabilization solutions in sloped seabed environments.
Figure 22 illustrates the transient liquefaction depth around a pile foundation under combined wave–current action for different seabed slopes. The results show a clear trend that as the seabed slope increased, both the magnitude and extent of liquefaction increased significantly. In the case of a steep slope (slope = 1/2.5), the maximum liquefaction depth exceeded 0.8 m and was concentrated on the right side of the pile. Conversely, for mild slopes such as 1/20, the liquefaction depth was minimal, indicating a lower potential for instability. This highlights the critical role of seabed slope in amplifying the effects of wave-induced pore pressure and the associated risk of seabed liquefaction near offshore structures.

4.4. Influence of Wave Height

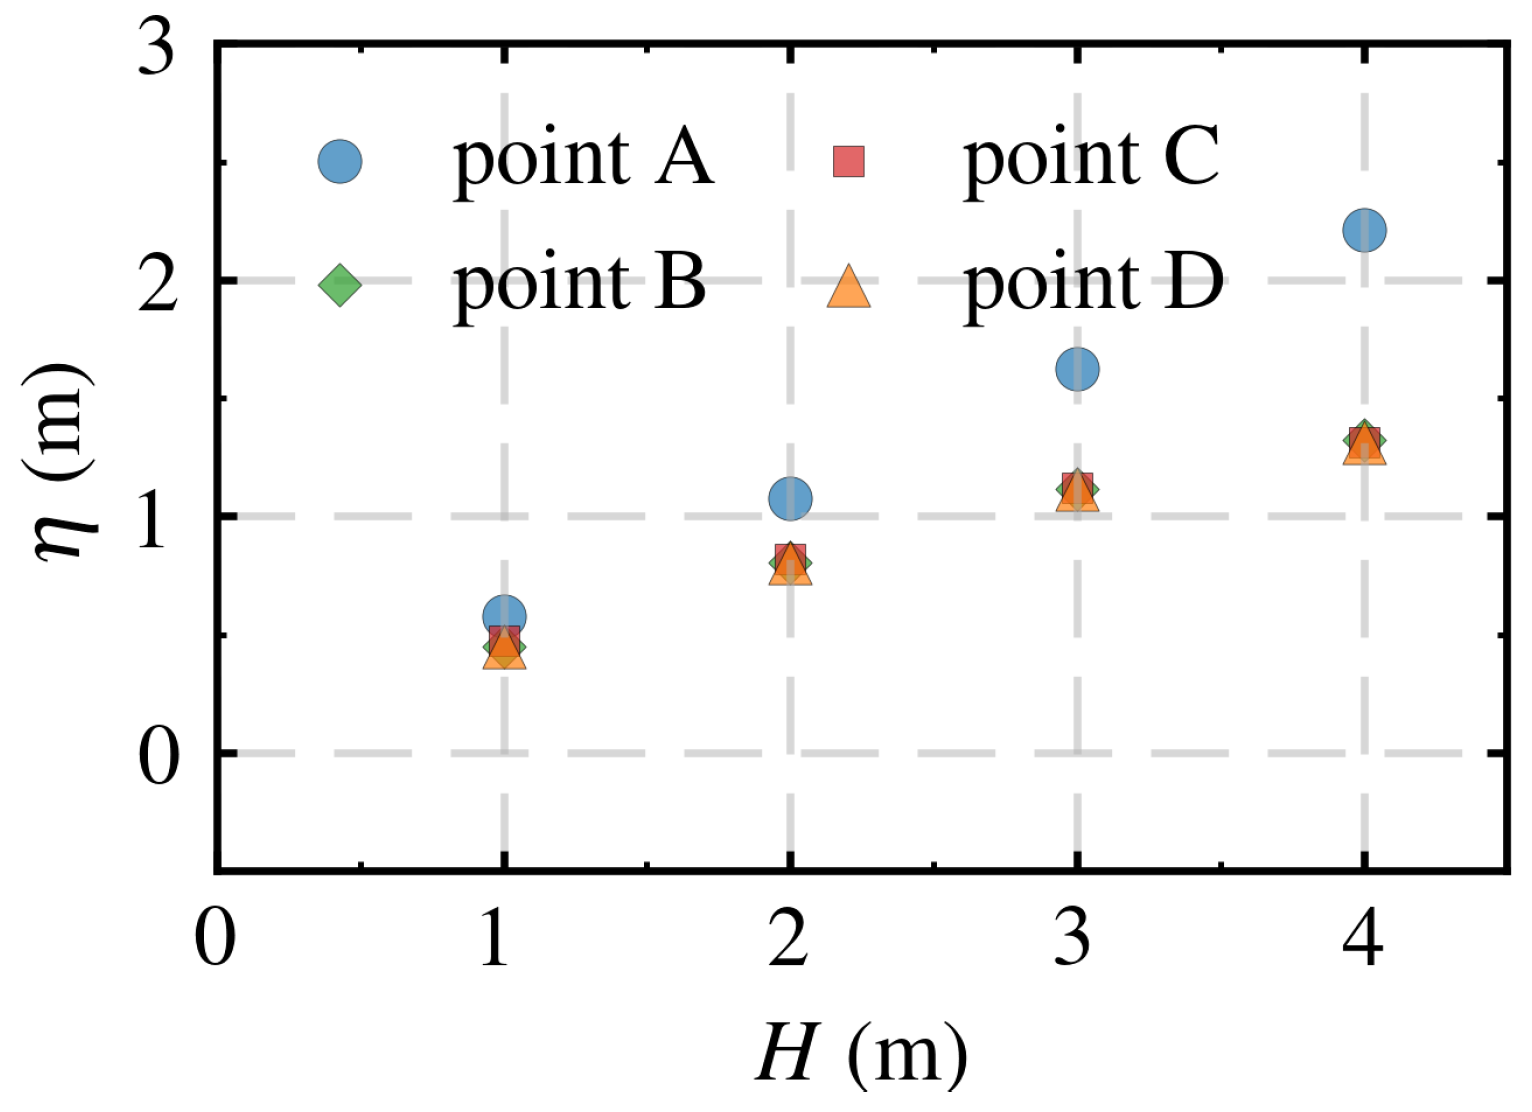
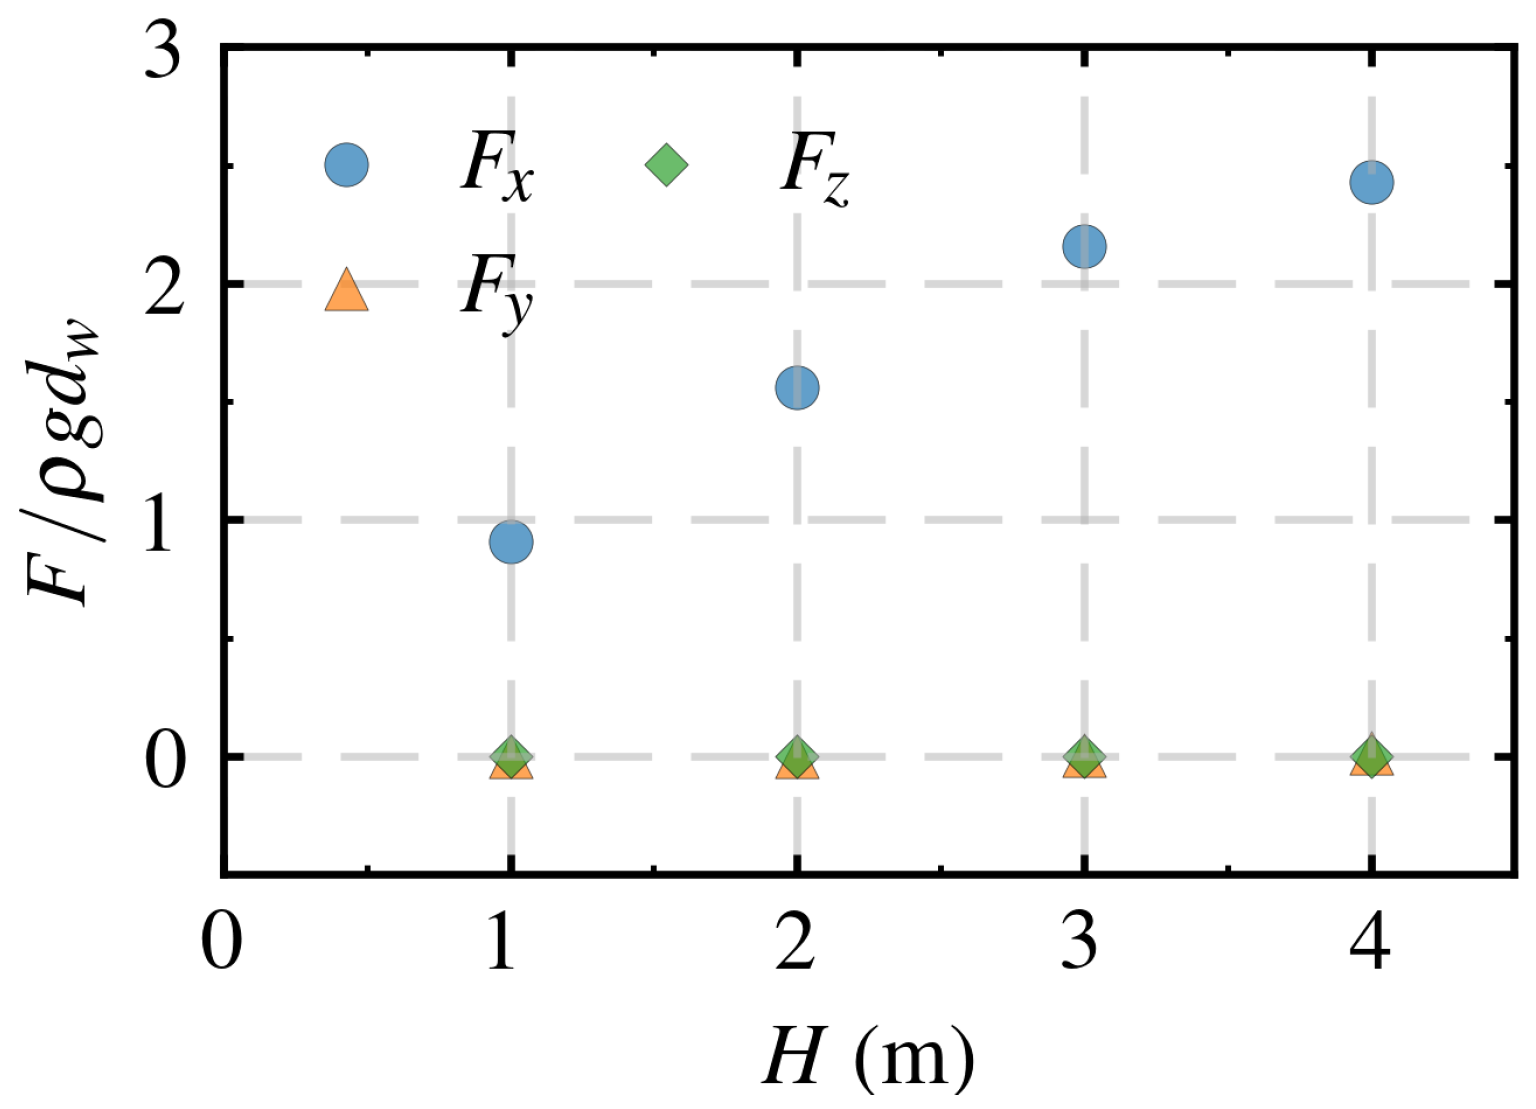
As one of the three primary wave parameters, wave height directly influenced the wave loading exerted on the seabed surface. Therefore, this section first investigates the effect of wave height on the water surface amplitude (see Figure 23). It can be observed that the water surface amplitude at the sides and lee-side of the pile exhibited a slower growth rate with increasing wave height compared to that observed on the upstream side. This phenomenon is primarily attributed to the attenuation and redistribution of wave energy around the pile. In addition, the influence of wave height on the wave forces acting on the pile is also investigated in this section (see Figure 24). It is clearly observed that the wave force in the x-direction increased continuously with the rise in wave height.
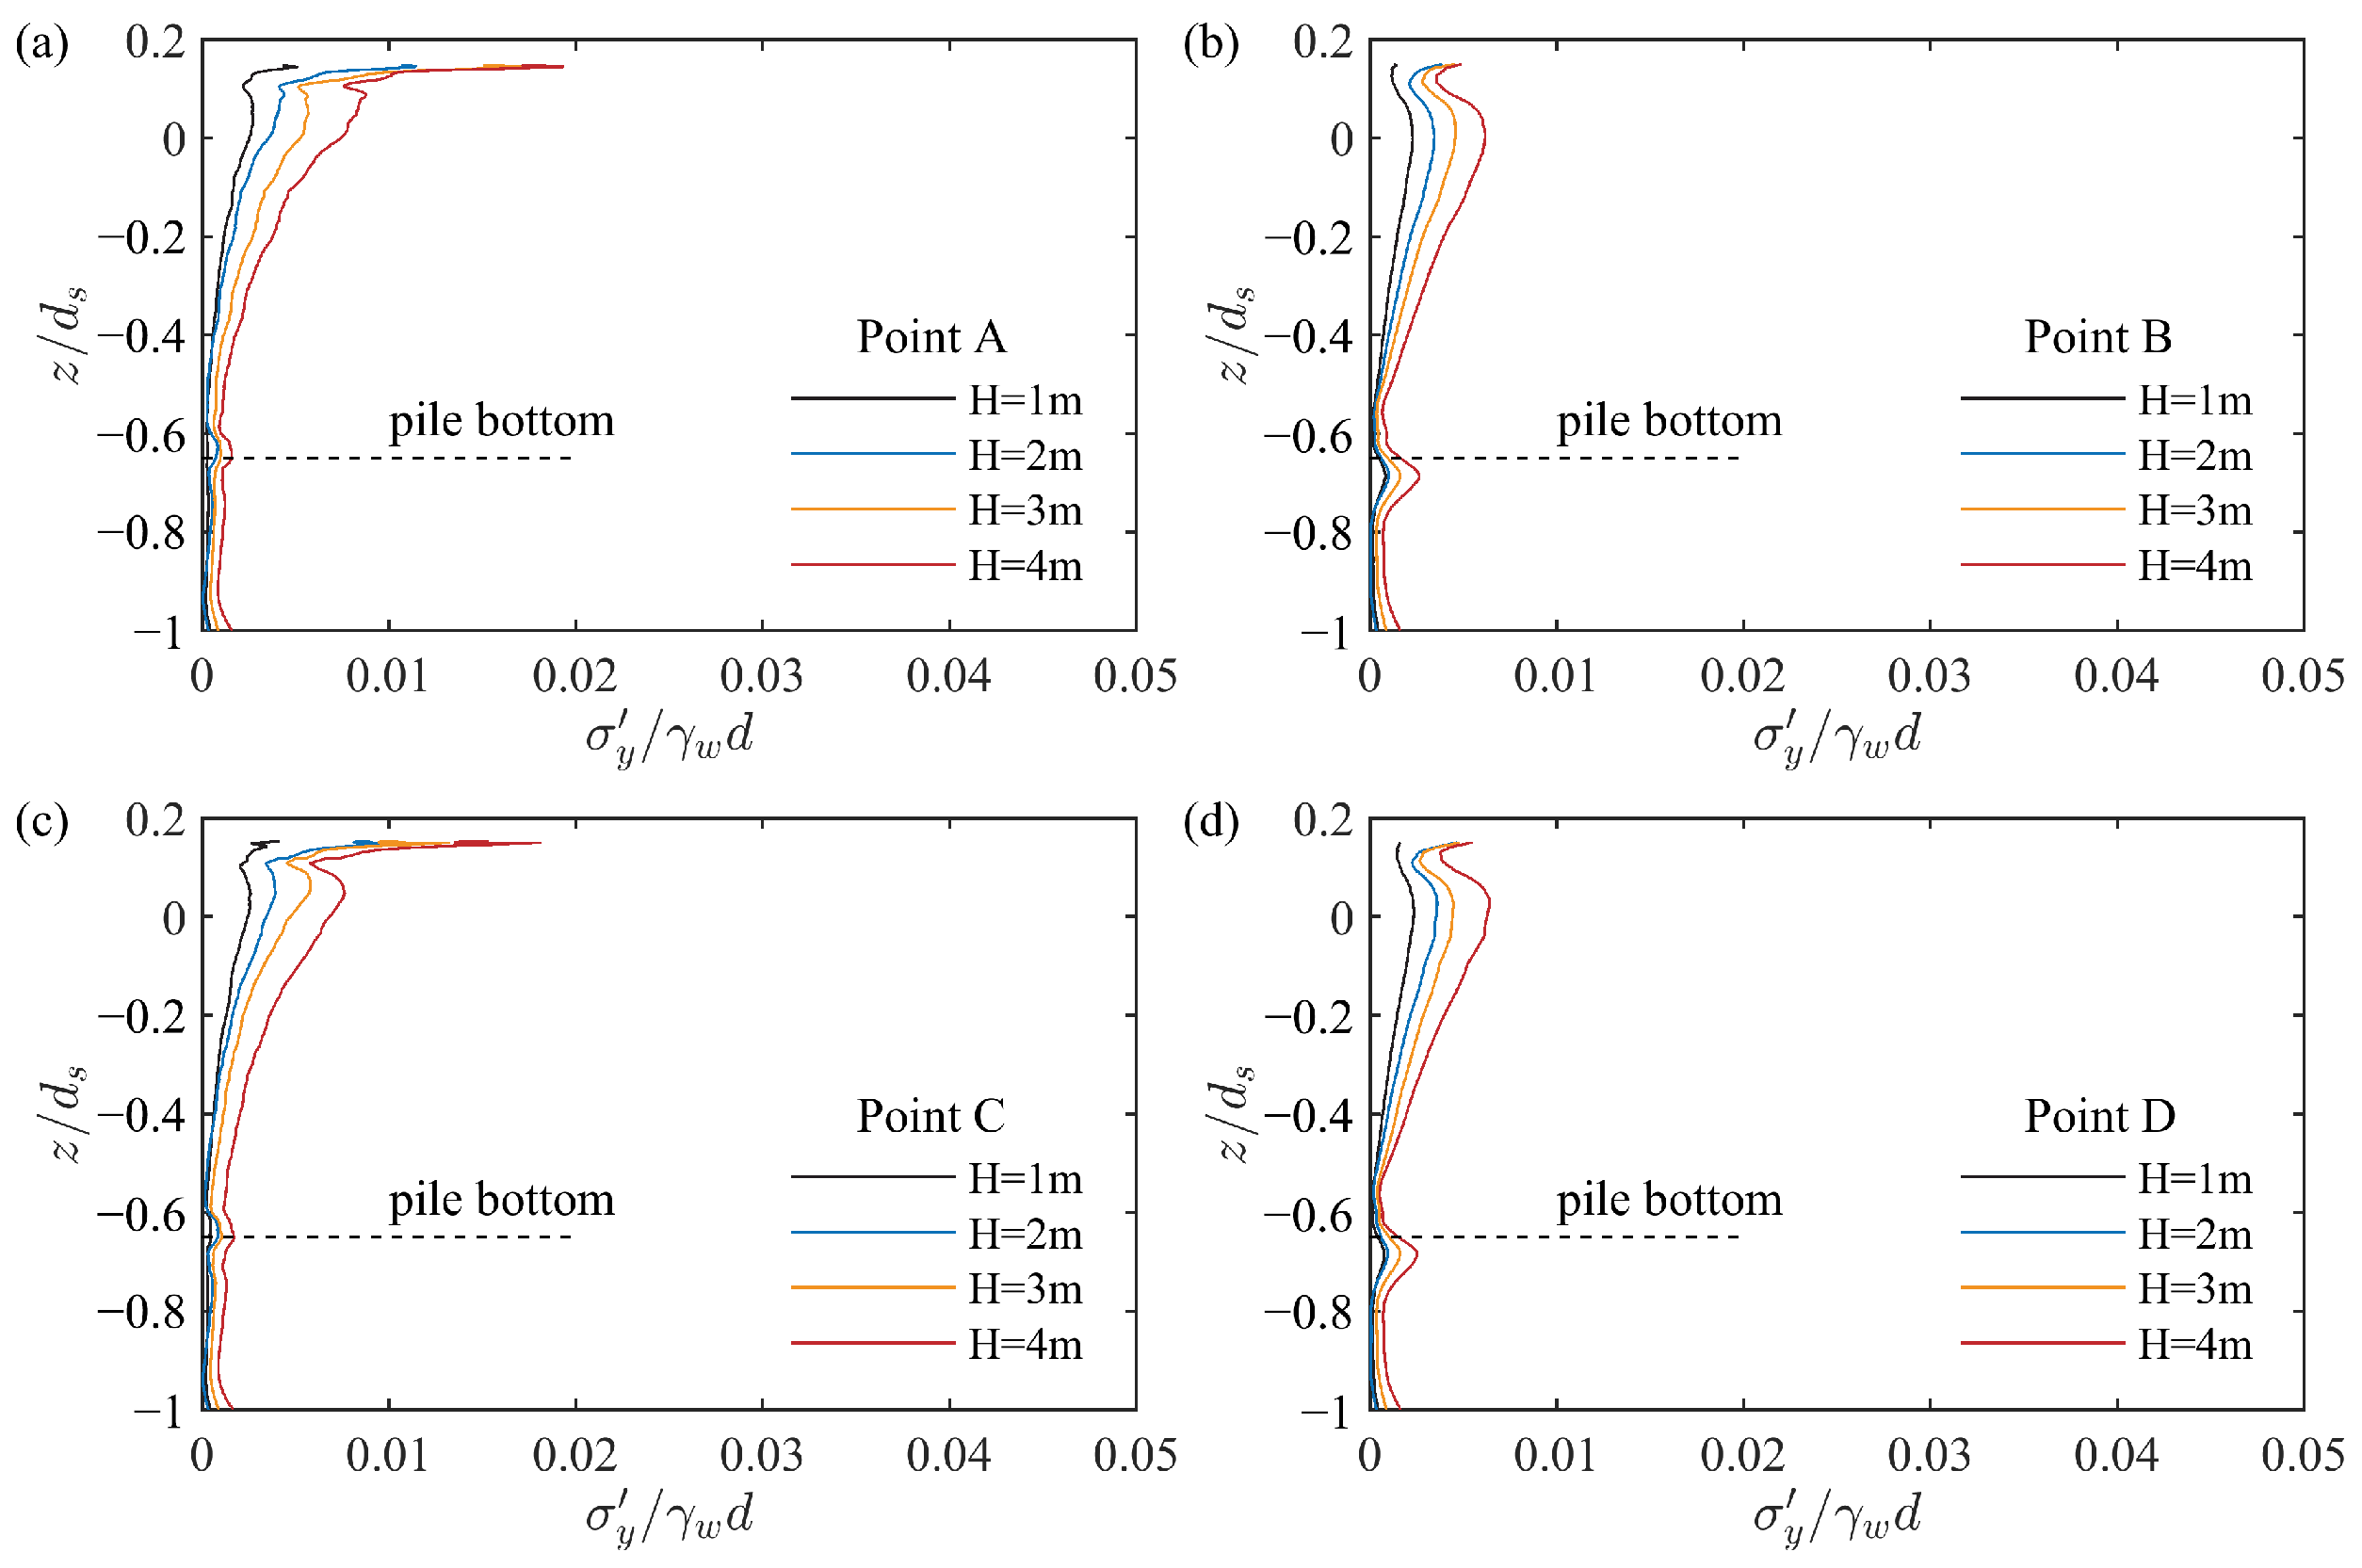
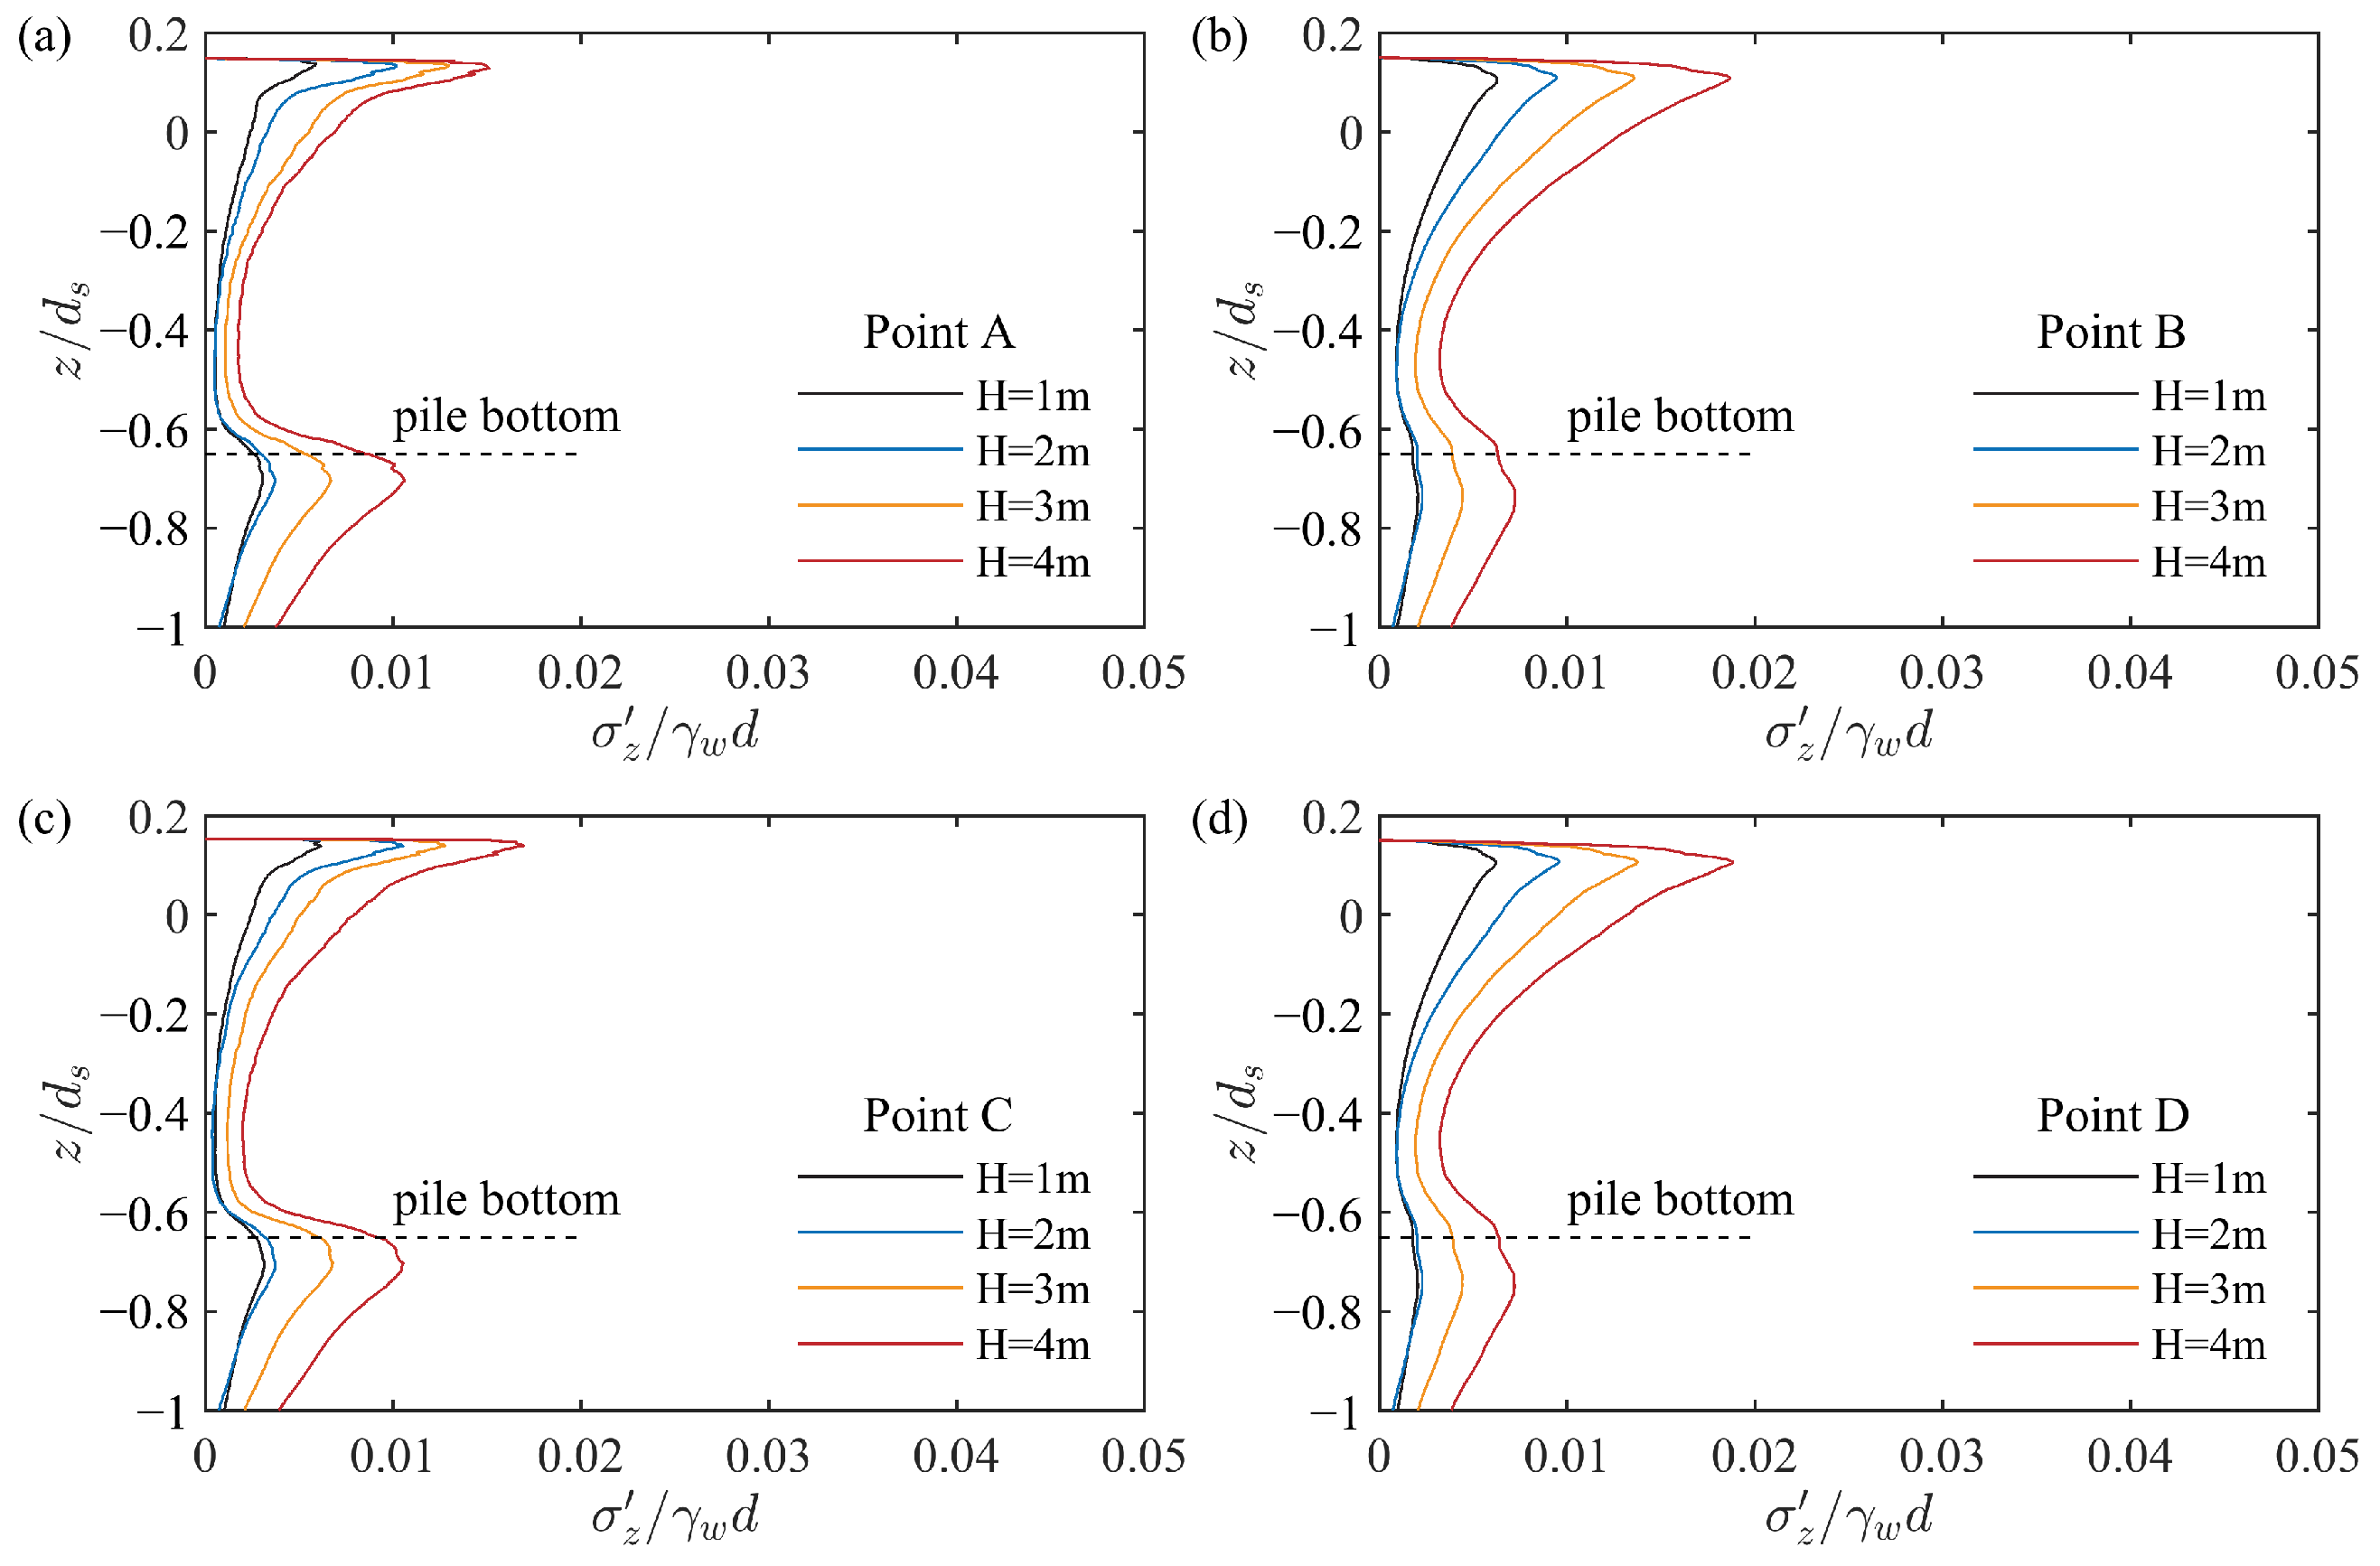
Figure 25, Figure 26 and Figure 27 present the vertical distributions of effective stress in three directions under different wave heights. Among the three directions, wave height had the strongest effect on z-direction effective stress and the weakest on x-direction. Taking the x-direction effective stress at point D as an example, Figure 25d shows that the effective stress curves for wave heights of 3 m and 4 m almost overlap. In contrast, the z-direction effective stress at the same location shows a noticeable gap between the two curves. Later, the effect of wave height on the vertical distribution of pore pressure is studied in this section (see Figure 28). Similarly, the pore pressure increased with the increase in wave height. A relatively small difference was observed between wave heights of 1 m and 2 m, while a substantial increase in pore pressure occurred when the wave height was 3 m. These results demonstrate that wave-induced vertical loading plays a dominant role in governing both effective stress and pore pressure within seabeds. The heightened sensitivity of vertical stress and pore pressure to wave height implies a greater risk of soil instability or liquefaction under extreme wave conditions. From a geotechnical design perspective, this highlights the necessity of incorporating wave loading intensity when assessing seabed response and structural safety in offshore environments.
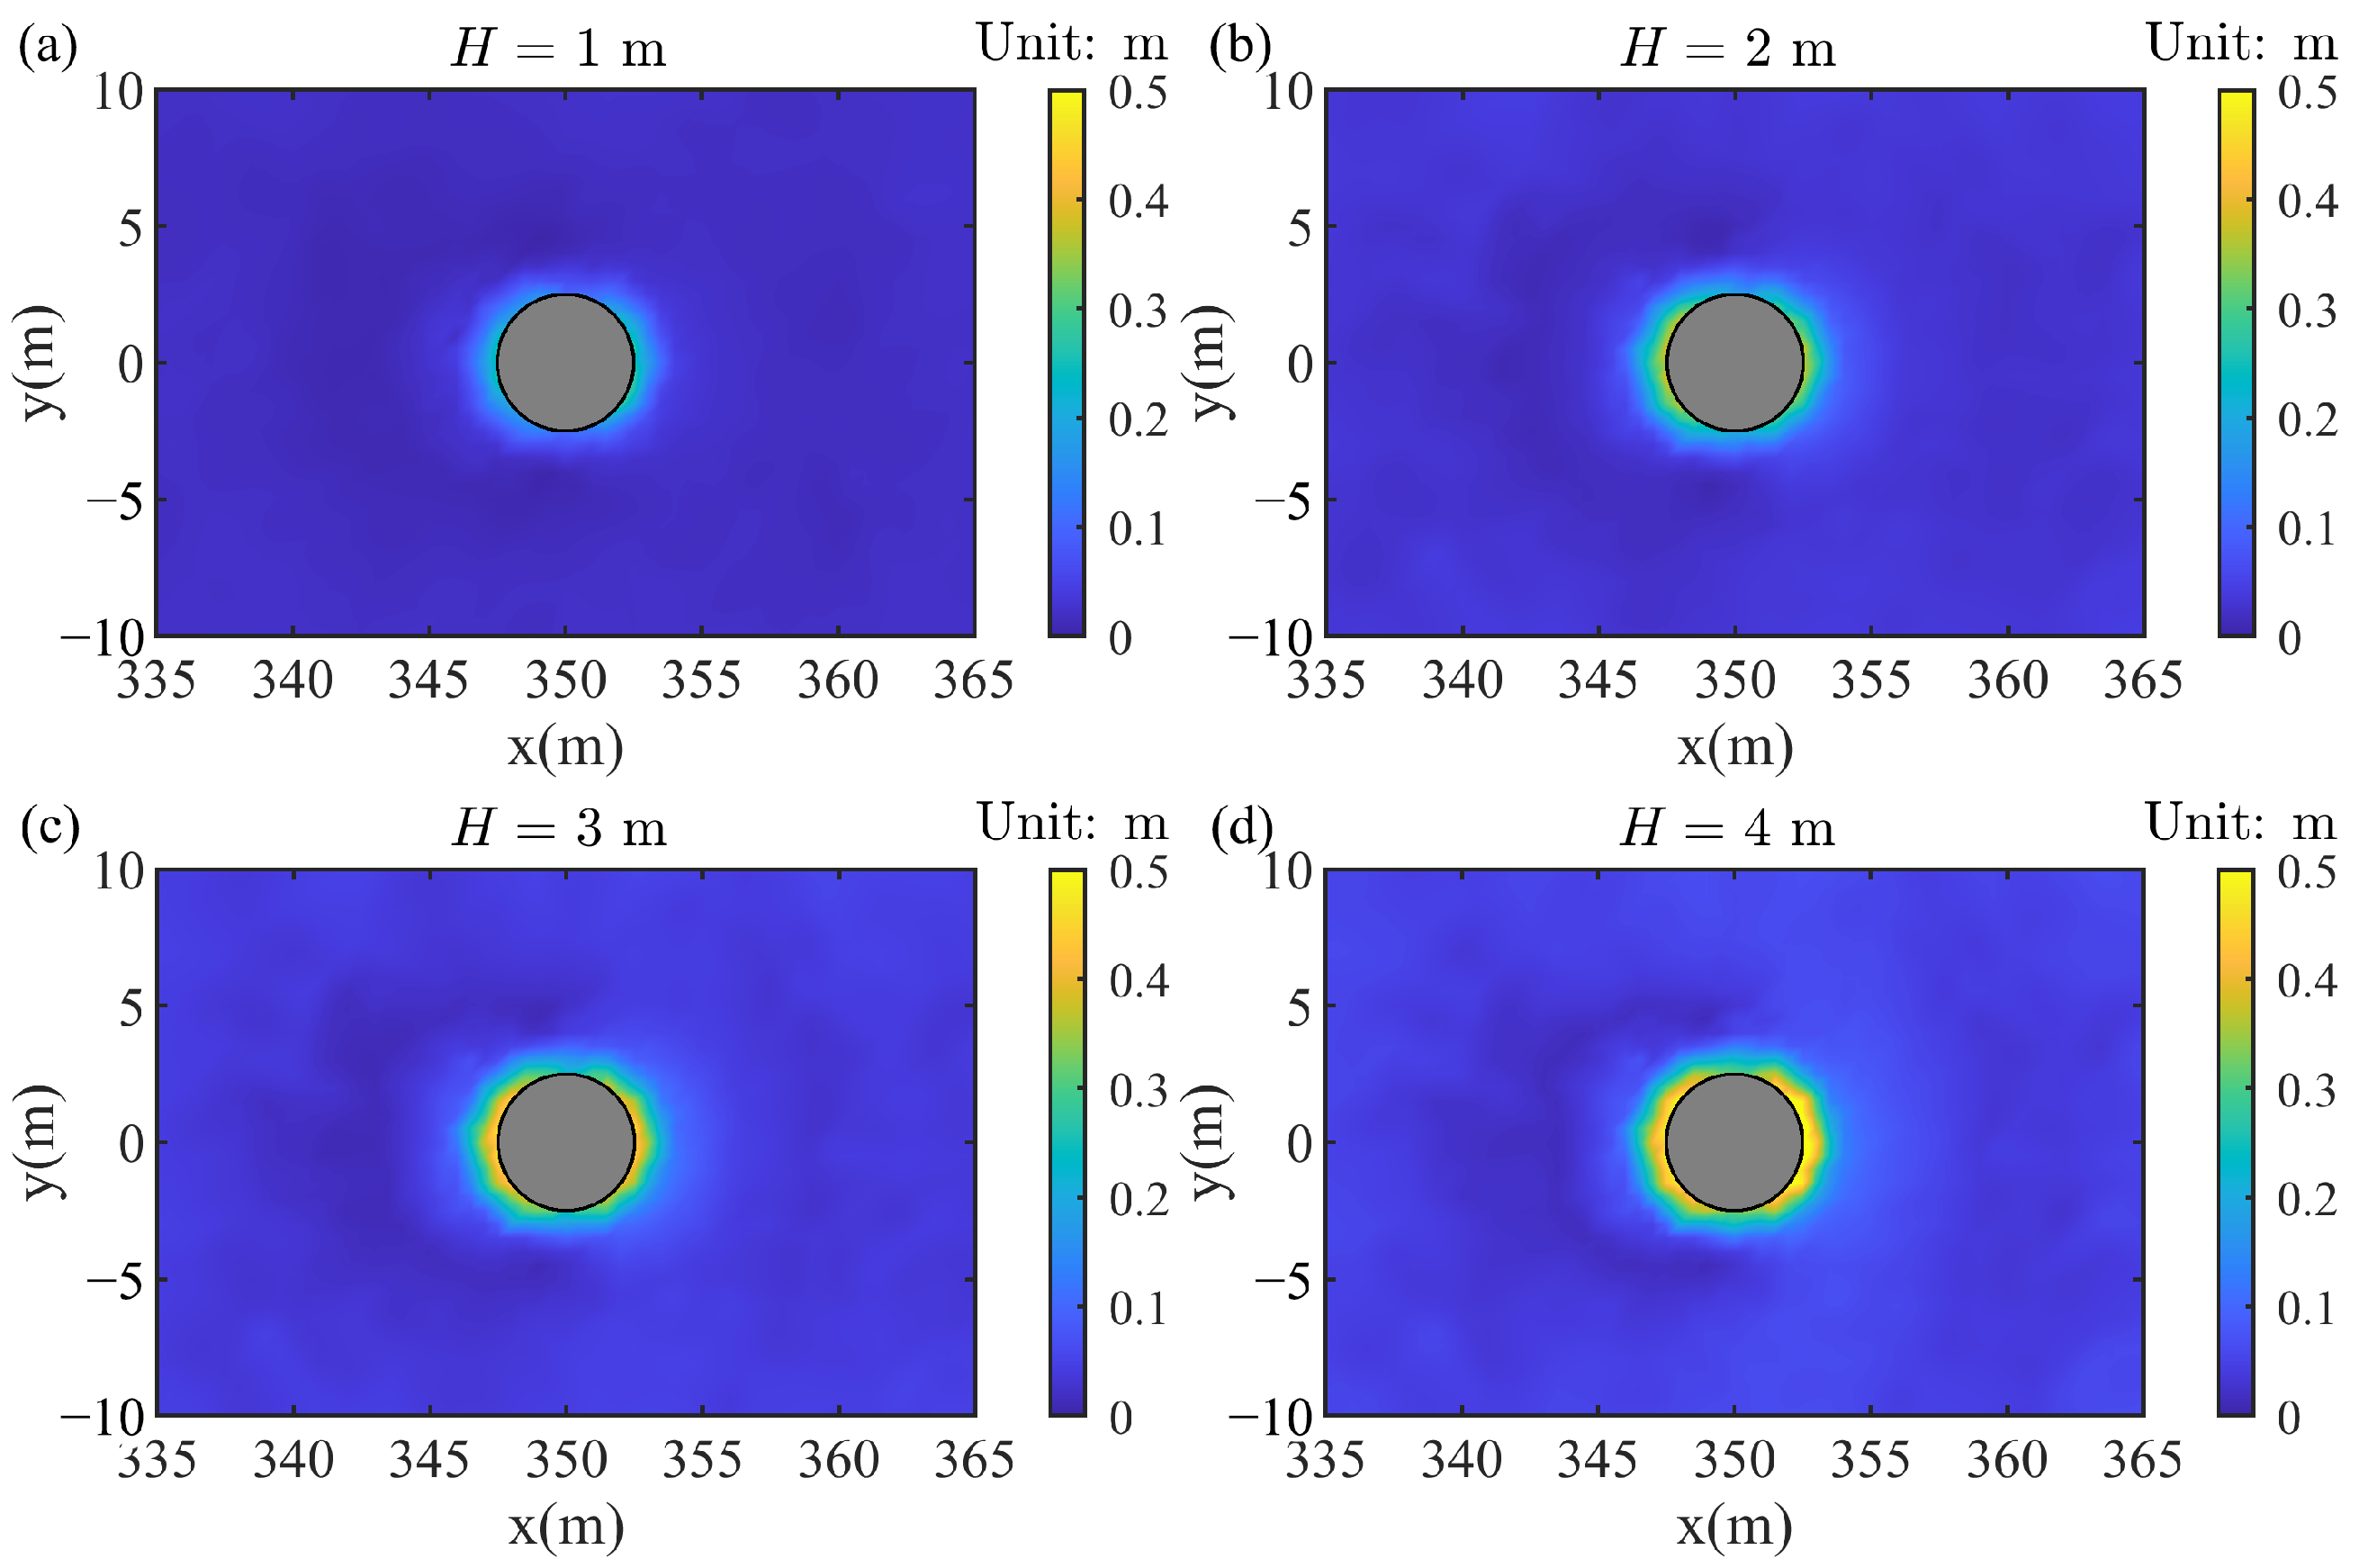
Figure 29 presents the transient liquefaction depth around the pile foundation under different wave heights. It is evident that the liquefaction depth increased significantly with rising wave height. For the smallest wave height (H = 1 m), the liquefied zone was shallow and localized near the pile. However, when H = 4 m, the liquefaction depth reached the maximum of 0.5 m and covered a wider area. This indicates that greater wave energy intensified the transient seepage forces in the seabed, thereby enhancing the potential for instantaneous liquefaction around the pile foundation.

4.5. Influence of Current

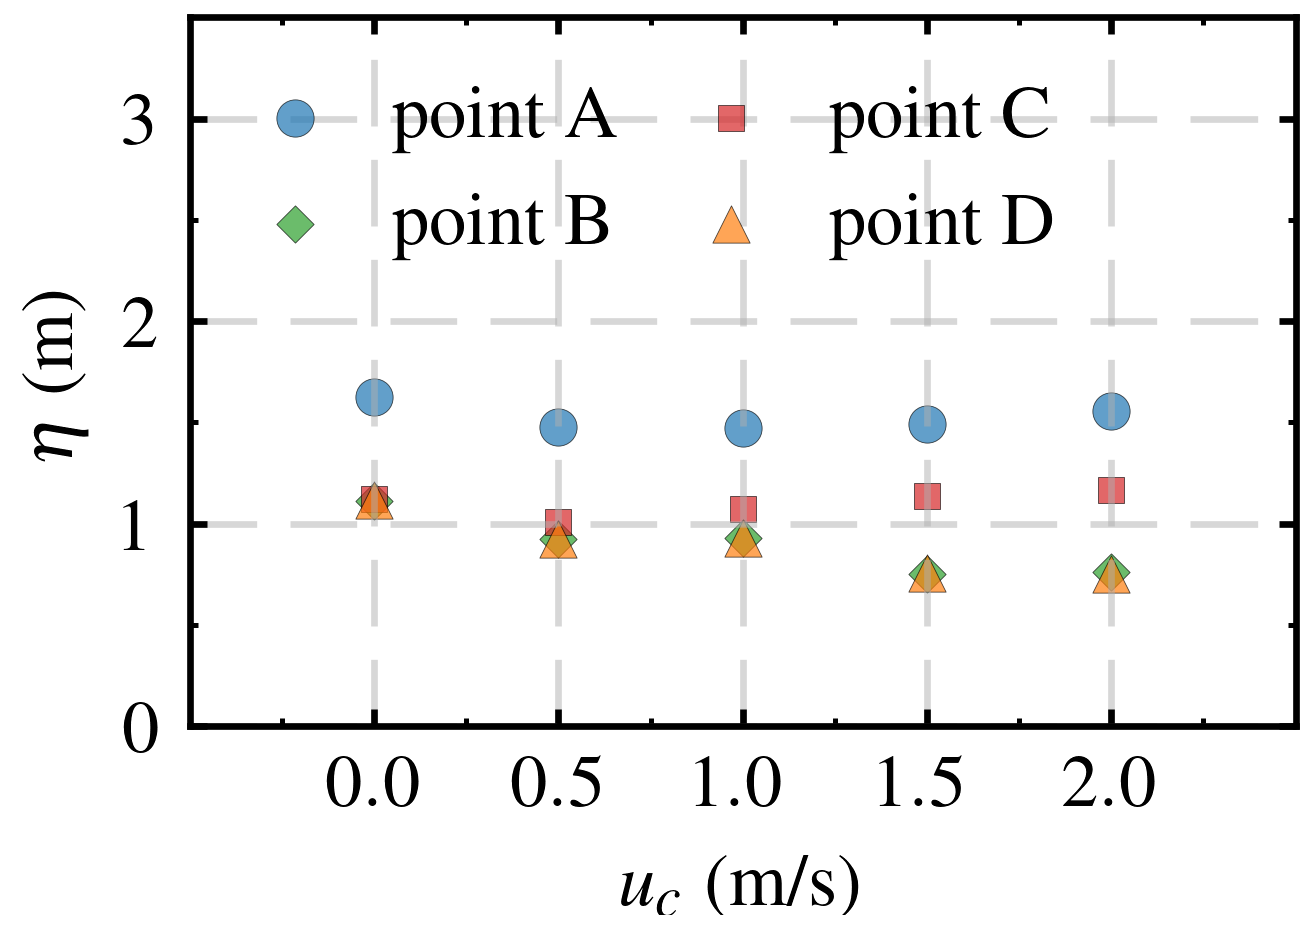
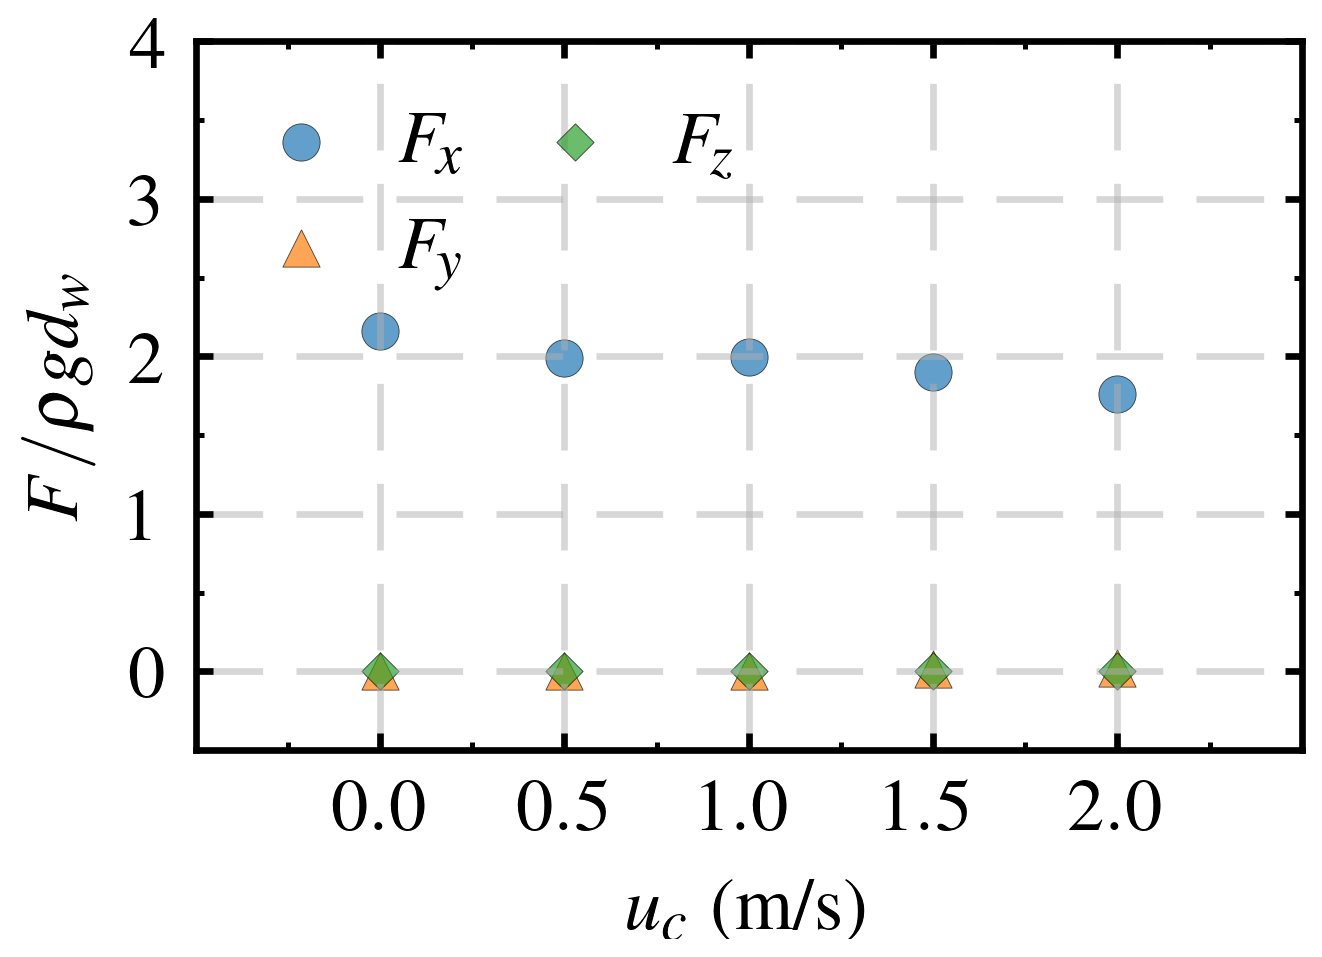
To investigate the effect of current velocity on the oscillating seabed response, the current velocities were set to U c = 0 m/s, 0.5 m/s, 1 m/s, 1.5 m/s, and 2 m/s. Figure 30 shows the influence of current velocity on the water surface amplitude around the pile. It can be seen from the figure that the water surface amplitude upstream and on the lee-side of the pile first decreased and then increased with increasing current velocity. However, the water surface amplitude on both lateral sides of the pile initially decreased and then gradually approached a stable value as the current velocity increased. This is due to the fact that at low current velocities, wave diffraction and reflection upstream and on the lee-side of the pile enhanced local free surface fluctuations during the domination of wave. As flow velocity increased, the wave–current interaction weakened the diffraction effect, reducing the water surface amplitude. At higher velocities, wake vortices and asymmetric pressure fields around the pile induced stronger local fluctuations, causing the water surface amplitude to increase. In contrast, the effects of wave diffraction and flow disturbance were more balanced on both sides of the pile. With the increase in current velocity, the initial diffraction effect was also weakened, causing a gradual decrease in free surface amplitude. At higher velocities, the flow became more symmetric and stable, which led to stable water surface amplitude. Additionally, the effect of current velocity on the wave force acting on the pile is investigated in this section (see Figure 31). It is obvious that the x-direction wave force on pile body decreased with the increase in current velocity.
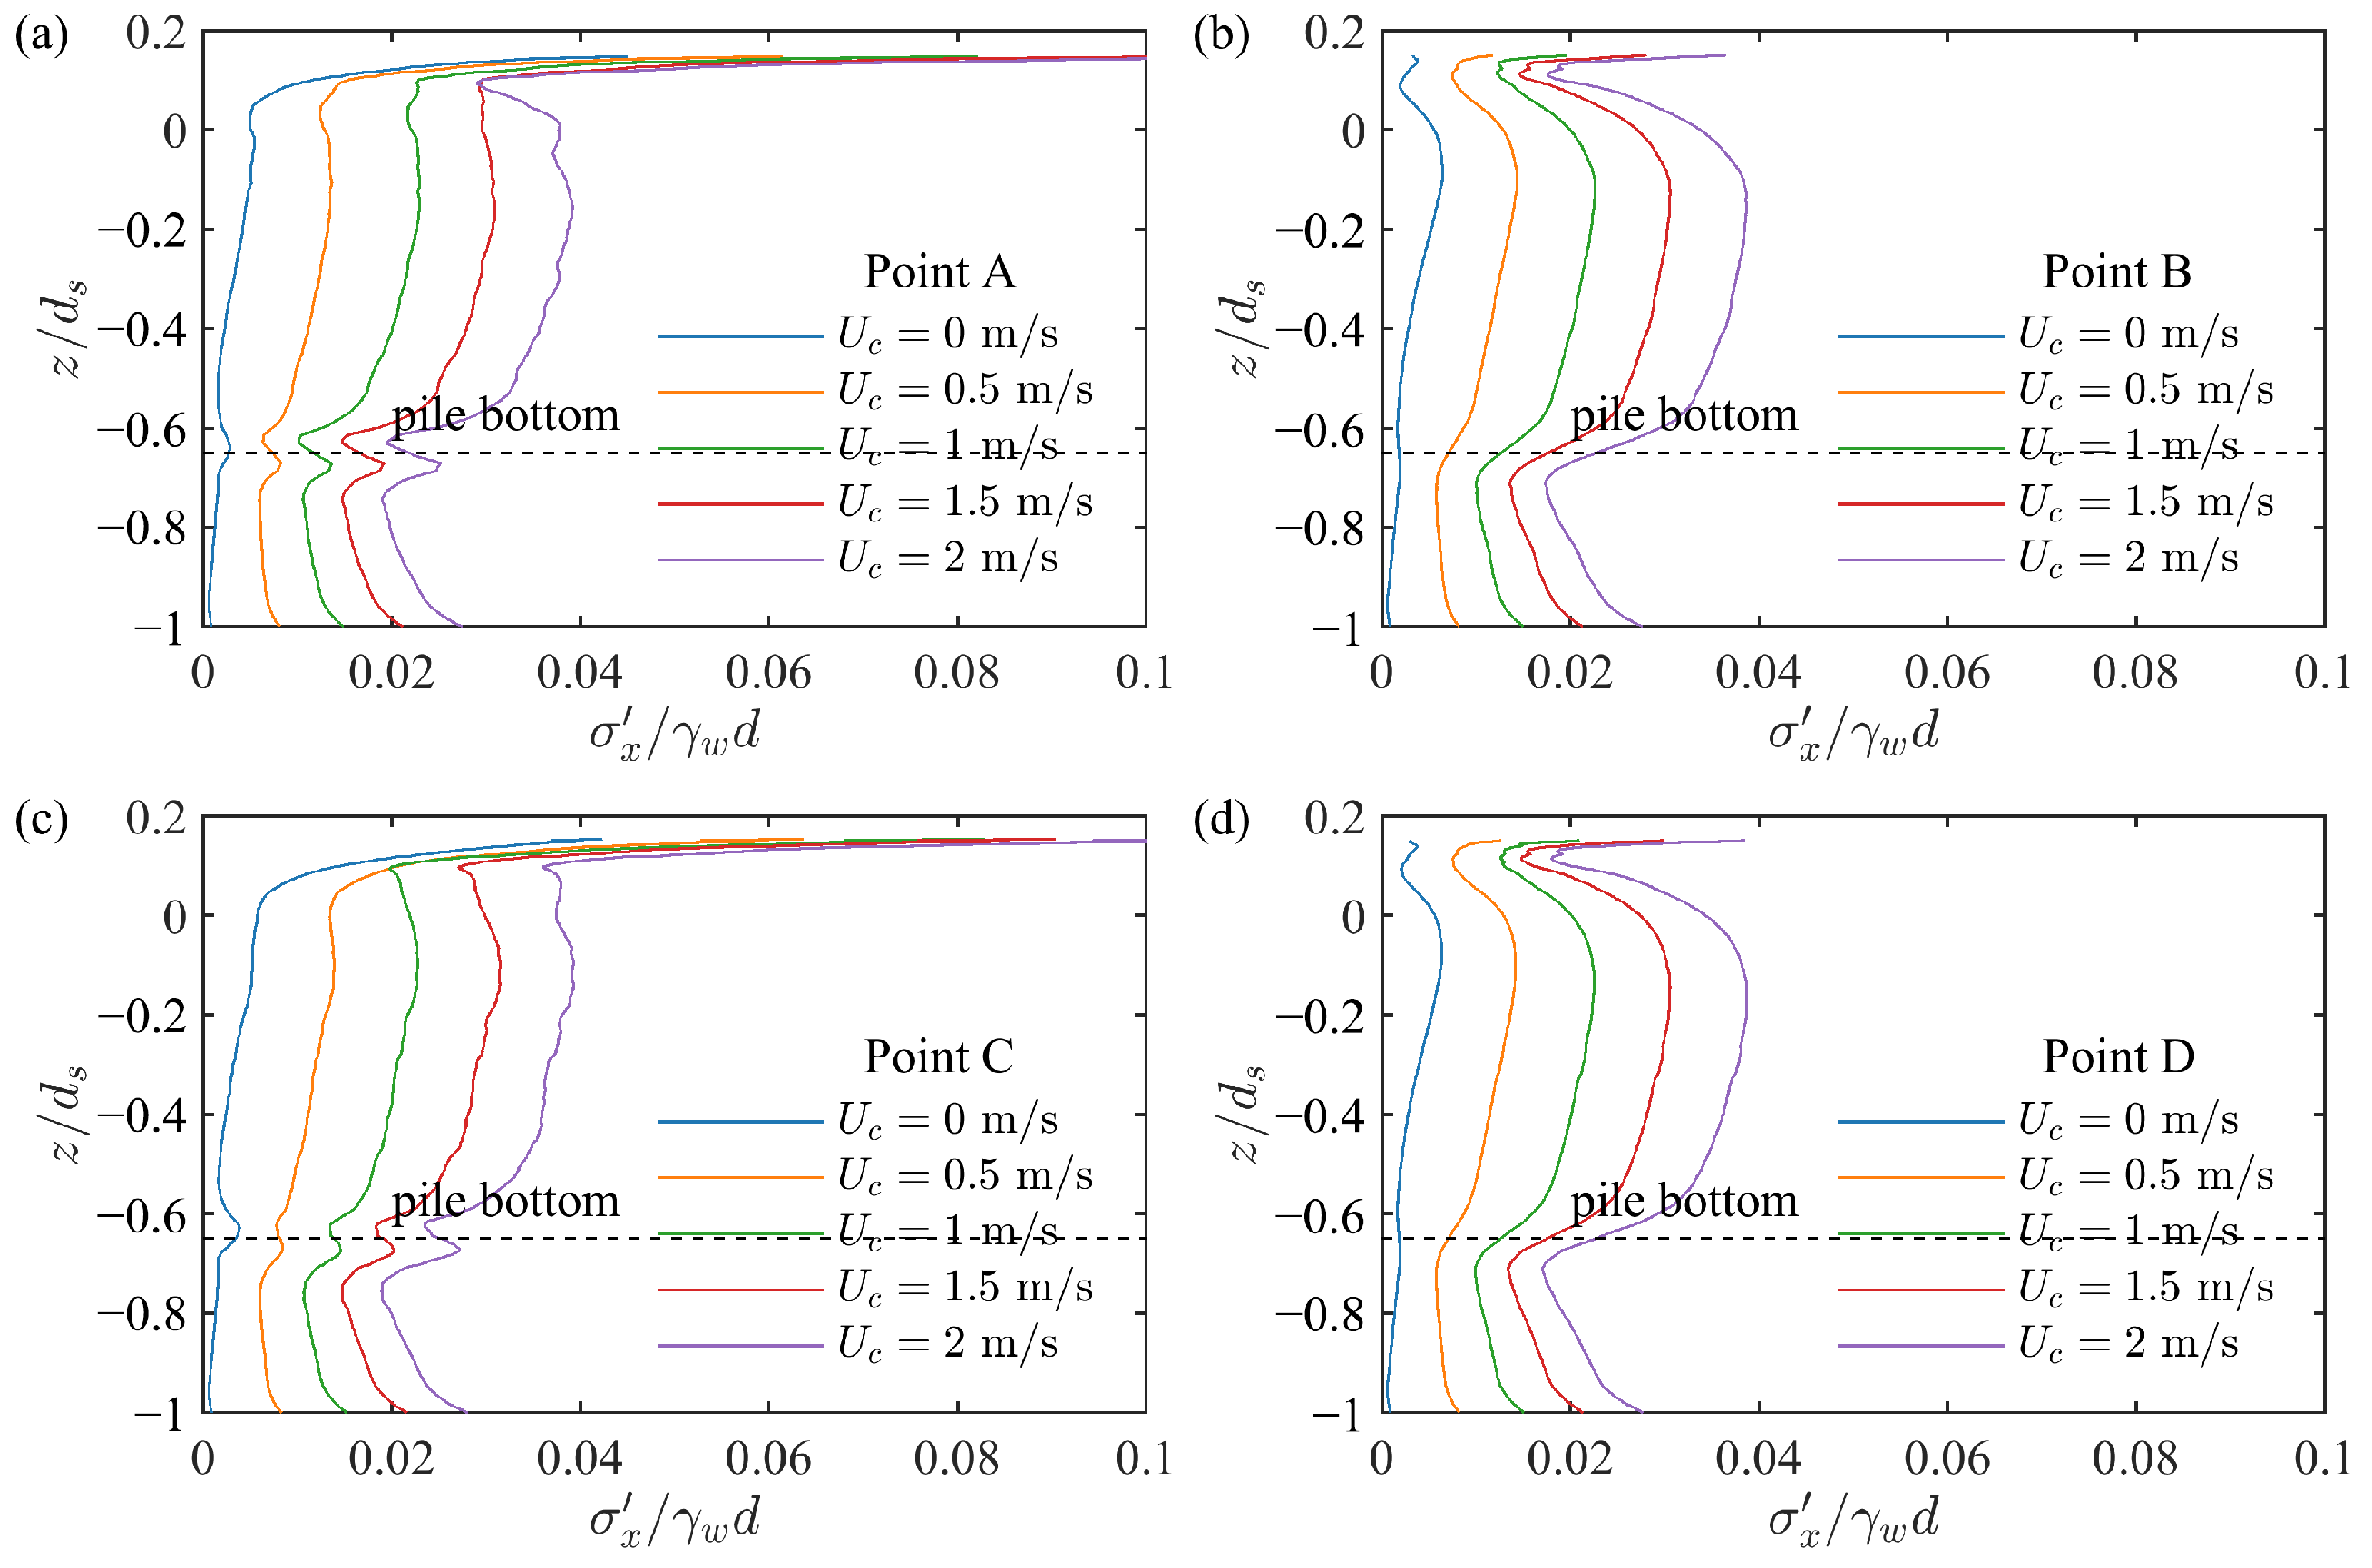
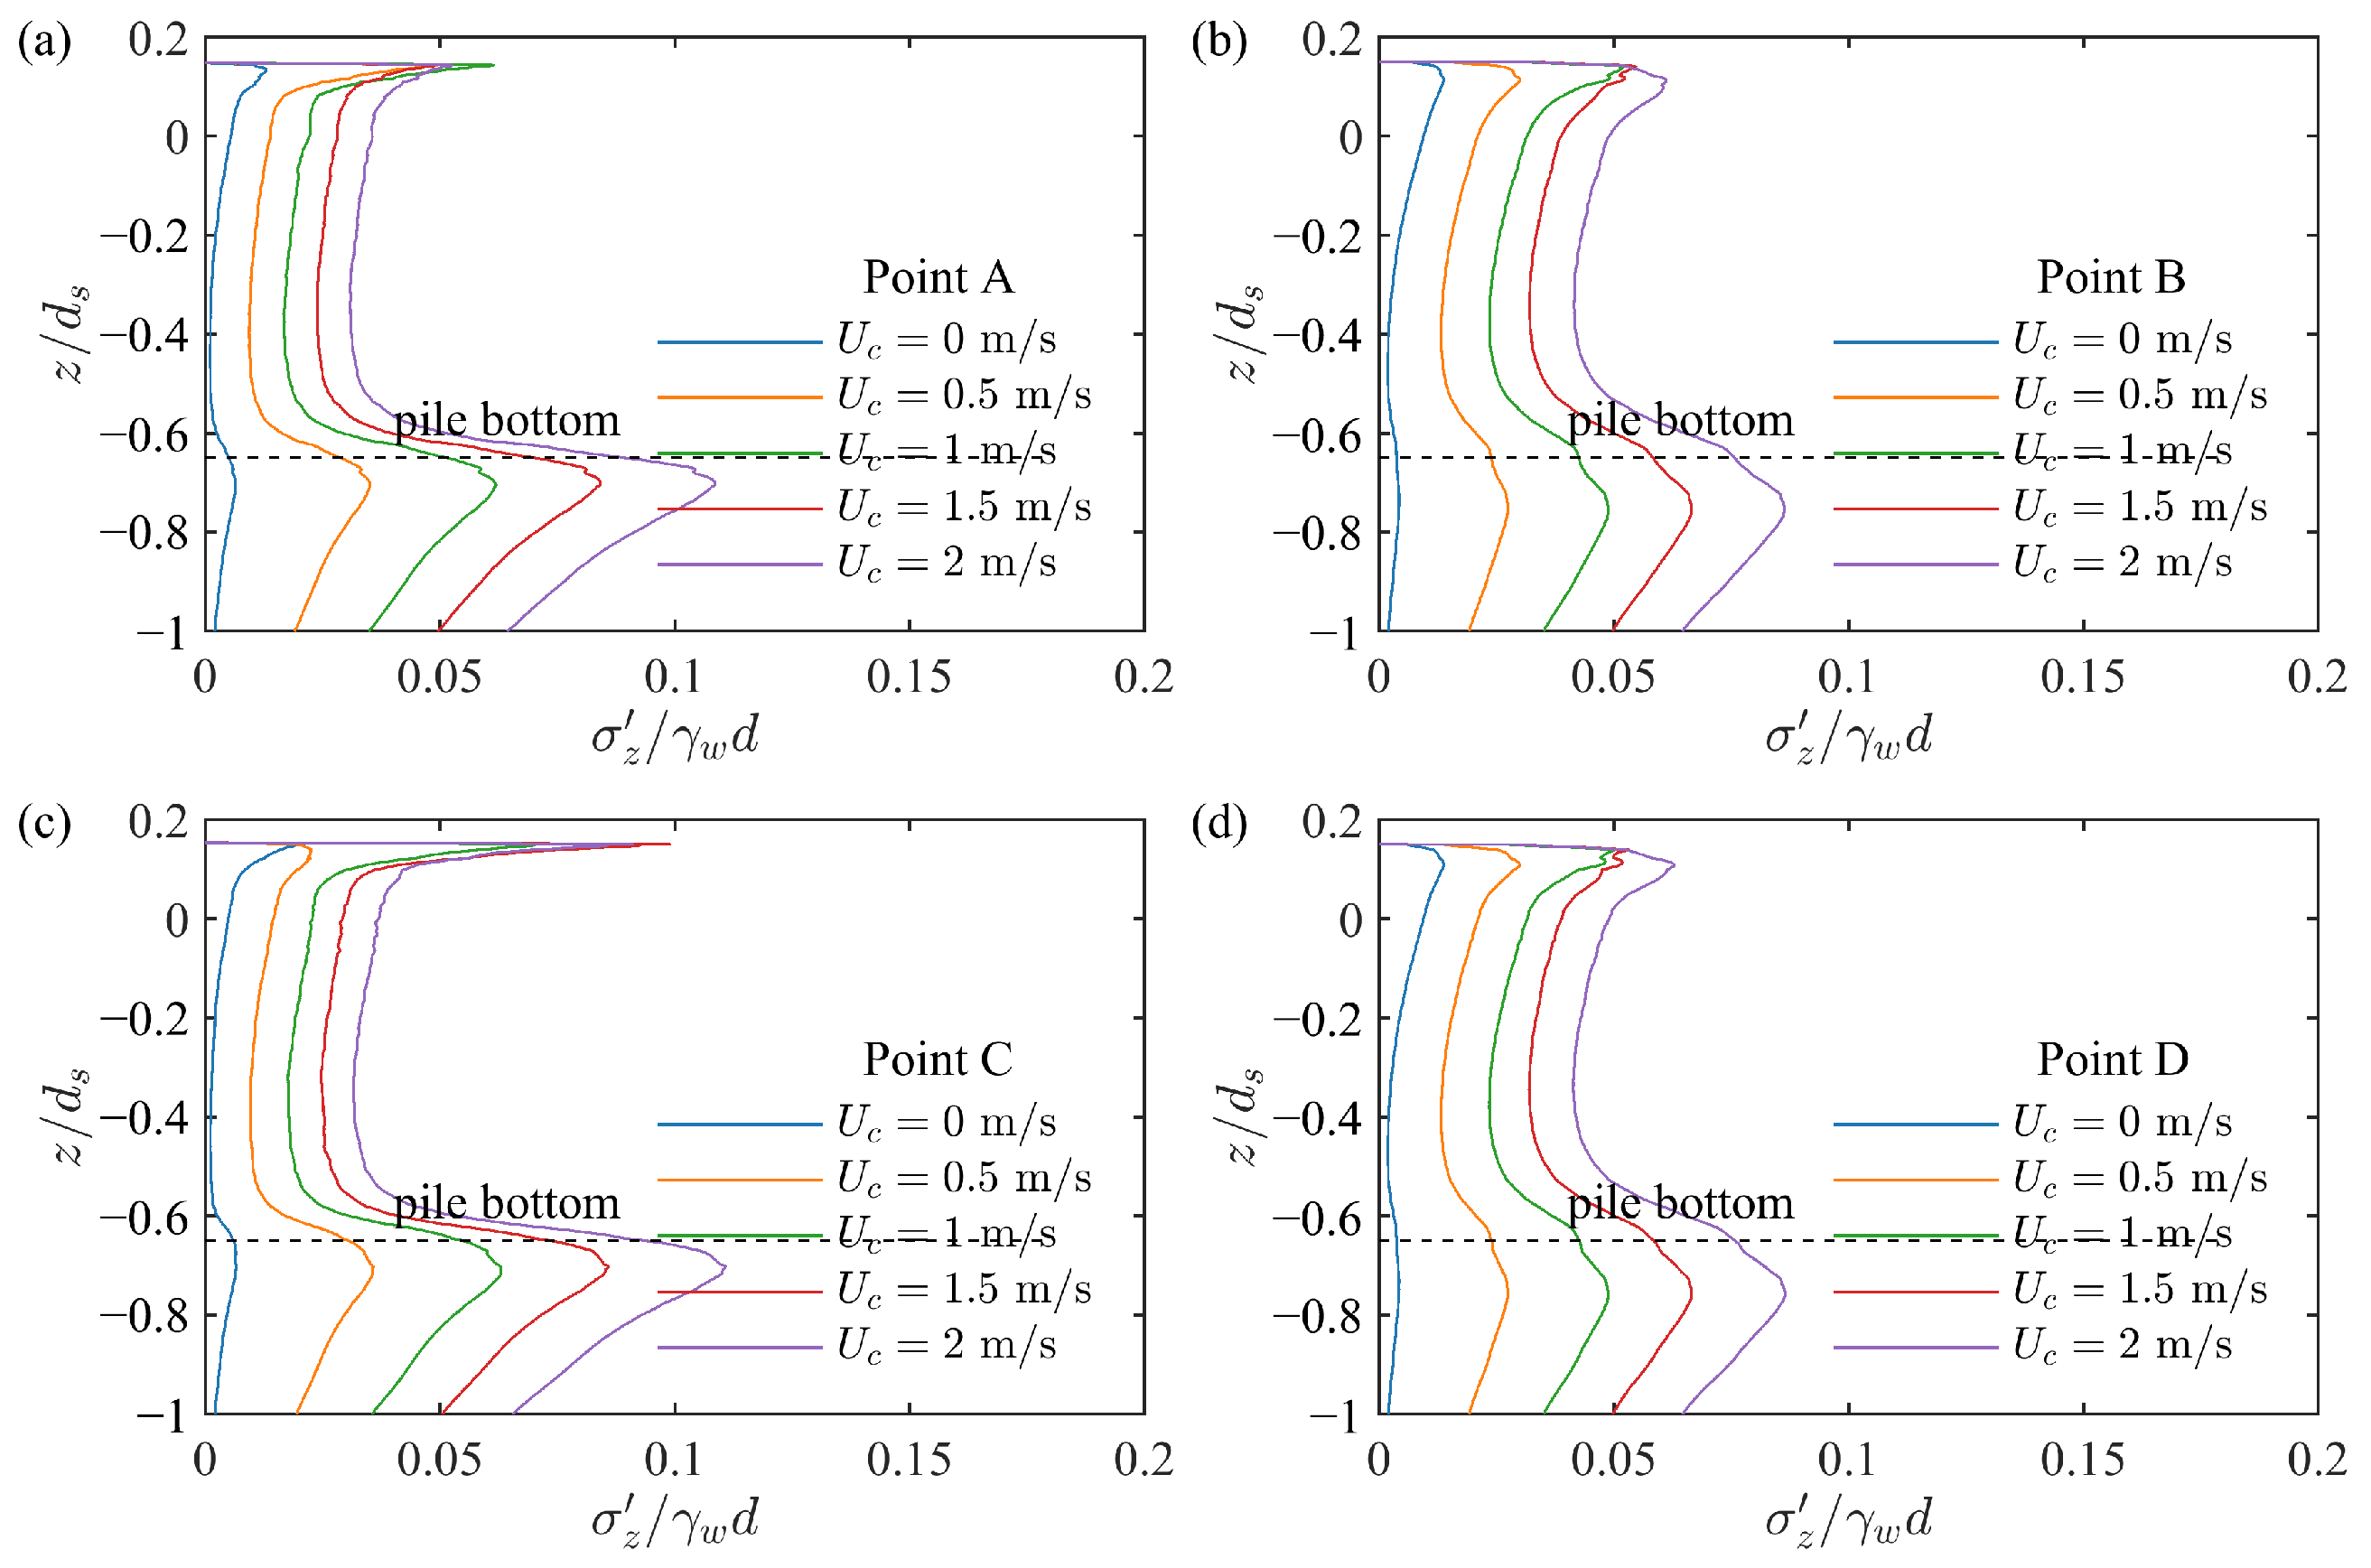
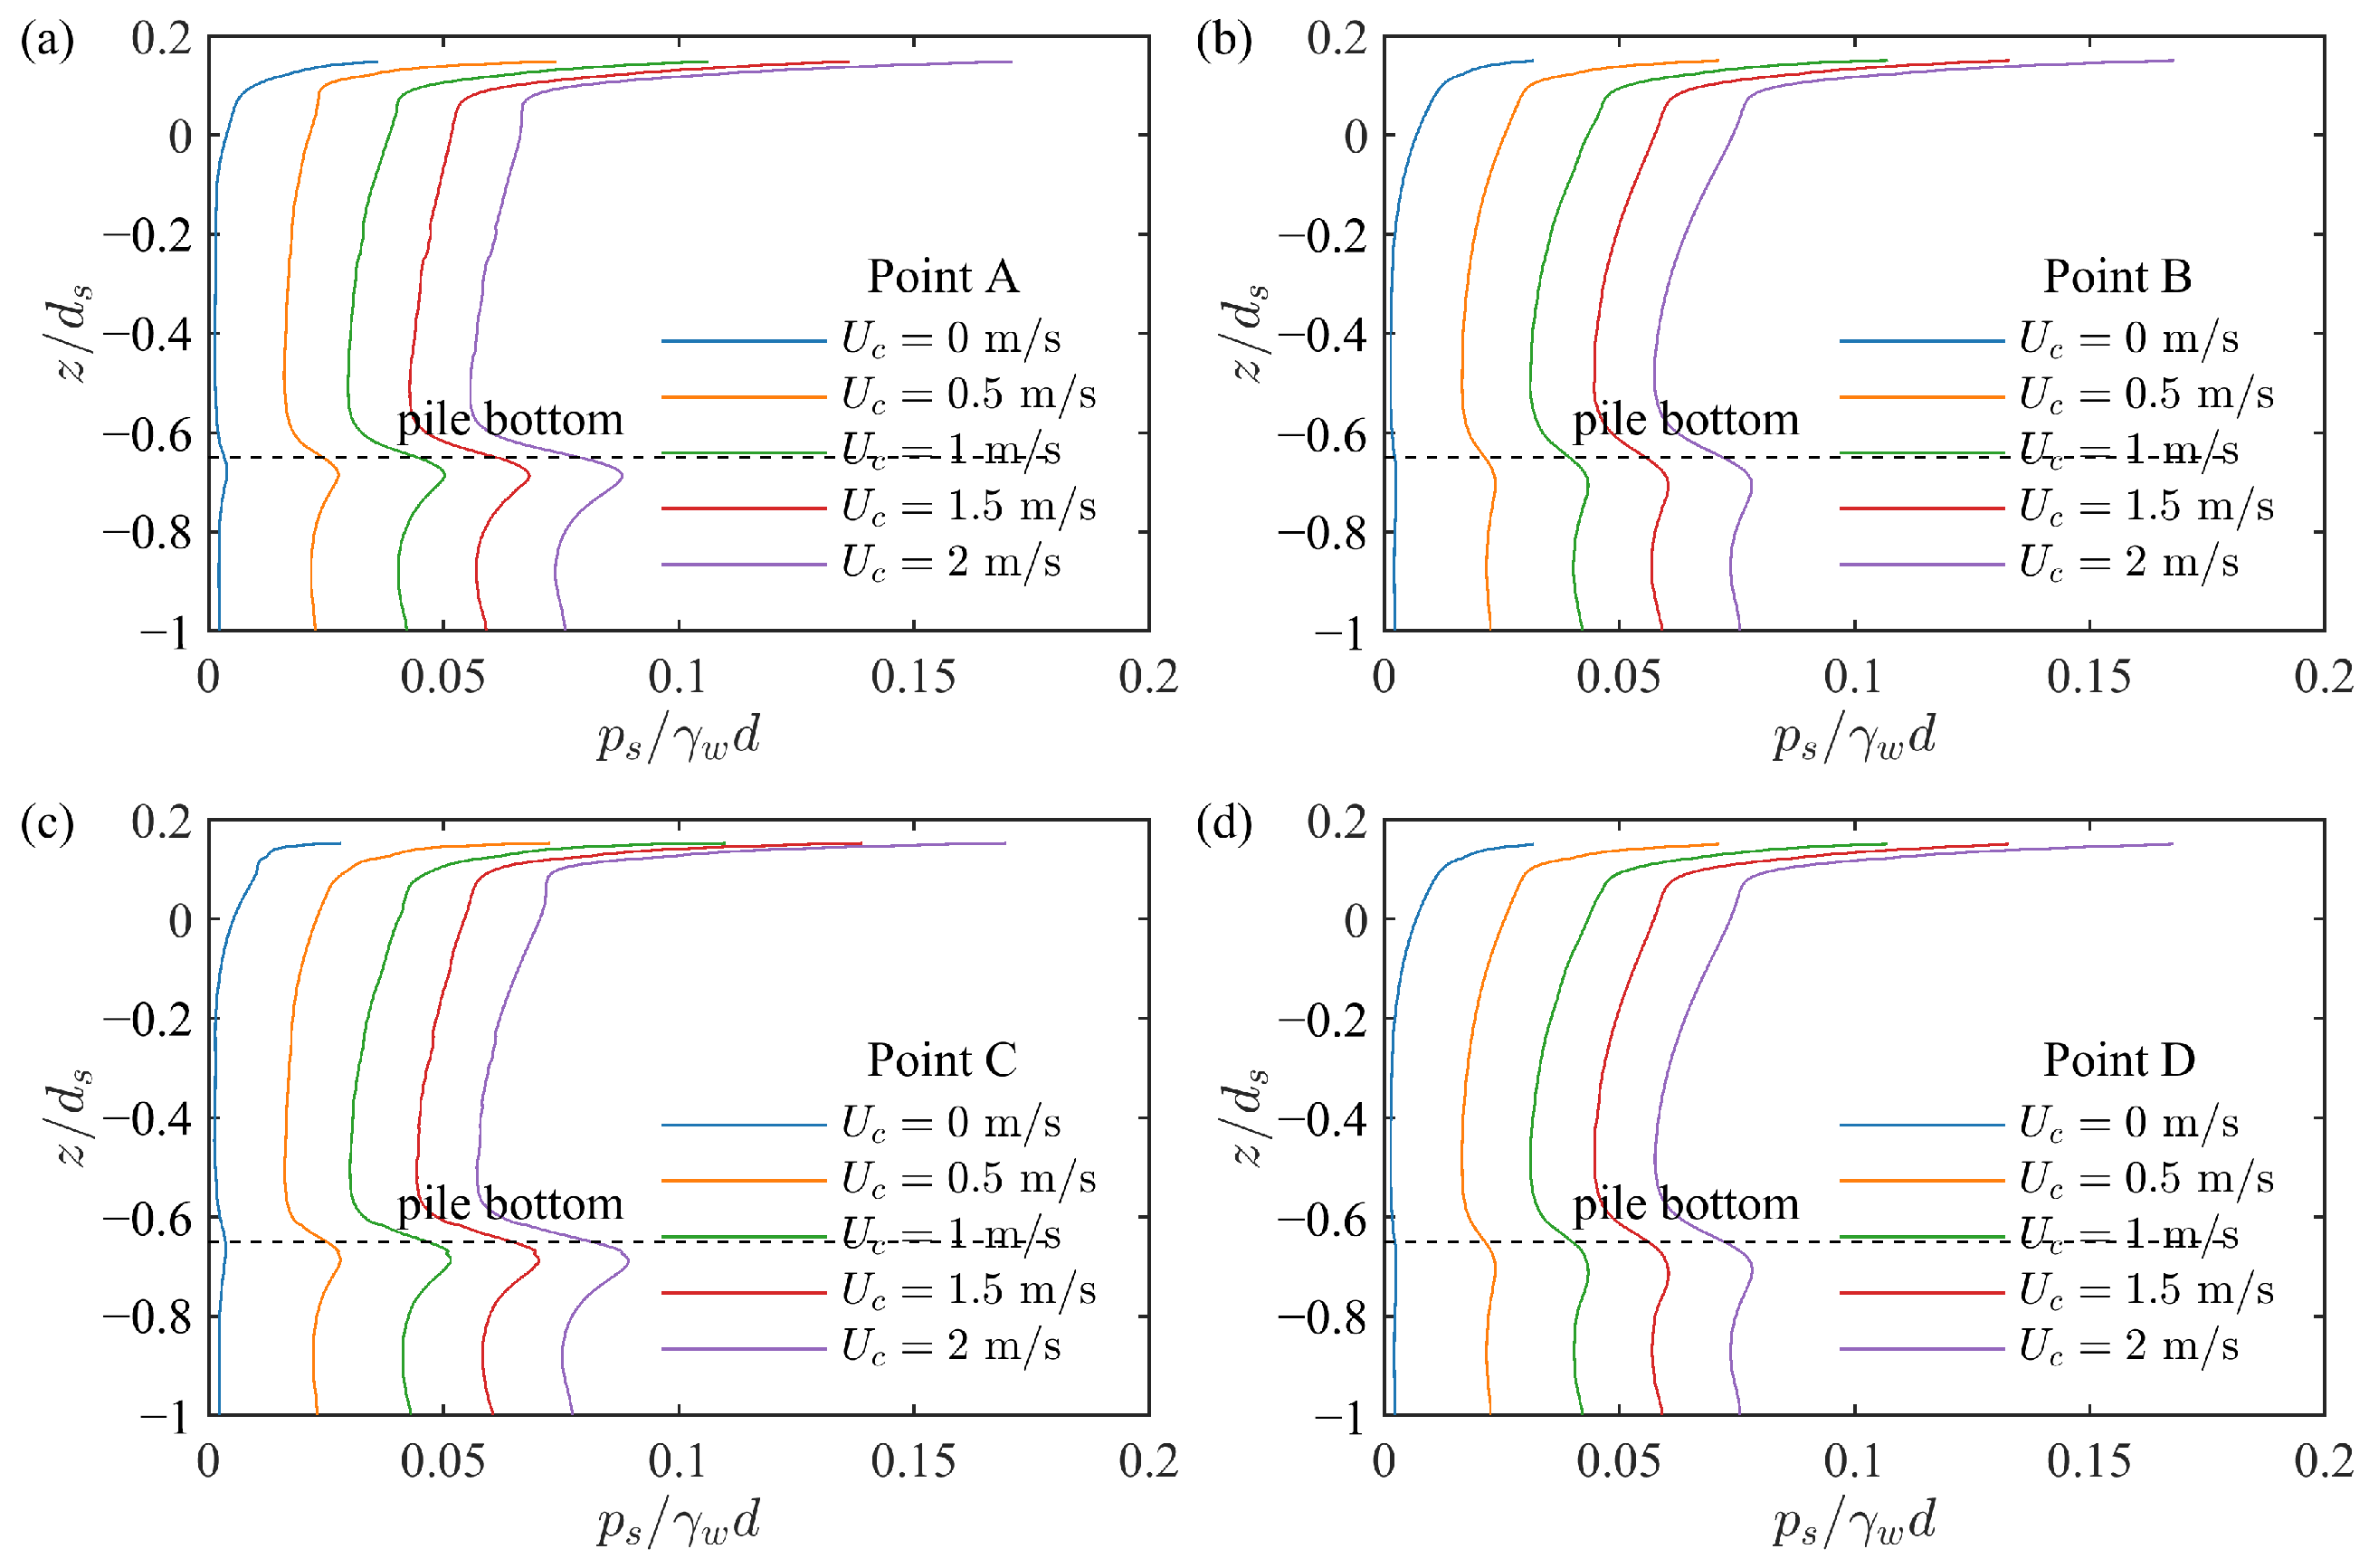
To further investigate the effect of current velocity on the depth-dependent oscillatory response of the seabed, Figure 32, Figure 33, Figure 34 and Figure 35 present the distributions of the maximum effective normal stresses and oscillatory pore pressure at various seabed depths along points A, B, C, and D. The results show that both the maximum effective stress and pore pressure increased with current velocity when the wave propagated in the same direction as the current. This behavior is attributed to the suppression of wake vortices around the pile at higher current speeds. With fewer vortices forming, the associated negative pressure near the seabed surface was reduced, resulting in a smaller attenuation of wave-induced pressure and thus a more intense seabed response. In addition, it can also be observed that the maximum vertical effective stress on the lee-side of the monopile was greater than that at the other locations (see Figure 34). This was mainly because of the flow separation and wake formation behind the pile, which led to increasing pressure fluctuations and stronger seepage effects on the lee-side of the pile. Therefore, the vertical effective stress in the lee-region was enhanced. These findings suggest that stronger currents, particularly when aligned with wave direction, can significantly amplify seabed stresses and pore pressure near monopiles. From an engineering perspective, such effects must be considered in the design and stability assessment of offshore foundations, especially in environments characterized by strong wave–current interactions.
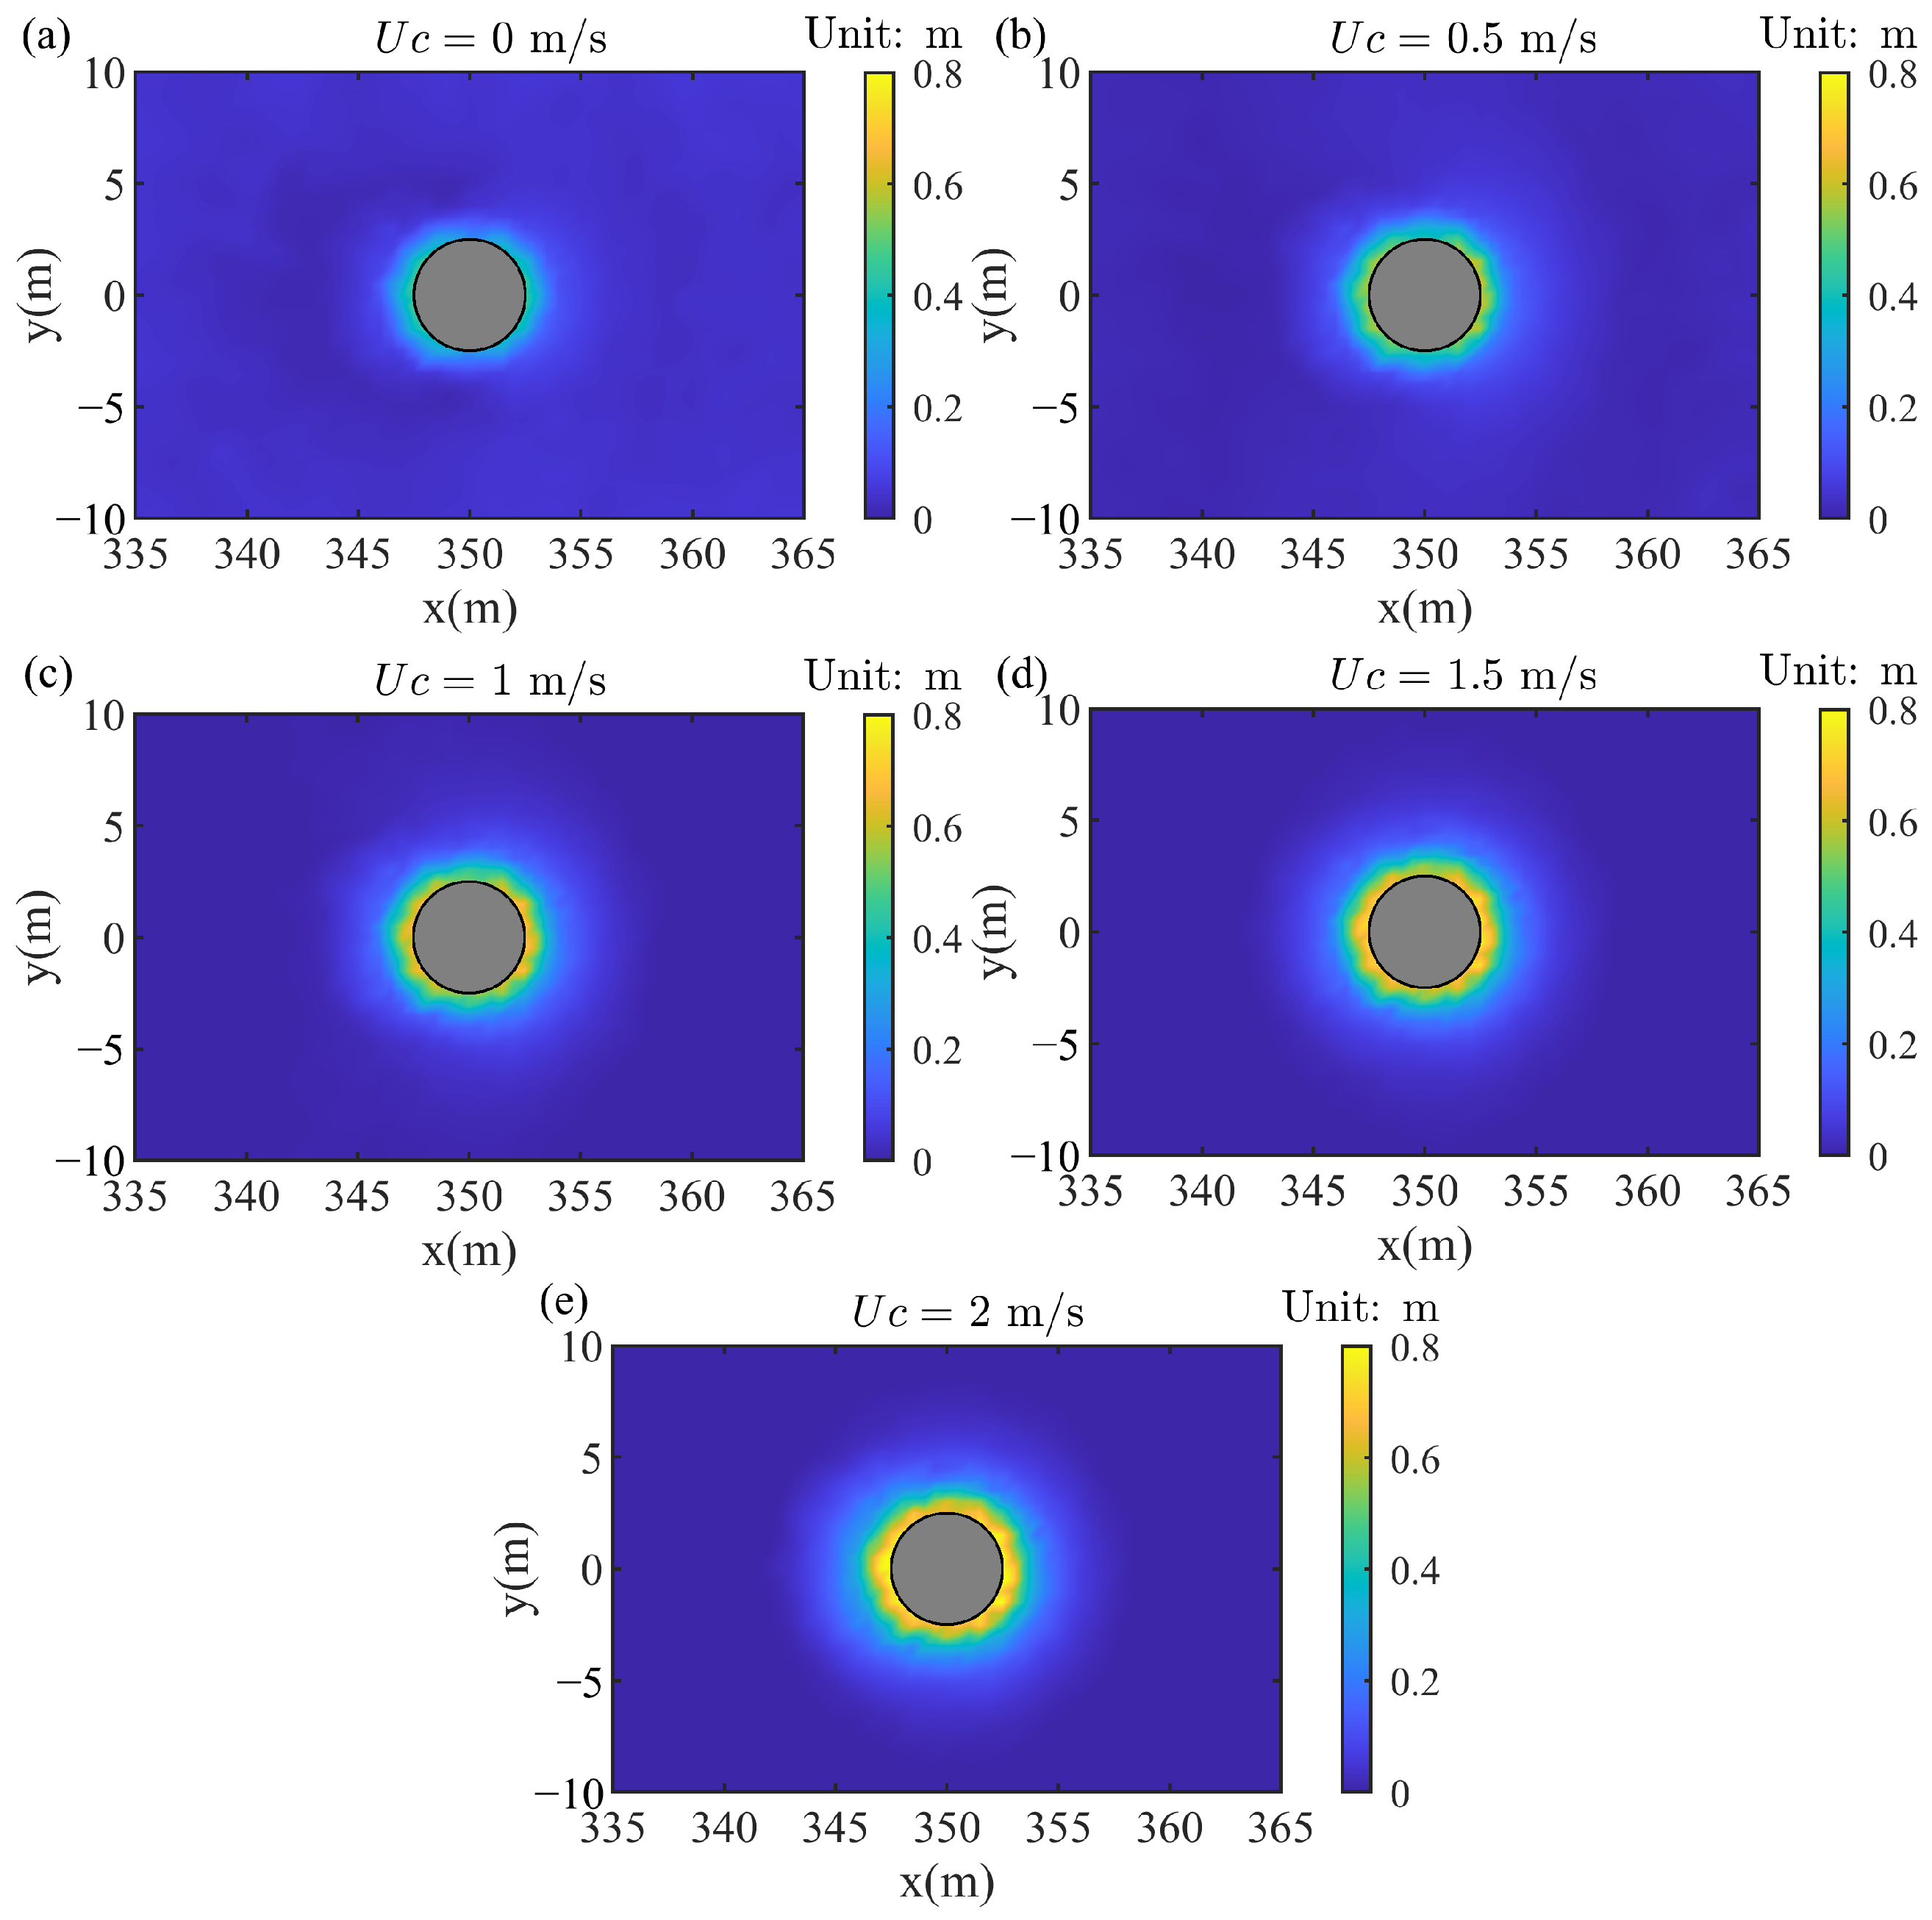
Figure 36 illustrates the instantaneous liquefaction depth around a pile foundation under combined wave–current loading for various current velocities. As the current velocity increased, the depth and extent of liquefaction around the pile became more significant. When U c = 0 m/s, liquefaction was relatively shallow and localized. However, with increasing current velocity up to 2 m/s, the maximum liquefaction depth approached 0.8 m and extended more symmetrically around the pile. This suggests that stronger current enhanced the wave-induced seepage force and pore pressure gradients in the seabed, thereby intensifying the potential for transient liquefaction. The findings emphasize the critical role of current flow in amplifying seabed instability near pile foundations.

5. Conclusions

In this paper, a three-dimensional model was proposed to study the sloping seabed response around a monopile. According to the numerical results, the following conclusions can be summarized:
  • The validation results demonstrate that the developed model was capable of accurately capturing wave–current-induced pore pressure and effective stress around the monopile.
  • The variation in seabed slope had minimal impact on the water surface amplitude around the pile but significantly affected the effective stress and pore pressure. In particular, the pore pressure on the lee-side of the pile showed the greatest sensitivity to the increasing slope, which weakened the bearing capacity and stability of the pile foundation. Moreover, the increase in slope increased the liquefaction depth around the pile, which was particularly obvious downstream of the pile.
  • With the increase in wave height, the water surface amplitude upstream of the pile exhibited a greater increase compared to other regions. Additionally, larger wave heights predominantly promoted the development of effective stress in the z-direction, whereas the effective stress in the x-direction evolved more rapidly under smaller wave heights. Based on the variation in effective stress, the liquefaction depth also increased with the increase in wave height.
  • The water surface amplitude upstream and on the lee-sides of the pile exhibited a nonmonotonic trend with increasing current velocity. In contrast, the water surface amplitude on both lateral sides of the pile decreased with the increase in current velocity and eventually approached a stable value. Furthermore, the effective stress, pore pressure, and liquefaction depth around the pile increased with the increase in velocity. Among the four observation points around the pile, the maximum vertical effective stress occurred on the lee-side of the pile.
  • From an engineering perspective, this study holds significant practical value for the design and safety assessment of offshore structures situated on complex seabed topographies. On one hand, the research elucidates the underlying mechanisms by which sloping seabeds influence the dynamic response of foundations, thereby providing a theoretical basis for the layout and reinforcement design of monopile foundations in non-horizontal seabed conditions. On the other hand, the findings can be utilized to identify high-risk zones, thus contributing to the optimization of site selection and construction strategies for marine engineering projects.

Author Contributions

Conceptualization, J.Z.; methodology, L.T. (Linlong Tong); software, Y.G.; validation, C.X. and S.X.; writing—original draft preparation, C.X., L.T. (Linlong Tong), and Y.G.; writing—review and editing, S.X. and L.T. (Liming Tao); visualization, C.X. and Y.G.; supervision, J.Z.; project administration, L.T. (Linlong Tong). All authors have read and agreed to the published version of the manuscript.

Funding

This research received no external funding.

Data Availability Statement

Data is contained within the article.

Conflicts of Interest

Authors Chao Xu, Shoupeng Xie and Liming Tao were employed by the company China Harbour Engineering Company Ltd. The remaining authors declare that the research was conducted in the absence of any commercial or financial relationships that could be construed as a potential conflict of interest.

References

  1. Bourne, D.G.; Webster, N.S. Coral Reef Bacterial Communities. In The Prokaryotes; Springer: Berlin/Heidelberg, Germany, 2013; pp. 163–187. [Google Scholar]
  2. Montaggioni, L.F. History of Indo-Pacific coral reef systems since the last glaciation: Development patterns and controlling factors. Earth-Sci. Rev. 2005, 71, 1–75. [Google Scholar] [CrossRef]
  3. Hopley, D. Encyclopedia of Modern Coral Reefs; Springer: Dordrecht, The Netherlands, 2011. [Google Scholar]
  4. Ye, J.; Shan, J.; Zhou, H.; Yan, N. Numerical modelling of the wave interaction with revetment breakwater built on reclaimed coral reef islands in the South China Sea-Experimental verification. Ocean Eng. 2021, 235, 109325. [Google Scholar] [CrossRef]
  5. Xiao, Z.; Song, L.; Li, J. Stability of the large cylindrical structures in Hong Kong–Zhuhai–Macao bridge: A case study. Appl. Ocean Res. 2020, 97, 102092. [Google Scholar] [CrossRef]
  6. Huo, S.; Zhu, M.; Dai, G.; Gong, W. Application of inclined steel-pipe piles in ocean engineering. J. Coast. Res. 2020, 103, 284–287. [Google Scholar] [CrossRef]
  7. Saengsupavanich, C.; Ferren, V.; Magdalena, I.; Ariffin, E.H.; Sanitwong-Na-Ayutthaya, S. Using piles for wave reduction and coastal protection: A review. Reg. Stud. Mar. Sci. 2024, 77, 103638. [Google Scholar] [CrossRef]
  8. Sumer, B.M. Liquefaction Around Marine Structures; World Scientific: Singapore, 2014; Volume 39. [Google Scholar]
  9. Jeng, D.S. Porous Models for Wave-Seabed Interaction; Springer: Berlin/Heidelberg, Germany, 2012. [Google Scholar] [CrossRef]
  10. Smith, A.W.S.; Gordon, A.D. Large Breakwater Toe Failures. J. Waterw. Port Coast. Ocean Eng. 1983, 109, 253–255. [Google Scholar] [CrossRef]
  11. Ulker, M.; Rahman, M.; Jeng, D.S. Wave-Induced Response of Seabed: Various Formulations and Their Applicability. Appl. Ocean Res. 2009, 31, 12–24. [Google Scholar] [CrossRef]
  12. Jeng, D.S.; Ye, J.H.; Zhang, J.S.; Liu, P.F. An Integrated Model for the Wave-Induced Seabed Response around Marine Structures: Model Verifications and Applications. Coast. Eng. 2013, 72, 1–19. [Google Scholar] [CrossRef]
  13. Manik, H.M. Acoustical Measurement and Biot Model for Coral Reef Detection and Quantification. Adv. Acoust. Vib. 2016, 2016, 1–11. [Google Scholar] [CrossRef]
  14. Yan, L.; Guo, X.; Zhang, X.; Qi, J. Numerical Simulation on the Frequency Response of 3-D Reef–Seawater–Seabed Coupling System Under Seismic Excitation. J. Mar. Sci. Eng. 2024, 12, 2343. [Google Scholar] [CrossRef]
  15. Biot, M.A. General Theory of Three-Dimensional Consolidation. J. Appl. Phys. 1941, 12, 155–164. [Google Scholar] [CrossRef]
  16. Biot, M.A. Theory of Propagation of Elastic Waves in a Fluid-saturated Porous Solid. I. Low-Frequency Range. J. Acoust. Soc. Am. 1956, 28, 168–178. [Google Scholar] [CrossRef]
  17. Biot, M.A. Theory of Propagation of Elastic Waves in a Fluid-saturated Porous Solid. II. Higher Frequency Range. J. Acoust. Soc. Am. 1956, 28, 179–191. [Google Scholar] [CrossRef]
  18. Zienkiewicz, O.C.; Chang, C.T.; Bettess, P. Drained, Undrained, Consolidating and Dynamic Behaviour Assumptions in Soils. Géotechnique 1980, 30, 385–395. [Google Scholar] [CrossRef]
  19. Jeng, D.S.; Rahman, M.S. Effective Stresses in a Porous Seabed of Finite Thickness: Inertia Effects. Can. Geotech. J. 2000, 37, 1383–1392. [Google Scholar] [CrossRef]
  20. Yamamoto, T.; Koning, H.L.; Sellmeijer, H.; Hijum, E.V. On the Response of a Poro-Elastic Bed to Water Waves. J. Fluid Mech. 1978, 87, 193–206. [Google Scholar] [CrossRef]
  21. Madsen, O.S. Wave-Induced Pore Pressures and Effective Stresses in a Porous Bed. Géotechnique 1978, 28, 377–393. [Google Scholar] [CrossRef]
  22. Okusa, S. Wave-Induced Stresses in Unsaturated Submarine Sediments. Géotechnique 1985, 35, 517–532. [Google Scholar] [CrossRef]
  23. Sakai, T.; Hattori, A.; Hatanaka, K. Wave-induced transient pore-water pressure and seabed instability in the surf zone. In Proceedings of the International Conference on Geotechnical Engineeing for Coastal Development-Theory and Practice on soft Ground, Yokohama, Japan, 3–6 September 1991; Volume 1, pp. 627–632. [Google Scholar]
  24. Jeng, D.S.; Seymour, B.R. Response in Seabed of Finite Depth with Variable Permeability. J. Geotech. Geoenvironmental Eng. 1997, 123, 902–911. [Google Scholar] [CrossRef]
  25. Jeng, D.S.; Cha, D. Effects of dynamic soil behavior and wave non-linearity on the wave-induced pore pressure and effective stresses in porous seabed. Ocean Eng. 2003, 30, 2065–2089. [Google Scholar] [CrossRef]
  26. Chen, X.; Lei, Y.; Zheng, X.Y. Dynamic responses of a transversely isotropic poroelastic seabed subjected to nonlinear random waves with emphasis on liquefaction depth. Ocean Eng. 2023, 286, 115491. [Google Scholar] [CrossRef]
  27. Zhao, H.; Jeng, D.S.; Liao, C.; Zhu, J. Three-dimensional modeling of wave-induced residual seabed response around a mono-pile foundation. Coast. Eng. 2017, 128, 1–21. [Google Scholar] [CrossRef]
  28. Lin, J.; Zhang, J.-S.; Sun, K.; Wei, X.-L.; Guo, Y.-K. Numerical analysis of seabed dynamic response in vicinity of mono-pile under wave-current loading. Water Sci. Eng. 2020, 13, 74–82. [Google Scholar] [CrossRef]
  29. Lin, J.; Guo, Y. Numerical investigation of non-cohesive seabed response around a mono-pile by crossing wave-current. Water Sci. Eng. 2022, 15, 57–68. [Google Scholar] [CrossRef]
  30. Tong, D.; Liao, C.; Chen, J. Hydro-mechanical modelling of interaction between monopiles and cross-anisotropic sandy seabed subjected to wave loadings. Geomech. Geoengin. 2024, 19, 123–138. [Google Scholar] [CrossRef]
  31. Ye, J.; Jeng, D.; Wang, R.; Zhu, C. A 3-D Semi-Coupled Numerical Model for Fluid–Structures–Seabed-Interaction (FSSI-CAS 3D): Model and Verification. J. Fluids Struct. 2013, 40, 148–162. [Google Scholar] [CrossRef]
  32. Jasak, H. OpenFOAM: Open Source CFD in Research and Industry. Int. J. Nav. Archit. Ocean Eng. 2009, 1, 89–94. [Google Scholar]
  33. Liang, Z.; Jeng, D.S. A three-dimensional model for the seabed response induced by waves in conjunction with currents in the vicinity of an offshore pipeline using OpenFOAM. Int. J. Ocean Coast. Eng. 2018, 1, 1850004. [Google Scholar] [CrossRef]
  34. khumar Shanmugasundaram, R.; Rusche, H.; Windt, C.; Kirca, Ö.; Sumer, M.; Goseberg, N. Towards the numerical modelling of residual seabed liquefaction using OpenFOAM. OpenFOAM J. 2022, 2, 94–115. [Google Scholar] [CrossRef]
  35. Li, Y.; Ong, M.C.; Tang, T. A numerical toolbox for wave-induced seabed response analysis around marine structures in the OpenFOAM® framework. Ocean Eng. 2020, 195, 106678. [Google Scholar] [CrossRef]
  36. Qin, C.; Duan, L.; Wang, D.; Duan, B.; Fan, M.; Wang, H. Three-dimensional numerical simulation of wave-induced seabed response around a dumbbell-shaped cofferdam. Appl. Ocean Res. 2023, 134, 103501. [Google Scholar] [CrossRef]
  37. Li, X.J.; Gao, F.P.; Yang, B.; Zang, J. Wave-Induced Pore Pressure Responses And Soil Liquefaction Around Pile Foundation. Int. J. Offshore Polar Eng. 2011, 21, 233–239. [Google Scholar]
  38. Chang, K.T.; Jeng, D.S. Numerical Study for Wave-Induced Seabed Response around Offshore Wind Turbine Foundation in Donghai Offshore Wind Farm, Shanghai, China. Ocean Eng. 2014, 85, 32–43. [Google Scholar] [CrossRef]
  39. Sui, T.; Zhang, C.; Guo, Y.; Zheng, J.; Jeng, D.; Zhang, J.; Zhang, W. Three-Dimensional Numerical Model for Wave-Induced Seabed Response around Mono-Pile. Ships Offshore Struct. 2016, 11, 667–678. [Google Scholar] [CrossRef]
  40. Shi, F.; Dalrymple, R.A.; Kirby, J.T.; Chen, Q.; Kennedy, A. A Fully Nonlinear Boussinesq Model in Generalized Curvilinear Coordinates. Coast. Eng. 2001, 42, 337–358. [Google Scholar] [CrossRef]
  41. Lin, Z.; Pokrajac, D.; Guo, Y.; Jeng, D.s.; Tang, T.; Rey, N.; Zheng, J.; Zhang, J. Investigation of Nonlinear Wave-Induced Seabed Response around Mono-Pile Foundation. Coast. Eng. 2017, 121, 197–211. [Google Scholar] [CrossRef]
  42. Duan, L.; Jeng, D.S.; Wang, D. PORO-FSSI-FOAM: Seabed Response around a Mono-Pile under Natural Loadings. Ocean Eng. 2019, 184, 239–254. [Google Scholar] [CrossRef]
  43. Duan, L.; Jeng, D.S.; Wang, S.; Zhu, B. Numerical investigation of the wave/current–induced responses of transient soil around a square mono-pile foundation. J. Coast. Res. 2019, 35, 625–636. [Google Scholar] [CrossRef]
  44. Liang, Z.; Jeng, D.S. The instantaneous seabed liquefaction around offshore pile-type foundation and seabed protection under combined wave and current loading. Ocean Eng. 2022, 257, 111649. [Google Scholar] [CrossRef]
  45. Rafiei, A.; Rahman, M.; Gabr, M. Response and Instability of Sloping Seabed Supporting Small Marine Structures: Wave–Structure–Soil Interaction Analysis. J. Offshore Mech. Arct. Eng. 2022, 144, 032101. [Google Scholar] [CrossRef]
  46. Fan, M.; Lunliang, D.; Jianting, Z.; Zhuang, L.; Duoyin, W. Dynamic response of sloping seabed with buried twin pipelines under wave loading. Ocean Eng. 2024, 305, 117818. [Google Scholar]
  47. Lin, J.; Gao, Y.; Guo, Y.; Liu, J.; Feng, L. Wave-induced sloping seabed residual response around a buried pipeline. Mar. Georesources Geotechnol. 2024, 1–19. [Google Scholar] [CrossRef]
  48. He, K.; Ye, J.; Ma, L.; Fang, B. Seismic performance of revetment breakwater and nearby frame structure on reclaimed coral sand foundation in the SCS: Centrifuge shaking table test. Appl. Ocean Res. 2025, 157, 104512. [Google Scholar] [CrossRef]
  49. Ma, R.; Ji, B.; Zhang, L.; Pan, S.; Hu, K. Probability Stability Evaluation of Coral Reef Limestone Reef Slopes Under Earthquake. J. Mar. Sci. Eng. 2025, 13, 284. [Google Scholar] [CrossRef]
  50. Boussinesq, J. Theorie de l’ecoulement Tourbillant. Mem. Acad. Sci. 1877, 23, 46. [Google Scholar]
  51. Launder, B.E.; Spalding, D.B. The Numerical Computation of Turbulent Flows. In Numerical Prediction of Flow, Heat Transfer, Turbulence and Combustion; Elsevier: Amsterdam, The Netherlands, 1983; pp. 96–116. [Google Scholar]
  52. Matsson, J.E. An Introduction to ANSYS Fluent 2022; SDC Publications: Mission, KS, USA, 2022. [Google Scholar]
  53. Ashgriz, N.; Mostaghimi, J. An introduction to computational fluid dynamics. Fluid Flow Handb. 2002, 1, 1–49. [Google Scholar]
  54. Lee, H.C.; Wahab, A.K.A. Performance of different turbulence models in predicting flow kinematics around an open offshore intake. SN Appl. Sci. 2019, 1, 1266. [Google Scholar] [CrossRef]
  55. Otoo, E.; Asumadu, R.; Boadi, G.K.; Zhang, J.; Boadu, S.; Mattah, P. Numerical investigation of scour around monopile foundation of offshore wind farm. Discov. Appl. Sci. 2024, 6, 11. [Google Scholar] [CrossRef]
  56. Rusche, H. Computational Fluid Dynamics of Dispersed Two-Phase Flows at High Phase Fractions. Ph.D. Thesis, Imperial College London, London, UK, 2003. [Google Scholar]
  57. Brackbill, J.; Kothe, D.; Zemach, C. A Continuum Method for Modeling Surface Tension. J. Comput. Phys. 1992, 100, 335–354. [Google Scholar] [CrossRef]
  58. Vafai, K.; Tien, C. Boundary and Inertia Effects on Flow and Heat Transfer in Porous Media. Int. J. Heat Mass Transf. 1981, 24, 195–203. [Google Scholar] [CrossRef]
  59. Higuera, P. Application of Computational Fluid Dynamics to Wave Action on Structures. Ph.D. Thesis, University of Cantabria, Santander, Spain, 2015. [Google Scholar]
  60. Ye, J.; Jeng, D.; Wang, R.; Zhu, C. Validation of a 2-D Semi-Coupled Numerical Model for Fluid–Structure–Seabed Interaction. J. Fluids Struct. 2013, 42, 333–357. [Google Scholar] [CrossRef]
  61. Liu, X.; García, M.H. Numerical Simulation of sea bed response under waves with coupled solver of Biot consolidation equations and free surface water flow. In Proceedings of the ISOPE Pacific/Asia Offshore Mechanics Symposium, Dalian, China, 17–21 September 2006; ISOPE: Mountain View, CA, USA, 2006; pp. 127–134. [Google Scholar]
  62. Chen, L.; Zang, J.; Hillis, A.; Morgan, G.; Plummer, A. Numerical Investigation of Wave–Structure Interaction Using OpenFOAM. Ocean Eng. 2014, 88, 91–109. [Google Scholar] [CrossRef]
  63. Wang, S.; Wang, P.; Zhai, H.; Zhang, Q.; Chen, L.; Duan, L.; Liu, Y.; Jeng, D.S. Experimental Study for Wave-Induced Pore-Water Pressures in a Porous Seabed around a Mono-Pile. J. Mar. Sci. Eng. 2019, 7, 237. [Google Scholar] [CrossRef]
  64. Moriasi, D.N.; Arnold, J.G.; Van Liew, M.W.; Bingner, R.L.; Harmel, R.D.; Veith, T.L. Model Evaluation Guidelines for Systematic Quantification of Accuracy in Watershed Simulations. Trans. ASABE 2007, 50, 885–900. [Google Scholar] [CrossRef]
  65. Gourlay, M.R.; Colleter, G. Wave-Generated Flow on Coral Reefs—An Analysis for Two-Dimensional Horizontal Reef-Tops with Steep Faces. Coast. Eng. 2005, 52, 353–387. [Google Scholar] [CrossRef]
  66. Massel, S.; Gourlay, M. On the Modelling of Wave Breaking and Set-up on Coral Reefs. Coast. Eng. 2000, 39, 1–27. [Google Scholar] [CrossRef]
  67. Yu, T.; Meng, X.; Li, T.; Guo, Q.; Li, Y. Numerical Simulation of Interaction between Wave-Driven Currents and Revetment on Coral Reefs. Ocean Eng. 2022, 254, 111346. [Google Scholar] [CrossRef]
  68. Yao, Y.; Chen, X.; Xu, C.; Jia, M.; Jiang, C. Numerical Modelling of Wave Transformation and Runup over Rough Fringing Reefs Using VARANS Equations. Appl. Ocean Res. 2022, 118, 102952. [Google Scholar] [CrossRef]
  69. Gourlay, M. Wave Set-up on Coral Reefs. 2. Set-up on Reefs with Various Profiles. Coast. Eng. 1996, 28, 17–55. [Google Scholar] [CrossRef]
  70. Mayorga-Martínez, M.; Bello-Pineda, J.; Perales-Valdivia, H.; Pérez-España, H.; Heyman, W.D. Characterizing Geomorphology of Mesophotic Coral Reef Ecosystems in the Southwestern Gulf of Mexico: Implications for Conservation and Management. Front. Mar. Sci. 2021, 8, 639359. [Google Scholar] [CrossRef]
  71. Xie, W.; Zhang, Q.; Cai, H.; Fu, M. Numerical Investigation on the Interaction between a Tsunami-like Solitary Wave and a Monopile on a Sloping Sandy Seabed. J. Mar. Sci. Eng. 2024, 12, 1421. [Google Scholar] [CrossRef]
  72. Wang, L.; Lai, Y.; Hong, Y.; Mašín, D. A Unified Lateral Soil Reaction Model for Monopiles in Soft Clay Considering Various Length-to-Diameter (L/D) Ratios. Ocean Eng. 2020, 212, 107492. [Google Scholar] [CrossRef]
  73. He, K.; Ye, J. Dynamics of Offshore Wind Turbine-Seabed Foundation under Hydrodynamic and Aerodynamic Loads: A Coupled Numerical Way. Renew. Energy 2023, 202, 453–469. [Google Scholar] [CrossRef]
  74. Huang, L.; Ren, K.; Li, M.; Tuković, Ž.; Cardiff, P.; Thomas, G. Fluid-Structure Interaction of a Large Ice Sheet in Waves. Ocean Eng. 2019, 182, 102–111. [Google Scholar] [CrossRef]
  75. Zhao, H.; Liang, Z.; Jeng, D.S.; Zhu, J.; Guo, Z.; Chen, W. Numerical Investigation of Dynamic Soil Response around a Submerged Rubble Mound Breakwater. Ocean Eng. 2018, 156, 406–423. [Google Scholar] [CrossRef]
  76. Li, Z.; Zhang, Z.; Tai, P.; Shen, P.; Li, J. Investigation of Morphological Effects on Crushing Characteristics of Calcareous Sand Particle by 3D Image Analysis with Spherical Harmonics. Powder Technol. 2024, 433, 119204. [Google Scholar] [CrossRef]
  77. Ye, J.; Jeng, D.; Chan, A.H.C. Consolidation and Dynamics of 3D Unsaturated Porous Seabed under Rigid Caisson Breakwater Loaded by Hydrostatic Pressure and Wave. Sci. China Technol. Sci. 2012, 55, 2362–2376. [Google Scholar] [CrossRef]
Figure 1. Boundary conditions for numerical domain.
Water 17 01621 g001
Figure 2. Computinonal process in one time step. red arrows represent the data exchange between the different models.
Water 17 01621 g002
Figure 3. Wave surface profile verification of wave–pile interaction [62]. (a) surface elevation at wave gauge 1; (b) surface elevation at wave gauge 9.
Water 17 01621 g003
Figure 4. Pore pressure validation of wave–seabed–pile interaction [63]. (a) pore pressure at pressure gauge 12; (b) pore pressure at pressure gauge 22.
Water 17 01621 g004
Figure 5. Geometric diagram of numerical computation. (The four red points represent observation points around the pile, used to record the water surface elevation and the cross-sectional profile of the seabed along the depth.)
Water 17 01621 g005
Figure 6. Mesh configuration used in numerical computation (visualized with coarsened mesh): (a) wave region; (b) seabed and pile region.
Water 17 01621 g006
Figure 7. Mesh sensitivity analysis based on pore pressure amplitude at a point located 2 m below the seabed surface along the vertical cross-section at point A in front of the pile.
Water 17 01621 g007
Figure 8. Effect of the pile on the consolidation behavior of flat and sloping seabed. (a) vertical displacement in the flat seabed; (b) vertical displacement in the sloping seabed; (c) vertical effective stress in the flat seabed; (d) vertical effective stress in the sloping seabed; (e) pore pressure in the flat seabed; (f) pore pressure in the sloping seabed.
Water 17 01621 g008
Figure 9. Water level around the pile at four characteristic points (points A–D; see Section 3.1 for their locations).
Water 17 01621 g009
Figure 10. The displacement and pore pressure of the sloping seabed around the pile. (ac) correspond to the moments when the wave crest passed over the pile, while (df) correspond to the moments when the wave trough passed over the pile.
Water 17 01621 g010
Figure 11. The displacement and pore pressure of the flat seabed around the pile. (ac) correspond to the moments when the wave crest passed over the pile, while (df) correspond to the moments when the wave trough passed over the pile.
Water 17 01621 g011
Figure 12. The distribution of effective stress in the sloping seabed around the pile at the moment of wave trough. (a) effective stress in the x-direction; (b) effective stress in the y-direction; (c) effective stress in the z-direction.
Water 17 01621 g012
Figure 13. The distribution of effective stress in the flat seabed around the pile at the moment of wave trough. (a) effective stress in the x-direction; (b) effective stress in the y-direction; (c) effective stress in the z-direction.
Water 17 01621 g013
Figure 14. The seepage force in the z-direction was at the wave trough.
Water 17 01621 g014
Figure 15. The liquefaction development process around the pile. (a) t = 0; (b) t = T/4; (c) t = T/2.
Water 17 01621 g015
Figure 16. Distribution of water surface amplitude for different slope gradients.
Water 17 01621 g016
Figure 17. Distribution of maximum wave force on pile for different slope gradient.
Water 17 01621 g017
Figure 18. Distribution of σ x for different slopes: (a) along the z-direction at point A; (b) along the z-direction at point B; (c) along the z-direction at point C; (d) along the z-direction at point D.
Water 17 01621 g018
Figure 19. Distribution of σ y for different slopes: (a) along the z-direction at point A; (b) along the z-direction at point B; (c) along the z-direction at point C; (d) along the z-direction at point D.
Water 17 01621 g019
Figure 20. Distribution of σ z for different slopes: (a) along the z-direction at point A; (b) along the z-direction at point B; (c) along the z-direction at point C; (d) along the z-direction at point D.
Water 17 01621 g020
Figure 21. Distribution of p s for different slopes: (a) along the z-direction at point A; (b) along the z-direction at point B; (c) along the z-direction at point C; (d) along the z-direction at point D.
Water 17 01621 g021
Figure 22. The maximum liquefaction depth around the pile for different slopes. (a) slope is 1:20; (b) slope is 1:10; (c) slope is 1:5; (d) slope is 1:2.5.
Water 17 01621 g022
Figure 23. Distribution of water surface amplitude for different wave heights.
Water 17 01621 g023
Figure 24. Distribution of maximum wave force on pile for different wave heights.
Water 17 01621 g024
Figure 25. Distribution of σ x for different wave heights: (a) along the z-direction at point A; (b) along the z-direction at point B; (c) along the z-direction at point C; (d) along the z-direction at point D.
Water 17 01621 g025
Figure 26. Distribution of σ y for different wave heights: (a) along the z-direction at point A; (b) along the z-direction at point B; (c) along the z-direction at point C; (d) along the z-direction at point D.
Water 17 01621 g026
Figure 27. Distribution of σ z for different wave heights: (a) along the z-direction at point A; (b) along the z-direction at point B; (c) along the z-direction at point C; (d) along the z-direction at point D.
Water 17 01621 g027
Figure 28. Distribution of p s for different wave heights: (a) along the z-direction at point A; (b) along the z-direction at point B; (c) along the z-direction at point C; (d) along the z-direction at point D.
Water 17 01621 g028
Figure 29. The maximum liquefaction depth around the pile for different wave heights. (a) H = 1 m; (b) H = 2 m; (c) H = 3 m; (d) H = 4 m.
Water 17 01621 g029
Figure 30. Distribution of water surface amplitude for different current velocities.
Water 17 01621 g030
Figure 31. Distribution of maximum wave force on pile for different current velocities.
Water 17 01621 g031
Figure 32. Distribution of σ x for different current velocities: (a) along the z-direction at point A; (b) along the z-direction at point B; (c) along the z-direction at point C; (d) along the z-direction at point D.
Water 17 01621 g032
Figure 33. Distribution of σ y for different current velocities: (a) along the z-direction at point A; (b) along the z-direction at point B; (c) along the z-direction at point C; (d) along the z-direction at point D.
Water 17 01621 g033
Figure 34. Distribution of σ z for different current velocities: (a) along the z-direction at point A; (b) along the z-direction at point B; (c) along the z-direction at point C; (d) along the z-direction at point D.
Water 17 01621 g034
Figure 35. Distribution of p s for different current velocities: (a) along the z-direction at point A; (b) along the z-direction at point B; (c) along the z-direction at point C; (d) along the z-direction at point D.
Water 17 01621 g035
Figure 36. The maximum liquefaction depth around the pile for different current velocities. (a) U c = 0 m/s; (b) U c = 0.5 m/s; (c) U c = 1 m/s; (d) U c = 1.5 m/s; (e) U c = 2 m/s.
Water 17 01621 g036
Table 1. General performance ratings for model evaluation [64].
Performance RatingNSERSR
Very Good0.75–1.000.00–0.50
Good0.65–0.750.50–0.60
Satisfactory0.50–0.650.60–0.70
Unsatisfactory<0.50>0.70
Table 2. Geometric parameters of computational domain.
ParameterSymbolUnitValue
pile diameter d p m5
water depth d w m20
air height h a m10
seabed thickness d s m20
seabed slope height h s m15
seabed slope gradients-1:20∼1:2.5
off-seabed floor length l 1 m200
seabed slope length l 2 m h s / s
flat seabed length l 3 m100
distance of pile from front of slope l p m l 2 / 2
Table 3. Model input parameters.
ModelParametersSymbolUnitValue
wavewave heightHm3
wave periodTs6
current velocity U c m/s0∼2
seabedshear modulus G s Pa 5.8 × 10 6
permeability k s m/s 2.3 × 10 4
particle density ρ s kg/m32679
porosityn-0.448
saturation S r -0.99
pileshear modulus G p Pa 1.0 × 10 10
particle density ρ p kg/m34070
Disclaimer/Publisher’s Note: The statements, opinions and data contained in all publications are solely those of the individual author(s) and contributor(s) and not of MDPI and/or the editor(s). MDPI and/or the editor(s) disclaim responsibility for any injury to people or property resulting from any ideas, methods, instructions or products referred to in the content.