Article

CFD Investigation of Spray and Water Curtain Systems in Mine Ventilation: Airflow Paths, Velocity Variations, and Influence Patterns

1
Research Institute of Aero-Engine, Beihang University, Beijing 100191, China
2
Ecole Centrale de Pékin, Beihang University, Beijing 100191, China
*
Author to whom correspondence should be addressed.
Water 2025, 17(11), 1600; https://doi.org/10.3390/w17111600
Submission received: 20 March 2025 / Revised: 22 May 2025 / Accepted: 22 May 2025 / Published: 25 May 2025
(This article belongs to the Special Issue Hydraulics and Hydrodynamics in Fluid Machinery, 2nd Edition)

Abstract

:
This study reports a CFD investigation of spray-based dust suppression strategies in mining tunnels, focusing on the dynamic operation of roadheaders, onboard spraying systems, and water curtains. The simulations assess how these systems affect airflow patterns, velocity distributions, and pressure variations under various operating conditions. The results indicate that cutterhead sprays produce conical dispersion patterns directed toward the rear of the tunnel under forced ventilation, while transfer point sprays establish localized zones of extended residence time, with stable droplet distributions achieved in 3.5 s. Spray activation markedly increases local air velocity, with peak values near the cutterhead rising from 0.88 m/s to 32.29 m/s. Meanwhile, water curtains, modeled as porous media, induce stepwise pressure drops from 186.89 Pa to 91.15 Pa. These findings underscore the distinct effects of spraying and water curtain systems on tunnel ventilation and offer valuable insights for the design and optimization of airflow control and dust suppression in underground mining environments.

1. Introduction

Underground mining and tunneling operations generate substantial amounts of dust, which is exacerbated by increasing mechanization. Consequently, dust pollution has become increasingly severe, posing significant threats to the health and safety of miners. High dust concentrations not only lead to occupational diseases such as pneumoconiosis but also have the potential to trigger gas explosions [1]. Therefore, effective dust control in underground mining and tunneling is a critical issue in occupational safety management. At present, water mist suppression and water curtain isolation technologies are extensively employed, demonstrating effectiveness in dust capture and controlling airflow dispersion to a certain level [2]. Nevertheless, several practical challenges remain unresolved. These include substantial dust re-entering mine ventilation ducts due to high moisture content in coal seams, deformation and shrinkage of roadway roof panels, unreliable operation of fixed water curtain installations, and limited coverage and insufficient long-term stability when employing a single water curtain system. Furthermore, the impacts of nozzle type, nozzle placement, and various water mist parameters on the airflow field in the tunnel remain inadequately understood.
Wang et al. [3] conducted research on the dust suppression effectiveness of air-assisted spray devices in roadheaders using ANSYS Fluent 2025 R1. They found that the average dust removal efficiencies for total dust and respirable dust reached 61.39% and 43.19%, respectively. Chang et al. [4] studied the impact of nozzle placement and spray duration on dust suppression performance through CFD (computational fluid dynamics) simulations and wind tunnel experiments, concluding that both factors significantly influenced the effectiveness. Furthermore, their research indicated that surfactant addition could further enhance suppression performance. Lu et al. [5] conducted numerical simulations combined with experimental research on water mist particle size distribution under varying wind speed conditions. Their results showed that increasing spray pressure and nozzle velocity led to a decrease in droplet size, while the dust removal efficiency first decreased and then increased with increasing solution concentration. Wang et al. [6] developed an analytical scaling law model for short-time dust emission from belt conveyors, deriving a piecewise mean velocity expression for dust particles. Zhang et al. [7] developed a wet–dry combined dust removal device based on CFD modeling and experimental validation, successfully reducing the respirable dust concentration to 0.179–0.250 mg/m3 with the field dust removal efficiency reaching 90.25%. Guo et al. [8] optimized parameters for an external spray dust removal system in continuous coal mining tunnels using CFD modeling and experimental methods, effectively lowering respirable dust concentrations to 6.2–10.1 mg/m3, with on-site dust suppression efficiencies exceeded 90%. Wang et al. [9] used multi-factor CFD simulations to optimize dust suppression in tunnel excavation. Integrating spray systems and water curtains, they achieved up to 80.4% dust reduction, validated by on-site experiments. Nie et al. [10] employed CFD modeling and orthogonal experimental methods to optimize nozzle types and arrangements, determining optimal parameters such as a spray pressure of 6 MPa, a 25° front spray angle, and a 15° rear spray angle. These parameters reduced the dust concentration to 39.3 mg/m3, achieving a suppression efficiency of up to 89.74%. Peng et al. [11] used CFD simulations combined with experiments to investigate the efficiency of pneumatic atomization nozzles for respirable dust suppression. They discovered that at a spray pressure of 0.4 MPa, the suppression efficiency could reach 92.07%, attributing this effectiveness to improved coverage of the spray field. Ma et al. [12] demonstrated through numerical simulations and spray experiments that using a 2.4 mm nozzle under 8 MPa pressure could effectively reduce the dust concentration to 87.21 mg/m3 at the coal cutter operator position, with 90.33% dust suppression efficiency. Wang et al. [13] investigated the impact of water curtains on fluid (smoke and heat) distribution in tunnel fires, validated their smoke/heat blocking effectiveness through momentum ratio optimization and numerical simulations. Nie et al. [14] studied coal dust dispersion in large-scale mining and found that high-concentration dust formed 40–60 m downwind of the front drum. Their proposed wet dust suppression technology reduced dust concentrations by 73–82%. Wang et al. [15] investigated the fluid-regulating effect of water curtains on vapor dispersion, validating through full-scale experiments and CFD simulations the velocity changes upstream/downstream of curtains and their effectiveness in suppressing vapor spread.
The aforementioned studies have provided valuable insights into the performance of water mist and water curtain dust suppression technologies, primarily emphasizing improvements in dust removal efficiency. However, they have not adequately addressed how these dust suppression measures influence the airflow fields within tunnels, nor thoroughly clarified the underlying interaction mechanisms between airflow and suppression parameters, such as nozzle configuration, positioning, and spray characteristics. Consequently, there remains insufficient theoretical guidance to inform the optimal design and application of dust suppression systems in dynamic mining environments. Therefore, this study systematically investigates the impact of onboard spray systems, transfer point sprays, and water curtains on the airflow path, velocity distribution, and airflow stability within mining tunnels. Through detailed CFD modeling and analysis, this research elucidates the mechanisms through which dust suppression measures interact with tunnel airflow, providing robust theoretical support for the optimization of ventilation systems and the enhancement of working environments in underground mining operations.
The remainder of this paper is organized into four main sections. Section 2 introduces the mathematical model underpinning the CFD simulations, detailing the turbulence modeling approach and the representation of spray droplets and water curtains. Section 3 describes the case under investigation, covering the mine tunnel geometry, the computational mesh, and the boundary conditions and simulation parameters employed. Section 4 presents the results and discussion, highlighting the airflow patterns, velocity distributions, and pressure variations observed in the tunnel with and without spray and water curtain systems in operation.

2. Mathematical Model

2.1. Turbulence Model

The Navier–Stokes equations, which govern fluid flow, can be simplified using the Reynolds-averaged approach (RANS). This method decomposes the instantaneous velocity u i into its mean component u i and fluctuating part u i . Time averaging the governing equations yields the following non-conservative forms of the continuity and momentum equations for an incompressible, viscous, Newtonian fluid:
u ¯ i x i = 0 ,
u ¯ i t + u ¯ j u ¯ i x j = 1 ρ p ¯ x i + x j v u ¯ i x j u i u j ¯ + f i ¯ ,
where i , j = 1,2 , 3 ; ρ is the air density; u ¯ i is the time-averaged air velocity; p ¯ is the time-averaged pressure; t is the time; ν is the kinematic viscosity; f i is the body force. u i u j ¯ is the Reynolds stress components, and f ¯ i is the time-averaged body force.
The Reynolds stress term u i u j ¯ is modeled according to Boussinesq’s eddy viscosity hypothesis:
u i u j ¯ = ν t u ¯ i x j + u ¯ j x i + 2 3 k δ i j ,
where ν t is the kinematic eddy viscosity, k is the turbulent kinetic energy, and δ i j is the Kronecker delta. In the present study, we adopted Menter’s Shear Stress Transport (SST) kω model, which combines the robustness of the kω model in near-wall regions with the freestream independence of the kε model in the far field [16,17]. This hybrid model is well suited for capturing rotating flows and complex flow separation phenomena, resulting in more accurate and stable simulations. The governing equations of SST k-ω model describe
ν t = a 1 k m a x a 1 ω , S F 2 ,
which defines the kinematic eddy viscosity, and
k t + u ¯ i k x i = P k β * k ω + x i ν + σ k ν t k x i ,
for the turbulence kinetic energy, and
ω t + u ¯ i ω x i = α S 2 β ω 2 + x i ν + σ ω ν t ω x i + 2 1 F 1 σ ω 2 ω k x i ω x i ,
for the specific dissipation rate [17], where ν t is the kinematic eddy viscosity, k is the turbulence kinetic energy, ω is the specific dissipation rate, P k is the turbulence production term, S is the invariant measure of the mean strain rate, and F 1 , F 2 are blending functions. Each of the constants is a blend of an inner 1 and outer 2 constant, blended via
ϕ = F 1 ϕ 1 + 1 F 1 ϕ 2 .
The closure coefficients and auxiliary relations [16] are defined as follows:
F 1 = tanh min max k β * ω y , 500 ν y 2 ω , 4 σ ω 2 k C D k ω y 2 4 , F 2 = tanh max 2 k β * ω y , 500 ν y 2 ω 2 ,
P k = min u i u j ¯ ρ u i x j , 10 β * k ω , C D k ω = max 2 ρ σ ω 2 1 ω k x i ω x i , 10 20 , α 1 = 5 9 , α 2 = 0.44 , β 1 = 0.075 , β 2 = 0.0828 , β * = 0.09 , σ k 1 = 0.85 , σ k 2 = 1 , σ ω 1 = 0.5 , and σ ω 2 = 0.856 .
In the context of the current study, the rotational airflow induced by the roadheader cutterhead was considered. To improve the accuracy of the simulations, the wet scrubber, tunnel complexity, curvature correction, and corner flow correction were incorporated. The curvature correction modifies the turbulence production term, enhancing the model’s sensitivity to the effects of streamline curvature and system rotation, thus preventing unphysical phenomena that may arise from underestimating turbulent viscosity [18]. Eddy viscosity models, however, often fail to capture secondary flows of the second kind, as they do not account for the anisotropy of normal stresses. The corner flow correction, on the other hand, facilitates the accurate simulation of secondary flows in rectangular channels, non-circular pipes, and other complex geometries.

2.2. Air–Droplet Coupling Model

In mining engineering, the motion of spray droplets is generally captured using a Lagrangian framework, where the fluid forces acting on each droplet are integrated over time to trace their trajectories. Ansys Fluent provides this capability through its DPM module, which can accommodate various particle–fluid interactions. Given that the volume fraction of the droplets remains below 12%, they are treated as non-rotating point masses, and interactions such as friction and collisions between droplets are neglected. Droplets can be considered as heavy particles [19,20], governed by
m p d u p d t = m p u u p τ r + F 0 + m p g ρ p ρ ρ p + F s + F m ,
where m p is the droplet mass; u is the instantaneous fluid velocity; u p is the droplet velocity; ρ and ρ p represent the fluid and droplet densities, respectively; F 0 = m p u τ r accounts for turbulent dispersion via a discrete random walk model [6]; g denotes gravitational acceleration; F s represents Saffman’s lift force [21]; F m is the Magnus lift force [22]; and m p u u p τ r is the drag force. The particle relaxation time τ r [23,24] is defined by
τ r = ρ p d p 2 18 μ 24 C d R e ,
where μ is the air molecular viscosity, d p is the droplet diameter, R e ρ d p u p u μ denotes the relative Reynolds number, and C d is the drag coefficient for smooth spherical droplets. As suggested by Morsi and Alexander [25], C d can be written as C d = a 1 + a 2 R e + a 3 R e 2 , where a 1 , a 2 , and a 3 are constants valid over various Re ranges.

2.3. Water Curtain Porous Medium Model

In this study, the water curtain in the mine tunnel is modeled as a porous medium to capture its resistance to airflow because it consists of a mesh onto which water is sprayed to enhance dust adhesion. The primary focus is on the air resistance generated by the water curtain, and the space occupied by the water curtain is treated as a porous region. This approach is based on the Superficial Velocity Porous Formulation, which is commonly used in computational fluid dynamics to model the effects of porous media on fluid flow [26]. The velocity within the porous zone is assumed to remain the same as that outside the porous region; however, the presence of the water curtain creates resistance to the airflow. This resistance is modeled through the addition of a source term to the standard momentum equations, which accounts for both viscous and inertial losses within the porous medium. The source term is given by
S i = j = 1 3   D i j μ v j + j = 1 3   C i j 1 2 ρ v j v j ,
where S i represents the source term in the momentum equation for the i -th direction; v is the magnitude of the velocity; and D i j and C i j are matrices that represent the viscous and inertial resistance coefficients, respectively. This source term accounts for the pressure drop across the porous region, which is proportional to the fluid velocity in the cell. For homogeneous porous media, the source term can be simplified as follows:
S i = μ α v i + C 2 1 2 ρ v i v i ,
where α is the permeability of the porous medium, and C 2 is the inertial resistance factor. This simplified model is appropriate for representing the air resistance caused by the water curtain, treating it as a homogeneous porous medium. By adjusting the permeability α and the inertial resistance factor C 2 , the model can accurately simulate the impact of the water curtain on the airflow within the tunnel. In the absence of direct experimental measurements for our water curtain, we have drawn upon the work of Tew and Gorgun [27,28]. Specifically, the model incorporates a permeability of 1.2 × 10⁻⁶ m−2 and an inertial resistance of 150 m−1 in the flow direction.

2.4. Pressure-Swirl Atomizer Model

The Linearized Instability Sheet Atomization model, proposed by Schmidt et al. [29] and improved in ANSYS Fluent, is employed. Centrifugal motion within the injector generates an air core enveloped by a liquid film. The film thickness t at the injector exit is related to the mass flow rate, as follows:
m eff ˙ = π ρ u t d inj t ,
where d inj is the nozzle exit diameter; m eff ˙ is the effective mass flow rate; and u is the axial velocity at the nozzle exit. These quantities are determined based on the internal structure of the nozzle, which is difficult to calculate from basic principles. Assuming the total velocity is related to the nozzle exit pressure, the following equation is obtained:
U = k v 2 Δ p ρ l ,
where k v is the velocity coefficient and determined by
k v = max 0.7 , 4 m eff ˙ π d inj 2 ρ l cos θ ρ l 2 Δ p .
Given Δ p , Equation (13) yields U , from which the axial velocity component u = U cos θ and film thickness t are determined. The tangential velocity component w = U sin θ is equal to the radial velocity of the liquid sheet downstream, while the axial velocity remains invariant post-exit.
The pressure-swirl atomizer model incorporates gas–phase interactions, liquid viscosity, and surface tension effects on liquid sheet breakup, as detailed by Senecal et al. [30]. A simplified theoretical framework is outlined below. The model assumes a two-dimensional, incompressible liquid sheet of thickness 2 h propagating at velocity U through a stationary inviscid gas medium. The liquid and gas densities are denoted as ρ l and ρ g , respectively, with liquid viscosity μ l . A coordinate system moving with the sheet is adopted, and infinitesimal disturbances of the form η = η 0 e i k x + i ω t are imposed on the steady flow. Here, η 0 is the initial wave amplitude, k is the wave number, and ω = ω r + i ω i is the complex growth rate. The dominant instability corresponds to the maximum ω r , denoted as Ω , governing sheet disintegration. By adopting the sinuous mode (in-phase interface oscillations) in boundary condition analyses, the corresponding dispersion relationship can be formulated as follows:
ω 2 tanh k h + Q + 4 ν l k 2 tanh k h + 2 i Q k U = 0 ,
and
4 ν l k 4 tanh k h 4 ν l 2 k 3 l tanh l h Q U r 2 k 2 + σ k 3 ρ l = 0 ,
where Q = ρ g / ρ l and l = k 2 + ω / ν l . Above the critical Weber number W e g = 27 / 16 , short-wavelength instabilities dominate, while long wavelengths prevail below this threshold. High-pressure fuel injection systems typically exceed W e g , favoring short-wave regimes. Neglecting higher-order viscous terms via order-of-magnitude analysis simplifies Equation (16) to
ω r = 1 tanh k h + Q { 2 ν l k 2 tanh k h + 4 ν l 2 k 4 tanh k h Q 2 U 2 k 2 tanh k h + Q } .
For long wavelengths, sheet breakup initiates when disturbances reach the critical amplitude η b , yielding breakup time τ = 1 Ω ln η b η 0 , where Ω is obtained by numerically maximizing ω r k . The breakup length L b = U determines ligament formation. The empirical constant ln η b / η 0 = 12 , derived theoretically for liquid jets [31], aligns with experimental data across We = 2–200 [32]. Ligament diameter d L is determined via mass balance. For long waves, d L = 8 h K s , where K s is the wave number at Ω . Sheet thickness h end evolves radially as h end = r 0 h 0 r 0 + L b sin θ / 2 . For short waves, d L scales linearly with wavelength as d L = 2 π C L K s , C L = 0.5 . Droplet formation follows Weber’s capillary instability analysis:
d 0 = 1.88 d L 1 + 30 O h 1 / 6 ,
where O h is the Ohnesorge number. The resultant d 0 defines the most probable size in a Rosin–Rammler distribution with a spread parameter of 3.5 and a dispersion angle of 7°.

2.5. Rotating Cutterhead

In tunnel excavation, the cutterhead is treated as a rigid body in rotary motion, which cannot be represented by the stationary mathematical model but instead requires the sliding mesh model (SMM) [33]. The SMM is a particular instance of the general dynamic mesh motion, where nodes move rigidly within a specified dynamic mesh zone. The stationary and rotary cell zones are linked through nonconformal interfaces, with the mesh motion updating these interfaces to reflect their new positions. For the dynamic meshes around the rotating cutterhead, the conservation equation for a general scalar ϕ on an arbitrary control volume V at the motion boundary is expressed as follows:
V   ρ φ u u g d A + d d t V   ρ φ d V = S φ   S φ d V + V   Γ φ d A ,
where ρ f represents the fluid density, u is the air velocity vector, u g is the moving mesh velocity, S φ is the source term of ϕ , and Γ is the diffusion coefficient.
Since the cutterhead mesh motion is rigid in the sliding mesh formulation, all cells maintain their original volume and shape. The time derivative term can be written as follows:
d d t V   ρ φ d V = ( ρ φ ) n + 1 ( ρ φ ) n Δ t V .
To ensure conservation of mass, the time derivative of the control volume is calculated from
d V d t = V   u g d A = j   A j u g , j = 0 ,
where d V / d t is the volume time derivative of the control volume; k represents the number of faces on the control volume; A j is the area vector for the j -th face, and the dot product A j u g , j on each control volume face is given by
A j u g , j = δ V j Δ t ,
where δ V j is the volume swept out by the control volume face j over the time step Δ t . The time derivative is computed from
d d t V   ρ φ d V = ( ρ φ ) n 1 4 ( ρ φ ) n + 3 ( ρ φ ) n + 1 2 Δ t V ,
where n 1 , n , and n + 1 refer to the quantities at successive time levels, with n + 1 representing the current time step.
In the second-order difference scheme, the volume time derivative of the control volume is calculated in the same manner as the first-order difference scheme. For the second order difference scheme, the dot product A j u g , where j is each control volume face, is expressed as follows:
u g , j A j n + 1 = 3 2 u g , j A j n 1 2 u g , j A j n 1 = 3 2 δ V j Δ t n 1 2 δ V j Δ t n 1 ,
where δ V j n and δ V j n 1 represent the volumes swept out by control volume faces at the previous and current time levels over a time step [26].

3. Case Description

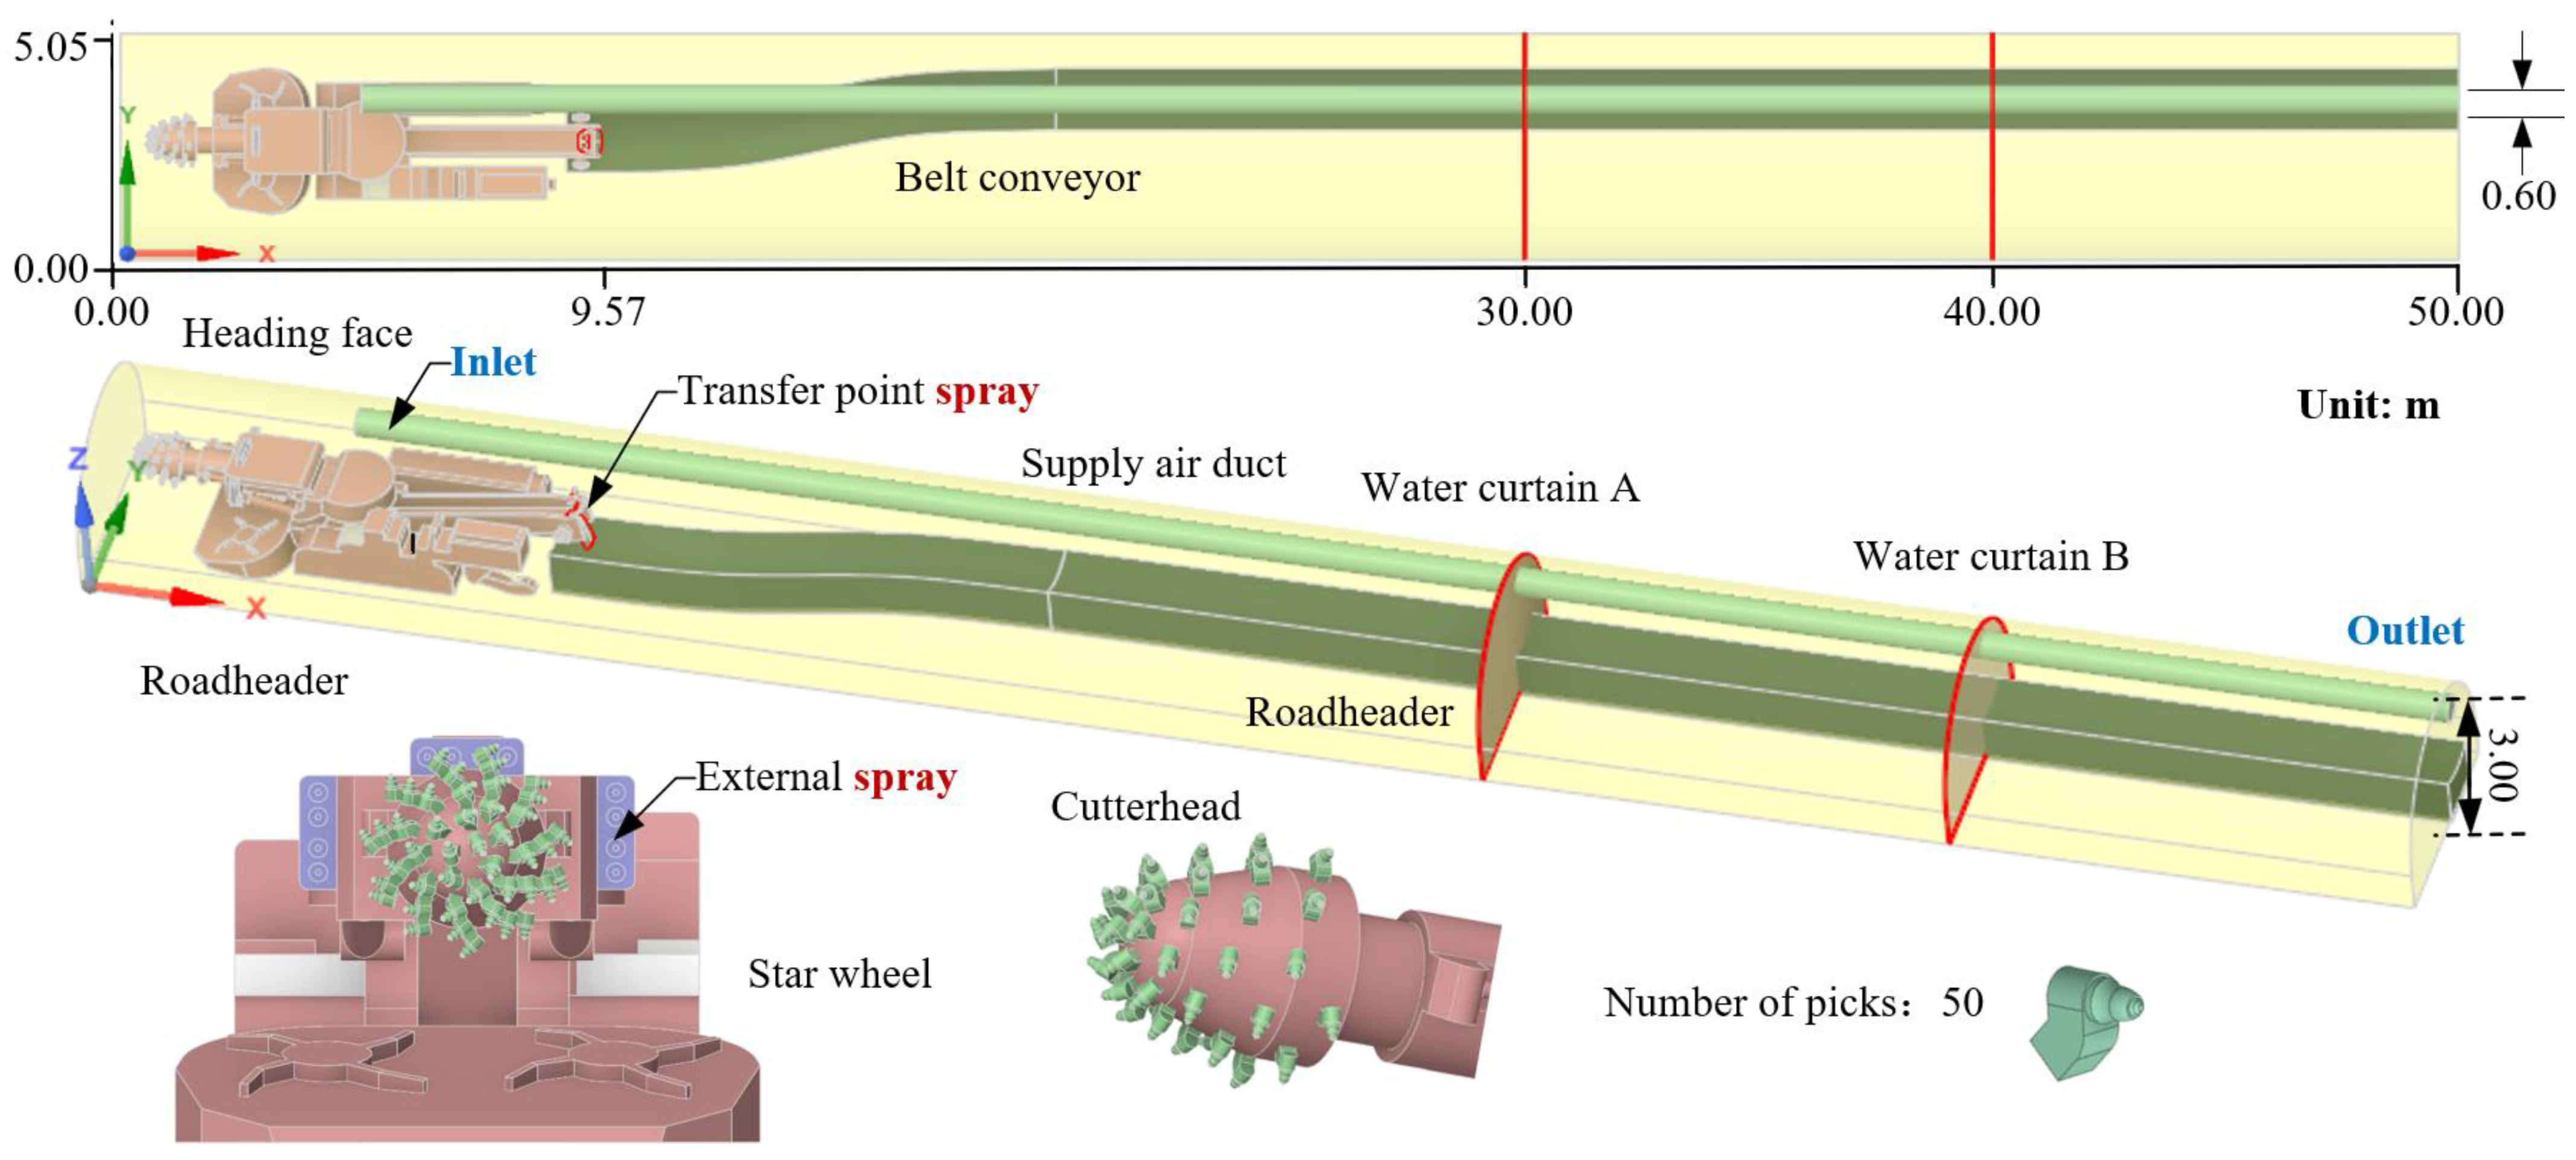
3.1. Geometric Model
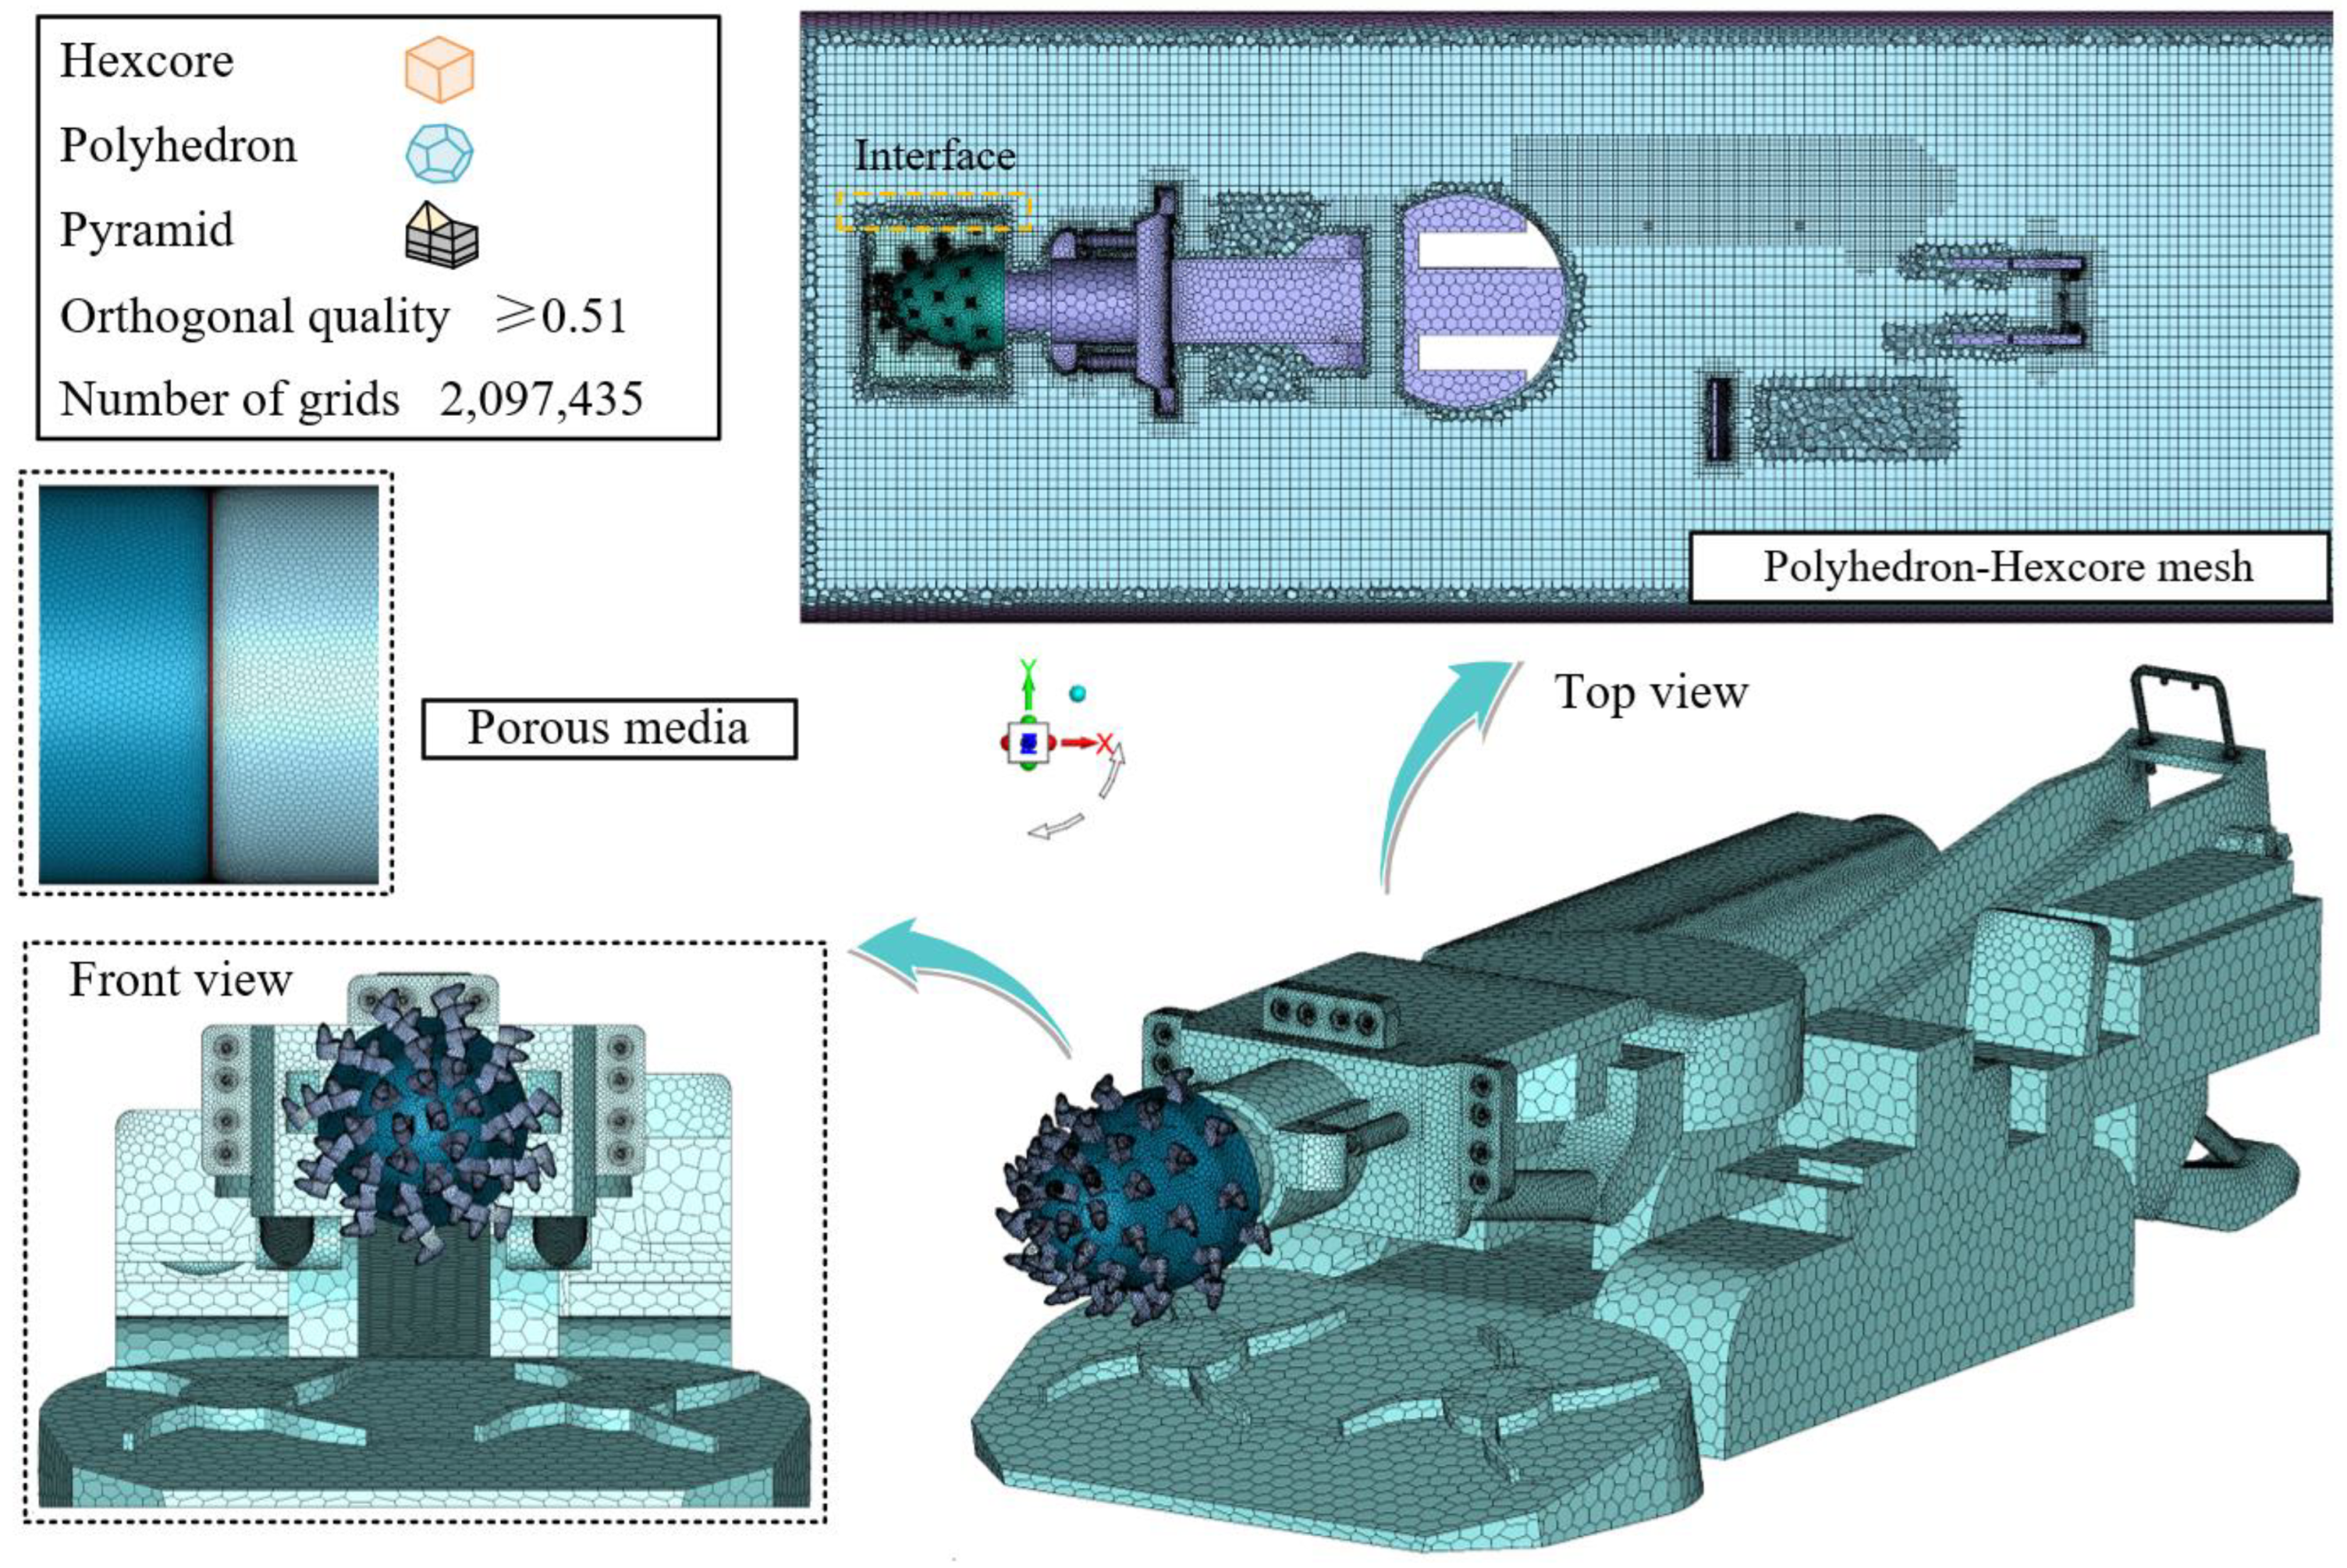
The coal mine tunnel is located in northeastern China with a cross-sectional area of 13.59 m2 and measures about 5.05 m in width by 3.3 m in height, supported by 29U retractable metal arch frames, as shown in Figure 1. Excavation is performed at the heading face using an EBZ-160F roadheader (Shijiazhuang Coal Mining Machinery Co., Ltd., Shijiazhuang, China), which features a cutterhead equipped with 50 picks and a star wheel for coal gathering. The cutterhead operates at 47.8 rpm to shear through the coal seam, with a complete belt conveyor system. A forced ventilation setup is employed, consisting of a localized fan connected to a 0.6 m diameter supply air duct designed to supply an airflow of 366.0 m3/min. To further manage dust levels, water curtains (labelled A and B) are installed at distances of 30 m and 40 m from the heading face, respectively.

3.2. Mesh Details

A Polyhedron-Hexcore mesh was employed in this study, combining polyhedral cells near boundaries with hexahedral cells in the primary flow regions, and using pyramidal cells for smooth transitions. This hybrid approach provides the adaptability of polyhedral elements alongside the accuracy and efficiency of hexahedral grids, making it well suited for large-scale simulations. As shown in Figure 2, the final mesh consists of 2,097,435 cells with a minimum orthogonal quality above 0.51. The water curtains were treated as porous media to capture their impact on airflow. Local mesh refinement was carried out around critical areas—including the rotating cutterhead (fitted with 50 picks), the main body of the roadheader, and zones exhibiting substantial flow variations—to accurately represent complex geometries. By increasing mesh density in these regions, the model achieves higher simulation fidelity and detailed flow characterization. To handle the rotating cutterhead domain, an interface was established between the rotational and static zones, ensuring accurate data exchange and seamless integration across fluid regions. This setup strikes a balance between precision and computational efficiency, allowing the mesh to represent intricate equipment features while maintaining manageable memory requirements.

3.3. Boundary Conditions

Table 1 provides an overview of the primary simulation parameters. A k–ω SST turbulence model was adopted under transient conditions, with a production limiter enabled to prevent over-prediction of turbulence. Y+ intensive near-wall treatment was applied to accurately capture boundary layer flows. The outflow from the supply air duct was designated as the inlet, and the tunnel exit served as the outlet. Water droplets were injected via a pressure-swirl atomizer, and “escape” boundary conditions ensured that droplets dissolved upon contacting the walls. This setup reflects realistic dust control measures within the tunnel. Additionally, the rotating cutterhead at 47.8 rpm was simulated using a sliding mesh approach, allowing the transient solver to capture the cutterhead’s real motion and its impact on the flow field.

3.4. Solver and Numerical Details

All simulations were performed using the coupled pressure–velocity solver with the Rhie–Chow momentum flux formulation. Spatial derivatives were computed using the least squares cell-based gradient approach; pressure interpolation was achieved via the PRESTO! scheme [26]; and the transport equations for momentum, turbulent kinetic energy and specific dissipation rate were discretized using the third-order MUSCL scheme, a monotone upstream-centered method that employs limited slope extrapolation to cell interfaces, thereby attaining third-order spatial accuracy while minimizing numerical diffusion and suppressing non-physical oscillations in regions of steep gradients. Temporal discretization was conducted using the bounded second-order implicit scheme, chosen for its numerical stability and accuracy in transient flow simulations. Relaxation factors were generally set to default values, with occasional minor adjustments made to facilitate convergence. The physical time-step size was carefully determined based on local flow characteristics and stability considerations. Parallel computations were carried out using 96 cores on an AMD EPYC 9474F dual CPU workstation equipped with 384 GB of RAM, substantially reducing computational time and efficiently managing large and complex mesh configurations. The flow-field simulation without droplet release required approximately 24 h to reach a stable state, and the droplet release simulation over 3.5 s required approximately 96 h of computation. The setting details are listed in Table 2.

4. Results and Discussion

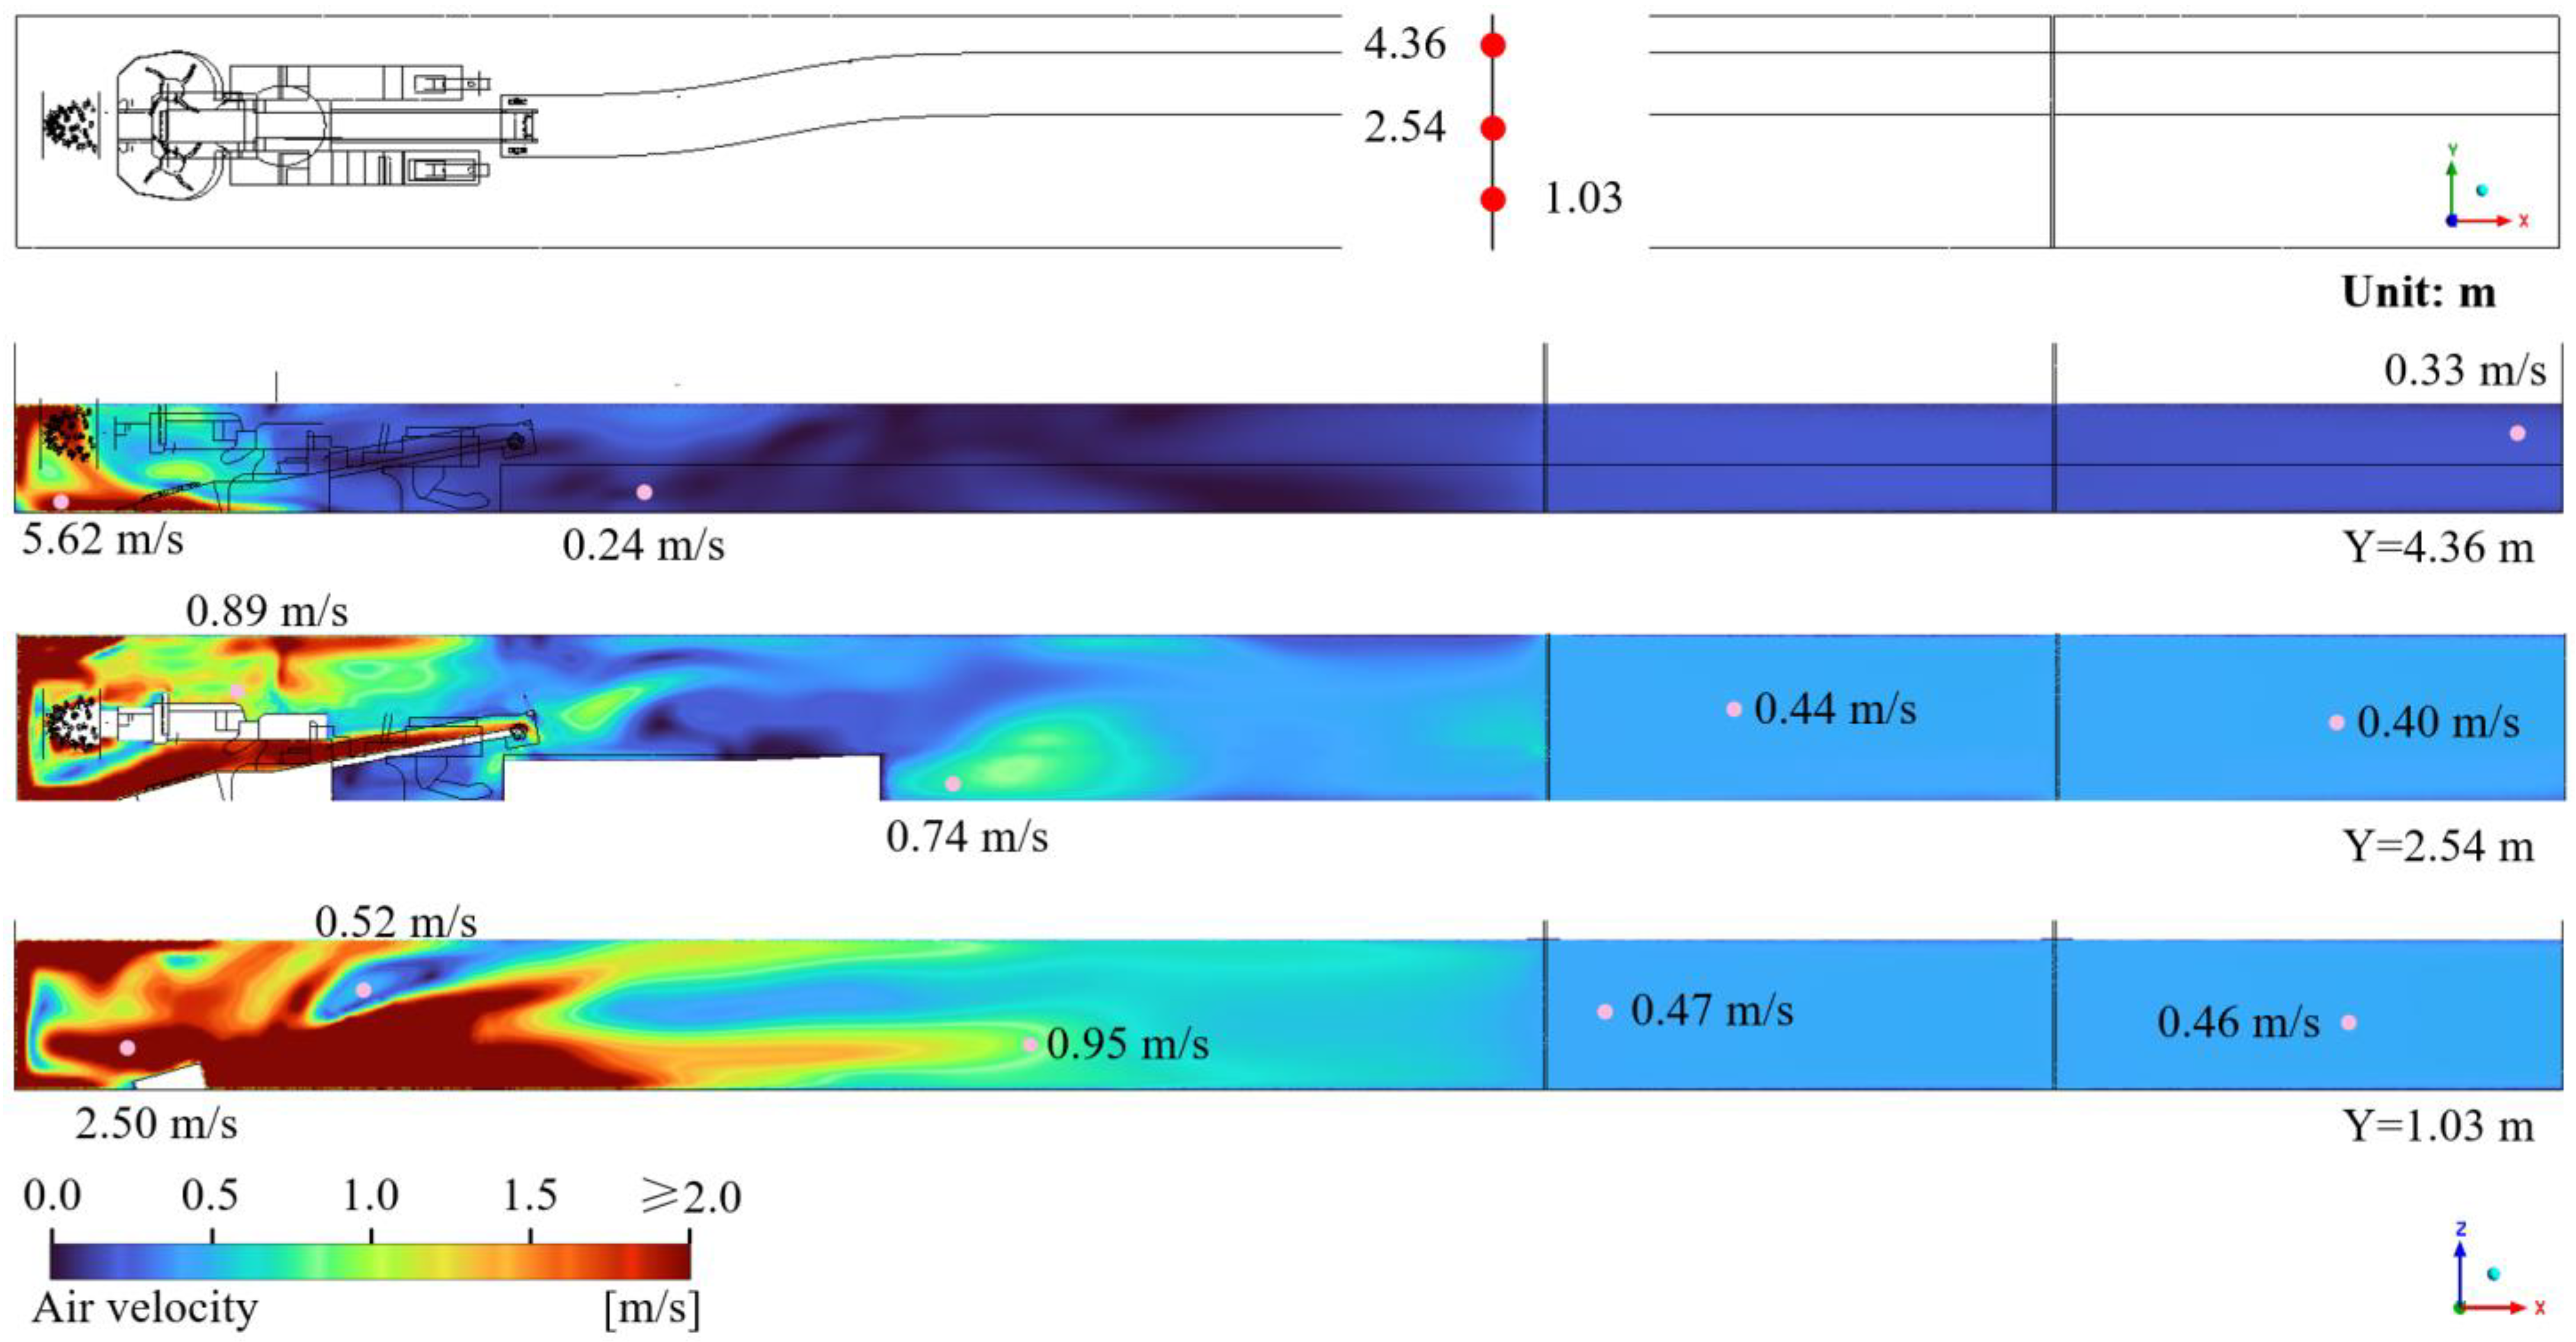
4.1. Airflow Field in a Tunnel Under Halted Operations

The distribution of airflow streamlines and velocity variations within the heading tunnel is shown in Figure 3 under halted operations, where excavation has been suspended and no dust is generated. As a result, both the spray system and dust control water curtains are turned off. Fresh air enters the tunnel through the supply duct at an initial velocity of about 21.24 m/s near the duct exit. When this incoming flow encounters the heading face, it is obstructed and deflects toward the rear, resulting in a large-scale vortex in front of the heading face. Meanwhile, a noticeable velocity drop is observed around the roadheader, with the air velocity behind the machine decreasing to as low as 0.17 m/s. By contrast, airflow on the return side maintains a relatively high velocity of about 3–5 m/s. Farther along the tunnel toward the outlet, the flow velocity gradually declines, eventually reaching a minimum of 0.44 m/s at the outlet.
Figure 4 illustrates the air velocity distribution within the tunnel. Overall, the velocity exhibits a clear attenuation trend, gradually decreasing along the tunnel toward the outlet. At the cross-section near the inlet (X = 0.5 m), most regions experience an air velocity exceeding 5.0 m/s. However, due to the turbulent disturbance induced by the cutterhead, a sharp velocity drop occurs in its vicinity, with local minima reaching approximately 0.88 m/s. In the return side, the air velocity remains relatively high but progressively decreases with increasing distance from the inlet, declining from 3.02 m/s at X = 5 m to 1.33 m/s at X = 15 m. Furthermore, the air velocity above the belt conveyor is notably lower, particularly in the middle and downstream sections, where the attenuation becomes more pronounced. For instance, at X = 30 m, the air velocity is merely 0.46 m/s.
The spatial distribution of air velocity at three representative cross-sections within the tunnel, located at Y = 1.03 m (return side), Y = 2.54 m (tunnel central), and Y = 4.36 m (intake side), is shown in Figure 5. Overall, the air velocity decreases significantly along the tunnel length and exhibits notable spatial variations. At Y = 1.03 m, the air velocity at the front of the tunnel reaches 2.50 m/s. However, after passing the roadheader area, the velocity drops sharply to 0.52 m/s, further decreasing to around 0.46 m/s near the outlet. At Y = 2.54 m, the air velocity exceeds 2.0 m/s in the region ahead of the roadheader. Due to obstruction and turbulence caused by the roadheader, the air velocity directly above the machine significantly drops to 0.89 m/s. As the tunnel extends, the velocity stabilizes, remaining around 0.40 m/s near the outlet. At Y = 4.36 m, a large high-velocity area is observed at the tunnel’s entrance, with a peak velocity of 5.62 m/s. However, as the airflow moves along the tunnel, it decreases rapidly, reaching 0.33 m/s at the outlet.
At the height of the ventilation duct (Z = 2.50 m), the air velocity at the duct outlet reaches as high as 21.31 m/s, as shown in Figure 6. As the airflow moves toward the excavation face and subsequently turns toward the outlet, a localized low-velocity region emerges beneath the supply air duct, where the velocity significantly decreases to approximately 1.70 m/s. Additionally, a pronounced low-speed area develops around the roadheader, with a low velocity of about 1.27 m/s, before gradually stabilizing at approximately 0.43 m/s near the outlet. At the pedestrian breathing zone (Z = 1.60 m), distinct velocity fluctuations occur due to the roadheader’s obstruction effects, characterized by a relatively high velocity of 2.74 m/s beneath the cutterhead and an evident low-velocity region downstream of the machine tail (approximately 0.21 m/s). Following this zone, the air velocity becomes relatively stable, ranging between 0.41 and 0.55 m/s. Near ground level (Z = 0.50 m), high air velocity exceeding 2 m/s is observed extensively in the roadway’s frontal section, with the peak velocity reaching up to 3.05 m/s. However, the velocity progressively decreases toward the tunnel outlet, ultimately reducing to approximately 0.44 m/s. These results demonstrate significant spatial variations in air velocity along the excavation roadway, primarily attributable to the obstructive and flow-disturbing effects of the roadheader structure.

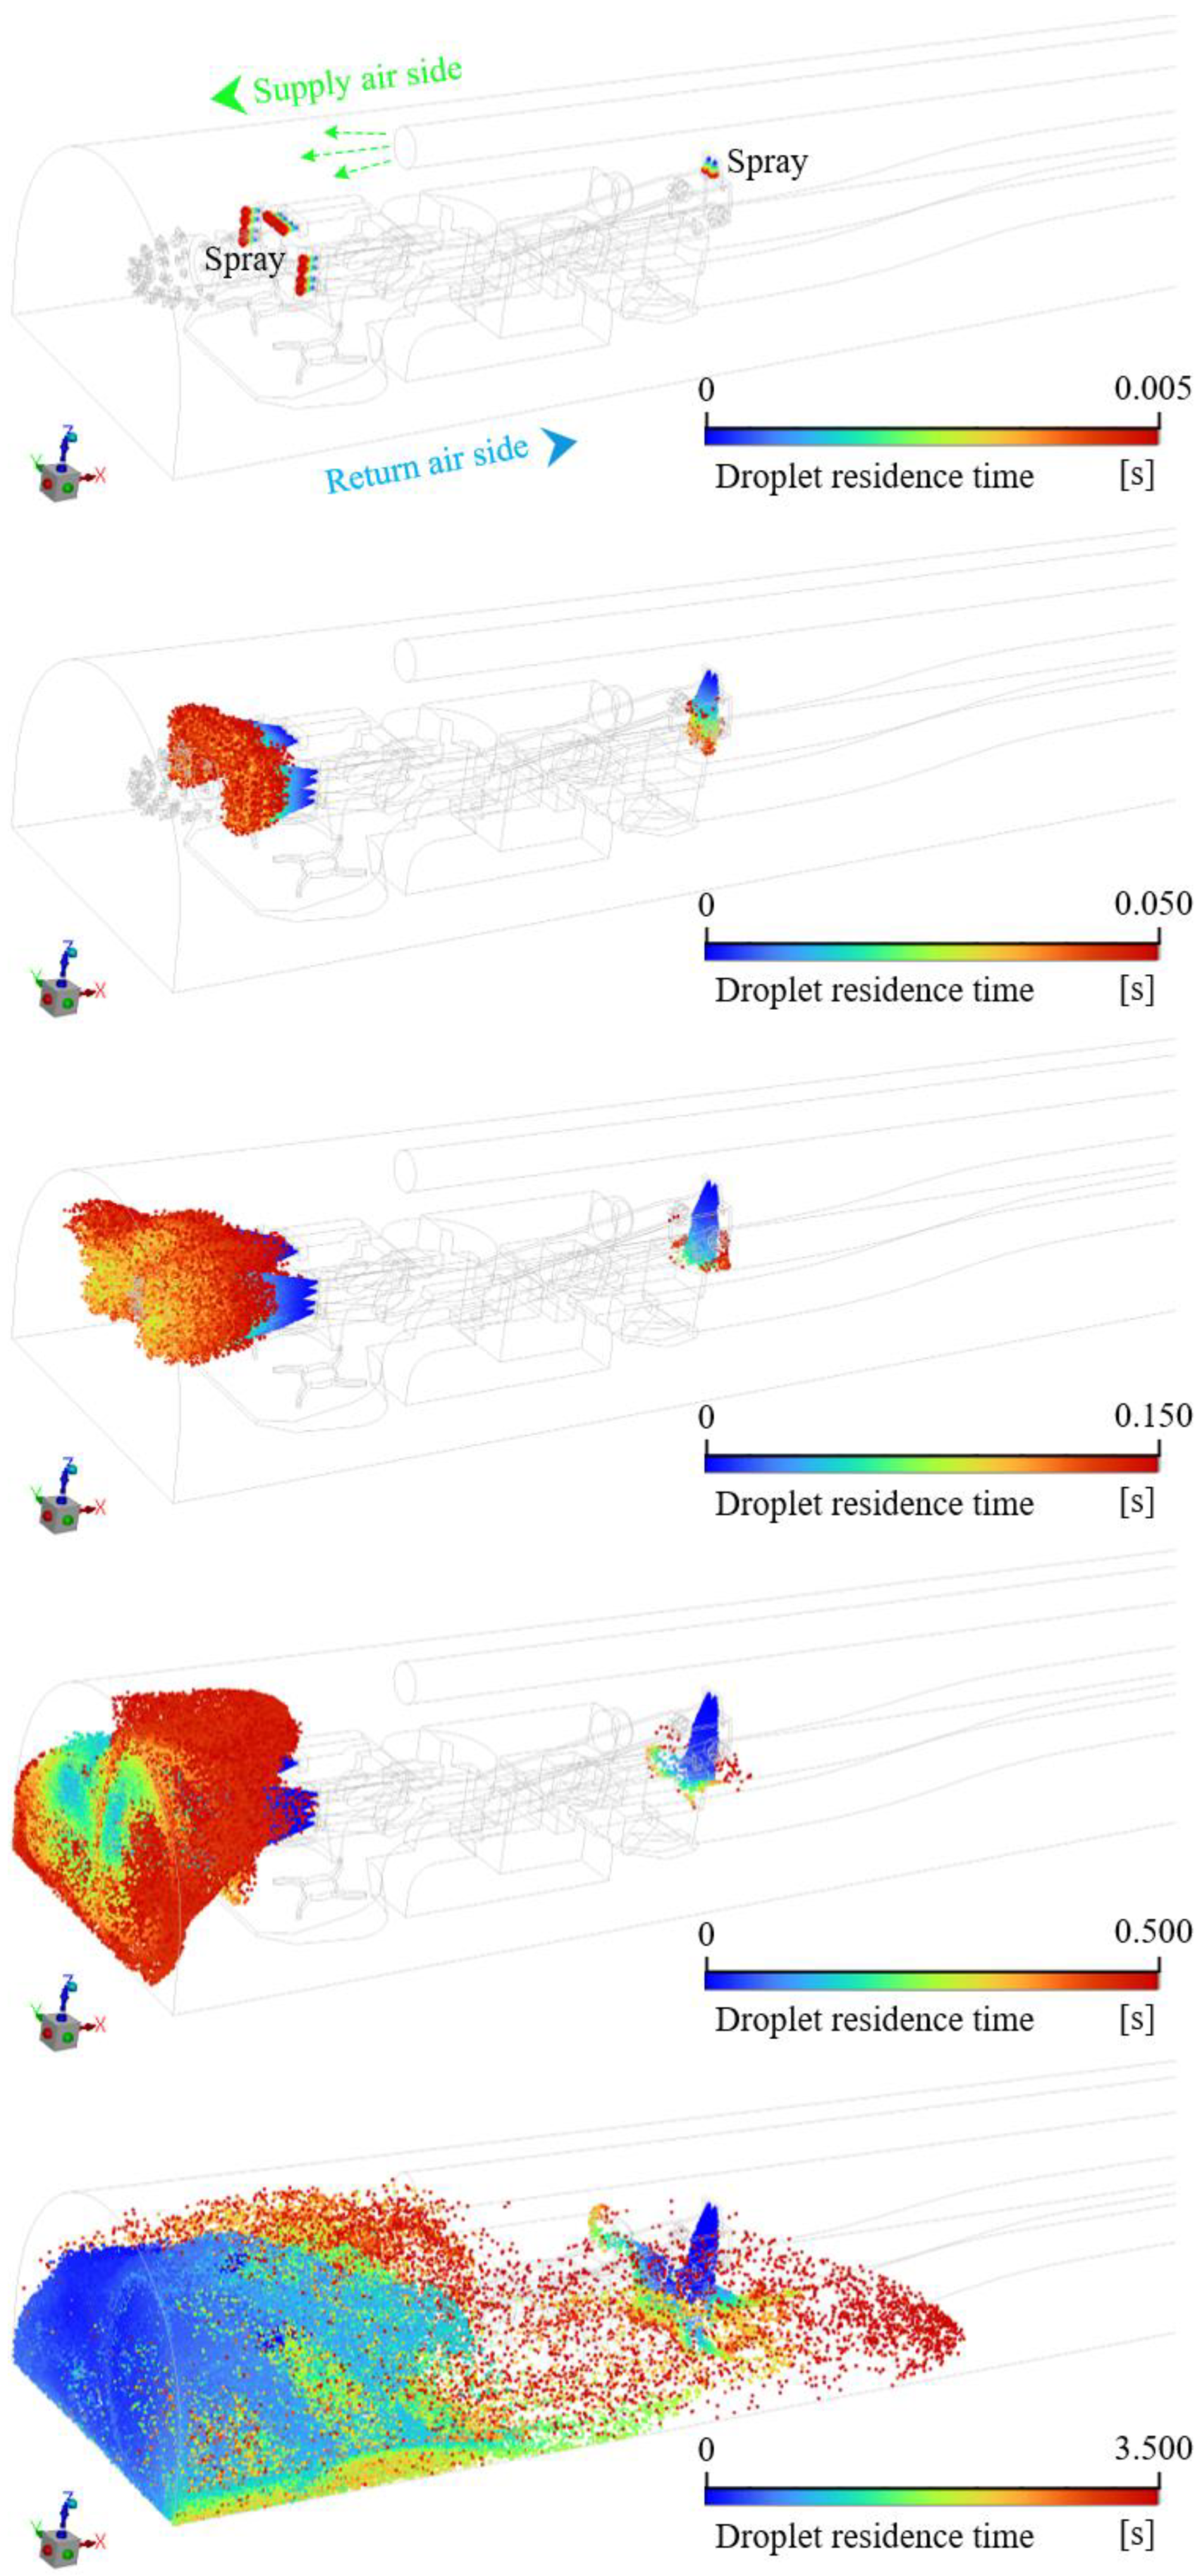
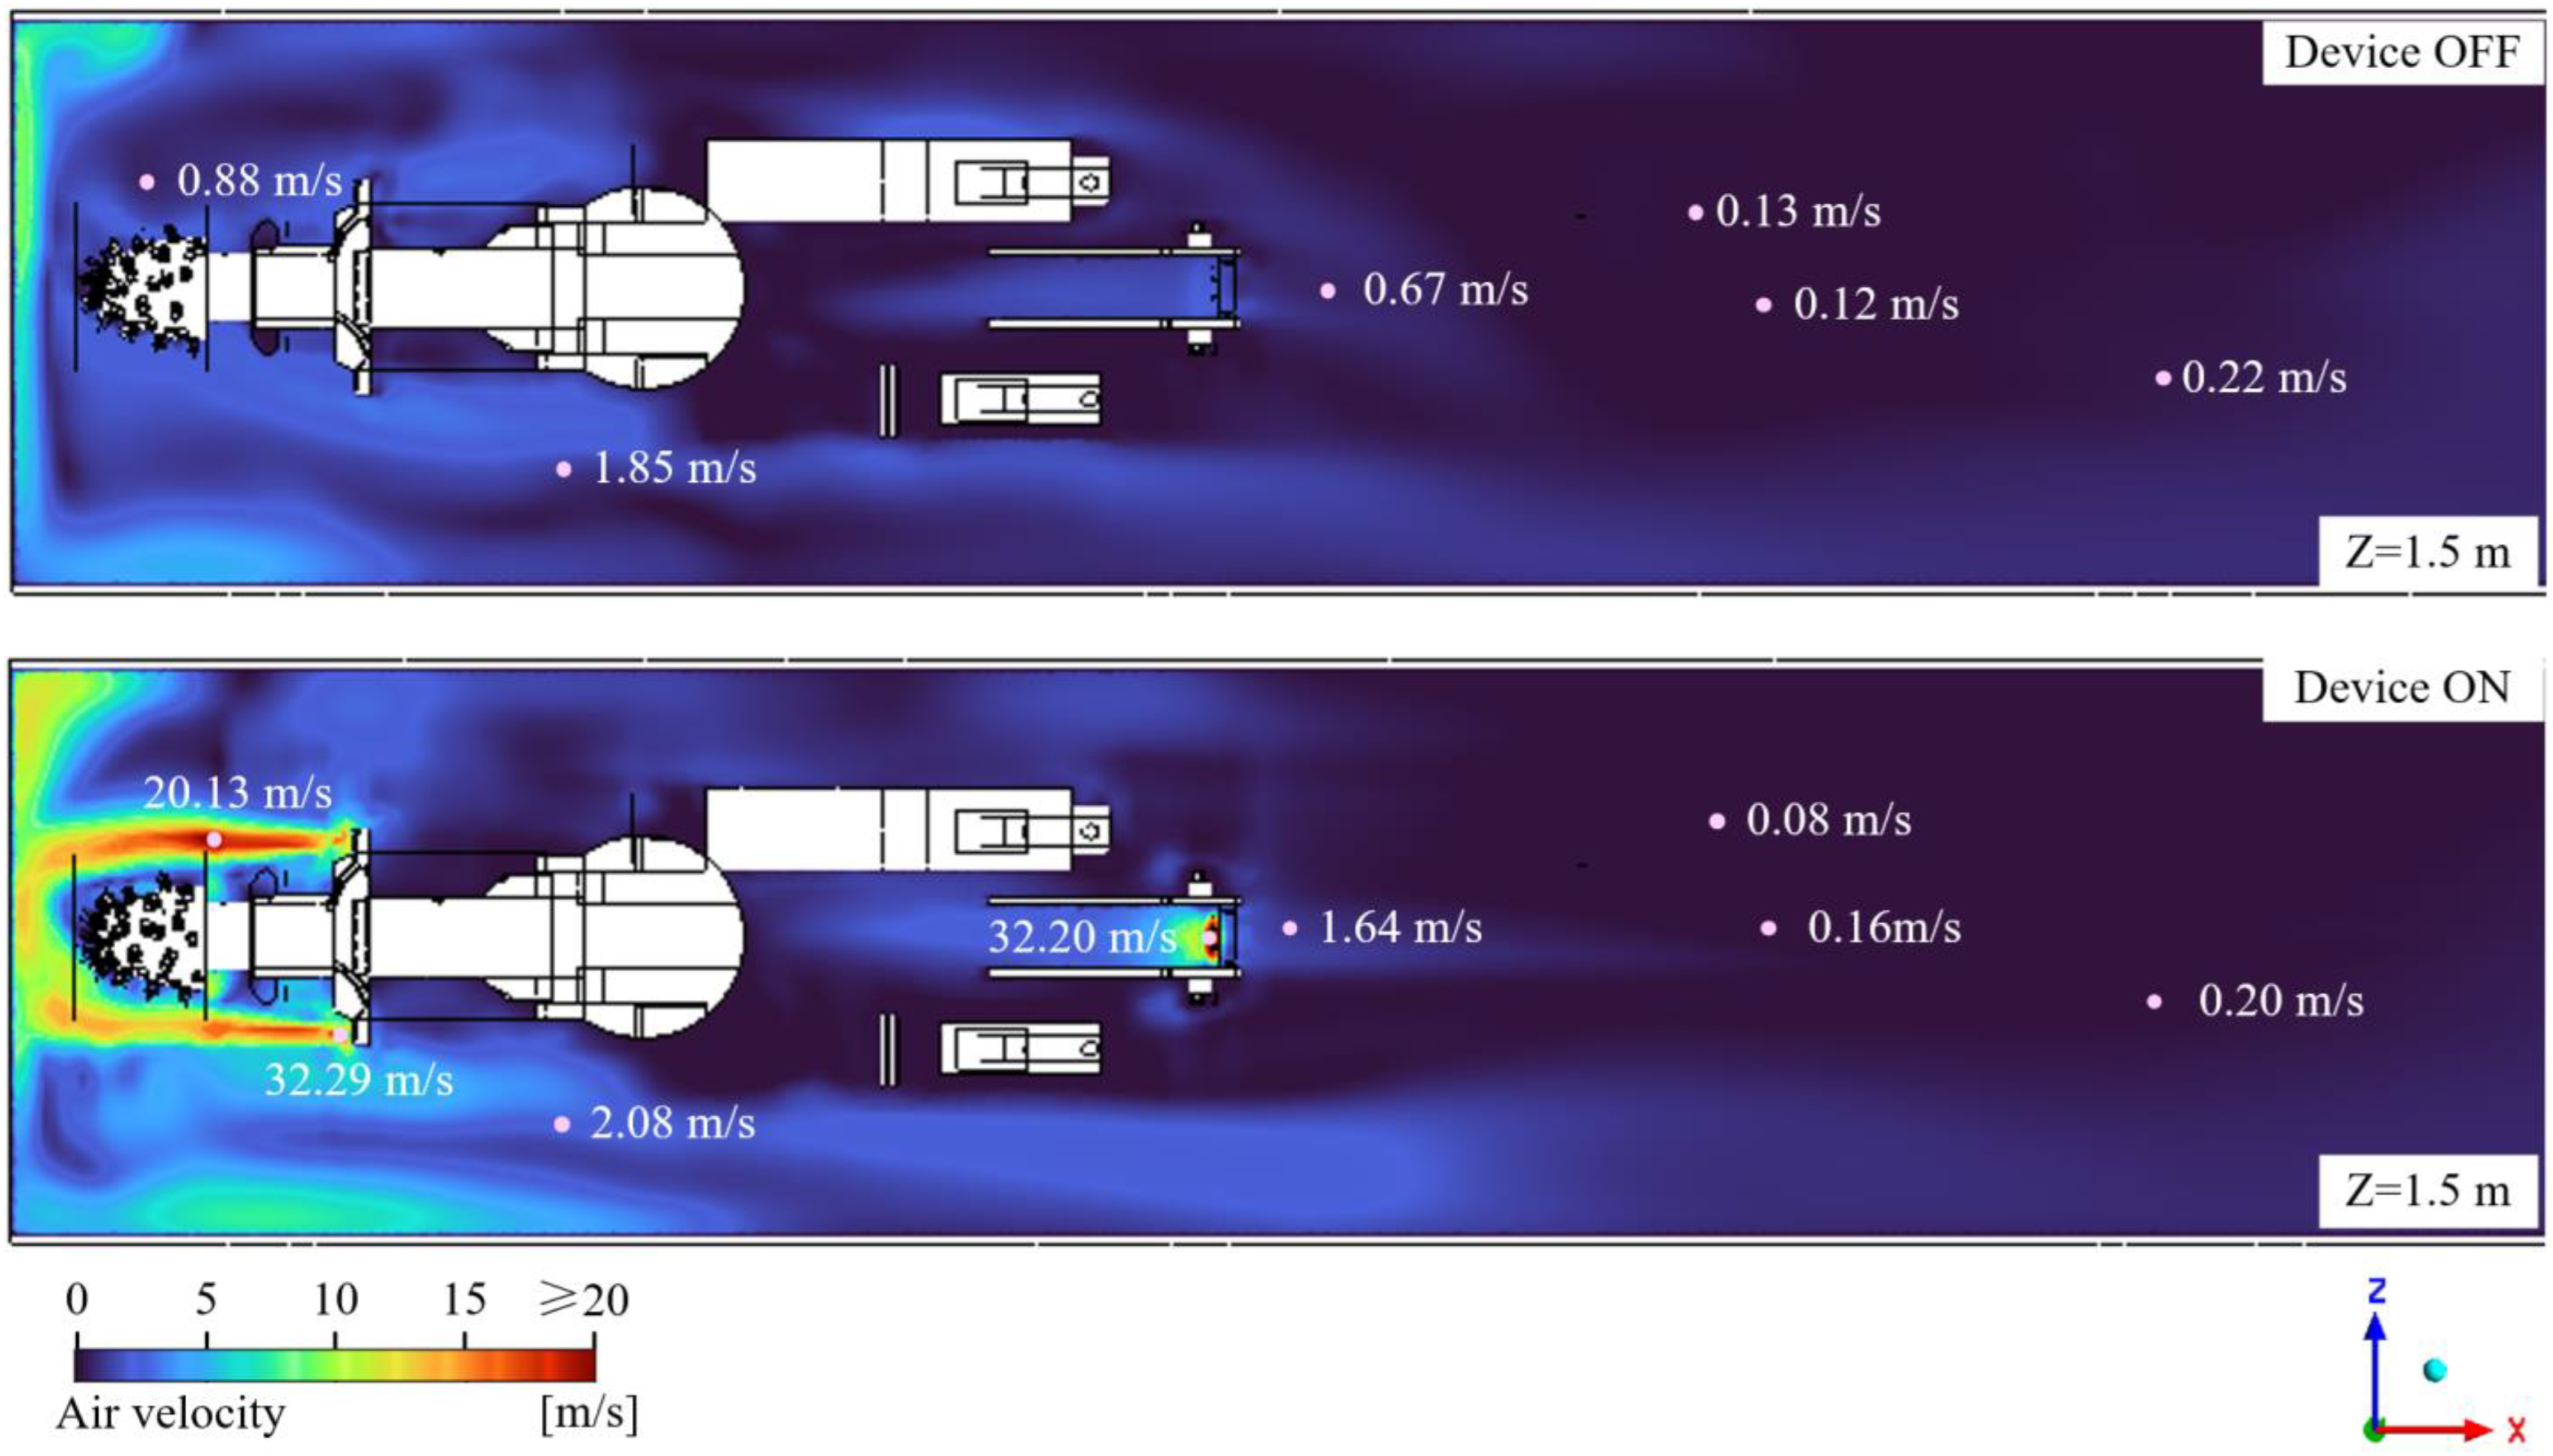
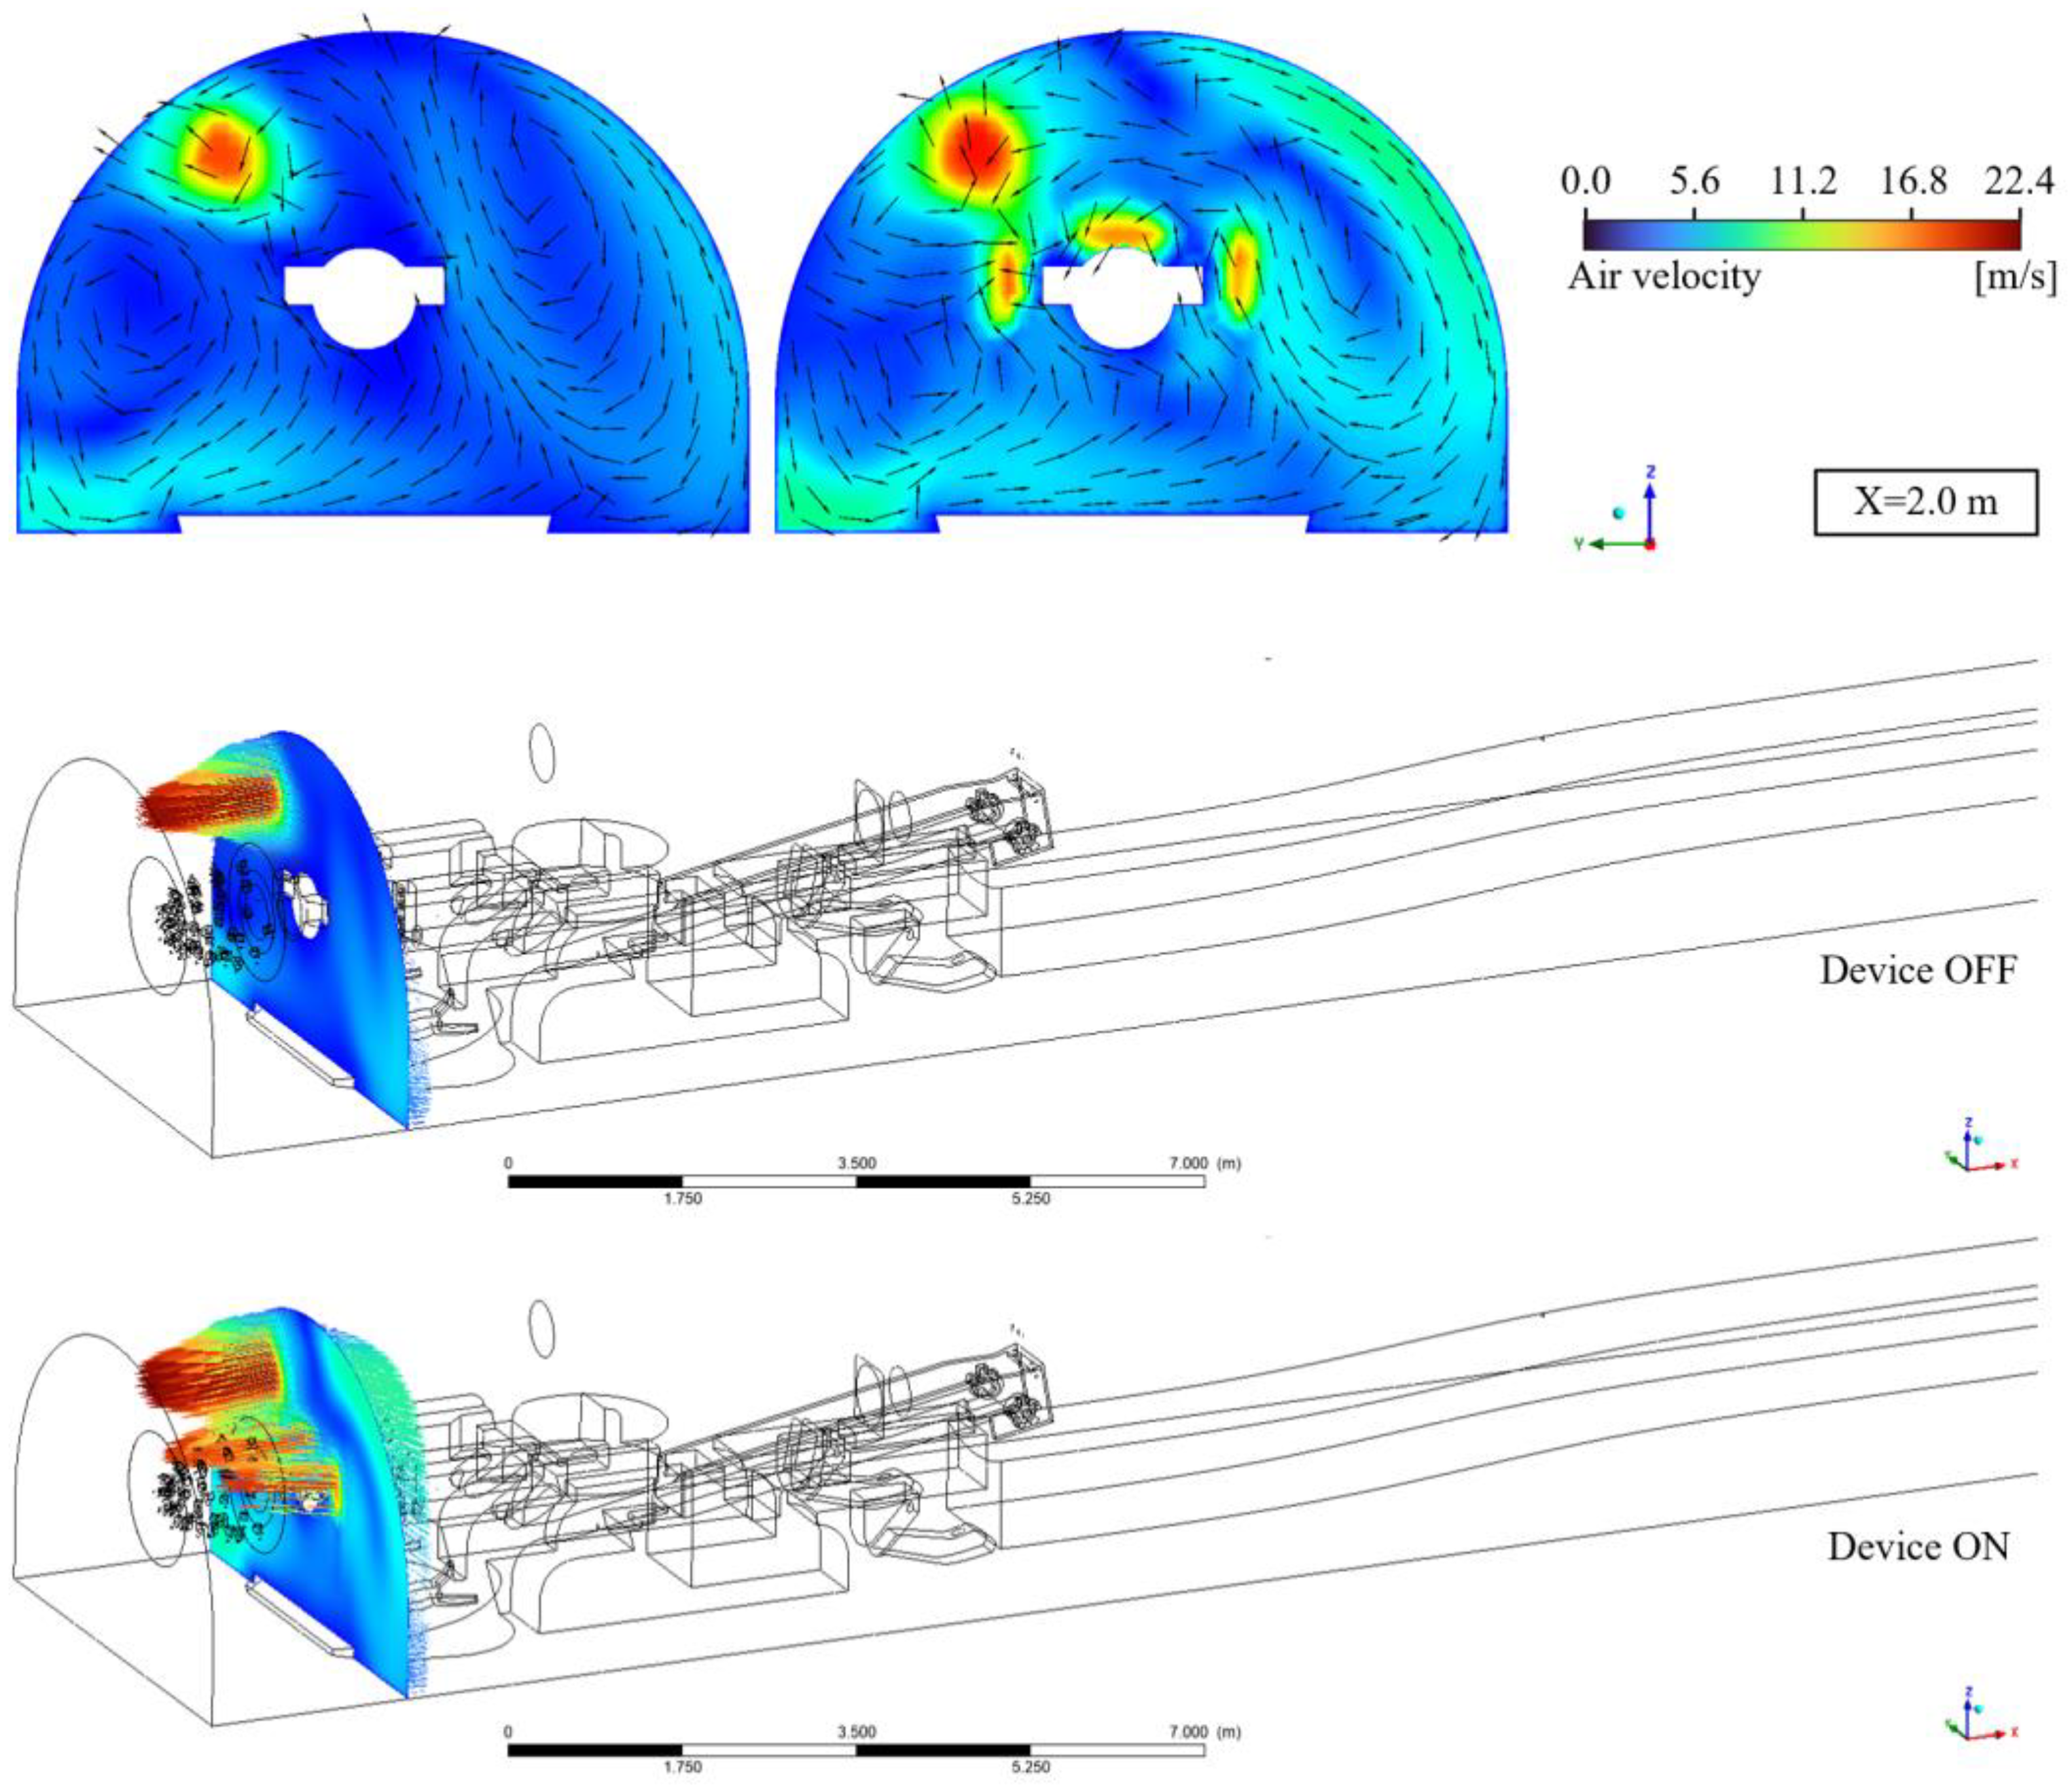
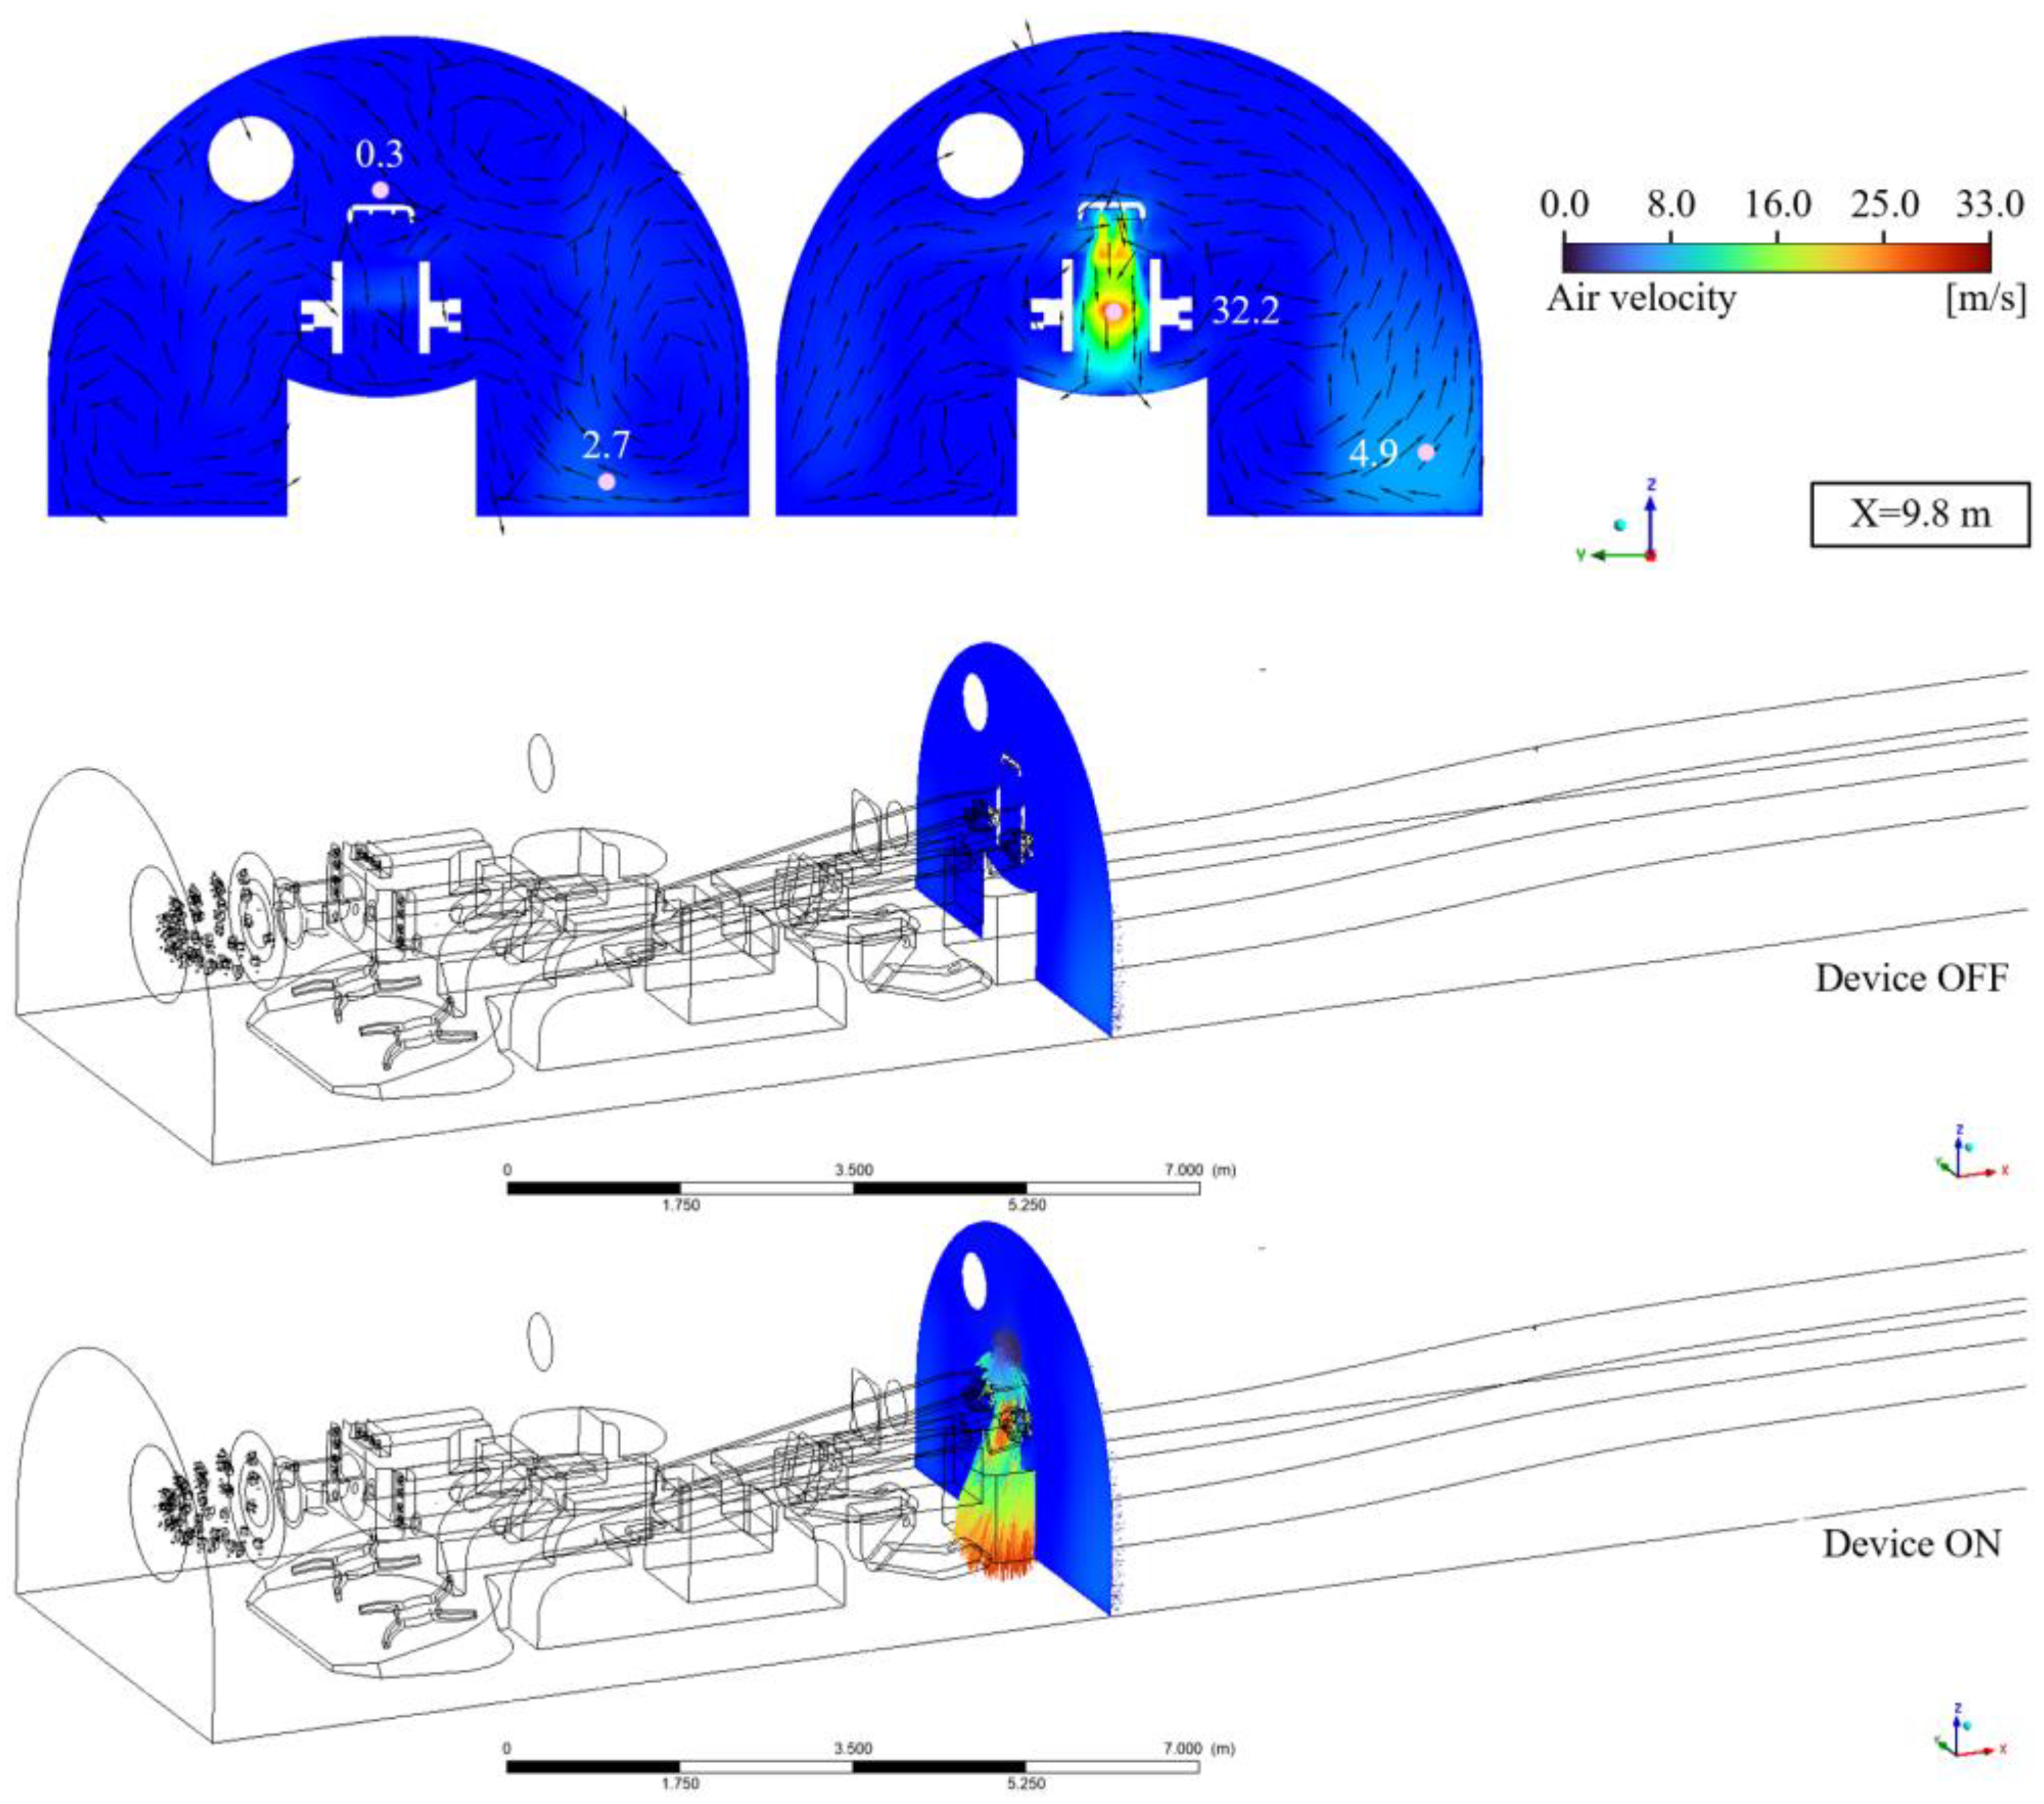
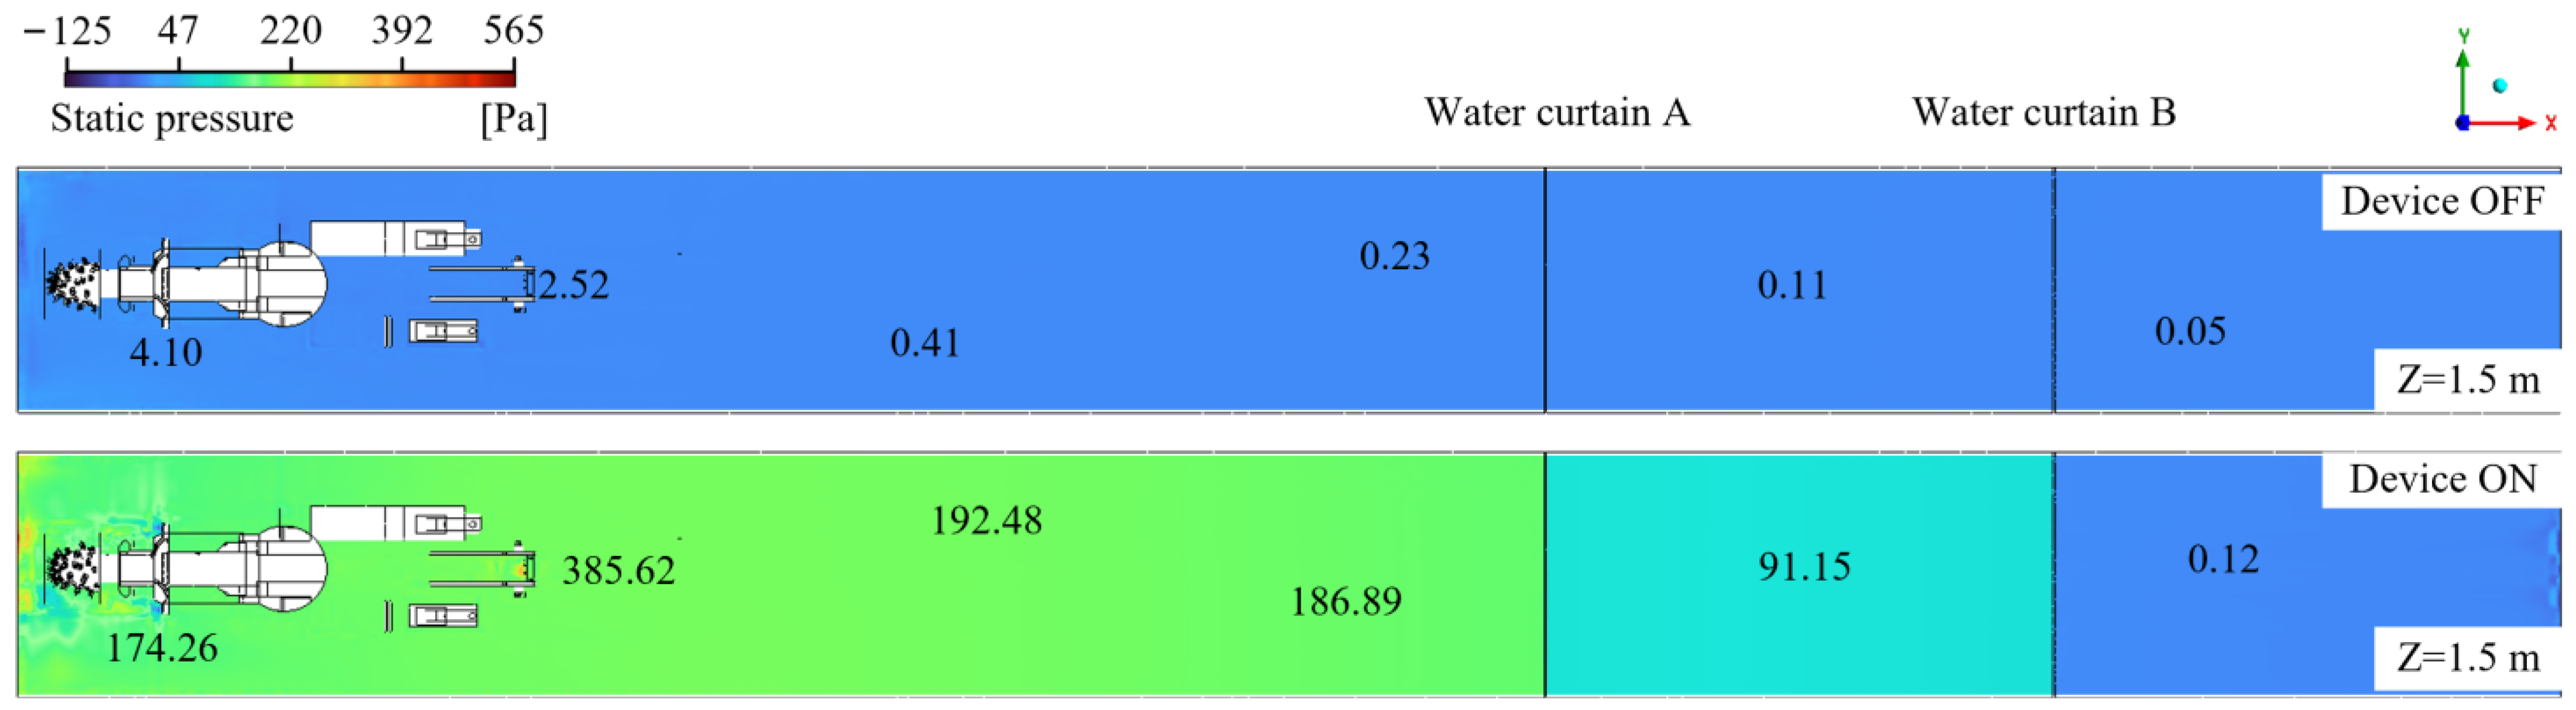
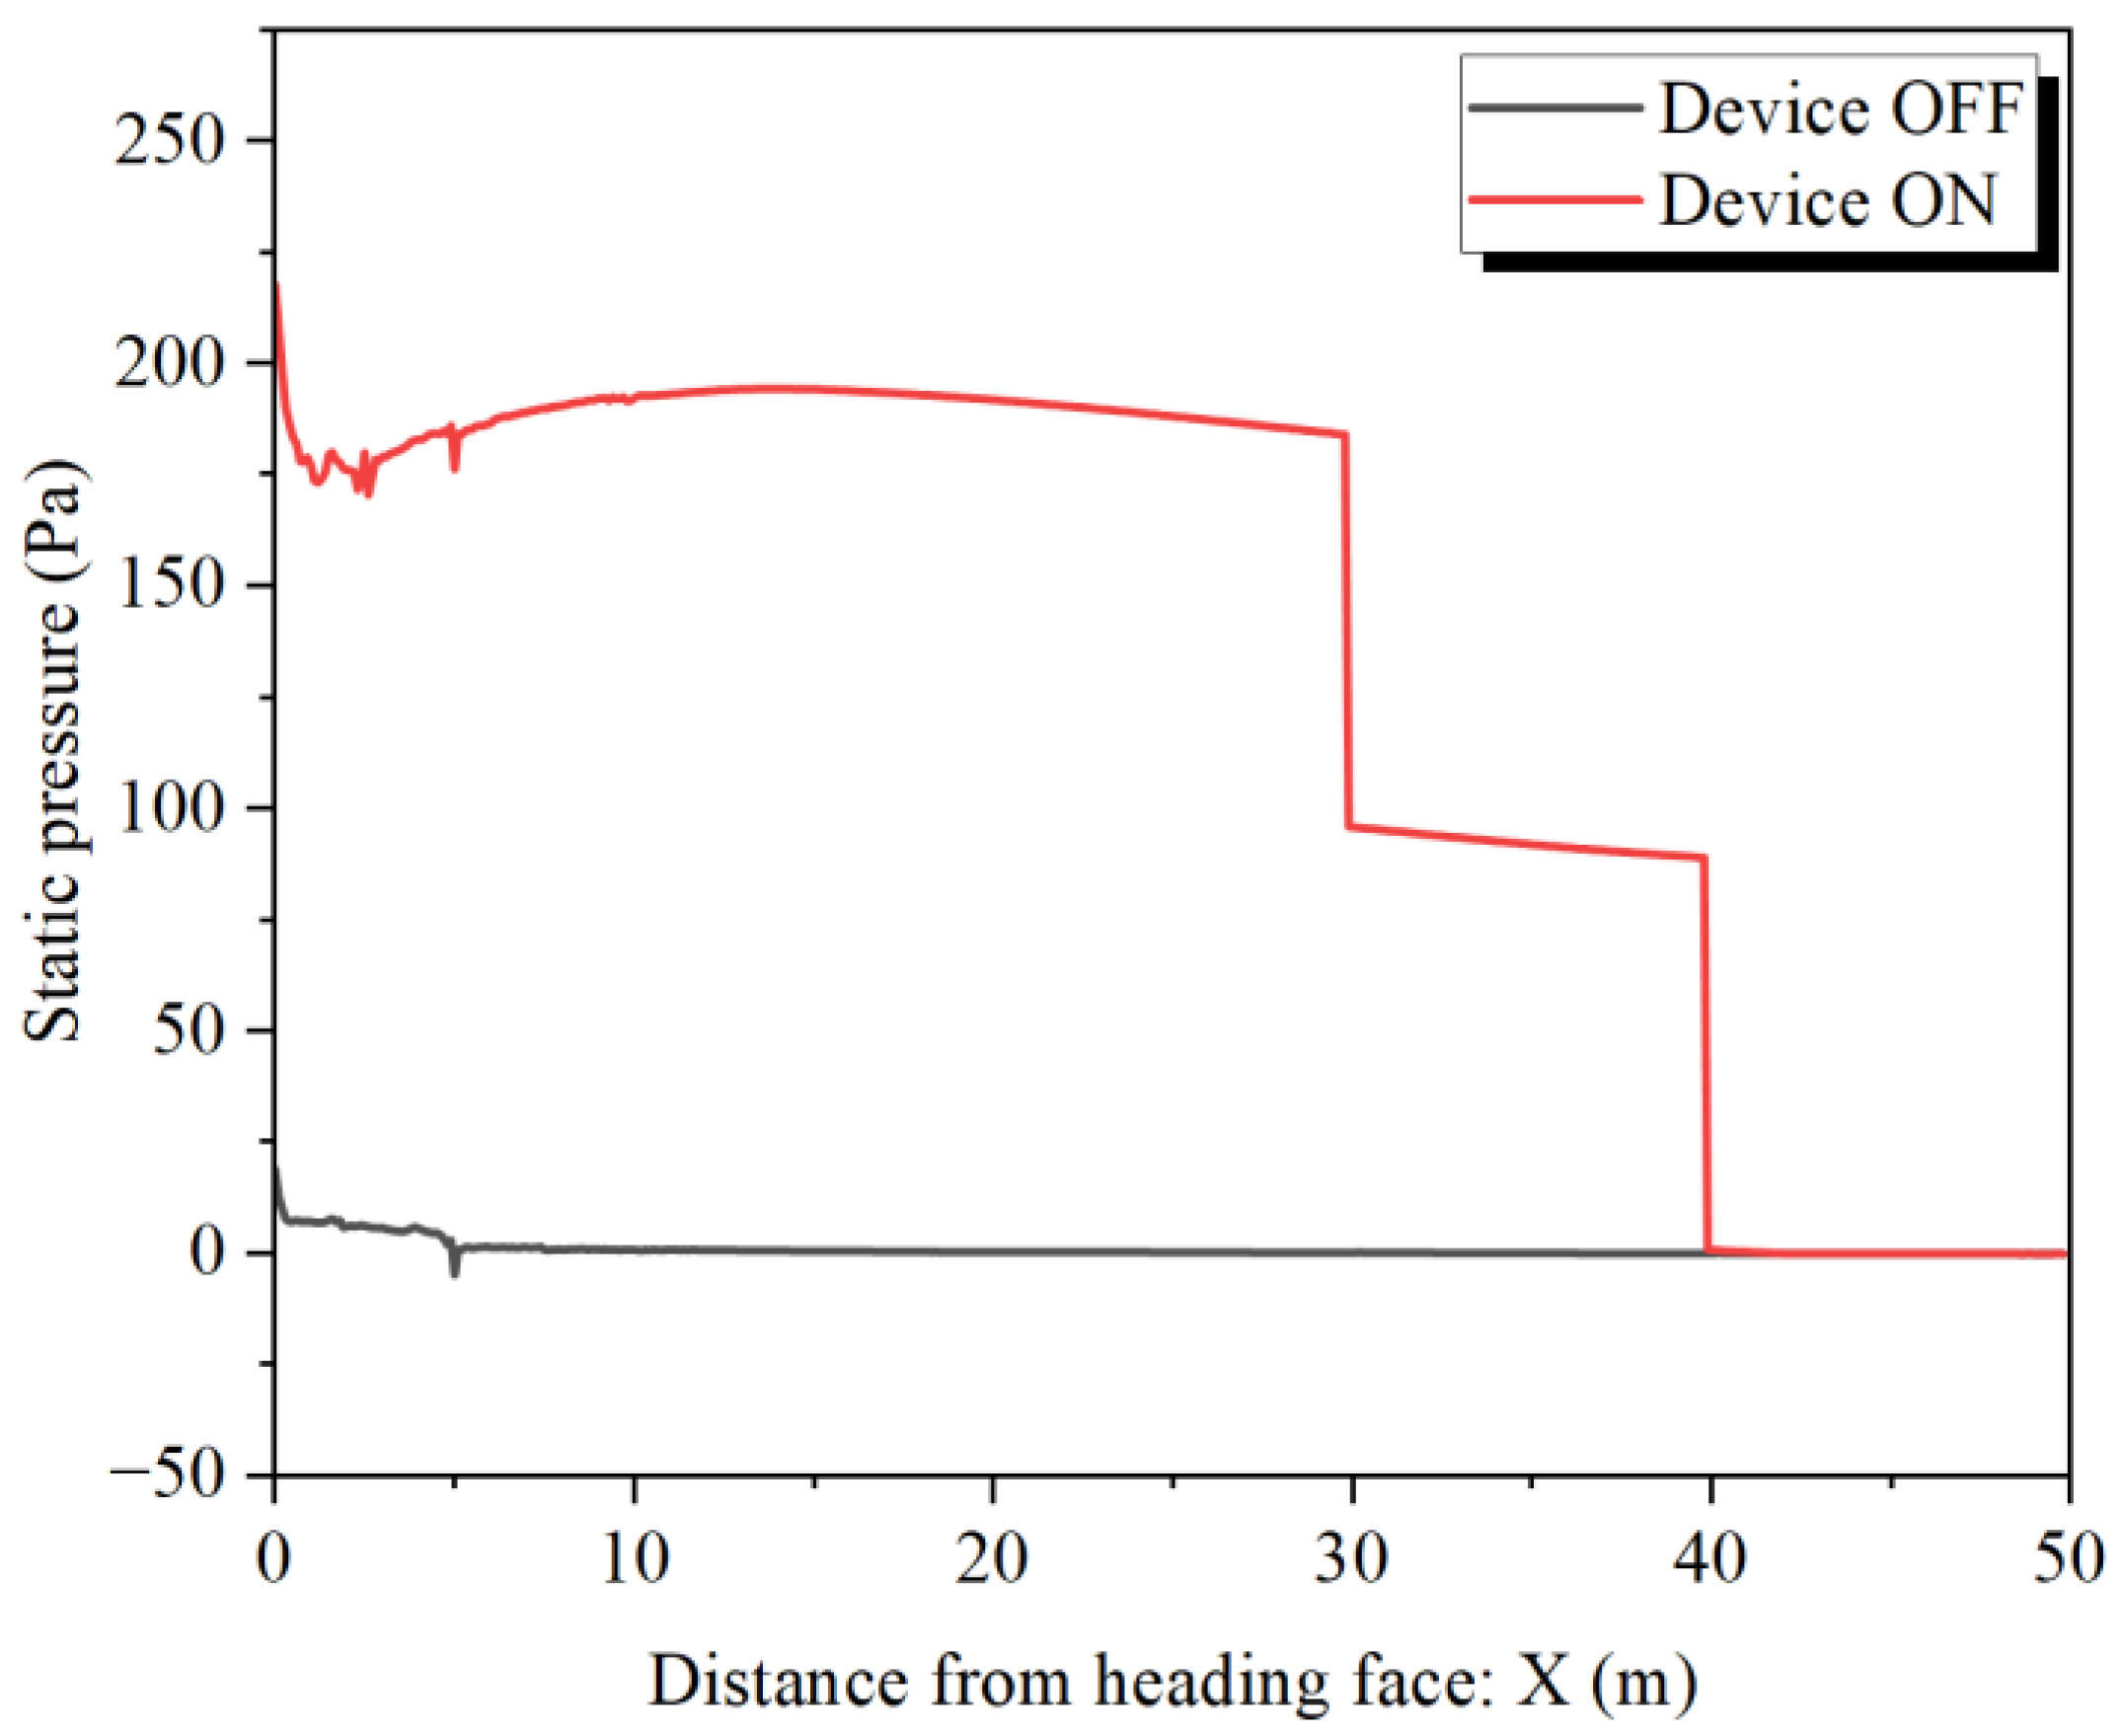
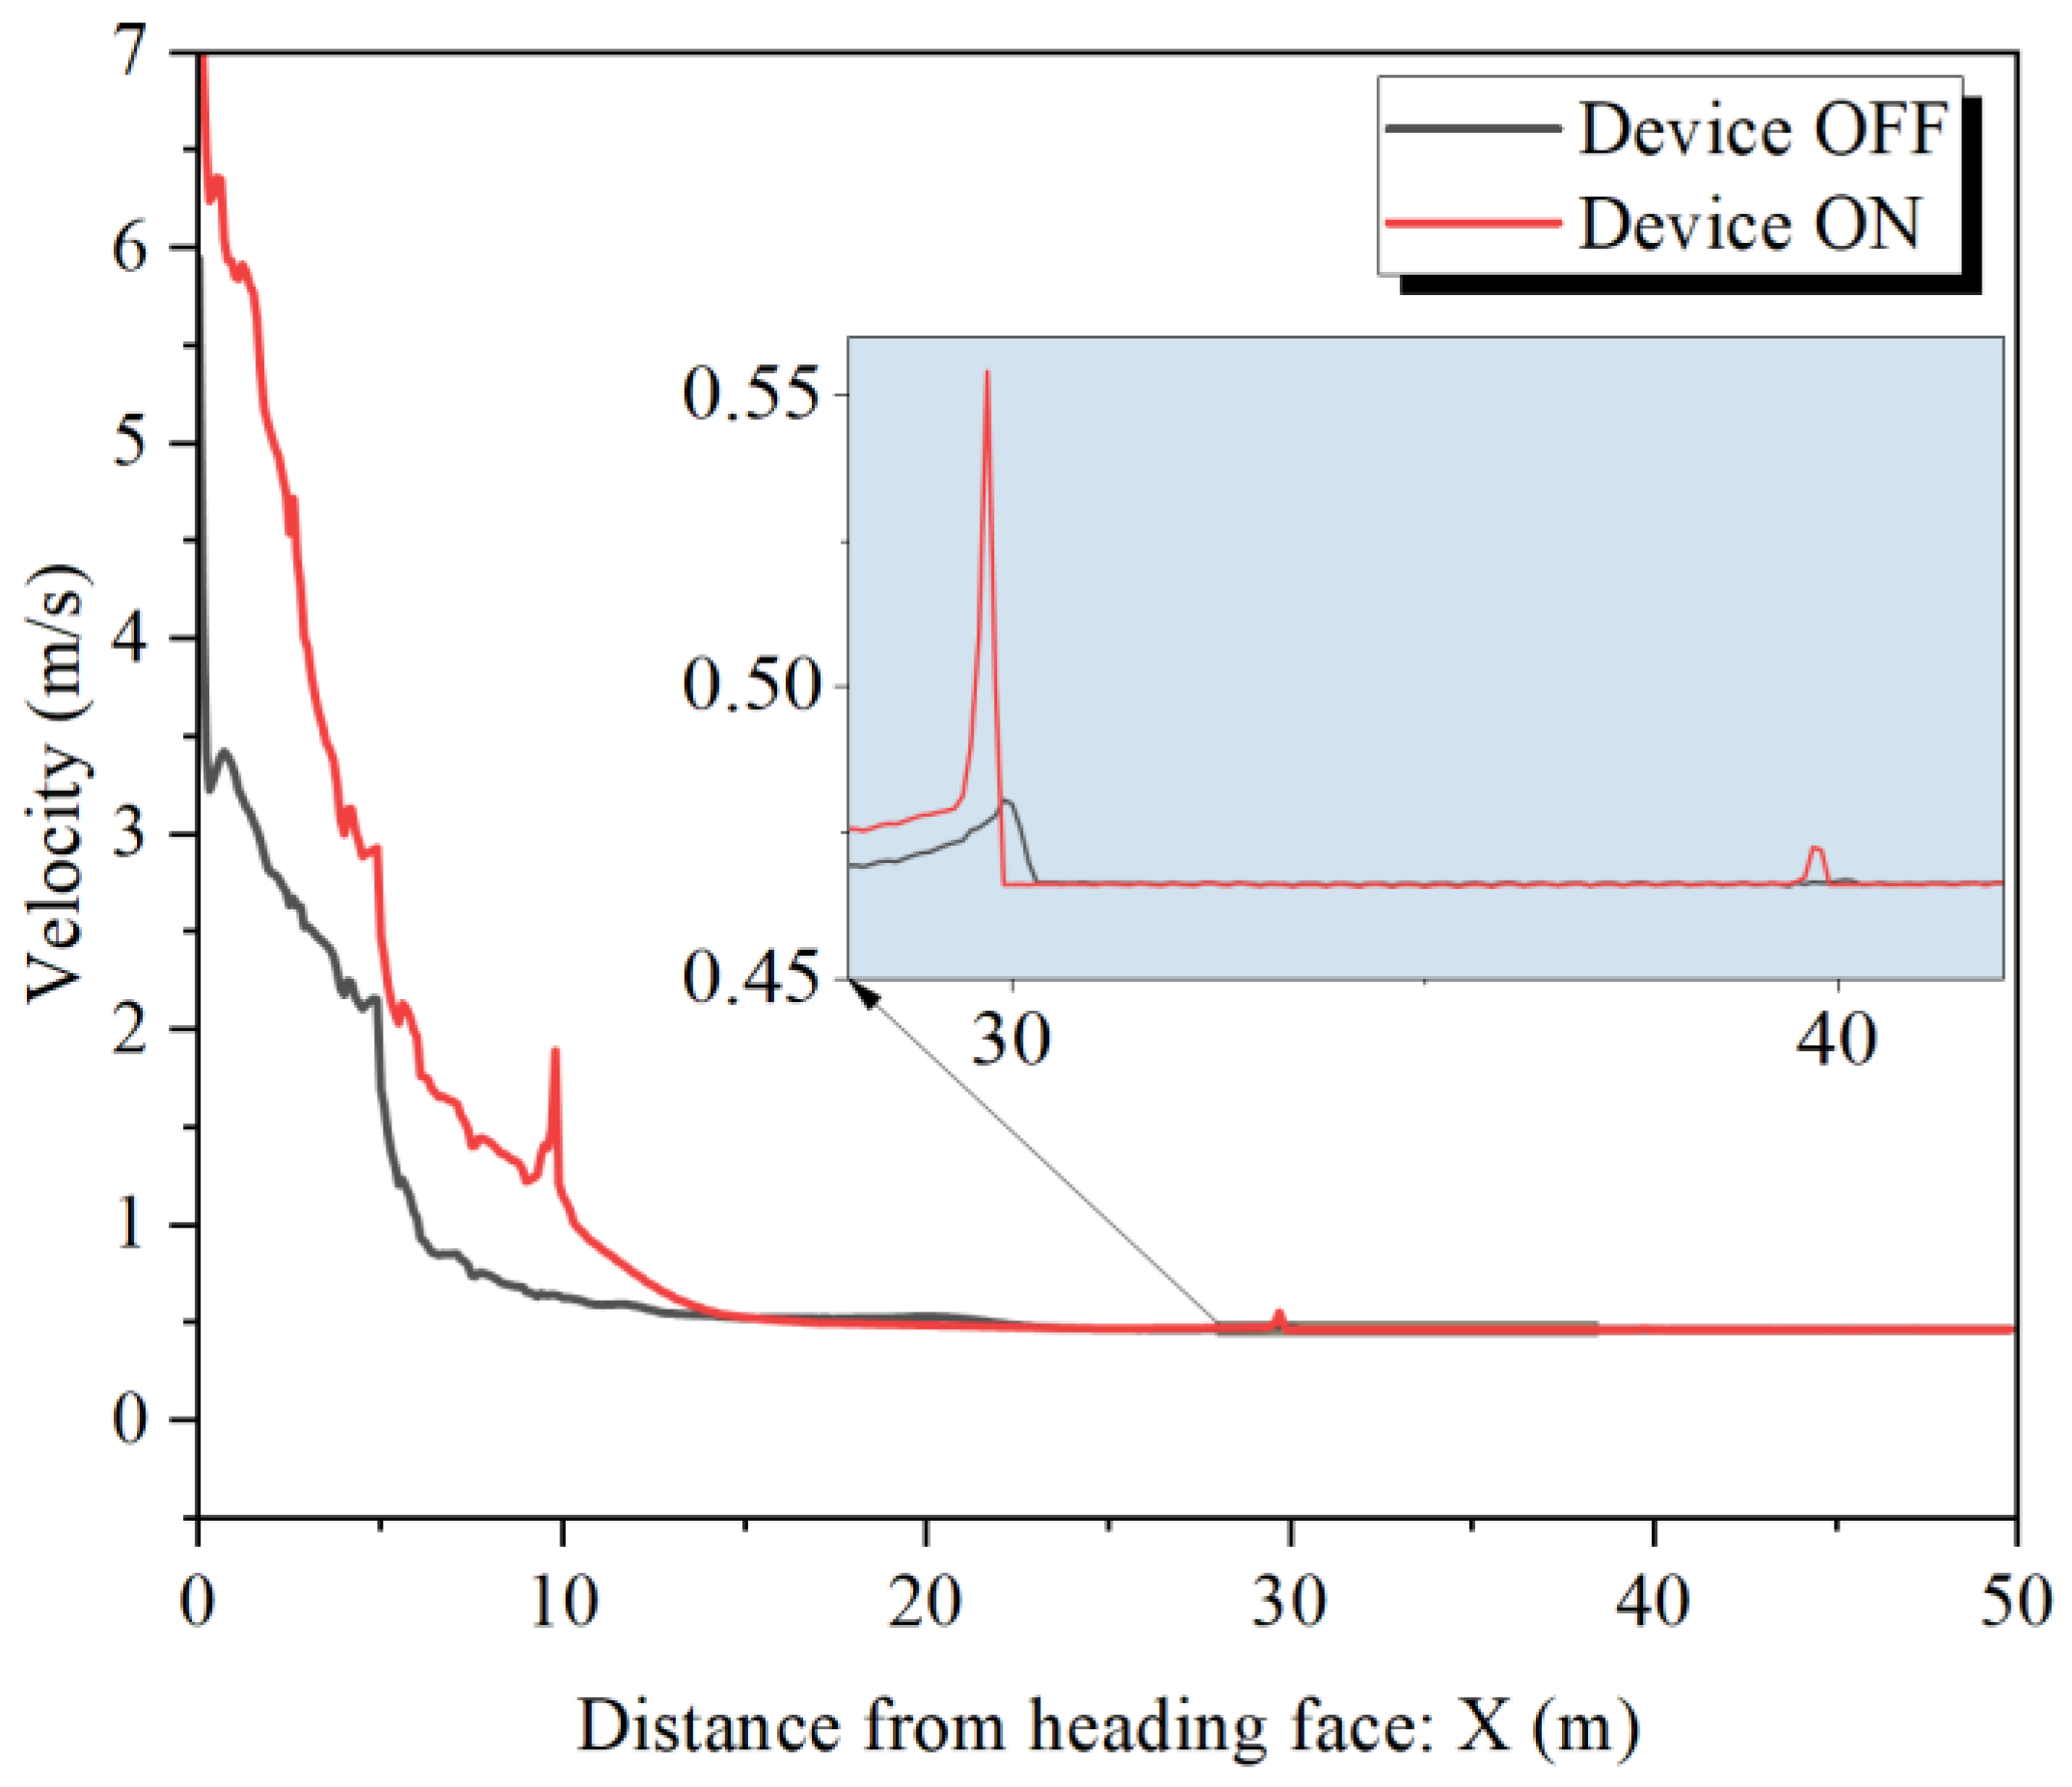
4.2. Impact of Spraying and Water Curtain on Airflow Field

The trajectories and residence time distributions of droplets released from spray systems positioned at the cutter boom and transfer point within the excavation roadway are illustrated in Figure 7, depicting the dynamic evolution of droplet dispersion at different moments in time. Initially, droplets exit rapidly from the nozzles, dispersing outward in a conical pattern. Specifically, the external spray comprises twelve nozzles arranged circumferentially above the cutterhead, effectively encapsulating and suppressing dust generated during excavation. Under the influence of forced ventilation, droplets predominantly migrate toward the return side. At 0.5 s after spray initiation, droplets originating from the cutterhead region expand significantly toward the rear of the tunnel, forming a broader dispersion area with notably increased residence time, as indicated by the progressive color shift from blue-green (short residence) toward red (long residence). Concurrently, droplets emitted from the transfer point spray system remain primarily localized near the roadheader’s rear, forming a relatively compact area with prolonged droplet residence. By 3.5 s, droplets have extensively dispersed throughout the excavation workspace, reaching a stable spatial distribution. Droplets from the transfer point system notably spread downstream along the roadway toward the rear and bottom areas, showing significantly prolonged residence time. Overall, the dynamic dispersion process highlights substantial non-uniformity driven by complex interactions between airflow patterns and structural interference from the excavation equipment, providing valuable insights for optimizing dust suppression performance.
The spatial distributions of air velocity at the Z = 1.5 m cross-section under conditions with the device off (spray and water curtain off) and the device on (spray and water curtain on) are illustrated in Figure 8. Under the device OFF condition, the air velocity inside the tunnel is generally low, with a peak velocity of approximately 0.88 m/s near the cutterhead, while the air velocity around the roadheader tail is considerably lower, ranging between 0.12 and 0.67 m/s. With activation of the spray systems, the introduction of high-velocity droplets significantly enhances localized airflow, particularly near the cutterhead region, where the maximum velocity sharply increases to approximately 32.29 m/s. Similarly, the airflow induced by the transfer point spray also exhibits a pronounced increase, reaching a velocity of up to about 33.00 m/s near the spray nozzle and approximately 10.0 m/s in the adjacent region. Due to obstruction by the sidewalls of the conveyor, the airflow is predominantly redirected along the ±X directions. The significant enhancement in local air velocity demonstrates strong momentum exchange between the spray droplets and surrounding air, yet this effect diminishes considerably toward the outlet. These observations indicate that while spray-induced jets can greatly improve local airflow dynamics and potentially enhance dust suppression near key operational areas, their influence on distant regions of the tunnel remains limited due to airflow attenuation and structural interference.
The air velocity distributions and vector fields at cross-sections located at X = 2.0 m (cutterhead region, Figure 9) and X = 9.8 m (transfer point region, Figure 10) under device OFF (left side) and ON (right side) conditions are presented for comparison. Under the device OFF condition, the air velocity at both cross-sections is generally low and uniformly distributed, with only localized regions exhibiting moderate air velocity ranging from approximately 2.9 to 5 m/s. Upon activating the sprays, the high-velocity jets significantly disturb the local airflow fields. At the cutterhead cross-section (X = 2.0 m), the previously moderate-velocity area (5 m/s) develops into a distinctly high-velocity zone with a peak velocity reaching 22.4 m/s. The three-dimensional views further illustrate that spray-induced momentum considerably strengthens airflow around the cutterhead, expanding airflow coverage toward the upper regions and return side, thereby effectively enhancing ventilation and dust suppression near the excavation face. At the transfer point cross-section (X = 9.8 m), the highest air velocity is around 2.9 m/s without spray, whereas the airflow near the transfer point remains as low as approximately 0.2 m/s. With the spray activated, the maximum air velocity near the transfer point sharply rises to about 16.8 m/s, resulting in a pronounced high-velocity area oriented vertically downstream. The corresponding three-dimensional visualization confirms that the transfer point sprays induce strong airflow disturbances, thereby substantially increasing airflow dynamics in the mid-to-rear regions of the tunnel, beneficial for ventilation enhancement and dust dilution. Overall, these comparative analyses highlight the prominent influence of spray-induced jets on local airflow in excavation tunnels, demonstrating their potential to significantly improve local ventilation and dust control near the cutter head and transfer point, while air velocity gradually diminishes downstream into more uniform distributions.
The static pressure distributions at the Z = 1.5 m cross-section under device OFF and ON conditions are presented in Figure 11. Under the device OFF condition, the static pressure throughout the tunnel remains relatively uniform and slight, ranging between approximately 4.10 Pa near the roadheader and 0.05 Pa at the outlet. Upon activating the spray and water curtain devices, significant alterations in the static pressure distribution are observed. Notably, a marked high-pressure region develops downstream of the roadheader, with maximum static pressures reaching up to 385.62 Pa near the transfer point area. The presence of water curtains A and B further influences the pressure distribution, inducing stepwise pressure drops across each curtain, with pressures recorded at approximately 186.89 Pa after water curtain A and 91.15 Pa after water curtain B. Near the cutterhead, a distinct pressure region (174.26 Pa) emerges due to the intense momentum exchange associated with spray-induced airflow acceleration. The overall pressure gradient reflects increased airflow resistance and local dynamic disturbances resulting from spray and water curtain operations.
As shown in Figure 12, the area-weighted static pressure increases significantly when the dust suppress devices are activated. Under the device OFF condition, the static pressure remains relatively low. By contrast, under the device ON condition, the static pressure near the heading face rises rapidly, reaching around 200 Pa within the first 10 m. A distinct two-step pressure drop appears downstream of the curtain: at X = 30 m, the static pressure falls abruptly from 180 Pa to 90 Pa. At X = 40 m, the pressure declines further to near-ambient levels, indicating that the combined resistance of the water curtain is no longer dominant and the airflow has re-equilibrated with the main ventilation stream. These two pressure inflection points delineate the effective influence zone of the suppression devices (0–40 m). Beyond 40 m, the pressure profiles for the ON and OFF cases converge, implying negligible impact on the downstream ventilation network. In Figure 13, the area-weighted velocity also shows a clear increase when the spray system is activated. Under the device OFF condition, the velocity remains relatively low, with the highest velocity at X = 1 m being approximately 3.4 m/s. However, with the devices on, the velocity increases sharply to reach a maximum of 6.3 m/s. A notable feature is the sharp rise in velocity, especially between 0 and 20 m from the heading face. The inset in Figure 13 provides a more detailed view between 30 and 40 m, where the velocity stabilizes around 0.45 m/s, with the fluctuations attributed to the obstructive effect of the water curtain on the airflow.

5. Conclusions

This study systematically investigated the influence of spray systems and water curtains on airflow dynamics within mining tunnels using a CFD framework. The results demonstrate that spray configuration and water curtain placement critically govern airflow patterns and pressure distribution, with three key findings:
Spray systems at the cutterhead and transfer point exhibit distinct dispersion behaviors, with cutterhead sprays forming conical patterns expanding toward the rear of the tunnel under forced ventilation and transfer point sprays remaining localized near equipment, creating prolonged residence zones. By 3.5 s, droplets achieve stable distributions, with transfer point droplets migrating downstream to rear/bottom regions, enhancing dust suppression in critical areas.
Spray activation dramatically increases local velocities, with the cutterhead region’s peak velocity surging from 0.88 m/s (Device OFF) to 32.29 m/s (Device ON) due to droplet–air momentum exchange and the transfer point area’s velocity rising from 0.20 m/s to 33.00 m/s, forming vertical high-speed jets, although structural obstructions redirect airflow laterally (±X), limiting downstream propagation beyond 20 m.
Spray systems also induce significant pressure fluctuations, forming high-pressure zones near the transfer point (385.62 Pa) and cutterhead (174.26 Pa) due to momentum exchange, with the area-weighted pressure near the heading face rising sharply (200 Pa within 10 m) and stabilizing to 0.45 m/s at 30–40 m. Water curtains, modeled as porous media, create flow resistance and alter tunnel pressure distribution, with post-water curtain A pressure of 186.89 Pa and post-water curtain B pressure of 91.15 Pa.
Within approximately 5 m of the heading face, spray droplets are entrained by the ventilation jet and the cutterhead, dispersing across the full tunnel cross-section. Although these droplets do scavenge airborne dust, the resulting dust-laden mist remains suspended long enough to pose a respiratory hazard. To mitigate this risk, we recommend using a higher-density spraying medium (for example, water containing dissolved salts or other benign weighting additives) so that the dust-droplet agglomerates settle more rapidly out of the breathing zone.

Author Contributions

Conceptualization, L.F. and C.-Y.W.; methodology, L.F. and C.-Y.W.; formal analysis, L.F. and C.-Y.W.; writing—original draft preparation, C.-Y.W.; writing—review and editing, L.F., Y.-T.L. and H.-Q.A. All authors have read and agreed to the published version of the manuscript.

Funding

We acknowledge the financial support from the National Natural Science Foundation of China (Grant Nos. 12388101 and U2341231) and the Science Center for Gas Turbine Project (Grant No. P2022-C-III-001-001).

Data Availability Statement

The data that support the findings of this study are available from the corresponding author upon reasonable request.

Conflicts of Interest

The authors declare no conflicts of interest. The funders had no role in the design of the study; in the collection, analyses, or interpretation of data; in the writing of the manuscript; or in the decision to publish the results.

Abbreviations

The following abbreviations are used in this manuscript:
CFDComputational Fluid Dynamics
RANSReynolds-averaged approach
SSTShear Stress Transport
DPMDiscrete Phase Model

References

  1. Laney, A.S.; Weissman, D.N. Respiratory diseases caused by coal mine dust. J. Occup. Environ. Med. 2014, 56 (Suppl. 10), S18–S22. [Google Scholar] [CrossRef]
  2. Seaman, C.E.; Shahan, M.R.; Beck, T.W.; Mischler, S.E. Design of a water curtain to reduce accumulations of float coal dust in longwall returns. Int. J. Min. Sci. Technol. 2020, 30, 443–447. [Google Scholar] [CrossRef]
  3. Wang, X.Z.; Wang, P.F.; Li, S.L.; Chen, S.Q. Development and application of air-assisted spraying device for dust suppression on tunnel boring machine. Tunn. Undergr. Space Technol. 2025, 159, 106469. [Google Scholar] [CrossRef]
  4. Chang, P.; Chen, Y.P.; Xu, G.; Huang, J.X.; Ghosh, A.; Liu, W.V. Numerical study of coal dust behaviours and experimental investigation on coal dust suppression efficiency of surfactant solution by using wind tunnel tests. Energy Sources Part A Recovery Util. Environ. Eff. 2021, 43, 2173–2188. [Google Scholar]
  5. Lu, W.; Ouyang, X.P.; Zhu, W.J. Investigation of Water Spraying Distribution by Multi-points Characterization System in Simulation Tunnel. Pol. J. Environ. Stud. 2023, 32, 171–181. [Google Scholar] [CrossRef]
  6. Wang, C.Y.; Fang, L. An analytical scaling law model framework for short-time dust emission from belt conveyor. Adv. Powder Technol. 2024, 35, 104613. [Google Scholar] [CrossRef]
  7. Zhang, S.B.; Nie, W.; Guo, C.; Peng, H.T.; Ma, Q.X.; Xu, C.W.; Zhang, H.; Liu, Q.Y. Optimization of spray dust suppression device in return air tunnel of a coal mine based on CFD technology. Build. Environ. 2021, 203, 108059. [Google Scholar] [CrossRef]
  8. Guo, C.; Nie, W.; Xu, C.W.; Peng, H.T.; Zhang, C.C.; Li, S.L.; Yue, N.; Liu, Z.Q.; Yang, S.B.; Ma, Q.X.; et al. A study of the spray atomization and suppression of tunnel dust pollution based on a CFD-based simulation. J. Clean. Prod. 2020, 276, 123632. [Google Scholar] [CrossRef]
  9. Wang, C.Y.; Zhang, H.; Xue, T.; Fang, L. A multi-factor CFD simulation to dust suppression in dynamic tunnel excavation. Tunn. Undergr. Space Technol. 2025, 159, 106458. [Google Scholar] [CrossRef]
  10. Nie, W.; Guo, C.; Zhang, S.B.; Peng, H.T.; Xu, C.W.; Ma, Q.X.; Yuan, M.Y.; Zhou, W.W.; Guo, L.D.; Cheng, L. Optimization of spraying dust reduction technology of continuous miner machine and the dust environment in a tunnel, based on computational fluid dynamics (CFD) technology. Powder Technol. 2022, 398, 117044. [Google Scholar] [CrossRef]
  11. Peng, H.T.; Peng, Y.F.; Nie, W.; Liu, F.; Xu, C.W. Atomization law and dust reduction effect of air-atomizing nozzles determined by CFD and experiments. Energy 2025, 318, 134822. [Google Scholar] [CrossRef]
  12. Ma, Q.X.; Nie, W.; Yang, S.B.; Xu, C.W.; Peng, H.T.; Liu, Z.Q.; Guo, C.; Cai, X.J. Effect of spraying on coal dust diffusion in a coal mine based on a numerical simulation. Environ. Pollut. 2020, 264, 114717. [Google Scholar] [CrossRef]
  13. Zhong, W.; Zhang, Z.M.; Wu, Y.H.; Gao, Z.H. Research on the application mechanism of water mist curtain smoke blocking and heat blocking in tunnels. Indoor Built Environ. 2024, 34, 330–354. [Google Scholar] [CrossRef]
  14. Nie, W.; Yang, B.; Du, T.; Peng, H.T.; Zhang, X.; Zhang, Y.L. Dynamic dispersion and high-rise release of coal dust in the working surface of a large-scale mine and application of a new wet dust reduction technology. J. Clean. Prod. 2022, 351, 131356. [Google Scholar] [CrossRef]
  15. Olewski, T.; Basha, O.; Waldram, S.; Mannan, S.; Vechot, L. Mitigation of LNG Dispersion Using Two Dimensional (2D) Water Curtains. In Proceedings of the 22nd Hazards Symposium—Process Safety and Environmental Protection, Liverpool, UK, 11–14 April 2011; pp. 308–314. [Google Scholar]
  16. Menter, F.R. Zonal two equation k-w turbulence models for aerodynamic flows. In Proceedings of the 23rd Fluid Dynamics, Plasmadynamics, and Lasers Conference, Orlando, FL, USA, 6–9 July 1993; p. 2906. [Google Scholar]
  17. Menter, F.R. Two-equation eddy-viscosity turbulence models for engineering applications. AIAA J. 1994, 32, 1598–1605. [Google Scholar] [CrossRef]
  18. Smirnov, P.E.; Menter, F.R. Sensitization of the SST turbulence model to rotation and curvature by applying the Spalart–Shur correction term. J. Turbomach. 2009, 131, 041010. [Google Scholar] [CrossRef]
  19. Bec, J.; Cencini, M.; Hillerbrand, R. Heavy particles in incompressible flows: The large Stokes number asymptotics. Phys. D Nonlinear Phenom. 2007, 226, 11–22. [Google Scholar] [CrossRef]
  20. Maxey, M.R. The gravitational settling of aerosol particles in homogeneous turbulence and random flow fields. J. Fluid Mech. 2006, 174, 441–465. [Google Scholar] [CrossRef]
  21. Saffman, P.G. The lift on a small sphere in a slow shear flow. J. Fluid Mech. 1965, 22, 385–400. [Google Scholar] [CrossRef]
  22. Michaelides, E.E.; Sommerfeld, M.; Wachem, B.V. Multiphase Flows with Droplets and Particles, 3rd ed.; CRC Press: Boca Raton, FL, USA, 2022. [Google Scholar]
  23. Gosman, A.D.; Loannides, E. Aspects of computer simulation of liquid-fueled combustors. J. Energy 1983, 7, 482–490. [Google Scholar] [CrossRef]
  24. Fang, L.; Li, L.L.; Guo, J.S.; Liu, Y.W.; Huang, X.R. Time scale of directional change of active Brownian particles. Phys. Lett. A 2022, 427, 127934. [Google Scholar] [CrossRef]
  25. Morsi, S.A.; Alexander, A.J. An investigation of particle trajectories in two-phase flow systems. J. Fluid Mech. 2006, 55, 193–208. [Google Scholar] [CrossRef]
  26. Ansys® Fluent, Release 25.1. Help System, Fluent Theory Guide. ANSYS, Inc.: Canonsburg, PA, USA, 2025.
  27. Tew, R.; Simon, T.; Gedeon, D.; Ibrahim, M.; Rong, W. An initial non-equilibrium porous-media model for CFD simulation of Stirling regenerators. In Proceedings of the 4th International Energy Conversion Engineering Conference and Exhibit (IECEC), San Diego, CA, USA, 26–29 June 2006; p. 4003. [Google Scholar]
  28. Gorgun, E.; Dogu, Y.; Aksit, M.F. Investigation of Flow Behavior and Porous Medium Resistance Coefficients for Metallic-Cloth Fibers. Fibers 2020, 8, 75. [Google Scholar] [CrossRef]
  29. Schmidt, D.P.; Nouar, I.; Senecal, P.K.; Rutland, J.; Martin, J.K.; Reitz, R.D.; Hoffman, J.A. Pressure-swirl atomization in the near field. SAE Trans. 1999, 108, 471–484. [Google Scholar]
  30. Senecal, P.K.; Schmidt, D.P.; Nouar, I.; Rutland, C.J.; Reitz, R.D.; Corradini, M.L. Modeling high-speed viscous liquid sheet atomization. Int. J. Multiph. Flow 1999, 25, 1073–1097. [Google Scholar] [CrossRef]
  31. Weber, C. Zum Zerfall eines Flüssigkeitsstrahles. ZAMM-J. Appl. Math. Mech. Z. Für Angew. Math. Mech. 1931, 11, 136–154. [Google Scholar] [CrossRef]
  32. Dombrowski, N.; Hooper, P.C. The effect of ambient density on drop formation in sprays. Chem. Eng. Sci. 1962, 17, 291–305. [Google Scholar] [CrossRef]
  33. Tonello, N.; Eude, Y.; de Meux, B.D.L.; Ferrand, M. Frozen Rotor and Sliding Mesh Models Applied to the 3D Simulation of the Francis-99 Tokke Turbine with Code_Saturne. In Proceedings of the 2nd Workshop on Transient Operation of Francis Turbines (Francis-99), Lulea, Sweden, 14–15 December 2016. [Google Scholar]
Figure 1. Geometric schematic diagram of excavation tunnel.
Water 17 01600 g001
Figure 2. Grid quality and division detail.
Water 17 01600 g002
Figure 3. The airflow streamlines and contour map under halted operations.
Water 17 01600 g003
Figure 4. The air velocity distribution within the tunnel.
Water 17 01600 g004
Figure 5. The variations in air velocity at different Y cross-sections.
Water 17 01600 g005
Figure 6. The variations in air velocity at different Z cross-sections.
Water 17 01600 g006
Figure 7. Dynamic dispersion and residence time evolution of spray droplets.
Water 17 01600 g007
Figure 8. The spatial distributions of air velocity under device OFF and ON conditions.
Water 17 01600 g008
Figure 9. Airflow field comparison near the cutterhead under device OFF and ON conditions.
Water 17 01600 g009
Figure 10. Airflow field comparison near the transfer point under device OFF and ON conditions.
Water 17 01600 g010
Figure 11. The static pressure distributions under device OFF and ON conditions.
Water 17 01600 g011
Figure 12. The area-weighted static pressure changes with distance from the heading face.
Water 17 01600 g012
Figure 13. The area-weighted velocity changes with distance from the heading face.
Water 17 01600 g013
Table 1. Boundary conditions.
ItemNameParameter
Turbulence ModelKω SSTTransient
Double Precision
InletMass Flow Rate6.9355 kg/s
Slide Mesh MotionRotational Area
Rotational Velocity
Cutterhead
47.8 rev/min
Discrete Phase ModelInteractionInteraction with Continuous Phase
Update DPM Sources Every Flow Iteration
DPM Iteration Interval (10)
Tracking OptionMax. Number of Steps (700)
High-Res Tracking (ON)
Particle TreatmentUnsteady Particle Tracking
Track with Fluid Flow Time Step
Pressure Swirl
Atomizer
MaterialWater-liquid
Density998.2 kg/m3
TypePressure Swirl Atomizer
PositionCutterhead|Transfer point
Total Flow Rate0.83 kg/s
Upstream Pressure2.8 Mpa
Injector Inner Diameter5 mm
Spray Half Angle15°
Azimuthal Angle0–360°
Dispersion Angle
Sheet Constant12
Ligament Constant0.5
Table 2. Solver and numerical settings.
ItemNameParameter
Solution MethodsSolverCouple
TimeBounded Second Order Implicit
GradientLeast Squares Cell Based
PressurePRESTO!
MomentumThird-Order MUSCL
Turbulent Kinetic EnergyThird-Order MUSCL
Specific Dissipation RateThird-Order MUSCL
Time AdvancementTime Step Size0.0001 s
Max Iterations/Time Step20
Explicit Relaxation FactorsMomentum0.75
Pressure0.75
Under-Relaxation FactorsDensity1
Body Force1
Turbulent Kinetic Energy0.8
Specific Dissipation Rate0.8
Turbulent Viscosity1
Discrete Phase Source0.9
Convergence ResidualContinuity1 × 10−4
x-velocity1 × 10−4
y-velocity1 × 10−4
z-velocity1 × 10−4
k1 × 10−4
omega1 × 10−4
Disclaimer/Publisher’s Note: The statements, opinions and data contained in all publications are solely those of the individual author(s) and contributor(s) and not of MDPI and/or the editor(s). MDPI and/or the editor(s) disclaim responsibility for any injury to people or property resulting from any ideas, methods, instructions or products referred to in the content.

