Abstract
The electric submersible pump (ESP) is a critical component in subsurface resource extraction systems, yet the presence of gas in the working medium significantly affects its performance. To investigate the impact of impeller perforation on gas–liquid mixing and internal flow characteristics, unsteady numerical simulations were conducted based on the Euler–Euler multiphase flow model. The transient evolution of the gas phase distribution, flow behavior, and liquid phase turbulent entropy generation rate was analyzed under an inlet gas volume fraction of 5%. Results show that under part-load flow conditions, impeller perforation reduces the amplitude of dominant frequency fluctuations and enhances periodicity, thereby mitigating low-frequency disturbances. Under design flow conditions, it leads to stronger dominant frequencies and intensified low-frequency fluctuations. Gas phase distribution varies little under low and design flow rates, while at high flow rates, gas accumulations shift from the midsection to the outlet with rotor rotation. As the flow rate increases, liquid velocity rises, and flow streamlines become more uniform within the channels. Regions of high entropy generation coincide with high gas concentration zones: they are primarily located near the impeller inlet and suction side under low flow, concentrated at the inlet and mid-passage under design flow, and significantly reduced and shifted toward the impeller outlet under high flow conditions. The above results indicate that the perforation design of ESP impellers should be optimized according to operating conditions to improve gas dispersion paths and flow channel geometry. Under off-design conditions, perforations can enhance operational stability and transport performance, while under design conditions, the location and size of the perforations must be precisely controlled to balance efficiency and vibration suppression.
1. Introduction
Electric submersible pumps (ESPs) have a small outer diameter, high head, and good stability, which are suitable for downhole submersible operations and are widely used in groundwater extraction, agricultural irrigation, oil and gas development, and other fields [1,2]. The presence of gas in groundwater and crude oil inevitably affects the performance of ESPs [3,4]. When the pumped medium contains gas, a two-phase flow of gas and liquid occurs inside the pump. Gas accumulation in the impeller flow passage reduces the effective flow area, leading to head reduction, efficiency decrease, and even gas locking, which severely threatens the stable operation of ESPs [5,6,7].
To address the above issues, numerous studies have been conducted by scholars both domestically and internationally using numerical simulations and experimental methods to investigate the gas–liquid two-phase flow patterns inside pumps [8]. In terms of numerical simulation, García et al. [9] conducted numerical simulations of gas–liquid two-phase flow in a single-stage electric submersible pump under low flow rate and high inlet gas volume fraction (IGVF) conditions. They found that large-diameter bubbles tend to form cavities on the suction side of the blades, ultimately leading to gas–liquid separation and a reduction in pump efficiency. Shi et al. [10] used the SST k–ω turbulence model to simulate multiphase pumps under various IGVF conditions. The results show that gas accumulation primarily occurs near the pressure side of the impeller inlet, the blade tip clearance, and the blade suction side. As the IGVF increases, a distinct stratified structure and separated vortices appear in the tip clearance region. Ali et al. [11] combined visualization technology with numerical simulation to determine the impact of bubble size and rotational speed on ESP performance. They found that larger bubbles and lower speeds significantly degrade the ESP performance and concluded that higher rotational speeds lead to smaller bubble diameters. Gong et al. [12] applied the entropy generation method to analyze the distribution and scale of energy loss in hydraulic turbines. Since then, entropy generation theory has been widely employed in the analysis of internal energy losses in fluid machinery. Numerical results by Verde et al. [13] indicate that entropy generation in the mainstream region primarily originates from large-scale velocity gradients caused by flow separation, backflow, impingement, and vortices. In recent years, entropy generation theory has also been extended to the study of complex gas–liquid two-phase flows. Yan et al. [14] analyzed the entropy generation distribution in a three-stage ESP under different gas volume fractions, revealing a progressive increase in entropy generation from the impeller inlet to the outlet. Under high gas content conditions, the entropy generation becomes more significant, confirming the effectiveness of entropy generation theory in the energy loss analysis of ESPs. In terms of experimental studies, Murakami et al. [15,16] were the first authors to use visualization experiments to study bubble formation and changes in flow patterns on impeller pressure surfaces at high gas content, revealing that large bubbles are the primary cause of head reduction. Barrios et al. [17] tested ESP gas–liquid two-phase flow characteristics using visualization models and high-speed photography, discovering that gas accumulates on impeller pressure surfaces at a high gas content, lowering ESP performance. A proposed solution is to reduce the gas phase accumulation area to enhance performance. Cubas et al. [18] visualized ESPs and found that increasing the rotational speed reduces impeller bubble diameter, improving performance and boosting pump capability at higher gas contents. In summary, numerical simulations and experimental studies play an irreplaceable role in revealing the complex gas–liquid two-phase flow mechanisms within ESPs. The integration of both approaches provides reliable analytical tools and theoretical foundations for investigating ESP gas–liquid transport performance. However, a systematic understanding of the energy loss mechanisms within multistage ESPs under gas–liquid two-phase flow conditions remains lacking.
Although the aforementioned studies provide theoretical support for improving gas–liquid multiphase transport performance, most are still based on the structural principles of conventional centrifugal pumps for the ESP design and optimization. Existing structural optimization efforts primarily focus on adjusting the impeller tip clearance and adding balance holes. Luo et al. [19] explored the effect of balance hole location on centrifugal pump performance under gas–liquid two-phase conditions. Results showed that balance holes lower the ESP performance at a low inlet gas content but enhance it at a high gas content when located in the gas phase accumulation zones. Wang et al. [20] numerically simulated three different long and short blade arranged impellers and found that the closer the short blades are to the long blades’ suction surface, the smaller the gas phase accumulation area near the long blades, and the more significant the improvement in impeller flow conditions. Shi et al. [21] used high-speed photography and computational fluid dynamics; the study demonstrated that increasing the impeller tip clearance improves the uniformity of the gas–liquid phase distribution but worsens the pump’s pressure boost performance. Shi et al. [22] compared centrifugal pumps with different impeller tip clearances at a 10% inlet gas content. Results indicated that larger tip clearances intensify the irregular isobaric line changes near the blade tips but improve the gas phase accumulation in the impeller flow passage. Thus, current methods to boost ESP performance under gas–liquid two-phase conditions mainly involve adjusting the impeller tip clearance and adding balance holes. Although these methods somewhat enhance gas–liquid mixture transportation, they fail to effectively resolve the gas accumulation in the impeller flow passage.
Blade perforation, an emerging structural optimization approach, alters fluid flow paths and effectively reduces gas accumulation in the impeller flow passage. However, there are still relatively few studies on the specific effects of blade perforation on the unsteady flow characteristics in electric submersible pumps, particularly regarding the flow patterns and energy loss performance under different flow rates and gas void fraction conditions. Research in this area remains unsystematic. To address this, this paper conducts unsteady simulations of a single-stage ESP with and without blade perforations at a 5% gas content and various flow rates based on the Euler–Euler non-homogeneous flow model. The goal of this study is to investigate the impact of blade perforations on ESP internal flow and entropy generation distribution under two-phase gas–liquid conditions, thereby guiding the optimization of ESP design and enhancing gas–liquid mixture transportation.
2. Numerical Methodology
2.1. Governing Equations
The Euler–Euler model treats the gas and liquid phases as two interpenetrating continua and effectively captures the macroscopic behavior of gas–liquid two-phase flows. Thus, the Euler–Euler heterogeneous flow model is employed in this study. In numerical simulations, the Euler–Euler approach can be simplified into homogeneous and heterogeneous models. The heterogeneous model accounts for velocity slip, interphase momentum exchange, and interfacial forces, providing a more realistic representation of the actual flow conditions. Accordingly, the heterogeneous model is adopted herein. For turbulence modeling, the SST k–ω model [23] is applied to the liquid phase, as it combines the strengths of the standard k–ε and k–ω models and offers high adaptability and predictive accuracy [24,25]. The gas phase is modeled using a dispersed phase zero equation model [26] to reduce the computational complexity, which is well-suited to cases involving small-scale, sparsely distributed bubbles. Based on the above assumptions, the governing equations are expressed as follows:
Continuity equation:
Momentum equation:
where αk denotes the volume fraction, ρk the density, wk the relative velocity, and μk the dynamic viscosity of phase k. The interphase interaction force is represented by mk, and Fk denotes the body force.
2.2. Computational Model
The study’s subject is a single-stage electric submersible pump, with a designed flow rate of Qdes = 140.00 m3/d, a single-stage head of Hdes = 5.79 m, a rated speed of n = 2917 r/min, and a specific speed of ns = 85.40. The calculation model consists of the inlet, impeller, diffuser, casing, and outlet. Table 1 shows the geometric parameters of the impeller and the diffuser. To enhance the fully-developed flow at the inlet and outlet, the lengths of the inlet and outlet sections of the electric submersible pump are extended to five and ten times the outer diameter of the impeller inlet, respectively, to prevent recirculation flow and reduce vortex losses. The entire computational domain is modeled using the three-dimensional modeling software UG-NX 12.0. For the blade-perforated electric submersible pump selected in the paper, the distance from the hole center to the blade center was 27.5 mm, the hole diameter was 5 mm, and the hole cross-sectional area was 19.63 mm2. The impeller with a blade perforation and the corresponding perforation parameters are shown in Figure 1 and Figure 2.

Table 1.
Geometry parameters.
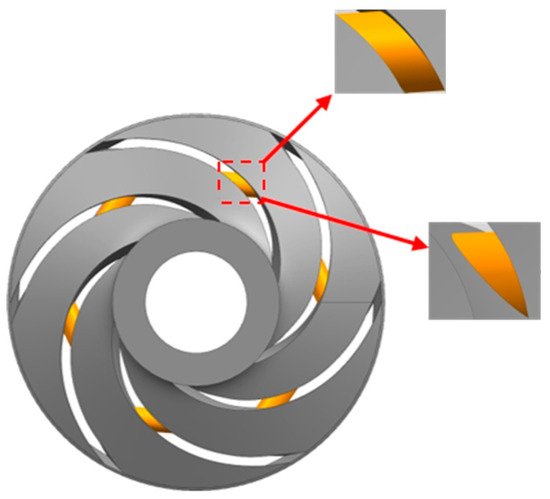
Figure 1.
Impeller with blade perforation.
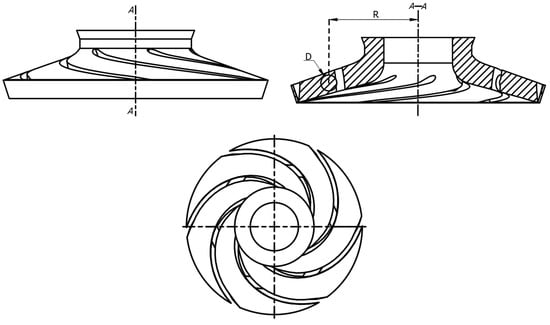
Figure 2.
Blade perforation parameters.
2.3. Mesh Independence Verification
Before computational fluid dynamics (CFD) computation, the calculation domain must be partitioned into multiple sub-regions with high-precision mesh quality to ensure computational accuracy and convergence. This study used ICEM 19.0 software to generate structured meshes for the cavity, impeller, diffuser, and inlet/outlet flow passages of the unperforated electric submersible pump, with the meshing results shown in Figure 3.

Figure 3.
Computational domain meshing. (a) Diffuser, casing, inlet, and outlet; (b) impeller.
During simulation, the quantity of mesh significantly impacts the results. Excessively dense meshes slow down calculations, while too sparse meshes compromise accuracy. Therefore, an appropriate meshing scheme is necessary to balance speed and accuracy. This study conducts simulation calculations with five different meshing schemes and computes the head at the design flow rate. As shown in Figure 4, the head tends to stabilize as the mesh element number increases. Ultimately, considering the balance between computational cost and accuracy, the mesh scheme with a total mesh count of 2,593,236 is selected for the simulation calculations.

Figure 4.
Mesh independence analysis.
2.4. Numerical Simulation Boundary Conditions
This study utilized the ANSYS-CFX 2021 R2 software for numerical calculations. Both phases were set as incompressible fluids, with the continuous phase modeled using the SST k–ω turbulence model and a turbulence intensity of 5%. The dispersed phase utilizes the dispersed phase zero equation model, with interphase transfer modeled through a particle-based approach. Based on the force balance between external disruptive forces and surface tension, Barrios [27] proposes a bubble diameter prediction model, which was later modified by Wang et al. [28], as shown in Equation (3). In this study, the modified model is applied to predict the bubble diameter db of an ESP under the condition of IGVF = 5%, yielding a value of 0.2 mm. It is assumed that the bubble diameter remains constant during the flow, and the surface tension coefficient of the gas phase is taken as 0.0739 N/m [20]. Mesh interfaces between flow domains were set the same as under pure water conditions, with a convergence precision of 10−4. Detailed parameter explanations are shown in Table 2. The steady-state calculation results were used as the initial values for the transient calculations. In the non-steady-state numerical calculation, the transient rotor–stator mode was adopted for the dynamic and static interfaces. The total time for the unsteady calculation was set to T = 0.30726 s, equivalent to 15 impeller rotations. The time step was set to the time for a 2° impeller rotation, ΔT = 0.0001138 s.
Table 2.
Description of gas–liquid two-phase simulation parameters.
3. Experimental Testing
3.1. Experimental Apparatus
To verify the accuracy of the simulation results, experimental tests were conducted on a single-stage electric submersible pump physical model. The test equipment includes a ZNX-AK flowmeter (FLOWSTED, Suzhou, China) and an SGDN torque meter (HENGGANG, Shanghai, China), with measurement accuracies of ±0.1% and ±0.5%, respectively. The experimental setup utilized an open electric submersible pump test bench, with the impeller and diffuser precision cast from stainless steel to ensure dimensional accuracy. A schematic of the test bench is shown in Figure 5. Comparing the experimental results with the simulation calculations can effectively validate the accuracy of the simulation.
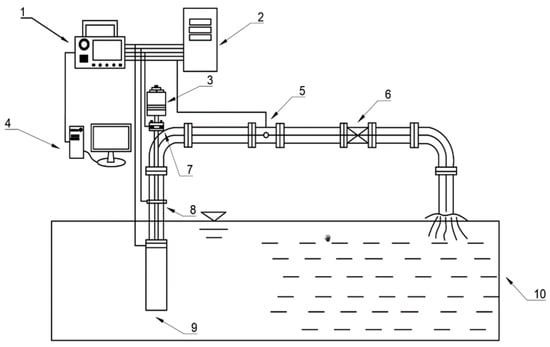
Figure 5.
Schematic of the external characteristics test rig. 1. Data logger. 2. Power distribution cabinet. 3. Electric motor. 4. Computer. 5. Flowmeter. 6. Discharge pipeline valve. 7. Torque meter. 8. Discharge pipeline. 9. Electric submersible pump. 10. Open sump.
3.2. Experimental Validation
Using the established numerical simulation method and meshing scheme, this section presents a simulation calculation for a single-stage electric submersible pump without blade perforations under pure water conditions at a speed of 2917 rpm. Numerical simulations were carried out at flow rates of 0.6 Qdes, 0.8 Qdes, 1.0 Qdes, 1.2 Qdes, and 1.4 Qdes, respectively. Figure 6 compares the simulation results with the hydraulic performance test data. This comparison validates the simulation’s accuracy and provides a baseline for further research. The simulation overestimates the head due to the exclusion of balance holes and inlet clearance, and the shaft power differs from the experimental values because it neglects volumetric and mechanical losses, including transmission and friction losses. However, the simulation-predicted trends in head, efficiency, and shaft power of the electric submersible pump generally match the test results, indicating reliable numerical results, a suitable meshing scheme, and a high-precision numerical method. Reliable experimental results depend on maintaining an acceptable measurement uncertainty. In this study, we evaluated the uncertainties associated with each instrument used and calculated the overall system uncertainty accordingly. The flow rate was measured using an electromagnetic flowmeter with an accuracy of ±0.1%. Inlet and outlet pressures were monitored by two intelligent pressure transmitters with an accuracy of ±0.2%. Rotational speed and torque were measured using sensors with an accuracy grade of ±0.5%. Based on these values, the estimated overall system uncertainty for efficiency measurements in this experiment is 0.43%.

Figure 6.
Comparison of test and simulation results for external characteristics of ESP.
4. Results and Discussions
4.1. Pressure Fluctuation Analysis
To determine the pressure fluctuation characteristics within the electric submersible pump, multiple monitoring points were established on the impeller both before and after perforation. Ten monitoring points were arranged on the 0.5-span cross-section of the impeller flow passage, five each on the suction and pressure sides of the blade. On the suction side, they were labeled S1 to S5 from the impeller inlet to the outlet; on the pressure side, P1 to P5 in the same order, as shown in Figure 7. After numerical simulation, pressure fluctuation signals were obtained from these points. To analyze them, both time-domain and frequency-domain methods were used. To better process the data, the pressure fluctuation coefficient Cp, defined as follows, was used as a dimensionless measure of fluctuation intensity:
where P is the static pressure at the monitoring point, in pascals (Pa); is the average static pressure at the monitoring point over one impeller rotation cycle, also in pascals (Pa); ρ is the density of the liquid medium (kg/m3); and u2 is the circumferential speed at the impeller outlet (m/s).

Figure 7.
Distribution of pressure fluctuation monitoring points.
The pressure fluctuation is further analyzed by transforming the time-domain information into frequency-domain information using the Fast Fourier Transform (FFT). The Fourier transform of function f(t) is as follows:
The frequency-domain analysis is based on multiples of the rotational frequency, defined as follows:
where n is the impeller speed in rpm. For this electric submersible pump, with a speed of 2917 rpm, the rotational frequency was 48.6 Hz. The blade passing frequency can be calculated as
where fY is the blade passing frequency of the impeller in Hz, and ZY is the number of impeller blades, which is six in this study. Therefore, the blade passing frequency fY of the impeller in this study is 291.6 Hz. Then the diffuser blade passing frequency was calculated as follows:
where fD is the diffuser blade passing frequency in Hz, and ZD is the number of diffuser blades, which is nine in this study. The diffuser blade passing frequency fD was calculated and found to be 437.4 Hz.
4.1.1. Time-Domain Analysis
This study investigated the time-domain analysis of pressure fluctuations before and after blade perforation, as shown in Figure 8, under an inlet gas concentration of 5% and at the design flow rate (1.0 Qdes). It is seen that the pressure fluctuation curves for both the unperforated and perforated blades exhibit a clear periodicity. Observing the time-domain graph of pressure fluctuations, both blades show significant peaks and valleys on both the pressure and suction sides, consistent with the number of diffuser blades. For both types of blades, the fluctuation amplitude increases from the inlet to the outlet, correlating with the changes in pressure distribution within the impeller flow passage and indicating suitable gas–liquid transportation performance with fewer large-scale bubbles. Notably, the pressure side fluctuation amplitude exceeds that on the suction side for both blades. Compared to the unperforated blade, the perforated blade shows a significantly larger pressure side fluctuation amplitude and a more erratic curve. The fluctuation amplitude on the pressure side increased by approximately 8.3%, suggesting enhanced gas phase accumulation on the pressure side and increased flow instability within the impeller flow passage at the design flow rate.

Figure 8.
Time-domain analysis of pressure fluctuations under 1.0 Qdes. (a) Pressure side, without blade perforation; (b) suction side, without blade perforation; (c) pressure side, with blade perforation; (d) suction side, with blade perforation.
Also, when considering an inlet gas concentration of 5% and at the low flow rate of 0.6 Qdes, the time-domain pressure fluctuation curves for both blade types exhibit irregular fluctuations, less periodicity than at the design flow rate, and higher amplitudes, especially in the middle of the impeller flow passage, as shown in Figure 9. This is because the flow pattern is more complex under low flow rate conditions in gas–liquid two-phase flow. When gas flows through the impeller passage, it tends to accumulate due to the influence of the blades, altering the gas pressure distribution and affecting the pressure fluctuation characteristics. The less apparent periodicity at low flow rates suggests a more severe gas phase accumulation than under design conditions. After perforation, the pressure fluctuation amplitudes on both the pressure and suction sides of the blade are lower than those of the unperforated blade, the fluctuation amplitude on the pressure side increases by approximately 34.4%, and the fluctuation curves become more regular. This suggests that the impeller flow passage is more stable, and the gas phase accumulation is reduced after perforation, further confirming the previous conclusion that perforation improves gas–liquid transportation performance at low flow rates.

Figure 9.
Time-domain analysis of pressure fluctuations under 0.6 Qdes. (a) Pressure side, without blade perforation; (b) suction side, without blade perforation; (c) pressure side, with blade perforation; (d) suction side, with blade perforation.
In addition, the pressure fluctuation curves on the suction and pressure sides of the blades with and without perforations were investigated at a high flow rate (1.4 Qdes) and an inlet gas concentration of 5%, as shown in Figure 10. It is seen that the fluctuations are more irregular, with less obvious periodicity than at the other flow rates. This is due to the increased flow velocity and more complex gas–liquid two-phase flow conditions. At high flow rates, the increased velocity of the gas–liquid two-phase flow causes the gas to experience greater inertial forces as it passes through the impeller flow passage, leading to more complex gas motion [29]. Additionally, the gas phase tends to accumulate more severely under these conditions, resulting in a more uneven gas pressure distribution and, consequently, more irregular pressure fluctuation curves. After perforation of the holes, the pulsation amplitude decreases, with the maximum fluctuation amplitude on the pressure side reduced by approximately 42.9%, and the periodicity relatively enhanced. This indicates a significant improvement in the gas phase accumulation.

Figure 10.
Time-domain analysis of pressure fluctuations under 1.4 Qdes. (a) Pressure side, without blade perforation; (b) suction side, without blade perforation; (c) pressure side, with blade perforation; (d) suction side, with blade perforation.
For the unperforated impeller, the fluctuation amplitudes at various monitoring points are consistently high and exhibit irregular patterns. This indicates a heightened flow instability and significant accumulation of gas in the impeller flow passage. In contrast, the perforated impeller shows reduced fluctuation amplitudes and a more defined periodicity, suggesting a notable improvement in the gas phase accumulation phenomenon. This demonstrates that blade perforation at high flow rates enhances the gas–liquid two-phase flow characteristics, reduces the gas phase accumulation, and leads to a more uniform gas pressure distribution, thereby decreasing the irregularity of the pressure fluctuations.
Moreover, observations of the pressure fluctuations under gas–liquid two-phase conditions at three different flow rates reveal that the fluctuation amplitude initially decreases and then increases with an increasing flow rate. In gas–liquid two-phase flow, the interaction between the bubbles and the liquid varies with flow rate, influencing the fluctuation amplitude. At low flow rates, weak gas–liquid interaction due to poor mixing results in significant fluctuations. As the flow rate increases, enhanced mixing and interaction reduce the amplitude of fluctuations. However, at very high flow rates, the complex gas–liquid interaction and intensified fluctuations increase the fluctuation amplitude.
4.1.2. Frequency-Domain Analysis
This study investigated the frequency-domain analysis of pressure fluctuations before and after blade perforation. Figure 11 presents the pressure fluctuation frequency-domain diagrams of the blades with and without perforations at the design flow rate (1.0 Qdes) and an inlet gas concentration of 5%. The main frequency fluctuation signals of both blades are at the rotational frequency and increase in the direction of flow. The presence of gas intensifies the unstable flow, causing fluctuation signals in the low-frequency range. The diffuser’s static–dynamic interference results in fluctuation signals at the diffuser blade passing frequency, with the greatest impact at the outlet. Comparing the perforated and unperforated blades, the perforated blade exhibits more significant fluctuations in low-frequency signals and larger amplitudes, indicating increased gas phase accumulation and more pronounced gas–liquid separation. This further explains the changes in the gas phase distribution after perforation, as mentioned earlier.
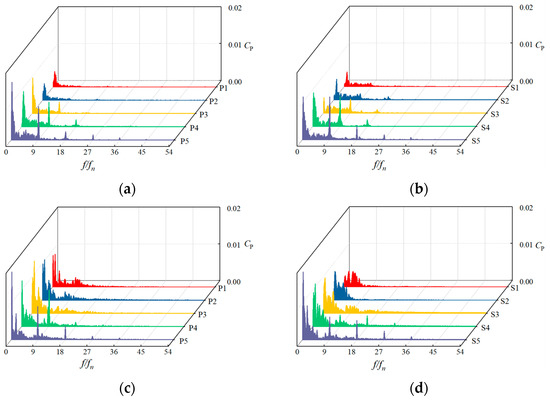
Figure 11.
Frequency domain analysis of impeller suction surface and pressure surface pressure pulsation at 1.0 Qdes. (a) Pressure side, without blade perforation; (b) suction side, without blade perforation; (c) pressure side, with blade perforation; (d) suction side, with blade perforation.
Furthermore, Figure 12 shows the pressure fluctuation frequency-domain curves of the suction and pressure sides of the blades with and without perforations at a low flow rate (0.6 Qdes) and an inlet gas concentration of 5%. Each monitoring point on both blades shows dominant frequency signals at the rotational frequency. The low-frequency range signals are chaotic and irregular. The dominant frequency signals at low flow rates are more substantial than those at the design flow rate, indicating unstable flow and aggravated gas phase accumulation in the impeller passage at low flow rates. After perforation, the dominant frequency signals on both the pressure and suction sides of the blade are weaker than those of the unperforated blade, indicating that the gas phase accumulation in the impeller passage is somewhat suppressed, and the flow is more stable at low flow rates.

Figure 12.
Frequency domain analysis of impeller suction surface and pressure surface pressure pulsation at 0.6 Qdes. (a) Pressure side, without blade perforation; (b) suction side, without blade perforation; (c) pressure side, with blade perforation; (d) suction side, with blade perforation.
Figure 13 shows the pressure fluctuation frequency-domain curves of the blades with and without perforations at a high flow rate (1.4 Qdes) and an inlet gas concentration of 5%. For both blades, the dominant frequency of pressure fluctuations appears in the low-frequency range, with consistent signal strength across monitoring points and significant low-frequency fluctuations, similar to the low flow rate case. Comparing the perforated and unperforated blades, the perforated blade exhibits reduced dominant frequency signal strength and weaker low-frequency fluctuations. This is because the perforations increase the flow passage, disperse the large bubbles with the fluid exiting the holes, and enhance flow uniformity, thereby improving the ESP’s performance and stability.

Figure 13.
Frequency domain analysis of impeller suction surface and pressure surface pressure pulsation at 1.4 Qdes. (a) Pressure side, without blade perforation; (b) suction side, without blade perforation; (c) pressure side, with blade perforation; (d) suction side, with blade perforation.
4.2. Unsteady Analysis of the Internal Flow Field
At an inlet gas concentration of 5%, the gas phase distribution, liquid phase velocity streamlines, and turbulent entropy generation dissipation on the middle cross-section of the impeller flow passage of a blade-perforated electric submersible pump were analyzed for three flow rates (0.6 Qdes, 1.0 Qdes, and 1.4 Qdes) to investigate the transient characteristics of the internal flow field of the blade-perforated pump. Figure 14 illustrates the transient gas phase distribution in the impeller flow passage of a perforated electric submersible pump at 1.4 Qdes and a 5% inlet gas concentration. The high gas content areas decrease over time. Fluid passing through the holes disperses the large bubbles near the outlet of the impeller flow passage into smaller ones, thereby reducing gas phase accumulation, improving gas–liquid separation, and enhancing mixing. This allows the liquid to carry gas away from the impeller flow passage more easily. At time T0, the gas is mainly distributed in the middle and inlet of the impeller flow passage, with uneven distribution across different passages. From T0 to T0 + 0.8T, the gas is gradually transported to the outlet of the impeller flow passage. By T0 + 0.8T, almost all the gas has been transported to the following passage. At T0 + 1.0T, gas begins to accumulate again at the impeller inlet for the next cycle. However, due to the instability and complexity of the gas–liquid two-phase flow, the distribution in the next cycle differs from the previous one. In summary, at a 5% inlet gas concentration and 1.4 Qdes flow rate, the gas phase distribution exhibits clear periodicity. The holes disperse the large bubbles, blocking the flow passage. Within a single impeller rotation cycle, the location of the gas phase accumulation shifts from the middle and inlet of the impeller flow passage towards the outlet.

Figure 14.
ESP Gas phase transient distribution in ESP with blade perforation under 1.4 Qdes. (a) T0; (b) T0 + 0.2T; (c) T0 + 0.4T; (d) T0 + 0.8T; (e) T0 + 1.0T.
Figure 15 shows the gas phase distribution in a blade-perforated electric submersible pump at 1.0 Qdes and a 5% inlet gas concentration. The distribution exhibits weak periodicity and insignificant changes, with the gas mainly in an elongated shape in the middle of the impeller flow passage. This weak periodicity may be due to the relatively slow fluid velocity at the design flow rate compared to the high flow rate. At 1.4 Qdes, the dispersed small bubbles travel with the liquid phase to the impeller flow passage outlet and then to the following flow component. The lower velocity at the design flow rate may cause large bubbles to form before the previous ones exit the passage. To verify this, the gas phase distribution in a single impeller passage was studied. The figure shows the gas phase distribution in the middle cross-section of the impeller passage from bubble formation to exit (black dashed area). At T0, a large bubble is in the middle of the passage. By T0 + 0.11T, it deforms and moves towards the outlet due to the impact of fluid from the holes. At T0 + 0.22T, it continues towards the outlet while a new large bubble forms. At T0 + 0.33T, it still flows towards the outlet and a long gas accumulation form. It exits the passage at T0 + 0.44T. This confirms the hypothesis: the slower velocity at the design flow rate causes a new large bubble to form before the previous one exits, resulting in an irregular gas phase distribution and performance decline.
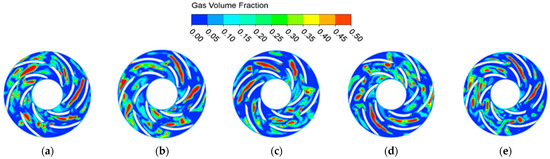
Figure 15.
ESP Gas phase transient distribution in ESP with blade perforation under 1.0 Qdes. (a) T0; (b) T0 + 0.2T; (c) T0 + 0.4T; (d) T0 + 0.8T; (e) T0 + 1.0T.
Figure 16 presents the transient gas phase distribution in a blade-perforated electric submersible pump at 0.6 Qdes and a 5% inlet gas concentration. From T0 to T0 + 1.0T, regions with high gas volume fractions appear at the impeller passage inlet, with no significant periodic changes and larger gas phase distributions at the outlet. Overall, at low flow rates, the transient gas phase changes in the blade-perforated pump are not apparent. This may be because gas accumulation at the inlet reduces the effective flow area, thereby exacerbating gas accumulation at the outlet. The further reduced velocity at low flow rates weakens the impact of the fluid exiting the holes at the gas accumulation location, prolonging the bubble’s cycle to the following flow component. The figure indicates that this region exhibits a clear periodicity. At T0, it is situated at the junction of the hole and the back surface with a considerable scale. By T0 + 0.15T, the fluid from the hole deforms this large bubble, but the low flow rate results in an insufficient impact to fully disperse it. At T0 + 0.3T, the large bubble reverts to its original state, with low-scale bubbles around it. At T0 + 0.45T, it is impacted again, and at T0 + 0.6T, it enlarges due to coalescence with neighboring low-scale bubbles. The gas accumulation at the impeller passage inlet and outlet reduces the effective flow area. The low flow rate also decreases the fluid velocity within the passage, weakening the impact force and resulting in minimal bubble changes, which intensify gas–liquid separation and internal flow instability.

Figure 16.
ESP Gas phase transient distribution in ESP with blade perforation under 0.6 Qdes. (a) T0; (b) T0 + 0.2T; (c) T0 + 0.4T; (d) T0 + 0.8T; (e) T0 + 1.0T.
4.3. Unsteady Distribution of Liquid Phase Streamlines
Figure 17 shows the variation in liquid phase streamlines in a blade-perforated electric submersible pump at different flow rates with an inlet gas concentration of 5%. As the flow rate increases, the liquid phase velocity and the uniformity of the streamlines in the impeller passage increase, confirming the previous hypotheses. The liquid phase flow pattern is closely related to the gas phase distribution; greater gas accumulation reduces the effective flow area, leading to a sparser streamline distribution. At low flow rates, the periodic variation in the liquid phase streamlines is not significant, with noticeable backflow at the impeller passage inlet and distinct gas–liquid separation. Larger high gas volume fraction regions correspond to more significant backflow, and some passages have smaller effective flow areas with sparse streamlines [30]. At the design flow rate, large-scale low-velocity backflow vortices also appear at the inlet, and the variation in liquid phase streamlines over time is not obvious. This is because the instantaneous gas phase distribution changes little under these two conditions, resulting in insignificant variations in the effective flow area and making the periodic variation of liquid phase streamlines over time less obvious. The transient distribution pattern of liquid phase streamlines at high flow rates is consistent with that of the gas phase, becoming more uniform and stable from T0 to T0 + 1.0T.

Figure 17.
Transient streamlines distribution of ESP with blade perforation under different flow rates. (a) 0.6 Qdes; (b) 1.0 Qdes s; (c) 1.4 Qdes.
4.4. Unsteady Distribution of Liquid Phase Turbulent Entropy Generation Dissipation Rate
The entropy generation in the electric submersible pump originates from three main aspects: fluctuating velocity, wall effects, and time-averaged velocity, with the entropy generation triggered by velocity fluctuations in centrifugal pumps accounting for the majority of the total entropy generation [31,32]. Figure 18 shows the instantaneous variation of the liquid phase turbulent entropy generation dissipation rate in a perforated ESP under different flow rates at an inlet gas concentration of 5%. In the low flow rate conditions, regions with high entropy generation rates are located on the pressure side of the impeller inlet and on the suction side near the center of the impeller passage. There are also extensive areas of high entropy generation rates at the outlets of some passages. The distribution of turbulence-induced entropy generation loss locations within the ESP differs little across various flow rates. At the design flow rate, large-area entropy generation regions appear at the impeller passage inlet and middle, with little difference in the distribution of liquid phase turbulence-induced entropy generation loss locations across various time points [33,34]. In the high flow rate conditions, the distribution of high entropy generation regions vary significantly across different time points. At time T0, these regions are located at the passage inlet and middle. From T0 to T0 + 1.0T, they first move towards the passage outlet and then return to the impeller passage inlet and middle by T0 + 1.0T. A comparison of the gas phase transient distribution charts for the perforated ESP under the three flow rates clearly shows that the high entropy generation regions are consistent with the high gas content regions. Moreover, in the high flow rate conditions, the high entropy generation regions are smaller than those in the other two working conditions.

Figure 18.
Transient distribution of liquid phase turbulent dissipative entropy rate of ESP with blade perforation under different flow rates. (a) 0.6 Qdes; (b) 1.0 Qdes; (c) 1.4 Qdes.
5. Conclusions
In this study, the unsteady pressure fluctuations of ESPs with and without blade perforations were compared at an inlet gas concentration of 5% and varying flow rates. This study investigated the instantaneous gas phase distribution, liquid phase streamline distribution, and turbulent entropy generation dissipation rate distribution of the perforated ESP at three flow rates to understand its internal flow field distribution patterns. The primary outcomes of this study are summarized as follows:
- (1)
- This study analyzes and compares the pressure fluctuations at monitoring points on the suction and pressure sides of the impeller blades in open-hole and closed-hole ESPs under three different flow rates. The results show that at off-design flow rates of 0.6 Qdes and 1.4 Qdes, blade perforation reduces the fluctuation amplitude and enhances periodicity, with the maximum fluctuation amplitude on the pressure side decreasing by approximately 34.4% and 42.9%, respectively, and reduces the fluctuations and amplitudes in the low-frequency range. However, at the design flow rate of 1.0 Qdes, blade perforation increases the fluctuation amplitude and causes more chaotic fluctuations in the low-frequency range, with the maximum pressure side fluctuation amplitude increasing by 8.3%.
- (2)
- The study of instantaneous gas phase distribution in the open-channel ESP under three flow conditions reveals that, at the design flow rate, gas concentrates in the middle of the flow passages. At low flow rates, a high gas content region forms near the inlet, with significant gas–liquid separation occurring in the midsection. At high flow rates, the gas accumulation zone shifts from the inlet and midsection toward the outlet over a single cycle.
- (3)
- The study of instantaneous streamline distribution in an open-channel ESP under three flow rates reveals that the effective flow area of the impeller passages is closely related to the degree of gas accumulation. At low and design flow conditions, large-scale low velocity recirculation vortices form near the impeller inlet. However, under high flow conditions, these recirculation vortices disappear, significantly improving the backflow phenomenon.
- (4)
- The analysis of turbulent entropy generation dissipation rates in the open-channel ESP under three flow conditions shows that high entropy generation regions typically coincide with areas of high gas volume fraction. At low flow rates, entropy generation is mainly concentrated near the inlet and midsection of the blade suction side, with little variation over time. Under the design flow rate, high entropy generation appears at the inlet and midsection, with the distribution of high dissipation zones remaining relatively stable across time. At high flow rates, the high entropy generation region shifts progressively from the impeller inlet to the outlet over time.
These findings suggest that the design of ESP structures should incorporate impeller perforation configurations tailored to the specific operating conditions to optimize gas dispersion paths and local flow channel geometry. Blade perforations contribute to an improved operational stability and transport performance under off-design conditions; however, under design conditions, the location and size of the perforations must be carefully controlled to balance efficiency and vibration suppression.
Author Contributions
Conceptualization, S.L. and L.Z.; methodology, Y.Z.; software, J.W.; validation, S.L., Y.Z. and J.B.; formal analysis, J.D.; investigation, Y.Z. and H.Z.; resources, H.Z.; data curation, J.B.; writing—original draft preparation, S.L. and J.W.; writing—review and editing, J.B. and L.Z.; visualization, Y.Z.; supervision, L.Z.; project administration, J.D.; funding acquisition, L.Z. All authors have read and agreed to the published version of the manuscript.
Funding
This work was supported by Nature Science Foundation of Jiangsu Province (Grant No. BK20230011).
Data Availability Statement
The data presented in this article are available upon request from the corresponding author.
Conflicts of Interest
S.L., J.B., and H.Z. were employed by CNOOC China Limited, Tianjin Branch. Y.Z. and J.D were employed by China Oilfield Services Limited. The remaining authors declare that the research was conducted in the absence of any commercial or financial relationships that could be construed as a potential conflict of interest.
References
- Zhu, H.; Zhu, J.; Zhang, H. Mechanistic modeling of gas effect on multi–stage Electrical Submersible Pump (ESP) performance with experimental validation. Chem. Eng. Sci. 2022, 252, 117288. [Google Scholar] [CrossRef]
- Zhou, L.; Wang, S.; Fu, J.; Bai, L.; Chen, J. Numerical and experimental study of viscosity effects on an electric submersible pump. Phys. Fluids 2025, 37, 035162. [Google Scholar] [CrossRef]
- Hang, J.; Bai, L.; Zhou, L.; Jiang, L.; Shi, W.; Agarwal, R. Inter–stage energy characteristics of electrical submersible pump under gassy conditions. Energy 2022, 256, 124624. [Google Scholar] [CrossRef]
- Aydin, H.; Merey, S. Design of Electrical Submersible Pump system in geothermal wells: A case study from West Anatolia, Turkey. Energy 2021, 230, 120891. [Google Scholar] [CrossRef]
- Bulgarelli, N.A.V.; Biazussi, J.L.; Verde, W.M.; Perles, C.E.; de Castro, M.S.; Bannwart, A.C. Experimental investigation on the performance of Electrical Submersible Pump (ESP) operating with unstable water/oil emulsions. J. Pet. Sci. Eng. 2021, 197, 107900. [Google Scholar] [CrossRef]
- Li, H.; Yang, J.; Zhang, W.; Hu, L.; Liang, A.; Yao, Z. Energy performance and unsteady gas-liquid flow characteristics of a multiphase rotodynamic pump: An experiment. Appl. Energy 2024, 375, 124112. [Google Scholar] [CrossRef]
- Jiang, Y.; Tang, Y.; Li, H. A review of trends in the use of sewage irrigation technology from the livestock and poultry breeding industries for farmlands. Irrig. Sci. 2022, 40, 297–308. [Google Scholar] [CrossRef]
- Shi, G.; Wang, S.; Xiao, Y.; Liu, Z.; Li, H.; Liu, X. Effect of cavitation on energy conversion characteristics of a multiphase pump. Renew. Energy 2021, 177, 1308–1320. [Google Scholar] [CrossRef]
- García, J.A.; Asuaje, M.; Pereyra, E.; Ratkovich, N. Analysis of two–phase gas–liquid flow in an Electric Submersible Pump using A CFD approach. Geoenergy Sci. Eng. 2024, 233, 212510. [Google Scholar] [CrossRef]
- Shi, G.; Liu, Z.; Xiao, Y.; Yang, H.; Li, H.; Liu, X. Effect of the inlet gas void fraction on the tip leakage vortex in a multiphase pump. Renew. Energy 2020, 150, 46–57. [Google Scholar] [CrossRef]
- Ali, A.; Yuan, J.; Deng, F.; Wang, B.; Liu, L.; Si, Q.; Buttar, N.A. Research progress and prospects of multi–stage centrifugal pump capability for handling gas–liquid multiphase flow: Comparison and empirical model validation. Energies 2021, 14, 896. [Google Scholar] [CrossRef]
- Gong, R.; Wang, H.; Chen, L.; Li, D.; Zhang, H.; Wei, X. Application of entropy production theory to hydro-turbine hydraulic analysis. Sci. China Technol. Sci. 2013, 56, 1636–1643. [Google Scholar] [CrossRef]
- Verde, W.; Biazussi, J.; Sassim, N.; Bannwart, A.C. Experimental studyof gas-liquid two-phase flow patterns within centrifugal pumps impellers. Exp. Therm. Fluid Sci. 2017, 85, 37–51. [Google Scholar] [CrossRef]
- Yan, S.; Luo, X.; Sun, S.; Zhang, L.; Chen, S.; Feng, J. Influence of inlet gas volume fraction on energy conversion characteristics of multistage electric submersible pump. J. Pet. Sci. Eng. 2021, 207, 109164. [Google Scholar] [CrossRef]
- Murakami, M.; Minemura, K. Effects of entrained air on the performance of a centrifugal pump: 1st report, performance and flow conditions. Bull. JSME 1974, 17, 1047–1055. [Google Scholar] [CrossRef]
- Murakami, M.; Minemura, K. Effects of entrained air on the performance of centrifugal pumps: 2nd report, effects of number of blades. Bull. JSME 1974, 17, 1286–1295. [Google Scholar] [CrossRef]
- Barrios, L. Visualization and Modeling of Multiphase Performance Inside an Electrical Submersible Pump. Ph.D. Thesis, The University of Tulsa, Tulsa, OK, USA, 2007. [Google Scholar]
- Cubas, J.; Stel, H.; Ofuchi, E.; Marcelino Neto, M.A.; Morales, R.E.M. Visualization of two–phase gas–liquid flow in a radial centrifugal pump with a vaned diffuser. J. Pet. Sci. Eng. 2020, 187, 106848. [Google Scholar] [CrossRef]
- Luo, X.; Xie, H.; Feng, J.; Ge, Z.; Zhu, G. Influence of the balance hole on the performance of a gas–liquid two–phase centrifugal pump. Ocean Eng. 2022, 244, 110316. [Google Scholar] [CrossRef]
- Wang, B.; Zhang, H.; Deng, F.; Wang, C.; Si, Q. Effect of Short Blade Circumferential Position Arrangement on Gas–Liquid Two–Phase Flow Performance of Centrifugal Pump. Processes 2020, 8, 1317. [Google Scholar] [CrossRef]
- Shi, G.; Liu, Z.; Liu, X.; Xiao, Y.; Tang, X. Phase distribution in the tip clearance of a multiphase pump at multiple operating points and its effect on the pressure fluctuation intensity. Processes 2021, 9, 556. [Google Scholar] [CrossRef]
- Shi, G.; Liu, Z.; Wang, B. Effect of tip clearance on flow behaviors in a multiphase pump. J. Drain. Irrig. Mach. Eng. 2022, 40, 332–337. [Google Scholar]
- Zhang, W.; Xie, X.; Zhu, B.; Ma, Z. Analysis of phase interaction and gas holdup in a multistage multiphase rotodynamic pump based on a modified Euler two–fluid model. Renew. Energy 2021, 164, 1496–1507. [Google Scholar] [CrossRef]
- Shi, M.; Ruan, Y.; Wu, B.; Ye, Z.; Zhu, S. Performance evaluation of Hydrodynamic Vortex Separator at different hydraulic retention times applied in Recirculating Biofloc Technology system. Trans. ASABE 2017, 60, 1737–1747. [Google Scholar] [CrossRef]
- El-Emam, M.; Zhou, L.; Omara, A. Predicting the performance of aero-type cyclone separators with different spiral inlets under macroscopic bio-granular flow using CFD-DEM modelling. Biosyst. Eng. 2023, 233, 125–150. [Google Scholar] [CrossRef]
- Menter, F. Two–equation eddy–viscosity turbulence models for engineering applications. AIAA J. 1994, 32, 1598–1605. [Google Scholar] [CrossRef]
- Barrios, L.; Prado, G. Experimental visualization of two-phase flow inside an electrical submersible pump stage. J. Energy Resour. Technol. 2009, 133, 042901. [Google Scholar] [CrossRef]
- Wang, C.; Zhang, Y.; Zhang, J.; Zhu, J. Flow pattern recognition inside a rotodynamic multiphase pump via developed entropy production diagnostic model. J. Pet. Sci. Eng. 2020, 194, 107467. [Google Scholar] [CrossRef]
- Gong, C.; Li, D.; Kang, C. Visualization of the evolution of bubbles in the spray sheet discharged from the air-induction nozzle. Pest Manag. Sci. 2022, 78, 1850–1860. [Google Scholar] [CrossRef]
- Li, C.; Wu, J.; Pan, X.; Dou, H.; Zhao, X.; Gao, Y.; Yang, S.; Zhai, C. Design and Experiment of a Breakpoint Continuous Spraying System for Automatic-Guidance Boom Sprayers. Agriculture 2023, 13, 2203. [Google Scholar] [CrossRef]
- Zhou, L.; Hang, J.; Bai, L.; Krzemianowski, Z.; El-Emam, M.A.; Yasser, E.; Agarwal, R. Application of entropy production theory for energy losses and other investigation in pumps and turbines: A review. Appl. Energy 2022, 318, 119211. [Google Scholar] [CrossRef]
- Pan, X.; Jiang, Y.; Li, H.; Hui, X.; Xing, S. Numerical simulation of the effect of varying dispersion tooth insertion depth on the jet breakup and hydraulic performance. Biosyst. Eng. 2024, 239, 98–113. [Google Scholar] [CrossRef]
- Wang, Z.; Chen, Y.; Rakibuzzaman, M.; Agarwal, R.; Zhou, L. Numerical and experimental investigations of a double-suction pump with a middle spacer and a staggered impeller. Irrig. Drain. 2025; in press. [Google Scholar]
- Li, D.; Wang, H.; Qin, Y.; Han, L.; Wei, X.; Qin, D. Entropy production analysis of hysteresis characteristic of a pump–turbine model. Energy Convers. Manag. 2017, 149, 175–191. [Google Scholar] [CrossRef]
Disclaimer/Publisher’s Note: The statements, opinions and data contained in all publications are solely those of the individual author(s) and contributor(s) and not of MDPI and/or the editor(s). MDPI and/or the editor(s) disclaim responsibility for any injury to people or property resulting from any ideas, methods, instructions or products referred to in the content. |
© 2025 by the authors. Licensee MDPI, Basel, Switzerland. This article is an open access article distributed under the terms and conditions of the Creative Commons Attribution (CC BY) license (https://creativecommons.org/licenses/by/4.0/).