Article

A Bench-Scale Woodchip-Enhanced Bioelectrochemical Denitrification Remediation Wall for Simulating Nitrate-Contaminated Groundwater In Situ Treatment

1
College of Resources and Environment, Shanxi Agricultural University, No. 1 Mingxian Road, Taigu 030801, China
2
Soil Health Laboratory in Shanxi Province, No. 81 Longcheng Street, Taiyuan 030031, China
3
School of Water Resources and Environment, China University of Geosciences (Beijing), No. 29 Xueyuan Road, Haidian District, Beijing 100083, China
*
Author to whom correspondence should be addressed.
Water 2025, 17(11), 1593; https://doi.org/10.3390/w17111593
Submission received: 28 April 2025 / Revised: 21 May 2025 / Accepted: 22 May 2025 / Published: 24 May 2025
(This article belongs to the Section Water Quality and Contamination)

Abstract

:
Excessive nitrogen fertilizer use has resulted in growing nitrate contamination of groundwater. In this study, an in situ bioelectrochemical reactor (isBER) reinforced with woodchips was developed for the treatment of actual nitrate-contaminated groundwater. During the 75-day experiment, the denitrification performance, grid permeability, and microbial community structure were investigated under different flow rates and current densities. The reactor achieved a remarkable nitrate removal efficiency of 97.6% ± 0.4% and a rate of 2.09 ± 0.14 mg-N/(L·h). These results were obtained at a temperature of 18.5 ± 0.8 °C, a current density of 350 mA/m2, and a flow rate of 10 cm/d. Notably, the reactor can adapt to a wide flow-rate range of 5~20 cm/d and the operation proceeded smoothly without any blockages. Furthermore, the cathode module demonstrated enrichment of hydrogen autotrophic denitrifying bacteria (Pseudomonas, Stenotrophomonas) and heterotrophic denitrifying bacteria (Brucella, Enterobacteriaceae). Conversely, the anode module exhibited relatively high enrichment levels of aerobic microorganisms and lignin-degrading bacteria (Cellvibrio). The research results can provide novel insights and technical support for in situ remediation of groundwater nitrate contamination.

1. Introduction

Groundwater nitrate pollution, originating from the indiscriminate discharge of nitrogen fertilizer and wastewater, has emerged as a pressing global environmental issue [1]. Nitrate contamination poses significant risks to human health, including the provision of substandard drinking water and the development of methemoglobinemia. Additionally, it contributes to adverse environmental effects such as the depletion of aquatic life and the onset of eutrophication [2].
In situ remediation involves the direct application of physical, chemical, and biological methods to remove pollutants within the aquifer of the contaminated site without causing damage to the natural environment, such as the unsaturated zone and aquifer zone [3], and it has been recognized as an effective and economical way for addressing groundwater nitrate contamination [4]. Among the various in situ nitrate removal methods, biological denitrification permeation reaction barriers (PRBs) have gained widespread application in remediating groundwater nitrate contamination due to their advantages of low secondary pollution and cost-effectiveness [5]. Agricultural waste with rough surfaces and good carbon release, such as corn cobs [6] and straw [7], have been proven to be efficient carbon sources for biological denitrification and can achieve efficient and economical control of groundwater nitrate pollution. In on-site practice, natural solid-phase carbon sources such as sawdust bioreactors are also recognized as one of the promising technologies for removing nitrate from tile drainage [8].
However, the biodegradation process is often hindered by factors such as insufficient electron donors, extended generation times, and low microbial activity [9]. One potential strategy to enhance nitrate removal performance involves supplying electrical power within the bioreactor [10], thereby offering denitrifying microorganisms with more readily available electrons as an energy source [11]. Electrical stimulation can enhance the denitrification performance of sawdust in BER using graphite as cathode and anode and achieve 40.5% nitrate removal at 22.5 °C and a current intensity of 500 mA [12]. Additionally, appropriate electrical currents can stimulate the metabolism of denitrifying bacteria and enhance their growth activity [13]. In addition, due to the faster electron transfer of cathode biofilm, abundant denitrification-related functional genes, and enrichment of hydrogen autotrophic denitrifying bacteria, BER driven by a rice-husk-integrated bio cathode can achieve a nitrate removal rate of 1.05 mg-N/(L∙h) and a hydrogen autotrophic denitrification contribution of 50.7% at 200 mA/m2 [14]. The study also showed that simultaneously embedding the anode and cathode with woodchips can minimize the inhibition of denitrifying bacteria by anodic oxidants and achieve the highest nitrate removal at a current density of 350 mA/m2 [15].
However, the currently constructed bioelectrochemical system enhancement systems are mainly batch processing and column studies, which only evaluate the nitrate removal performance under one-dimensional or two-dimensional flow conditions. However, there is limited research on three-dimensional seepage and relatively low-temperature actual groundwater [16,17]. Various combinations of electrochemical technology and PRB have been proposed, including electro-thermal repair PRB [18] and bio-electrodynamic repair PRB [19]. However, current electro remediation PRB is primarily utilized for in situ remediation of organic matter pollution in groundwater and soil, with no reported application for groundwater nitrate pollution remediation.
Based on this approach, in this study, we constructed a laboratory-scale seepage sand tank to more accurately simulate geological conditions and groundwater flow. An in situ bioelectrochemical remediation reactor for nitrate contaminated groundwater was constructed using woodchips as microbial carriers. Subsequently, actual nitrate-contaminated groundwater was introduced for infiltration tank experiments. This study investigated the effects of current application and flow-rate variation (0–20 cm/d) on the denitrification performance and grid permeability of various electrode components in isBER. The changes in the pH value of the system and the concentration changes in the main cations and anions in the system are also of concern. In addition, this study will further discuss the evolution of microbial diversity and community structure in different areas of the reactor to elucidate the interaction and regulatory mechanisms between autotrophic and heterotrophic microorganisms. Ultimately, this study contributes to the in situ remediation of nitrate-contaminated groundwater, particularly providing insights for the practical implementation of enhanced electrode biofilm technology for agricultural and forestry waste.

2. Materials and Methods

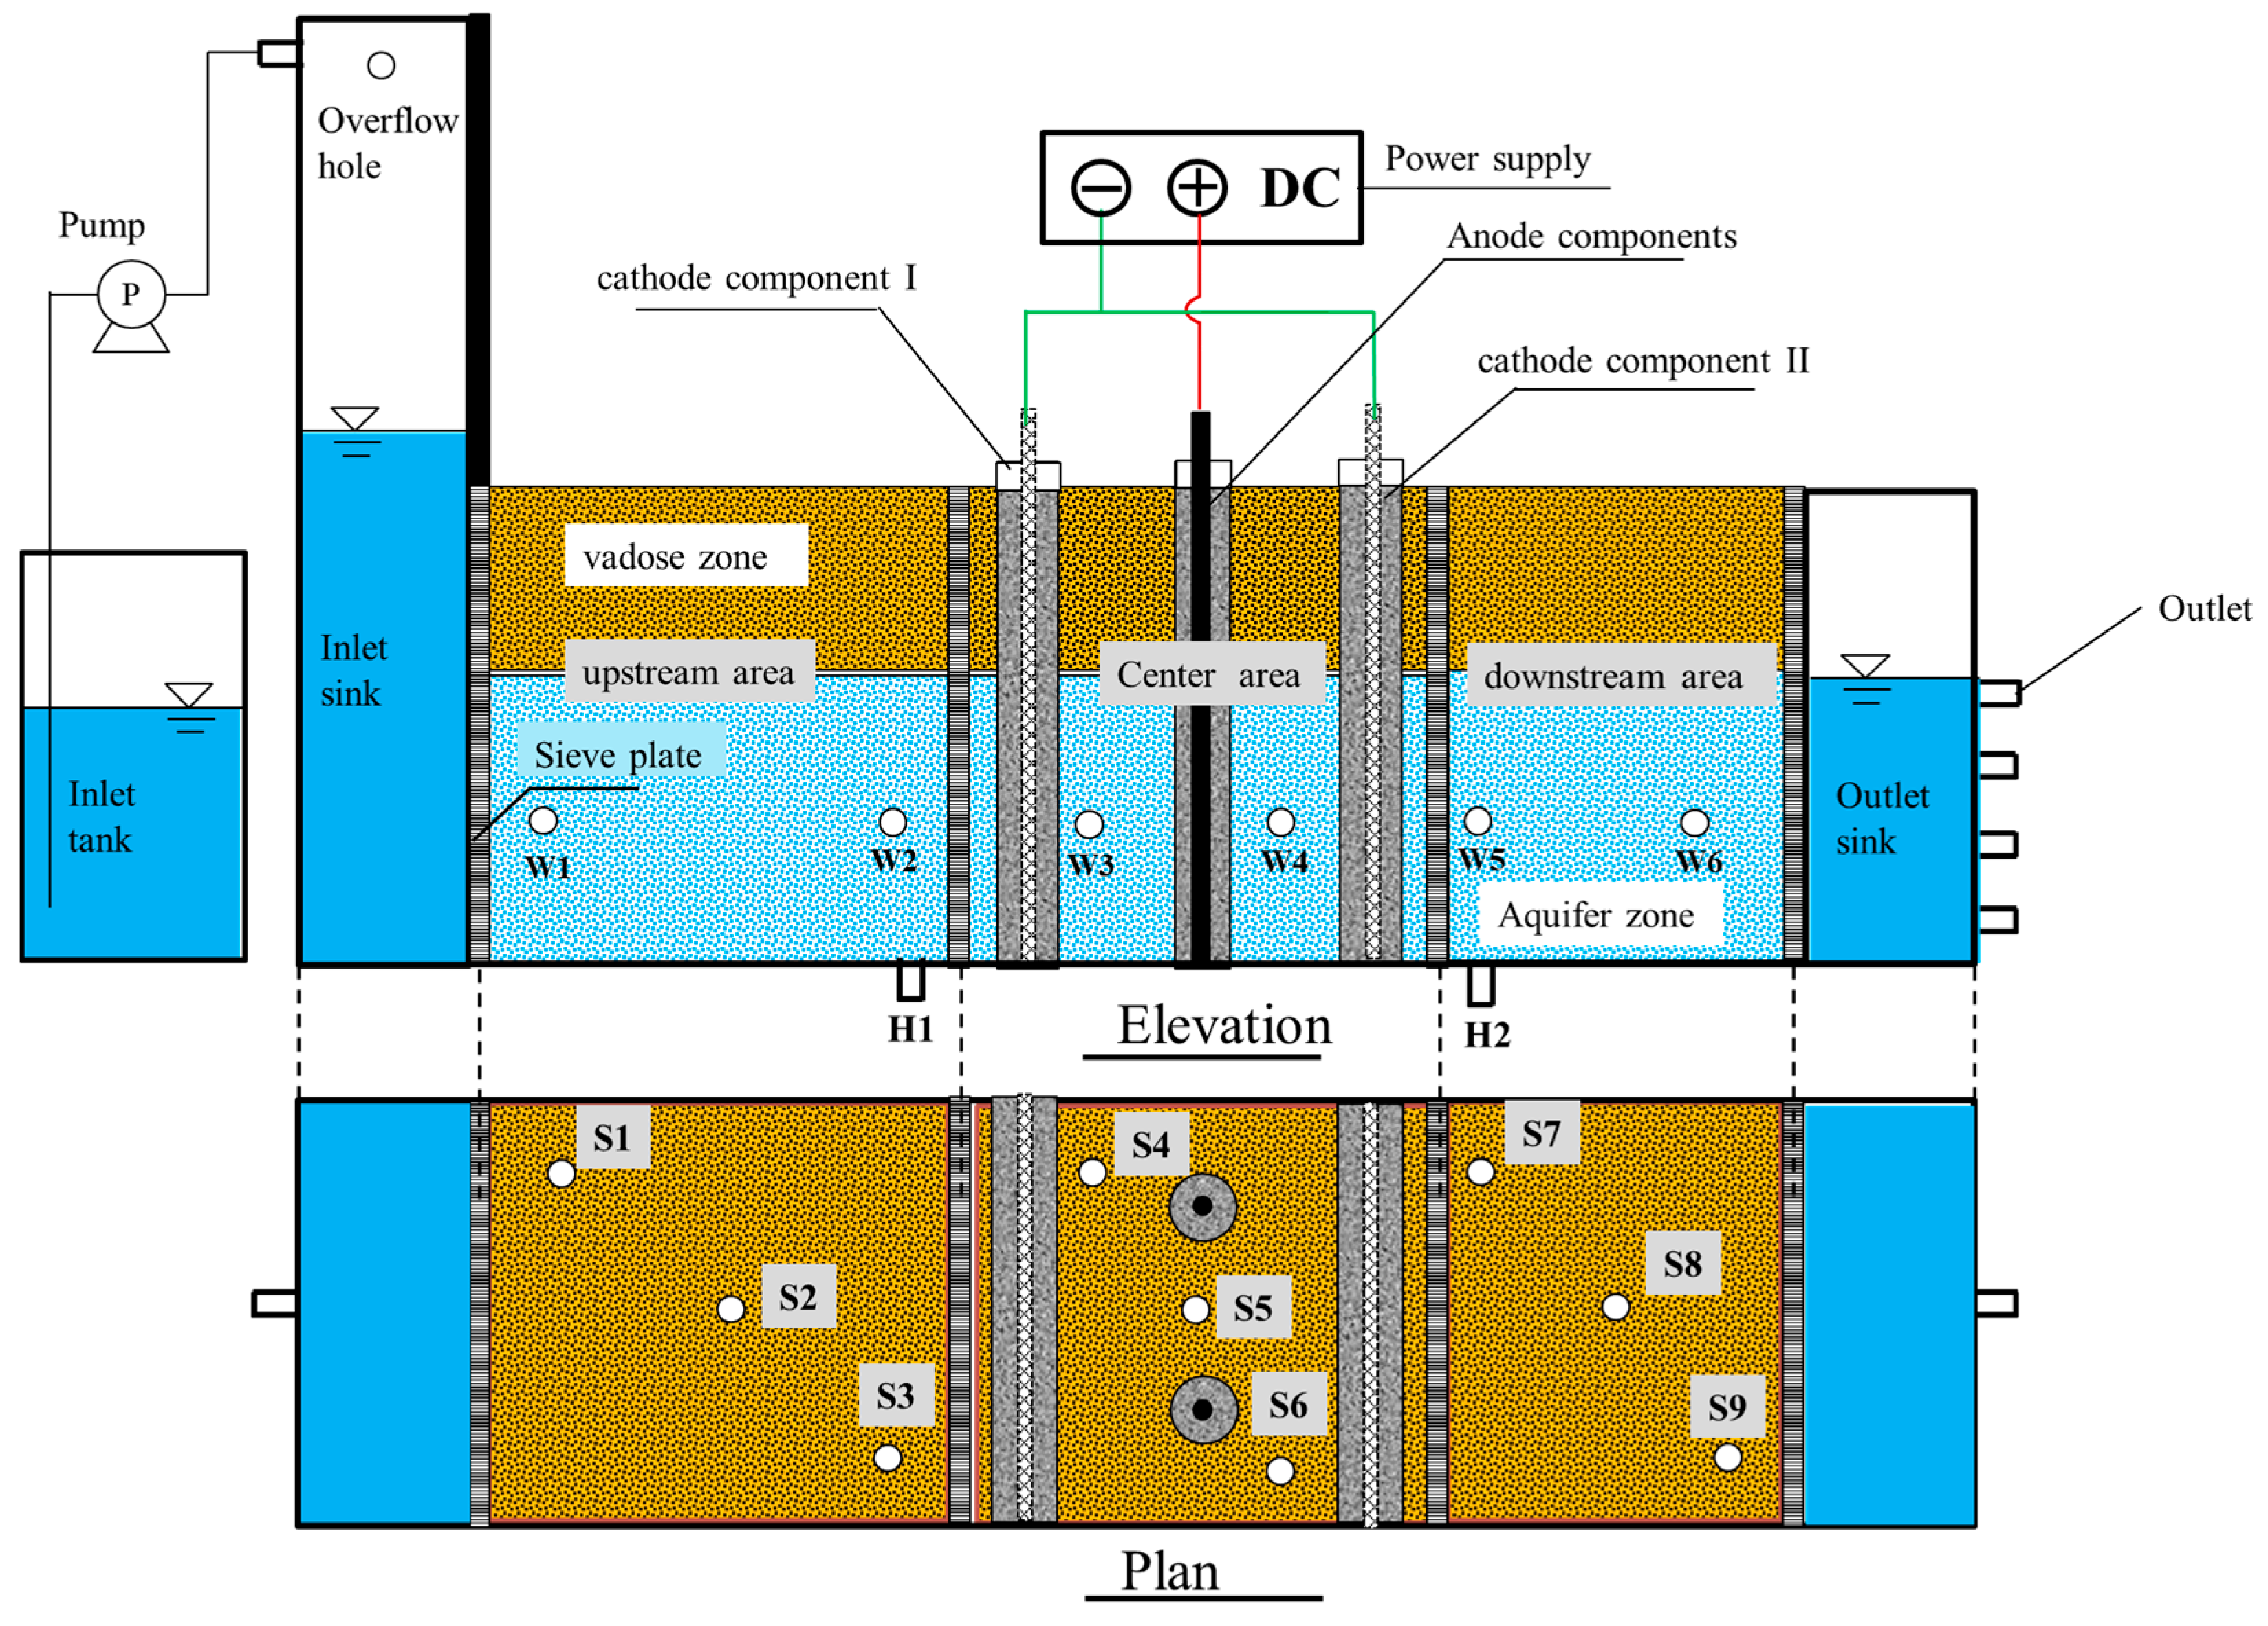
2.1. isBER Construction and Inoculation

As depicted in Figure 1, the reaction apparatus comprised an inlet tank, a peristaltic pump, a rectangular plexiglass seepage tank, and an adjustable DC power supply. The rectangular plexiglass seepage tank, with dimensions of 1000 mm in length and 200 mm in width, was designed to mimic the groundwater environment [20]. Within the tank, the inlet reservoir measured 600 mm in height, while the remaining portion was 300 mm high. Vertical installation of three screen plates in the seepage tank featured evenly distributed circular holes, each with a diameter of 5 mm and spaced 10 mm apart. This configuration divided the seepage tank into five sections: the inlet reservoir, upstream area, center area, downstream area, and effluent reservoir. The upstream, center, and downstream areas were filled with quartz sand (1~2 mm) and soil (1~2 mm). Quartz sand was predominantly packed in the lower segment (200 mm in height) to replicate the aquifer zone, while soil filled the upper portion (100 mm in height) to represent the vadose zone.
The center area (CA) was comprised of 2 anode components and 2 cathode components. The anode component consisted of a carbon rod (height: 350 mm, diameter: 120 mm) and a porous plexiglass tube (height: 340 mm, outer diameter: 60 mm), with 5 mm diameter holes drilled through the outer wall. These holes were evenly distributed with a spacing of 10 mm. Additionally, woodchips (3~5 mm, 80.2 g) were included. The cathode component consisted of a stainless-steel mesh cathode (height: 350 mm, length: 194 mm, with a grid of 5 mm × 5 mm) and a porous rectangular groove (height: 340 mm, length: 198 mm, width: 60 mm), with evenly distributed circular holes on the outer wall, each with a diameter of 5 mm and spaced 10 mm apart at their centers, and woodchips (3~5 mm, 430.7 g). The carbon rod (or stainless-steel mesh) was positioned in the center of the porous plexiglass tube (or porous rectangular groove), following which, the woodchips, thoroughly mixed with sludge, were naturally and uniformly filled to a height of 300 mm, covering the anode (or cathode) to form the respective anode (or cathode) components.
As depicted in Figure 1, two anode components were positioned in parallel along the central axis of the center area, while the two cathode components were symmetrically arranged along the screen plates on both sides of the CA. The cathode components located first and second along the direction of water flow were referred to as the front-end cathode component (cathode component I) and the back-end cathode component (cathode component II), respectively. By dividing the water inflow by the effective reactor volume, the medium porosity (ηe) was calculated to be 45.9%.
The groundwater was pumped into IR using a peristaltic pump, maintaining a stable head height in both the inlet reservoir and the effluent reservoir to simulate a consistent flow state. Variations in flow rate were simulated by adjusting the peristaltic pump flow. Power was supplied by an adjustable direct current (DC) power source. Six water sampling ports (W1~W6) were positioned on the side of the reaction tank to monitor changes in nitrate concentration along the water flow. Among these, W1 and W2 were designated for assessing nitrate adsorption by the upstream quartz sand. W3, W4, and W5 were situated behind cathode component I, the anode component, and cathode component II, respectively, to investigate the nitrate removal efficiency of each electrode component. W6 served as the sampling port in the downstream area. Additionally, H1 and H2 were located at the bottom of the reactor, with a U-shaped pressure gauge connected to measure the height difference of the water column between the upstream and downstream sections of the denitrification grid. In addition, 9 soil sampling points (S1–S9) were set up in the aeration zone, with a sampling depth of 5 cm.
The activated sludge used was obtained from the Qinghe wastewater treatment plant in Beijing, China, following the domestication method outlined in our previous research [21]. Subsequently, the woodchips for both the anode and cathode modules were immersed separately in domesticated anaerobic activated sludge for 24 h. Throughout this period, the mixture was agitated every 4 h to ensure thorough mixing of the denitrifying bacteria and woodchips [15].

2.2. Groundwater and Soil

The groundwater was sampled from reserve wells designated for drinking water supply at Beijing Language and Culture University, located in Beijing, China (N 40°00′06″, E 116°35′29″). The main components detected in the groundwater included 2.08 mg/L of NO3-N, 78.00 mg/L of Ca2+, 32.72 mg/L of Mg2+, 1.90 mg/L of Fe2+, 0.41 mg/L of Mn2+, 31.91 mg/L of Cl, and 63.44 mg/L of SO42−. To simulate nitrate contamination, NaNO3 was introduced into the groundwater, resulting in a finalNO3-N concentration of 30 mg/L. The pH of the nitrate-contaminated groundwater was measured to be 8.94 ± 0.08, with a TOC concentration of 1.32 ± 0.24 mg/L.
The experimental soil was sampled from the upper 0~20 cm layer of a maize field located in Shunyi District, Beijing (N 40°06′04″, E 116°53′28″), and passed through a 20-mesh sieve before analyzing its basic properties. The primary components of the soil were as follows: TN (0.11%, w/w), TP (0.14%, w/w), TK (2.16%, w/w), TOC (13.4 mg/g dry soil), and NO3-N (0.84 mg/g dry soil). Subsequently, the soil underwent natural air-drying, followed by screening with a molecular sieve to achieve a particle size of 1 to 2 mm for further processing.

2.3. Experimental Start-Up and Operation

The operation of isBER was conducted in five stages, each with different applied current density and influent flow rates. Table 1 summarizes the operating conditions for these stages, with stage 1 representing the start-up period. Additionally, based on a previous study, the denitrification performance of the isBER was explored under the optimal current density of 350 mA/m2 [15]. The variation in current densities during stages 2 to 3 aimed to investigate the effect of electrical stimulation on nitrate removal performance, while the different flow rates during stages 3 to 5 aimed to clarify the denitrification performance at various flow rates. The isBER was operated at room temperature (18.5 ± 0.8 °C) throughout the entire experimental period.

2.4. Samples and Analyses

2.4.1. Water Quality and Soil Indicators

An amount of 10 mL of water samples were collected daily at each sampling point and then filtered through a 0.45 μm membrane filter. NO3-N, NO2-N, and NH4+-N concentrations were determined using ultraviolet spectrophotometry (DR6000, HACH, Loveland, CO, USA) following the SEPA protocol [22]. Total organic carbon (TOC) was measured using a TOC analyzer (Multic N/C 2100S, Analytik Jena, Thüringen, Germany). pH levels were monitored using a pH meter (Seven Multi S40, Mettler Toledo, Zurich, Switzerland). Major cations (Ca2+ and Mg2+) were analyzed by inductively coupled plasma atomic emission spectroscopy (ICP-AES) (iCAP 6300, Thermo, Waltham, MA, USA), while anions (Cl and SO42−) were determined using an ion chromatograph system (ICS-600, Dionex IonPac, Thermo Fisher, Waltham, MA, USA) with an analytical precision of ±5.0%. Additionally, water sample colony counting was performed using the 3MTM PetriflmTM Aerobic Count Plate (3M Company, St. Paul, MN, USA) according to the manufacturer’s instructions.
Soil pH was measured using a pH meter (Seven Multi S40, Mettler Toledo, Switzerland), and the TN content in soil was determined by the semi-micro Kjeldahl method. The TP and NO3-N were determined by ultraviolet spectrophotometry (DR6000, HACH, USA). The TK content was measured by atomic absorption spectrophotometer (iCE™ 3300 AAS, Thermo Scientific, Waltham, MA, USA). The content of organic matter was measured by a TOC analyzer (Multic N/C 2100S, Analytik Jena, Germany).

2.4.2. Microbial Analysis

The woodchips of the anode and cathode components were collected, and the original sludge (before being injected into isBER) was also collected to evaluate microbial diversity. The analysis method for microorganisms is consistent with our previous research [15].

2.4.3. Permeability Analysis

The daily recording of the height difference of the water column between upstream and downstream areas of the central region was conducted. Subsequently, the change in permeability coefficient in the denitrification grid was calculated using Darcy’s law (Equation (1)):
v d = k H L
where k is the permeability coefficient (cm/d), and vd is the Darcy flow rate (cm/d), calculated based on the flow rate measured at the water outlet. ∆H represents the height difference of water column between the upstream and downstream ends of the denitrification grid (cm), measured using U-shaped pressure gauges connected to points H1 and H2. L denotes the distance between points H1 and H2 (35.6 cm).

3. Results and Discussion

3.1. Denitrification Performance

The denitrification performance of the isBER at various operating stages is illustrated in Figure 2. No significant difference (p = 0.375) was observed in the NO3-N concentrations of W1 and W2 at the upstream area throughout the entire operational period. This suggests that the quartz sand added in the aquifer zone has minimal adsorption effects on nitrate. During the setup period (stage 1), as easily utilized organic matter released by woodchips was consumed [23], the NO3-N concentration in the central and downstream areas gradually increased and then stabilized. By the end of stage 2, the overall nitrate removal rate in the central area was calculated to be 0.73 ± 0.08 mg-N/(L·h). The NO3-N removal rates of cathode components I, anode components, and cathode components II were 0.39 ± 0.03, 0.13 ± 0.03, and 0.21 ± 0.02 mg-N/(L·h), respectively. This indicates that without the application of current, heterotrophic denitrification processes occur in each electrode component along the water flow direction. The higher nitrate removal rate observed in cathode components I may be attributed to the greater nitrate concentration difference in the treated water, which increases the interface mass transfer rate and consequently improves the nitrate removal performance [24].
At a current density of 350 mA/m2 (stage 3), a decrease in NO3-N concentration was observed in W3, W4, and W5, with corresponding nitrate removal rates of 0.84 ± 0.03, 0.24 ± 0.03, and 0.12 ± 0.01 mg-N/(L·h) for cathode components I, anode components, and cathode components II, respectively. Meanwhile, the overall nitrate removal rate in the central area was calculated to be 1.20 ± 0.07 mg-N/(L·h). Compared to stage 2, electrical stimulation significantly enhanced nitrate removal efficiency (p < 0.05). Several factors could explain the increase in nitrate removal rate at stage 3: (i) nitrate electrochemical reduction [25] and hydrogen autotrophic denitrification [26] occurred on the cathode following the application of current. (ii) The local aerobic microenvironment in the anode promoted the denitrification process of micro-aerobic microorganisms [15]. (iii) Optimal electrical stimulation increased the activity of denitrifying bacteria and denitrifying reductase, thereby promoting the nitrate reduction [13]. (iv) Anodic oxidation can decompose lignin, which is difficult for microorganisms to utilize, into smaller organic matter [27], providing more available carbon sources for denitrifying microorganisms and promoting nitrate reduction. Furthermore, the denitrification performance of microorganisms is closely related to temperature. In this study, the heat generated by electrical stimulation increased the temperature, thereby promoting the activity of denitrifying microorganisms [12]. This temperature elevation was beneficial for the biological treatment of low-temperature water bodies.
Comparing stages 3~5, where the current density was maintained at 350 mA/m2, the nitrate removal performance was observed to vary with the flow rate. As depicted in Figure 2, at the end of stage 4 (350 mA/m2, 10 cm/d), the NO3-N removal efficiencies of W3, W4, and W5 were observed to be 53.4% ± 1.8%, 71.9% ± 1.4%, and 97.6% ± 0.4%, respectively. Compared with stage 3 (350 mA/m2, 5 cm/d), the NO3-N removal efficiency of cathode components I and anode components in stage 4 was lower. This decrease in efficiency might be attributed to the faster water flow, which reduced the reaction time between microorganisms and nitrate, thereby diminishing the nitrate removal performance.
Although the nitrate removal efficiency of cathode components I and the anode components was low, there was no significant difference in the overall nitrate removal efficiency of the central area in stages 3 and 4 (p = 0.170). This lack of difference might be attributed to the higher NO3-N concentration difference in cathode components II in stage 4, which increased the interfacial mass transfer rate, thereby improving nitrate removal efficiency [28]. Additionally, the stabilization of the biofilm structure with the progression of the reaction process could have led to the enrichment of dominant microorganisms, thereby enhancing nitrate removal performance [29]. However, when the flow rate increased to 20 cm/d (stage 5), the high flow rate resulted in a shorter contact time between microorganisms and the solute. This reduction in contact time led to decreased nitrate removal efficiency, with W3, W4, and W5 exhibiting removal efficiencies of 34.8% ± 1.9%, 58.8% ± 1.2%, and 81.6% ± 0.4%, respectively.
At a current density of 350 mA/m2, although the nitrate removal efficiency of the reactor decreased with an increasing flow rate, the denitrification rate exhibited an upward trend. When the flow rates were 5, 10, and 20 cm/d, the nitrate removal rates of the central area were 1.20 ± 0.07, 2.09 ± 0.14, and 4.16 ± 0.29 mg-N/(L·h), respectively. This increase in denitrification rate with higher flow rates might be attributed to the increase in shear stress, which improved biofilm stability [30].
In practice, various factors, such as climate (rainy season or dry season), surface water level, geological conditions, and human activities (farm irrigation and artificial drainage), can influence groundwater levels, resulting in fluctuations in flow velocity [31]. However, in this study, the NO3-N concentration remained relatively stable across each stage, with no significant fluctuations observed with the increase in flow rate. This suggests that the isBER constructed in this study exhibits a certain level of resistance to flow-rate fluctuations ranging from 5 to 20 cm/d in the actual groundwater environment.
In addition to the central area, the nitrate removal efficiency in the downstream area improved with the increase in flow rate (Figure 2). This improvement may be attributed to the transport of denitrifying microorganisms from the central area downstream by the water flow.
Furthermore, the accumulation of NO2-N in W1 and W2 was almost undetectable, further confirming that nitrate was not being reduced in the upstream area. During the operation of stage 1, the NO2-N accumulation in W3, W4, and W5 initially increased and then decreased. This trend occurred because the nitrate reduction efficiency decreased with the consumption of small-molecule organic matter released by woodchips in the early stage of stage 1, leading to nitrite accumulation [32]. As the biofilm properties gradually stabilized, nitrite accumulation decreased with the improvement in nitrate reduction performance. Compared to stage 2, the NO2-N concentration in stage 3 significantly decreased after the application of current. Electrical stimulation not only promoted NO2-N reductase activity but also led to higher NO3-N removal in cathode component I, resulting in a relatively lower NO3-N concentration as the treated water flowed through the anode component. This elimination of nitrite reductase inhibition by high NO3-N concentration contributed to the decrease in NO2-N concentration [33]. Additionally, nitrite reductase activity is closely related to pH [28]. Furthermore, the NO2-N accumulation in W3, W4, and W5 gradually increased at stage 3~5. This increase may be attributed to the higher flow rate, which led to shorter contact reaction times among microorganisms, organic matter, and nitrate. Microorganisms tend to reduce nitrate first to obtain more energy [34], resulting in NO2-N accumulation. Moreover, the NO2-N concentration of W6 decreased at stages 1~5, indicating the presence of denitrifying microorganisms in the downstream area.
As shown in Figure 2, during stages 1 to 5 of operation, no accumulation of NH4+-N was observed in W1 and W2 in the upstream area. When no current was applied, NH4+-N is primarily realized through DNRA, a process positively correlated with the C/N ratio [35]. At the beginning of stage 1, woodchips released a significant amount of small-molecular organic matter, thereby increasing the C/N ratio [36] and, consequently, promoting the DNRA process and NH4+-N accumulation [37]. Subsequently, the consumption of readily available organics gradually reduced the C/N ratio, leading to a weakening of the DNRA process. Additionally, the NH4+-N concentration was observed to increase gradually along the water flow direction in stages 1~2 (Figure 2). This increase was attributed to the accumulation of organic matter released from the woodchips in each electrode component.
In the energized stages 3~5, NH4+-N accumulation was observed in the two cathode components, primarily caused by DNRA [38] and the electrochemical reduction of nitrate by the iron cathode [39]. Additionally, the presence of abundant background cations (such as Ca2+, Mg2+, Fe2+, Fe3+, and Cu2+) in actual groundwater can further increase NH4+-N accumulation [40]. The decrease in the NH4+-N concentration of W4 might be attributed to the dissolved oxygen generated by anodic oxidation, which promoted the local enrichment of aerobic nitrifying bacteria in the anode components. These bacteria consumed ammonium through nitrification. Moreover, no significant difference in NH4+-N concentration was observed between W5 and W6 from stage 1 to stage 5 (p = 0.894), indicating that the microorganisms washed downstream by the water flow hardly produce or consume NH4+-N.
After considering the nitrate removal performance and the accumulation of NO2-N and NH4+-N, the isBER constructed in this study exhibited its highest denitrification performance when the current density was 350 mA/m2 and the flow rate was 10 cm/d. The nitrate removal efficiency and rate in the central area were 97.6% ± 0.4% and 2.09 ± 0.14 mg-N/(L·h), respectively. In comparison with our study, the denitrification capacity of both unused sawdust and sawdust that had been operational in PRBs for 2 and 7 years, respectively, increased [41]. Their results demonstrated that when the influent NO3-N concentration increased from 3.1 to 48.8 mg/L, the nitrate removal rates remained relatively constant. The denitrification rates were 0.64–0.96, 0.50, and 0.38 mg-N/(L·h) for unused sawdust, 2-year-old sawdust, and 7-year-old sawdust, respectively—significantly lower than those achieved in our study. Additionally, their experimental temperature (21.0–23.5 °C) was higher than ours (18.5 ± 0.8 °C). These findings strongly demonstrate the superior efficiency of our sawdust-enhanced biofilm electrochemical technology. Comparison with the previously constructed C-WBER [15] revealed that, despite the lower environmental temperature in this study (18.5 ± 0.8 °C) compared to the C-WBER (25 ± 1 °C), the denitrification rate of the isBER was not significantly lower (p = 0.081) than that of the C-WBER (2.58 mg NO3-N /(L·h). This result suggests that the three-dimensional seepage in the isBER facilitates better interaction among microorganisms, woodchips, solutes (TOC, nitrate, nitrite, ammonium nitrogen, etc.), and electrode electrolysis products (woodchip degradation products, CO2, H2, e, etc.), thereby enhancing denitrification performance.
The isBER developed in this study requires relatively high initial investment costs (mainly for electrode materials, power supply, and monitoring systems) but offers the advantage of convenient, long-term operation and maintenance. In practical applications, the service life of woodchips [42] and anodes [12] may become limiting factors for continuous operation, requiring further evaluation of their lifespan and scheduled replacement. Additionally, dynamic balancing between carbon release from woodchips and carbon consumption for denitrification needs to be maintained.

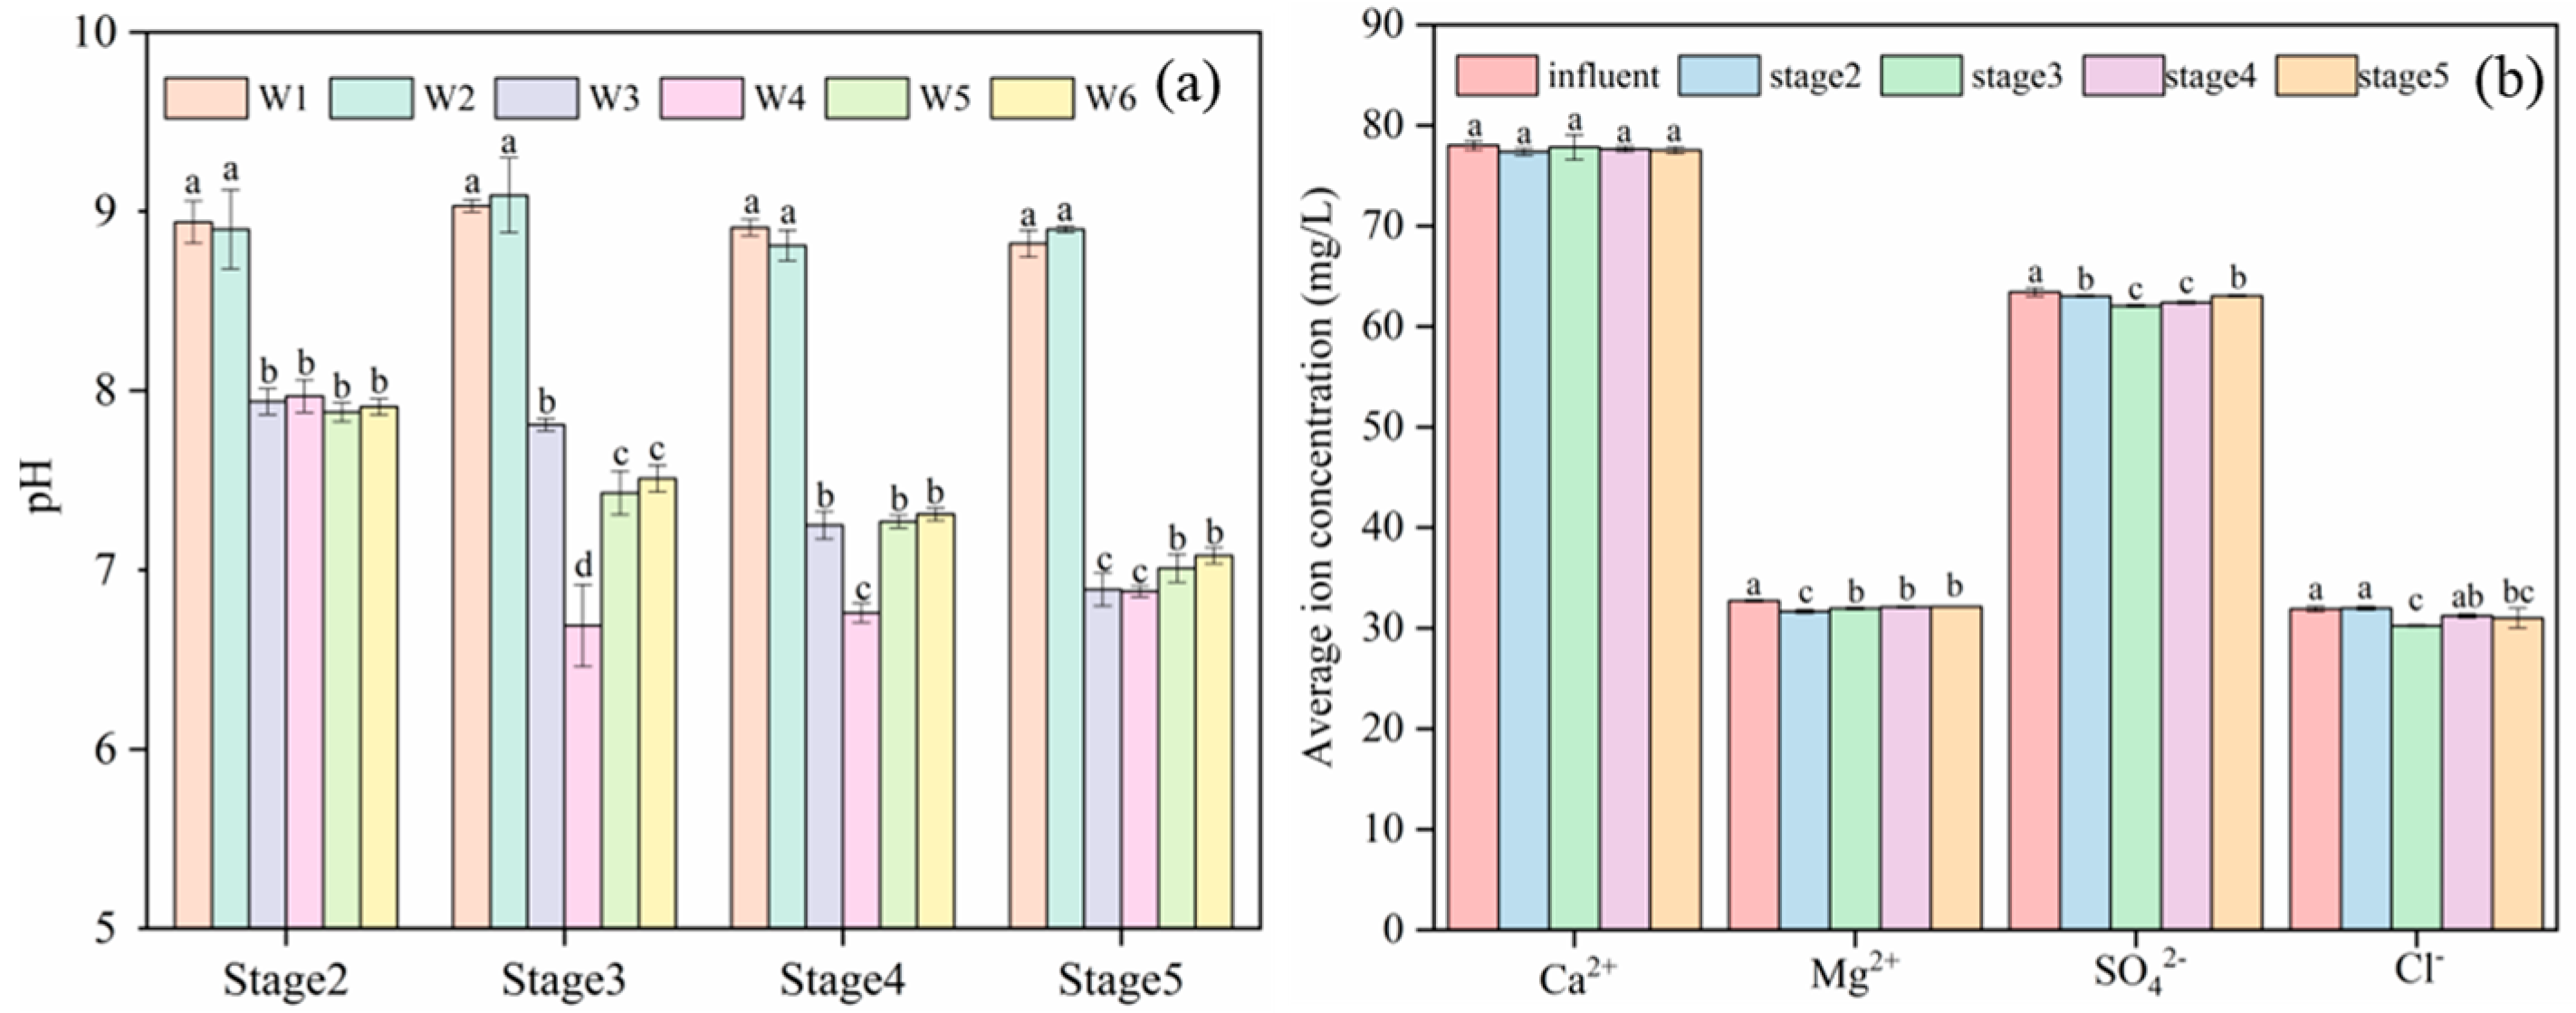
3.2. Changes in pH and Ions

Figure 3a illustrates the pH changes in W1~W6 in stages 2~5, while Figure 3b presents the concentrations of cations and anions in the influent and effluent of stages 2~5. When no current is applied, the actual pH value of nitrate-contaminated groundwater is measured as 8.94 ± 0.08. During stage 2, the pH values of sampling ports W3, W4, and W5 all decrease after the groundwater flows through the three electrode components, with values of 7.94 ± 0.03, 7.97 ± 0.02, and 7.88 ± 0.10, respectively. This indicates that the interaction between nitrate reduction (resulting in alkali production) and sawdust fermentation (resulting in acid production) maintains the solution’s weakly alkaline pH.
In addition, mineral ions in groundwater, such as Ca2+ and Mg2+, may undergo electrolysis, leading to the formation of calcium and magnesium deposits, which can affect electrode performance and nitrate removal to varying degrees [44]. Therefore, changes in the concentrations of Ca2+ and Mg2+ in W6 from stage 2 to 5 were analyzed in this study (Figure 3b). Compared to the initial groundwater, the concentrations of Ca2+ and Mg2+ in the effluent at stage 2~5 showed a slight decrease. Studies have indicated that CaCO3 and CaMg(CO3)2 precipitates appear at pH ≈ 8, MgCO3 precipitates appear at pH ≈ 9, and Mg(OH)2 and Ca(OH)2 precipitates begin to appear when pH>10. In this study, when the flow rates were 5, 10, and 20 cm/d, the solution pH in each electrode component was maintained in a relatively neutral environment (pH range: 6.69~7.94) and did not reach the pH levels conducive to the sedimentation of Mg2+ and Ca2+. Consequently, the negative influence of calcium and magnesium precipitates on permeability and electrode performance was avoided.
In addition to cations, changes in the concentrations of SO42− and Cl in W6 from stage 2 to 5 are shown in Figure 3b. No significant changes in the SO42− concentration before and after the reaction were observed at each stage (p = 0.159). Although microbial autotrophism in BER can facilitate SO42−-reduction, the SO42− removal efficiency tends to be low when the biofilm has not undergone sulfate acclimation [45]. Furthermore, nitrate-reducing bacteria (NRB) typically exhibit a stronger ability to obtain electrons compared to sulfate-reducing bacteria (SRB), resulting in slower growth of SRB than NRB in the same reaction system [46]. Additionally, the initial Cl concentration in groundwater was measured at 31.91 mg/L. Across stages 2 to 5, the Cl concentrations were 31.99, 30.24, 31.23, and 31.01 mg/L, respectively (Figure 3b), and no significant changes were observed (p > 0.05). While effective chlorine generated by the anodic oxidation of Cl can reoxidize ammonium nitrogen into nitrogen or nitrate, achieving this requires specific conditions such as the use of DSA electrode, Cl concentration, and anode potential [47]. Therefore, considering the use of graphite anodes and the relatively low Cl concentration in this study, the influence of Cl on denitrification performance can be ignored. In summary, the isBER constructed in this study demonstrates promising potential for nitrate treatment in actual groundwater scenarios.

3.3. Permeability of the Grid

As shown in Figure 4, The permeability coefficient k of quartz sand in the aquifer was initially measured to be 4.12 ± 0.21 m/d before the construction of the denitrifying grid. Subsequently, the permeability coefficient K decreased from 3.68 m/d on the first day to 1.31 m/d on the eighth day after the denitrifying grid was installed and then stabilized at 1.13 ± 0.31 m/d. The decrease in denitrification grid permeability in the early stage of stage 1 may be attributed to the gradual growth of microorganisms on the woodchip surface, leading to the formation of biofilm [48]. This biofilm formation further contributed to a gradual decrease in the permeability coefficient.
Subsequently, the average permeability coefficient of the denitrification grid increased from 1.41 ± 0.20 m/d (stage 2) to 1.72 ± 0.47 m/d (stage 3) (Figure 4). This increase may be attributed to electrical stimulation, which promoted the utilization of woodchips by microorganisms in the cathode and anode components [15]. In addition, the electrochemical degradation of lignin at the anode increased the porosity of the reaction medium [27], thereby contributing to the observed increase in permeability coefficient.

3.4. Microbiological Analysis

3.4.1. Changes in Microbial Community of Electrode Components

The microbial community diversity of the original sludge, cathode component I, anode component, and cathode component II were analyzed. The coverage of all sequencing samples exceeded 99.7%, ensuring a comprehensive representation of the microbial community. Table 2 presents the Sobs, Shannon, Ace, and Chao indices of the samples. The Sobs index indicates the number of operational taxonomic units (OTUs) in the microbial sample, while the Chao and Ace indices are positively correlated with community richness [49]. As depicted in Table 2, the Sobs indices of cathode component I and II were lower than that of the original sludge, suggesting an increase in the microbial OTU number in the cathode components. However, the change in Chao and Ace indices followed a different pattern: cathode component II > original sludge > cathode component I. This indicates that the microbial community richness of the two cathode components varied with the flow of treated water, possibly due to differences in water quality indicators in the solution.
The Shannon index primarily reflects the diversity and uniformity of the bacterial community and is positively correlated with community diversity [50]. The Shannon index values for the four samples are as follows: anode component (4.16) > original sludge (4.09) > cathode component II (2.99) > cathode component I (2.42). The higher Shannon index observed in the anode component indicates that microbial diversity is greater in the anode compared to the original sludge. The higher diversity, uniformity, and richness of microorganisms in the anode component may be attributed to the partial enrichment of aerobic microorganisms. The microorganisms in this study were originally domesticated in an anaerobic environment. However, the enrichment of aerobic microorganisms in the anode promoted an increase in microbial diversity and richness in the component.
The lower Shannon index observed in the cathode components I and II compared to the original sludge can be attributed to the enrichment of dominant bacteria, leading to reduced microbial diversity. Furthermore, the Shannon index of cathode component I is lower than that of cathode component II, possibly due to the higher nitrate removal efficiency in cathode component I. The increased removal efficiency in cathode component I may promote the enrichment of dominant denitrifying bacteria, consequently resulting in lower microbial diversity.
The microbial community structure at the genus level in the original sludge and each electrode component is depicted in Figure 5. In the original sludge, the dominant denitrifying bacteria is Thauera, with a relative abundance of 8.1%. Thauera has been demonstrated to perform heterotrophic denitrification using a variety of electron donors [51]. In addition, some sludge groups and fermentative bacteria commonly found in sewage treatment plants are observed in the original sludge, including norank_f_JG30-KF-CM45 [52], norank_f_Bacteroidetes_vadinHA17 [53], and unclassified_f_Anaerolineaceae [54], with relative abundances of 10.5%, 6.3%, 5.2%, and 3.5%, respectively. Notably, the relative abundance of Pseudomonas, known to utilize H2 as electron donors for denitrification, is only 0.1% in the original sludge. After the reaction, the relative abundance of Pseudomonas significantly increased in cathode components I and II, reaching 53.4% and 34.4%, respectively. The higher abundance of Pseudomonas in the cathode component may be attributed to the higher NO3-N concentration of the treated water flowing through the cathode component (Figure 2), which promotes the enrichment of hydrogen autotrophic denitrifying bacteria. Stenotrophomonas is known to be an electrically active bacterium, and the presence of metal ions in the solution can promote its enrichment [55]. In this study, the relative abundance of Stenotrophomonas in the original sludge was negligible (0.0%). However, during the reaction process, the abundant metal ions present in the actual groundwater, along with H2 generated by cathode electrolysis, facilitated the enrichment of Stenotrophomonas. Consequently, the relative abundance of Stenotrophomonas in cathode component I and II increased to 1.1% and 5.3%, respectively.
In addition, the heterotrophic denitrifying bacterium Brucella has the capability to simultaneously degrade aromatic organics and nitrate [56]. Its relative abundance in the original sludge is negligible (0.0%). However, in cathode components I and II, the relative abundances of Brucella are 4.8% and 10.3%, respectively, indicating lignin degradation and nitrate reduction in both cathode components. The higher relative abundance of Brucella in cathode component II compared to cathode component I may be attributed to the neutral pH in cathode component II, which is conducive to the enrichment of Brucella. Similarly, unclassified_f_Enterobacteriaceae, another heterotrophic denitrifying bacterium, exhibits a negligible relative abundance in the original sludge (0.0%). However, its relative abundance increases to 2.3% in cathode component I and 9.9% in cathode component II. This indicates heterotrophic denitrification occurring in both cathode components, with the difference in relative abundance potentially related to pH.
On the other hand, the microbial species present in the anode component have also undergone changes compared to the original sludge. The dominant bacteria in the anode component include Cellvibrio, Pseudomonas, Stenotrophomonas, unclassified_f_Sphingomonadaceae, Sphingobium, Devosia, and unclassified_f_Microbacteriaceae. Notably, Cellvibrio emerges as the predominant genus in the anode component, accounting for 13.1% of the relative abundance. This genus has been documented to degrade cellulose and lignin under aerobic conditions and can use nitrate as an inorganic nitrogen source for its growth and metabolism [57]. Additionally, several bacteria capable of performing both nitrification and denitrification under aerobic or facultative aerobic conditions, such as Pseudomonas and Stenotrophomonas, are also enriched, with relative abundances of 10.2% and 2.5%, respectively. Aeration of the bioelectrochemical system to increase DO concentration resulted in the enrichment of aerobic denitrifying bacteria Pseudomonas and Stenotrophomonas, facilitating simultaneous removal of COD and nitrate in wastewater [57].
In summary, the dominant denitrifying bacteria species in cathode components I and II are largely similar. However, variations in the concentrations of NO3-N, NO2-N, NH4+-N, and pH in the pre-treatment water contribute to differences in the dominant bacterial species. Moreover, the higher enrichment of aerobic microorganisms and lignin-degrading bacteria in the anode component effectively consumes the by-products such as O2 and NH4+-N, thereby promoting woodchip degradation.

3.4.2. The Bacterial Count in Effluent

In addition to denitrification performance, the bacterial count in the effluent serves as an important indicator for assessing the effectiveness of denitrification grids. Adhering to guidelines set by the World Health Organization (WHO) and national standards such as the “Sanitary Standards for Drinking Water” (GB5749-2006) in China is essential. These standards specify that the total bacterial count in drinking water should not exceed 100 CFU/mL. Similarly, according to the “Quality Standards for Groundwater” (GB/T 14848-2017) in China, the total bacteria count in Class I to III water quality should be ≤100 CFU/mL, while in Class IV water quality, it should be ≤1000 CFU/mL. Hence, this study conducted an analysis of the total bacterial count in the effluent of D1 at different flow rates under 350 mA/m2, as depicted in Table 3.
According to Table 3, the total bacterial count in the actual groundwater ranges from 1.13 × 10² to 3.45 × 10² CFU/mL, which meets the Class IV standard for groundwater quality. However, under a constant applied current density of 350 mA/m2, an increase in flow rate leads to a rise in the total bacterial count in the effluent. Specifically, at a flow rate of 5 cm/d, the count ranges from 3.10 × 10² to 7.51 × 10² CFU/mL, still within the Class IV standard. However, as the flow rate further increases, the total bacterial count in the downstream area gradually increases, reaching 3.72 × 10⁵~5.21 × 10⁵ CFU/mL at 20 cm/d. This represents a three-orders-of-magnitude increase compared to the groundwater before treatment. The observed rise in bacterial count in the effluent may be attributed to the higher flow rate, which washes out some biofilms from the denitrification zone into the effluent. This also explains why nitrate and nitrite reduction occurred in the downstream area. For practical implementation, either an antimicrobial-agent-loaded PRB [58] or an electrochemically oxidized PRB with low-voltage electrodes for oxidizing species generation [59] can be employed. These solutions effectively inactivate bacteria while maintaining hydraulic conductivity, thereby ensuring water safety and compliance with regulatory standards.

4. Conclusions

The in situ bioelectrochemical remediation reactor developed in this study can adapt to a wide flow-rate range of 5~20 cm/d. Operating at a temperature of 18.5 ± 0.8 °C, a current density of 350 mA/m2, and a flow rate of 10 cm/d, the reactor achieves impressive nitrate removal efficiency (97.6% ± 0.4%) and a notable removal rate (2.37 ± 0.14 mg-N/(L·h)) within the denitrification zone. Moreover, the application of current increases the permeability of the denitrification grid. Furthermore, microbial analysis reveals significant enrichment of hydrogen autotrophic denitrifying bacteria, particularly Pseudomonas aeruginosa, in cathode component I (53.4%) and component II (34.3%) in the denitrification zone. Conversely, a more uniform distribution of autotrophic and heterotrophic denitrifying bacteria is observed in the cathode component towards the rear. Additionally, the anode module exhibits elevated levels of aerobic micro-organisms (Cellvibrio and Stenotrophomonas) and lignin-degrading bacteria (Sphingobium and unclassified_f__Sphingomonadaceae), indicating robust biodegradation processes. These findings underscore the efficacy and potential of the developed reactor for mitigating nitrate contamination in groundwater, offering valuable insights for future environmental remediation efforts.

Author Contributions

C.Y.: data curation, writing—original draft preparation, software, methodology, manuscript modification and inspection. Y.C.: investigation. C.F.: conceptualization, methodology, project administration. All authors have read and agreed to the published version of the manuscript.

Funding

This research was funded by the National Natural Science Foundation of China (NSFC; No. 42077163), the Shanxi Provincial Basic Research Program (No. 202303021222051), the Scientific and Technological Innovation Foundation of Shanxi Agricultural University (Ph.D. Research Startup) (No. 2021BQ94), and the Award for Excellent Doctoral in Shanxi (No. SXBYKY2022045).

Data Availability Statement

The related research has not been completed. If there is a need, you can consult for some data at yangchen@sxau.edu.cn.

Acknowledgments

The authors acknowledge financial support from the National Natural Science Foundation of China, the Shanxi Provincial Basic Research Program, the Scientific and Technological Innovation Foundation of Shanxi Agricultural University (Ph.D. Research Startup), and the Award for Excellent Doctoral in Shanxi.

Conflicts of Interest

We declare no conflicts of interests.

References

  1. Su, H.; Kang, W.D.; Li, Y.R.; Li, Z. Fluoride and nitrate contamination of groundwater in the Loess Plateau, China: Sources and related human health risks. Environ. Pollut. 2021, 286, 117287. [Google Scholar] [CrossRef]
  2. Egbi, C.D.; Anornu, G.K.; Ganyaglo, S.Y.; Appiah-Adjei, E.K.; Li, S.L.; Dampare, S.B. Nitrate contamination of groundwater in the Lower Volta River Basin of Ghana: Sources and related human health risks. Ecotoxicol. Environ. Saf. 2020, 191, 110227. [Google Scholar] [CrossRef] [PubMed]
  3. Borah, P.; Borah, G.; Malakar, A. Mitigating nitrate contamination in groundwater: A comprehensive review of in-situ approaches. Groundw. Sustain. Dev. 2025, 28, 101406. [Google Scholar] [CrossRef]
  4. Lawrinenko, M.; Rhea, L.; Forshay, K.J.; Lee, T.R.; White, M.; Wilkin, R.T. Long-term field study of nitrate and ammonium remediation using a permeable reactive barrier at a livestock feeding operation. J. Environ. Manag. 2025, 380, 124962. [Google Scholar] [CrossRef] [PubMed]
  5. Yu, W.H.; Zheng, T.Y.; Guo, B.; Tao, Y.H.; Liu, L.C.; Yan, N.; Zheng, X.L. Coupling of polyhydroxybutyrate and zero-valent iron for enhanced treatment of nitrate pollution within the Permeable Reactive Barrier and its downgradient aquifer. Water Res. 2024, 250, 121060. [Google Scholar] [CrossRef]
  6. Zou, L.; Xu, J.; Liu, H.; Zhou, Z.; Chen, Y.; Wang, X.; Wang, H.; Zou, Y. The efficiency of enhanced nitrogen and phosphorus removal in a vertical flow constructed wetland using alkaline modified corn cobs as a carbon source. Environ. Technol. Innov. 2024, 35, 103690. [Google Scholar] [CrossRef]
  7. Wang, J.; Chu, L. Biological nitrate removal from water and wastewater by solid-phase denitrification process. Biotechnol. Adv. 2016, 34, 1103–1112. [Google Scholar] [CrossRef]
  8. Law, J.Y. Opportunities and Challenges to Use Electrical Stimulation for Enhanced Denitrification in Woodchip Bioreactors; Iowa State University: Ames, IA, USA, 2017. [Google Scholar]
  9. Li, W.W.; Yu, H.Q. Electro-assisted groundwater bioremediation: Fundamentals, challenges and future perspectives. Bioresour. Technol. 2015, 196, 677–684. [Google Scholar] [CrossRef]
  10. Sakakibara, Y.; Kuroda, M. Electric prompting and control of denitrification. Biotechnol. Bioeng. 1993, 42, 535–537. [Google Scholar] [CrossRef]
  11. Tong, S.; Liu, H.Y.; Feng, C.P.; Chen, N.; Zhao, Y.; Xu, B.C.; Zhao, J.M.; Zhu, M. Stimulation impact of electric currents on heterotrophic denitrifying microbial viability and denitrification performance in high concentration nitrate-contaminated wastewater. J. Environ. Sci. 2019, 77, 363–371. [Google Scholar] [CrossRef]
  12. Law, J.Y.; Soupir, M.L.; Raman, D.R.; Moorman, T.B.; Ong, S.K. Electrical stimulation for enhanced denitrification in woodchip bioreactors: Opportunities and challenges. Ecol. Eng. 2018, 110, 38–47. [Google Scholar] [CrossRef]
  13. Liu, H.; Chen, N.; Feng, C.; Tong, S.; Li, R. Impact of electro-stimulation on denitrifying bacterial growth and analysis of bacterial growth kinetics using a modified Gompertz model in a bio-electrochemical denitrification reactor. Bioresour. Technol. 2017, 232, 344–354. [Google Scholar] [CrossRef] [PubMed]
  14. Xue, L.J.; Chen, N.; Zhao, J.M.; Yang, C.; Feng, C.P. Rice husk-intensified cathode driving bioelectrochemical reactor for remediating nitrate-contaminated groundwater. Sci. Total Environ. 2022, 837, 155917. [Google Scholar] [CrossRef]
  15. Yang, C.; Liu, T.; Chen, N.; Tong, S.; Feng, C. Performance and mechanism of a novel woodchip embedded biofilm electrochemical reactor (WBER) for nitrate-contaminated wastewater treatment. Chemosphere 2021, 276, 130250. [Google Scholar] [CrossRef]
  16. Xu, X.; Zou, Y.; Pan, H.; Gu, B. Safeguarding Groundwater Nitrate within Regional Boundaries in China. Environ. Sci. Technol. 2025, 59, 467–477. [Google Scholar] [CrossRef]
  17. Freeze, R.A. Three-Dimensional, Transient, Saturated-Unsaturated Flow in a Groundwater Basin. Water Resour. Res. 1971, 7, 347–366. [Google Scholar] [CrossRef]
  18. Pous, N.; Koch, C.; Vilà-Rovira, A.; Balaguer, M.D.; Colprim, J.; Mühlenberg, J.; Müller, S.; Harnisch, F.; Puig, S. Monitoring and engineering reactor microbiomes of denitrifying bioelectrochemical systems. RSC Adv. 2015, 5, 68326–68333. [Google Scholar] [CrossRef]
  19. Mena, E.; Ruiz, C.; Villaseñor, J.; Rodrigo, M.A.; Cañizares, P. Biological permeable reactive barriers coupled with electrokinetic soil flushing for the treatment of diesel-polluted clay soil. J. Hazard. Mater. 2015, 283, 131–139. [Google Scholar] [CrossRef] [PubMed]
  20. Li, R.; Feng, C.P.; Chen, N.; Zhang, B.G.; Hao, C.B.; Peng, T.; Zhu, X. A bench-scale denitrification wall for simulating the in-situ treatment of nitrate-contaminated groundwater. Ecol. Eng. 2014, 73, 536–544. [Google Scholar] [CrossRef]
  21. Yang, C.; Feng, C.P.; Chen, N.; Deng, Y.; Hu, W.W.; Xue, L.J. Development of a novel palm fiber biofilm electrode reactor (PBER) for nitrate-contaminated wastewater treatment: Performance and mechanism. Environ. Sci.-Water Res. 2020, 6, 839–850. [Google Scholar] [CrossRef]
  22. SEPA. Water and Wastewater Monitoring Analysis Method; China Environmental Science Press: Beijing, China, 2002. [Google Scholar]
  23. Zhao, J.M.; Feng, C.P.; Tong, S.; Chen, N.; Dong, S.S.; Peng, T.; Jin, S.L. Denitrification behavior and microbial community spatial distribution inside woodchip-based solid-phase denitrification (W-SPD) bioreactor for nitrate-contaminated water treatment. Bioresour. Technol. 2018, 249, 869–879. [Google Scholar] [CrossRef] [PubMed]
  24. Li, B.; Irvin, S. The Comparison of Alkalinity and ORP as Indicators for Nitrification and Denitrification in a Sequencing Batch Reactor (SBR). Biochem. Eng. J. 2007, 34, 248–255. [Google Scholar] [CrossRef]
  25. Zhang, J.; Quast, T.; Eid, B.; Chen, Y.-T.; Zerdoumi, R.; Dieckhöfer, S.; Junqueira, J.R.C.; Seisel, S.; Schuhmann, W. In-situ electrochemical reconstruction and modulation of adsorbed hydrogen coverage in cobalt/ruthenium-based catalyst boost electroreduction of nitrate to ammonia. Nat. Commun. 2024, 15, 8583. [Google Scholar] [CrossRef]
  26. Chen, H.; Tang, M.; He, L.; Xiao, X.; Yang, F.; He, Q.; Sun, S.; Gao, Y.; Zhou, L.; Li, Y.; et al. Exploring the impact of fulvic acid on electrochemical hydrogen-driven autotrophic denitrification system: Performance, microbial characteristics and mechanism. Bioresour. Technol. 2024, 412, 131432. [Google Scholar] [CrossRef]
  27. Du, X.; Zhang, H.; Sullivan, K.P.; Gogoi, P.; Deng, Y. Electrochemical Lignin Conversion. ChemSusChem 2020, 13, 4318–4343. [Google Scholar] [CrossRef]
  28. Glass, C.; Silverstein, J.A. Denitrification kinetics of high nitrate concentration water: pH effect on inhibition and nitrite accumulation. Water Res. 1998, 32, 831–839. [Google Scholar] [CrossRef]
  29. Nakhla, G.; Zhu, J. Impact of calcium on biofilm morphology, structure, detachment and performance in denitrifying fluidized bed bioreactors (DFBBRs). Chem. Eng. J. 2013, 232, 183–195. [Google Scholar] [CrossRef]
  30. Celmer, D.; Oleszkiewicz, J.A.; Cicek, N. Impact of shear force on the biofilm structure and performance of a membrane biofilm reactor for tertiary hydrogen-driven denitrification of municipal wastewater. Water Res. 2008, 42, 3057–3065. [Google Scholar] [CrossRef]
  31. Mahara, Y.M.A.; Habermehl, T.; Hasegawa, K.; Nakata, T.; Ransley, R. Groundwater dating by estimation of groundwater flow velocity and dissolved 4He accumulation rate calibrated by 36Cl in the Great Artesian Basin, Australia. Earth Planet. Sc. Lett. 2009, 287, 43–56. [Google Scholar] [CrossRef]
  32. Wang, J.; Zhang, F.; Wang, Z.; Liang, H.; Du, Z.; Zhang, Y.; Lu, H.; Peng, Y. Metagenomic insights into nitrite accumulation in sulfur-based denitrification systems utilizing different electron donors: Functional microbial communities and metabolic mechanisms. Water Res. 2025, 270, 122805. [Google Scholar] [CrossRef]
  33. Kinnunen, O.; Kruglova, A.; Jensen, M.M.; Kuokkanen, A.; Smets, B.F.; Mikola, A. Shift in activated sludge microbiomes associated with nitrite accumulation and high nitrous oxide emissions. Environ. Res. 2025, 277, 121591. [Google Scholar] [CrossRef] [PubMed]
  34. Thrash, J.C.; Coates, J.D. Direct and indirect electrical stimulation of microbial metabolism. Environ. Sci. Technol. 2008, 42, 3921–3931. [Google Scholar] [CrossRef]
  35. Kaviraj, M.; Kumar, U.; Chatterjee, S.; Parija, S.; Padbhushan, R.; Nayak, A.; Gupta, V.V. Dissimilatory nitrate reduction to ammonium (DNRA): A unique biogeochemical cycle to improve nitrogen (N) use efficiency and reduce N-loss in rice paddy. Rhizosphere 2024, 30, 100875. [Google Scholar] [CrossRef]
  36. Zhang, J.; Feng, C.; Hong, S.; Hao, H.; Yang, Y. Behavior of solid carbon sources for biological denitrification in groundwater remediation. Water Sci. Technol. 2012, 65, 1696–1704. [Google Scholar] [CrossRef]
  37. White, C.; Antell, E.; Schwartz, S.L.; Lawrence, J.E.; Keren, R.; Zhou, L. Synergistic interactions between anammox and dissimilatory nitrate reducing bacteria sustains reactor performance across variable nitrogen loading ratios. Front. Microbiol. 2023, 14, 1243410. [Google Scholar] [CrossRef]
  38. Wan, Y.; Li, R.; Yao, K.; Peng, C.; Wang, W.; Li, N.; Wang, X. Bioelectro-barriers prevent nitrate leaching into groundwater via nitrogen retention. Water Res. 2024, 249, 120988. [Google Scholar] [CrossRef] [PubMed]
  39. Liu, X.; Dong, H.; Wang, Q.; Yang, J.; Zhai, X.; Lin, M.; Liu, K.; Yang, Q. Efficient nitrate removal via microorganism-iron oxide co-evolution on biocathode surface. Bioelectrochemistry 2024, 163, 108889. [Google Scholar] [CrossRef]
  40. Wang, J.; Wang, Y.; Bai, J.; Liu, Z.; Yan, D. High efficiency of inorganic nitrogen removal by integrating biofilm-electrode with constructed wetland: Autotrophic denitrifying bacteria analysis. Bioresour. Technol. 2015, 227, 7–14. [Google Scholar] [CrossRef] [PubMed]
  41. Robertson, W.D. Nitrate removal rates in woodchip media of varying age. Ecol. Eng. 2010, 36, 1581–1587. [Google Scholar] [CrossRef]
  42. Christianson, L.E.; Feyereisen, G.W.; Hay, C.; Tschirner, U.W.; Kult, K.; Wickramarathne, N.M.; Hoover, N.; Soupir, M.L. Denitrifying bioreactor woodchip recharge: Media properties after nine years. Trans. ASABE 2020, 63, 407–416. [Google Scholar] [CrossRef]
  43. Parpot, P.; Bettencourt, A.P.; Carvalhoa, A.M.; Carvalhoe, M. Biomass conversion: Attempted electrooxidation of lignin for vanillin production. J. Appl. Electrochem. 2000, 30, 727–731. [Google Scholar] [CrossRef]
  44. Sakakibara, Y.; Flora, J.R.V.; Suidan, M.T.; Kuroda, M. Modeling of electrochemically-activated denitrifying biofilms. Water Res. 1994, 28, 1077–1086. [Google Scholar] [CrossRef]
  45. Fu, F.S.; Zhang, R.D.; Luo, H.P.; Liu, G.L.; Bai, Y.P. Autotrophic biocathode for high efficient sulfate reduction in microbial electrolysis cells. Bioresour. Technol. 2014, 167, 462–468. [Google Scholar] [CrossRef]
  46. Otwell, A.E.; Carr, A.V.; Majumder, E.L.W.; Ruiz, M.K.; Wilpiszeski, R.L.; Hoang, L.T.; Webb, B.; Turkarslan, S.; Gibbons, S.M.; Elias, D.A.; et al. Sulfur metabolites play key system-level roles in modulating denitrification. mSystems 2021, 6, e01025-20. [Google Scholar] [CrossRef]
  47. Kuang, P.; Natsui, K.; Einaga, Y.; Feng, C.; Deng, Y. Annealing enhancement in stability and performance of copper modified boron-doped diamond (Cu-BDD) electrode for electrochemical nitrate reduction. Diam. Relat. Mater. 2021, 114, 108310. [Google Scholar] [CrossRef]
  48. Cunningham, A.B.; Characklis, W.G.; Abedeen, F.; Crawford, D. Influence of biofilm accumulation on porous media hydrodynamics. Environ. Sci. Technol. 1991, 25, 1305–1311. [Google Scholar] [CrossRef]
  49. Iqbal, A.; Ligeng, J.; Mo, Z.; Adnan, M.; Lal, R.; Zaman, M.; Usman, S.; Hua, T.; Imran, M.; Pan, S.-G.; et al. Substation of vermicompost mitigates Cd toxicity, improves rice yields and restores bacterial community in a Cd-contaminated soil in Southern China. J. Hazard. Mater. 2024, 5, 465. [Google Scholar] [CrossRef]
  50. Almeida, G.S.S.; Saito, V.S.; Sartori, M. Experimental effects of multiple agricultural stressors on diversity and size structure of subtropical stream macroinvertebrates. Environ. Adv. 2025, 20, 100630. [Google Scholar] [CrossRef]
  51. Hassan, M.; Zhu, G.; Yang, Z. The removal performance of nitrates in the novel 3D-BERS with GAC and diversity of immobilized microbial communities treating nitrate-polluted water: Effects of pH and COD/NO3-N ratio. Environ. Eng. Res. 2022, 27, 200526. [Google Scholar] [CrossRef]
  52. Li, C.; Pan, G.; Wang, X.; Qiang, X.; Qiang, T. The effects of non-metallic organic tanning agents on the microbial community structure in wastewater. J. Clean. Prod. 2020, 279, 123553. [Google Scholar] [CrossRef]
  53. Zhang, Y.; Wei, D.; Morrison, L.; Ge, Z.; Zhan, X.; Li, R. Nutrient removal through pyrrhotite autotrophic denitrification: Implications for eutrophication control. Sci. Total Environ. 2019, 662, 287–296. [Google Scholar] [CrossRef]
  54. Liang, B.; Wang, L.Y.; Mbadinga, S.M.; Liu, J.F.; Mu, B.Z. Anaerolineaceae and Methanosaeta turned to be the dominant microorganisms in alkanes-dependent methanogenic culture after long-term of incubation. Amb. Express. 2015, 5, 37. [Google Scholar] [CrossRef]
  55. Mao, Y.; Yu, X.; Tong, Z. Characterization of Thauera-dominated hydrogen-oxidizing autotrophic denitrifying microbial communities by using high-throughput sequencing. Bioresour. Technol. 2013, 128, 703–710. [Google Scholar] [CrossRef]
  56. Freddi, L.; de la Garza-García, J.A.; Al Dahouk, S.; Occhialini, A.; Köhler, S. Brucella spp. are facultative anaerobic bacteria under denitrifying conditions. Microbiol. Spectr. 2023, 11, 02767. [Google Scholar] [CrossRef]
  57. Vanderstraeten, J.; Lamote, B.; da Fonseca, M.J.M.; De Groote, P.; Briers, Y. Conversion of the free Cellvibrio japonicus xyloglucan degradation system to the cellulosomal mode. Appl. Microbiol. Biotechnol. 2022, 106, 5495–5509. [Google Scholar] [CrossRef]
  58. Underwood, J.C.; Harvey, R.W.; Metge, D.W.; Repert, D.A.; Baumgartner, L.K.; Smith, R.L.; Roane, T.M.; Barber, L.B. Effects of the Antimicrobial Sulfamethoxazole on Groundwater Bacterial Enrichment. Environ. Sci. Technol. 2011, 45, 3096–3101. [Google Scholar] [CrossRef] [PubMed]
  59. Cloete, T.; Thantsha, M.; Maluleke, M.; Kirkpatrick, R. The antimicrobial mechanism of electrochemically activated water against Pseudomonas aeruginosa and Escherichia coli as determined by SDS-PAGE analysis. J. Appl. Microbiol. 2010, 107, 379–384. [Google Scholar] [CrossRef] [PubMed]
Figure 1. The experimental device of isBER enhanced by woodchips for nitrate-contaminated groundwater remediation.
Water 17 01593 g001
Figure 2. The denitrification performance of isBER at different operating stages.
Water 17 01593 g002
Figure 3. The average pH of water sampling port in stage 2~5 (a); the concentration of cations and anions in the influent and effluent of stages 2~5 (b). The different letters (a–c) denote significant differences (p < 0.05, Tukey’s test). In comparison to stage 2, the pH values of W3, W4, and W5 in stage 3 were closer to neutral after the application of current (a), leading to lower nitrite accumulation. The pH value of the solution after the anode components was lower than that after the cathode components. This difference can be attributed to the cushioning effect of CO2 generated by the anodic carbon rod oxidation. Additionally, aromatic acids produced by anodic electrochemical oxidation and woodchip decomposition also contributed to the decrease in solution pH [43].
Water 17 01593 g003
Figure 4. Changes in permeability coefficient (k) and Darcy flow velocity (vd) in isBER.
Water 17 01593 g004
Figure 5. Microbial community at the genus level in the original sludge and various electrode components.
Water 17 01593 g005
Table 1. The operating conditions of isBER.
Stage 1Stage 2Stage 3Stage 4Stage 5
Current density (mA/m2)00350350350
flow rate (L/d)0.990.990.991.983.96
Running time (d)0~1516~3031~4546~6061~75
Table 2. The microbial community diversity indices of the original sludge and electrode components.
SampleSobsShannonAceChaoCoverage
Original sludge3444.09378.27390.160.997875
Cathode component I3012.42369.48352.410.998078
Anode component4224.16481.42468.720.997738
Cathode component II3122.99387.83412.630.997556
Table 3. The bacterial count in effluent at different flow rates under 350 mA/m2.
Water SampleThe Bacterial Count (CFU/mL)
The actual groundwater1.13 × 102~3.45 × 10²
Effluent at 5 cm/d3.10 × 102~7.51 × 10²
Effluent at 10 cm/d2.18 × 103~2.74 × 10³
Effluent at 20 cm/d3.72 × 105~5.21 × 10⁵
Disclaimer/Publisher’s Note: The statements, opinions and data contained in all publications are solely those of the individual author(s) and contributor(s) and not of MDPI and/or the editor(s). MDPI and/or the editor(s) disclaim responsibility for any injury to people or property resulting from any ideas, methods, instructions or products referred to in the content.

