1. Introduction
With the acceleration of urbanization [
1] and the compounded impact of climate change and the urban heat island effect, urban water challenges such as flooding and black-odorous water bodies have become increasingly severe, posing serious threats to public safety and urban infrastructure. These issues are particularly acute in mountainous cities, where the surrounding steep terrain, complex precipitation patterns, and fragile ecosystems exacerbate stormwater management challenges [
2]. During extreme rainfall events, the combination of rapid surface runoff on steep slopes and strong initial pollutant wash-off [
3] significantly increases the risk of flooding and water quality impairment. In areas with shallow soils or exposed bedrock, poor infiltration capacity may even trigger secondary disasters such as debris flows.
Traditional urban spatial planning often falls short in terms of integrating stormwater control, ecological restoration, and water resource protection [
4]. Recognizing this, China launched the sponge city initiative in 2013 [
5,
6], promoting integrated measures such as infiltration, detention, storage, purification, reuse, and discharge to enhance urban resilience to extreme climates [
7]. To date, sponge city construction has been piloted in 30 cities and expanded to over 100 others [
8], becoming a key strategy in global urban stormwater management [
9,
10]. In mountainous regions, the sponge city approach is especially vital for mitigating flood risks, improving rainwater utilization, and reducing non-point-source pollution.
However, the effectiveness of stormwater management measures is highly dependent on their spatial allocation and the characteristics of target areas. For example, Low-Impact Development (LID) facilities vary in structure and function, and their performance in controlling runoff and pollutants differs depending on local terrain, hydrology, and land use [
11]. Therefore, designing optimal spatial layouts for LID deployment is both technically complex and context-specific [
12].
To address the LID spatial allocation challenge, recent research has begun integrating intelligent optimization algorithms into LID planning. For example, multi-objective optimization algorithms, such as the Non-Dominated Sorting Genetic Algorithm II (NSGA-II), have been used in conjunction with the Storm Water Management Model (SWMM) to optimize LID configurations, with multiple objectives such as cost-effectiveness, runoff reduction, and pollutant removal [
13,
14]. While effective, such approaches typically require high-resolution datasets and extensive computational resources [
15,
16,
17], limiting their scalability for large and data-scarce mountainous regions [
18]. Hence, there is a need for more practical and efficient methods that account for terrain characteristics and management goals while enabling the identification of critical control areas and optimal LID deployment plans, with limited data and time inputs.
An important conceptual foundation for addressing this challenge is the
source–sink theory. It describes the flow of materials or energy between “source” areas—where phenomena (e.g., runoff, heat, pollutants) are generated—and “sink” areas—where they are received, stored, or transformed [
19]. This theory has been widely applied in fields such as urban heat island mitigation [
20], ecological security patterns [
21,
22,
23], soil erosion control [
24], and environmental pollution management [
25,
26,
27]. Owing to its low data requirements and scalability [
28], the source–sink theory has gained traction in stormwater management research, particularly in non-point-source pollution control [
29,
30] and urban flood risk assessment [
31,
32]. Closely tied to urban landscape patterns [
33], the source–sink theory provides a systematic basis for analyzing spatial configurations and their hydrological roles [
34], helping to clarify runoff generation and convergence processes across different urban zones.
Previous studies applying source–sink theory demonstrated that multi-scale, hierarchical layouts of LID facilities can significantly enhance hydrological performance in mountainous areas [
35]. For instance, Hou et al. proposed a multi-level stormwater management strategy for mountain parks, which significantly reduced peak runoff and improved water infiltration [
36]. Other research has shown that integrating source-area infiltration, mid-zone interception, and sink-area storage leads to optimal hydrological outcomes [
37,
38]. Furthermore, spatially balanced deployment of LID facilities across source and sink areas has been found to enhance landscape hydrological functions [
39]. These studies typically involve delineating zones along the source–sink continuum, designing a limited set of LID scenarios, and using hydrological modeling to assess their performance. However, they often lack a systematic approach for optimizing the LID deployment ratios across different zones.
To address this gap, the present study develops a systematic approach for optimizing LID spatial layouts using source–sink theory. Focusing on the Xining sponge city pilot area in China, this study delineates the landscape into runoff source and sink areas [
39], enabling the preliminary identification of high-risk zones and supporting targeted LID planning. LID facility types are matched to different zones according to their hydrological characteristics. An SWMM-based model is constructed to simulate runoff and water quality under dynamic scenarios. To quantitatively evaluate the balance between source and sink interventions, a new indicator—source–sink coupling optimization degree (SSCOD)—is proposed. This indicator integrates source efficiency, sink capacity, and pollutant reduction synergy to determine the optimal spatial deployment ratio of LID facilities. The study not only validates the applicability of source–sink theory for managing urban stormwater in mountainous contexts but also elucidates the mechanisms linking landscape patterns, runoff control, and pollution reduction. By reducing system complexity and enhancing planning efficiency, the proposed framework delivers both theoretical insights and practical guidance for LID layout planning, helping to minimize resource waste, correct layout imbalance, and support the sustainability goals of sponge city construction.
2. Materials and Methods
2.1. Study Area
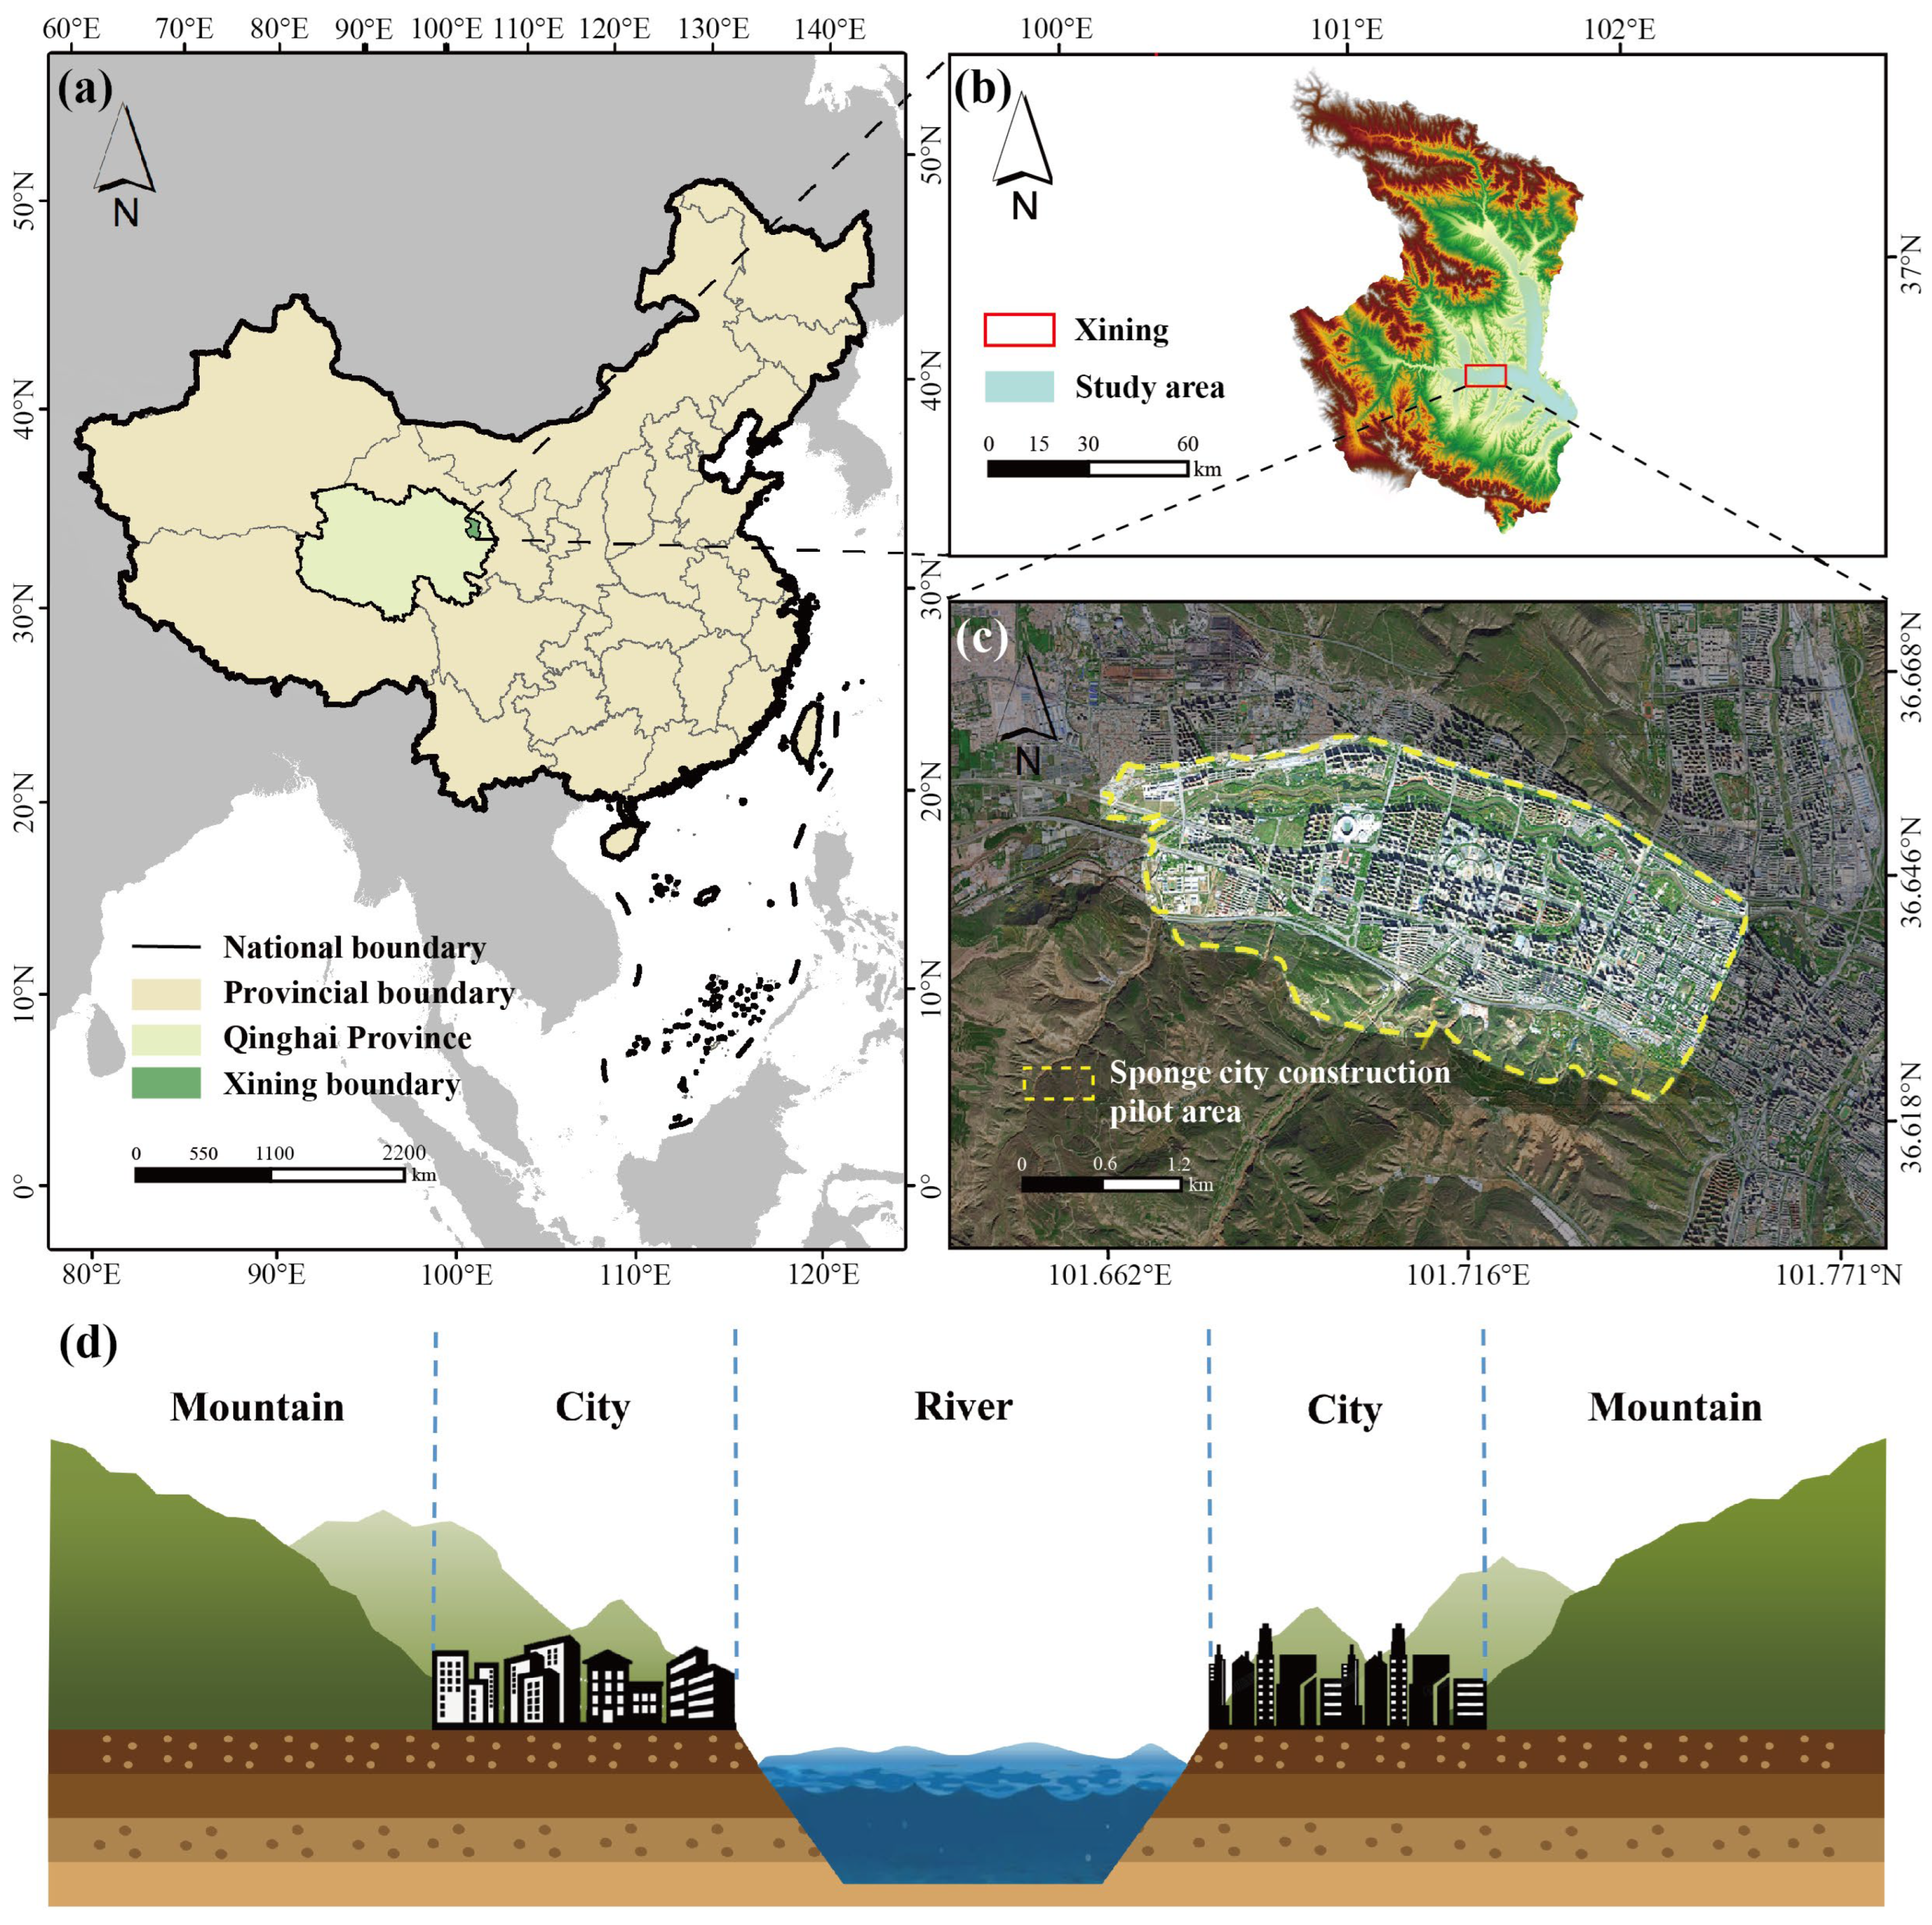
This study focuses on the sponge city construction pilot area in Xining City as a representative case (
Figure 1). Xining, the capital of Qinghai Province, is located in eastern Qinghai (101°47′ E, 36°16′ N), at the junction of the Qinghai–Tibetan Plateau and the Loess Plateau. Situated within the “Source of Three Rivers” region—the headwaters of the Yangtze, Yellow, and Lancang Rivers—Xining plays a pivotal role in China’s “Water Tower” ecological security strategy [
40], contributing significantly to national water resource management and environmental conservation. In 2016, Xining was selected as a national pilot city for sponge city construction, highlighting its importance in sustainable urban water management.
With an average elevation of 2295 m, Xining is a typical mountainous city. It features higher terrain in the northwest and lower areas in the southeast, forming a “four mountains flanking three rivers” spatial pattern. The city’s development has been shaped by its topography, with expansion constrained by mountains and extending along river valleys, resulting in a layout deeply that is integrated with mountains and water.
The pilot area is situated in the western part of Xining’s central urban zone, with a planned construction area of 21.63 km
2. It features higher terrain in the southwest and lower elevations in the northeast, with a cross slope of 2%, a longitudinal slope of 21%, and an average slope of approximately 3.5%. Elevation ranges from 2438 m at the southwestern ridgeline to 2188 m along the northern bank of the Huangshui River. Backed by mountains and facing water, the area exemplifies Xining’s “mountain–water–city” characteristics (
Figure 1b).
Xining has a continental plateau semi-arid climate with uneven spatiotemporal rainfall distribution. Annual rainfall averages around 410 mm, with 60% to 80% concentrated from May to September, peaking in July and August. The city records the highest frequency of extreme rain events in Qinghai Province. Intense summer storms, such as those occurring in 2013, 2020, and 2024, have frequently triggered flooding, landslides, and mudslides. Urban waterlogging remains a significant concern, particularly in areas surrounded by mountains, like the study site, which are highly susceptible to flooding during heavy rainfall events.
2.2. Stormwater Risk Assessment
As previously mentioned, we first performed stormwater risk assessment and delineated the study area into various zones to support subsequent LID planning. Six critical indicators were identified from the literature (see
Table 1 for rationale), including rainfall intensity, elevation, slope, vegetation coverage, land use type, and surface roughness. Among them, elevation, slope, and rainfall intensity were categorized as
runoff dynamic factors due to their role in encouraging runoff generation, while vegetation coverage, surface roughness, and land use type were classified as
landscape resistance factors for their ability to impede runoff or promote infiltration [
32].
2.2.1. Data Source
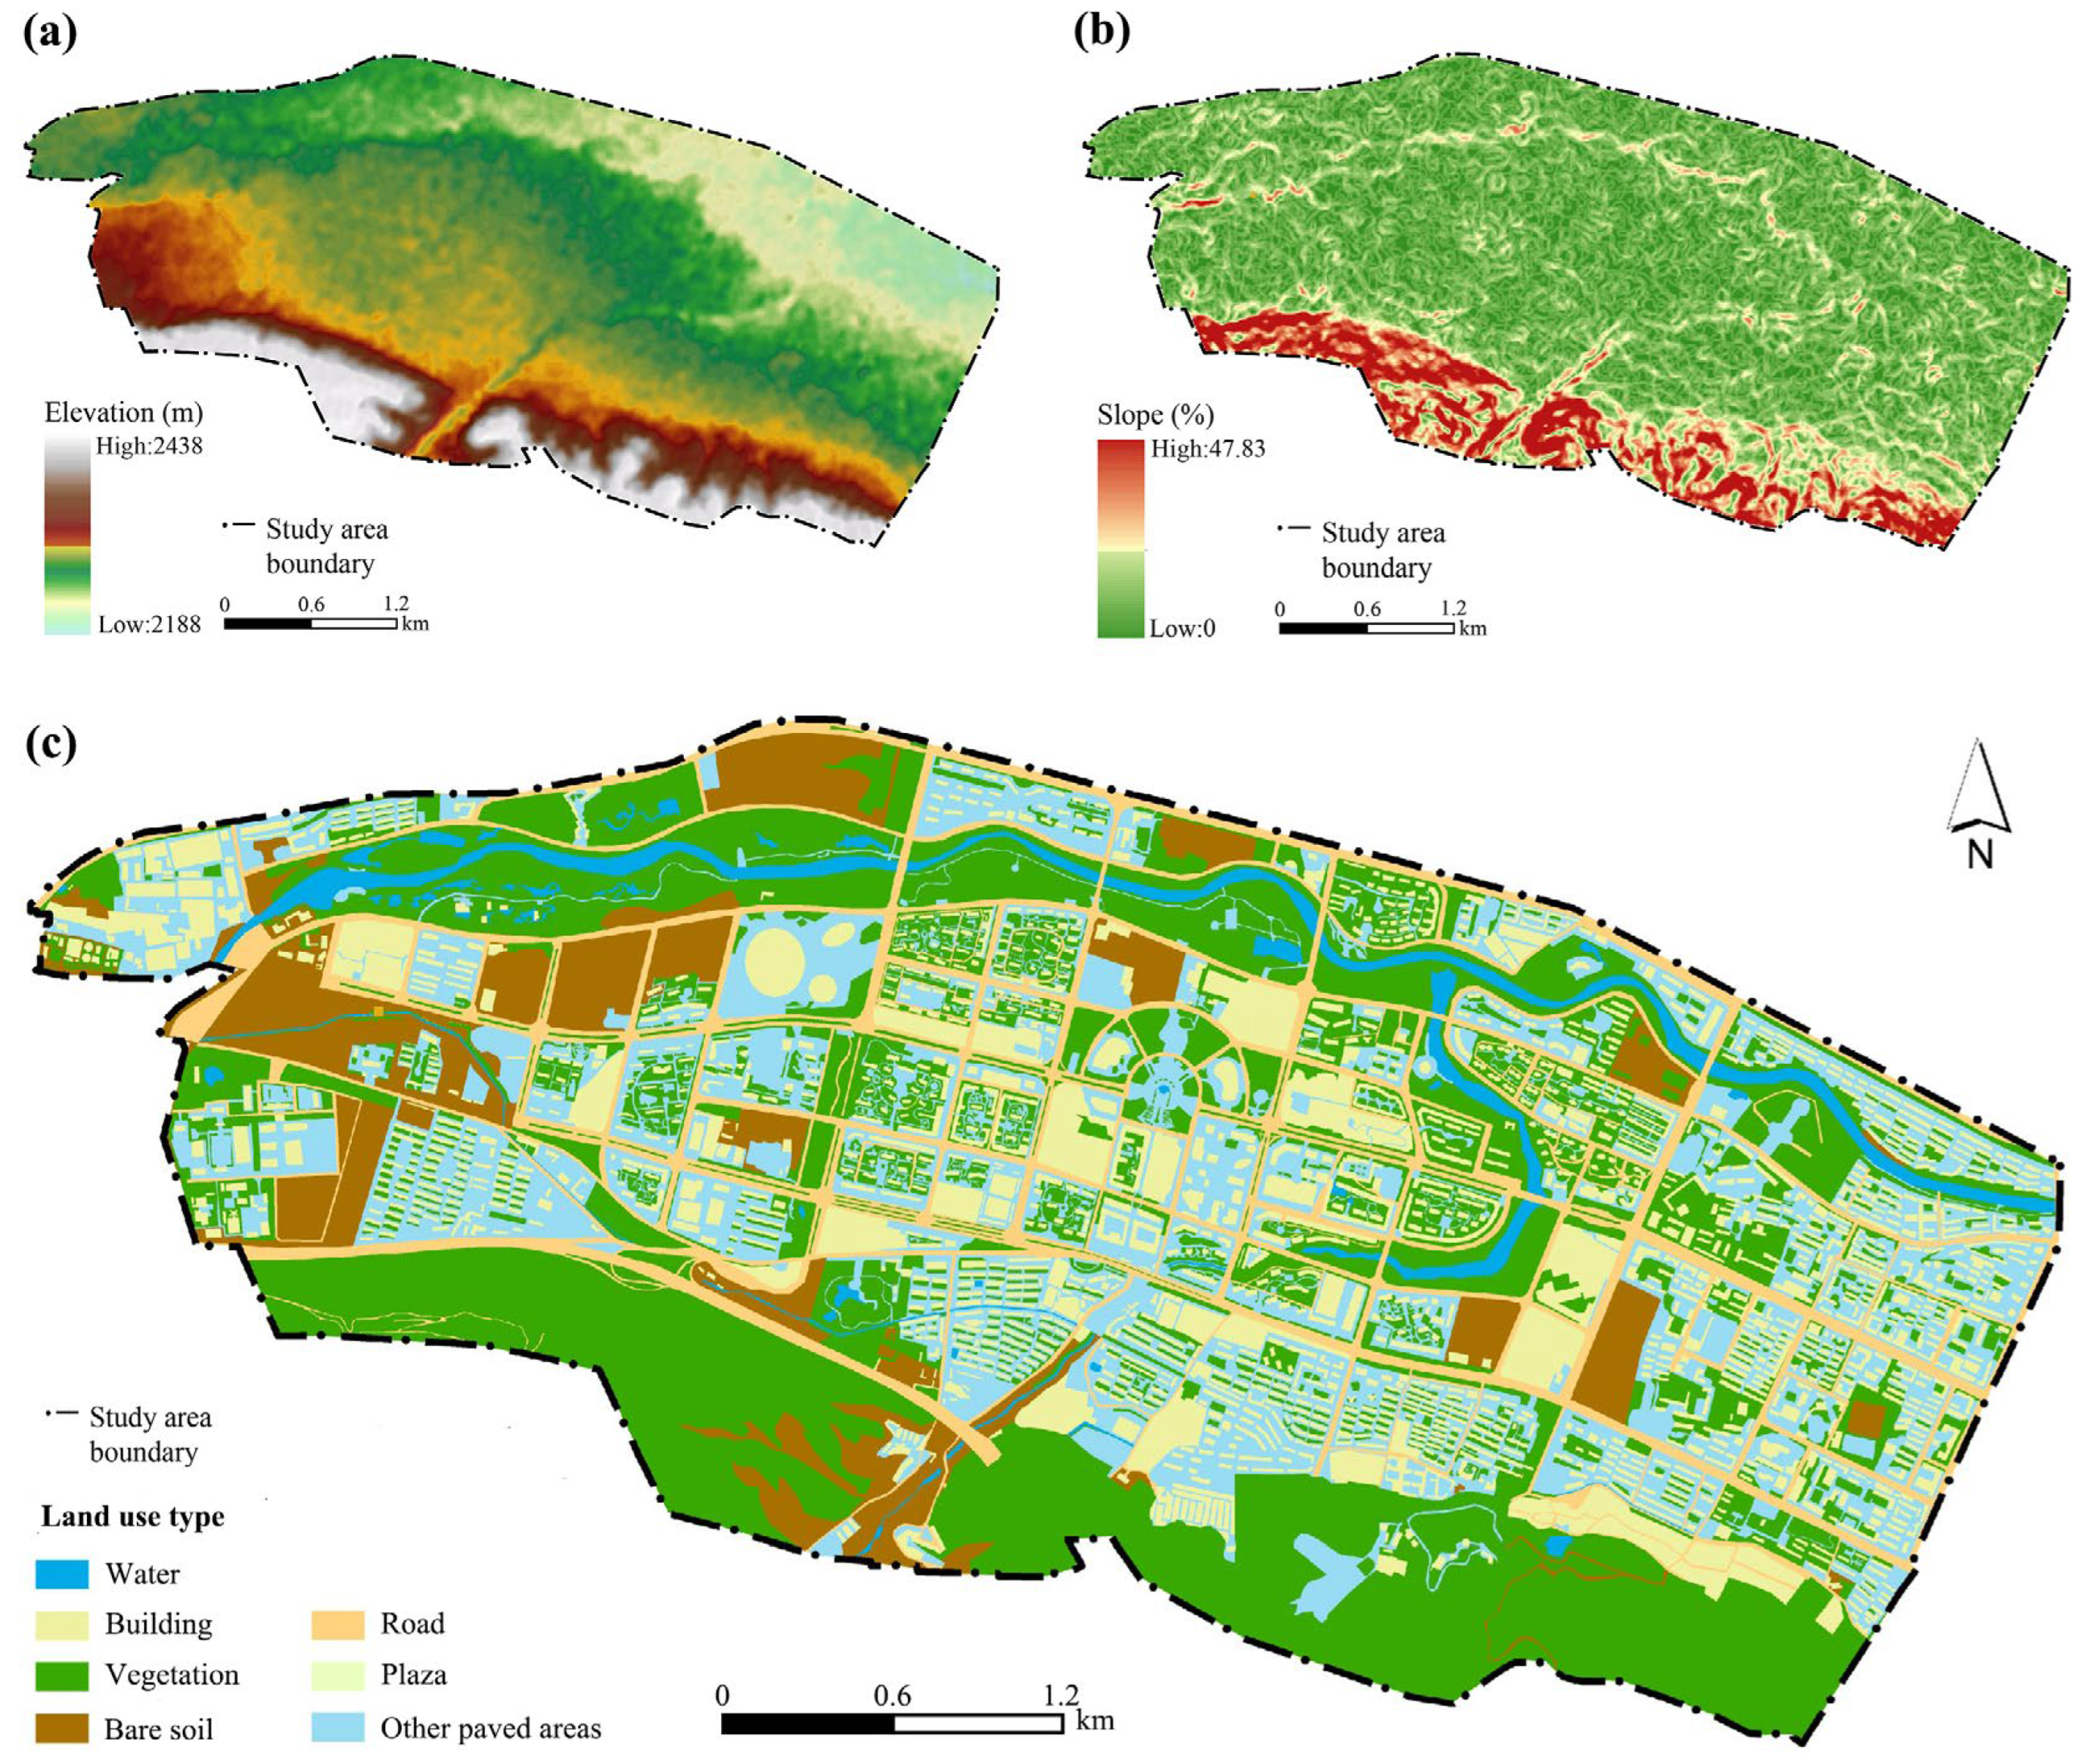
Data on the selected factors were obtained from various sources (
Figure 2). The DEM data were provided by the Alaska Satellite Facility (ASF) (
https://search.asf.alaska.edu/ 2 May 2025), while slope and surface roughness were derived from the DEM using ArcGIS 10.8. The Normalized Difference Vegetation Index (NDVI) data, representing vegetation coverage, were obtained from the Geospatial Data Cloud (
https://www.gscloud.cn 2 May 2025), and land use data were provided by the China Academy of Urban Planning & Design (CAUPD).
2.2.2. Design Rainfall
Rainfall intensity for different return periods was calculated using the formula specified in the
Xining Drainage Engineering Special Plan (2012–2030) [
41]. The rainfall intensity-duration formula for Xining is given as follows:
where
q represents the rainfall intensity (L/s·ha); t represents the rainfall duration (min); and T represents the return period (year).
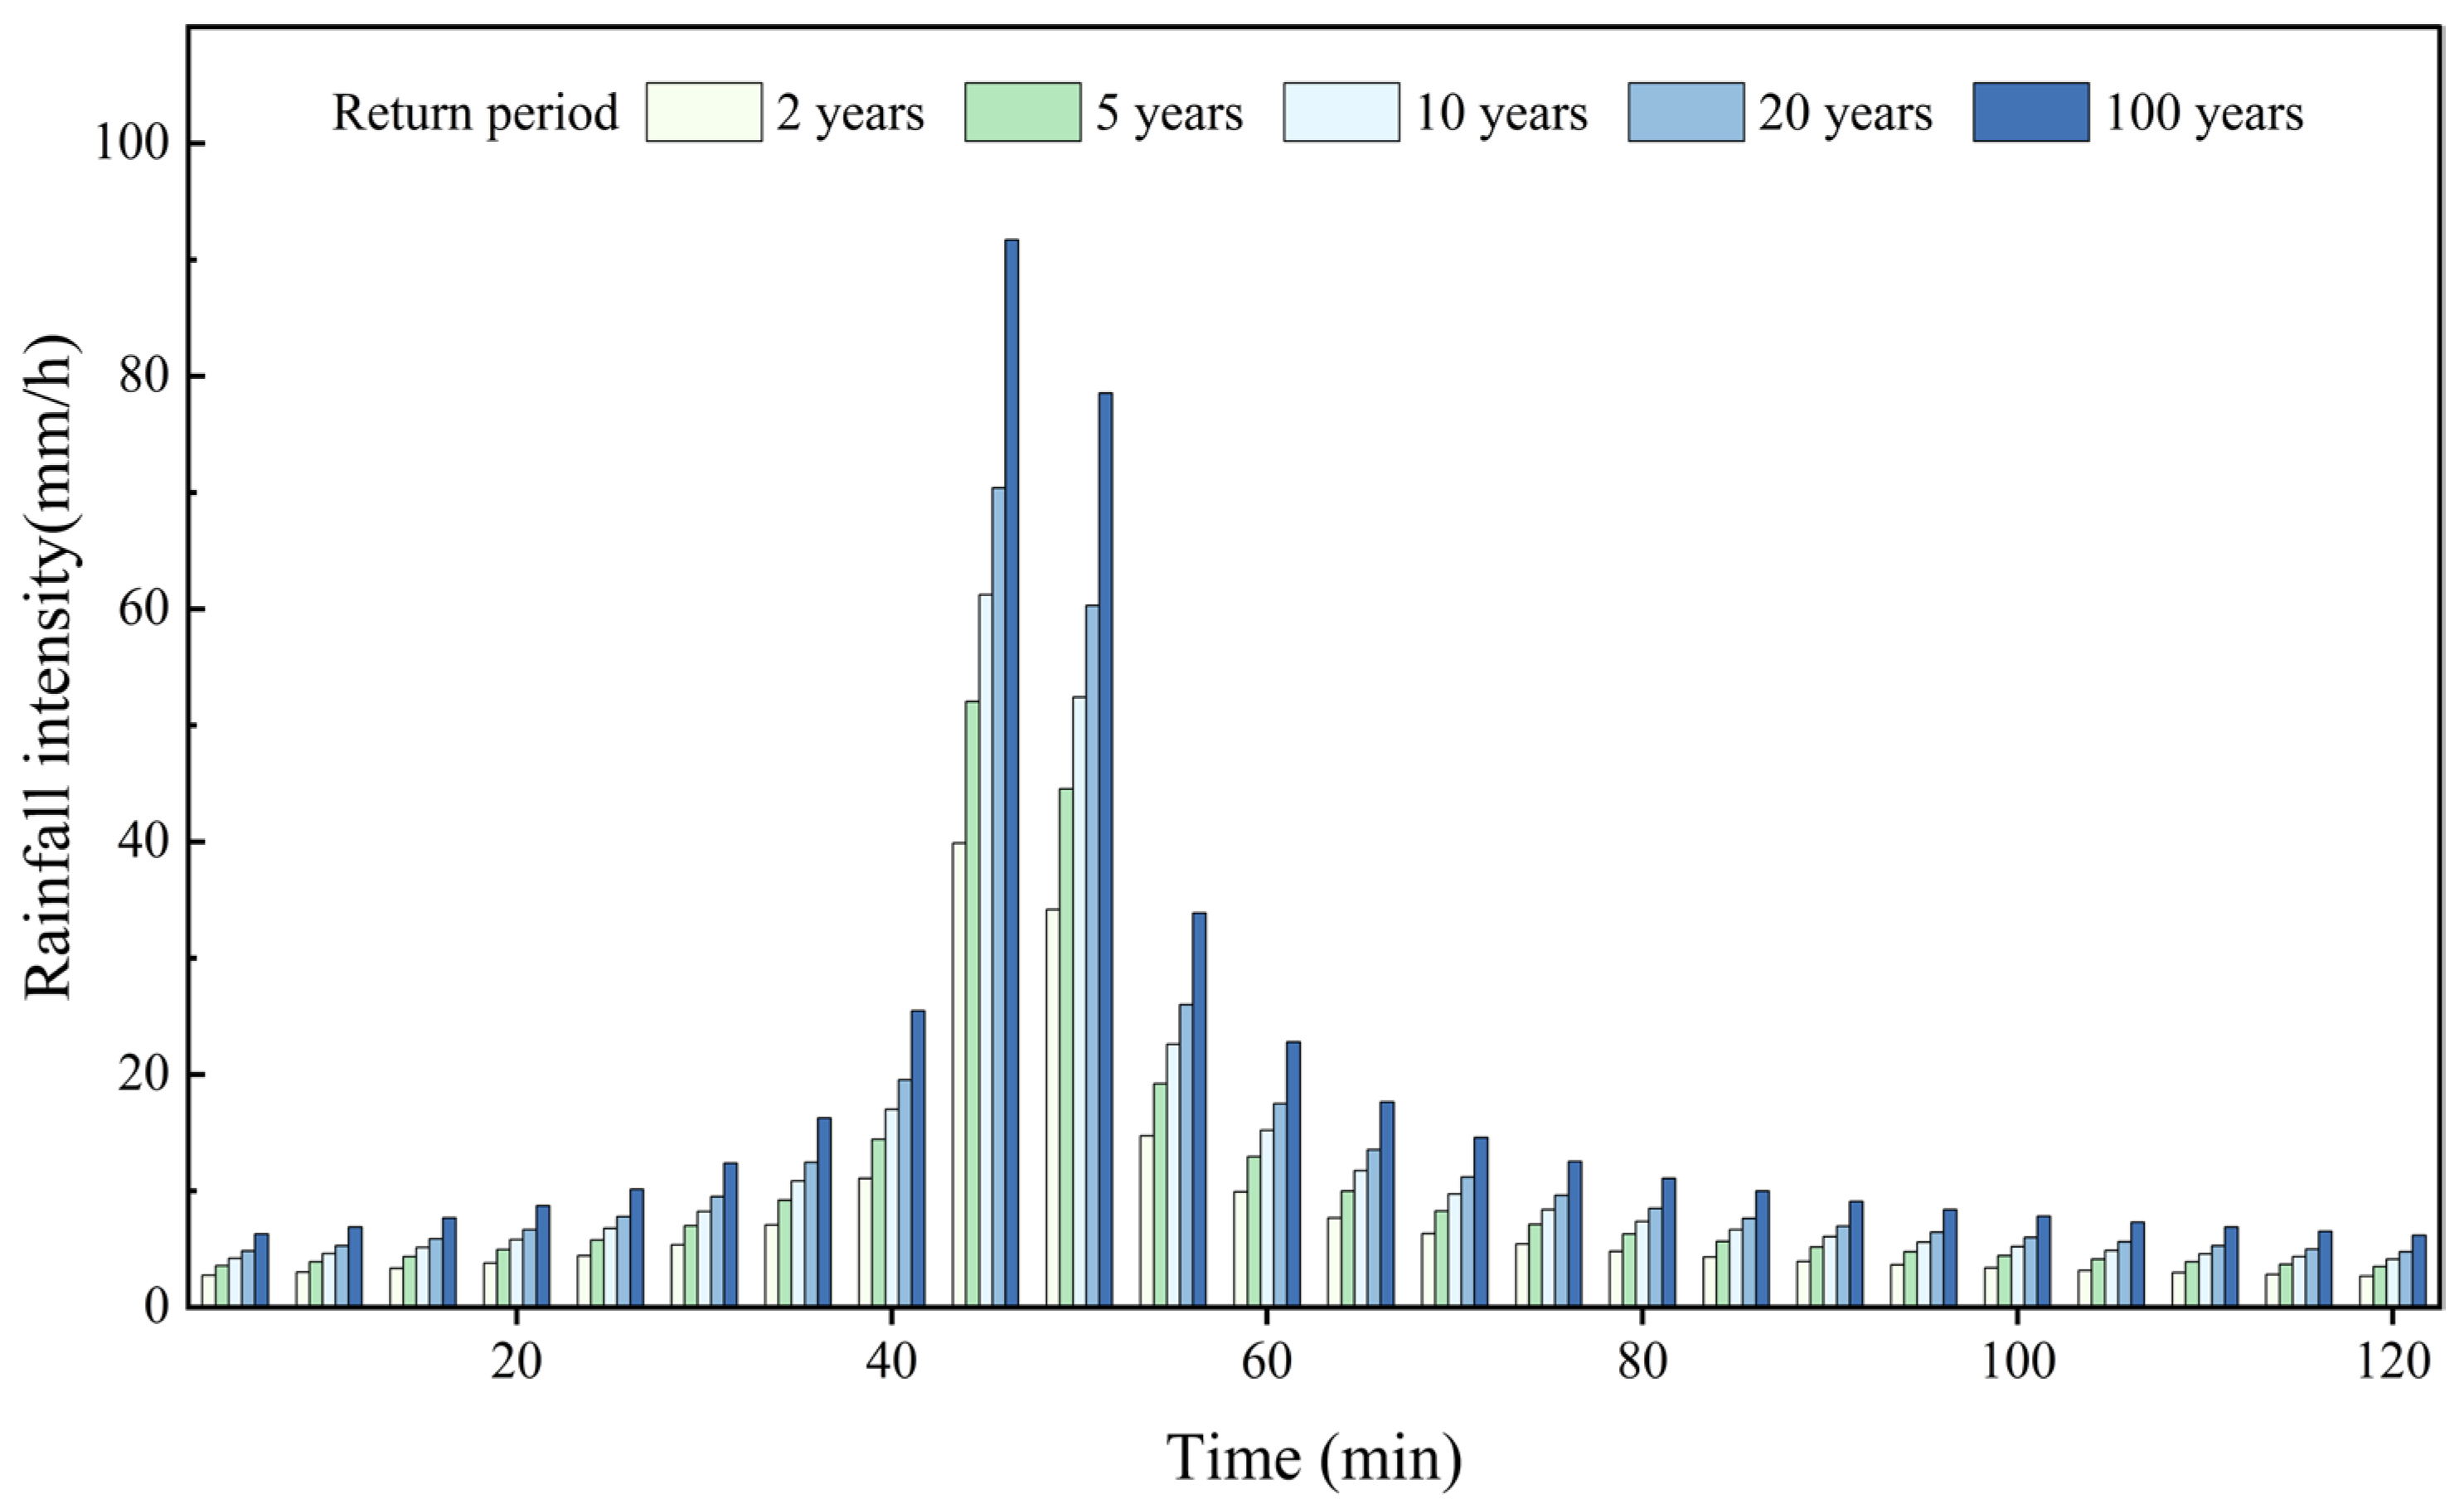
The study area is characterized by a predominantly single-peak rainfall pattern, with peak rainfall intensity occurring around r = 0.37. The Chicago rainfall pattern, which has been widely adopted by various Chinese cities with favorable outcomes [
42,
43], was used to simulate the design rainfall process in Xining. The rainfall hyetographs were generated, with a total duration of 120 min and a time interval of 5 min.
Figure 3 presents the design rainfall hyetographs for return periods of 2, 5, 10, 20, and 100 years.
2.2.3. Quantification of the Stormwater Hazard Index
Data for quantifying stormwater risks were processed and analyzed in ArcGIS 10.8. Raster values of each evaluation indicator were classified into six levels and assigned dynamic or resistance coefficients, which are relative values reflecting the variation in influence across different factors. Based on the existing literature [
44], coefficients were set within the range of 1 to 10. After setting the coefficients for the indicators (
Table 2 and
Table 3), their corresponding weights were determined using the Analytic Hierarchy Process (AHP) [
45] (
Table 4). The consistency ratio (CR) was less than 0.1, indicating all weightings passed the consistency check.
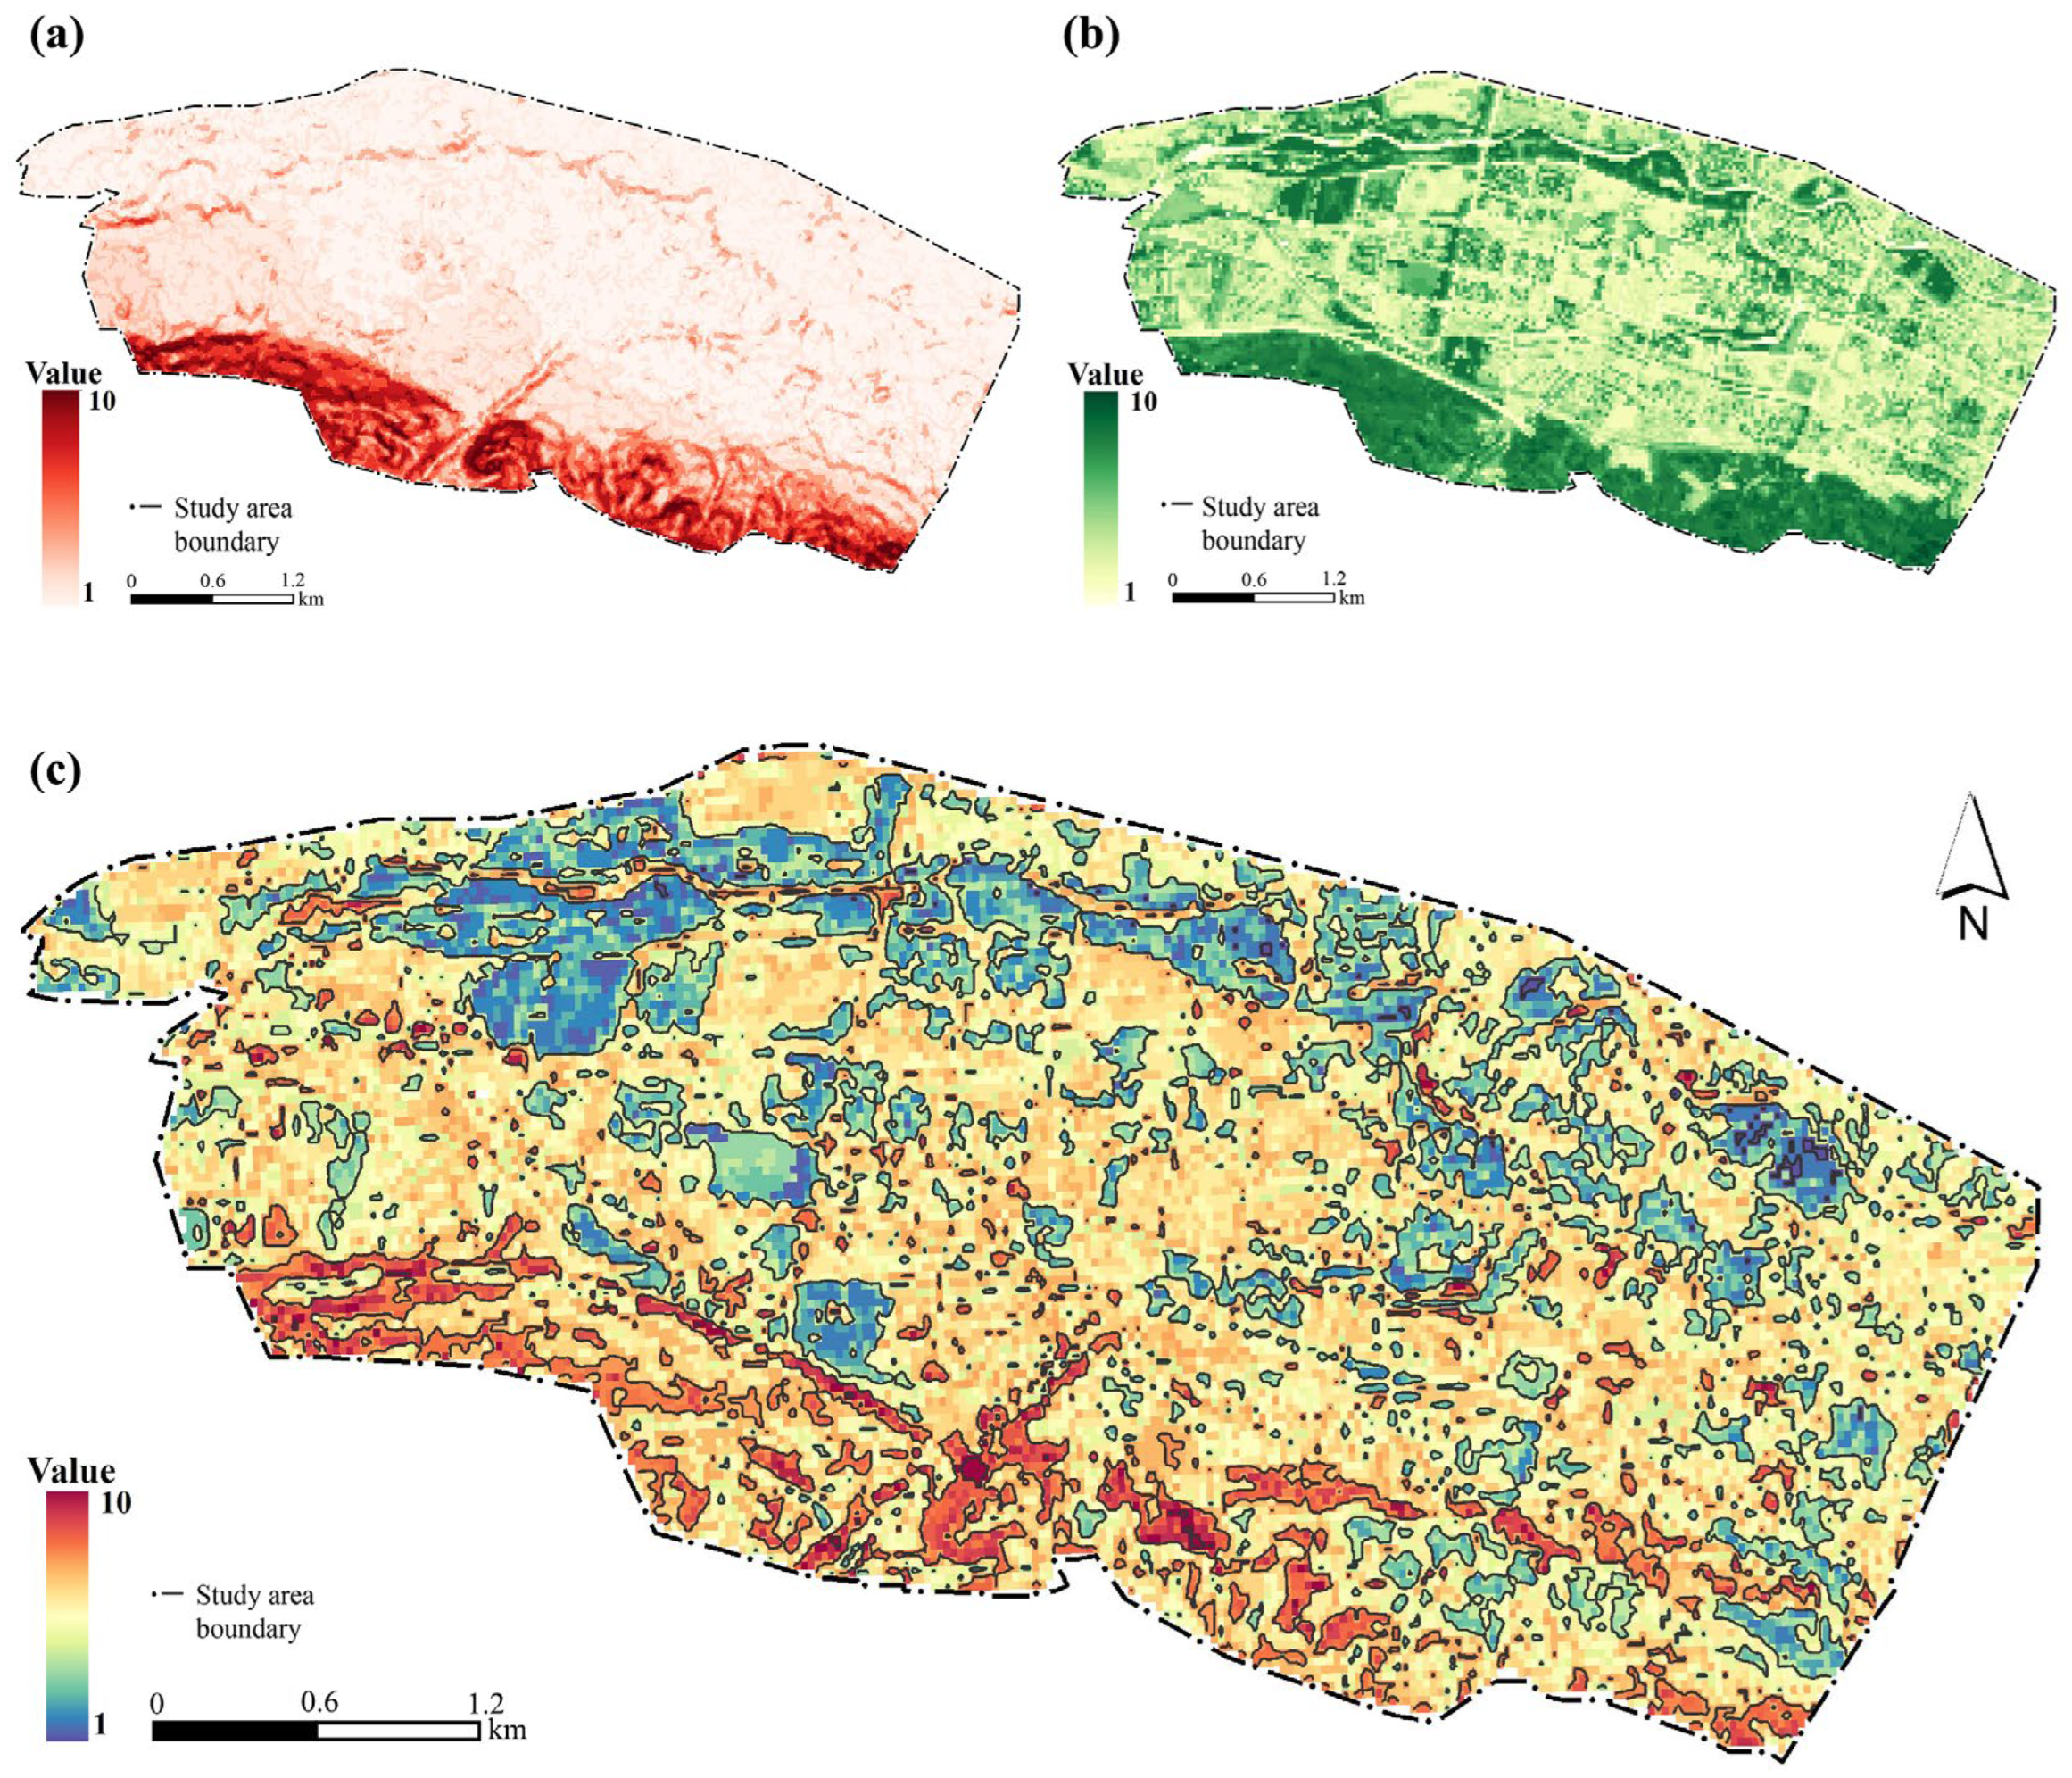
Using the weighted indicators, ArcGIS 10.8 was employed to generate the runoff dynamic surface and landscape resistance surface (
Figure 4). These layers were then overlaid to compute the Stormwater Hazard Index (H), which reflects the risk level of stormwater flooding across the study area. Higher
H values indicate greater flood risk. The index was calculated using the following formula:
where
w1 to
w6 represent the weights of respective factors;
R is rainfall intensity (mm/h);
E is elevation (m);
Kslope is slope;
NDVI is the Normalized Difference Vegetation Index;
Rrough is surface roughness; and
CLU refers to land use type.
To better visualize the stormwater flood risk distribution, the Natural Breaks classification method in ArcGIS 10.8 was used to categorize the Stormwater Hazard Index into three levels: high, medium, and low risk. This classification informed the urban stormwater safety pattern in the study area (
Figure 4c). High-risk zones accounted for 18.21%, medium-risk zones for 44.45%, and low-risk zones for 37.34% of the total area.
Stormwater flood risk in the study area shows a general decreasing trend from south to north. High-risk zones are primarily located in the southern region, which is characterized by steep slopes and loose soils. These conditions facilitate rapid runoff generation, allowing the area to be identified as a typical source zone. Under heavy rainfall conditions, slopes and gullies in the source areas are prone to erosion, with the soil susceptible to hydraulic scouring and gravitational forces—conditions that increase the likelihood of geohazards such as debris flows and landslides. The central region is classified as a medium-risk zone. Despite the relatively flat terrain, intensive urbanization and high impervious surface coverage significantly limit rainwater infiltration capacity. While runoff generation in source areas and storage capacity in sink areas can be relatively balanced under mild rain events, extreme rainfall conditions can overwhelm urban drainage systems, leading to urban flooding. The northern region, predominantly situated within the Huangshui River Basin, features flat terrain with dense vegetation coverage. These features provide strong resistance to runoff generation and concentration, making this area a typical sink zone.
2.3. SWMM Model Development
2.3.1. Establishment of SWMM
Next, we established an SWMM model to assess how various LID layout schemes perform in runoff reduction and water quality treatment. SWMM is a dynamic rainfall-runoff simulation program developed by the United States’ Environmental Protection Agency (EPA). It is the most widely used urban stormwater model worldwide [
46,
47]. The latest version, SWMM 5.2.4, can simulate eight different LID measures. SWMM not only simulates the flow and water quality processes in urban areas and drainage networks but also evaluates the effects of LID facilities on urban water quality and quantity after construction [
48,
49].
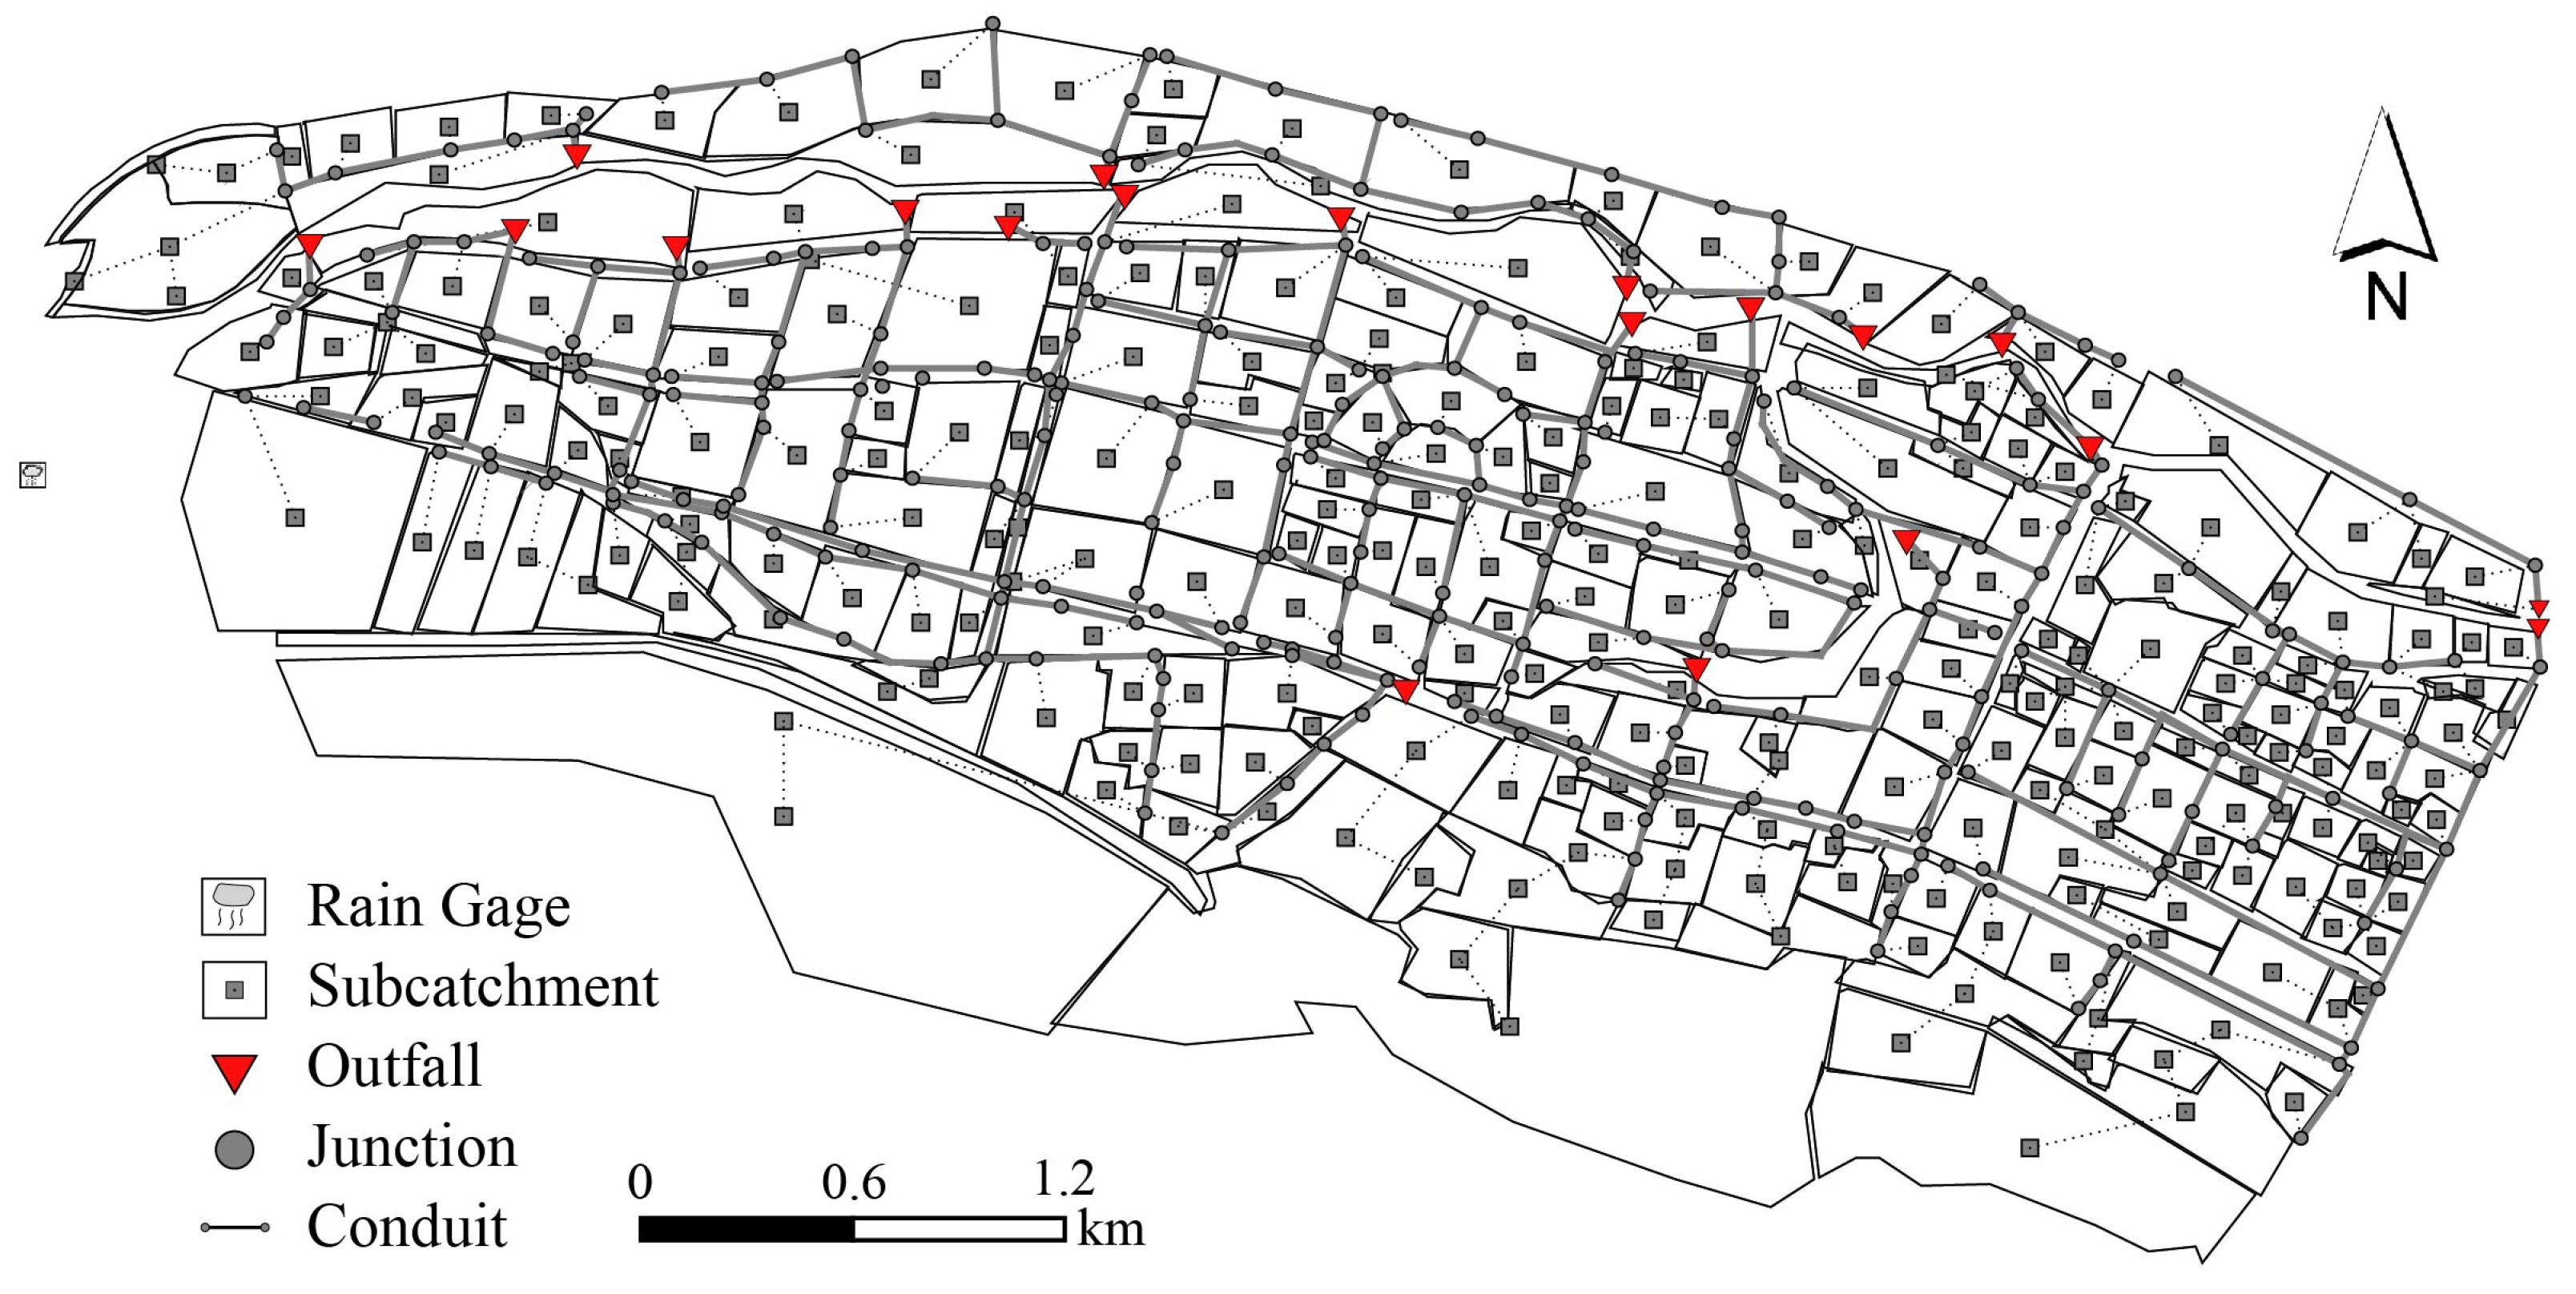
Based on topography and land use, the study area was discretized using SWMM into 272 sub-catchments, 312 nodes, 311 pipe segments, and 20 outfalls (
Figure 5). The Horton infiltration model was applied to simulate infiltration. Deterministic parameters, such as the sub-catchment area, impervious ratio, and slope, were obtained directly from ArcGIS 10.8. Uncertain parameters, such as the Manning roughness coefficient and surface depression storage, were adjusted using recommended values from the model manual and the relevant literature.
In the SWMM water quality module, pollutant accumulation was modeled using the saturation function, and the wash-off process was modeled using an exponential function. Total Suspended Solids (TSSs) were selected as the representative pollutant [
50], as over 80% of adsorbed pollutants are typically associated with TSSs during rainfall events [
51]. The parameter settings used in the study area are provided in
Table 5.
2.3.2. Model Calibration and Validation
Due to the lack of measured runoff data in the study area, model calibration and validation using observed outfall values were not feasible. Instead, this study adopted a runoff coefficient-based calibration method commonly used in urban rainfall-runoff modeling [
52]. This approach has been successfully applied in previous studies [
53,
54], demonstrating its feasibility and acceptable accuracy. To ensure model stability across varying rainfall conditions, parameters were calibrated using design storms with return periods of 5 and 10 years. The resulting composite runoff coefficients were 0.41 and 0.46, respectively, both within the acceptable range of 0.4–0.6 for low-density residential areas.
Rainfall events on 30 March and 2 May 2017, were selected for empirical analysis. The composite runoff coefficients of 0.441 and 0.459 both met the required criteria. The calibrated hydraulic parameters of the final model are presented in
Table 6.
2.3.3. Scenarios Design and Simulation
Four LID layout schemes were developed through a structured process. This included identifying the major LID types suitable for the study area, determining the annual runoff volume control target, and consulting key planning guidelines and the relevant literature to design representative scenarios. First, given the region’s limited water resources and high soil permeability, LID facilities focusing on infiltration and retention were prioritized to maximize water absorption and minimize runoff. Therefore, four main types of LID facilities were selected: vegetative swale, permeable pavement, rain gardens, and bioretention cells. Vegetative swales are suitable for smaller green spaces, while rain gardens and bioretention cells are more appropriate for larger landscaped areas. The permeable pavement was chosen for use in parking lots and plazas. The specific parameter values for each LID type are listed in
Table 7.
In accordance with
The Technical Guide for Sponge City Construction [
55], a volume-based method was employed for storage capacity calculation, targeting both runoff volume and pollution control. The storage volume was calculated as follows:
where
V represents the total storage volume (m
3);
H denotes the design rainfall depth (mm), determined based on the annual runoff volume control rate;
Φ is the composite runoff coefficient; and
F is the catchment area (hm
2).
Using the weighted average method, the runoff coefficient for the study area was calculated as 0.461. Based on the target annual runoff volume control rate of no less than 88%, the required V was calculated as ≥145,582.9 m3.
Next, we leveraged multiple sources to develop a representative LID layout scheme (Scheme 2), including the
Xining Sponge City Construction Design Guidelines (hereafter referred to as the
Guidelines) [
56], the relevant literature [
57,
58], and planning control indicators. The total area for LID facilities was set at 215 hectares, as recommended by the
Guidelines. In determining the layout, we considered factors such as construction ratios within land use types, development intensity, achievable green space ratio, and building drainage types. To ensure that the required total storage capacity was met, the minimum necessary areas for permeable pavement and bioretention facilities were calculated to be 107.83 ha and 92.34 ha, respectively. These values served as the basis for the LID facility’s layout. LID spatial allocation was further refined according to the spatial distribution of flood risk across the study area. In high-risk zones with steep slopes, shallow soils, and poor water retention, localized infiltration was prioritized. Vegetated swales were extensively applied to collect and retain rainwater. In medium-risk zones with high development intensity and dense populations, permeable pavement was the primary measure deployed to enhance permeability. In low-risk zones, such as the northern, low-lying parts of the study area, the focus was on retention and purification. Facilities such as bioretention ponds and rain gardens were applied to purify rainwater and improve ecological health.
Finally, with the total LID area fixed at 215 ha, as specified by the Guidelines, three additional layout schemes were developed to assess the impact of varying LID allocations in high-risk zones. Scheme 1 reduced the area for each LID type in high-risk zones by 25% compared to Scheme 2, while Schemes 3 and 4 increased the area for each LID type in these zones by 25% and 50%, respectively. To maintain the total LID area at 215 ha, the allocations in the other risk zones were adjusted proportionally. Detailed design plans for each scheme are shown in
Table 8.
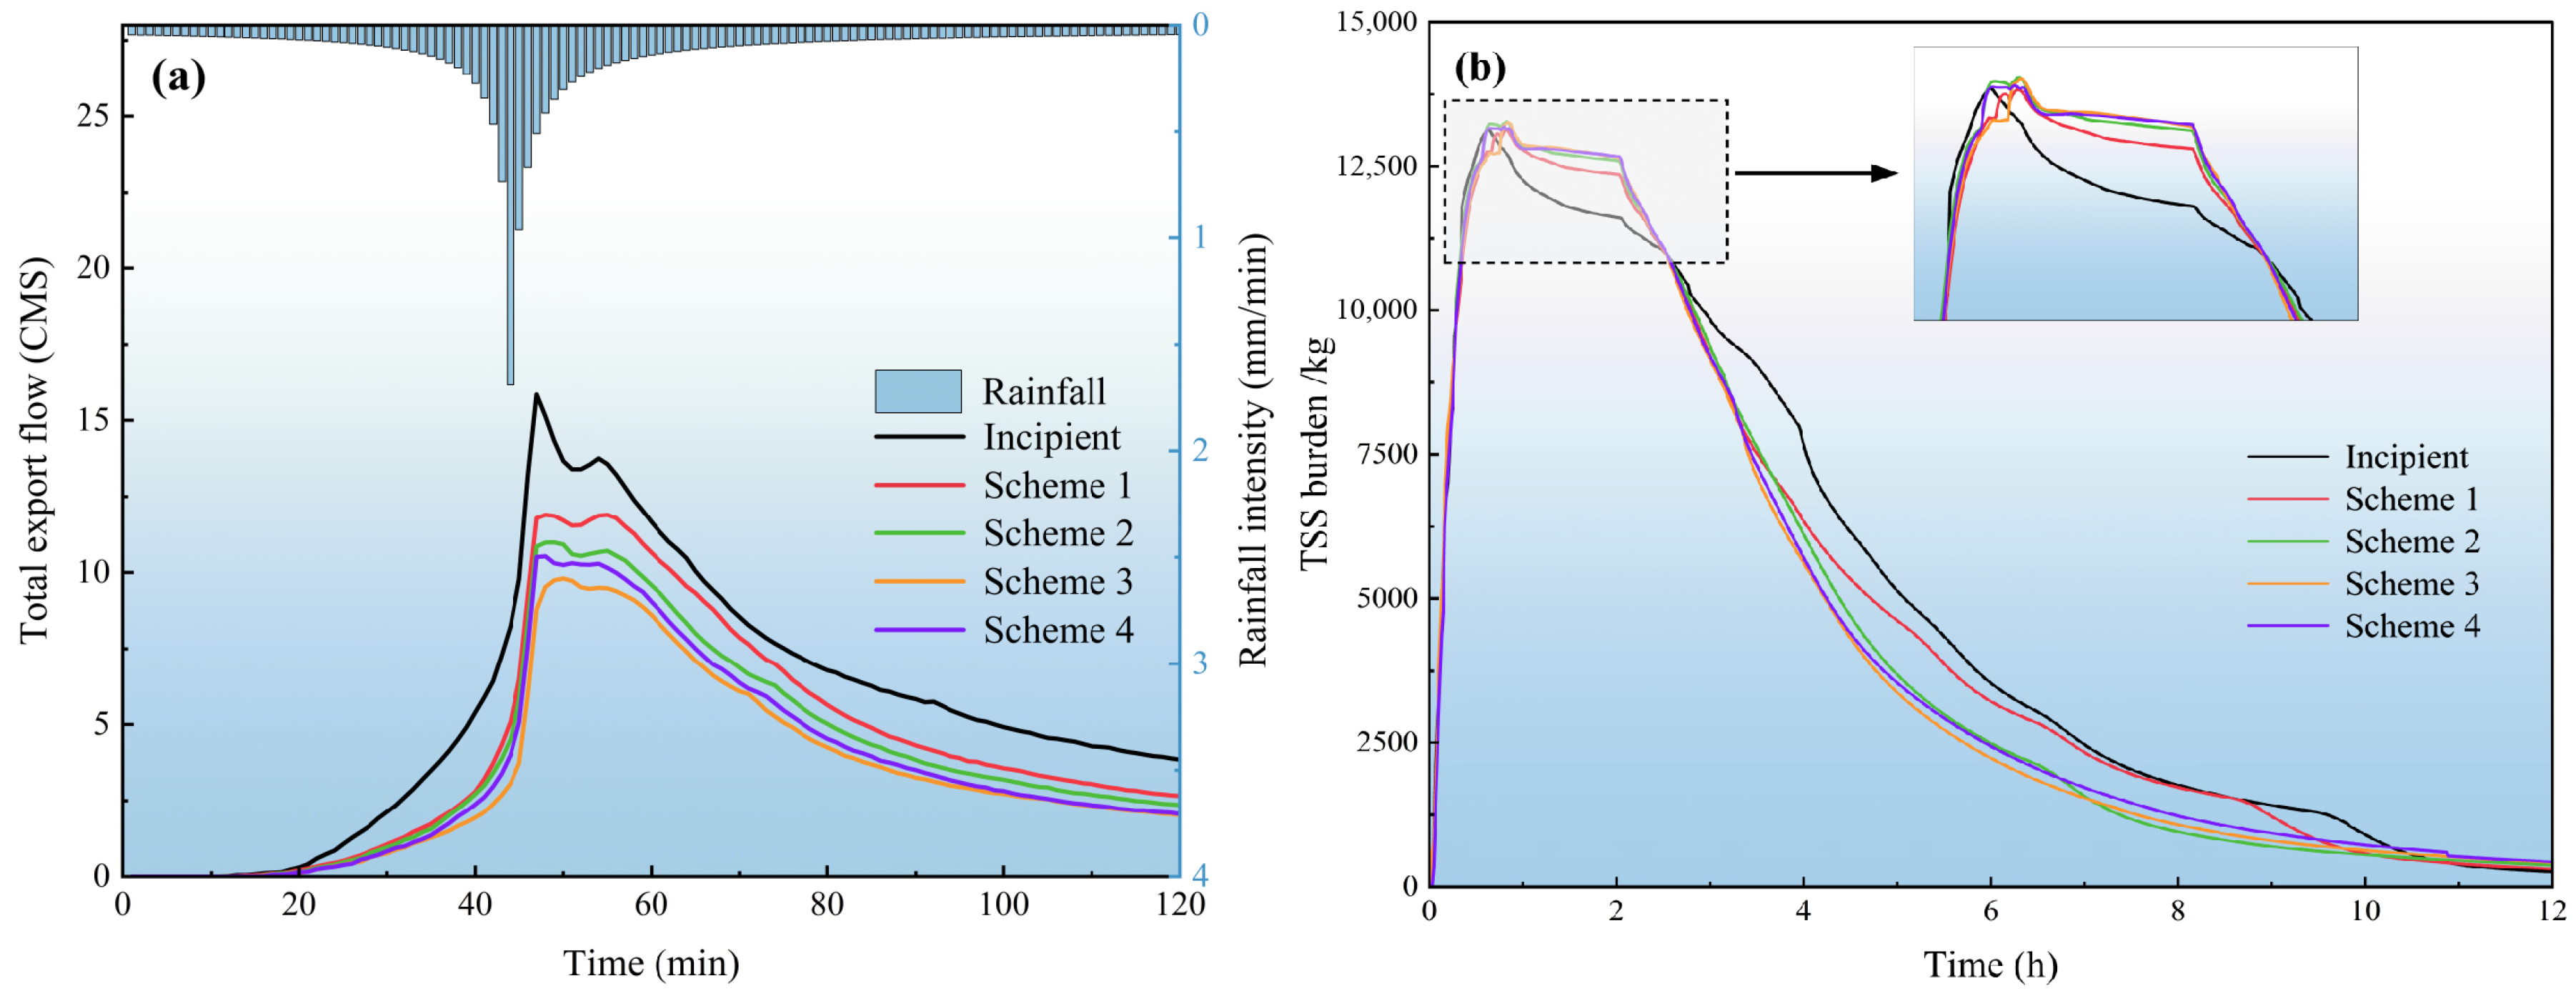
Once the LID schemes were established, SWMM modeling was conducted under 2-year, 5-year, and 10-year return period rainfall events. Four key indicators were used to assess hydrological and water quality performance: the runoff total volume reduction rate (
RVO), peak flow reduction rate (
RQ), rainwater utilization rate (
K), and pollutant reduction rate (
PT) [
59]. Each scenario was evaluated against the baseline scheme (
BS), with no LID installations used to determine the effectiveness of LID implementation. The calculation formulas are as follows:
where
RVO,
RQ,
K, and
PT represent the runoff volume reduction rate, peak flow reduction rate, rainwater utilization rate, and TSS pollutant reduction rate, respectively;
VBS,
QBS, and
MBS denote the runoff volume (mm), peak flow (mm), and total pollutant load (kg), respectively, under the baseline scheme;
Vi,
Qi, and
Mi represent the corresponding values under various LID schemes;
Win represents the infiltration volume (mm) and
Ws denotes the storage volume of sponge facilities (mm); and P represents total rainfall (mm).
2.4. Assessing LID Configuration with a New Metric—SSCOD
Optimizing the spatial distribution of LID facilities within a source–sink framework is vital for effective stormwater management in mountainous cities. A well-balanced layout between source and sink areas helps reduce runoff output and minimize flood risks. Therefore, quantitatively assessing the spatial configuration of LID facilities in both zones is key to enhancing flood resilience in complex terrains.
Existing studies have proposed various indicators to quantify the relationship between source and sink landscapes in stormwater systems. For example, the Location-Weighted Landscape Index (LWLI) [
60] integrates elevation, slope and distance loading ratios to capture the influence of landscape patterns on the rainfall-runoff processes. At a finer site scale, Zhang et al. proposed the Configuration Ratio between Patches of Runoff Sources and Sink (CRSS) [
61] to help identify critical thresholds in the sink landscape’s ability to manage runoff.
Building on these frameworks and addressing both hydrological and water quality dimensions, this study proposes a novel metric: the “source–sink coupling optimization degree” (SSCOD). SSCOD evaluates the effectiveness of LID spatial deployment by quantifying how well runoff is generated, transmitted, and regulated through coordinated source–sink functioning. In mountainous cities, terrain attributes such as elevation, slope, and surface roughness lead to significant spatial and functional distinctions between source and sink areas. These differences indicate the existence of an optimal coupling ratio—a configuration that maximizes flood regulation benefits. SSCOD captures this optimization by integrating three key components: source area efficiency (ESource), sink-area efficiency (ESink), and pollutant reduction synergy index (IPollutant Reduction).
In this study, source areas correspond to high-risk runoff generation zones, while medium- and low-risk zones are considered as sink areas. The core objective of source areas is to reduce the runoff volume and delay its generation. Therefore, ESource focuses on the reduction in total runoff volume relative to a no-LID baseline scenario. The sink areas’ core function is to delay and absorb runoff from the source areas through storage and retention. Thus, ESink is best measured by the reduction in peak flow rates. IPollutant Reduction measures the degree of synergy between source and sink areas in pollutant reduction. This indicator emphasizes how effectively both zones operate together to enhance overall water quality outcomes. By integrating these three components, SSCOD provides a comprehensive assessment of the spatial and functional collaboration between source and sink areas, enabling a more informed optimization of LID facility layout and design.
The specific formulas are as follows:
where
α,
β, and
γ are the weighting coefficients for SSCOD;
ESource is the runoff reduction efficiency in source areas;
ESink is the peak flow reduction efficiency in sink areas;
IPollutant Reduction is the pollutant reduction synergy index;
Qbaseline is the runoff volume generated in source areas without LID;
Qsource is the runoff volume generated in source areas with LID;
Pbaseline is the peak flow rate received in sink areas without LID;
Psink is the peak flow rate received in sink areas with LID;
EPollution, Source is the pollutant reduction efficiency in source areas; and
EPollution, Sink is the pollutant reduction efficiency in sink areas.
In addition, to evaluate the relationship between the LID distribution in source and sink areas, the coupling ratio (
RCoupling) is defined as follows:
where
Areasource, LID is the total area of LID facilities in source areas, and
Areasink, LID is the total area of LID facilities in sink areas.
RCoupling visually reflects whether LID resource allocation between the source and sink areas is reasonable, thus aiding in the spatial optimization of LID distribution.
4. Discussion
4.1. Effectiveness of LID Facility Layout
The research results underscore the pivotal role of high-risk zones in urban stormwater management, particularly in mountainous environments. Strategically increasing LID facilities in these areas promotes rainwater infiltration and retention, thereby mitigating surface runoff generation, reducing peak flow, and decreasing flood frequency. However, this benefit exhibits diminishing returns once the proportion of LID facilities in high-risk zones reaches a critical threshold, where infiltration and retention capacities begin to saturate. At this stage, additional LID investments yield marginal hydrological benefits while incurring increased construction costs and the waste of land resources. Conversely, underinvestment in medium- and low-risk areas can undermine overall stormwater management’s effectiveness, indicating the necessity of a balanced, zone-sensitive layout. These results highlight the importance of scientifically determining the proportion and spatial distribution of LID facilities to strike an optimal balance between environmental benefits and economic efficiency. Planning should avoid overconcentration in select areas and instead adopt a holistic, risk-informed deployment strategy that maximizes system-wide benefits.
As rainfall intensity increases—especially under extreme events—the stormwater management capacity of green infrastructure significantly decreases [
65]. This is primarily due to infiltration saturation, where the soil’s capacity to absorb water is exceeded. Such limitations are particularly pronounced in high-density or mountainous urban environments. Consequently, green infrastructure alone is insufficient to manage extreme stormwater loads, and reliance solely on LID strategies can leave cities vulnerable to severe flooding [
66]. To address this challenge, future stormwater planning should adopt a green–gray infrastructure coordination framework, which strategically integrates LID systems with traditional gray infrastructure. This hybrid approach leverages the strengths of each system: green infrastructure provides decentralized treatment and ecological co-benefits, while gray infrastructure offers high-capacity, reliable flood mitigation [
67]. For example, intelligent runoff diversion mechanisms can be used to direct excess stormwater to downstream gray infrastructure once upstream green systems reach the point of saturation. Serial or cascading facility designs—where green infrastructure pre-treats and slows runoff before it enters gray infrastructure—can also improve hydraulic efficiency and pollutant removal under stress conditions.
Moreover, urban rivers, lakes, and wetlands—“blue” infrastructure—are integral to the performance of stormwater systems. These water bodies not only act as the final discharge points but also play a critical role in urban hydrological and ecological health [
68]. A comprehensive stormwater management framework, combining elements of green, blue, and gray infrastructure, can better harness their complementary functions. The coordinated integration of these systems represents a promising path toward adaptive, multifunctional, and future-ready urban stormwater solutions.
4.2. Application Value of the SSCOD Indicator
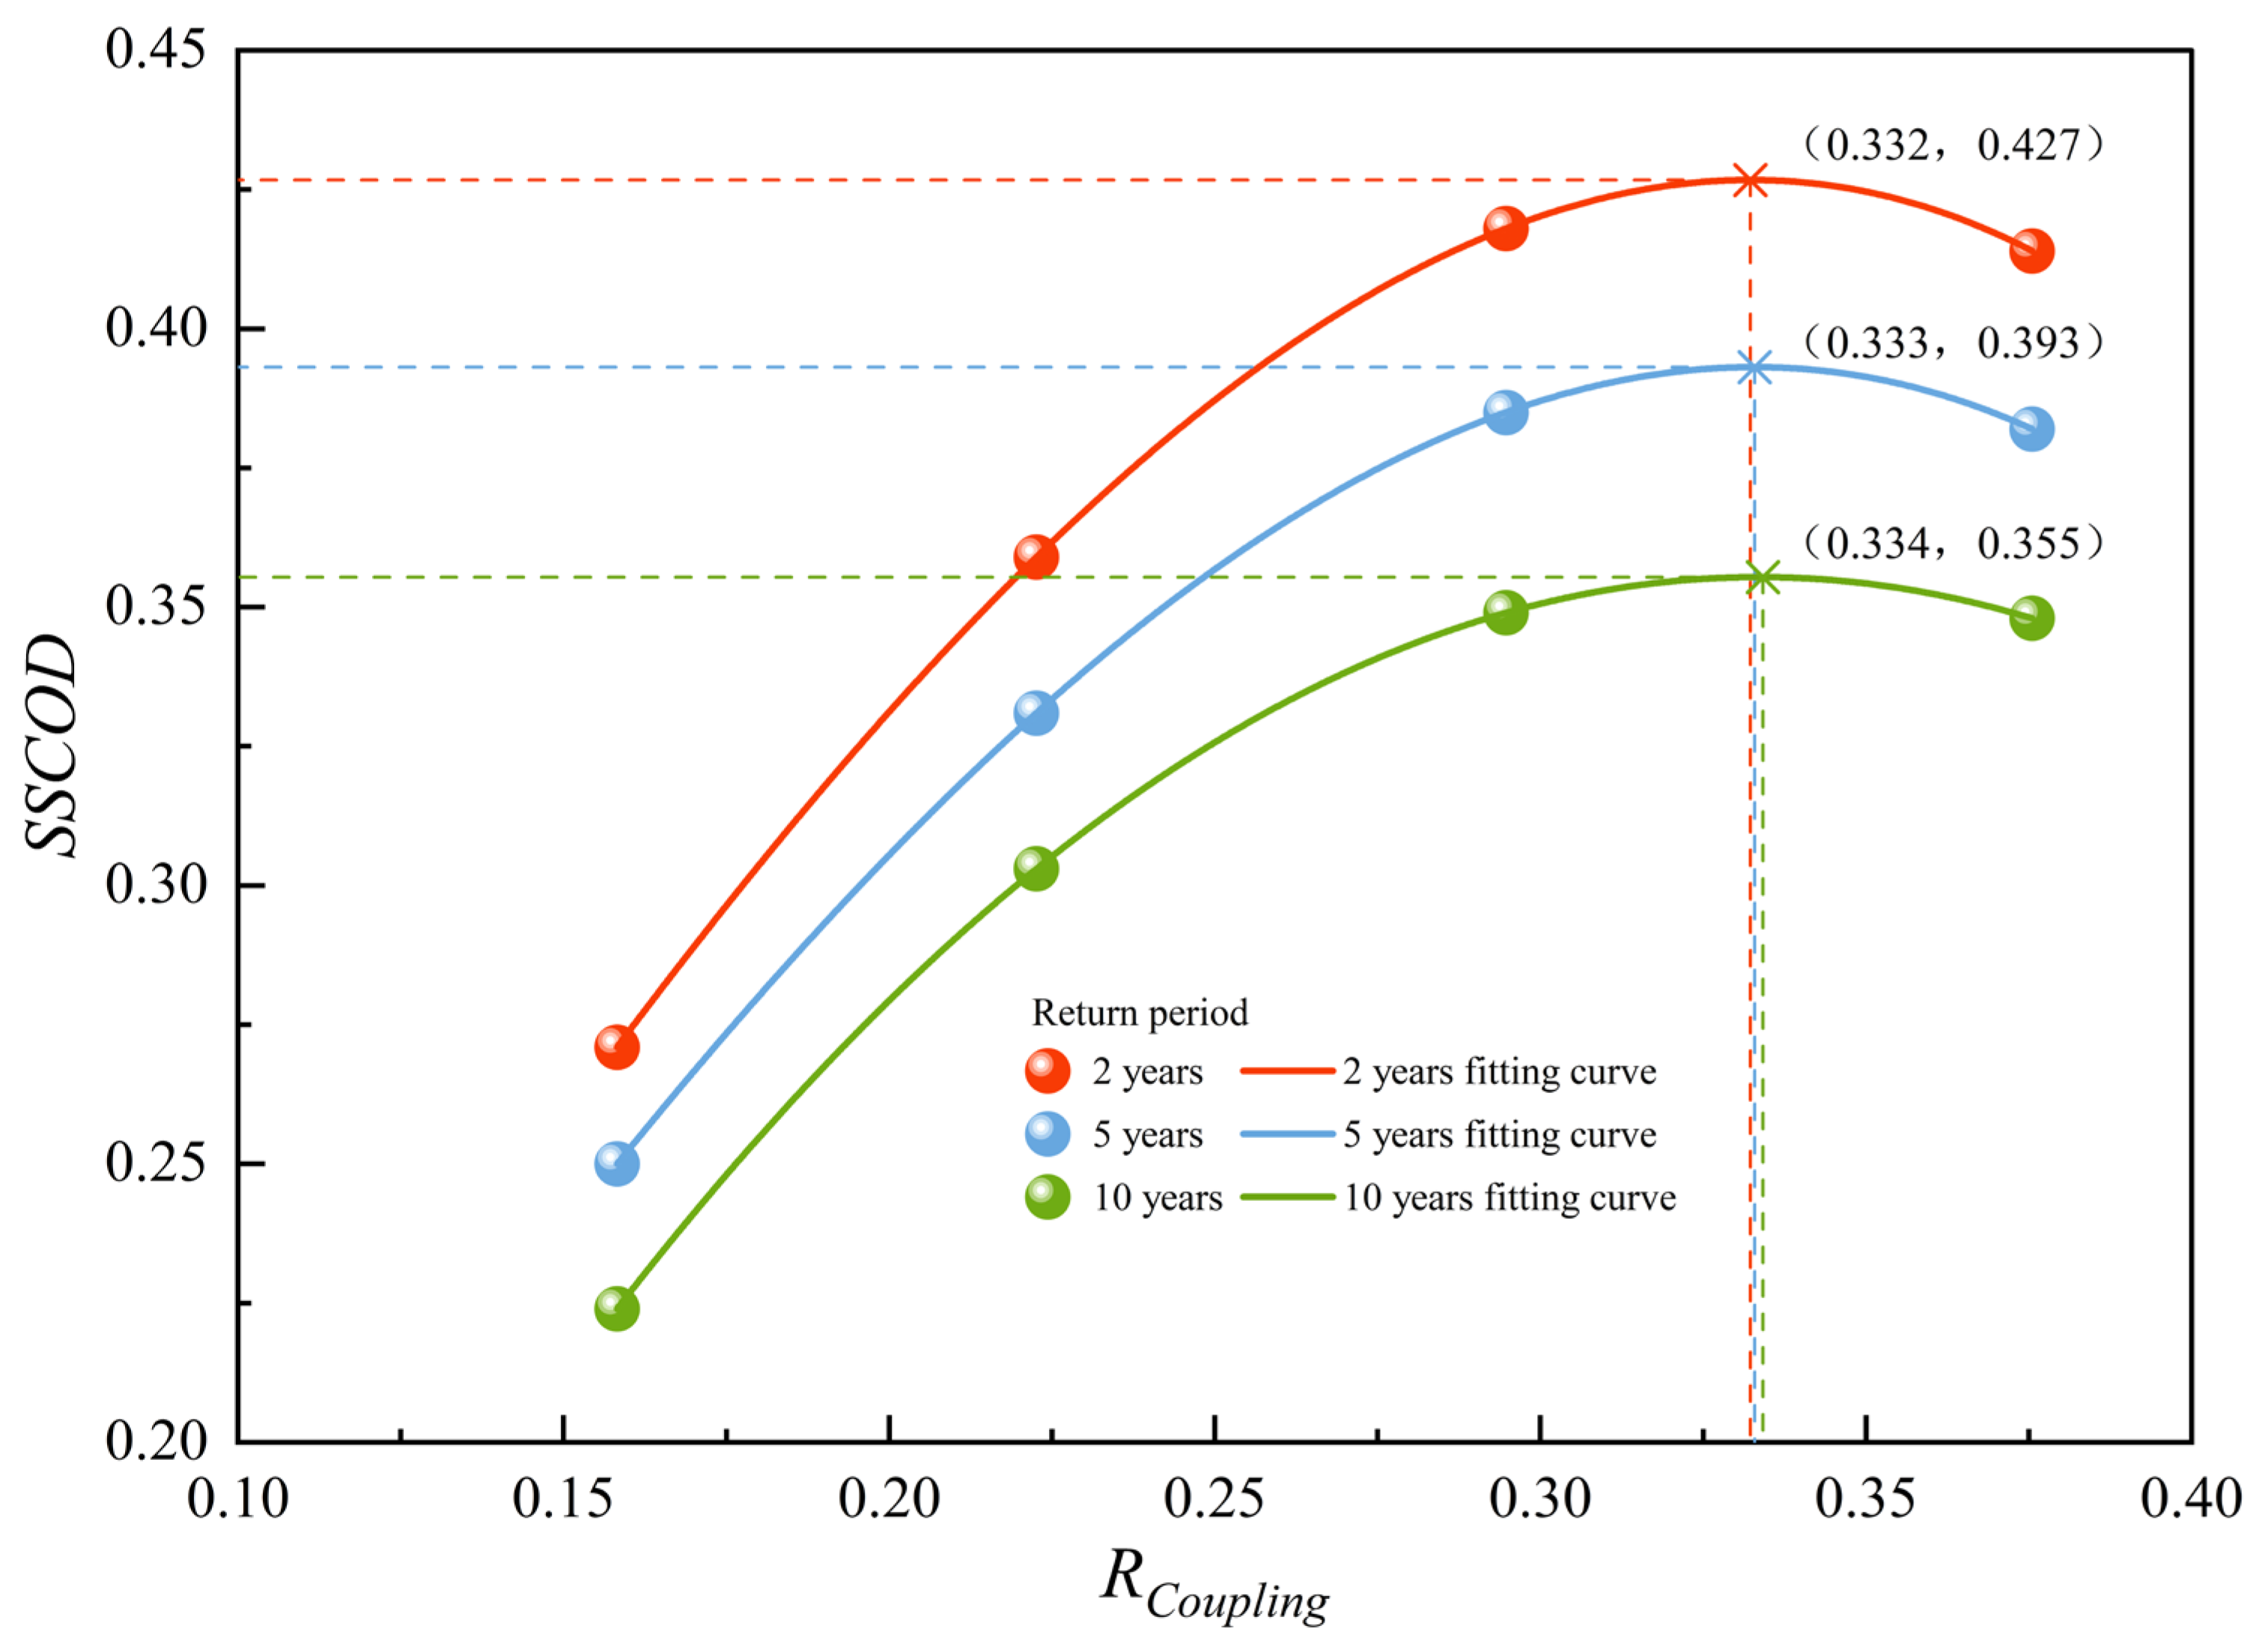
The source–sink coupling optimization degree (SSCOD) offers a novel and integrative indicator for evaluating the balance of LID facility allocation between source and sink areas. By comprehensively evaluating source-area runoff reduction efficiency, sink-area storage efficiency, and the pollutant reduction synergy index, SSCOD captures both hydrological and water quality performance, providing a comprehensive measure of stormwater management effectiveness. The SSCOD value range of 0.355–0.427, corresponding to peak stormwater management effectiveness under 2-, 5-, and 10-year storms, provides practical guidance for determining the optimal proportion of LID facilities in high-risk zones.
Beyond assessment, SSCOD also reveals the principle of diminishing returns in LID performance. As LID coverage increases in high-risk areas, SSCOD initially rises, indicating improved system efficiency. However, once a critical allocation threshold is surpassed, additional LID investments yield marginal gains or even degrade system performance due to source storage saturation, spatial mismatch, or the underutilization of sink capacity.
By coupling SSCOD with Rcoupling, the study identifies these critical turning points, providing planners with a quantitative tool to diagnose inefficiencies and guide the LID redistribution. High SSCOD values signal an optimized deployment that balances runoff reduction, storage, and pollutant control. In contrast, low values may indicate insufficient runoff reduction efficiency in source areas, overly low storage regulation capacity in sink areas, or poor pollutant control effectiveness. Thus, SSCOD not only serves as an evaluation tool but also as a decision-making aid. Monitoring its fluctuations allows planners to adaptively manage stormwater infrastructure’s layout, thereby improving the efficiency of stormwater management in mountainous cities.
4.3. Limitations
While the proposed framework offers valuable insights, the study has limitations. First, due to the lack of a comprehensive runoff monitoring system in the study area, this study employed the runoff coefficient method for model calibration. Although this approach is widely used in data-scarce contexts and supported by the existing literature, it may affect the accuracy of the model ‘spredictions. To improve the robustness and precision of future studies, it is essential to incorporate more field-based hydrological data and monitoring infrastructure. This would enable more accurate model calibration, enhance the reliability of stormwater performance assessments, and support more data-informed urban water management decisions.
Second, the determination of the optimal proportion of LID facilities in high-risk zones was based on a limited number of design scenarios, relying on data fitting rather than exhaustive optimization. As a result, the precision and generalizability of this ratio remain uncertain. Moreover, the study primarily focuses on hydrological and water quality indicators, without fully accounting for other critical considerations such as construction costs and social benefits. In real-world applications, economic and social dimensions are equally vital in shaping effective sponge city strategies.
Therefore, future research should move toward multi-objective optimization frameworks capable of evaluating trade-offs across environmental, economic, and social criteria. Techniques such as NSGA-II offer promising pathways for identifying Pareto-optimal solutions that balance hydrological efficiency with cost-effectiveness, land use constraints, and ecosystem services. Integrating such advanced optimization techniques into the SSCOD framework would significantly enhance its applicability and value as a planning tool under real-world constraints.
5. Conclusions
Based on the “source–sink” theory, this study proposes a spatial layout strategy for stormwater management measures tailored to mountainous cities. Focusing on the sponge city pilot area in Xining, high-risk source zones were delineated, and suitable LID facilities were selected for targeted stormwater management. The SWMM model was applied to simulate hydrological scenarios, determine the optimal LID facility ratio, and evaluate the effectiveness of proposed layout schemes. The results demonstrate that the well-balanced allocation of LID facilities between source and sink areas can significantly reduce surface runoff and improve water quality. However, LID performance declines under extreme rainfall conditions, highlighting the need for integration with conventional drainage systems. Additionally, the study reveals a marginal benefit effect: after a certain threshold, increasing LID coverage in source zones offers limited additional hydrological gains while consuming more land and resources.
This study also introduces the source–sink coupling optimization degree as a quantitative indicator for assessing the spatial coordination of LID facilities between source and sink areas. Optimal stormwater performance was observed when SSCOD values ranged between 0.345 and 0.423, corresponding to a high-risk zone LID proportion of 24.24–24.41%. These results provide a scientific basis for optimizing LID deployment in mountainous cities, highlighting the importance of spatial balance between source and sink areas for effective runoff control and pollutant reduction.
In conclusion, this study offers a novel spatial planning approach for LID deployment in mountainous cities, grounded in the source–sink theory and supported by quantitative modeling and performance assessment. By introducing the SSCOD metric, it provides practical guidance for achieving spatially balanced and hydrologically effective stormwater management strategies. The findings underscore the importance of targeted LID placement, especially in high-risk zones, while also cautioning against overconcentration and diminishing returns. Looking ahead, future research should further refine this framework by incorporating multi-objective optimization methods, such as NSGA-II, to address economic, environmental, and social trade-offs. Moreover, integrating green infrastructure with gray and blue systems will enhance the resilience and adaptability of urban stormwater systems in the face of climate change and extreme weather events.


