Article

Sources and Characteristics of Dissolved Organic Matter (DOM) during the Winter Season in Hangzhou Bay: Insights from Chromophoric DOM and Fluorescent DOM

1
Key Laboratory of Marine Ecosystem Dynamics, Second Institute of Oceanography, Ministry of Natural Resources, Hangzhou 310012, China
2
Ocean College, Zhejiang University, Zhoushan 316021, China
3
Key Laboratory of Nearshore Engineering Environment and Ecological Security of Zhejiang Province, Hangzhou 310012, China
4
Observation and Research Station of Yangtze River Delta Marine Ecosystems, Ministry of Natural Resources, Zhoushan 316000, China
5
School of Oceanography, Shanghai Jiaotong University, Shanghai 200230, China
6
Donghai Laboratory, Zhoushan 316000, China
7
State Key Laboratory of Satellite Ocean Environment Dynamics, Second Institute of Oceanography, Ministry of Natural Resources, Hangzhou 310012, China
*
Author to whom correspondence should be addressed.
Water 2025, 17(11), 1590; https://doi.org/10.3390/w17111590 (registering DOI)
Submission received: 16 April 2025 / Revised: 15 May 2025 / Accepted: 20 May 2025 / Published: 24 May 2025
(This article belongs to the Section Water Quality and Contamination)

Abstract

:
Elucidating the compositions, sources and mixing processes of dissolved organic matter (DOM) is crucial for a gaining deeper understanding of the coastal carbon cycle and global carbon budget. Hangzhou Bay (HZB), a vital estuary in China, receives freshwater inputs in the upper bay, borders the Changjiang River Estuary (CRE) to the north and is adjacent to Zhoushan Islands Region (ZIR) to the east. In HZB, the DOM sources and their compositions in estuaries remain unclear due to the complexity of this dynamic environment. In this study, we aimed to explore the chemical composition and sources of the DOM in the HZB and its adjacent coastal waters based on chromophoric DOM, fluorescent DOM indices and other hydrochemical parameters in the winter. The results showed that the DOM compositions in HZB have significant differences in the upper bay, middle bay and lower bay. The highest concentration of DOC was found in the CRE, close to the northern lower HZB, with high humification index (HIX), low biological index (BIX) and high proportion of humic-like fluorescent component (C1), indicating terrestrial inputs. In contrast, the DOM in the upper bay had high BIX and low HIX, being dominated by protein-like fluorescent components (C2 and C3), indicating an autochthonous source. The DOM in the middle bay showed mixed composition characteristics indicated by the chromophoric DOM (CDOM) and fluorescent DOM (FDOM) indices. Moreover, the terrestrial DOM transported via CDW intrusion accounted for a large proportion of the DOM in Northern HZB. Our study shows that, even in coastal estuaries with very strong hydrodynamics, the DOM composition can still retain its unique source signal, which, in turn, affects its migration and transformation processes. The results of this study provide supplement insights into the global carbon cycle and carbon budget estimation.

1. Introduction

Oceans are the most important carbon reservoir on Earth, absorbing more than 25% of the carbon dioxide (CO2) emitted by human activities [1]. Although the offshore area only accounts for 7% to 8% of the global ocean area, the primary production accounts for 10% to 30%, and organic carbon burial is as high as 80%, making it one of the most important carbon sinks in the global ocean [2,3]. However, carbon transport fluxes along the land–coastal ocean–open ocean continuum under low carbon emission scenarios are essentially unknown. It is challenging to accurately assess the carbon flux, source-sink pattern and evolution trend in the coastal region, including the estuaries and bays due to the complicated hydrology dynamics and carbon cycle processes [4].
Dissolved organic carbon (DOC) is the largest carbon reservoir in the ocean, impacting the global carbon cycle and climate change. Dissolved organic matter (DOM) is a heterogeneous mixture formed through the secretion and excretion of living organisms [5]. The structure and composition of dissolved organic matter significantly affect the balance of aquatic ecosystems. The DOM in the ocean is generally divided into two categories: terrigenous (humic-like, high aromaticity and high molecular weight) DOM and autochthonous (protein-like, low aromaticity and low molecular weight) DOM [6]. In addition, as a carrier of water pollutants, the source, composition and characteristics of DOM regulate the migration and transformation of pollutants [7].
The DOM chemical composition depends on its parent organic matter and subsequent biogeochemical processes, including photo- and biodegradation [8]. Though many studies interpret DOM at the molecular level, such as sugars amino acids and lignin phenols [9,10], the sources and compositions of most DOM are still largely unexplored [11]. Spectroscopic techniques, including absorbance spectra and fluorescence excitation emission matrices (EEMs), are useful for tracing DOM sources and assessing DOM reactivity by testing chromophoric DOM (CDOM), fluorescent DOM (FDOM) and multiple established optical indices [12]. Combined with parallel factor analysis (PARAFAC) models, the relative contributions of allochthonous and autochthonous FDOM could be semi-quantitatively confirmed [13,14]. Recent research has correlated the EEM data with the maximum fluorescence (Fmax) modeled by PARAFAC to examine the accuracy of the fluorescence intensities at the peaks of PARAFAC [15], and the machine learning method combined with PARAFAC model has also been used to identify sources of fluvial DOM in rivers [16]. Moreover, this method was used to study coastal bays under eutrophication conditions and large estuaries.
Through PARAFAC modeling, four fluorescent components, including two protein-like and two humic-like components, were validated in surface water and porewater in Andong Shoal, the southern bank of Hangzhou Bay, in 2016–2018 [17]. Zhao et al. found two humic-like components negatively correlated with salinity and one protein-like component in Xiangshan Bay, a semi-enclosed bay closed to the East China Sea (ECS), in May 2019, indicating the dilution of terrestrial signals by seawater [18]. Five fluorescent DOM components were validated in the Qiantang River Estuary (QRE), the upstream of Hangzhou Bay, in 2016–2017, including three humic-like and two protein-like components [19]. Four fluorescent components, including two protein-like and two humic-like components, were validated along the Changjiang River Estuary-to-ocean continuum in July 2017 [20].
Estuaries and bays link the land and the sea. Hangzhou Bay (HZB), adjacent to the Changjiang River Estuary (CRE) at the northern lower bay, is a vital estuary in China. The Qiantang River, the largest river in Zhejiang Province, China, carries terrestrial materials directly imported into HZB at the upper bay. Changjiang diluted water can also enter the bay directly from the Northern HZB or be carried into the bay through ebb and flow. The Changjiang, the largest river in China, brings large amounts of terrestrial materials, such as nutrients, particles and pollutants, into the CRE, thereby affecting material transport processes in adjacent coastal regions [21]. From the river to the open sea, DOC showed non-conservative mixing and was rapidly removed in low-salinity areas. Incubation experiments of DOC and amino acids conducted by Gou et al. in 2017 in the Changjiang River Estuary and adjacent seas indicated that photodegradation and biodegradation were important DOC removal mechanisms and exhibited specific responses depending on DOC compositions and sources [22]. Changjiang diluted water (CDW), characterized by low salinity and high nutrients, spreads southwestward in the winter, being affected by the northeast monsoon (December–February) [23]. It is generally recognized that the northwest monsoon leads to more significant CDW intrusion into Hangzhou Bay in the winter than in the summer and then strongly influences the hydrography of Hangzhou Bay [24]. It has been shown that, besides Qiantang freshwater (QTW), HZB receives more than half of its materials from CDW, which flows into Hangzhou Bay in the north and leaves via the southern part of the bay [25]. Therefore, CDW should have influenced the sources of DOM in HZB in the winter season, along with characteristic DOM signal invasion.
Recent research on HZB waters has focused on nutrients, particles and hydrodynamics [26,27]. The DOM in HZB waters is also an important carrier of organic carbon and pollutants. However, the studies mainly contained the results for CDOM, lacking the indices for and analysis of FDOM required to classify the exact fluorescent components of DOM. Recently, the combination of bulk carbon isotope, optical techniques and ultra-high-resolution mass spectrometry was used to study the compositions of DOM in CRE, QRE and Xiangshan Bay, respectively [18,19,20]. Studies that regard CRE, QRE and HZB as a whole system remain relatively scarce.
To sum up, research on the DOM compositions and sources in adjacent areas has mainly focused on the CRE–shelf–ECS continuum or the QRE–HZB continuum. Research on how the CDW invades Northern HZB in the winter has focused on nutrients, particles and hydrodynamics studies. How the CDW invasion, along with QTW and SSW, jointly affects the sources and characteristics of DOM in winter HZB is not clear. The objective of this study is to elucidate the chemical composition and sources of the DOM in HZB in the winter and the contribution of CDW inputs based on CDOM absorption, FDOM indices and other hydrochemical parameters collected through a comprehensive investigation survey in HZB and its adjacent sea in the winter.

2. Materials and Methods

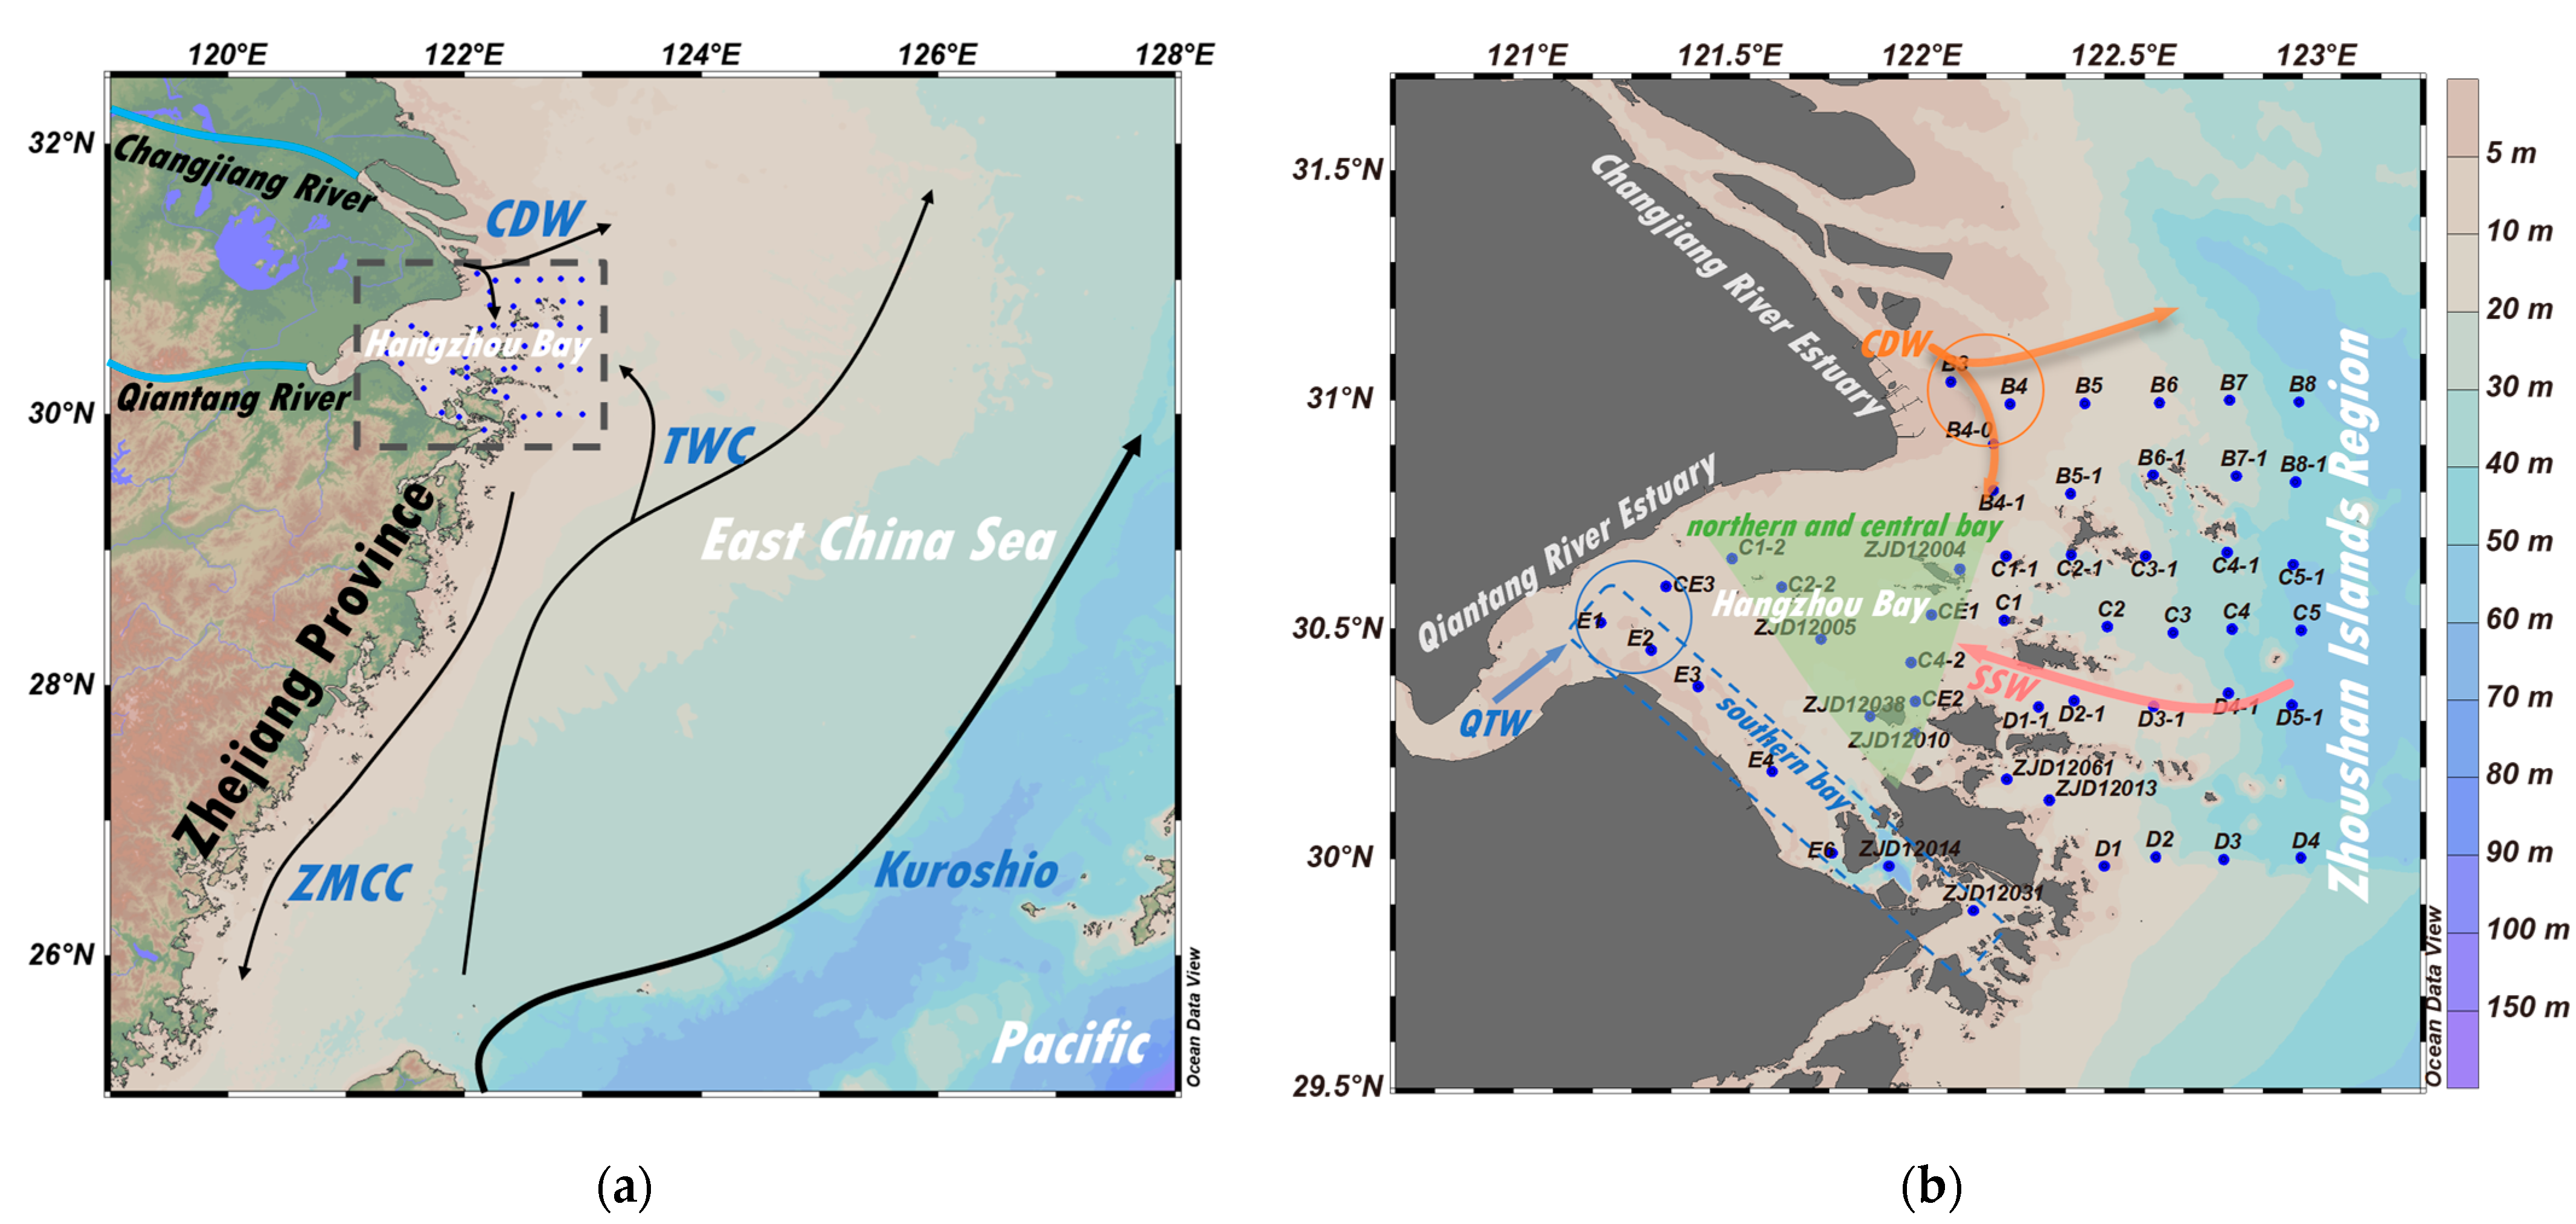
2.1. Study Area and Sampling Sites

A comprehensive investigation survey was conducted in HZB and its adjacent seas (Figure 1a) in the winter (27–31 January 2024). In total, 50 stations shown in Figure 1b were investigated during the cruise. Water samples were collected using a Sea-Bird Electronics CTD (CTD—conductivity, temperature and depth; SBE 9, Sea-Bird Scientific, Bellevue, WA, USA) with 6 Niskin sampling bottles. At each station, the hydrologic parameters (temperature, salinity, turbidity, PAR, Chl-a, DO and pH) were constantly monitored. Further processing of raw data was performed using Golden Software Surfer 15 and SBE Data Processing.

2.2. Sample Collection

Seawater samples were collected from different depths (surface 2 m, bottom and every 10 m in the water column) at each sampling station. A total of 152 DOC samples were filtered onboard through 0.2 μm polycarbonate membranes (Millipore, IsoporeTM; Merck KGaA, Darmstadt, Germany) into borosilicate EPA bottles (amber glass, hydrochloride acid precleaned, calcined at 460 °C for 4 h). Samples for the DOC concentration were stored in the dark at −20 °C, and samples for CDOM and FDOM were stored in the dark at 4 °C until laboratory analysis.

2.3. DOC Concentration Analysis

The DOC concentrations were analyzed using a high-temperature catalytic oxidation method with a total organic carbon analyzer (TOC-L, Shimadzu, Kyoto, Japan). Samples were acidified with 6 N HCl to pH ~2 to remove the inorganic carbon before injection. Sample concentrations were quantified using the external standard curve. The Milli-Q water samples (blank) were subtracted as a baseline, and 83.33 μmol/L standards were injected every 10 samples to check the accuracy of the measurements [28]. The analytical error based on the replicated measurements (three measurements per sample) was 0.5 within 5% of the DOC values.

2.4. CDOM and FDOM Optical Analyses

The CDOM absorbance was measured using the absorbance spectrophotometer (Hardware of Aqualog®, HORIBA Instruments Incorporated (HII), Edison, NJ, USA) with a 1 × 1 cm quartz cuvette. Meanwhile, FDOM excitation emission matrices (EEMs) were recorded using the fluorescence spectrofluorometer (Hardware of Aqualog®, HORIBA Instruments Incorporated (HII), Edison, NJ, USA) with a 1 × 1 cm quartz cuvette.

2.4.1. CDOM Analysis: Ultraviolet–Visible (UV–Vis) Absorbance

The CDOM absorbance was measured throughout the UV and visible spectral domains (240–500 nm) with a resolution of 3.0 nm. The absorbance (A) was converted into the Napierian absorption coefficient (a) and measured in m−1 using Equation (1) [29]:
a λ = 2.303 × A λ l ,
where Aλ is the absorbance, l is the length of the quartz cuvette, and λ is the wavelength. The aλ at certain wavelengths can represent the abundance of CDOM in waters [30].
The spectral slope coefficient (S) was calculated using Equation (2) [31]:
a λ 1 = a λ 2 e x p S λ 1 λ 2 ,
where aλ1 and aλ2 are absorption coefficients at wavelengths λ1 and λ2. For example, the spectral range (275–295 nm) was reported to be S275−295, measured in μm−1. The spectral slope ratio at a specific wavelength (SR) was calculated using Equation (3) to indicate the molecular weight of the DOM [32]:
S R = S 275 295 S 350 400 .
The aromaticity index SUVA254 was used as the average UV absorption of all DOM molecules, indicating the aromaticity of the DOM [12]. It was calculated using Equation (4) [33,34]:
S U V A 254 = a 254 D O C .

2.4.2. FDOM Analysis: Fluorescence Excitation Emission Matrices (EEMs)

The FDOM excitation range was set from 240 to 500 nm, while the emission range was set from 245 to 825 nm. The excitation and emission scans were set at 3 nm and 4.66 nm (8 pixel) steps, respectively. Instrument correction, blank subtraction, correction of the inner filter effects, Rayleigh masking of the first and second orders and normalization (Raman scattering units) were performed as detailed below.
Instrument correction: The sensitivity of the water Raman SNR was >20,000, and the peak of water absorption ranged from 397 to 1 nm. Blank subtraction: The EEMs were subtracted by the EEM of Milli-Q water measured under the same conditions. The inner filter effects in the EEMs were corrected using Equation (5) [35]:
F i d e a l = F o b s × 10 A b s E x + A b s E m 2 ,
where Fideal is the ideal fluorescence–signal spectrum, and Fobs is the observed fluorescence signal. AbsEx and AbsEm are the measured absorbance values at the respective excitation and emission wavelength coordinates. The Rayleigh and Raman scatter peaks were removed by using the three-dimensional interpolation (R1 ± 10 nm and R2 ± 20 nm) [36]. EEMs were normalized to the water Raman signal [37], and the fluorescence intensities were reported as equivalent water Raman units (R.U).
The fluorescence index (FI), humification index (HIX) and biological index (BIX) were calculated as indices for microbial modification, the humification degree and the contribution of biological and autochthonous DOMs, respectively. The FI represented the relative contribution of microbial and terrestrial sources of the DOM. Higher values indicate an increasing degree of microbial modification. FI was calculated via the ratio of Em intensity at 470 nm divided by 520 nm at Ex 370 nm [38,39]. Higher HIX values indicate an increasing degree of humification. HIX was calculated by the area under the Em spectra 435–480 nm divided by the peak area 300–345 nm at Ex 254 nm [40]. BIX was an indicator of autotrophic productivity. Higher values (>1) corresponded to recently produced DOM of autochthonous origin. BIX was calculated via the ratio of Em intensity at 380 nm divided by 430 nm at Ex 310 nm [41].

2.4.3. The 3D Fluorescence—PARAFAC Analysis

The EEM data were further analyzed using the parallel factor (PARAFAC) analysis with Solo® Software (9.5R, with PLS_Toolbox, Eigenvector Research; Manson, WA, USA). The n-component model (n = 2, 3, 4 ......) was validated via split-half, random initialization analysis and analysis of residuals.
Four-component PARAFAC analysis had 97.226% of the data explained, but the Core Consistency was only 17, with an only 2.2% similarity measure of splits and the overall model, which means that the four-comp—PARAFAC model is not available. Meanwhile, three-component PARAFAC analysis had 96.746% of the data explained, and the Core Consistency was 87, with an 87.2% similarity measure of splits and the overall model (Figure S1), which meant that the three-component PARAFAC model was reliable. Taking all factors into account, the three-component PARAFAC model was used for DOM composition analysis and further discussion in this study.

2.5. Statistical Analyses

The location of sampling sites, surface distributions and scatter diagrams were mapped via Ocean Data View 5.3.0 software (Schlitzer, Reiner, Ocean Data View, https://odv.awi.de, accessed on 1 March 2025). Correlation analysis (Pearson’s r) and principal component analysis (PCA) in this study were performed using the inbuilt statistics toolbox in OriginPro 2024b software. The results of linear and nonlinear fittings with p < 0.001 were recorded as significant.

3. Results

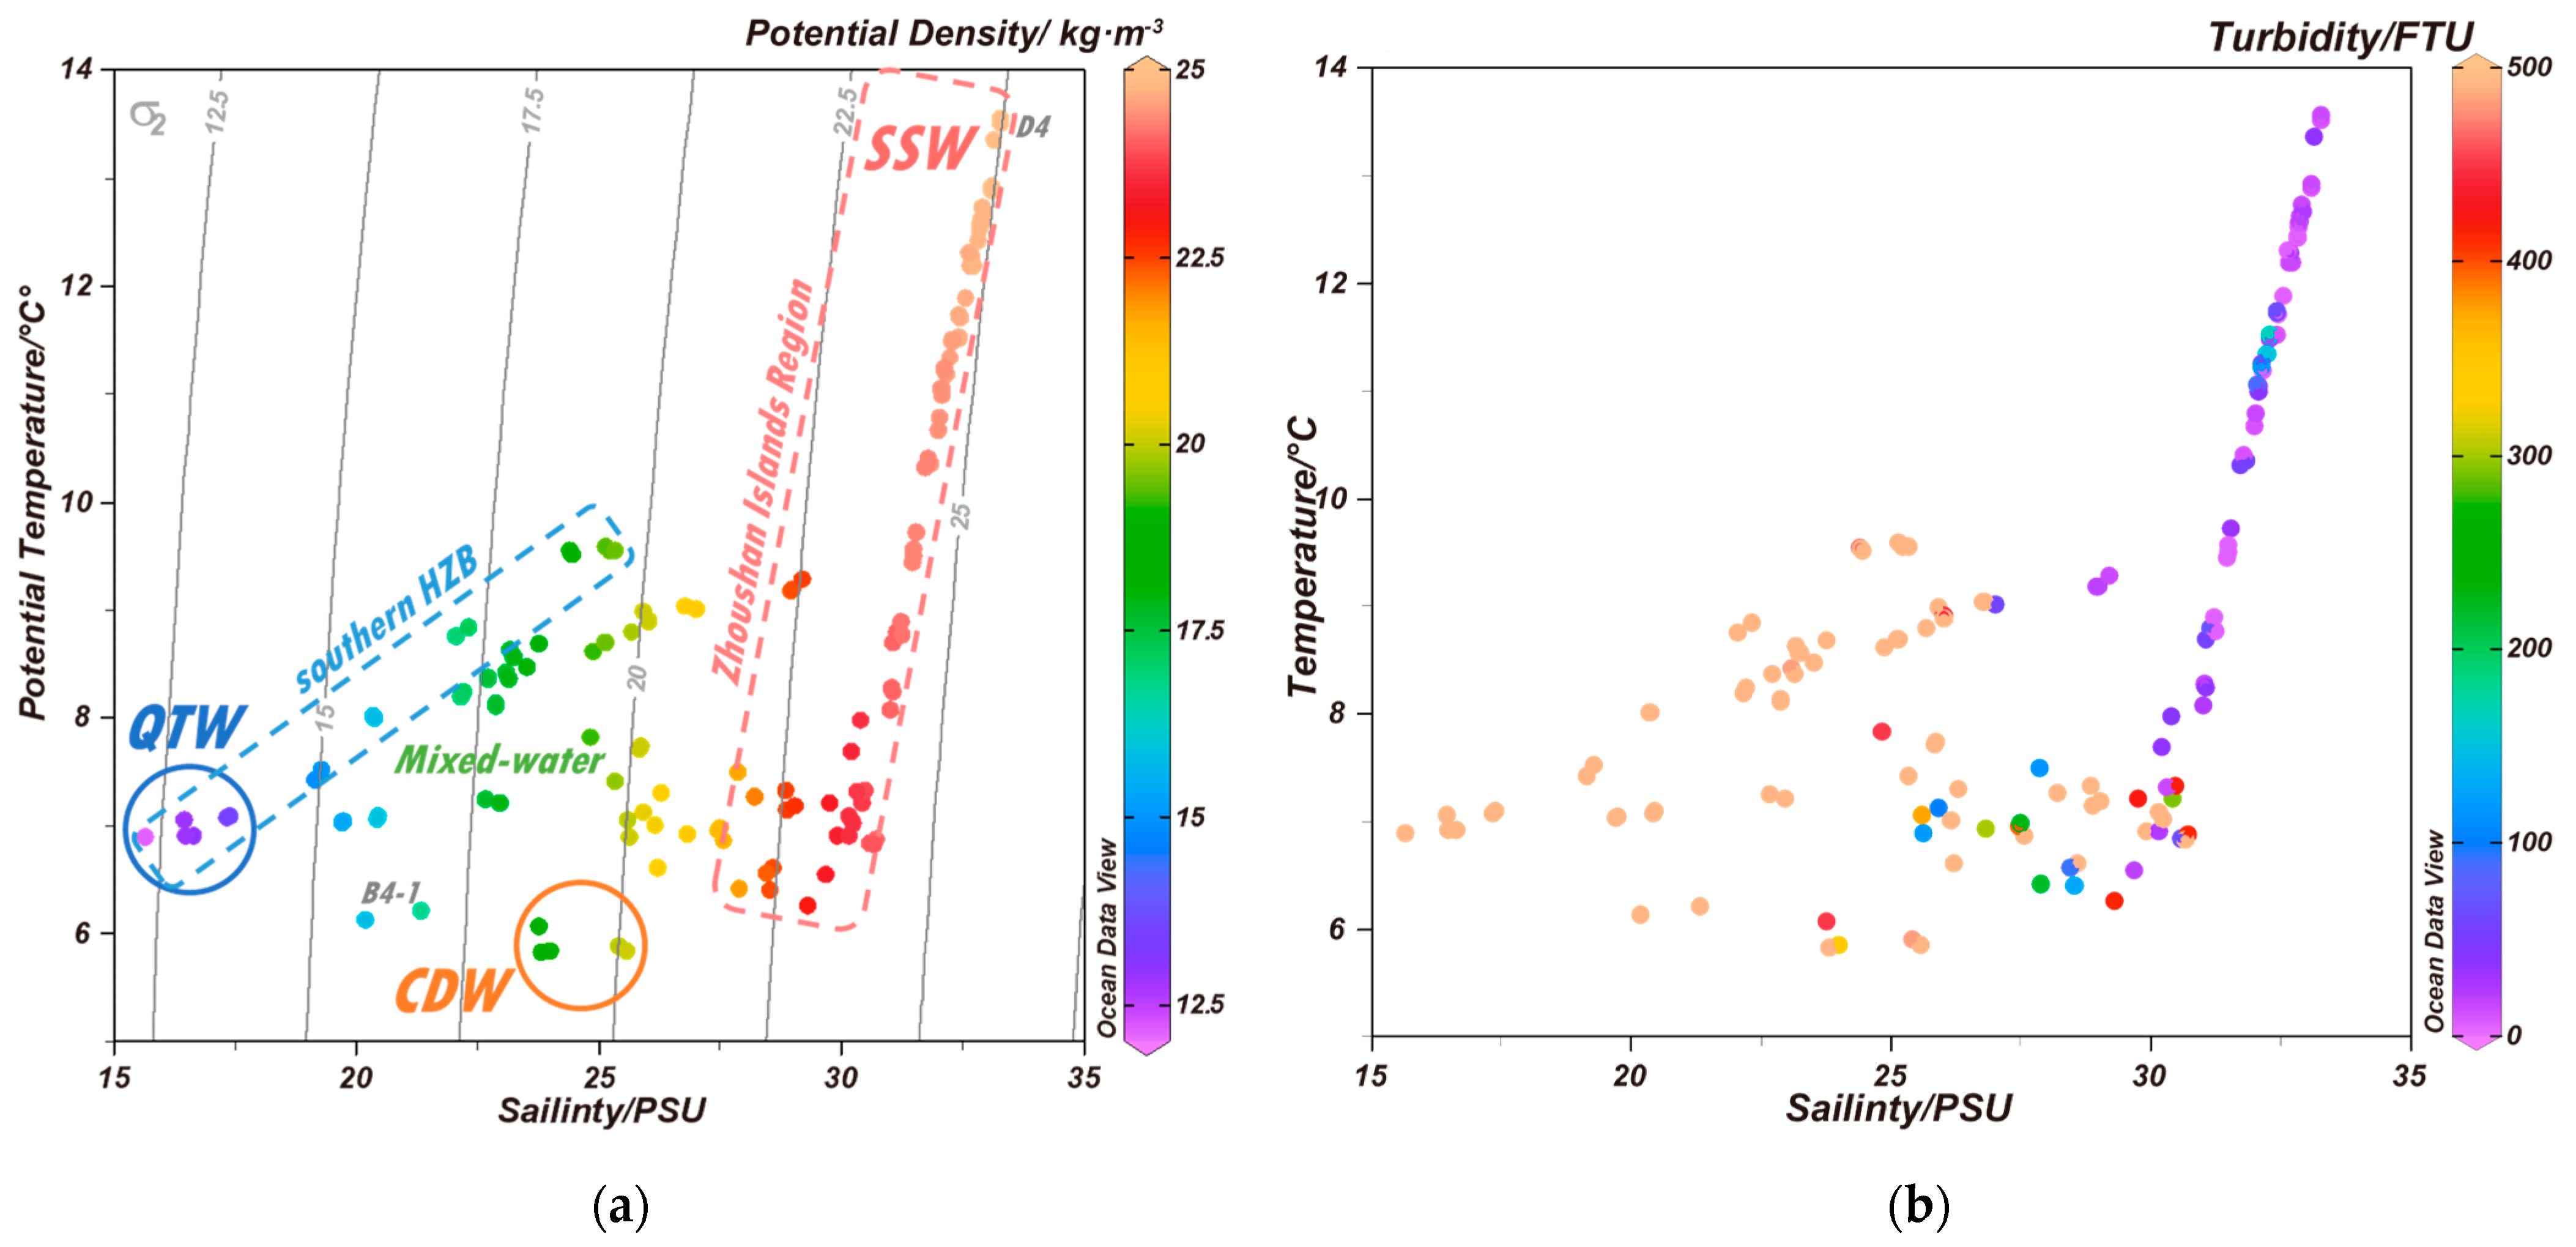
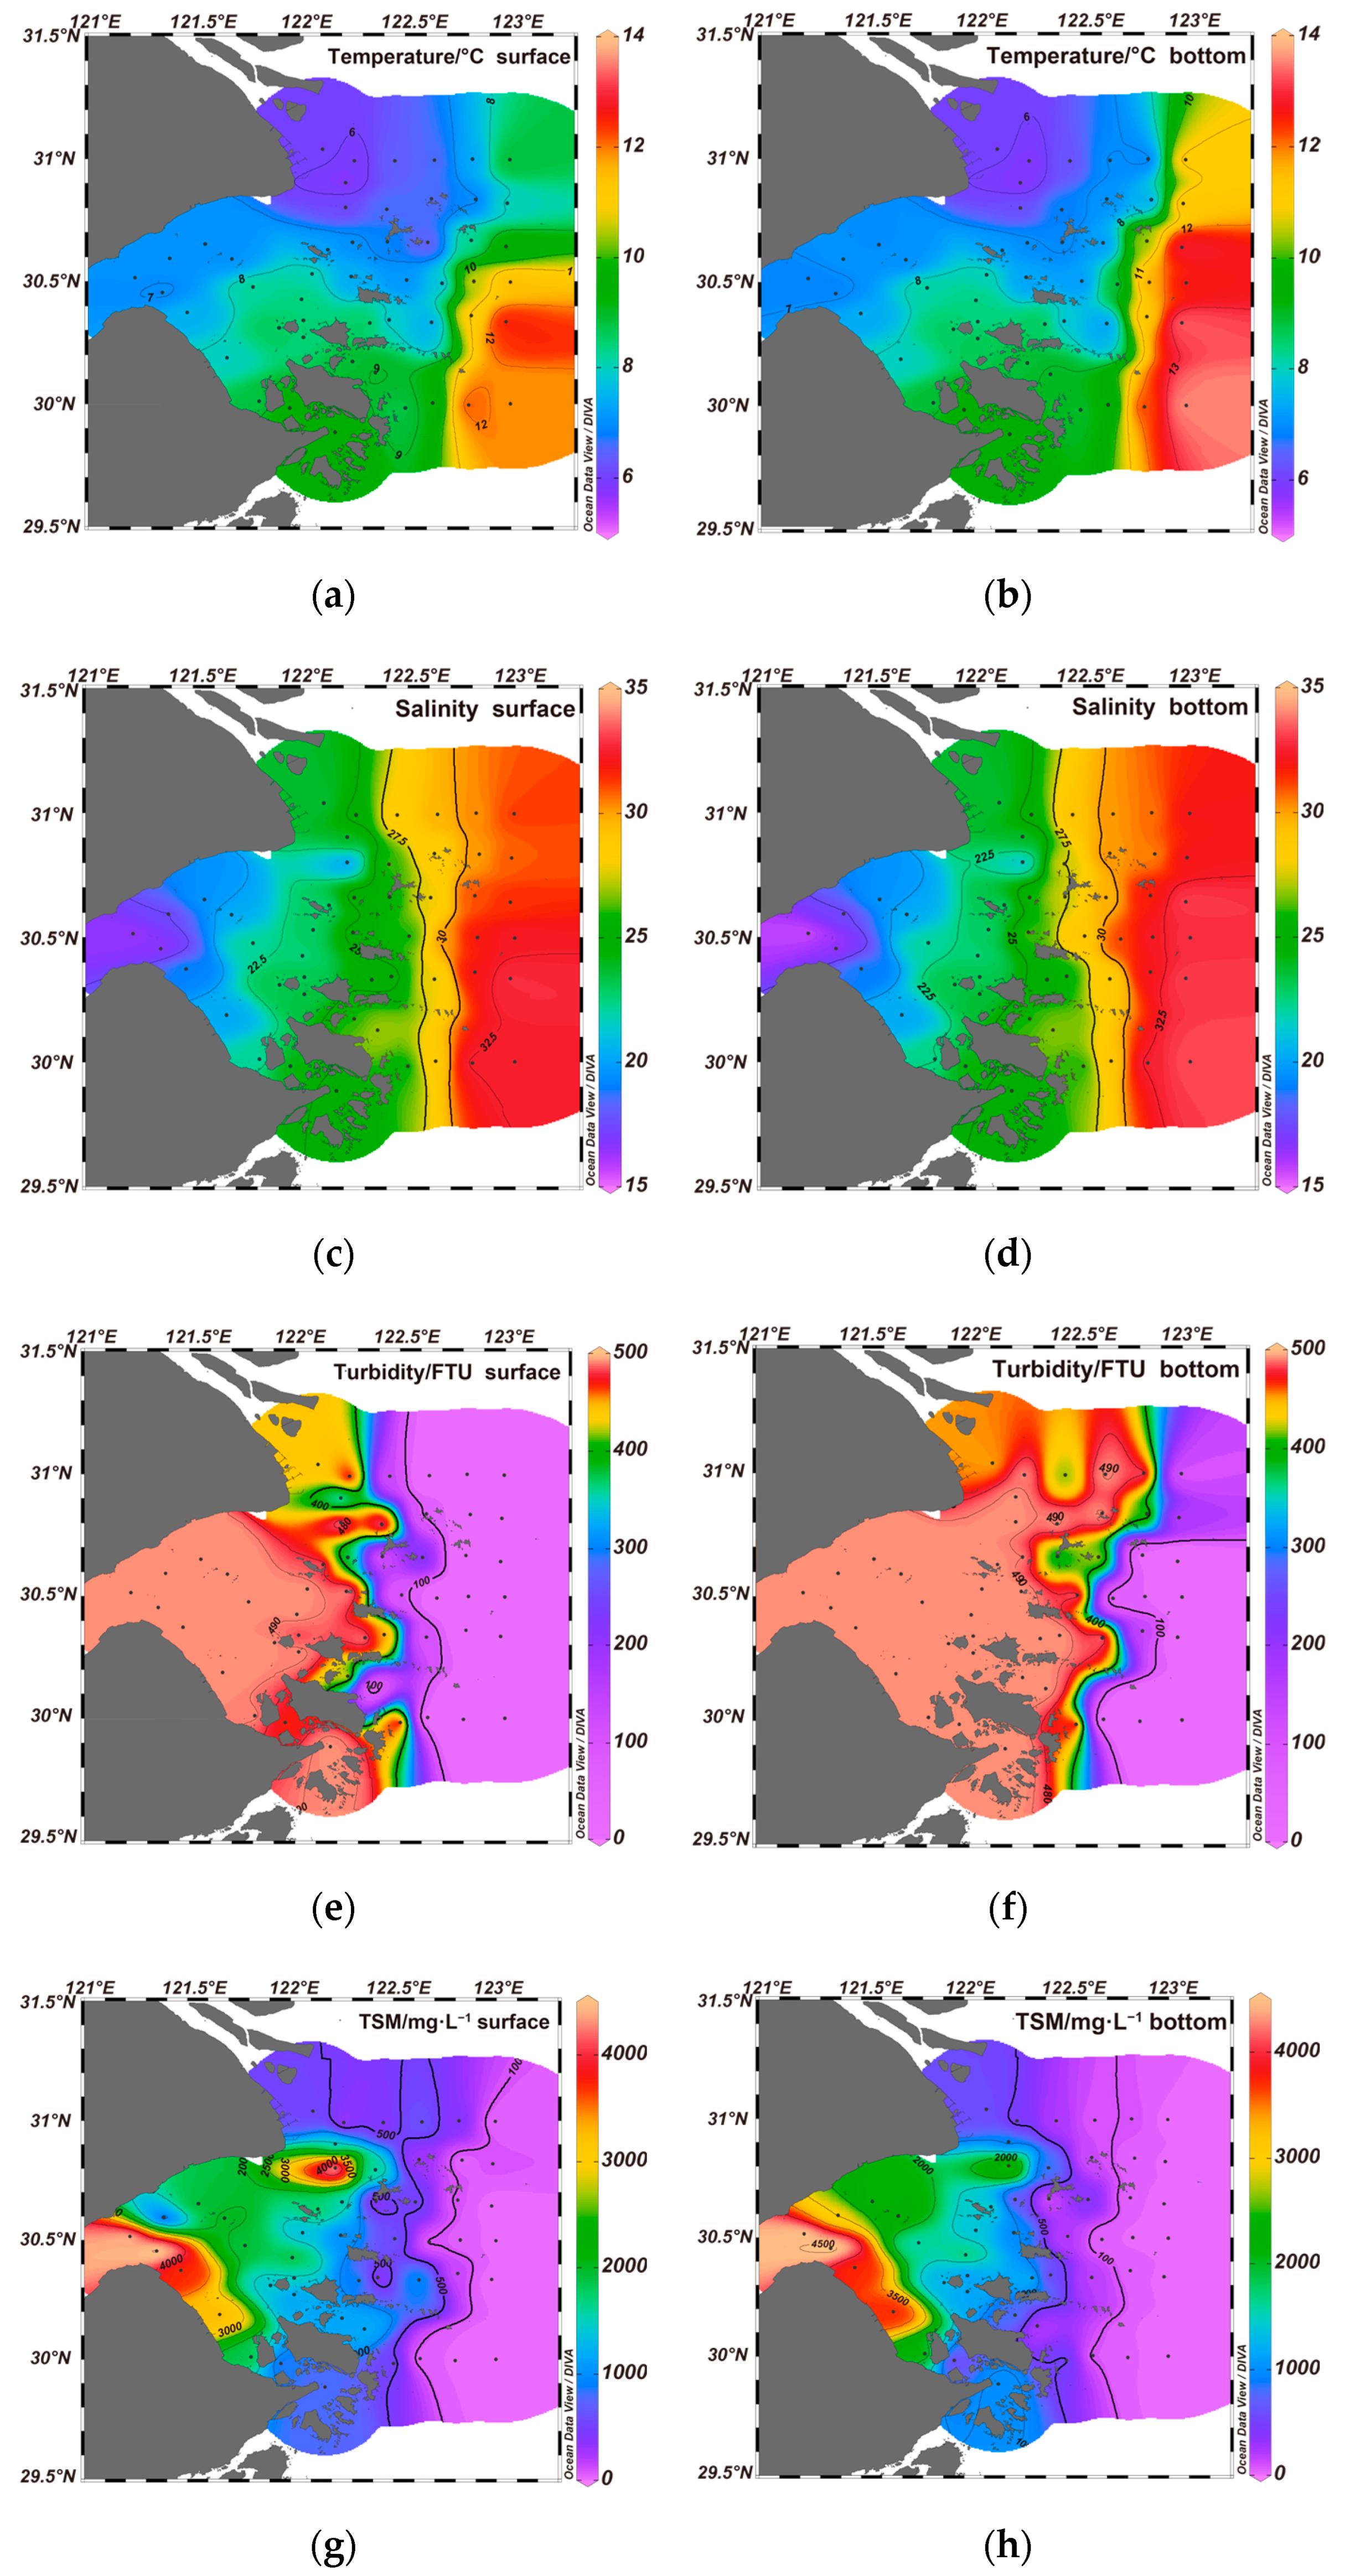
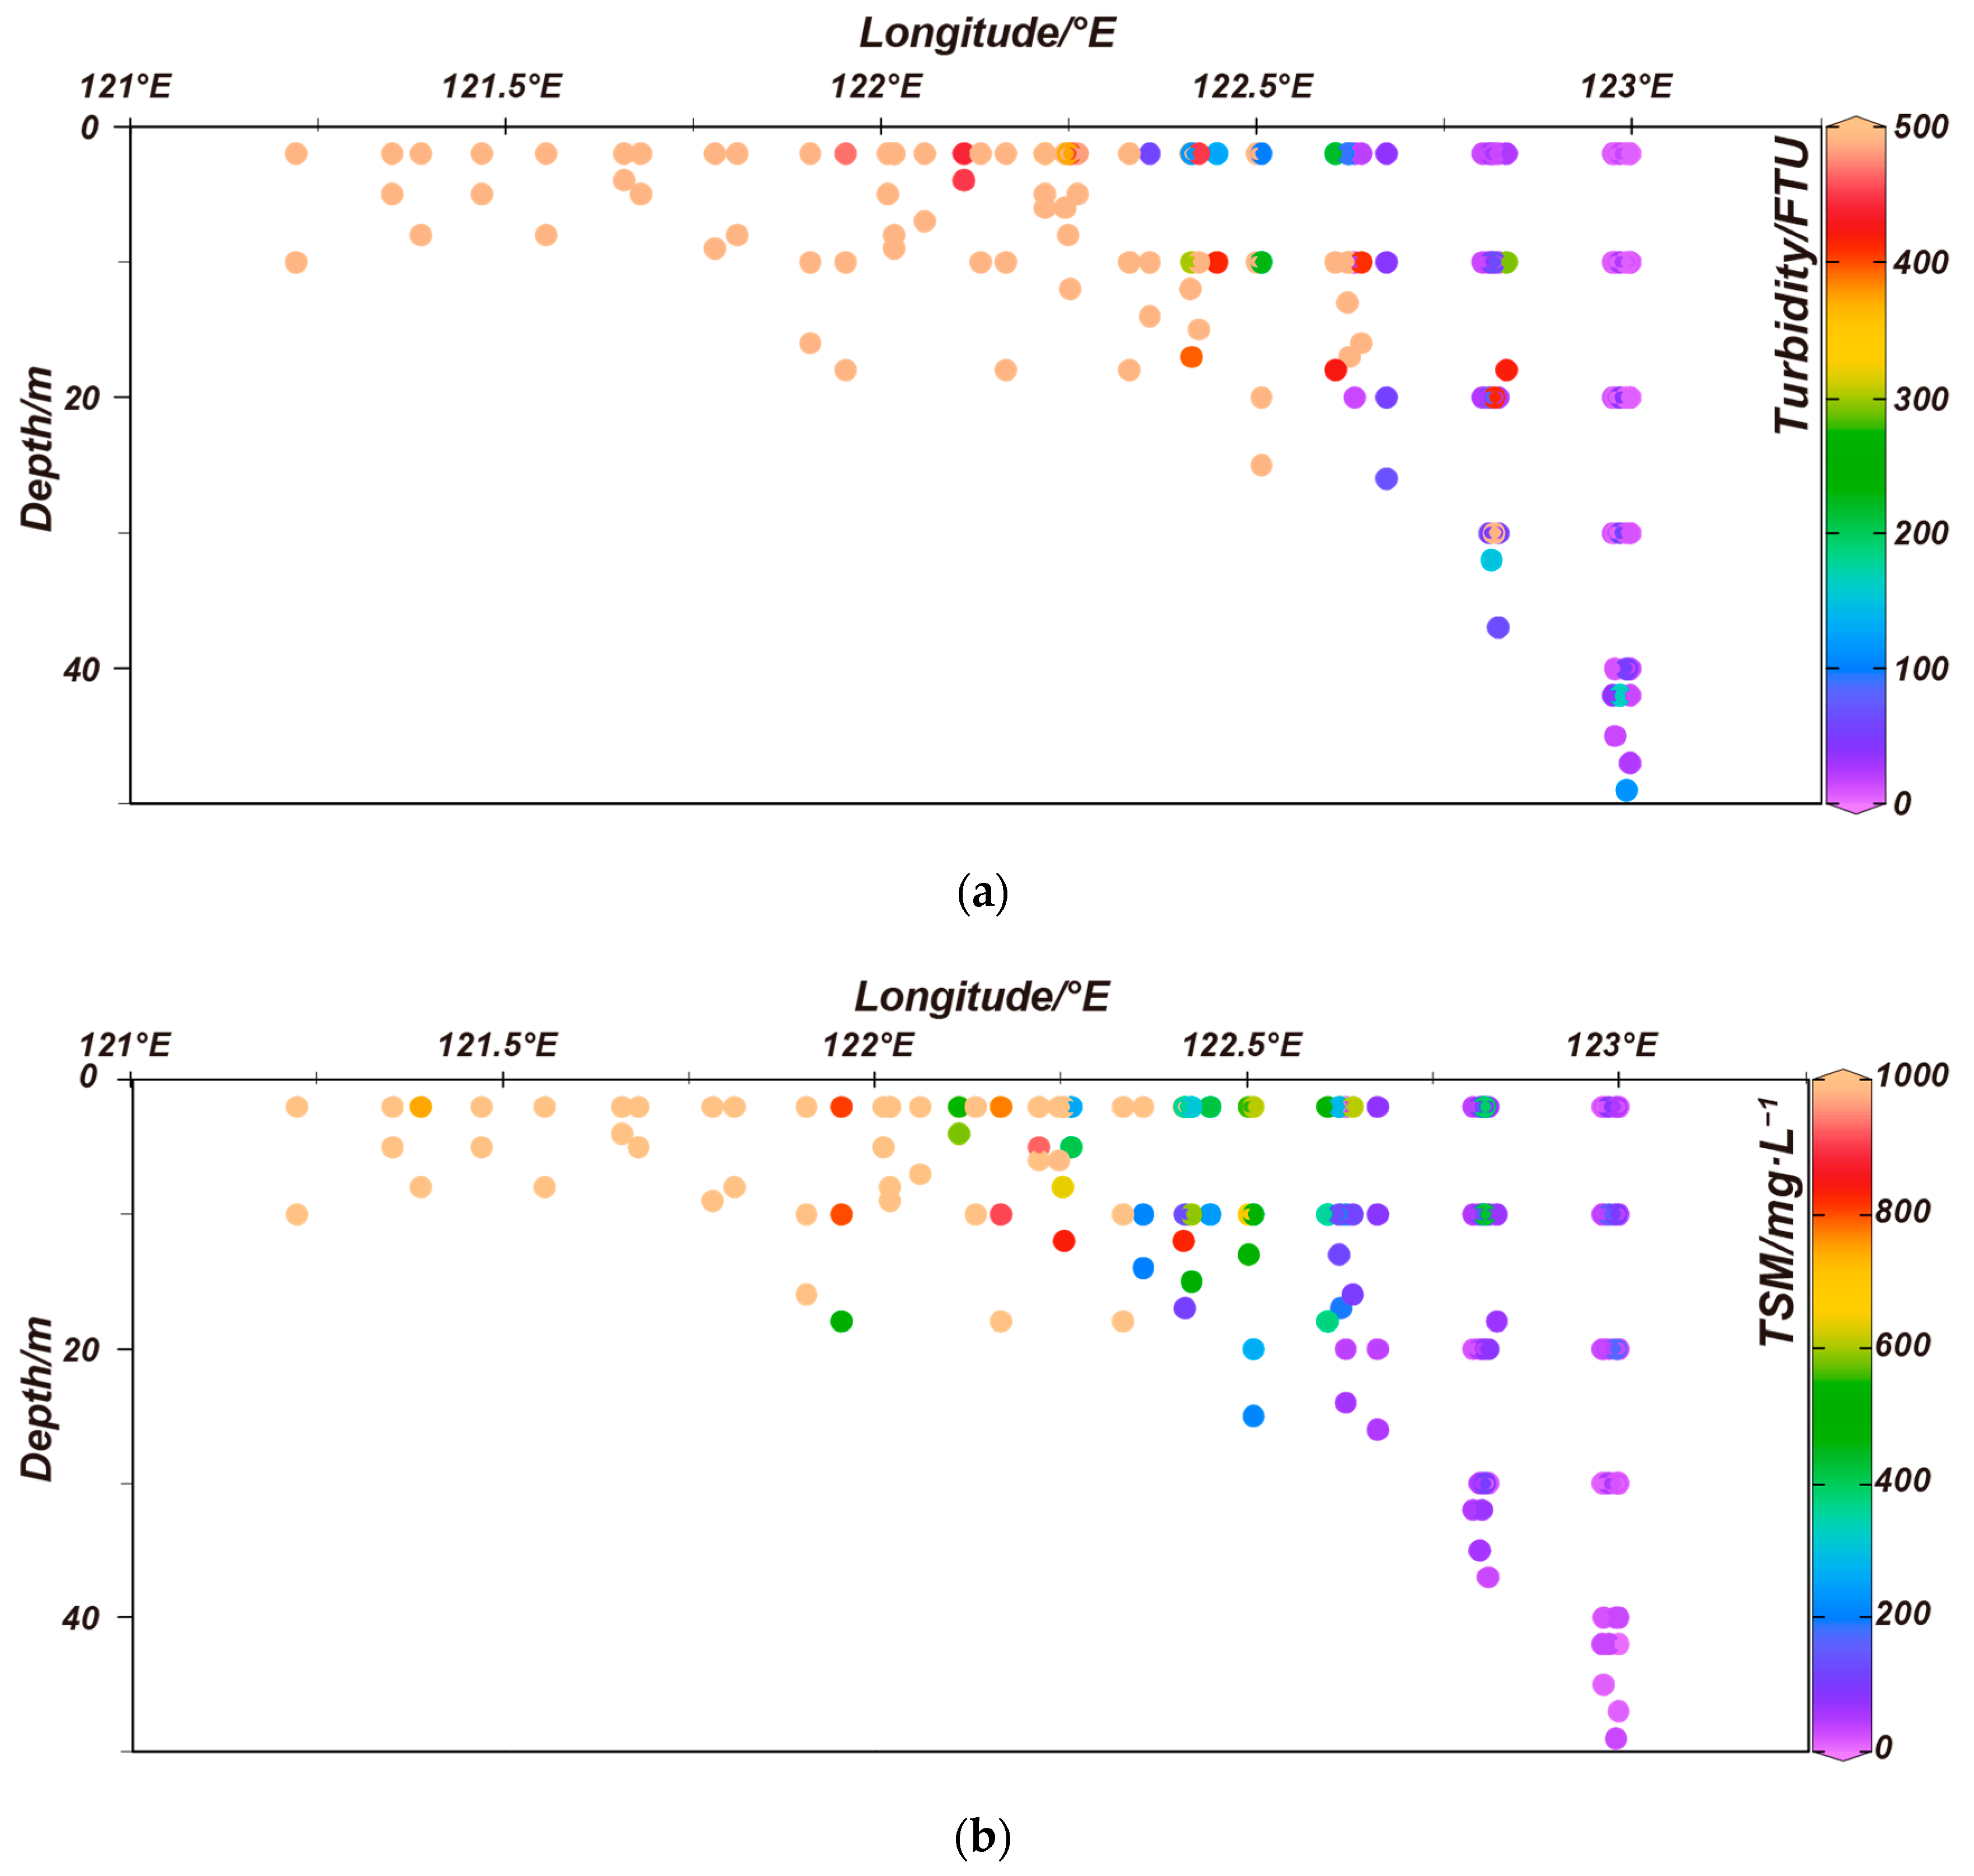
3.1. Hydrological and Hydrochemical Parameters in HZB and Adjacent Seas

The physical and chemical properties of seawater are primarily affected by the properties of water masses. Three different water sources were identified based on temperature, salinity and turbidity, showing distinct hydrological and hydrochemical properties (Table 1). QTW stands for Qiantang Estuary Water; CDW stands for Changjiang diluted water; SSW stands for shelf sea water (salinity > 27.5) in the Zhoushan Islands Region.
Table 1 shows the different water masses with different hydrochemical properties in winter in the study area. Water masses of varying densities and sources are highlighted and circled in different colors in Figure 2a. QTW (blue circle in Figure 2a) had medium temperature, lowest salinity and high turbidity (>400), with the highest DO and Chl-a values. Changjiang diluted water (CDW, orange circle in Figure 2a) had the lowest temperature, medium salinity and high turbidity (>400), with medium DO and Chl-a values. Shelf sea water (SSW, red quadrangle in Figure 2a) had the highest temperature and salinity and low turbidity (<300), with the lowest DO and Chl-a values.
There were 79 water samples with turbidity greater than 300 FTU in the study area, representing mixed waters highly influenced by both CDW and QTW, and 69 water samples with turbidity less than 300 FTU representing shelf sea waters (Figure 2b).
The HZB showed strong vertical mixing characteristics in late January 2024. The temperature and salinity ranged from 5.8 to 13.6 °C and 15.65 to 33.29, with average values of 8.8 ± 2.1 °C and 27.57 ± 4.56, respectively. The spatial distributions of salinity and temperature were consistent between the surface and bottom layers, with low salinity and temperature in the upper HZB and North HZB, and then, both the salinity and the temperature increased gradually southeastward to the Zhoushan Islands Region (ZIR) (Figure 3a–d).
The HZB is known for its strong tidal currents, with a large tidal range accompanied by high turbidity. An obvious turbidity front in the study area was found along the longitude of 122.5 °E. The turbidity was pretty high, ranging from 400 to 500 FTU, at the west side of the front, including the whole HZB. Then, it decreased eastward to the ZIR. On the east side of the front, the turbidity ranged from 5 to 100 FTU. The turbidity of the Northern Changjiang Estuary stations (B3, B4 and B4-0) was slightly lower than that of Hangzhou Bay (Figure 3e,f).
The total suspended matter (TSM) in the HZB and adjacent seas ranged from 113.6 mg·L−1 to 4616 mg·L−1 and 5.6 mg·L−1 to 616 mg·L−1 in the HZB (west of 122.5 °E) and the ZIR (east of 122.5 °E), respectively. The high values of TSM were found in the Qiantang River Estuary (QRE, stations E1–E4) and the northern lower bay near the CRE (Figure 3g,h).
In the HZB stations (from QRE to HZB mouth) of our study area, the turbidity values were very high and varied slightly from 482.75 to 492.47 FTU in all water layers (Figure 4a). In the ZIR stations (from HZB mouth to open ECS), the turbidity values decreased with the longitude and depth in general (Figure 4a). The TSM values showed a similar distribution with turbidity (Figure 4b), decreasing with the longitude and depth.

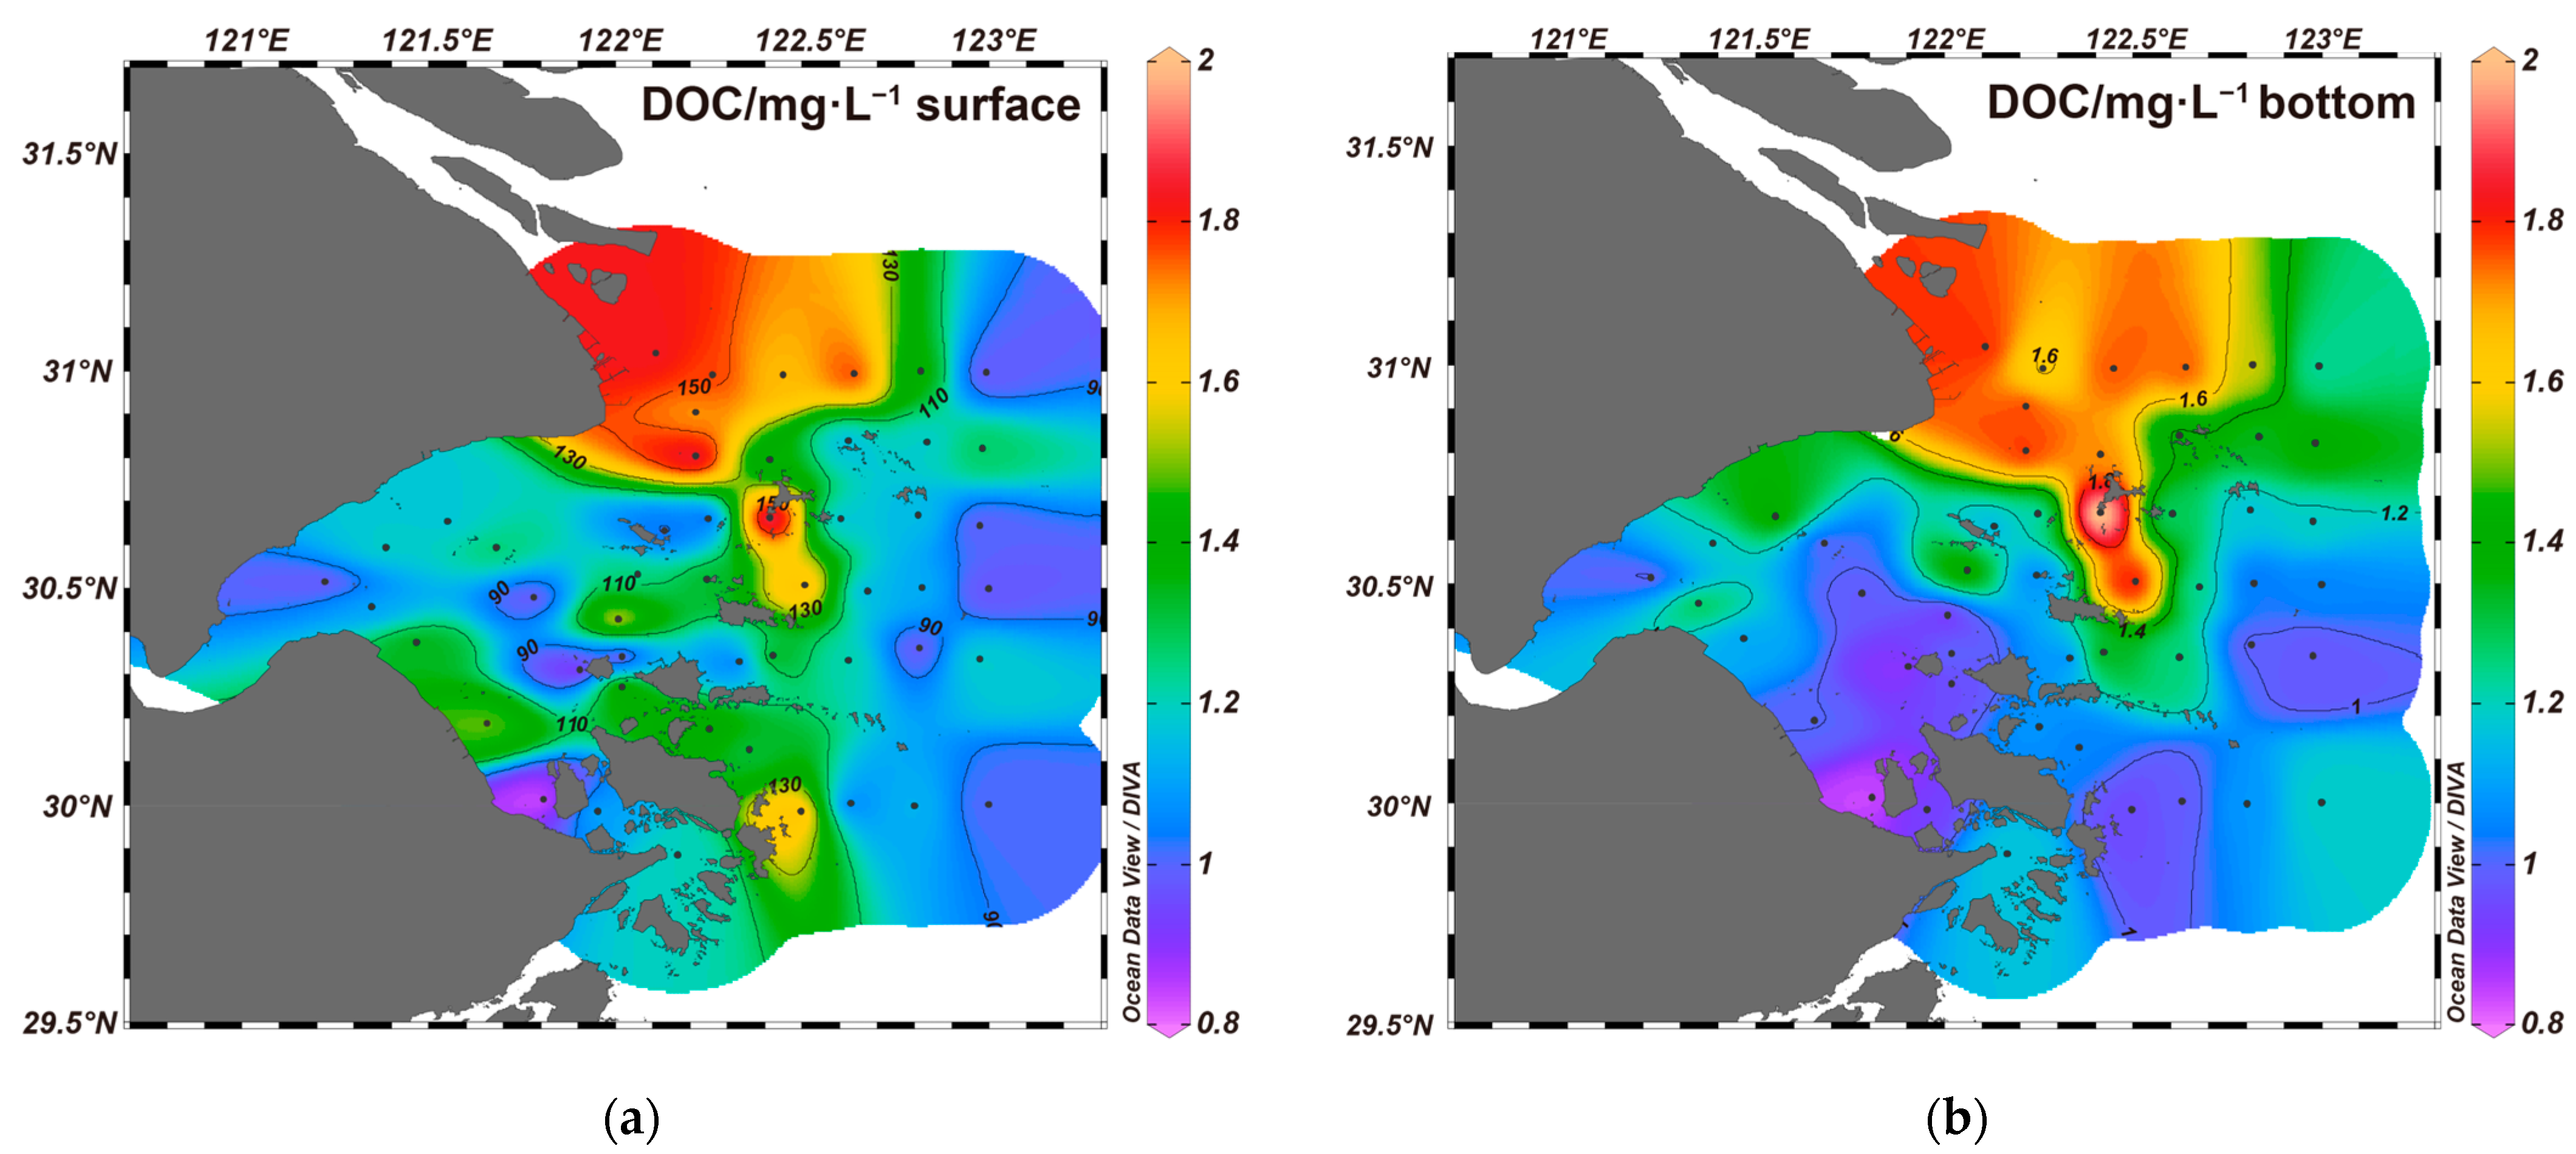
3.2. Distributions of DOC in the HZB and Adjacent Seas

The concentrations of DOC in the study area ranged from 69.2 to 179.2 μmol·L−1, with an average value of 105.8 ± 25.0 μmol·L−1. High DOC concentrations were observed in both surface and bottom waters near the Changjiang River Estuary (149.2 ± 8.3 μmol·L−1 at stations B3, B4, B4-0 and B4-1) and at station C2-1 (168.3 μmol·L−1) (Figure 5a,b), and then, they gradually decreased southwestward to the HZB and southeastward to the Zhoushan Islands Region (ZIR).

3.3. CDOM and FDOM Properties in the HZB and Adjacent Seas

The highest mean value of DOC concentration was in the CRE (Figure 6a), but the highest mean value of CDOM abundance was in the upper HZB (near QRE), and the CDOM absorption coefficients decreased from the upper bay through the lower bay to the bay mouth (Figure 6b,e). The FDOM relative abundance varied in the same way as a355 (Figure 6b,c).
The SR was higher in the ZIR with a mean value 2.01 than in the CRE and HZB (mean value 1.28–1.55) (Figure 6d). On the contrary, the SUVA254 mean values decreased from the QRE to the ZIR (from 6.60 to 3.20) from the upper bay to the lower bay to the bay mouth (Figure 6f).
In addition, the highest FI mean value was also found in the QRE (Figure 6g), and the FI decreased from the upper HZB (QRE) eastward to the CRE and the ZIR. The HIX mean values sharply increased from the QRE to the CRE, increasing from 0.47 to 2.19 (Figure 6h). The BIX mean values decreased from the upper HZB (QRE) eastward to the CRE, decreasing from 1.10 to 0.99 (Figure 6i).

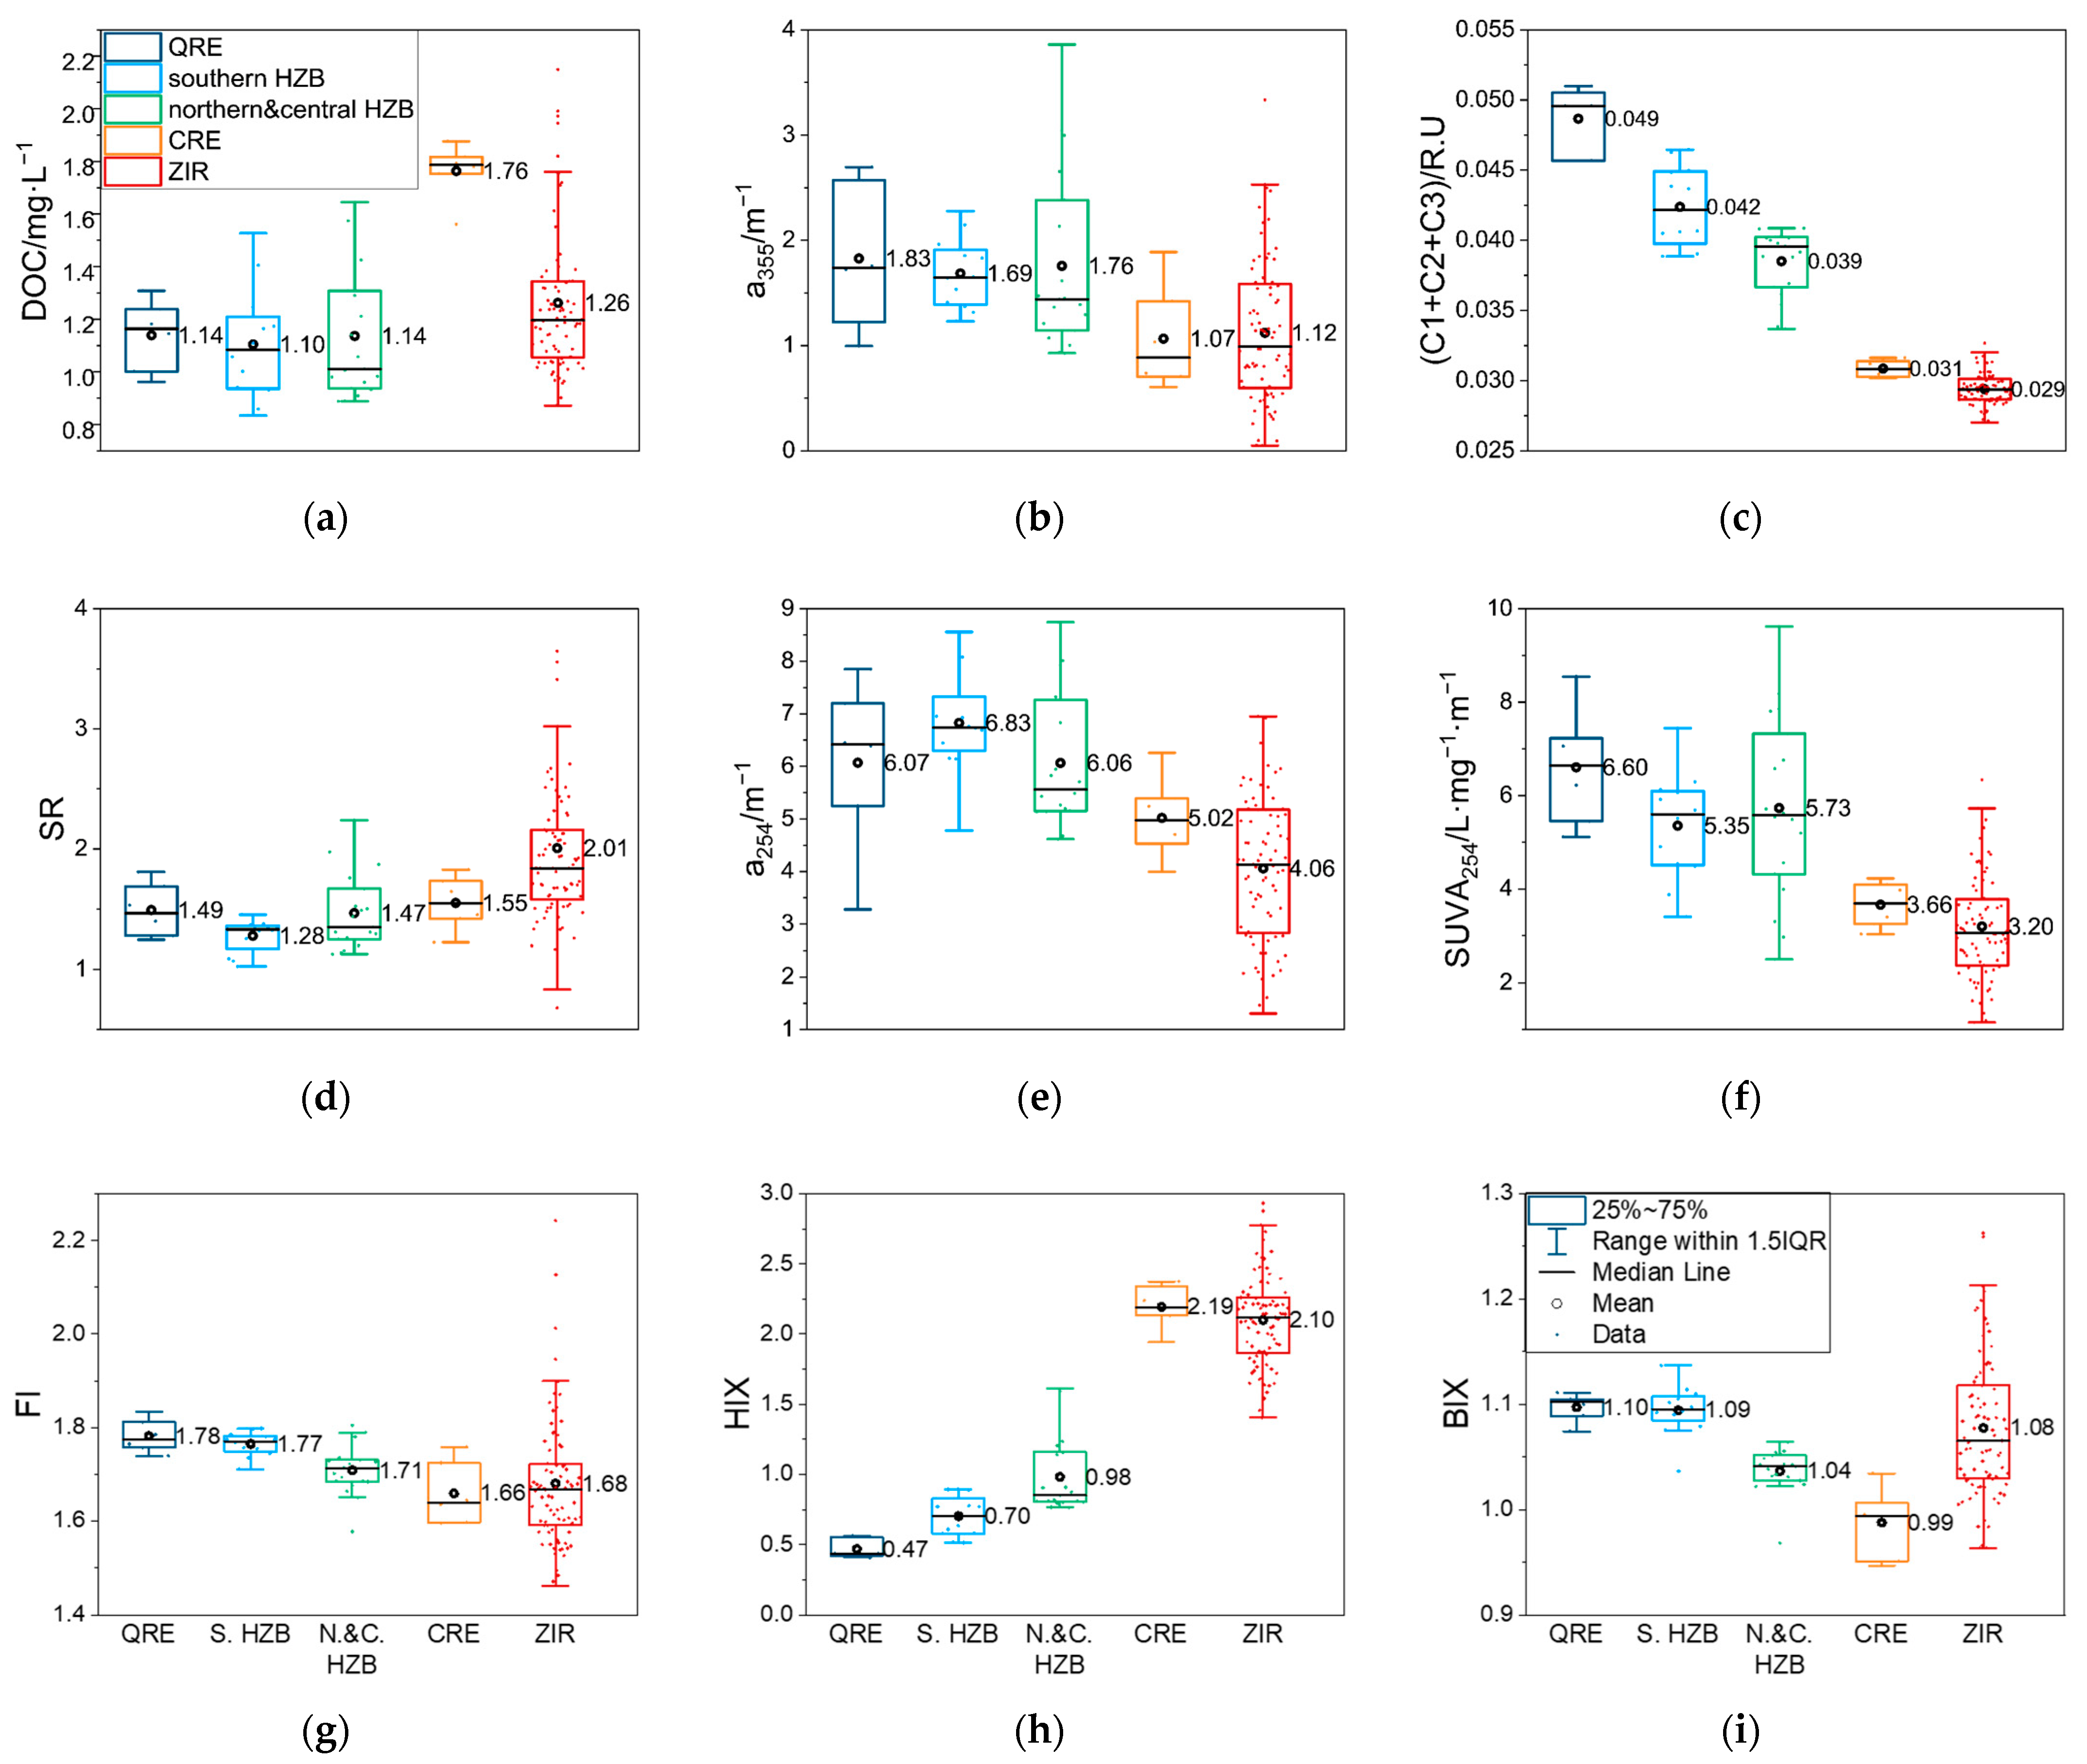
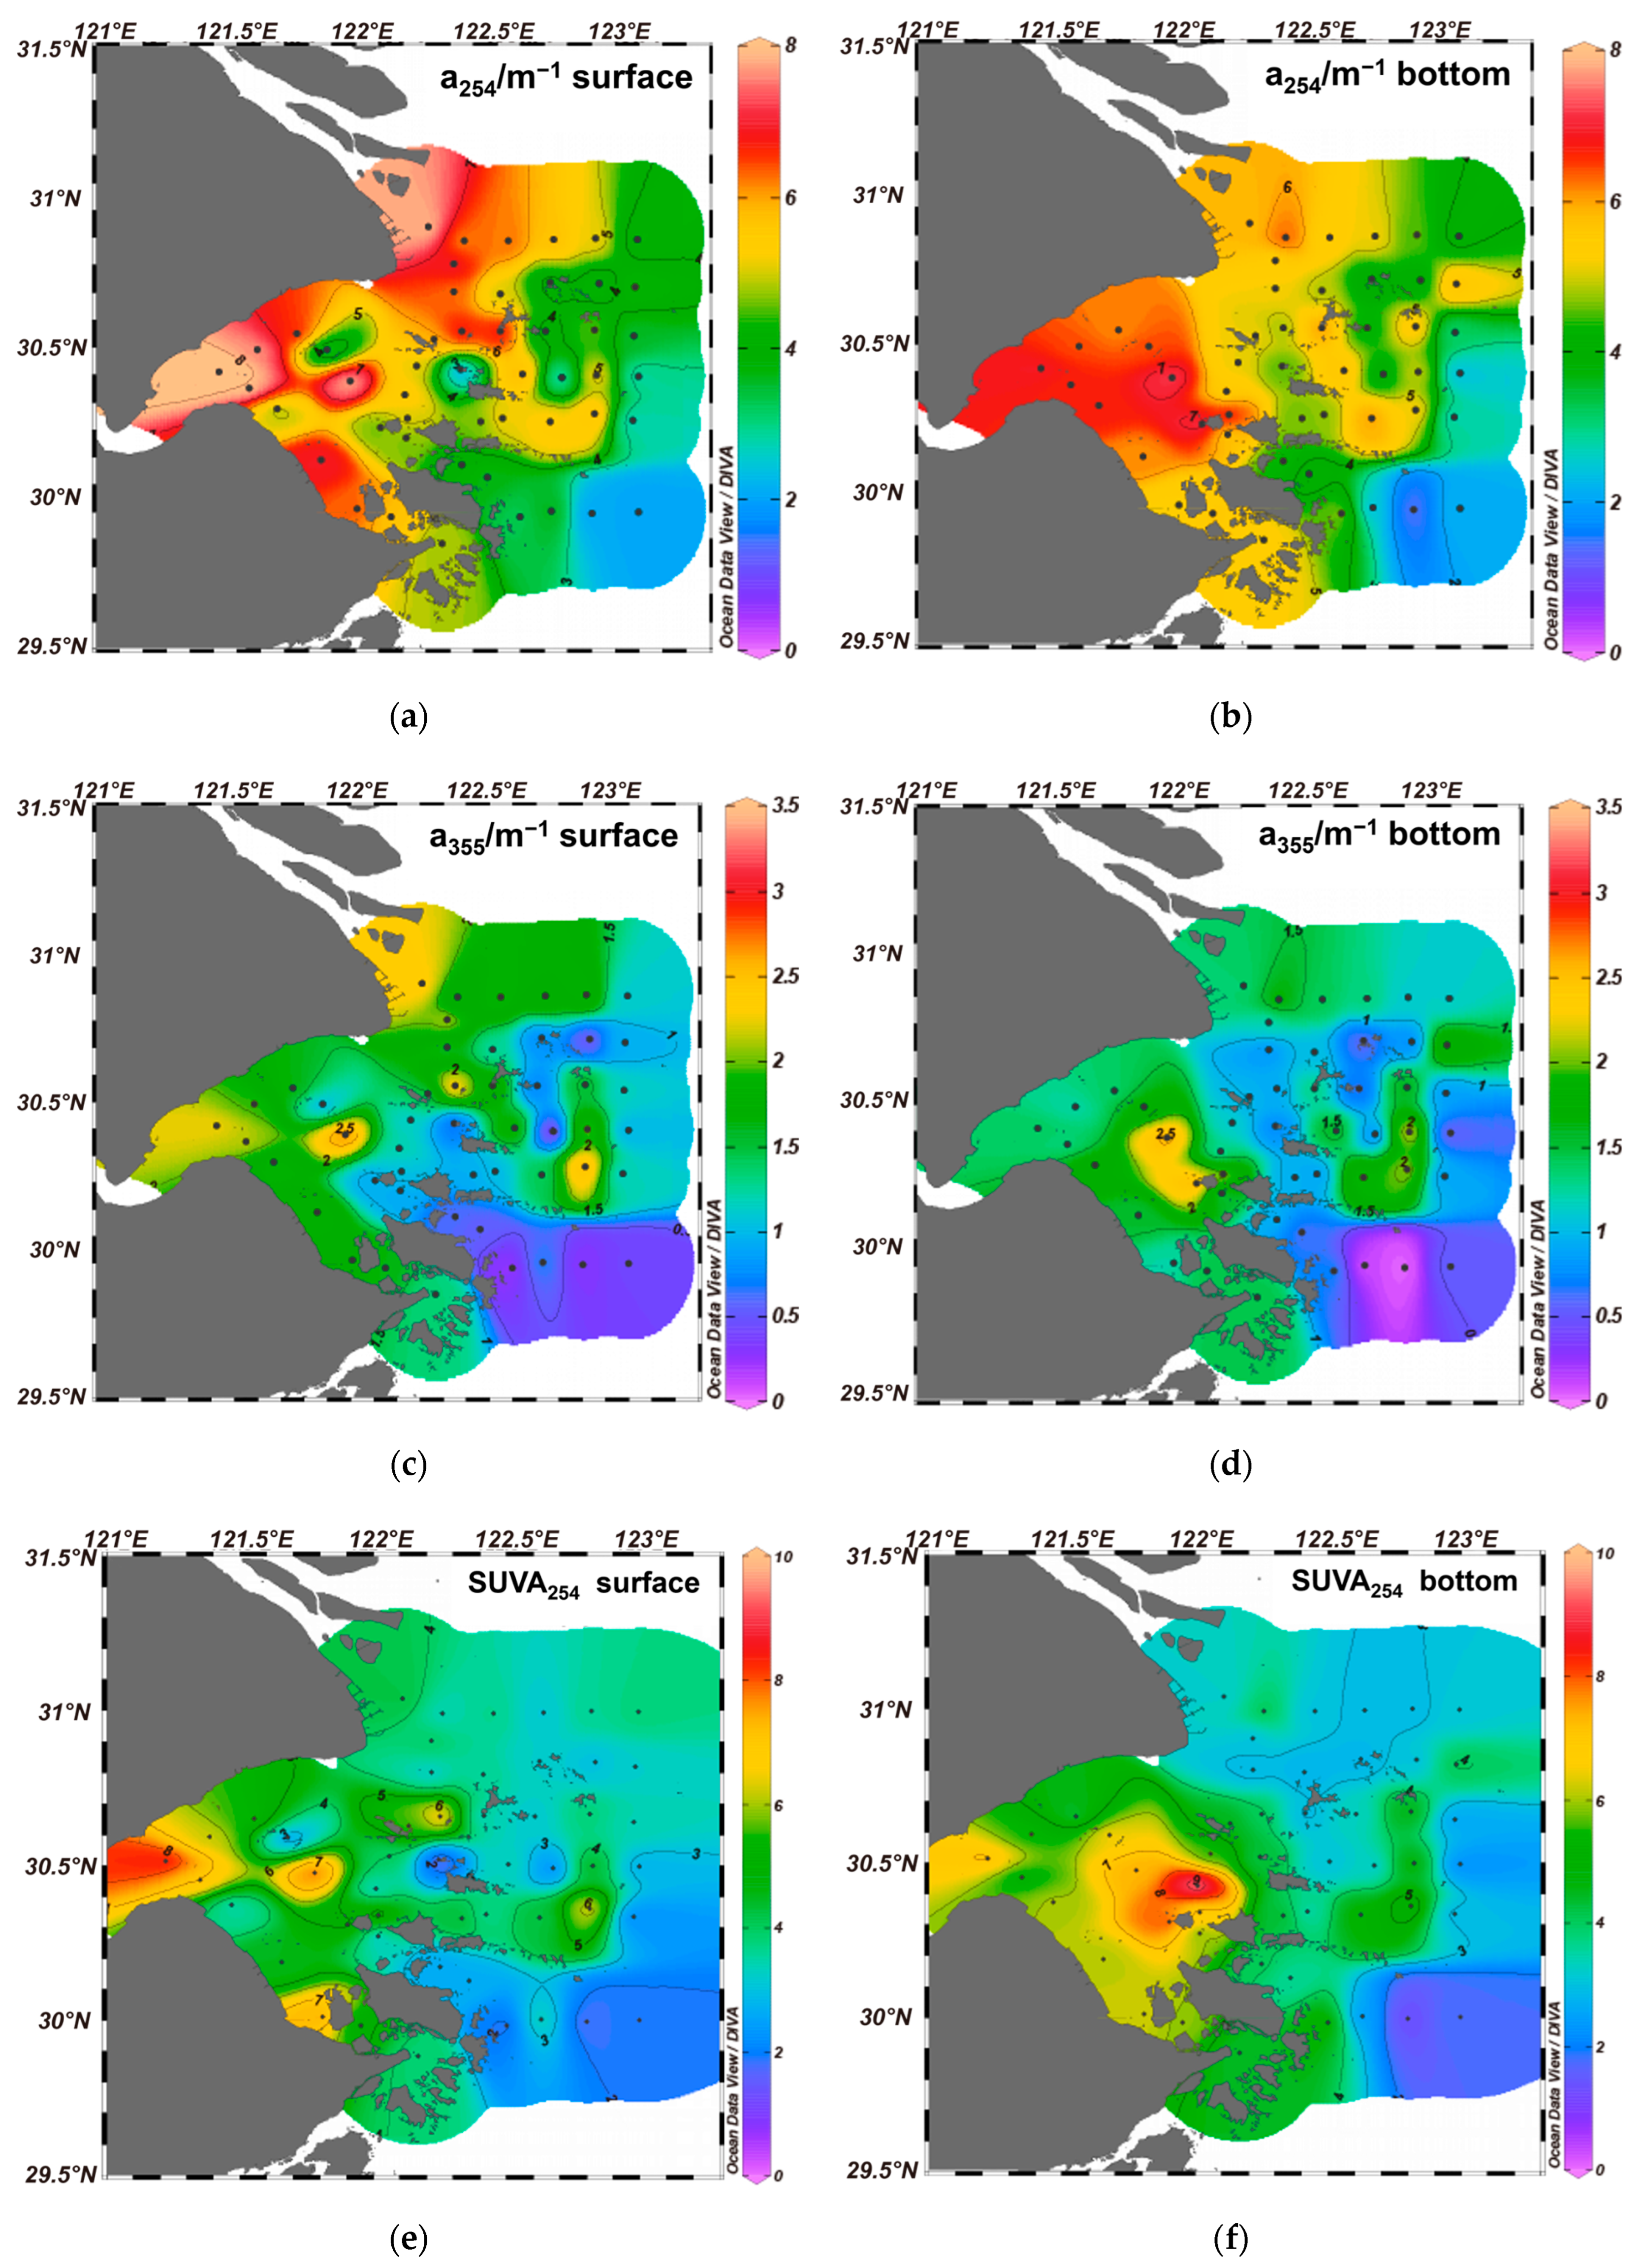
3.3.1. CDOM Coefficients
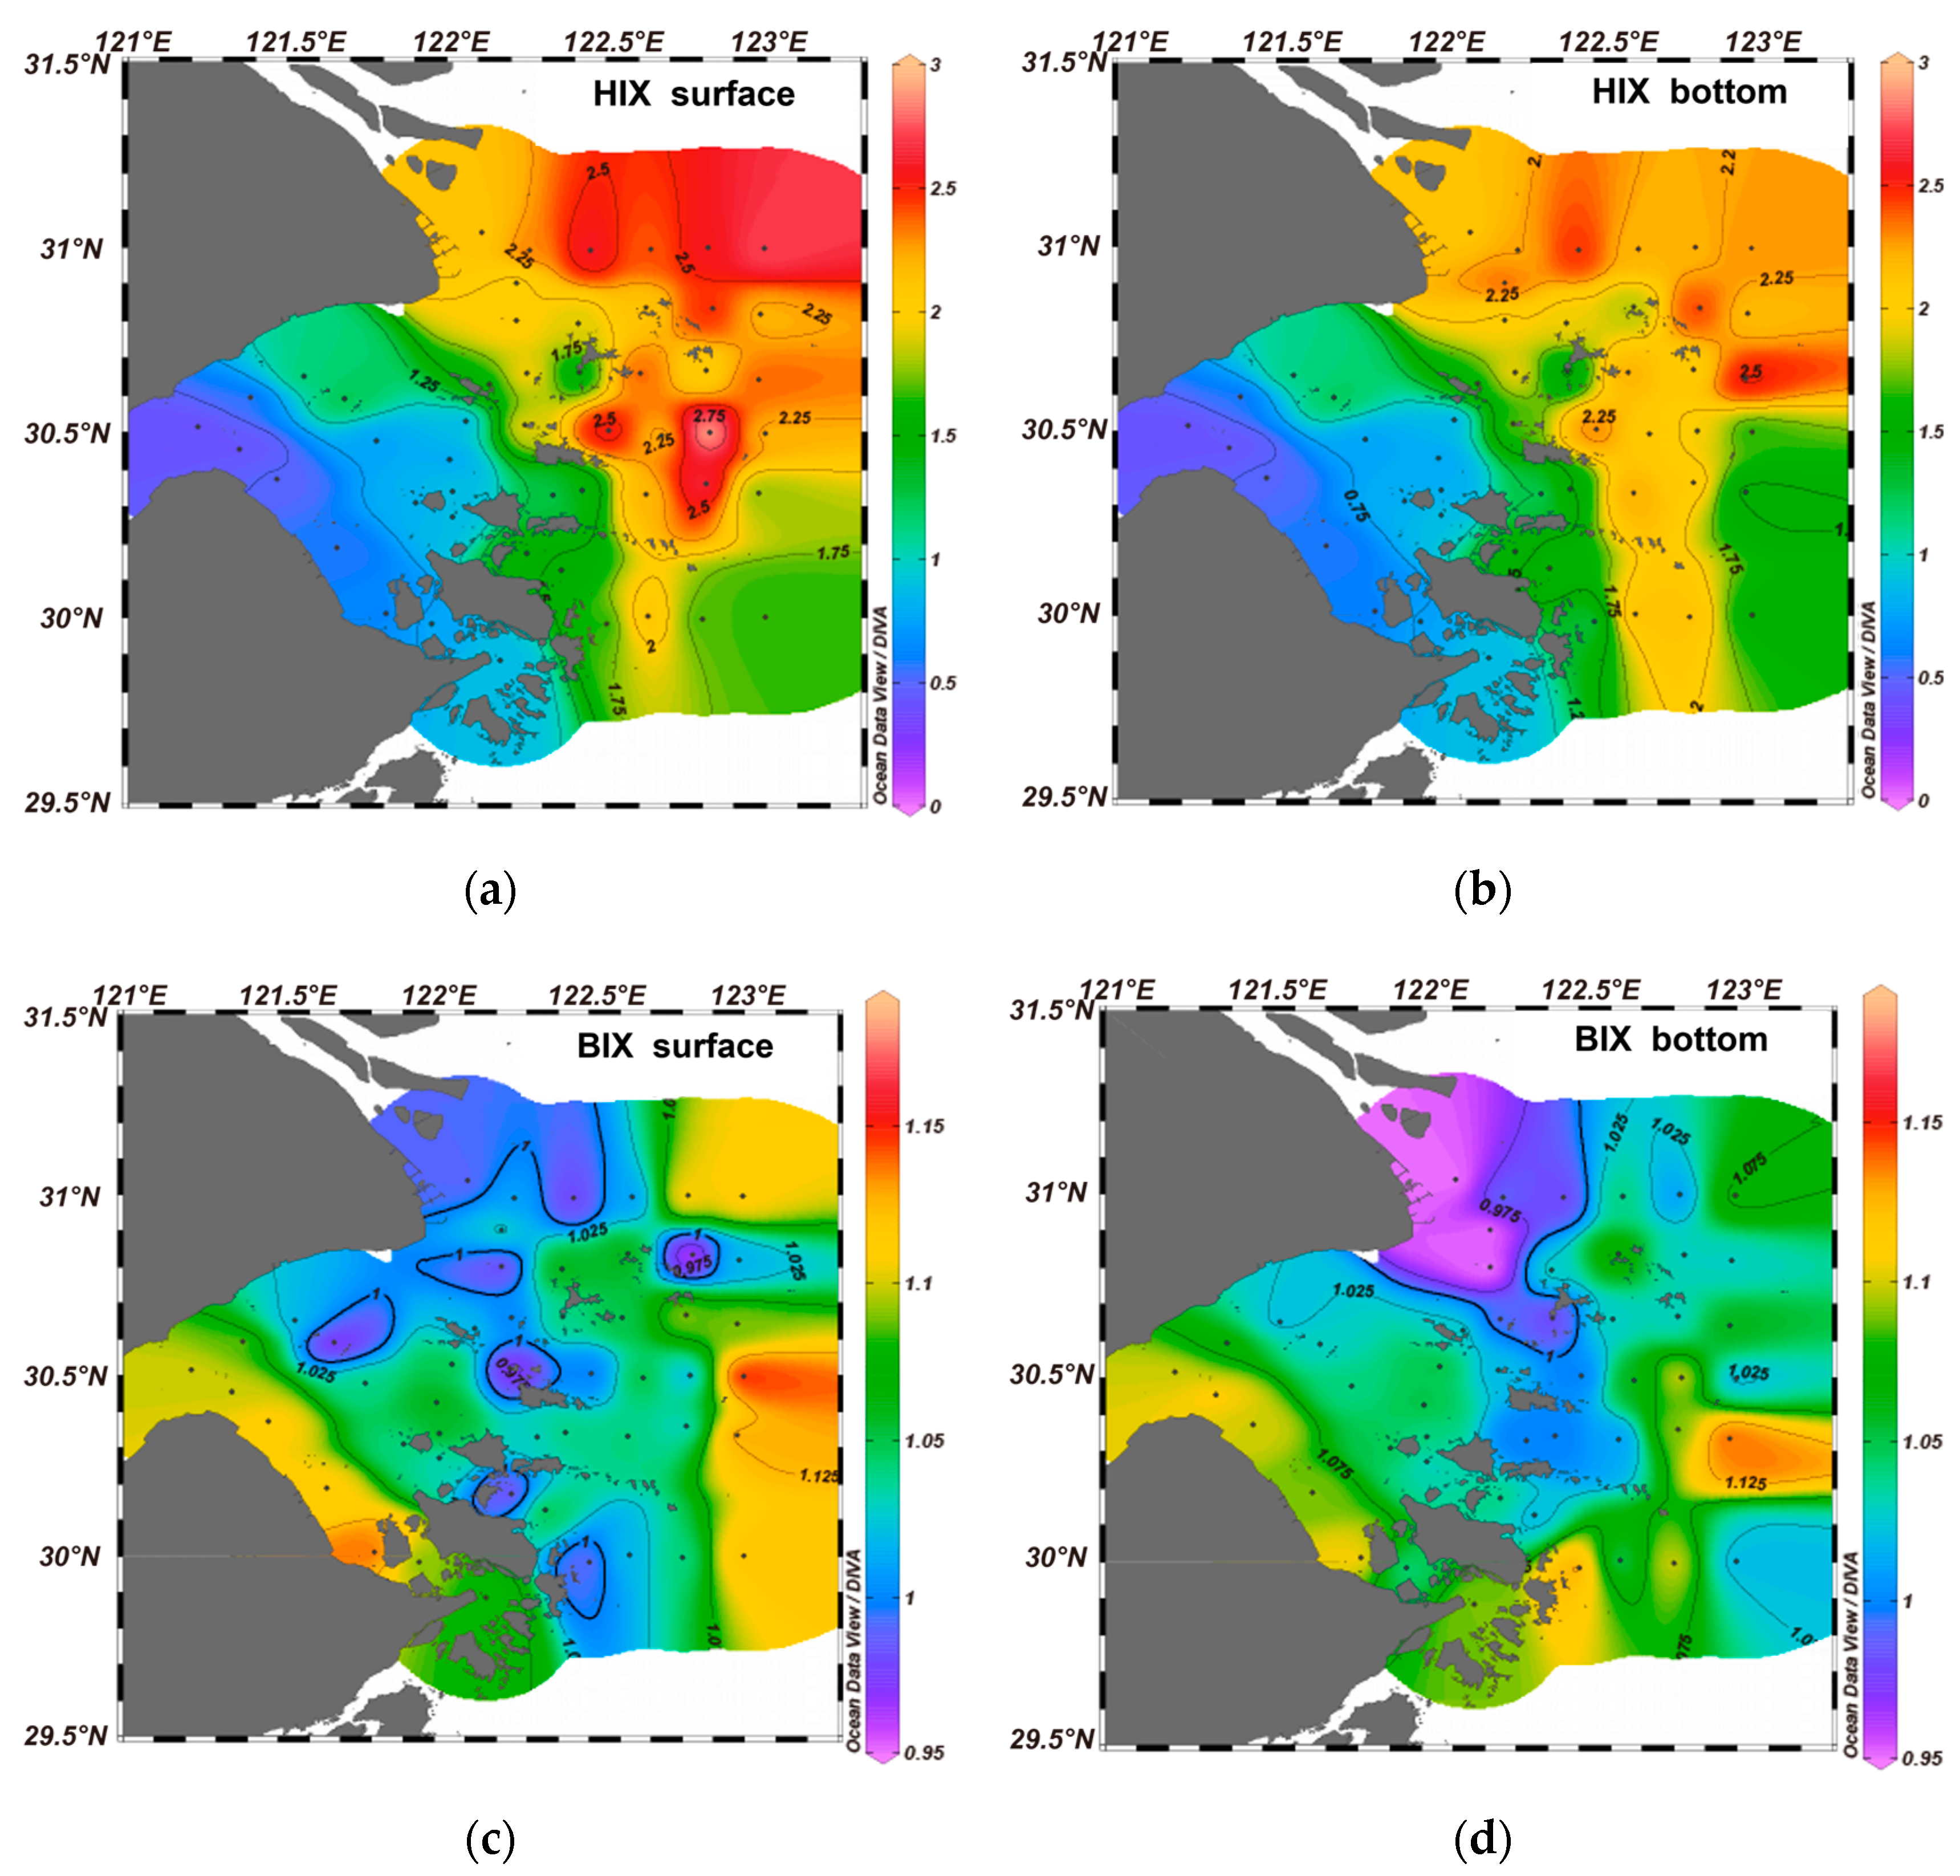
The absorption coefficients of CDOM at different wavelengths were always positively correlated in the coastal estuaries where the DOM was dominated by terrestrial input [43]. The absorption coefficient of CDOM in the HZB and adjacent seas was higher at 254 nm (a254) than other, longer wavelengths (Figures S2 and S3). This result was mainly due to the low concentrations of CDOM in the HZB and the shelf region, resulting in an inaccurate absorption coefficient measured at 350–500 nm. Previous studies have also reported that the shorter wavelength absorption fits better than longer wavelength absorption, especially in the open sea [43,44].
The UV absorption coefficients at 254 nm and 355 nm, i.e., a254 and a355 in the HZB and adjacent seas, ranged from 1.31 to 8.74 m−1 and 0.05 to 3.86 m−1, with an average of 4.77 ± 1.62 m−1 and 1.28 ± 0.69 m−1, respectively. The highest value of a254 was concentrated in the upper HZB and the CRE (surface water stations E1, E2, CE3 and B3) (Figure 7a–d). The SR ranged from 0.68 to 3.65, with an average of 1.71 ± 0.52. The aromaticity index SUVA254 ranged from 1.15 to 9.62, with an average of 3.90 ± 1.62 measured in L·mg−1·m−1 (Figure 7e,f).
The absorption of CDOM at certain wavelengths reveals the relative abundance of CDOM in the study area. There are two high-absorption areas at both 254 nm and 355 nm (UV absorptions) in the surface layer. One is near the CRE (station B3), and the other is near HZB (stations E1, E2 and CE3). At the bottom layer, the distribution of CDOM at 254 nm is similar to that at the surface layer. The highest SUVA254 values in the surface and bottom layers were found in the upper HZB, indicating that the DOM was highly aromatic under the influence of the Qiantang River Estuary (QRE) input.

3.3.2. FDOM Indices

The HIX values ranged from 0.41 to 2.93, with lower values near the upper HZB (Qiantang River Estuary) and Southern HZB (from stations E1 to E6 to ZJD12031), while higher values were recorded near the CRE (stations B3 to B8) (Figure 8a,b). The HIX values decreased gradually from the CRE to Southern HZB and from the northern lower bay to the upper bay.
The BIX values ranged from 0.95 to 1.26, with lowest values in bottom water near the CRE (stations B3, B4-0 and B4-1) and higher values in the Southern HZB (stations E1–E6) (Figure 8c,d). The BIX values increased spatially from the Changjiang Estuary southwestward to the Southern HZB and southeastward to the ZIR. The index ranges for salinity are supported in Figure S4.

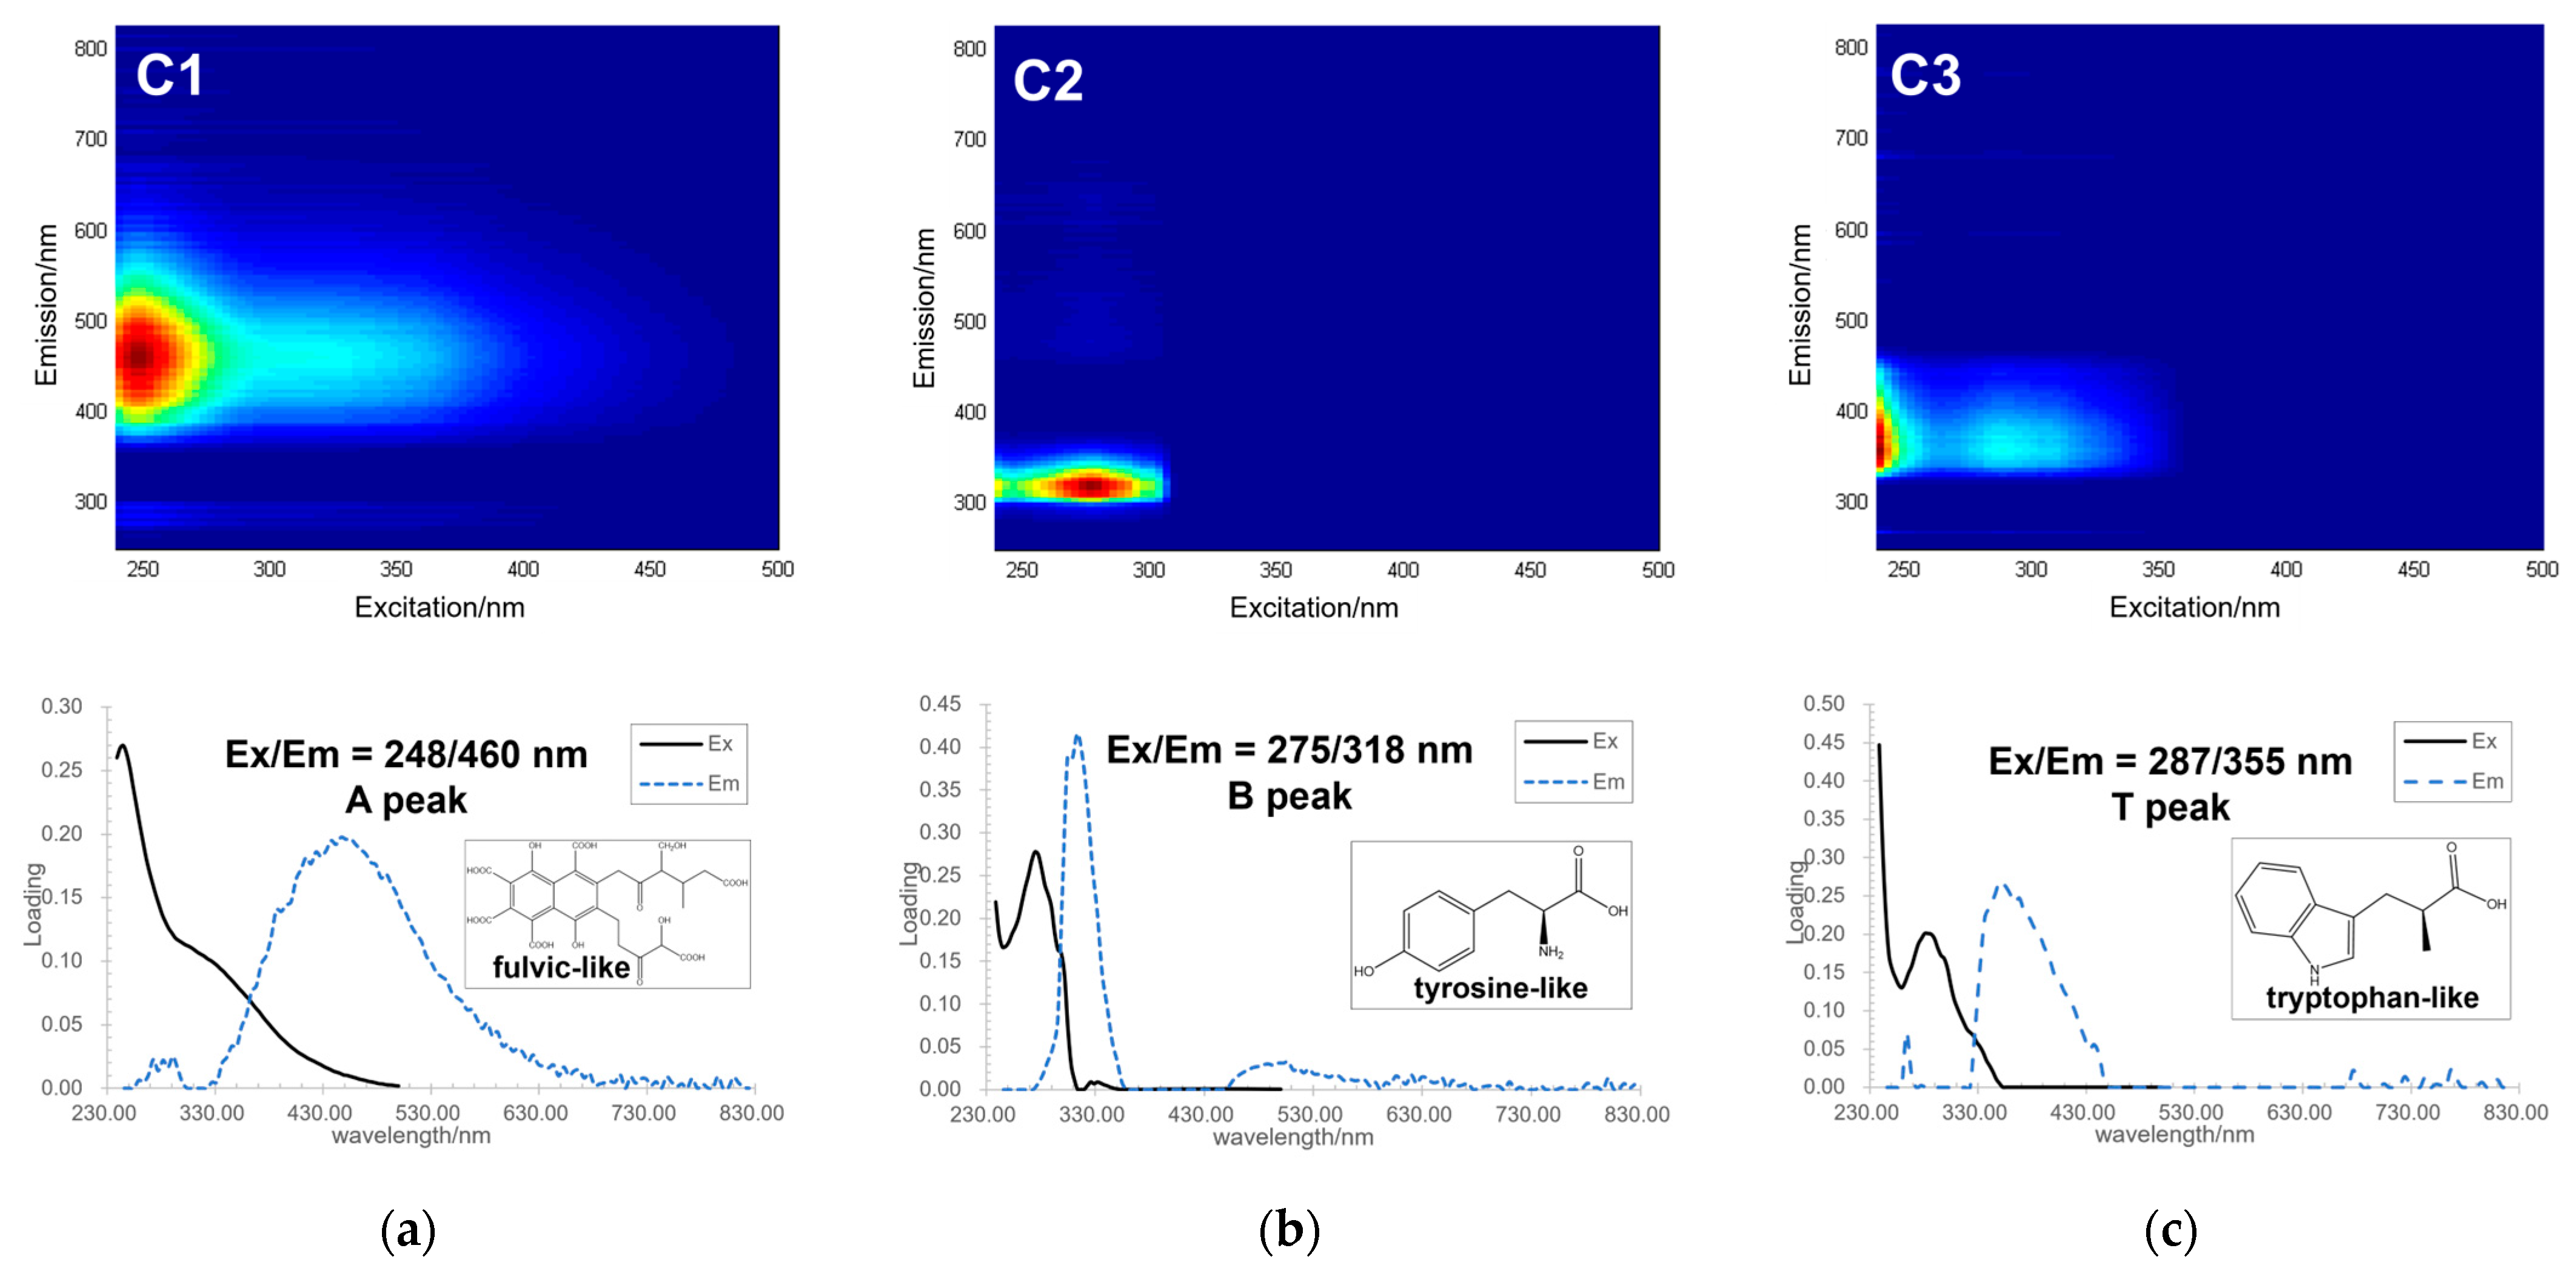
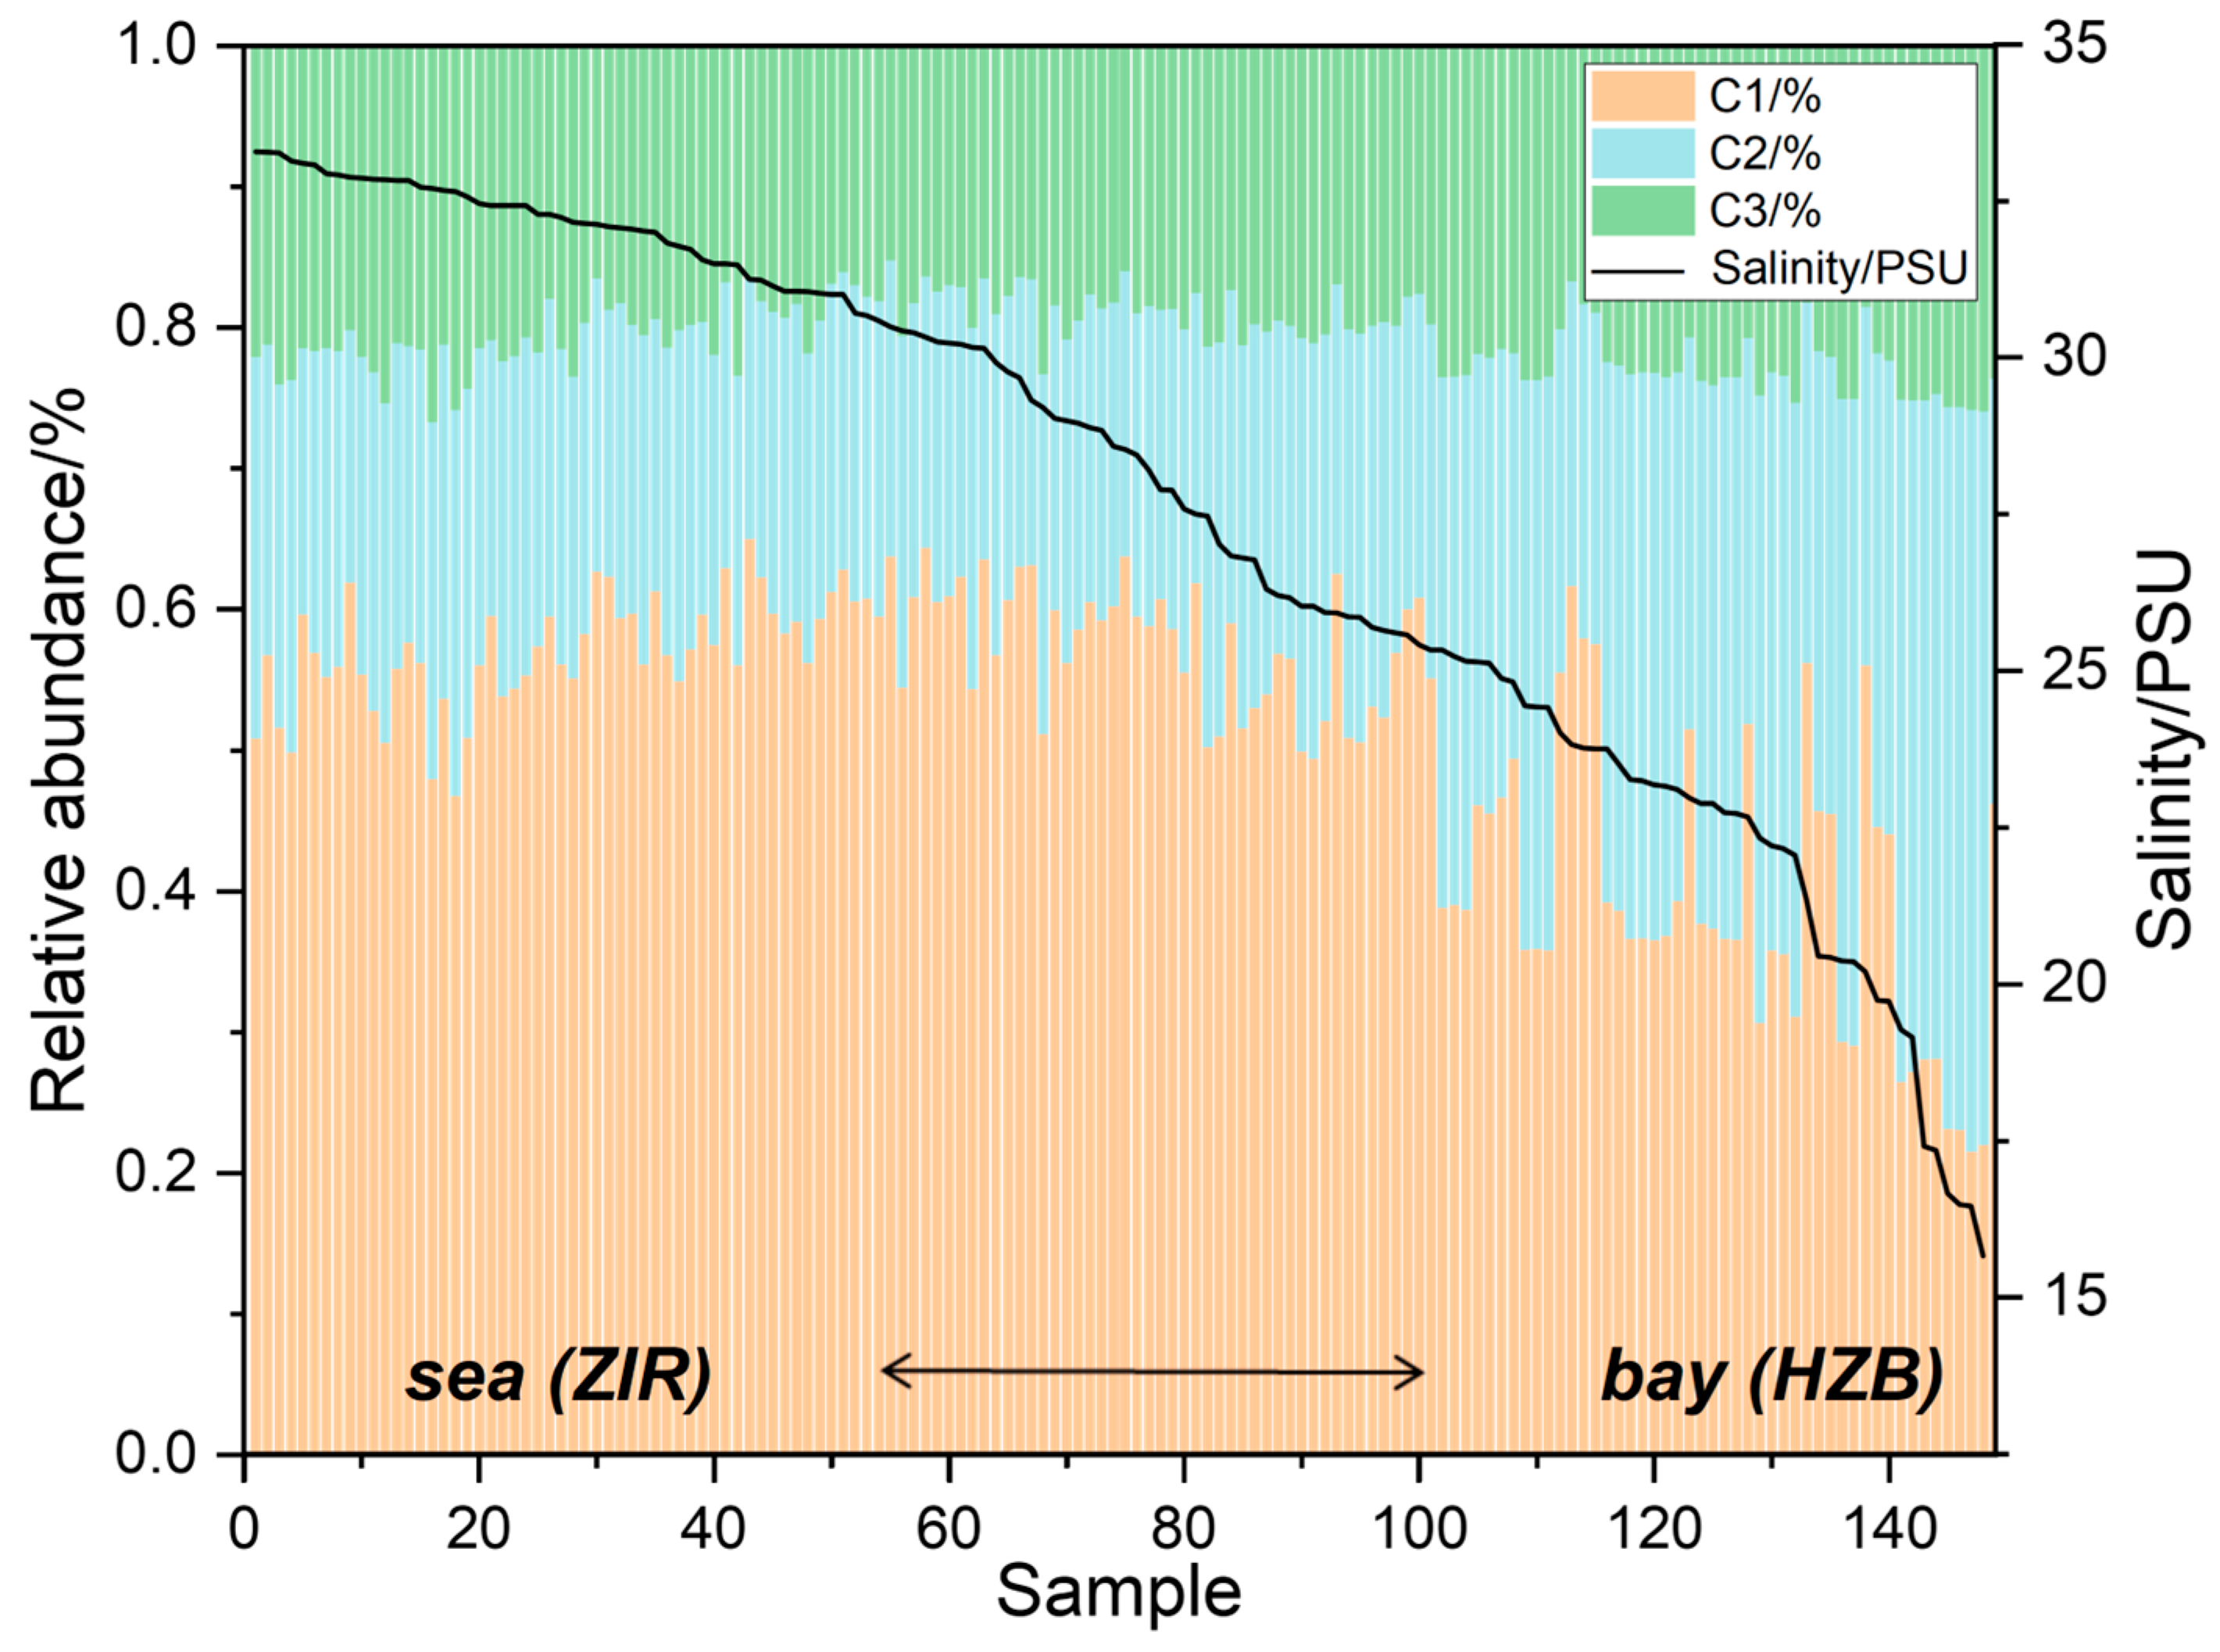
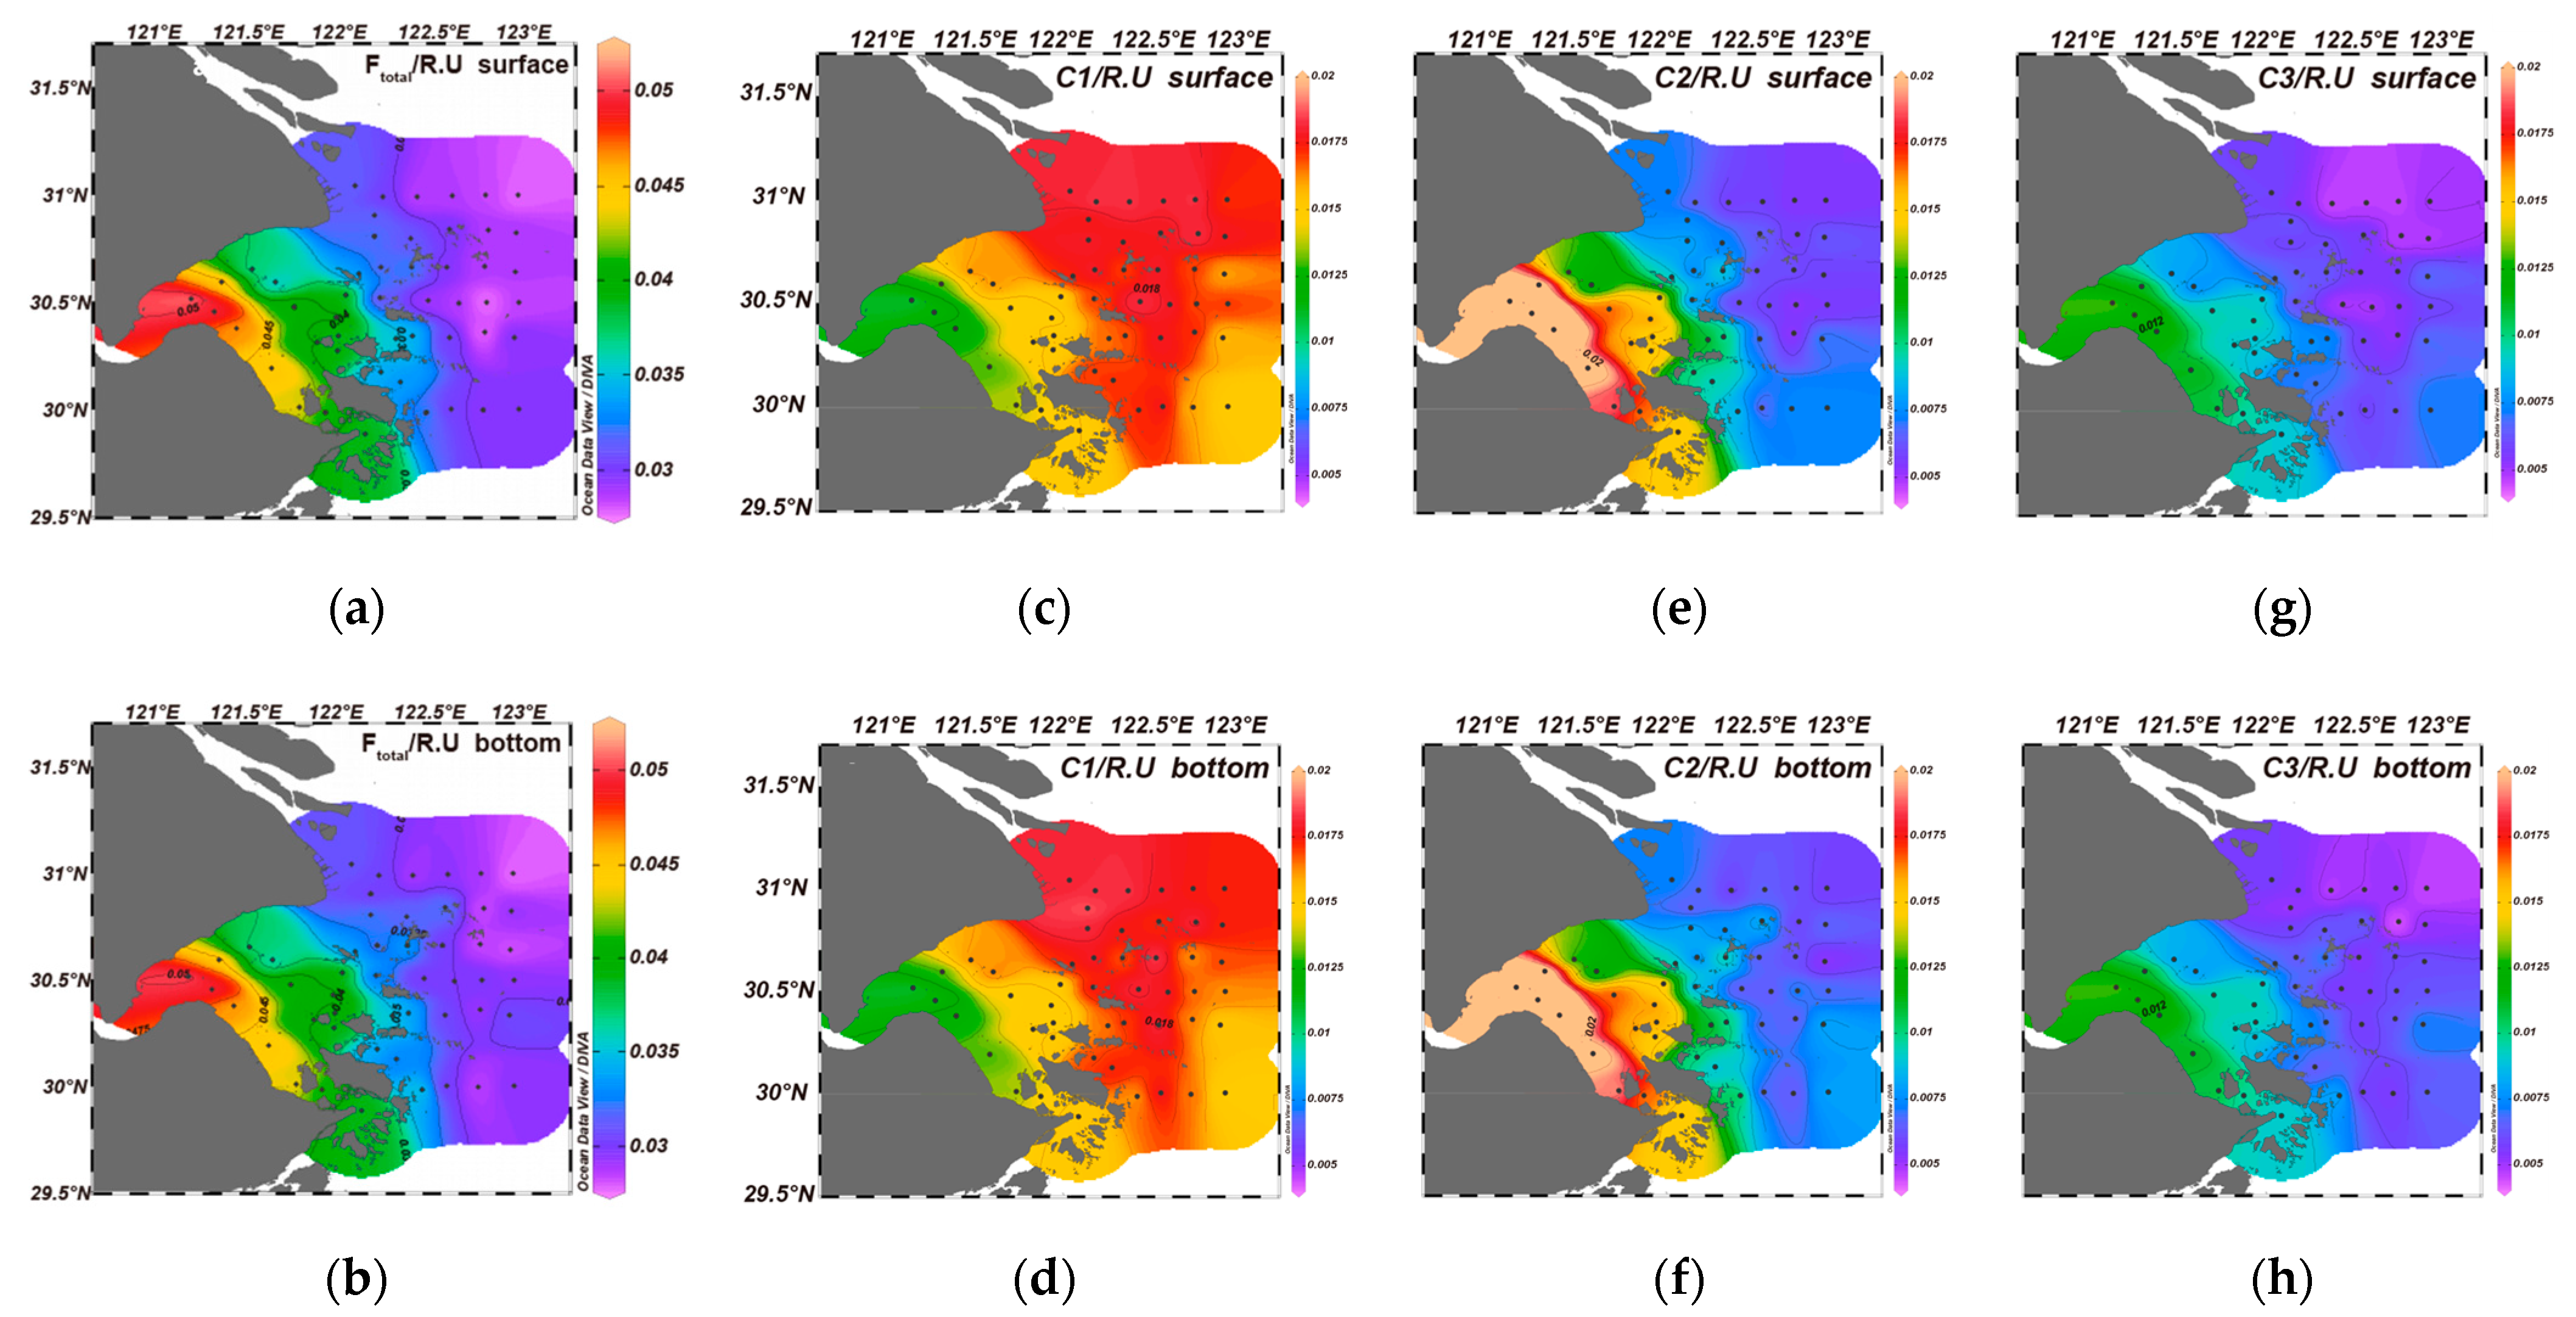
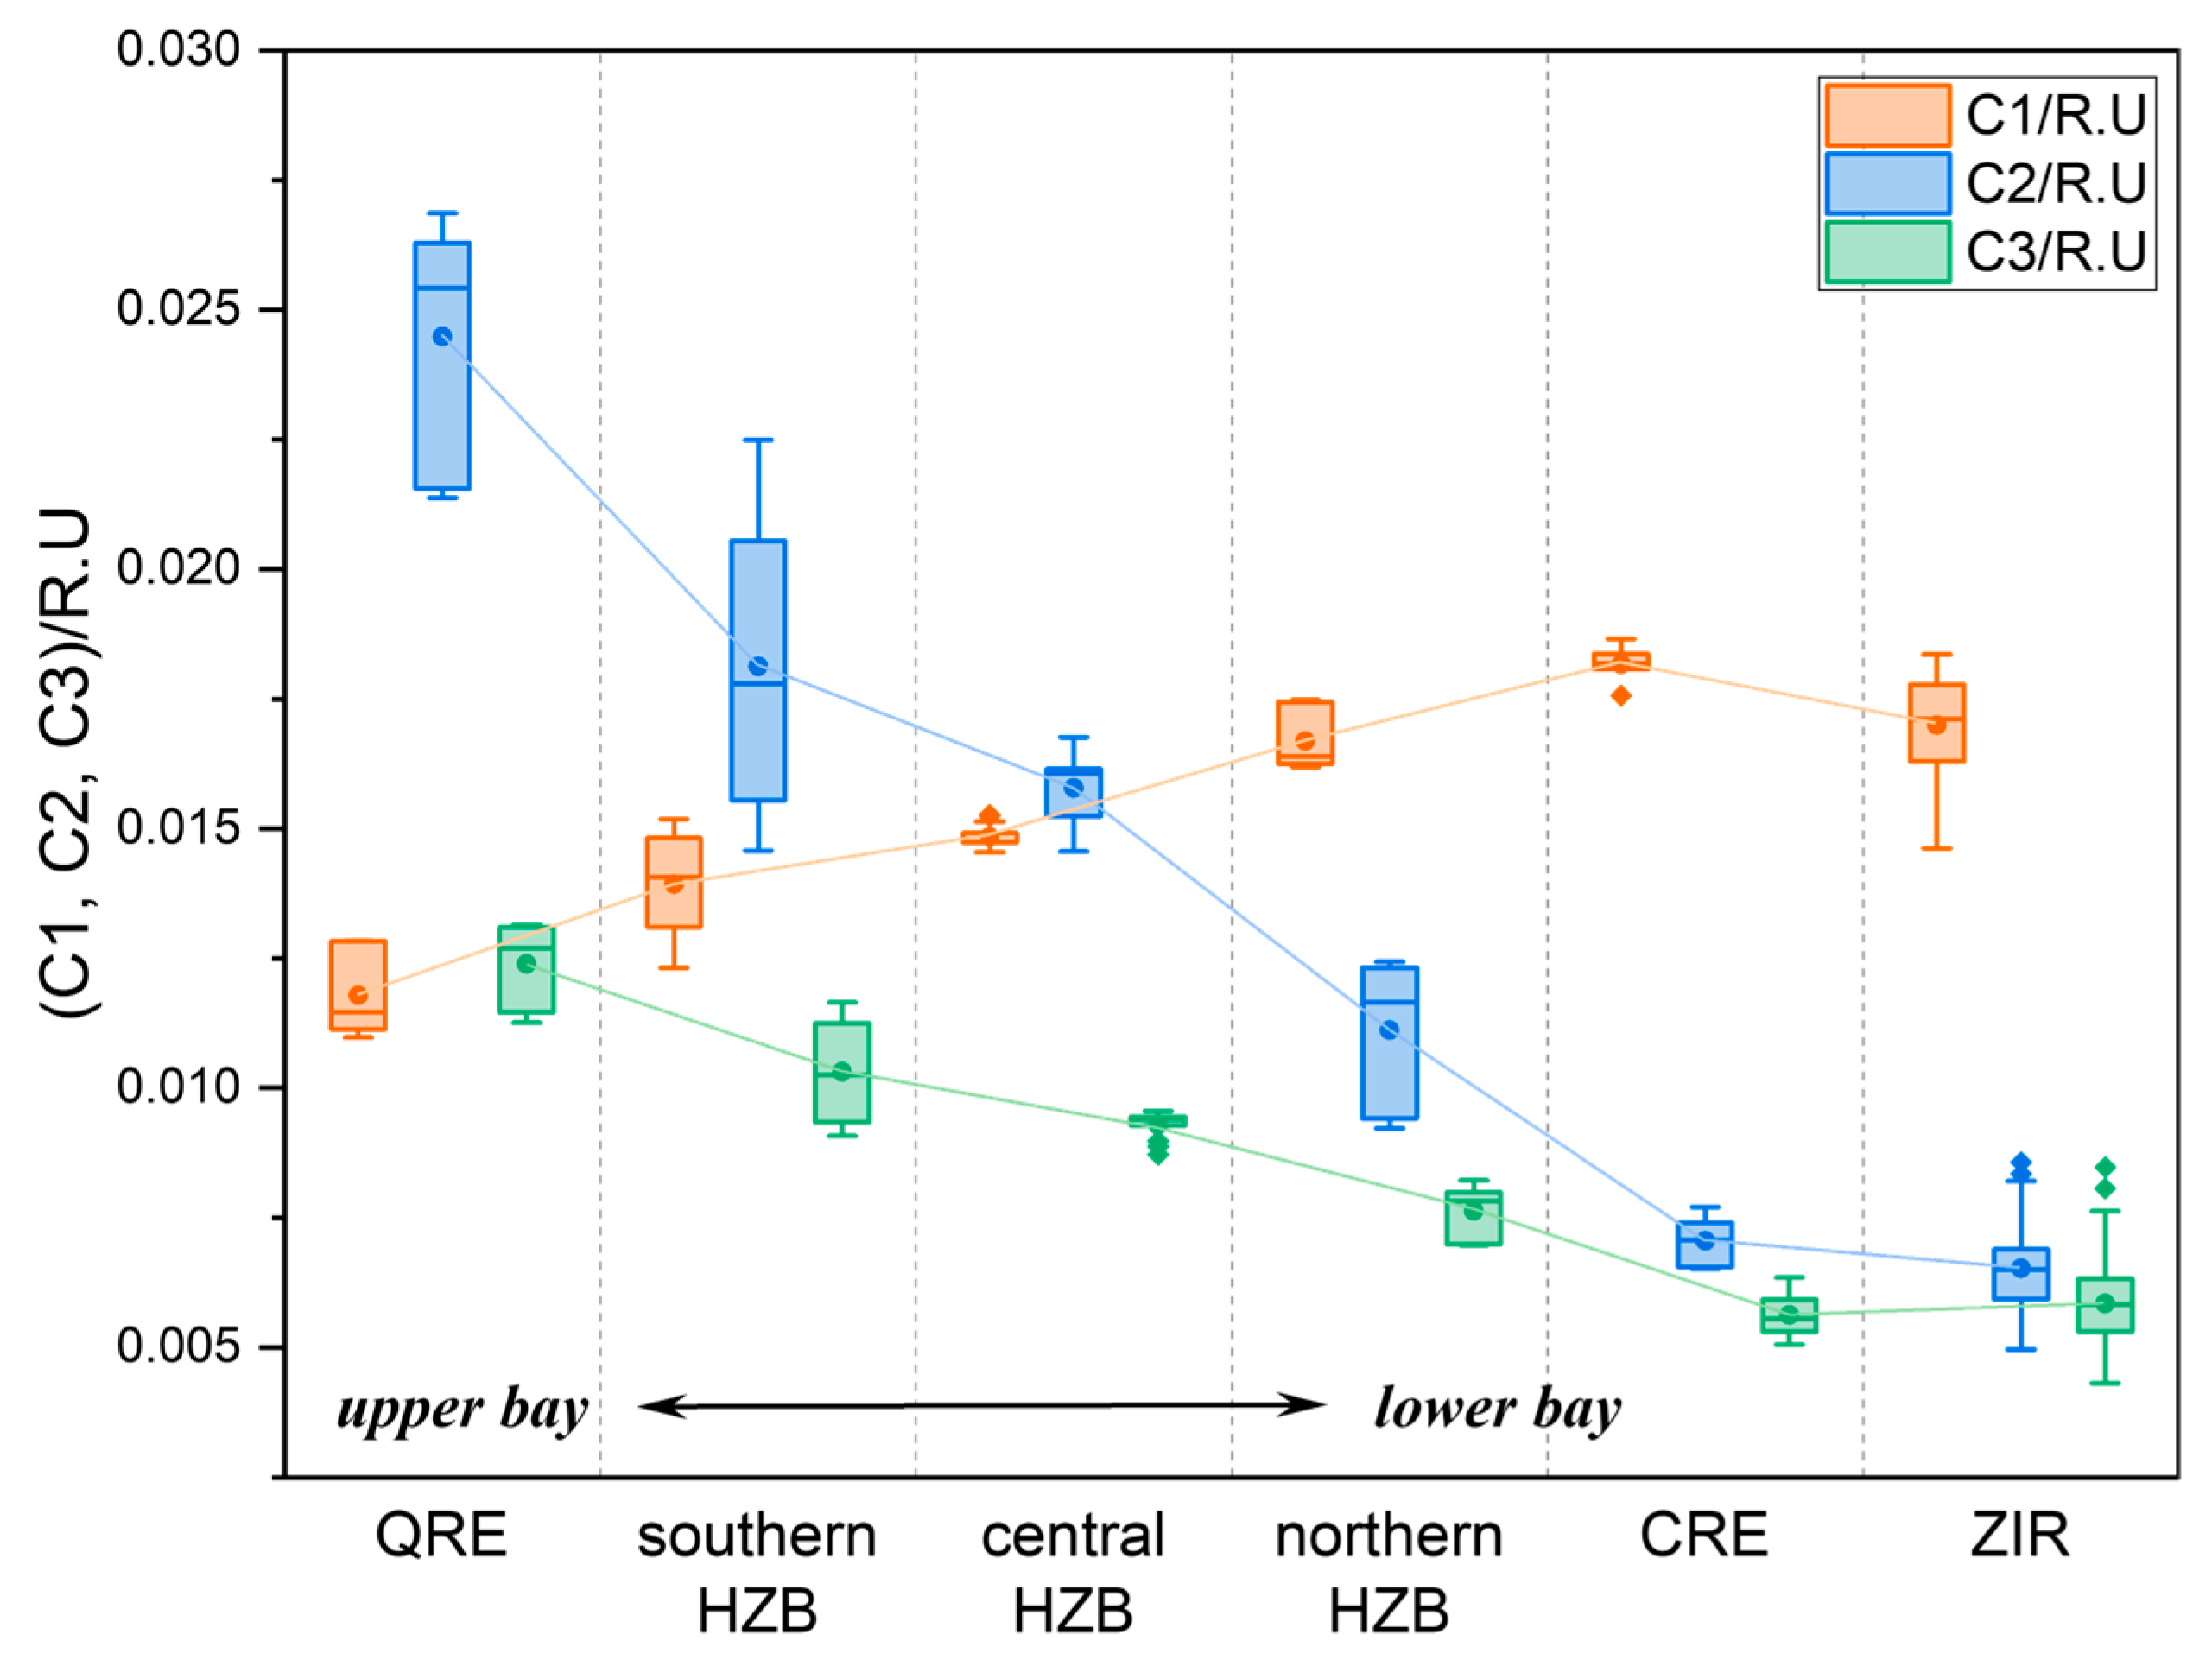
3.3.3. PARAFAC Analysis Results

Three fluorophore components were identified in the HZB and adjacent seas using PARAFAC (Figure 9), and they were compared with those found in previous studies in the OpenFluor database [45].
Component 1 (C1) displayed the excitation wavelength maxima (Ex) and emission wavelength maxima (Em) at 248 nm and 460 nm, respectively. C1 represents spectral characteristics similar to those of a UVC humic-like component (peak A) [13,46]. Compared with UVA humic-like matter (signature peak C), UVC humic-like DOM has a lighter molecular weight, lower aromaticity and stronger resistance to photodegradation [47].
Components 2 (C2) and 3 (C3) displayed an Ex/Em at 275/318 nm and 287/355 nm, respectively. A second Ex peak of C3 was observed at a wavelength less than 240 nm. Both C2 and C3 were identified as protein-like components. C2 shows typical features of tyrosine-like fluorescence (peak B), and C3 shows typical features of tryptophan-like fluorescence (peak T) [13,48].
Figure 9. The 3D fluorescence spectroscopy results, signature peaks (warm colors) of Ex/Em, and molecular characteristics [49] of the three FDOM components identified in the HZB and adjacent waters. (a) C1: Ex/Em = 248/460 nm, A peak; (b) C2: Ex/Em = 275/318 nm, B peak; (c) C3: Ex/Em = 287/355 nm, T peak.
Water 17 01590 g009
In total, the three components C1, C2 and C3 accounted for 34.7%, 41.5% and 23.8% in the HZB and 56.6%, 23.5% and 19.9% in the ZIR, respectively (Figure 10). The Ftotal (summary of C1 + C2 + C3) in the HZB and adjacent areas ranged from 0.0270 to 0.0510 R.U. The highest Ftotal values were concentrated in the QRE and upper HZB (Figure 11a,b). The Ftotal values of C1, C2 and C3 were 0.0110–0.0187, 0.0050–0.0269 and 0.0043–0.0131 R.U, with average values of 0.0165 ± 0.0016, 0.0096 ± 0.0050 and 0.0070 ± 0.0020 R.U, respectively. The C1 components were higher in the CDW-influenced areas, such as the CRE, the shelf sea area and lower HZB. The C2 and C3 components had the highest values near the QRE in the upper HZB. The distributions of C1, C2, and C3 in the HZB and adjacent sea are shown in Figure 11c–h. There is a strong positive correlation between the two protein-like components C2 and C3 (r2 = 0.93, p < 0.0001), while there is a strong negative correlation between the humic-like component C1 and protein-like component C2 when the salinity is lower than 27.5 (r2 = 0.96, p < 0.0001), as shown in Figure S3.

4. Discussion

4.1. Composition and Characteristics of DOM in the HZB and Adjacent Seas

The CDOM is a naturally occurring dissolved organic matter that absorbs UV light in water. The intensity of the UV absorption varies with the composition of CDOM, and it is often used in combination with FDOM to indicate the composition and characteristics of DOM [12]. Moreover, FDOM, i.e., DOM with fluorescence characteristics, also has UV–Vis absorption properties, and the absorption intensity could be represented by Ftotal (summary of C1 + C2 + C3 in unit R.U).
The absolute abundance of FDOM components C1, C2 and C3 in the Qiantang River Estuary (QRE), Hangzhou Bay (HZB), the Changjiang River Estuary (CRE) and the Zhoushan Islands Region (ZIR) showed distinct differences (Figure 12). In the QRE, the main components of DOM were C2 and C3. Then, these DOM decreased from the upper HZB to lower HZB (from the QRE to the CRE and the ZIR), as shown in Figure 12. Both C2 and C3 were identified as protein-like components [13]. C2 shows the typical features of tyrosine-like fluorescence., while C3 shows typical features of tryptophan-like fluorescence [49]. In this study, we analyzed the correlation between RFE corrected at 254 nm [50] and salinity (Figure S4). The result showed a significant positive correlation between the two parameters, indicating that the protein-like components were corrected by the primary production source. Figure S5b showed the biological index (BIX) varies with C2. C2 varied slightly with BIX and varied significantly in the HZB different areas, indicating human inputs of C2 as a possible source in HZB.
In contrast, the highest value of humic-like C1 was found in CRE as a high-value core, and then, it decreased from the CRE westward to the upper HZB and eastward to the ZIR, as shown in Figure 12. The three fluorescent components (C1–C3) were compared with the OpenFluor database [45]. C1 was associated with signatures similar to a photo-oxidized crude oil product [51]. It was associated with the terrestrial humic-like substance in Green Bay [52], a major component of porewater and bottom water in rivers [53], as well as leaf extracts in stream water [54], indicating that C1 is a terrestrial humic-like dissolved organic matter that has undergone photo-oxidization.
A high correlation (p < 0.0001) was revealed between HIX and component C1 (Figure S5), showing that the source of C1 mainly contributed to the degree of humification of DOM. This suggests that the DOC in CRE is dominated by the terrestrial input DOC with a high degree of humification. As Changjiang River carries large amounts of terrestrial materials into the CRE, the DOM in the CRE was mainly carried by Changjiang inputs with a high degree of humification.
Furthermore, the composition and characteristics of DOC indicated by other CDOM parameters and FDOM indices support the above results. Relatively low DOC concentrations, but with high a254 and SUVA254 values, were found in the upper HZB (the Qiantang River Estuary or QRE in Figure 6a,e), indicating that DOM in the QRE had higher UV absorption per C. Moreover, the highest values of a355 and Ftotal were found at the QRE (Figure 6b,c), indicating that the greatest relative abundance of CDOM and FDOM was in the QRE. The distributions of SUVA254, a355 and Ftotal jointly reflect the DOM molecular characteristics of the QTR source with high aromaticity, resulting in high UV absorption and high fluorescence excitation emission peaks. However, the highest DOC concentration with low SUVA254 was found at the CRE (Figure 6a,f). Compared to the DOM of QTW inputs, the DOM of CDW showed the characteristic of higher carbon amounts but lower aromaticity.
The FI is often used as a proxy for microbially modifying DOM [39], and the result (Figure 6g) indicated that the microbial modification in the QRE and Southern HZB was more significant than that in the CRE and the ZIR. The HIX is often used to indicate the humification degree of DOM [40]. Since the HIX is an indicator of humic substance content or extent of humification, the highest HIX in CRE (Figure 6h) indicated that an evident terrigenous humic-like DOM was carried by Changjiang River, and then, it spread from the CRE to the surrounding sea areas, including the lower HZB and the ZIR. The higher peak area of the HIX and lower peak area of the BIX in the CRE and Northern HZB showed a significant intrusion from CDW into HZB. The BIX is an indicator of autotrophic productivity, and higher values (>1) always correspond to recently produced DOM of autochthonous origin [41]. The BIX values in HZB (Figure 6i) indicated that the DOM from autotrophic productivity in the QRE and the southern bay was greater than those from the northern bay and the CRE. Although the average value of the BIX in the ZIR is almost equal to the value in the QRE, the significant difference in FI values indicated that there was a significant difference in DOM composition between these two regions, and the DOM in the QRE experienced strong microbial modification.
PCA of different characteristics and indices in HZB and the adjacent seas found two principal components (Figure 13). PC1, with 50.2%, represented positive correlations with CDOM UV absorption, protein-like FDOM (C2 and C3) and turbidity but negative correlations with salinity, the HIX and humic-like FDOM C1. PC1 was a principal component of short-wave absorption, small molecules, photodegradation and non-terrestrial sources. PC2, with 18.6%, represented positive correlations with turbidity and DOC but negative correlations with the BIX and the FI. PC2 was a principal component of freshness and biological modification. PC1 distinguished CRE and ZIR sources of DOM from HZB sources. Moreover, PC2 distinguished SSW from low-salinity, high-turbidity CDW and QTW masses. PCA clearly showed the obvious differences in DOM composition and characteristics in HZB and its adjacent areas.

4.2. Sources of DOM in HZB

Generally, DOM can be divided into autochthonous and allochthonous DOM according to the initial source. The autochthonous source includes phytoplankton synthesis in surface water and the transport of benthic organisms by upwellings. Moreover, autochthonous DOM can come from POM transportation and microbial lysis. Autochthonous DOM have a lower molecular weight, aromaticity and higher UV–Vis absorption in general. In contrast, the allochthonous source includes soil precipitation and plant metabolite leaching as terrestrial sources, as well as pollution sources produced via human activity. The allochthonous DOM may have higher molecular weight, higher aromaticity and be easily photodegraded [55,56].
The humic-like components were mainly terrestrial inputs in bays, estuaries and coastal waters, taking studies in Xiangshan Bay, Changjiang River Estuary and Shelf East China Sea as examples [18,20,22]. The protein-like component DOM is marine autochthonous DOM, which is derived from phytoplankton production. In general, from the bay to the sea, with an increase in salinity, the DOM would be gradually dominated by the in situ-produced composition [57].
It is known that the characteristics of DOM in CRE are mainly modulated by input of the terrestrial DOM. Moreover, the CDW contributes terrestrial, humic-like DOM to the ECS [20]. However, the DOM contribution of CDW invasion into HZB in the winter season remains unclear. In our results, the compositions of DOM in HZB showed contributions from different DOM sources. The highest values of C1 in the CRE and C2 and C3 in the QRE supported the idea that different FDOM composition features could be used to distinguish the sources of DOM in waters in different regions of HZB.
The distinct differences in FDOM components in HZB and its adjacent areas were discussed in Section 4.1. The result, combined with the water mass characteristics, could be used to indicate DOM sources in HZB. The DOM in HZB composed of different sources is controlled by the three different water masses of the QTW, CDW and SSW. Among them, the QTW has the lowest humic-like C1 component due to the modification of high Chl-a linked DOM, and it displays the highest protein-like C2 component of DOM in the upper HZB. In the upper bay near the QRE (stations E1, E2, CE3, E3 and E4), the main component of DOM is C2, and next is C3, the protein-like DOM. Previous studies showed that the Qiantang River carries a mixture of terrestrial humic-rich and anthropogenic protein-rich CDOM and contributes primarily to the CDOM in the upper bay [19]. Moreover, the values of protein-like components in FDOM are notably higher (from 23% up to 90%) than those of the other components in typical bays in China [18]. The main components are either derived from the synthesis of algal production or human sewage discharge [58]. These studies support our results that the highest C2 abundance was in the upper HZB near the QRE and the possible sources of protein-like DOM.
Water samples with turbidity greater than 300 FTU were found in HZB and the CRE areas in winter 2024 (Figure 2b), representing resuspension and material transportation highly influenced by both the CDW and QTW. Water samples in the ZIR had turbidity less than 300 FTU in winter 2024 (Figure 3e,f). It has been reported that the compositions of fluorescent DOM changes with both the salinity and tidal level in the Qiantang River (from 120.1 °E to 121.3 °E, Zhijiang to Zhapu) [19]. In the HZB (from 121.2 °E to 122.1 °E, QRE to HZB mouth) in this study, the turbidity values were very high and varied slightly in the surface and bottom layers (Figure 3a), which showed the strong sediment resuspension and thorough mixing of water layers [59].
Turbidity has been shown to be significantly resistant to the photodegradation and photobleaching of DOM in the bay and estuary [60]. Moreover, the SR is used to indicate the molecular weight (M.W) of DOM. Higher SR ratios indicate small M.W on average. The molecular weight decreased with the DOM decomposition process. Therefore, the SR can not only indicate the characteristics and sources of different kinds of DOM but also indicate the degradation degree of the same species of DOM [32]. In this study, the SR was higher in the ZIR than the CRE and HZB areas (Figure 6d), which indicated that, in SSW with low turbidity, photodegradation happened obviously in the humic-like C1 DOM component.
It has been shown that, besides Qiantang freshwater (QTW), HZB received more than half of its materials from the CDW, which flowed into Hangzhou Bay from the north and left via the southern part of the bay [25]. Therefore, as water mass is the carrier of DOM, the CDW should have contributed to the DOM sources in HZB in the winter, along with humic-like C1 DOM signal invasion. In our results, CDW showed the highest humic-like C1 component due to the strong effects of Changjiang terrestrial DOM inputs. SSW shows the high salinity and medium value of C1. The DOM composition in the northern bay is a mixture of QTW and CDW, with CDW being present in a higher proportion. The DOM composition in the central and southern bay was controlled by the mixing of these three water masses. In Southern HZB (blue dashed section in Figure 1b, Figure 2a and Figure 13), the C1 abundance and salinity (S) showed a significant positive relationship conforming to the formula C1 = 4.18 × 10⁻⁴ × S + 4.44 × 10⁻³ (R2 = 0.9862, blue dashed line in Figure 14), but the line was not on the mixing line of QTW and SSW. This further confirms the contribution of the mixing of the three water masses.
The C1 abundance and salinity in the ZIR (salinity > 27.5, red SSW area in Figure 1b, Figure 2a and Figure 13) conform to the following formula: C1 = −3.49 × 10⁻⁵ × S2 + 1.77 × 10⁻³ × S − 4.23 × 10⁻³ (R2 = 0.5803, red curve in Figure 14). The DOM composition in the ZIR is controlled by the nonlinear mixing of CDW and SSW. This is a reasonable outcome, since the CDW is a mixed water mass made up of Changjiang fresh water and ECS shelf water.

5. Conclusions

The dissolved organic carbon (DOC) concentrations ranged from 69.2 to 179.2 μmol/L in Hangzhou Bay (HZB) and its adjacent seas, with the highest values recorded in the Changjiang River Estuary (CRE) in winter 2024. The high humification index (HIX), low biological index (BIX) and low specific ultraviolet absorbance at 254 nm (SUVA254) in Changjiang Diluted Water (CDW) indicated that the terrestrial C1 is characterized by high humification, high molecular weight and low aromaticity because of photodegradation. The high HIX was found in northern HZB (lower bay), while the high BIX was found in Southern HZB. Dissolved organic matter (DOM) coming directly from the Changjiang River made a relatively high contribution to DOM in HZB in the winter. A three-component model was designed via parallel factor analysis (PARAFAC) in the study area, including one humic-like C1 and two protein-like C2 and C3. The highest C1 component was detected in the CRE, indicating high terrestrial DOM carried by Changjiang River into the CRE, while high values of protein-like C2 and C3 components were found in the QRE at the upper HZB. The compositions, sources and mixing behavior of DOM in HZB were determined by three different water masses (CDW, QTW and SSW). The terrestrial DOM transported via CDW intrusion accounted for a large proportion of the DOM in Northern HZB, while the DOC in Central and Southern HZB shows the mixed characteristics of the three water masses. The composition of DOC in the ZIR indicates the mixed sources of CDW and SSW. Our results reveal that DOC compositions can be effectively discriminated against by their spectral characteristics, providing valid insights for investigating offshore carbon cycling and tracing carbon transformation processes.

Supplementary Materials

The following supporting information can be downloaded at https://www.mdpi.com/article/10.3390/w17111590/s1: Figure S1: A comparison of the results of PARAFAC between the 4-component model and the 3-component model for parameters, residuals, auxiliary and the split-half test; Figure S2: Surface distributions of CDOM absorption coefficients in different wavelengths ranging from 254 nm to 460 nm; Figure S3: Pearson correlations analysis of DOC concentrations, CDOM absorptions at different wavelengths and abundance of the three FDOM components; Figure S4: FDOM indices varying with the salinity in the HZB and adjacent seas in winter 2024; Figure S5: FDOM indices varying with different components divided via PARAFAC; Figure S6: FDOM components of protein-like C2 along the salinity gradient in the HZB and adjacent seas in winter 2024.

Author Contributions

Conceptualization, H.J. and Z.J.; methodology, C.W., P.Y. and B.W.; validation, Y.L., N.Y. and Y.X.; investigation, Q.L., C.W. and Y.L.; data curation, C.W. and D.L.; writing—original draft preparation, C.W. and H.J.; writing—review and editing, H.J., Y.X., L.C. and D.L.; supervision, H.J.; project administration, H.J. and B.W.; funding acquisition, H.J. and Y.X. All authors have read and agreed to the published version of the manuscript.

Funding

This research was funded by Zhejiang Provincial Natural Science Foundation of China, grant number LD24D060001; the Science Foundation of Donghai Laboratory, grant number DH-2022ZY0006; Scientific Research Fund of the Second Institute of Oceanography, MNR, grant number JB2405; the Key R&D Program of Zhejiang, grant number 2023C03120; the Ocean Negative Carbon Emissions (ONCE) Program and Long Term Observation and Research Plan in the CE and the Adjacent ECS Project, grant number QNYJ2203.

Data Availability Statement

The raw data supporting the conclusions of this article will be made available by the authors on request.

Acknowledgments

We thank all the crew members for their help in collecting samples during the survey. We also thank our colleagues from the Second Institute of Oceanography, MNR, for providing the following support: Jiang Zhihao for CTD data, Jiang Peiwen and Bi Shuqing for TSM handling and Hu Ji for providing the technical support during fluorescence spectrofluorometer analysis.

Conflicts of Interest

The authors declare no conflicts of interest. The funders had no role in the design of the study; in the collection, analyses or interpretation of the data; in the writing of the manuscript or in the decision to publish the results.

Abbreviations

The following abbreviations are used in this manuscript:
DOMDissolved organic matter
CDOMChromophoric dissolved organic matter
FDOMFluorescent dissolved organic matter
DOCDissolved organic carbon
TSMThe total suspended matter
HZBHangzhou Bay
QREQiantang River Estuary
CREChangjiang River Estuary
ZIRZhoushan Islands region
ECSEast China Sea
QTWQiantang Estuary water
CDWChangjiang diluted water
SSWShelf seawater
FIThe fluorescence index
HIXThe humification index
BIXThe biological index
EEMsExcitation emission matrices
PARAFACParallel factor analysis
PCAPrincipal component analysis

References

  1. Hajima, T.; Kawamiya, M.; Ito, A.; Tachiiri, K.; Jones, C.D.; Arora, V.; Brovkin, V.; Séférian, R.; Liddicoat, S.; Friedlingstein, P.; et al. Consistency of global carbon budget between concentration- and emission-driven historical experiments simulated by CMIP6 Earth system models and suggestions for improved simulation of CO2 concentration. Biogeosciences 2025, 22, 1447–1473. [Google Scholar] [CrossRef]
  2. Bauer, J.E.; Cai, W.; Raymond, P.A.; Bianchi, T.S.; Hopkinson, C.S.; Regnier, P.A.G. The changing carbon cycle of the coastal ocean. Nature 2013, 504, 61–70. [Google Scholar] [CrossRef]
  3. Cai, W. Estuarine and Coastal Ocean Carbon Paradox: CO2 Sinks or Sites of Terrestrial Carbon Incineration. Annu. Rev. Mar. Sci. 2011, 3, 123. [Google Scholar] [CrossRef]
  4. Dai, M.; Su, J.; Zhao, Y.; Hofmann, E.E.; Cao, Z.; Cai, W.; Gan, J.; Lacroix, F.; Laruelle, G.G.; Meng, F.; et al. Carbon fluxes in the coastal ocean: Synthesis, boundary processes, and future trends. Annu. Rev. Earth Planet. Sci. 2022, 50, 593–626. [Google Scholar] [CrossRef]
  5. Wetzel, R.G. Death, detritus, and energy-flow in aquatic ecosystems. Freshw. Biol. 1995, 33, 83–89. [Google Scholar] [CrossRef]
  6. Zigah, P.K.; McNichol, A.P.; Xu, L.; Johnson, C.; Santinelli, C.; Karl, D.M.; Repeta, D.J. Allochthonous sources and dynamic cycling of ocean dissolved organic carbon revealed by carbon isotopes. Geophys. Res. Lett. 2017, 44, 2407–2415. [Google Scholar] [CrossRef]
  7. Du, Y.; Zhang, Q.; Liu, Z.; He, H.; Lurling, M.; Chen, M.; Zhang, Y. Composition of dissolved organic matter controls interactions with La and Al ions: Implications for phosphorus immobilization in eutrophic lakes. Environ. Pollut. 2019, 248, 36–47. [Google Scholar] [CrossRef]
  8. Stubbins, A.; Spencer, R.G.M.; Chen, H.; Hatcher, P.G.; Mopper, K.; Hernes, P.J.; Mwamba, V.L.; Mangangu, A.M.; Wabakanghanzi, J.N.; Six, J. Illuminated darkness: Molecular signatures of Congo River dissolved organic matter and its photochemical alteration as revealed by ultrahigh precision mass spectrometry. Limnol. Oceanogr. 2010, 55, 1467–1477. [Google Scholar] [CrossRef]
  9. Hernes, P.J.; Benner, R. Photochemical and microbial degradation of dissolved lignin phenols: Implications for the fate of terrigenous dissolved organic matter in marine environments. J. Geophys. Res.-Ocean. 2003, 108, 3291. [Google Scholar] [CrossRef]
  10. Repeta, D.J. Chemical Characterization and Cycling of Dissolved Organic Matter. In Biogeochemistry of Marine Dissolved Organic Matter, 2nd ed.; Elsevier: Amsterdam, The Netherlands, 2015; pp. 21–63. [Google Scholar]
  11. Hansell, D.A.; Carlson, C.A. Biogeochemistry of Marine Dissolved Organic Matter, 2nd ed.; Elsevier: Amsterdam, The Netherlands, 2015. [Google Scholar]
  12. Hansen, A.M.; Kraus, T.E.C.; Pellerin, B.A.; Fleck, J.A.; Downing, B.D.; Bergamaschi, B.A. Optical properties of dissolved organic matter (DOM): Effects of biological and photolytic degradation. Limnol. Oceanogr. 2016, 61, 1015–1032. [Google Scholar] [CrossRef]
  13. Coble, P.G. Characterization of marine and terrestrial DOM in seawater using excitation-emission matrix spectroscopy. Mar. Chem. 1996, 51, 325–346. [Google Scholar] [CrossRef]
  14. Stedmon, C.A.; Bro, R. Characterizing dissolved organic matter fluorescence with parallel factor analysis: A tutorial. Limnol. Oceanogr.-Methods 2008, 6, 572–579. [Google Scholar] [CrossRef]
  15. Yu, H.; Liang, H.; Qu, F.; Han, Z.-S.; Shao, S.; Chang, H.; Li, G. Impact of dataset diversity on accuracy and sensitivity of parallel factor analysis model of dissolved organic matter fluorescence excitation-emission matrix. Sci. Rep. 2015, 5, 10207. [Google Scholar] [CrossRef]
  16. Liu, D.; Nie, L.; Xi, B.; Gao, H.; Yang, F.; Yu, H. A novel-approach for identifying sources of fluvial DOM using fluorescence spectroscopy and machine learning model. npj Clean Water 2024, 7, 79. [Google Scholar] [CrossRef]
  17. Liang, W.; Chen, X.; Chen, Z.L.; Zhu, P.; Huang, Z.; Li, J.; Wang, Y.; Li, L.; He, D. Unraveling the impact of Spartina alterniflora invasion on greenhouse gas production and emissions in coastal saltmarshes: New insights from dissolved organic matter characteristics and surface-porewater interactions. Water Res. 2024, 262, 122120. [Google Scholar] [CrossRef]
  18. Zhao, C.; Zhou, Y.; Pang, Y.; Zhang, Y.; Huang, W.; Wang, Y.; He, D. The optical and molecular signatures of DOM under the eutrophication status in a shallow, semi-enclosed coastal bay in southeast China. Sci. China Earth Sci. 2021, 64, 1090–1104. [Google Scholar] [CrossRef]
  19. Zhou, Y.; Li, Y.; Yao, X.; Ding, W.; Zhang, Y.; Jeppesen, E.; Zhang, Y.; Podgorski, D.C.; Chen, C.; Ding, Y.; et al. Response of chromophoric dissolved organic matter dynamics to tidal oscillations and anthropogenic disturbances in a large subtropical estuary. Sci. Total Environ. 2019, 662, 769–778. [Google Scholar] [CrossRef]
  20. Zhou, Y.; He, D.; He, C.; Li, P.; Fan, D.; Wang, A.; Zhang, K.; Chen, B.; Zhao, C.; Wang, Y.; et al. Spatial changes in molecular composition of dissolved organic matter in the Yangtze River Estuary: Implications for the seaward transport of estuarine DOM. Sci. Total Environ. 2021, 759, 143531. [Google Scholar] [CrossRef]
  21. Li, D.; Chen, J.; Wang, B.; Jin, H.; Shou, L.; Lin, H.; Miao, Y.; Sun, Q.; Jiang, Z.; Meng, Q.; et al. Hypoxia Triggered by Expanding River Plume on the East China Sea Inner Shelf During Flood Years. J. Geophys. Res. Ocean. 2024, 129, e2024JC021299. [Google Scholar] [CrossRef]
  22. Guo, J.; Liang, S.; Wang, X.; Pan, X. Distribution and dynamics of dissolved organic matter in the Changjiang Estuary and adjacent sea. J. Geophys. Res. Biogeosci. 2021, 126, e2020JG006161. [Google Scholar] [CrossRef]
  23. Chen, C.T.A. Rare northward flow in the Taiwan Strait in winter: A note. Cont. Shelf Res. 2003, 23, 387–391. [Google Scholar] [CrossRef]
  24. Che, Y.; He, Q.; Lin, W.Q. The distributions of particulate heavy metals and its indication to the transfer of sediments in the Changjiang Estuary and Hangzhou Bay, China. Mar. Pollut. Bull. 2003, 46, 123–131. [Google Scholar] [CrossRef]
  25. Xu, F.; Ji, Z.; Wang, K.; Jin, H.; Loh, P.S. The Distribution of Sedimentary Organic Matter and Implication of Its Transfer from Changjiang Estuary to Hangzhou Bay, China. Open J. Mar. Sci. 2016, 06, 103–114. [Google Scholar] [CrossRef]
  26. Li, M.; Wang, B.; Li, Y.; Li, D.; Zhang, Y.; Yang, Z.; Chen, Q.; Huang, W.; Zhu, Y.; Zeng, J.; et al. Influence of suspended particulate matters on P dynamics and eutrophication in the highly turbid estuary: A case study in Hangzhou Bay, China. Mar. Pollut. Bull. 2024, 207, 116793. [Google Scholar] [CrossRef]
  27. Yang, Z.; Chen, J.; Jin, H.; Li, H.; Ji, Z.; Li, Y.; Wang, B.; Cao, Z.; Chen, Q. Tracing nitrate sources in one of the world’s largest eutrophicated bays (Hangzhou Bay): Insights from nitrogen and oxygen isotopes. Acta Oceanol. Sin. 2024, 43, 86–95. [Google Scholar] [CrossRef]
  28. Benner, R.; Strom, M. A critical evaluation of the analytical blank associated with DOC measurements by high-temperature catalytic oxidation. Mar. Chem. 1993, 41, 153–160. [Google Scholar] [CrossRef]
  29. Pegau, W.S.; Gray, D.; Zaneveld, J.R. Absorption and attenuation of visible and near-infrared light in water: Dependence on temperature and salinity. Appl. Opt. 1997, 36, 6035–6046. [Google Scholar] [CrossRef]
  30. Li, P.; Chen, L.; Zhang, W.; Huang, Q. Spatiotemporal distribution, sources, and photobleaching imprint of dissolved organic matter in the Yangtze Estuary and its adjacent sea using fluorescence and parallel factor analysis. PLoS ONE 2015, 10, e0130852. [Google Scholar] [CrossRef]
  31. Twardowski, M.S.; Boss, E.; Sullivan, J.M.; Donaghay, P.L. Modeling the spectral shape of absorption by chromophoric dissolved organic matter. Mar. Chem. 2004, 89, 69–88. [Google Scholar] [CrossRef]
  32. Helms, J.R.; Stubbins, A.; Ritchie, J.D.; Minor, E.C.; Kieber, D.J.; Mopper, K. Absorption spectral slopes and slope ratios as indicators of molecular weight, source, and photobleaching of chromophoric dissolved organic matter. Limnol. Oceanogr. 2008, 53, 955–969. [Google Scholar] [CrossRef]
  33. Traina, S.J.; Novak, J.; Smeck, N.E. An ultraviolet absorbance method of estimating the percent aromatic carbon content of humic acids. J. Environ. Qual. 1990, 19, 151–153. [Google Scholar] [CrossRef]
  34. Weishaar, J.L.; Aiken, G.R.; Bergamaschi, B.A.; Fram, M.S.; Fujii, R.; Mopper, K. Evaluation of specific ultraviolet absorbance as an indicator of the chemical composition and reactivity of dissolved organic carbon. Environ. Sci. Technol. 2003, 37, 4702–4708. [Google Scholar] [CrossRef]
  35. Larsson, T.; Wedborg, M.; Turner, D. Correction of inner-filter effect in fluorescence excitation-emission matrix spectrometry using Raman scatter. Anal. Chim. Acta 2007, 583, 357–363. [Google Scholar] [CrossRef]
  36. Zepp, R.G.; Sheldon, W.M.; Moran, M.A. Dissolved organic fluorophores in southeastern US coastal waters: Correction method for eliminating Rayleigh and Raman scattering peaks in excitation-emission matrices. Mar. Chem. 2004, 89, 15–36. [Google Scholar] [CrossRef]
  37. Lawaetz, A.J.; Stedmon, C.A. Fluorescence intensity calibration using the Raman scatter peak of water. Appl. Spectrosc. 2009, 63, 936–940. [Google Scholar] [CrossRef]
  38. Cory, R.M.; McNeill, K.; Cotner, J.P.; Amado, A.; Purcell, J.M.; Marshall, A.G. Singlet Oxygen in the Coupled Photochemical and Biochemical Oxidation of Dissolved Organic Matter. Environ. Sci. Technol. 2010, 44, 3683–3689. [Google Scholar] [CrossRef]
  39. McKnight, D.M.; Boyer, E.W.; Westerhoff, P.K.; Doran, P.T.; Kulbe, T.; Andersen, D.T. Spectrofluorometric characterization of dissolved organic matter for indication of precursor organic material and aromaticity. Limnol. Oceanogr. 2001, 46, 38–48. [Google Scholar] [CrossRef]
  40. Ohno, T. Fluorescence inner-filtering correction for determining the humification index of dissolved organic matter. Environ. Sci. Technol. 2002, 36, 742–746. [Google Scholar] [CrossRef]
  41. Huguet, A.; Vacher, L.; Relexans, S.; Saubusse, S.; Froidefond, J.M.; Parlanti, E. Properties of fluorescent dissolved organic matter in the Gironde Estuary. Org. Geochem. 2009, 40, 706–719. [Google Scholar] [CrossRef]
  42. Wu, H.; Shen, J.; Zhu, J.; Zhang, J.; Li, L. Characteristics of the Changjiang plume and its extension along the Jiangsu Coast. Cont. Shelf Res. 2014, 76, 108–123. [Google Scholar] [CrossRef]
  43. Guo, W.; Wang, C.; Xu, J.; Jiao, T.; Lin, Z. A review on the spectral analysis of marine organic matter. Mar. Sci. Bull. 2018, 37, 601–614. [Google Scholar]
  44. Martínez-Pérez, A.M.; Nieto-Cid, M.; Osterholz, H.; Catalá, T.S.; Reche, I.; Dittmar, T.; Álvarez-Salgado, X.A. Linking optical and molecular signatures of dissolved organic matter in the Mediterranean Sea. Sci. Rep. 2017, 7, 3436. [Google Scholar] [CrossRef]
  45. Murphy, K.R.; Stedmon, C.A.; Wenig, P.; Bro, R. OpenFluor- An online spectral library of auto-fluorescence by organic compounds in the environment. Anal. Methods 2014, 6, 658–661. [Google Scholar] [CrossRef]
  46. Stedmon, C.A.; Markager, S. Tracing the production and degradation of autochthonous fractions of dissolved organic matter by fluorescence analysis. Limnol. Oceanogr. 2005, 50, 1415–1426. [Google Scholar] [CrossRef]
  47. Liu, L.; Fang, Y.; Sun, X. Research progress of organic matter based on three-dimensional fluorescence spectroscopy-parallel factor analysis (EEM-PARAFAC). Water Purif. Technol. 2022, 41, 7–16, 185. (In Chinese) [Google Scholar]
  48. Cory, R.M.; McKnight, D.M. Fluorescence Spectroscopy Reveals Ubiquitous Presence of Oxidized and Reduced Quinones in Dissolved Organic Matter. Environ. Sci. Technol. 2005, 39, 8142–8149. [Google Scholar] [CrossRef]
  49. Hudson, N.; Baker, A.; Reynolds, D. Fluorescence analysis of dissolved organic matter in natural, waste and polluted waters—A review. River Res. Appl. 2007, 23, 631–649. [Google Scholar] [CrossRef]
  50. Downing, B.D.; Boss, E.; Bergamaschi, B.A.; Fleck, J.A.; Lionberger, M.A.; Ganju, N.K.; Schoellhamer, D.H.; Fujii, R. Quantifying fluxes and characterizing compositional changes of dissolved organic matter in aquatic systems in situ using combined acoustic and optical measurements. Limnol. Oceanogr. Methods 2009, 7, 119–131. [Google Scholar] [CrossRef]
  51. Whisenhant, E.A.; Zito, P.; Podgorski, D.C.; McKenna, A.M.; Redman, Z.C.; Tomco, P.L. Unique Molecular Features of Water-Soluble Photo-Oxidation Products among Refined Fuels, Crude Oil, and Herded Burnt Residue under High Latitude Conditions. ACS EST Water 2022, 2, 994–1002. [Google Scholar] [CrossRef]
  52. Lin, H.; Guo, L. Variations in Colloidal DOM Composition with Molecular Weight within Individual Water Samples as Characterized by Flow Field-Flow Fractionation and EEM-PARAFAC Analysis. Environ. Sci. Technol. 2020, 54, 1657–1667. [Google Scholar] [CrossRef]
  53. Chen, M.; Kim, S.-H.; Jung, H.-J.; Hyun, J.-H.; Choi, J.H.; Lee, H.-J.; Huh, I.-A.; Hur, J. Dynamics of dissolved organic matter in riverine sediments affected by weir impoundments: Production, benthic flux, and environmental implications. Water Res. 2017, 121, 150–161. [Google Scholar] [CrossRef]
  54. D’Andrilli, J.; Junker, J.R.; Smith, H.J.; Scholl, E.A.; Foreman, C.M. DOM composition alters ecosystem function during microbial processing of isolated sources. Biogeochemistry 2019, 142, 281–298. [Google Scholar] [CrossRef]
  55. Jiao, N.; Herndl, G.J.; Hansell, D.A.; Benner, R.; Kattner, G.; Wilhelm, S.W.; Kirchman, D.L.; Weinbauer, M.G.; Luo, T.; Chen, F.; et al. Microbial production of recalcitrant dissolved organic matter: Long-term carbon storage in the global ocean. Nat. Rev. Microbiol. 2010, 8, 593–599. [Google Scholar] [CrossRef]
  56. Lonborg, C.; Carreira, C.; Jickells, T.; Anton Alvarez-Salgado, X. Impacts of Global Change on Ocean Dissolved Organic Carbon (DOC) Cycling. Front. Mar. Sci. 2020, 7, 466. [Google Scholar] [CrossRef]
  57. Medeiros, P.M.; Seidel, M.; Ward, N.D.; Carpenter, E.J.; Gomes, H.R.; Niggemann, J.; Krusche, A.V.; Richey, J.E.; Yager, P.L.; Dittmar, T. Fate of the Amazon River dissolved organic matter in the tropical Atlantic Ocean. Glob. Biogeochem. Cycles 2015, 29, 677–690. [Google Scholar] [CrossRef]
  58. Stedmon, C.A.; Seredynska-Sobecka, B.; Boe-Hansen, R.; Le Tallec, N.; Waul, C.K.; Arvin, E. A potential approach for monitoring drinking water quality from groundwater systems using organic matter fluorescence as an early warning for contamination events. Water Res. 2011, 45, 6030–6038. [Google Scholar] [CrossRef]
  59. Li, Y.; Li, J.; Su, J.; Ren, F. Study on fluctuations of plume front and turbidity maximum in the Hangzhou Bay by remote sensing data. Acta Oceanol. Sin. 1993, 1, 51–62. [Google Scholar]
  60. Sun, X.; Song, G.; Xie, H. The apparent quantum yields of dissolved organic matter photobleaching and photomineralization in the Changjiang River Estuary. Haiyang Xuebao 2016, 38, 120–129. (In Chinese) [Google Scholar]
Figure 1. The map of the study area: Hangzhou Bay (HZB)—Changjiang Estuary (CRE) and adjacent seas. (a) HZB—CRE and adjacent seas and the currents. (b) Stations and sampling sites in winter 2024. The green-shaded area represents the water and DOM mixed zone in HZB (blue arrow: Qiantang freshwater, QTW; orange arrow: Changjiang diluted water, CDW; pink arrow: shelf seawater, SSW).
Water 17 01590 g001
Figure 2. T–S scheme in the HZB and adjacent seas. (a) T–S scheme with density. The blue circle is the water mass of low density and high turbidity in stations E1, E2 and CE3 dominated by QTW; the orange circle is the water mass CDW with medium density and high turbidity in stations B3, B4 and B4-0; the blue quadrangle is the water in southern Hangzhou Bay including stations E1-E6, ZJD12014, and ZJD12031; the red quadrangle is the water of high salinity (>27.5), high density and low turbidity in ZIR [42]. (b) Turbidity in the study areas. HZB and CRE with turbidity > 400 FTU, and ZIR with turbidity < 300 FTU.
Water 17 01590 g002
Figure 3. The distributions of the hydro-parameters in surface water (left panels) and bottom water (right panels) in the HZB and its adjacent seas in late January 2024: (a,b) temperature; (c,d) salinity; (e,f) turbidity; (g,h) TSM.
Water 17 01590 g003
Figure 4. The (a) turbidity and (b) TSM variability, along with longitude and depth, in the study areas.
Water 17 01590 g004
Figure 5. Distributions of DOC in the HZB and adjacent seas. (a) DOC in the surface water; (b) DOC in the water.
Water 17 01590 g005
Figure 6. DOC, CDOM and FDOM parameters in the study area. (a) DOC concentration; (b) CDOM at 355 nm; (c) Total FDOM; (d) CDOM SR; (e) a 254; (f) SUVA 254; (g) FI; (h) HIX; (i) BIX in the study area. The QRE included stations E1, E2 and CE3; Southern HZB was the nearshore section from E1 through E6 to ZJD12031; Northern and Central HZB was a mixed bay area influenced by CDW; CRE included stations B3, B4 and B4-0; ZIR included seawater samples in the Zhoushan Islands Region (salinity > 27.5).
Water 17 01590 g006
Figure 7. Distributions of CDOM absorption coefficients in the surface water (left) and bottom water (right). (a,b) a254; (c,d) a355; (e,f) SUVA254.
Water 17 01590 g007
Figure 8. The FDOM indices distribution in the HZB and adjacent seas in the surface (left) and the bottom (right). (a,b) Humification index (HIX); (c,d) Biological index (BIX).
Water 17 01590 g008
Figure 10. The relative abundance of C1, C2 and C3 varies with the salinity.
Water 17 01590 g010
Figure 11. (a,b) The summary of C1 + C2 + C3 as the total fluorescence; (ch) distributions of the surface and bottom C1, C2 and C3 component abundance in the HZB and adjacent seas (with the same color bar).
Water 17 01590 g011
Figure 12. The absolute abundance of FDOM components C1, C2 and C3 in HZB and its adjacent areas.
Water 17 01590 g012
Figure 13. The distinct differences in DOM composition and characteristics in the study areas indicated via PCA (ZIR samples did not put all in).
Water 17 01590 g013
Figure 14. The humic-like DOM component C1 varied with the salinity in different study areas in the winter. The blue circle included water samples in the Qiantang River Estuary (QRE) and the orange circle included water samples in the Changjiang River Estuary (CRE). The three colored solid lines were the theoretical mixing trend lines of the three-source waters between each other. The blue and red dashed lines were variation trends of C1 with salinity in southern HZB channel and ZIR area, respectively. The pattern of the protein-like DOM component C2 is shown in Figure S6.
Water 17 01590 g014
Table 1. Hydrological and hydrochemical parameters in different end member sources in the HZB and adjacent seas in late January 2024 (range values in parentheses).
Water MassesTemperature
/°C
SalinityTurbidity
/FTU
TSM
/mg·L−1
Chl-a
/μg·L−1
DO
/mg·L−1
pH
QTW7.0 ± 0.116.66 ± 0.59492.42 ± 0.01(746–4616)4.40 ± 0.1510.83 ± 0.086.87 ± 0.00
CDW5.9 ± 0.124.39 ± 0.79451.33 ± 50.25(256–1475)2.12 ± 0.5010.76 ± 0.056.86 ± 0.01
SSW10.2 ± 2.231.31 ± 1.805.44–293(6–1184)0.58 ± 0.18
(0.36–1.37)
9.20 ± 0.61
(8.29–10.38)
6.89 ± 0.03
(6.83–6.97)
Disclaimer/Publisher’s Note: The statements, opinions and data contained in all publications are solely those of the individual author(s) and contributor(s) and not of MDPI and/or the editor(s). MDPI and/or the editor(s) disclaim responsibility for any injury to people or property resulting from any ideas, methods, instructions or products referred to in the content.

