All hands-on activities related to the five units were completed under the supervision of the university activity leaders and the students’ teacher. Furthermore, all lessons and activities took place inside the high school classroom which eliminated the need for the students to travel.
3.3. Rain and Drainage
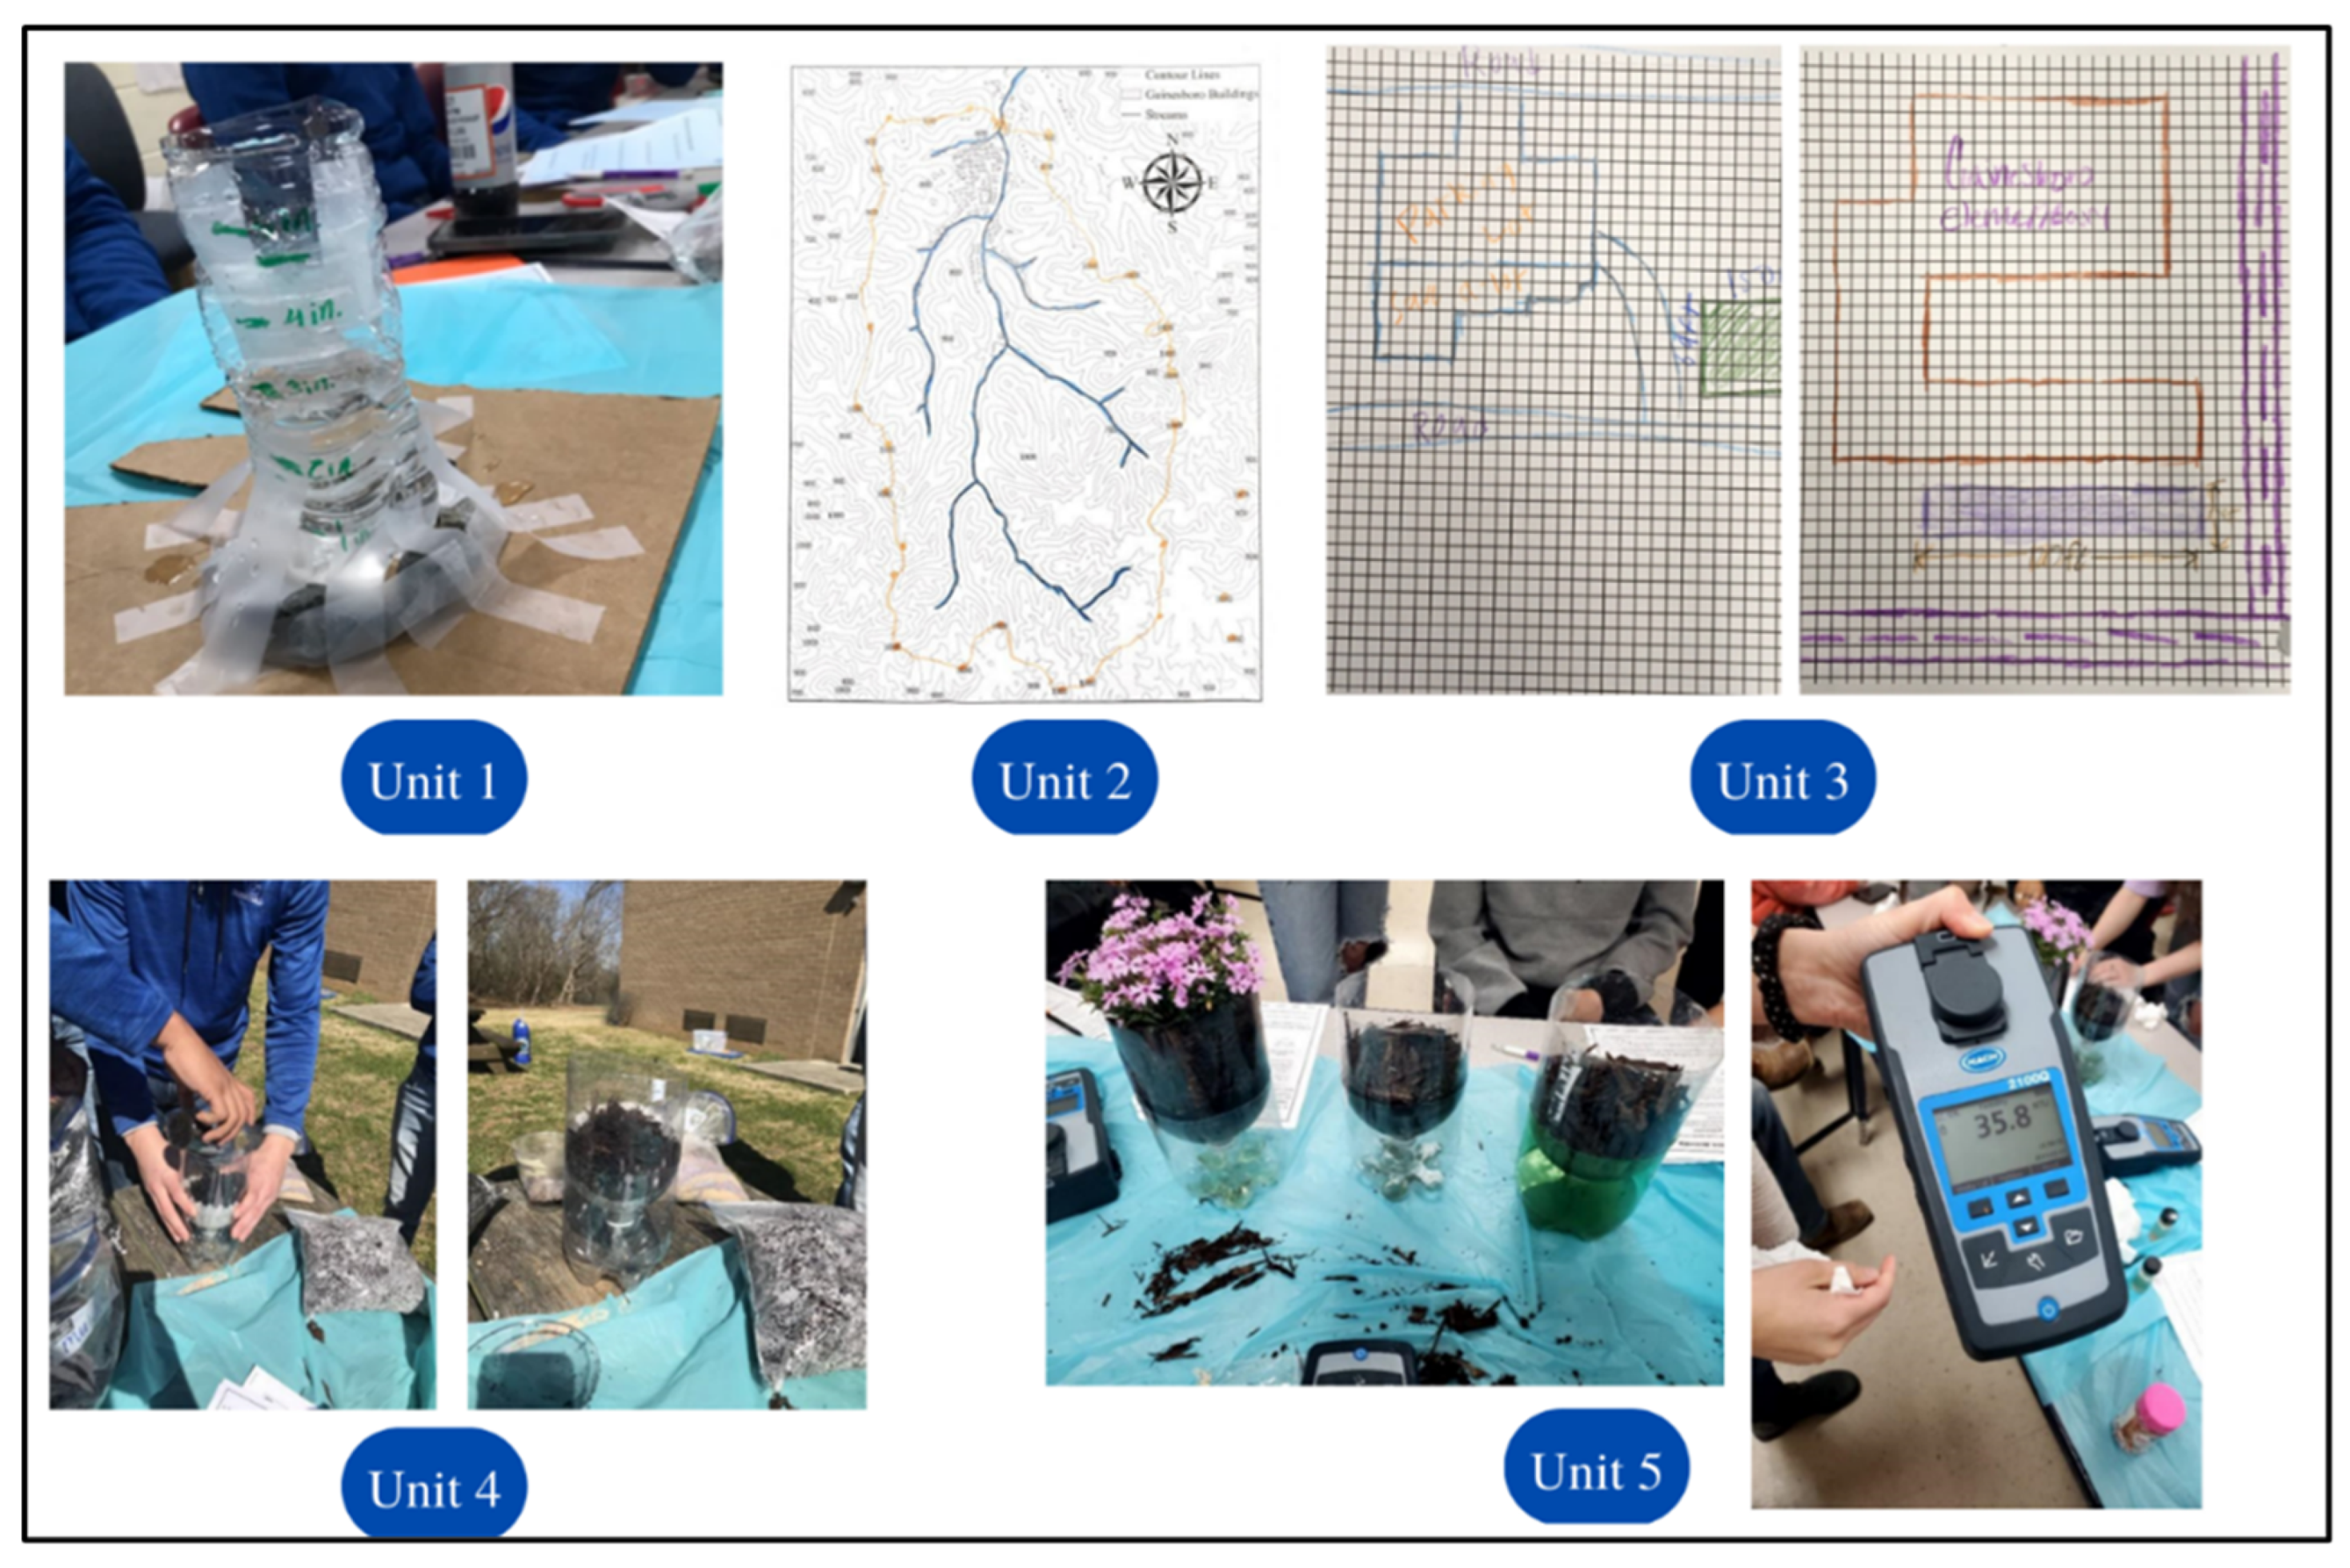
The third lesson and activity explored rain and drainage within a watershed. The lesson defined precipitation, pervious/impervious spaces, rainfall intensity, rainfall duration, rainfall depth, and rainfall frequency. Following the lesson, the students applied the engineering design process previously covered in the program to design a rain garden for two locations in their watershed, which documented stormwater issues. This activity was developed using guidance from the North Carolina Stormwater Best Management Practices Manual and the Iowa Rain Garden Design and Installation Manual [
13].
To accomplish this, students conducted background research on their site, using Google Earth to identify potential green and pervious spaces to install the rain gardens. Design requirements are provided by the activity leaders (the garden must be at least 10 feet downhill or away from any structural foundation, should be in a low spot where water can easily move to it, and should not be located on a steep incline). The students then sketched their gardens, and used the “Measure” tool in Google Earth to measure the impervious area adjacent to the green space. The students estimated the runoff volume using the measured area and a provided water depth. Once the runoff volume was estimated, students calculated their approximate rain garden sizes. Finally, students sketched their design with estimated dimensions, and presented their findings to the class.
3.4. Soils and Infiltration
The fourth lesson explored soil and infiltration. The lesson further explored rain gardens by defining low-impact development and bioretention, and highlighting the importance of soils in hydrology. Following the lesson, the fourth activity was adapted from the “Does Media Matter? Infiltration Rates and Storage Capacity” activity developed by the University of South Florida’s Water Awareness Research and Education Research Experience for Teachers [
14]. For this activity, students were given the opportunity to work with three different media types (mulch, topsoil, and sand) to better understand the drainage properties (field capacity and infiltration rate) of each soil type. The students were divided into three small groups, and each group tested the media’s field capacity and infiltration rate. Once the three groups were more familiar with their media types, each group shared their findings with the class. In their discussions, the students concluded that the mulch had the highest infiltration rate. The activity leaders then instructed the students that a common ratio for rain garden soil mix is 2:2:1 sand, topsoil, and mulch, respectively. The students came together as a class to test the infiltration of this 2:2:1 mixture of sand, topsoil, and mulch.
3.5. Plants and Filtration
For the final lesson, the students explore stormwater runoff pollution, filtration, and the role that rain gardens can play in protecting water quality. For the activity, students began by polluting a sample of “stormwater.” The students used simple, affordable ingredients in the activity: tajin represented sediment and organic matter, sprinkles represented microplastics, and quinoa represented animal waste. Once the students made their sample of polluted stormwater, the students were presented with three samples of potential rain garden soil mixtures. Sample 1 contained only mulch, Sample 2 contains the rain garden mix the students used in the previous activity (2:2:1 sand, topsoil, and mulch), and Sample 3 contained the rain garden mix as in Sample 2, but also includes a plant (Phlox stolonifera). As a class, the students hypothesized that Sample 3, which contained the rain garden mix and plant, would filter the water the best. To test the students’ hypothesis, the activity leaders introduced turbidimeters and the concept of turbidity. The students then used the turbidimeter to measure the turbidity of the polluted water prior to filtering it through any of our samples. Then, the students filter the stormwater through each of the samples and wait 3–5 min for water to pass through. After 3–5 min, the students retest the filtered sample’s turbidity. As hypothesized, filtering the polluted stormwater through Sample 3 resulted in the greatest reduction in turbidity.
3.6. Immediate Watershed Literacy Changes
Following the interactive lectures, the immediate changes in watershed literacy are shown in
Table 2,
Table 3,
Table 4,
Table 5 and
Table 6 for the various units. It should be noted that two students were absent during the Unit 3 interactive lecture, and activity on rain and drainage (pre-n = 7, post-n = 6). In Unit 4, four students were absent, and two students who did not attend the interactive lecture completed the post-content assessment (pre-n = 5, post-n = 6). Ultimately, the small number of student survey participants (n = 5 to n = 9) was a limitation of this study. The limited number of student participants may not reflect the overall opinions or abilities of the local youth, and the lack of a control group to which the survey results could be compared may introduce selection bias.
Due to the limited sample size of participants, descriptive statistics were used to evaluate the effectiveness of this short-term outreach. Overall, the students answered the assessment questions more accurately after participating in both the interactive lecture and activity. The average percent change in watershed literacy was found to be +22%, +57%, +13%, +20%, and +8% for units 1–5, respectively. Students experienced the greatest positive change in watershed literacy during Unit 2, with Q7 resulting in the greatest positive change (88%) of any of the questions of the five-unit content assessments. Unit 2 introduced students to the concept of a watershed through exploring characteristics of their local watershed. Through engaging with this place-based lesson, students were able to utilize their existing knowledge of their community and its flooding problems to better engage with the material.
For questions Q15 and Q18, the students showed no change in their ability to accurately answer the questions. In the case of Q18, the students were correctly able to identify sources of pollution in water prior to the unit, and therefore experienced no change in their responses. In question Q15, the students collectively maintained a 50% understanding of the concept of a rain garden both before and after the unit. Questions Q2, Q10, Q16, and Q20 revealed a decrease in watershed literacy after participation, suggesting that these questions should be further inspected to ensure that the questions are clear to the students. Additionally, the units should be reassessed to ensure the topics from these questions are sufficiently addressed. Incorporating a section of the surveys to allow students to express their difficulty in understanding the questions may help to ensure field validity of the survey materials [
15]. As a pilot program, these questions may provide insights into ways that the program and its surveys may be improved.
3.8. Student Perceived Change in Watershed Literacy
Lastly, the students reported their perceived watershed literacy using a Likert scale survey both before and after the program (1 = strongly agree, 6 = strongly disagree), as shown below in
Table 8. The 10 questions were then organized into three categories: watershed connectedness, student confidence, and student willingness.
Overall, the students showed an improved attitude toward their watershed for 8 of the 10 questions, which is similar to the findings of a watershed outreach attitude study by [
16], which showed a “weak trend towards desirable attitude shifts”. Similarly to [
16], the objective of this study was not to change student attitudes toward their watershed, but to improve watershed literacy. However, through the process of improving their understanding of a local watershed, the students reported an increased connectedness to their watershed and confidence in addressing stormwater management and flooding issues. These outcomes are shown in
Table 8. As members of a community facing watershed management challenges, this outcome was encouraging, as it demonstrated that students were able to better understand local watershed issues and were empowered to take informed action.
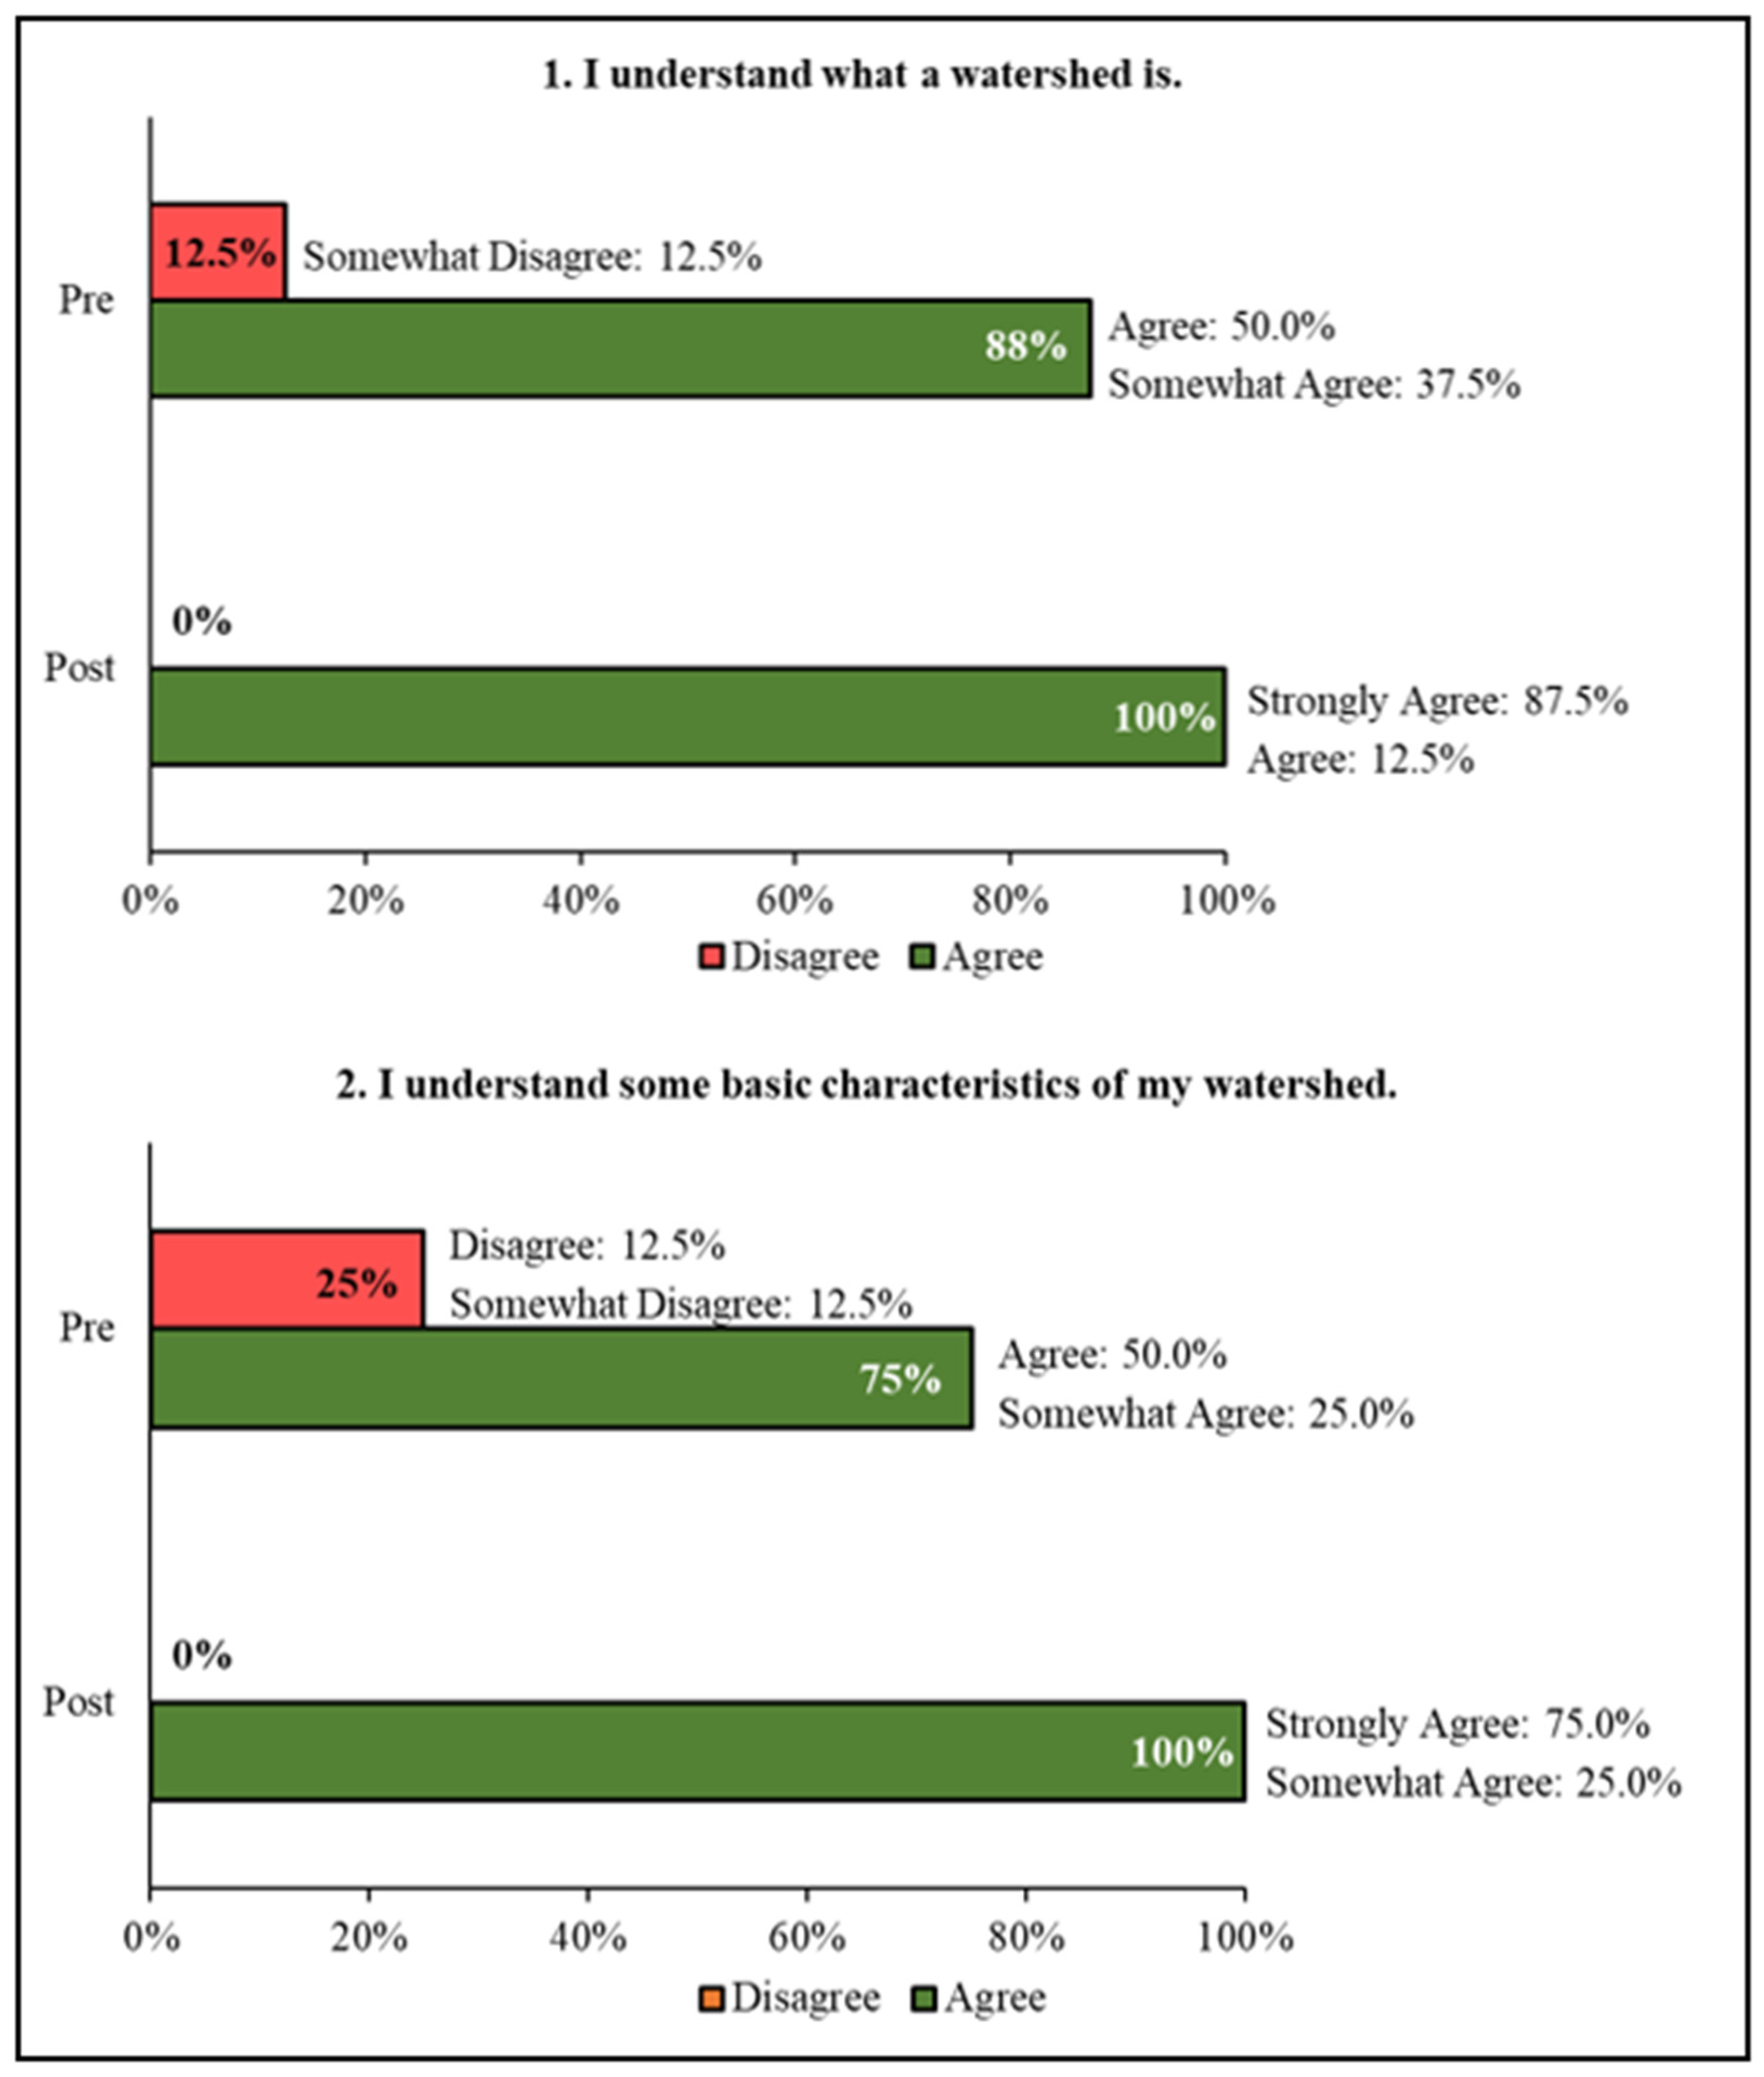
The questions that resulted in the greatest positive change in mean were Q1 (+1.50) and Q2 (+1.63), which correspond to watershed connectedness. In Q1 and Q2, students collectively reported an improvement in their understanding of a watershed and its characteristics (
Figure 2). Prior to the outreach, 88% of the students reported that they understood what a watershed was. However, referring to
Table 8, 0% of students were able to successfully define a watershed during the pre-program content assessment. This difference in self-perceived understanding and understanding as measured through the content assessments should be further investigated in future study efforts. Providing an incentive for student completion of the content surveys may be useful as well, as the brevity of some student responses may indicate a lack of effort rather than a lack of knowledge.
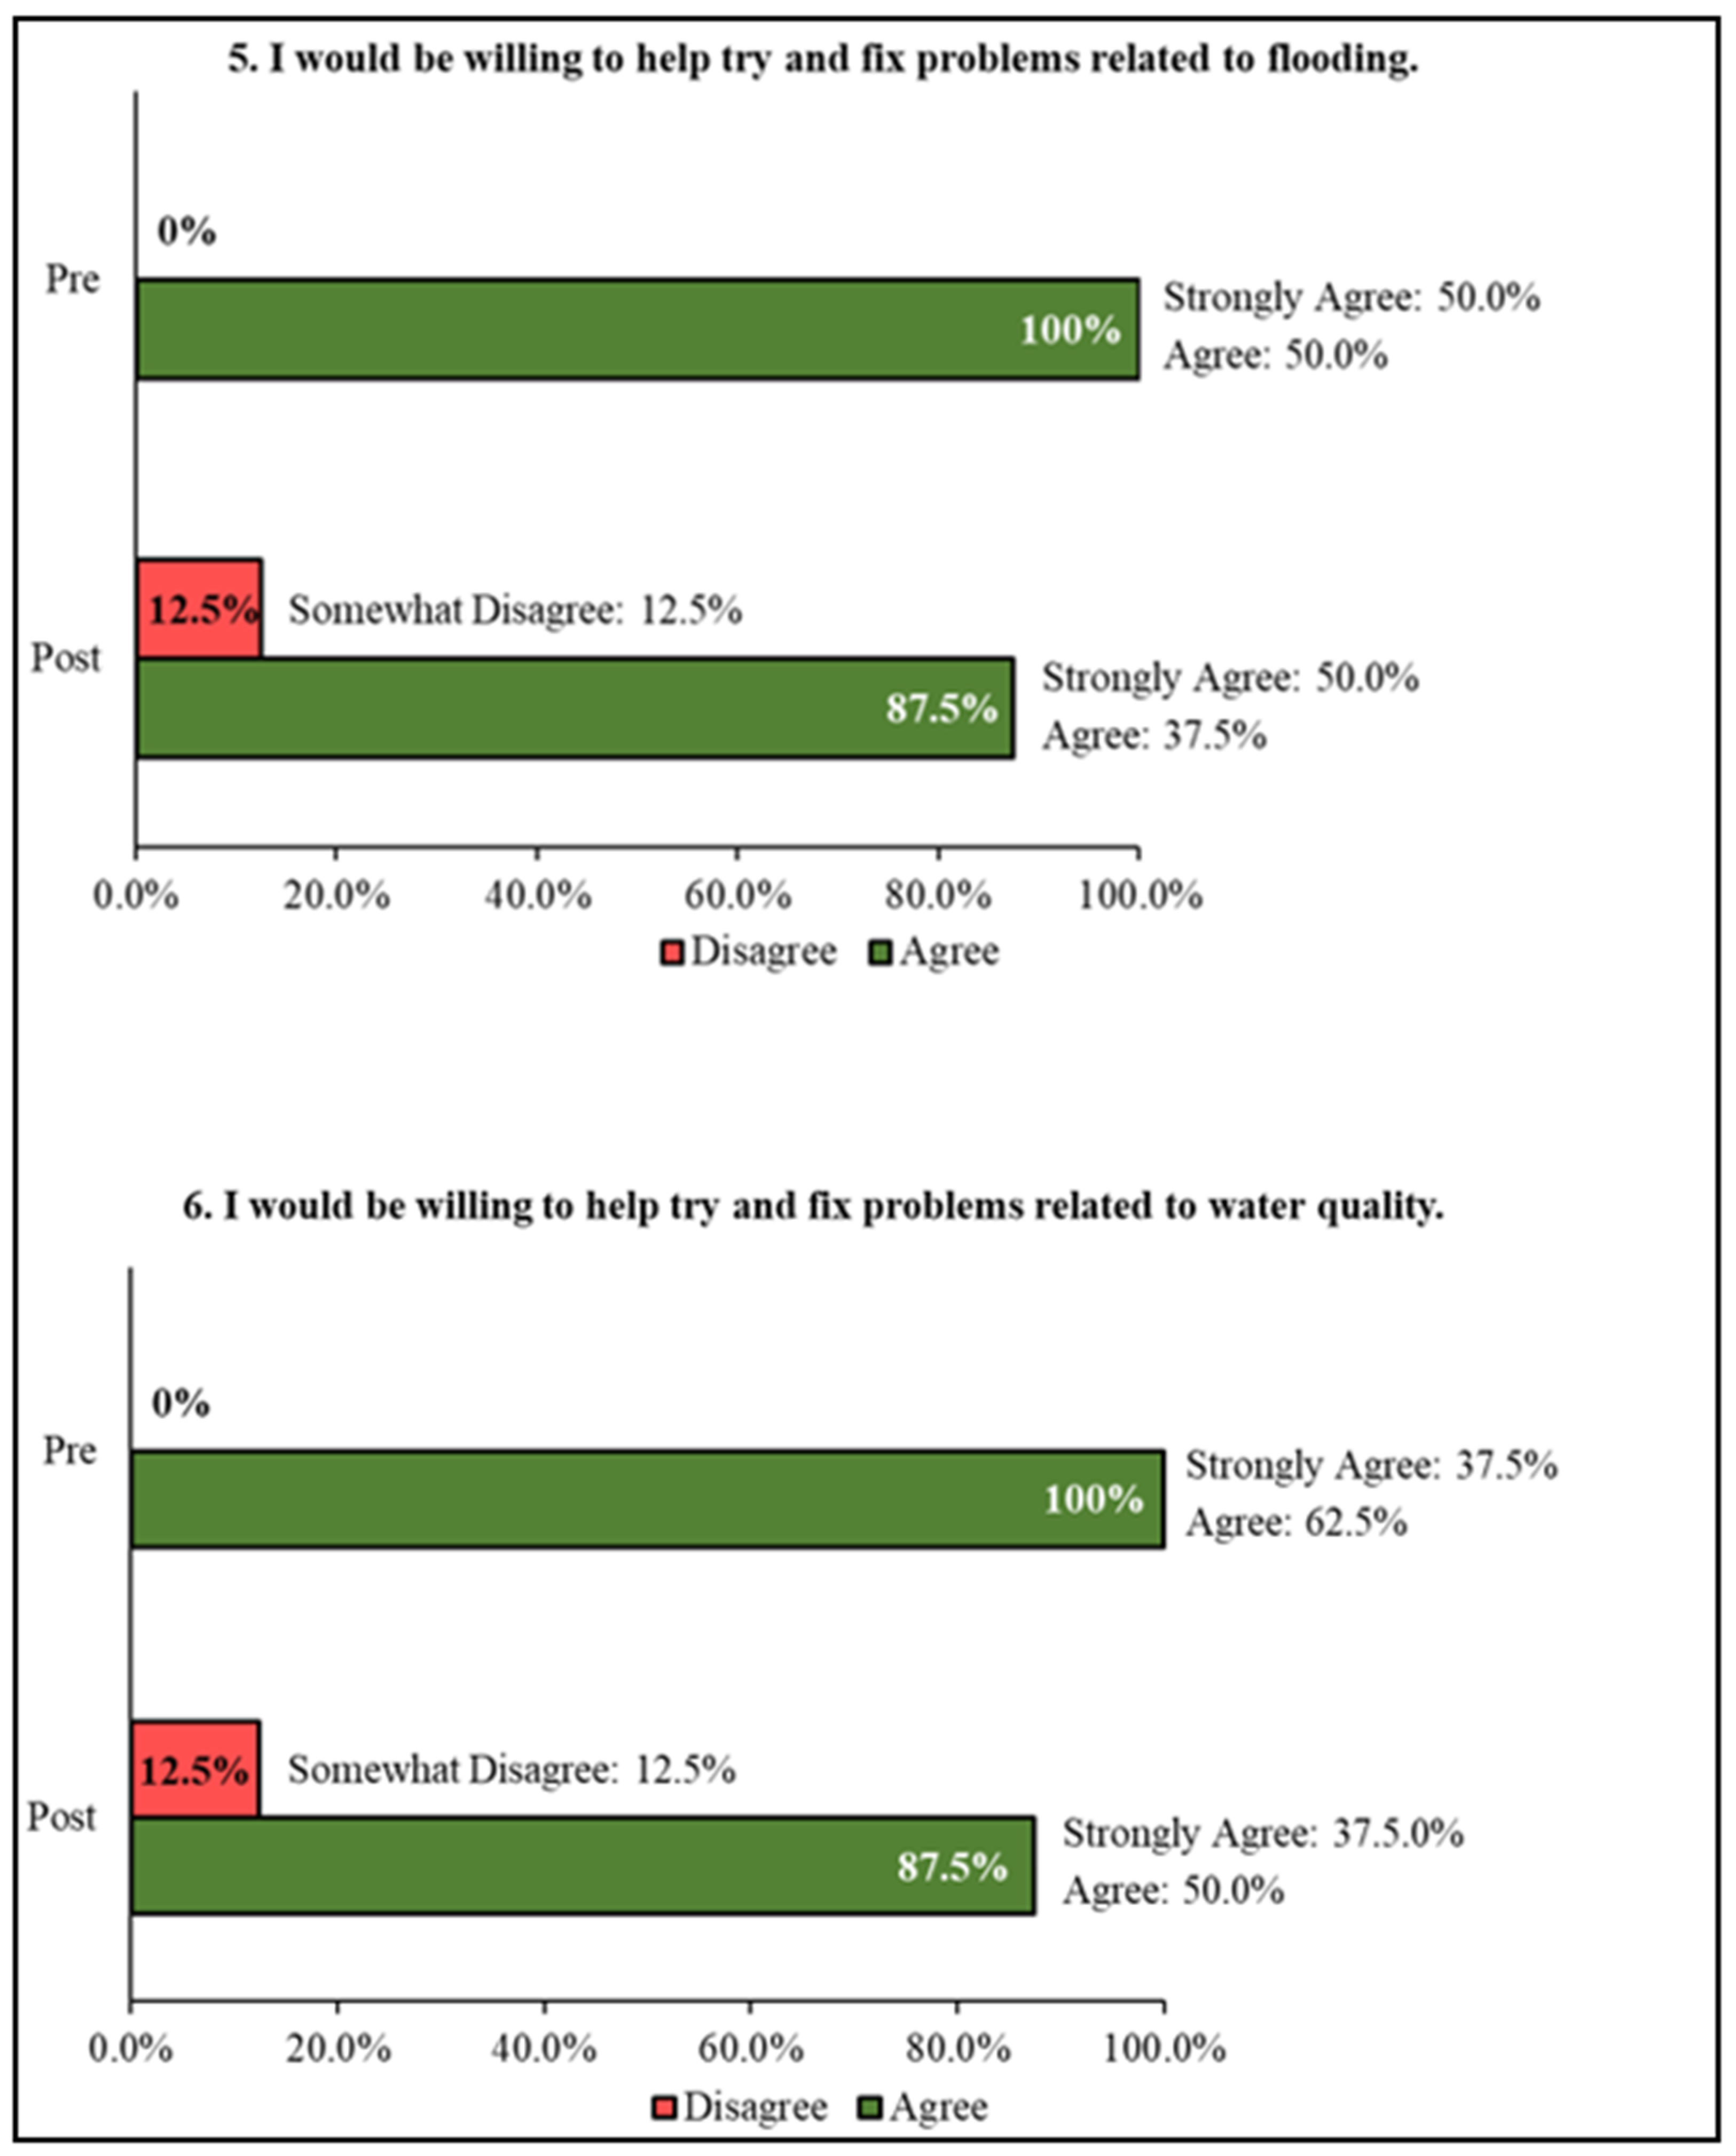
Conversely, the reported change in mean in questions 5 (−0.25) and 6 (−0.25) represented the greatest negative change. Questions 5 and 6 indicate that the student participants reported a decrease in willingness to address local flooding issues in their watershed (
Figure 3). Despite resulting in an overall improvement of short-term watershed literacy of the student participants, additional efforts should be made to attempt to address student willingness to become active watershed stewards. Involving community members in environmental outreach efforts has been found to provide increased data collection [
17], improved participation in stewardship efforts [
18], and enhanced awareness of one’s watershed and its processes [
19]. Therefore, it is recommended that future efforts with the students at the high school extend beyond classroom activities to allow the students to collect relevant watershed data and observe future flood mitigation measures.
As this program was designed largely by Civil and Environmental Engineering university representatives, increased collaboration and involvement with individuals who specialize in education and the inclusion of a rubric to evaluate program materials may provide valuable improvements to the outreach program as well. Providing an option to receive educator feedback from future studies is recommended as well. Additionally, including a section during the Likert scale assessments for students to explain their reasonings behind their agreements or disagreements may also provide additional insights into how the program may be improved. Because post-program surveys were conducted immediately after the final outreach unit, the potential long-term effectiveness of this outreach remains unevaluated.


