Article

Processes of Groundwater Contamination in Coastal Aquifers in Sri Lanka: A Geochemical and Isotope-Based Approach

by
Movini Sathma Ratnayake
1,
Sachintha Lakshan Senarathne
2,
Saranga Diyabalanage
3,
Chaminda Bandara
4,
Sudeera Wickramarathne
5 and
Rohana Chandrajith
1,*
1
Department of Geology, Faculty of Science, University of Peradeniya, Peradeniya 20400, Sri Lanka
2
GeoZentrum Nordbayern, Friedrich-Alexander-Universität Erlangen-Nürnberg, Schlossgarten 5, D-91054 Erlangen, Germany
3
Instrument Centre, Faculty of Applied Sciences, University of Sri Jayewardenepura, Nugegoda 10100, Sri Lanka
4
National Water Supply and Drainage Board, Telawala Road, Ratmalana 20000, Sri Lanka
5
Forest Engineering, Resources and Management, College of Forestry, Oregon State University, Corvallis, OR 97331-5704, USA
*
Author to whom correspondence should be addressed.
Water 2025, 17(11), 1571; https://doi.org/10.3390/w17111571
Submission received: 13 April 2025 / Revised: 9 May 2025 / Accepted: 20 May 2025 / Published: 23 May 2025
(This article belongs to the Special Issue Assessment of Groundwater Quality and Pollution Remediation)

Abstract

:
Over the last decade, concern has increased about the deterioration of groundwater quality in coastal aquifers due to salinization processes resulting from uncontrolled abstraction and the impacts of global climate change. This study investigated the groundwater geochemistry of a narrow sandy peninsula bounded by the ocean and brackish water lagoons in northern Sri Lanka. The population of the region has grown rapidly over the last decade with increasing agricultural activities, and therefore, the use of groundwater has increased. To investigate the effects of seawater intrusion and anthropogenic activities, selected water quality parameters and water isotopes (δ2H and δ18O) were measured in 51 groundwater samples. The results showed that selected shallow groundwater wells are vulnerable to contamination from anthropogenic processes and seawater intrusion, mainly indicated by Cl/Br ratios. Iron-rich groundwater (0.11 to 4.2 mg/L) could represent another problem in the studied groundwater. According to Water Quality Index calculations, 41% of shallow wells contained poor and unsuitable water for domestic and irrigation purposes. Most of the groundwater in the region was saturated with Ca and Mg containing mineral phases such as calcite, dolomite, magnesite and gypsum. Water isotopes (δ2H and δ18O) showed that about 50% of the groundwater samples were scattered near the local meteoric water line. This indicates sufficient rainwater infiltration. However, some samples exhibit elevated isotope values due to seawater admixture and secondary evaporation under semi-arid conditions. This study showed the utility of Cl/Br ratios as indicators for distinguishing anthropogenic sources of Cl contributions to groundwater in shallow, permeable aquifer systems.

1. Introduction

Groundwater is one of the most important sources of fresh water, and over 2.5 billion people worldwide rely on it [1]. Most of the rural population in the tropical belt uses groundwater for domestic needs and irrigation [2]. In recent decades, groundwater extraction has increased rapidly due to the contamination of surface water sources in many regions. Intensive agricultural activities, excessive abstraction, industrial and domestic waste disposal and predicted climate change impact groundwater resources. In addition to reducing the amount of water, groundwater quality is also an increasing problem. The input of nutrients, toxic heavy metals, hydrocarbons, organic pollutants from agrochemicals and pharmaceuticals, micro-plastics and other emerging pollutants can affect water quality [3,4]. Due to slow flow rates and long residence times, this represents an even greater problem for groundwater. Groundwater availability also depends on geological and geomorphological factors. Among the various groundwater systems, coastal aquifers are among the most vulnerable freshwater resources, especially in the arid and semi-arid regions of the world [5]. This vulnerability is due to potential seawater intrusion and natural and anthropogenic pollution [6,7]. Due to increasing demands and predicted climate change scenarios, managing groundwater resources in coastal areas is important and challenging.
Sandy aquifer systems, characterized by high porosity and permeability, are especially susceptible due to their rapid recharge and low contaminant attenuation capacity. In such environments, understanding the origin and nature of salinity becomes essential for effective groundwater management. One robust approach to tracing salinity sources in groundwater is using the chloride to bromide (Cl/Br) ratio [8,9]. This ratio is a conservative tracer since chloride and bromide typically do not undergo significant geochemical reactions under typical subsurface conditions [8]. In unimpacted groundwater, the Cl/Br ratio generally falls within a narrow range reflective of atmospheric and terrestrial inputs. Seawater, by contrast, has a well-established molar Cl/Br ratio of approximately 288 [10], making it a distinguishable marker for saltwater intrusion in coastal aquifers.
In sandy aquifers, elevated Cl/Br ratios often indicate marine influence from seawater intrusion, commonly caused by excessive groundwater extraction and resulting hydraulic gradient reversal. However, elevated chloride levels with disproportionately low bromide concentrations may point to anthropogenic sources such as road salts, sewage effluent or industrial discharge [11]. Differentiating between these salinity sources using Cl/Br ratios is particularly important in sandy aquifer systems, where the high permeability can lead to rapid contaminant migration. Consequently, Cl/Br ratio analysis not only aids in identifying the nature of contamination but also supports the development of targeted mitigation and sustainable groundwater management strategies in vulnerable regions. In addition, stable isotopes of oxygen (18O) and deuterium (2H), major ions chemistry can effectively be used to determine the seawater mixing with freshwater in different masses [12].
Sri Lanka has a coastline of 1620 km, where over 50% of the population lives [13]. Due to increasing tourism, the coastal belt is developing into an important economic centre in the country. All these factors increase the demand for water in the coastal region of Sri Lanka.
Geologically, over 90% of the island consists of high-grade metamorphic rocks. However, the coastal region of the northern and north-western parts is characterized by sedimentary aquifers with Miocene limestone and sandy aquifers [14]. These sedimentary aquifer systems are highly vulnerable to seawater intrusion, primarily due to excessive abstraction for domestic and irrigation purposes. In particular, aquifers in dunes and fissures have been exposed to increasing pollution from seawater intrusion in recent years [15,16]. The Kalpitiya, Mannar Island, Pooneryn and Mullaitivu–Point Pedro spit landforms are among the most prominent sandy aquifers in northern Sri Lanka (Figure 1). Due to the lack of surface water sources, the entire water supply in these regions relies on groundwater resources in sandy aquifers. Groundwater in these sedimentary terrains occurs as shallow lenses (<10 m) in coastal sand layers and dunes [17]. Recent studies showed that coastal groundwater, especially in shallow karst and sandy aquifers in the northern and northwestern regions, is contaminated with nutrients and toxic elements such as arsenic [15,16,18,19].
From among the sedimentary aquifers on the island, the Mullaitivu to Point Pedro spit landform is one of the largest sandy aquifers. It stretches for 88 km along the north-east coast. It is connected to the mainland near Mullaitivu and is surrounded by the Indian Ocean to the east and north and saltwater lagoons to the west. Groundwater occurs in the area as lenses within the sand layers. These shallow aquifers are also expected to become contaminated due to extensive military activities that ended in 2009 [20]. Soon after the end of the conflict, the area became heavily populated due to resettlement and expansion of agricultural activities. In addition to livestock farming, coconut, cashews, peanuts, onions and tobacco are mainly grown in this region. In connection with these practices, nitrogen fertilizers and animal manure are regularly used for cultivation. Since the quality of groundwater in the area has not been studied, this study aims to predict and manage groundwater pollution in the sandy aquifer system extending from Mullaitivu to Point Pedro in northern Sri Lanka, focusing on identifying sites affected by seawater intrusion and anthropogenic contamination.

2. Materials and Methods

Fifty-one (51) samples were collected during the dry season (August–September) in 2021 from active wells from the Mullaitivu to Point Pedro spit land and in adjacent areas (Figure 1). The depth to the water table during the sampling varied between 2.5 and 10.0 m. The wells were pumped for 5 to 10 min until the electrical conductivity became stable. Samples were collected from the deeper layers using a depth sampler to avoid the evaporation effect. Parameters such as pH, water temperature, electrical conductivity (EC) and redox potential (ROP) were measured on-site using pre-calibrated multi-parameter kits (Hach HQ40D). On site, the acid neutralization titration method was used to calculate the total alkalinity of the water. For anion and cation analysis, samples were filtered through 0.45 μm syringe filters into high-density polyethylene bottles. One set was acidified with high-purity HNO3 (pH < 2) to determine major cations and trace metals. Samples for water isotope analyses were collected in 15 mL plastic centrifuge tubes. The samples were stored at 4 °C until the analyses were carried out. Major cations and selected trace elements were measured using ICP-MS (Thermo ICAPQc), and anion measurements (Cl, F, NO3, SO42− and Br) were carried out using an ion chromatograph (Dionex IC-1100).
The ICP-MS instrument was optimized with a solution containing Ba, Bi, Ce, Co, In, Li and U for sensitivity, resolution and mass calibration. A helium collision/reaction cell removed polyatomic isobaric interferences. Elemental levels were quantified with respect to mixed standard stock solutions with five-point calibration. 103Rh and 186Re were used as internal standards to correct the instrumental internal drift. The accuracy of the analyses was verified with certified standards ERM-CA615. The recovery losses of certified standards were less than 1.0% for Cr, Mn, Co, Cu, As and Pb; within 1.0–3.0% for Zn, Sr and Cd; within 3.0–5.0% for B, Al, Zn and Ba; and within 5.0–10% for Li and Fe. Replicate sample analyses yielded better than ±5% relative standard deviations for all major cations and trace elements. The ion chromatograph was calibrated using a Dionex Seven Anion standard II solution, and the analytical reproducibility was within 10% (±1σ). For quality control, blank samples and duplicates were analyzed after each sample. Analytical accuracy was also checked by calculating the percentage ion balance error for all samples collected, which showed that the errors were within ±6%, except for samples JF-19 (+6.6%) and JF-30 (−6.8%).
Stable isotopes of water were determined using a wavelength-scanned cavity ring-down infrared spectrometer (Picarro L1102i), and values were reported in conventional delta notation (δ) as per mil (‰) with respect to Vienna Standard Mean Ocean Water V–SMOW). The analytical precisions were ±0.1‰ and ±0.3‰ for δ18O and δ2H, respectively.
The suitability of groundwater for various purposes was assessed using water quality index (WQI) calculations based on quality standards. The WQI is a widely used tool for determining the suitability of water for purposes such as drinking, irrigation and fishing [21,22,23]. Rather than considering a single water quality parameter, WQI calculations can use a range of parameters that provide a single meaningful value for assessing the suitability of water for human use. WQIs for domestic purposes are widely used by the World Health Organization (WHO) quality standards. In this study, the calculation of the WQI was carried out according to the weighted arithmetic index method described by Brown, et al. [24], in which the WQI was given as
W Q I = Q i W i W i
where Wi is the unit weight water quality for the ith parameter (e.g., Cl, F and NO3) and Qi is the quality rating scale of the ith parameter, and in which
W i = k v s
k = 1 i 1 n v i
q i = ( v i v o ) ( v s v o ) × 100
where k is the proportionality constant, vi provides the concentration of the ith parameter in the quality analysis, vo is the actual value of the ith parameter in pure water, vo = 7 for pH and 0 for other parameters and vs is the standard value based on the WHO standards [25]. The computed WQI values are classified as excellent water (WQI < 25), good water (WQI 25 to 50), poor water (WQI 50 to 75), very poor water (WQI 75 to 100) and water unsuitable for drinking (WQI > 100) [24].

3. Results and Discussion

The Mullaitivu to Point Pedro spit landform is one of the longest Quaternary sedimentary sandy terrains in Sri Lanka and is dominated by dune and beach sand deposits. These deposits vary in thickness between 15 and 40 m and are interspersed with shell layers over Miocene limestone sequences. Well-log details of this area indicated hard, brownish lateritic sand deposits (Fe-coated sand) interbedded with loose sandy sediments and clay layers. Hard clay layers with an average thickness of 15 m were found at depths of approximately 20 and 35 m that act as an aquiclude. However, neither the consistency nor the thickness of these layers could be observed throughout the entire study area. The groundwater table in the region was found to be between 0.9 and 10 m deep.
The pH of groundwater samples from the sandy aquifer system varied between 5.5 and 9.2, with a mean of 7.1. The region’s electrical conductivity (EC) varied between 167 and 8074 µS/cm, except for sample J14, which had an exceptionally high EC value of 11,140 µS/cm, possibly due to excessive mixing with seawater (Table 1). The dominant anions varied in the order Cl > HCO3 > SO42− > NO3 > F, while the cations varied in Na+ > Ca2+ > Mg2+ > K+ > Fetot. > Sr2+ > Mntot > Altot. (Table 1). Higher EC values and high Cl values in sample J14 indicate the influence of seawater intrusion. Cl contents in the samples varied between 8.6 and 2755 mg/L, with a mean of 216 mg/L. The Cl also showed significant (p < 0.05) positive correlations with Na+ (r = +0.975), K+ (r = +0.947), Ca2+ (r = +0.913) and Mg2+ (r = +0.807). These correlations suggest a common source.
The Sr2+ contents in the samples varied between 42 and 2370 µg/L (mean = 400 µg/L). The high Sr2+ content compared to other trace elements is mainly due to the contribution of the dissolution of underlying limestones [17]. Some wells showed NO3 values between 2.21 and 21.7 mg/L (mean = 7.89 mg/L). Groundwater contamination by nitrate mainly occurs through fertilizer applications and septic tank disposal in sandy aquifer systems [16,26,27,28]. Br was detected in 45 samples in a concentration range of 0.07 to 2.94 mg/L, with a mean of 0.55 mg/L. Compared to metamorphic aquifers in the rest of the island, low F values, averaging 0.16 mg/L, are a key feature of groundwater in the sandy aquifers of northern Sri Lanka. Higher EC, Cl and Br values in some wells (e.g., JF 34, 41 and 47) indicate possible seawater contamination. High chloride levels in groundwater in the region may also be due to UV degradation of oxidative chemicals such as chlorates and perchlorates, commonly used in military explosives. Remarkably higher iron contents were observed in many shallow wells in the studied aquifer system. The total iron content of the groundwater samples varied between 0.11 and 4.28 mg/L, with a mean of 1.35 mg/L, and 94% of the samples exceeded the WHO recommended guideline value (0.3 mg/L). Iron-rich groundwater often occurs in aquifers rich in organic matter [29].
The major anion and cation compositions of the groundwater samples were represented in a modified Piper diagram (Figure 2). It was found that most groundwater samples fall in the Ca-Mg-HCO3 and Ca-SO4 fields, while seven samples fall into the Na-Cl field. The spatial variability of some hydrogeochemical facies is mainly related to seawater intrusion. Seawater intrusion into freshwater aquifers results in reverse base exchange by releasing divalent cations such as Ca2+ and Sr2+ from the aquifer matrix through alkali elements, mainly Na+ [27,30,31]. The sandy aquifer material in the study region is rich in interlayer shell beds, which are sources of Ca2+ and Sr2+.
Due to their conservative nature, Cl and Br can serve as proxies for studying groundwater salinization in coastal aquifers [31,32,33,34]. These ions are highly soluble, do not participate in ion exchange reactions and are not adsorbed on mineral phases [35]. Generally, Br levels in freshwater are very low and often below the detection limit [36], while seawater averages 65 mg/L [37]. Furthermore, seawater has a uniform Cl/Br molar ratio of about 650 to 690. This ratio should remain constant if the source of both elements is seawater. Chloride is a common component of groundwater, and higher concentrations are mainly due to contamination from seawater or anthropogenic sources. The Cl/Br ratio of shallow groundwater is known to vary between 100 and 200, while halite dissolution can range between 1000 and 10,000 [38].
The Cl/Br molar ratio in the collected samples varied between 36 and 20,641 (Figure 3), with a mean of 1674. An increase in the Cl/Br ratio observed in this study may be due to the dissolution of salts or contamination from septic tank leachates [38,39,40]. Groundwater contaminated with sewage effluents generally has a Cl/Br ratio of 300–600 [38]. Katz, et al. [41] inferred that the Cl/Br ratio can serve as an indicator to assess the impact of septic tanks on groundwater. Most households in the study region use pit latrines constructed in sandy sediments. This practice can increase the risk of nutrients and bacteria leaking from septic tanks. Katz, et al. [41] also found that shallow, unconfined aquifers contaminated with septic tank leachate had high chloride levels (33–187 mg/L).
In general, Fe-rich groundwater in alluvial aquifers mainly derives from geogenic sources, and the intrusion of organic-rich septic leachates leads to a highly reducing environment in aquifer materials. Such environments trigger the reductive dissolution of Fe-oxide coatings in sand grains, thereby increasing the Fe content of groundwater. Degradation of allochthonous organic matter in aquifers also increases the HCO3 content in groundwater. Such respiration can also create a reducing environment, thereby contributing to the mobilization of Fe from aquifer materials.

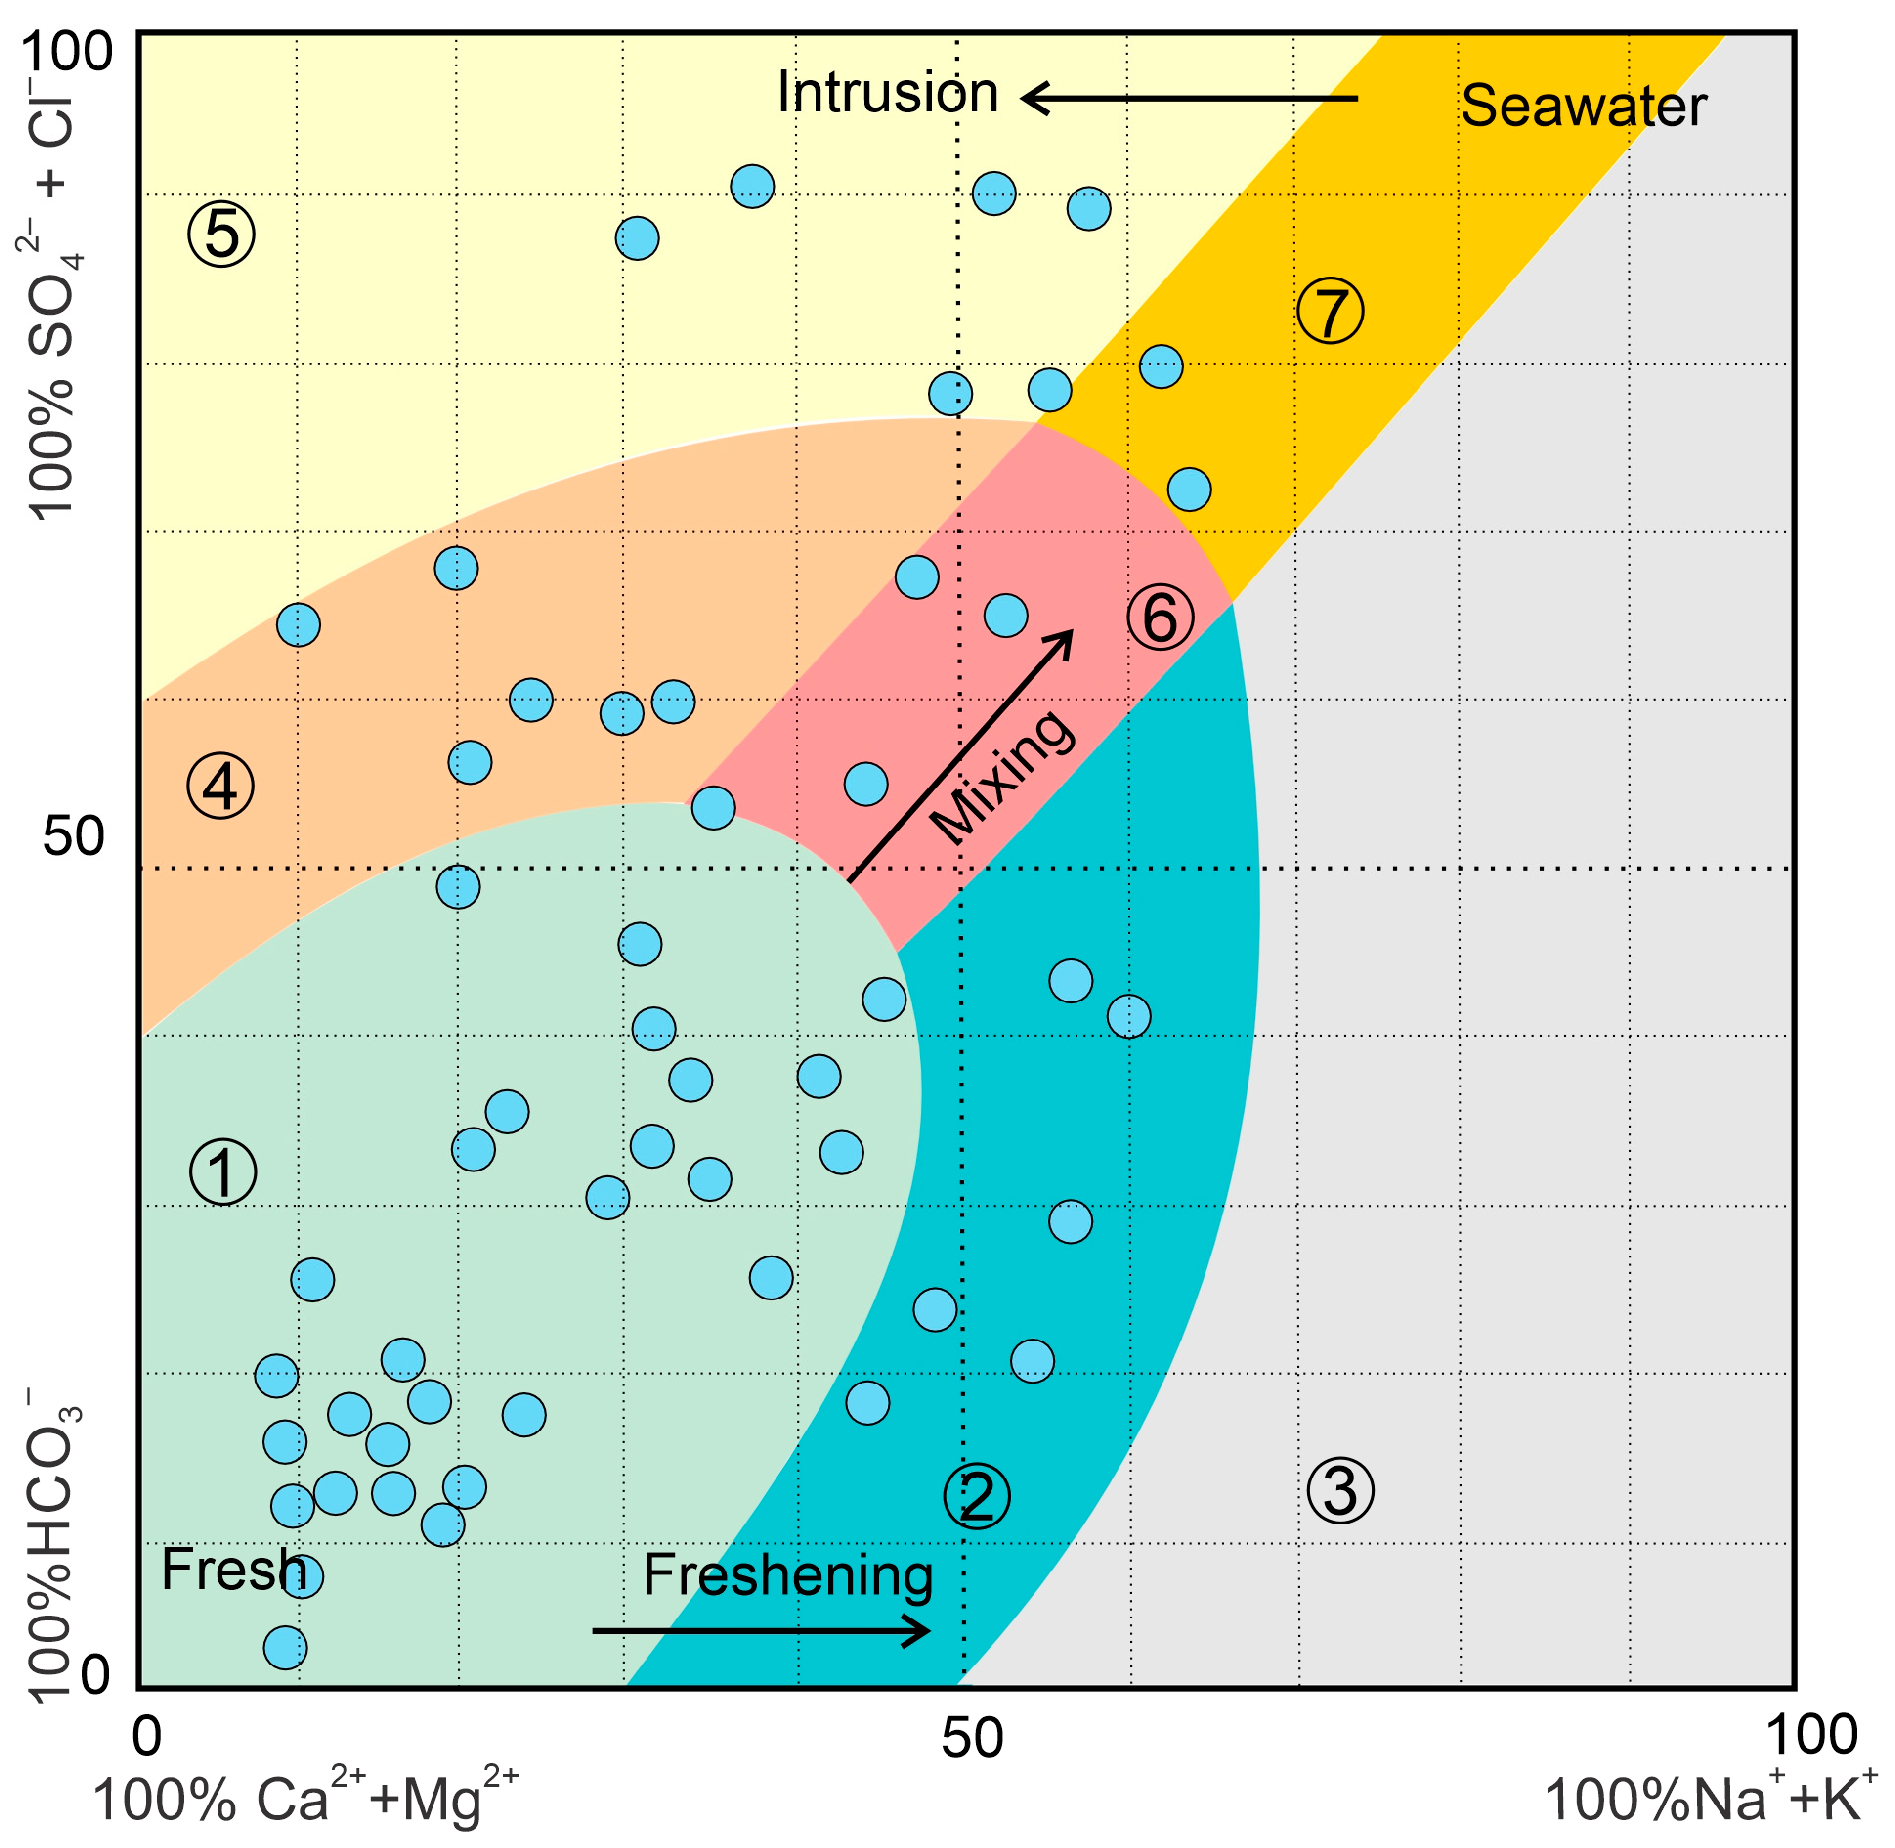
3.1. Groundwater Suitability

To calculate the water quality index (WQI), we considered pH, EC, HCO3, Cl, F, NO3, SO42−, Na+, K+, Ca2+, Mg2+ and Fetot into account. In Sri Lanka, F is considered an essential health-related element, especially in the dry zone regions, and is recommended for use in WQI calculation [43,44]. The WQI scores of the Mullaitivu–Point Pedro region ranged from 21 to 600 (Supplementary Table S1). The results showed that only 20% of the samples examined fell into “excellent” and “good” quality categories, while 39% and 10% belonged to “poor” and “very poor” water quality categories (Table 2). A total of 31% of all water samples from the region were “unsuitable” for drinking based on the calculated WQI (>100). The high Fetot content in some samples resulted in the WQI being moved to the “unsuitable” category. The spatial distribution of the WQI also showed that unsuitable water accumulated in certain locations in the sand spit, especially in the central part of the region. The results showed that human activities such as fertilizer use and septic tank leakage can significantly affect groundwater quality and be associated with Fe leaching from the geological materials. Most sand grains in dune sequences in northern Sri Lanka are coated with iron-rich materials leached by reductive dissolution [17,18]. The addition of organic-rich wastewater to aquifers promotes the reductive dissolution of Fe in aquifer materials, thereby increasing the iron content [29].

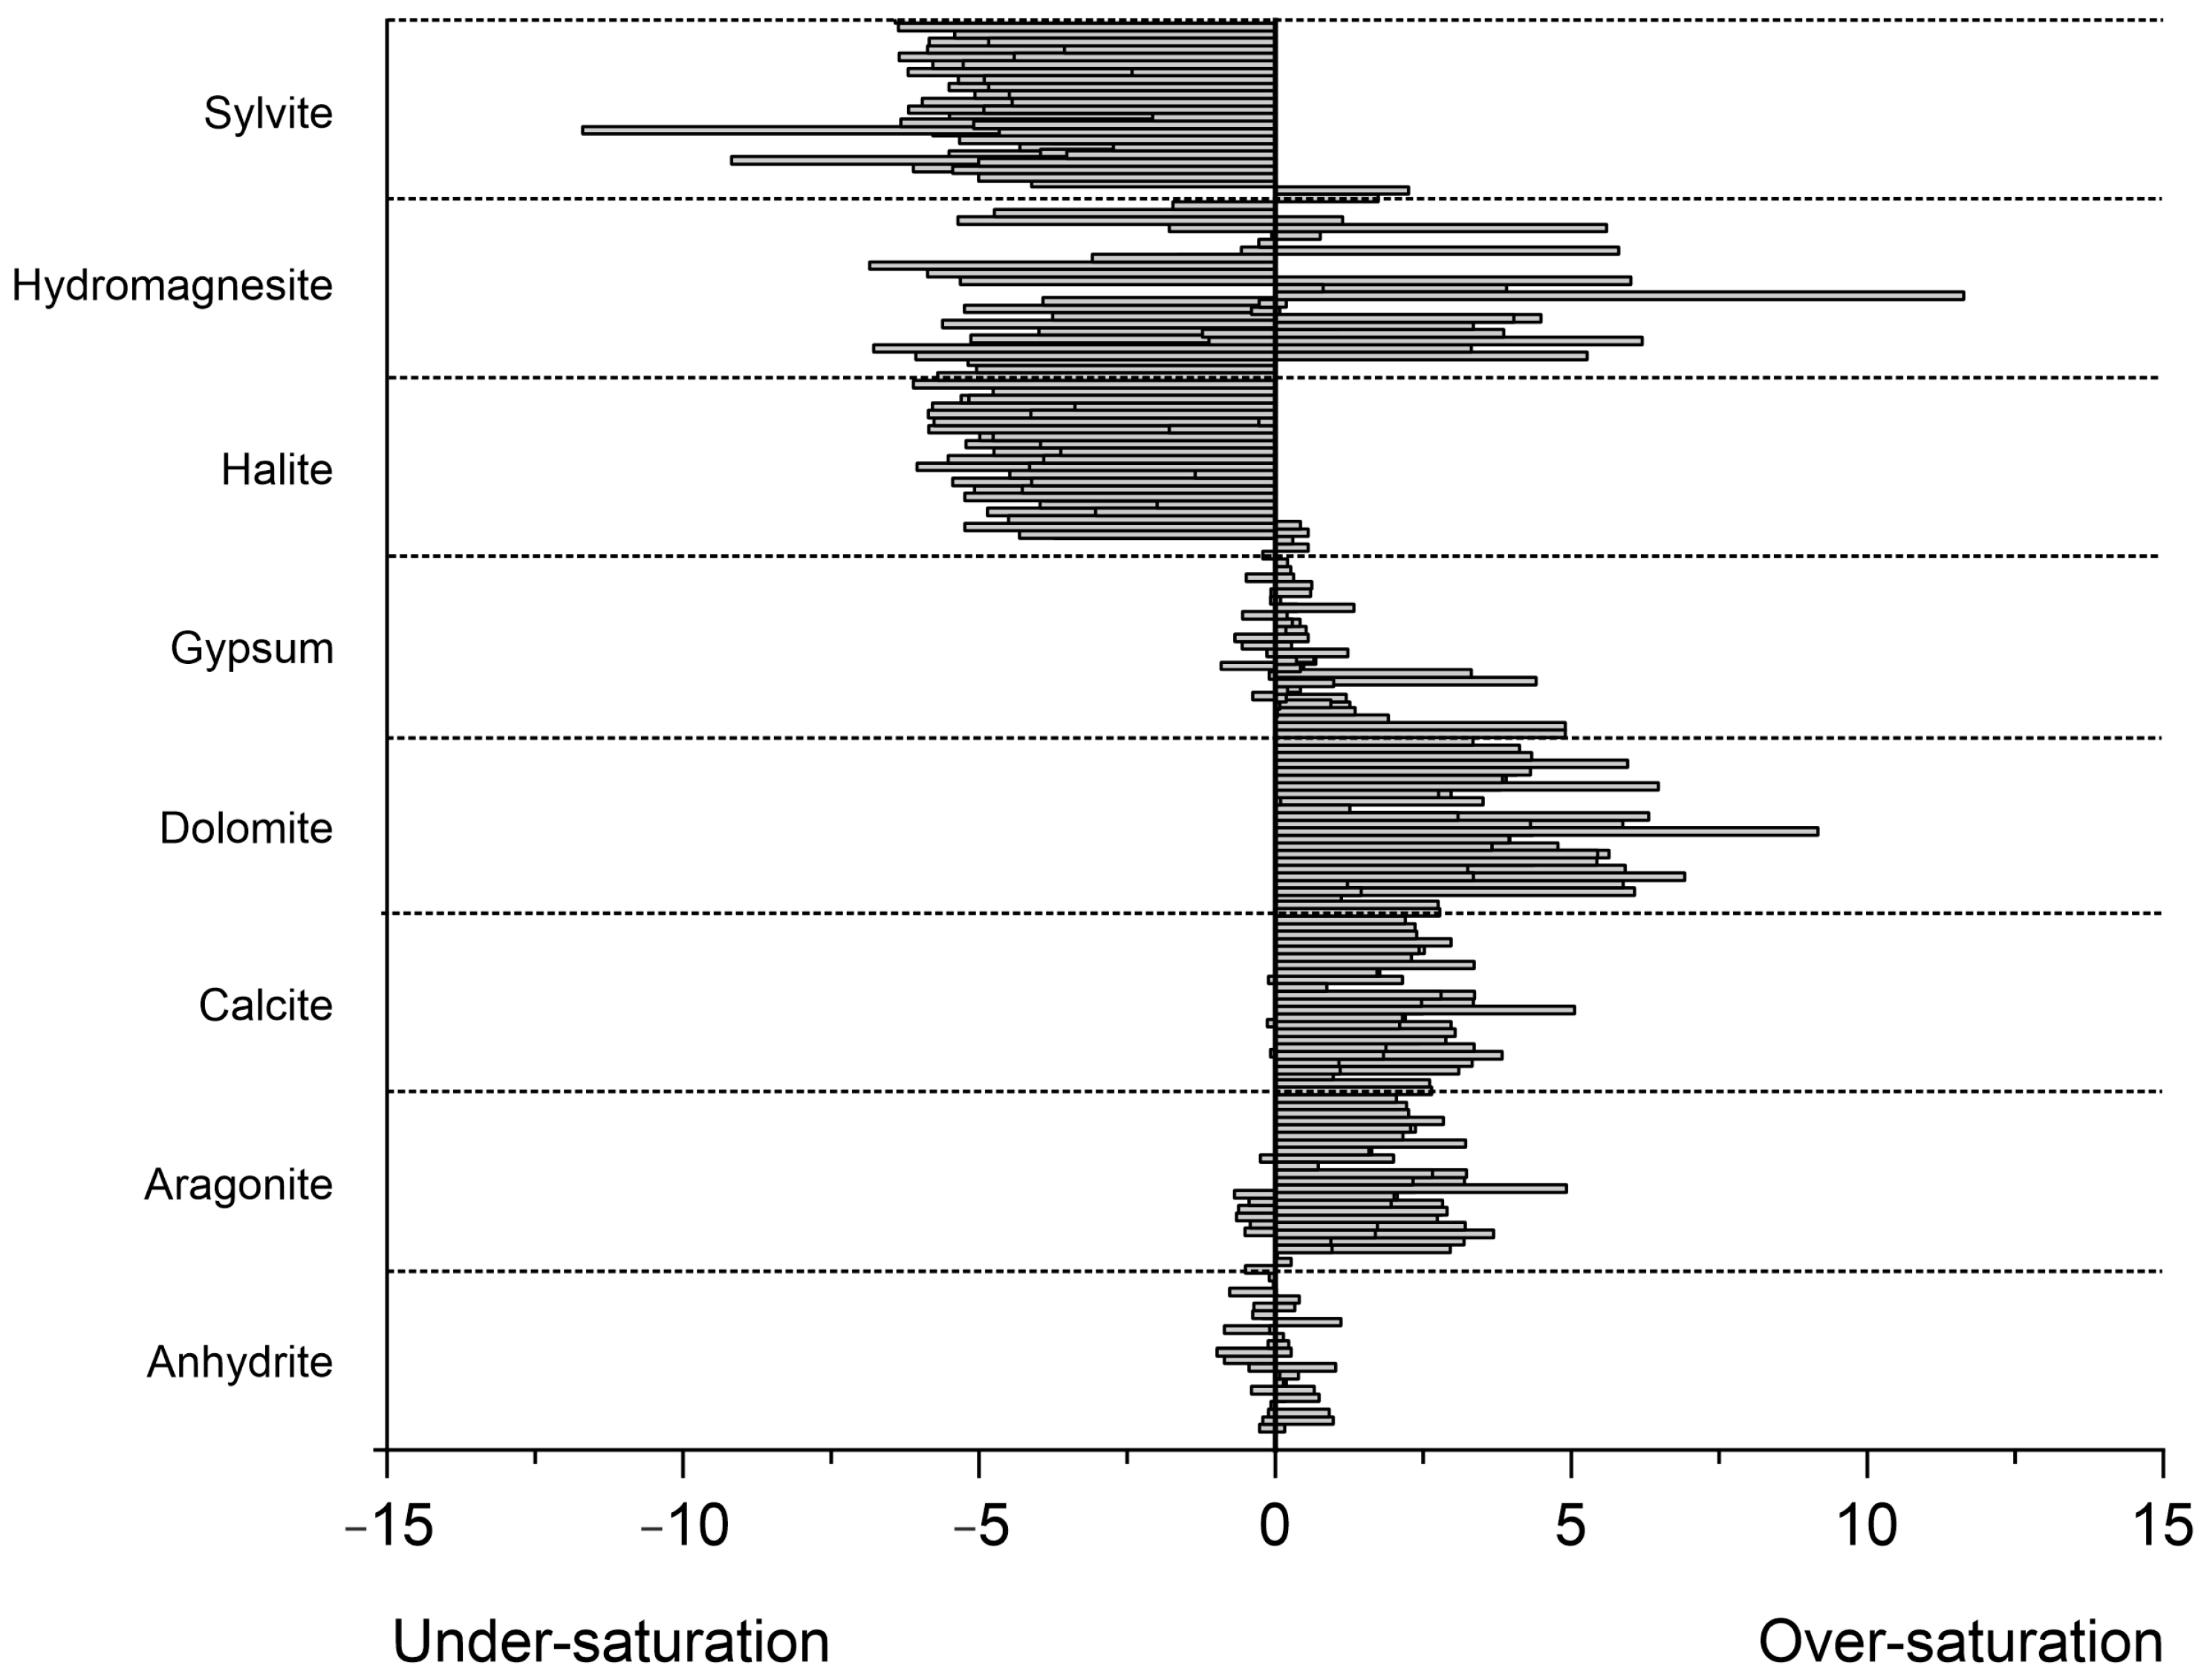
3.2. Saturation Index of Groundwater

PHREEQC simulation determines the mineral phase saturation index (SI) in aqueous systems and various mixtures. A positive SI indicates saturation or super-saturation, while negative values indicate under-saturation of mineral phases. The saturation index (SI) of typical mineral phases in the studied groundwater samples was calculated using PHREEQC version 3 [45]. Although the simulation provided different mineral phases based on the input of different geochemical compositions, only phases with positive values in most samples and some other essential phases related to seawater intrusion were discussed. Most of the groundwater in the coastal section was saturated with mineral phases containing Ca and Mg, such as calcite, dolomite, magnesite and gypsum. At the same time, it is highly undersaturated with alkali halides (Figure 4). Of the groundwater samples, 45% were slightly under-saturated or near equilibrium (−0.98 to +0.41) for anhydrite (CaSO4) and gypsum (CaSO4 · 2H2O). However, the mineral phases aragonite (98%), calcite (98%) and dolomite (96%) were slightly saturated, in many groundwater samples examined.
Figure 4. Saturation indices of major alkali and alkaline earth minerals in groundwater from the Mullaitivu–Point Pedro region were calculated using the PHREEQC simulation.
Water 17 01571 g004

3.3. Isotope Characteristics

In the study area, the stable isotopes of δ18O and δ2H for groundwater were between −9.0 and 1.6‰ and between −61.1 and −14.34‰, respectively, except for sample J38, which showed values of +1.46‰ and −0.69‰ (Table 2). The water isotope values of groundwater form a local evaporation line that follows a trend of δ2H = 6.3δ18O − 1.39 (r = 0.984). A local meteoric water line (LMWL) with a regression of δ2H = 8.5δ18O +15.0 is available for the Jaffna region [46] (Figure 5a). Almost 50% of the water samples examined were scattered near the LMWL, indicating rapid infiltration of precipitation through porous and permeable sand layers. Rainfall in this area is mainly confined to the Indian winter monsoon season. In this region, most rain falls in October–November (average 290 mm), with an average δ18O and δ2H of −6.35 and −40.1‰ [46]. Relatively low groundwater isotope values (e.g., J23) indicate a rapid response to heavy monsoon rainfall in the region. However, samples that deviate from the LMWL may be due to mixing with seawater or the influence of evaporation. The relationship between Cl and δ18O showed that samples with similarly low Cl have greater variations in δ18O. This suggests that evaporation is a major contributor to shallow groundwater in the study area (Figure 5b). The increasing Cl values (e.g., samples J2, J37 and J47) associated with isotopic enrichment may indicate groundwater mineralization due to halite dissolution or contamination from other sources rather than seawater intrusion. Some groundwater samples near the shore (e.g., J36 and J41) showed more obvious admixtures of seawater.

4. Conclusions

This study provides a comprehensive geochemical assessment of groundwater in the Mullaitivu to Point Pedro sandy aquifer system in northern Sri Lanka, revealing significant quality concerns linked to both natural processes and human activities. The findings indicate that shallow groundwater in this coastal region is highly vulnerable to contamination from seawater intrusion, septic tank leakage, fertilizer use and the geogenic release of iron through reductive dissolution processes. Elevated Cl/Br ratios proved effective in distinguishing between saline and anthropogenic sources of contamination. Furthermore, the presence of high iron concentrations in most wells, with over 90% exceeding WHO limits, raises serious concerns about the potability and agricultural usability of the water. Water Quality Index (WQI) analysis showed that nearly 80% of the groundwater samples fall into the categories of poor, very poor or unsuitable for drinking, underscoring the urgent need for sustainable groundwater management. The results also highlight the importance of monitoring isotope signatures and mineral saturation states to understand infiltration patterns and geochemical evolution. Ultimately, this study emphasizes the critical necessity for integrated water quality management strategies in vulnerable coastal aquifers, particularly in regions experiencing rapid resettlement, agricultural intensification and climate stress. However, an investigation of the mineralogical and geochemical properties of aquifer materials is required to understand the mechanism of groundwater mineralization in the area.

Supplementary Materials

The following supporting information can be downloaded at: https://www.mdpi.com/article/10.3390/w17111571/s1, Table S1: Calculated water quality index (WQI).

Author Contributions

Data curation, M.S.R. and S.D.; Formal analysis, S.L.S., C.B. and S.W.; Investigation, M.S.R., S.D. and C.B.; Methodology, S.L.S., S.D. and C.B.; Project administration, R.C.; Resources, C.B., S.W. and R.C.; Supervision, R.C.; Validation, R.C.; Visualization, R.C.; Writing—original draft, M.S.R. and S.L.S.; Writing—review and editing, S.W. and R.C. All authors have read and agreed to the published version of the manuscript.

Funding

This research received no external funding.

Data Availability Statement

Raw data of this study are available from the corresponding author upon reasonable request.

Conflicts of Interest

The authors declare no known competing financial interests or personal relationships that could have appeared to influence the work reported in this paper. The funding agency has no role in the study design, data collection and interpretation or the decision to submit the work for publication.

References

  1. Grönwall, J.; Danert, K. Regarding groundwater and drinking water access through a human rights lens: Self-supply as a norm. Water 2020, 12, 419. [Google Scholar] [CrossRef]
  2. Mukherjee, A.; Scanlon, B.R.; Aureli, A.; Langan, S.; Guo, H.; McKenzie, A. (Eds.) Global groundwater: From scarcity to security through sustainability and solutions. In Global Groundwater; Elsevier: Amsterdam, The Netherlands, 2021; Chapter 1; pp. 3–20. [Google Scholar]
  3. Pradhan, B.; Chand, S.; Chand, S.; Rout, P.R.; Naik, S.K. Emerging groundwater contaminants: A comprehensive review on their health hazards and remediation technologies. Groundw. Sustain. Dev. 2023, 20, 100868. [Google Scholar] [CrossRef]
  4. Kurwadkar, S.; Kanel, S.R.; Nakarmi, A. Groundwater pollution: Occurrence, detection, and remediation of organic and inorganic pollutants. Water Environ. Res. 2020, 92, 1659–1668. [Google Scholar] [CrossRef]
  5. Alfarrah, N.; Walraevens, K. Groundwater overexploitation and seawater intrusion in coastal areas of arid and semi-arid regions. Water 2018, 10, 143. [Google Scholar] [CrossRef]
  6. Han, D.; Currell, M.J. Review of drivers and threats to coastal groundwater quality in China. Sci. Total Environ. 2022, 806, 150913. [Google Scholar] [CrossRef]
  7. Boumaiza, L.; Chesnaux, R.; Drias, T.; Walter, J.; Huneau, F.; Garel, E.; Knoeller, K.; Stumpp, C. Identifying groundwater degradation sources in a Mediterranean coastal area experiencing significant multi-origin stresses. Sci. Total Environ. 2020, 746, 141203. [Google Scholar] [CrossRef]
  8. Winid, B.; Maruta, M. Assessment of Groundwater (Main Usable Aquifer) Vulnerability to Seawater Intrusion in the Polish Baltic Coastal Region. Water 2025, 17, 336. [Google Scholar] [CrossRef]
  9. Li, J.; Zhou, Y.; Liu, C.; Zhang, S.; Yao, F.; Yang, G.; Hou, W. Geochemical Exploration Techniques with Deep Penetration: Implications for the Exploration of Concealed Potash Deposits in the Covered Area on the Southern Margin of the Kuqa Basin. Water 2025, 17, 298. [Google Scholar] [CrossRef]
  10. Eggenkamp, H. The Geochemistry of Stable Chlorine and Bromine Isotopes; Springer: Berlin/Heidelberg, Germany, 2014. [Google Scholar] [CrossRef]
  11. Sebastian, S.; Górecka, A.; Wojtal-Frankiewicz, A. The effects of road salt on freshwater ecosystems and solutions for mitigating chloride pollution—A review. Sci. Total Environ. 2022, 805, 150289. [Google Scholar] [CrossRef]
  12. Xaza, A.; Mapoma, H.W.T.; Abiye, T.A.; Clarke, S.; Kanyerere, T. Investigating Seawater Intrusion in Republic of South Africa’s Heuningnes, Cape Agulhas Using Hydrogeochemistry and Seawater Fraction Techniques. Water 2023, 15, 2141. [Google Scholar] [CrossRef]
  13. Ratnayake, A.S.; Perera, U.L.H.P. Coastal zone management in Sri Lanka: A lesson after recent naval accidents. Mar. Pollut. Bull. 2022, 182, 113994. [Google Scholar] [CrossRef] [PubMed]
  14. Dissanayake, C.B.; Chandrajith, R. The hydrogeological and geochemical characteristics of groundwater of Sri Lanka. In Groundwater of South Asia; Mukherjee, A., Ed.; Springer: Singapore, 2018; pp. 405–428. [Google Scholar] [CrossRef]
  15. Bandara, U.G.C.; Diyabalanage, S.; Barth, J.A.C.; Chandrajith, R. Recharging mechanisms and seawater intrusion in karst aquifers in northwest Sri Lanka, based on hydrogeochemistry and water isotopes. ACS EST Water 2023, 3, 1678–1686. [Google Scholar] [CrossRef]
  16. Jayathunga, K.; Diyabalanage, S.; Frank, A.H.; Chandrajith, R.; Barth, J.A.C. Influences of seawater intrusion and anthropogenic activities on shallow coastal aquifers in Sri Lanka: Evidence from hydrogeochemical and stable isotope data. Environ. Sci. Pollut. Res. 2020, 27, 23002–23014. [Google Scholar] [CrossRef]
  17. Bandara, U.G.C.; Diyabalanage, S.; Hanke, C.; van Geldern, R.; Barth, J.A.C.; Chandrajith, R. Arsenic-rich shallow groundwater in sandy aquifer systems buffered by rising carbonate waters: A geochemical case study from Mannar Island, Sri Lanka. Sci. Total Environ. 2018, 633, 1352–1359. [Google Scholar] [CrossRef] [PubMed]
  18. Amarathunga, U.; Diyabalanage, S.; Bandara, U.G.C.; Chandrajith, R. Environmental factors controlling arsenic mobilization from sandy shallow coastal aquifer sediments in the Mannar Island, Sri Lanka. Appl. Geochem. 2019, 100, 152–159. [Google Scholar] [CrossRef]
  19. Jayasekera, D.L.; Kaluarachchi, J.J.; Villholth, K.G. Groundwater stress and vulnerability in rural coastal aquifers under competing demands: A case study from Sri Lanka. Environ. Monit. Assess. 2011, 176, 13–30. [Google Scholar] [CrossRef]
  20. Sivashanthini, K.; Dhanushka Dilini, J.; Shivatharshini, Y.; Gunaalan, K. Quantitative analysis of trace metal In water and soft tissues of Balanus Amphitrite In Nandikadal lagoon, Sri Lanka, 2019. In Proceedings of the 2nd International Conference on Research in Science, Engineering and Technology, Paris, France, 22–24 November 2019. [Google Scholar]
  21. Abbasi, T.; Abbasi, S.A. (Eds.) Water-Quality Indices: Looking Back, Looking Ahead. In Water Quality Indices; Elsevier: Amsterdam, The Netherlands, 2012; Chapter 16; pp. 353–356. [Google Scholar]
  22. Sutadian, A.D.; Muttil, N.; Yilmaz, A.G.; Perera, B.J.C. Development of river water quality indices—A review. Environ. Monit. Assess. 2015, 188, 58. [Google Scholar] [CrossRef]
  23. Uddin, M.G.; Nash, S.; Olbert, A.I. A review of water quality index models and their use for assessing surface water quality. Ecol. Indic. 2021, 122, 107218. [Google Scholar] [CrossRef]
  24. Brown, R.M.; McClelland, N.I.; Deininger, R.A.; O’Connor, M.F. A Water Quality Index-Crashing the Psychological Barrier. In Indicators of Environmental Quality; Springer: Boston, MA, USA, 1972; pp. 173–182. [Google Scholar] [CrossRef]
  25. WHO. Guidelines for Drinking-Water Quality, 3rd ed.; World Health Organization: Geneva, Switzerland, 2011; p. 216. [Google Scholar]
  26. Bijay, S.; Craswell, E. Fertilizers and nitrate pollution of surface and ground water: An increasingly pervasive global problem. SN Appl. Sci. 2021, 3, 518. [Google Scholar] [CrossRef]
  27. Han, D.; Post, V.E.A.; Song, X. Groundwater salinization processes and reversibility of seawater intrusion in coastal carbonate aquifers. J. Hydrol. 2015, 531, 1067–1080. [Google Scholar] [CrossRef]
  28. Reay, W.G. Septic tank impacts on ground water quality and nearshore sediment nutrient flux. Groundwater 2004, 42, 1079–1089. [Google Scholar] [CrossRef]
  29. Huang, G.; Han, D.; Song, J.; Li, L.; Pei, L. A sharp contrasting occurrence of iron-rich groundwater in the Pearl River Delta during the past dozen years (2006–2018): The genesis and mitigation effect. Sci. Total Environ. 2022, 829, 154676. [Google Scholar] [CrossRef]
  30. Antony, S.; Dev, V.V.; Kaliraj, S.; Ambili, M.S.; Krishnan, K.A. Seasonal variability of groundwater quality in coastal aquifers of Kavaratti Island, Lakshadweep Archipelago, India. Groundw. Sustain. Dev. 2020, 11, 100377. [Google Scholar] [CrossRef]
  31. Mora, A.; Mahlknecht, J.; Ledesma-Ruiz, R.; Sanford, W.E.; Lesser, L.E. Dynamics of major and trace elements during seawater intrusion in a coastal sedimentary aquifer impacted by anthropogenic activities. J. Contam. Hydrol. 2020, 232, 103653. [Google Scholar] [CrossRef]
  32. Gopinath, S.; Srinivasamoorthy, K.; Saravanan, K.; Prakash, R. Tracing groundwater salinization using geochemical and isotopic signature in Southeastern coastal Tamilnadu, India. Chemosphere 2019, 236, 124305. [Google Scholar] [CrossRef] [PubMed]
  33. Sarker, M.R.; Van Camp, M.; Hossain, D.; Islam, M.; Ahmed, N.; Karim, M.; Bhuiyan, A.Q.; Walraevens, K. Groundwater salinization and freshening processes in coastal aquifers from southwest Bangladesh. Sci. Total Environ. 2021, 779, 146339. [Google Scholar] [CrossRef]
  34. Skrzypek, G.; Dogramaci, S.; Grierson, P.F. Geochemical and hydrological processes controlling groundwater salinity of a large inland wetland of northwest Australia. Chem. Geol. 2013, 357, 164–177. [Google Scholar] [CrossRef]
  35. Howcroft, W.; Cartwright, I.; Fifield, L.K.; Cendón, D.I. Differences in groundwater and chloride residence times in saline groundwater: The Barwon River Catchment of Southeast Australia. Chem. Geol. 2017, 451, 154–168. [Google Scholar] [CrossRef]
  36. Magazinovic, R.S.; Nicholson, B.C.; Mulcahy, D.E.; Davey, D.E. Bromide levels in natural waters: Its relationship to levels of both chloride and total dissolved solids and the implications for water treatment. Chemosphere 2004, 57, 329–335. [Google Scholar] [CrossRef]
  37. Stumm, W.; Morgan, J.J. Aquatic Chemistry: Chemical Equilibria and Rates in Natural Waters; Wiley: Hoboken, NJ, USA, 2012. [Google Scholar]
  38. Davis, S.N.; Whittemore, D.O.; Fabryka-Martin, J. Uses of chloride/bromide ratios in studies of potable water. Groundwater 1998, 36, 338–350. [Google Scholar] [CrossRef]
  39. Katz, B.G.; Griffin, D.W.; McMahon, P.B.; Harden, H.S.; Wade, E.; Hicks, R.W.; Chanton, J.P. Fate of efluent-borne contaminants beneath septic tank drainfields overlying a karst aquifer. J. Environ. Qual. 2010, 39, 1181–1195. [Google Scholar] [CrossRef] [PubMed]
  40. Vengosh, A.; Pankratov, I. Chloride/bromide and chloride/fluoride ratios of domestic sewage effluents and associated contaminated ground water. Groundwater 1998, 36, 815–824. [Google Scholar] [CrossRef]
  41. Katz, B.G.; Eberts, S.M.; Kauffman, L.J. Using Cl/Br ratios and other indicators to assess potential impacts on groundwater quality from septic systems: A review and examples from principal aquifers in the United States. J. Hydrol. 2011, 397, 151–166. [Google Scholar] [CrossRef]
  42. Hem, J.D. Study and Interpretation of the Chemical Characteristics of Natural Water; US Geological Survey Water Supply Paper; Geological Survey: Alexandria, VA, USA, 1992. [Google Scholar]
  43. Chandrajith, R.; Bandara, U.G.C.; Diyabalanage, S.; Senaratne, S.; Barth, J.A.C. Application of water quality index as a vulnerability indicator to determine seawater intrusion in unconsolidated sedimentary aquifers in a tropical coastal region of Sri Lanka. Groundw. Sustain. Dev. 2022, 19, 100831. [Google Scholar] [CrossRef]
  44. Udeshani, W.A.C.; Dissanayake, H.M.K.P.; Gunatilake, S.K.; Chandrajith, R. Assessment of groundwater quality using water quality index (WQI): A case study of a hard rock terrain in Sri Lanka. Groundw. Sustain. Dev. 2020, 11, 100421. [Google Scholar] [CrossRef]
  45. Parkhurst, D.L.; Appelo, C.A.J. Description of input and examples for PHREEQC version 3—A computer program for speciation, batch-reaction, one-dimensional transport, and inverse geochemical calculations. US Geol. Surv. Tech. Methods 2013, 6, 497. [Google Scholar]
  46. Edirisinghe, E.A.N.V.; Karunarathne, G.R.R.; Tilakarathna, I.A.N.D.P.; Gunasekara, J.D.C.; Priyadarshanee, K.S.G.S. Isotope and chemical assessment of natural water in the Jaffna Peninsula in northern Sri Lanka for groundwater development aspects. Isot. Environ. Health Stud. 2020, 56, 205–219. [Google Scholar] [CrossRef]
Figure 1. Map showing the Jaffna Peninsula with the Mullaitivu–Point Pedro spit landform and sampling sites of sampled domestic wells.
Water 17 01571 g001
Figure 2. Modified Piper plot illustrating the distribution of groundwater samples from the Mullaitivu–Point Pedro region, categorized into distinct geochemical facies (1—Fresh; 2—Slightly fresh; 3—Freshening; 4—Slight intrusion; 5—Intrusion; 6—Slight conservative mixing; 7—Conservative mixing).
Water 17 01571 g002
Figure 3. Cl/Br ratios versus chloride concentrations in groundwater samples (black dots) from Mulaitiuv–Point Pedro sand spit with seawater [42]; septic tank leachates [41], sewage [40], halite [41], precipitation and groundwater [38].
Water 17 01571 g003
Figure 5. (a) Stable isotope compositions (δ18O and δ2H) of shallow groundwater in the Mullaitivu–Point Pedro region with respect to the Local Meteoric Water Line (LMWL) (after Edirisinghe et al., 2020) [46] and (b) Binary plot between chloride and δ18O in the study region.
Water 17 01571 g005
Table 1. Summary statistics of groundwater samples collected from the Mullaitivu–Point Pedro region of northern Sri Lanka.
Percentile
UnitMinimumMaximumMean25% (Q1)50% (Q2)75% (Q3)
Temp°C27.435.929.228.529.129.7
pH 5.539.167.106.577.247.50
ECµS/cm167111401323337449988
HCO3mg/L24.990215668.1132195
Clmg/L8.562755215.817.543.2154.6
Fmg/L0.0021.1500.1640.0260.0590.138
SO42−mg/L3.1823153.414.033.375.38
Brmg/L0.072.940.550.190.350.68
NO3mg/L2.2121.697.824.876.2010.62
Namg/L4.78130888.613.231.959.4
Kmg/L0.4072.47.021.502.455.26
Camg/L10.554885.835.949.689.0
Mgmg/L0.1896.113.73.886.5118.2
Alµg/L4.2441635.815.222.937.5
Mnµg/L0.7870976.83.1427.964.6
Feµg/L1104279138374811831622
Srµg/L41.92370400131281452
Baµg/L5.6871010719.740.5134
δ2H−61.1−0.69−37.4−45.1−36.7−33.8
δ18O−8.941.46−5.68−6.82−5.81−5.22
Table 2. Classification of groundwater quality in the Mullaitivu–Point Pedro region according to WQI values.
Type of Water QualityWQI RangeNumber of Samples% of Samples
Excellent<2524
Good26–50816
Poor51–752039
Very poor (Inferior)76–100510
Unsuitable>1001631
Disclaimer/Publisher’s Note: The statements, opinions and data contained in all publications are solely those of the individual author(s) and contributor(s) and not of MDPI and/or the editor(s). MDPI and/or the editor(s) disclaim responsibility for any injury to people or property resulting from any ideas, methods, instructions or products referred to in the content.

