Article

Biofilm Characteristics and Microbial Community Structure in Pipeline Systems Using Tea Polyphenols as Disinfectant

1
Key Laboratory of Urban Stormwater System and Water Environment, Beijing University of Civil Engineering and Architecture, Ministry of Education, Beijing 100044, China
2
School of Environmental Science & Engineering, Tianjin University, Tianjin 300354, China
3
Department of Equipment Engineering, Henan Technical College of Construction, Zhengzhou 450000, China
*
Author to whom correspondence should be addressed.
Water 2025, 17(10), 1545; https://doi.org/10.3390/w17101545
Submission received: 15 April 2025 / Revised: 18 May 2025 / Accepted: 19 May 2025 / Published: 21 May 2025
(This article belongs to the Section Urban Water Management)

Abstract

:
Polyphenols show promising application prospects as a novel natural disinfectant for drinking water. This study employed a simulated pipe network system to investigate the effects of tea polyphenols at an initial concentration of 5 mg/L on the characteristics of biofilm on pipe walls and microbial community succession patterns under different water ages (12–48 h). The results showed that with increasing water age, the tea polyphenol residual concentration gradually decreased, and the biofilm structure significantly evolved: the surface roughness increased from 5.57 nm to 32.8 nm, and the biofilm thickness increased from 40 nm to 150 nm. Microbial community diversity exhibited a trend of first increasing and then decreasing, with the Shannon index reaching its peak (2.847) at a water age of 36 h and remaining significantly higher than the control group (1.336) at all stages. High-throughput sequencing revealed a transition from a single dominant genus of Methylophilus (54.41%) at a water age of 12 h to a multi-genus coexistence pattern at a water age of 48 h, with Methylophilus (24.33%), unclassified_Saprospiraceae (21.70%), and Hydrogenophaga (16.52%) as the main dominant groups. Functional bacterial groups exhibited temporal changes, with biofilm colonization-related genera (Caulobacter, Sphingobium) reaching their peaks at 36 h, while special metabolic genera (Methylophilus, Hydrogenophaga) dominated at 48 h. Potential pathogens in the tea polyphenol treatment groups were effectively controlled at low levels (<0.21%), except for a temporary increase in Legionella (6.50%) at 36 h. Tea polyphenols’ selective inhibition mechanism helps suppress the excessive proliferation of specific genera and reduces the risk of potential pathogen outbreaks. This has important implications for ensuring the microbiological safety of drinking water.

1. Introduction

Disinfection serves as a critical step in drinking water treatment processes. It prevents and controls waterborne diseases while ensuring drinking water safety through the effective inactivation of pathogenic microorganisms [1]. Currently, drinking water disinfection technologies can be broadly classified into two principal categories: chemical disinfection and physical disinfection methods. Chlorine disinfection is widely utilized due to its low cost, simple operation, and excellent efficacy. However, chlorine readily reacts with natural organic matter (NOM) and synthetic organic compounds (SOCs) present in source waters to generate disinfection byproducts (DBPs) [2,3], which threaten human health. Ultraviolet (UV) disinfection, as a physical disinfection process, exhibits characteristics including short contact time, rapid action, and pronounced efficacy [4]. However, it consumes a high amount of energy and lacks residual disinfection effects in a pipeline. Additionally, certain bacteria possess photo-repair mechanisms [5,6]. These limitations create a compelling need for innovative disinfection agents that combine improved safety with enhanced treatment efficiency.
Tea polyphenols represent natural polyphenolic compounds extracted from tea leaves containing 65%~80% catechins, with epigallocatechin gallate (EGCG) accounting for approximately 59% of the total content [7]. Research demonstrates that tea polyphenols exhibit antioxidative, antitumor, and potent broad-spectrum antimicrobial properties [8,9,10,11]. They exert significant inhibitory effects against pathogenic microorganisms including Escherichia coli, Staphylococcus aureus, and Proteus species [12]. In drinking-water treatment, tea polyphenols not only demonstrate excellent sustained disinfection efficacy [13] but can also enhance other treatment processes through synergistic applications with ozone [14], ultraviolet irradiation [15], and ultrafiltration technologies [13], contributing significantly to drinking-water disinfection.
After the disinfected water enters the water distribution network, the surface of the pipe wall will gradually form a complex biofilm structure. These biofilms constitute dynamic systems composed of microbial cell assemblages embedded within a complex matrix of extracellular polymeric substances (EPSs) [16]. Specifically, biofilms comprise active microorganisms, inactive cells, and their metabolic products that collectively form microbial communities at the interface where water contact occurs [17]. Despite the implementation of multiple disinfection and management strategies in water treatment facilities and distribution networks, biofilms remain widely prevalent throughout water supply systems due to their ubiquity and persistence [18], providing ideal habitats for microbial survival, proliferation, and interaction [19]. The presence of biofilms accelerates disinfectant decay within distribution networks [20], adversely affecting water quality throughout the system. Biofilms continuously release microorganisms into the water and increase the concentration of planktonic bacteria during detachment events [21], elevating microbiological safety risks, which consequently affects water quality parameters including turbidity, color, and odor–taste characteristics.
Notably, cities with extensive distribution networks experience significant temporal variations in water delivery from treatment plants to different users. This temporal disparity consequently leads to distinct variations in water quality and biofilm characteristics throughout the distribution system. The impact of varying water age on biofilms in disinfected water distribution networks is significant. Longer water age at a distance from the water plant usually leads to more biofilm growth, as longer periods of time provide more time for microorganisms to attach and reproduce. This process typically causes the depletion of disinfectant residuals, thereby significantly compromising biofilm growth inhibition. Conversely, pipeline segments adjacent to the water treatment plant maintain elevated disinfectant concentrations through optimized water age control, thereby effectively suppressing biofilm growth. Generally, network sections with extended water age may develop thicker and more dense biofilm structures [22]. Different water ages similarly influence the microbial community composition within biofilms. Some studies have identified that extended water age may lead to more diverse microbial communities [23].
Despite existing research confirming the significant antimicrobial activity and broad-spectrum inhibitory effects of tea polyphenols, their application characteristics in water distribution systems remain unclear. This is particularly evident in networks of varying scales under conditions of changing water age. The microscopic structural characteristics of pipe wall biofilms have not been thoroughly elucidated. Microbial community composition and succession patterns remain insufficiently investigated. Dynamic changes in key functional microbial communities and inhibitory efficacy against potential pathogens have not been adequately elucidated.
While previous studies have explored various aspects of tea polyphenols as antimicrobial agents, research on their application in water distribution systems remains limited. Results have shown that the recommended dosage of TP for water treatment after ultrafiltration (UF) is 5 mg/L [8], which can effectively inhibit bacterial growth and maintain the disinfectant effect for up to 48 h. This dosage is considered safe for human consumption, with daily intake levels of at most 300 mg substantially below the safety thresholds for tea polyphenols [7].
Aiming at ensuring the water quality microbial safety in a pipeline network, the effects of tea polyphenols at this dosage level on biofilm development and microbial community succession in drinking water distribution systems under varying water ages were systematically investigated. Specifically, we focused on examining the characteristics of pipe wall biofilms, the difference between biofilm structures at different water ages, and microbial community succession patterns, as well as evaluating tea polyphenols’ selective inhibition mechanisms against microbial communities and potential pathogens. The findings from this study provide important theoretical support for the research and application of tea polyphenols as a novel disinfectant.

2. Materials and Methods

2.1. Experimental System Design

Five sets of parallel biofilm annular reactors (BARs) were constructed in this study to simulate water distribution networks of varying scales. The reactor has an effective volume of 6 L. Both the top and bottom of the reactor are sealed with black acrylic panels to ensure light isolation. The main body of the reactor was wrapped with aluminum foil to simulate the dark environment typically found in pipeline networks. Ductile iron coupons (50.0 mm × 25.0 mm × 2.0 mm) were installed inside the reactor to simulate pipeline conditions. These coupons were securely fixed using acrylic glass guides, simulation device of dynamic test pipeline. The experimental system design of biofilm annular reactors (BARs) is shown in Figure 1. A close-up view of a single reactor is shown in Figure 2.
Based on investigations of water supply networks in multiple cities across China, it was determined that the water age within these networks generally does not exceed 48 h. In order to simulate different water age conditions, the hydraulic retention time within the reactor was controlled by adjusting the influent flow rate. Reactor 1#, 2#, 3#, and 4# simulated pipeline locations with water ages of 12 h, 24 h, 36 h, and 48 h, respectively, while reactor 5# was used as the control group, and the water age was 48 h without adding tea polyphenols.
To simulate the flow velocity of the pipeline network, the internal stirrer speed of the reactors was set to 60 rpm [24]. The experimental water temperature was maintained at 25 ± 1 °C. The formulae for controlling water age by regulating the reactor influent flow rate and the specific flow rates of the influent pumps are shown in the following equations:
Q = V/T
Q#1 = 6 L/12 h = 0.139 mL/min
Q#2 = 6 L/24 h = 0.069 mL/min
Q#3 = 6 L/36 h = 0.046 mL/min
Q#4,#TB = 6 L/48 h = 0.037 mL/min
To study biofilm formation under different water age conditions, we employed a natural development approach rather than artificial inoculation. The ductile iron coupons were first cleaned with acetone to remove manufacturing residues, rinsed with deionized water, air-dried, and sterilized by autoclaving at 121 °C for 20 min before installation in the reactors. The biofilm development progressed through three phases: initial attachment (approximately one week), growth and maturation (another one and two weeks), followed by a stabilization phase where consistent biofilm characteristics were observed. At this stage, a comprehensive analysis of the morphological characteristics and microbial community structure of the biofilm on the coupons in each reactor was conducted to ensure that the obtained data accurately reflected the stable effects of tea polyphenols under different water age conditions.

2.2. Water Quality Parameters and Operating Conditions

The tea polyphenols used in the experiment were purchased from Nanjing Tianrun Biotechnology Co., Ltd. (Nanjing, China), with a purity of ≥98.0% AR grade.
The raw water used in the experiments was sourced from the effluent of a municipal water treatment plant. It underwent dechlorination using activated carbon and ultrafiltration through 0.01 μm membranes to simulate treated water after the water plant. This membrane size can effectively remove pathogenic microorganisms, including viruses. The primary water quality parameters of the raw water are shown in Table 1.
The initial concentration of tea polyphenols was set at 5 mg/L. The concentration of tea polyphenols in each reactor was monitored using UV–visible spectrophotometry. The residual concentrations measured at different water times are shown in Table 2.

2.3. Biofilm Characterization Methods

2.3.1. SEM Analysis

To characterize the morphological features of the biofilm, the surface morphology was examined using scanning electron microscopy (SEM). The sample preparation protocol was as follows: First, the slides were immersed in a 2.5% glutaraldehyde solution and fixed overnight at 4 °C. Subsequently, the samples were dehydrated using a graded ethanol series at concentrations of 25%, 50%, 75%, and 100%, with each concentration step lasting 30 min. Following dehydration, the samples were subjected to vacuum freeze drying for 6 h, after which they were sputter-coated with gold and observed using SEM.

2.3.2. AFM Analysis

To quantify the surface roughness of the biofilm, atomic force microscopy (AFM, Bruker Dimension Icon AFM, Billerica, MA, USA) was employed. After vacuum freeze drying for 6 h, the samples were scanned at a magnification of 400× to acquire surface roughness parameters (Ra) and three-dimensional topographic images. Measurements were performed on three randomly selected regions per sample, and the results were average.

2.3.3. CLSM Analysis

To visualize the activity of the biofilm, dual fluorescence staining was performed in conjunction with confocal laser scanning microscopy (CLSM, Zeiss LSM 880, Oberkochen, Germany). The fluorescence signals obtained were reconstructed in three dimensions using the ZEN Blue image analysis software (version 3.4), enabling the assessment of the spatial distribution patterns of live and dead bacteria within the biofilm.

2.4. CODMn Determination

We used the following procedure: Accurately pipette 20.00 mL of water sample into a 50 mL conical flask, add 2.00 mL of 30% sulfuric acid solution and 2.00 mL of 0.14 g/L potassium permanganate solution, mix well, and heat on an adjustable electric stove. Start timing when the solution begins to simmer, and maintain a gentle boiling state for 15 min. Immediately remove the conical flask, cool to room temperature, transfer the solution to a 25 mL stoppered colorimetric tube, dilute to the mark with distilled water, mix well, and let stand in the dark for 2 min. Measure the absorbance of the solution at a wavelength of 525 nm, using distilled water as a reference [25].

2.5. BDOC Determination

BDOC analysis was performed using the procedure proposed in [26]. Thiosulfate was added into the 250 mL filtered water samples to remove residual chlorine before inoculation with 2.5 mL of bulk water with bacteria. After the initial DOC concentrations in the water sample were measured, all the water samples were incubated in the dark at 20 °C. On day 28, the change between DOC0 and DOC28 was the BDOC value.

2.6. DNA Extraction and Sequencing

Due to the relatively low microbial concentration in the simulated pipeline water samples, microbial enrichment was achieved by filtration through a 0.22 μm pore size membrane. Genomic DNA was extracted from the samples using a commercial DNA extraction kit. The concentration and quality of the extracted DNA were accurately quantified using the Qubit dsDNA HS Assay Kit (Thermo Fisher Scientific, Waltham, MA, USA). The V3–V4 hypervariable regions of the bacterial 16S rRNA gene were amplified using the universal primers Nobar_34F (5′-CCTACGGGNGGWGCAG-3′) and Nobar_805R (5′-GACTACHVGGGTATCTAATCC-3′). PCR amplification was conducted under standard conditions to obtain target amplicons for downstream analysis. The purified PCR products were subjected to high-throughput sequencing. Resulting sequences were clustered into operational taxonomic units (OTUs) based on sequence similarity. Microbial community composition and structure were then analyzed based on the OTU data.

3. Results and Discussion

3.1. Effects of Tea Polyphenols on Water Quality

Changes in CODMn, BDOC, and total plate count at different water ages are shown in Figure 3.
As shown in Figure 3, with increasing water residence time in the distribution system, CODMn exhibited a consistent declining trend, gradually decreasing from the 12 h water age point to the 48 h water age point. This phenomenon indicates that tea polyphenols in water serve as an effective source of CODMn, and their degradation along the pipeline resulted in a continuous reduction in CODMn. Notably, at a water age of 48 h, the CODMn level in the tea polyphenol treatment group remained higher than that in the blank control, suggesting residual persistence within the system. With the progress of the experiment, the CODMn value of the experimental group fluctuated within a certain range, but the CODMn of the control group continued to decrease, indicating that the organic matter in it was continuously consumed.
Concurrently, Figure 3 demonstrates that BDOC displayed a trend of an initial increase followed by a decrease during the first 10 days of operation, which corresponds to the gradual stabilization process of microbial metabolic activities within the distribution network. The tea polyphenol treatment groups consistently maintained lower BDOC levels, indicating that tea polyphenols may selectively inhibit certain biodegradation processes and regulate the metabolic pathways of the microbial community.
In drinking water, biodegradable dissolved organic carbon (BDOC) serves as material and energy for bacterial growth, and can reflect the biological stability of microorganisms in water. The higher the BDOC concentration, the poorer the biological stability [26]. The changes in bacterial colony counts within the distribution network exhibited a significant correlation with BDOC variation trends, which can be categorized into three distinct phases: a growth phase (0–10 days), a transition phase (10–18 days), and a stability phase (after 18 days). During the initial phase, microorganisms began to attach to the pipe wall, forming punctate biofilms; however, as these biofilms were not yet firmly established, some microorganisms detached into the water phase due to hydraulic shear forces, resulting in elevated bacterial colony counts in the water. During the transition phase, biofilm detachment processes gradually diminished, and colony count fluctuations stabilized. After the stability phase was reached, relatively stable biofilm structures formed on the pipe wall surface, capable of withstanding hydraulic shear effects; concurrently, BDOC levels decreased, and bacterial colony counts in the water exhibited a declining trend. Importantly, across all water age conditions, the bacterial colony counts in tea polyphenol-treated distribution networks were consistently maintained below 100 CFU/L, demonstrating excellent microbial control efficacy.
The comprehensive analysis of CODMn, BDOC, and bacterial colony counts indicates that tea polyphenols as a disinfectant exert a dual regulatory mechanism in the distribution network: on one hand, they control microbial growth through direct antimicrobial action, and on the other hand, they influence biofilm development processes by modulating organic matter metabolic pathways. Even under low-concentration conditions, tea polyphenols can still maintain an effective influence on water quality, which provides significant reference value for disinfection practices in drinking water distribution systems.

3.2. Biofilm Morphological Characteristics

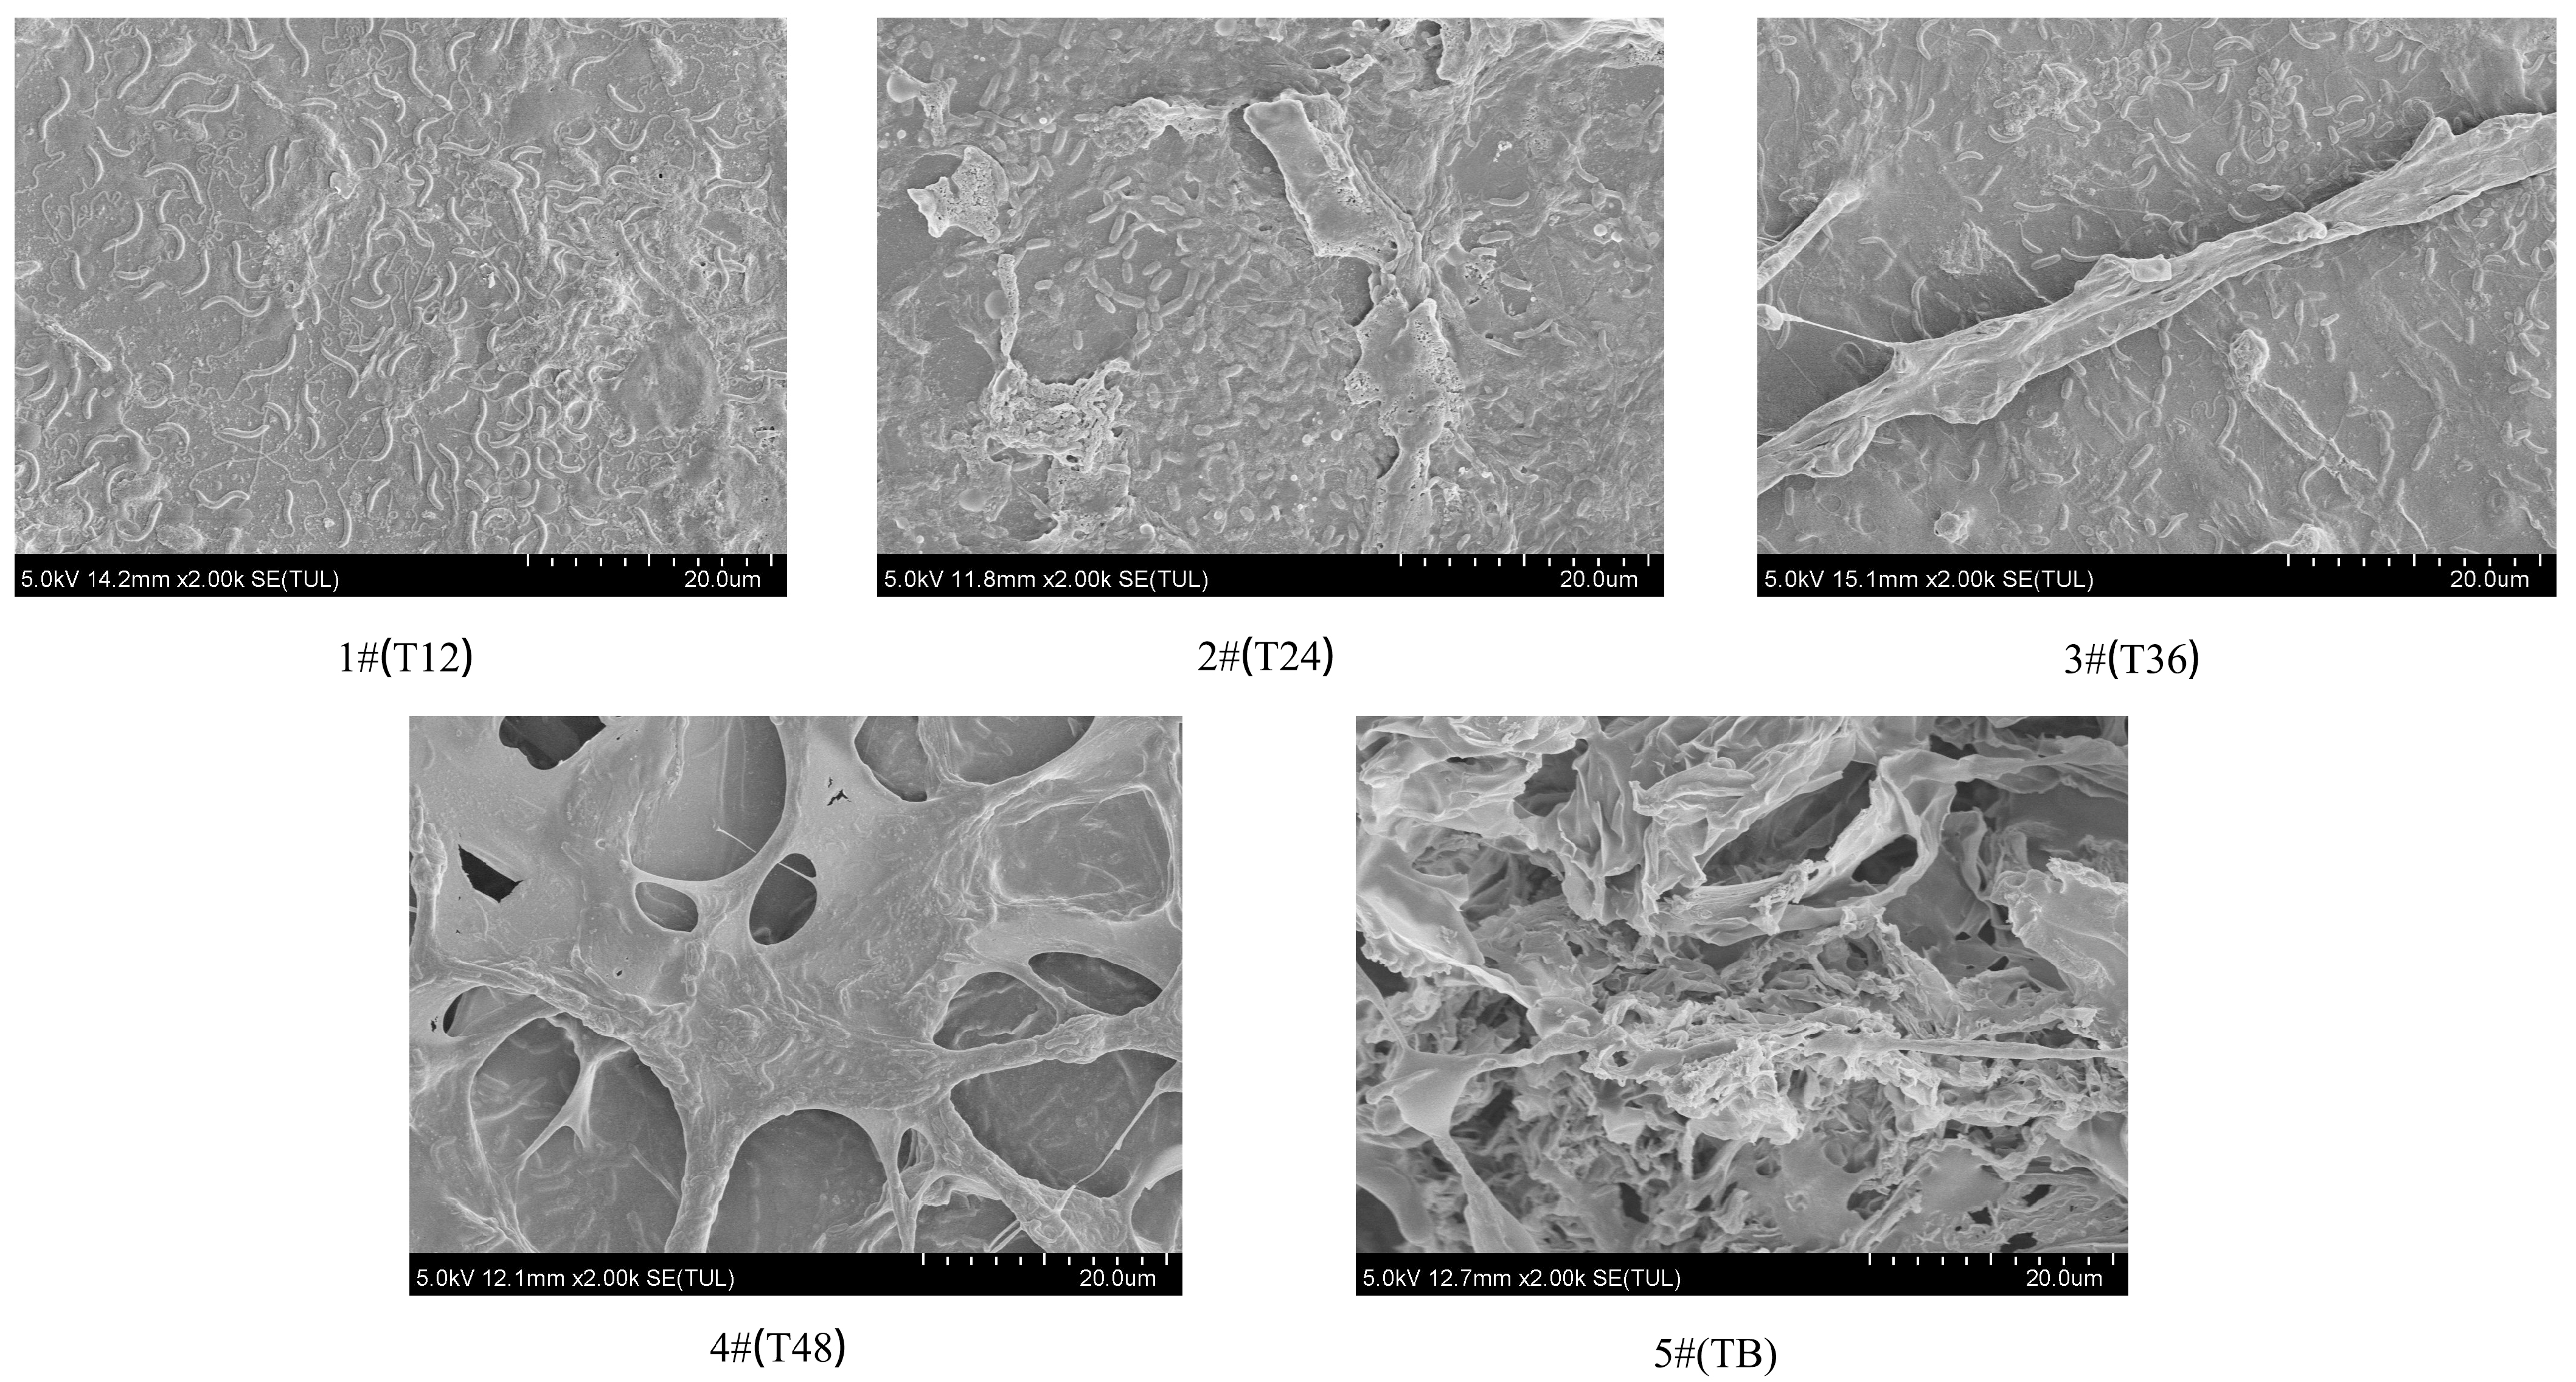
3.2.1. Surface Morphology

As shown in Figure 4 and Figure 5, the biofilm structure exhibited a significant evolution process with increasing water age.
As Figure 1 illustrates, the biofilm morphology attached to the carriers at different sampling points exhibits significant variations when observed under low magnification (500×). In the T12 reactor, the biofilm on coupons generally appears relatively flat, while in the T24 reactor, the biofilm on coupons begins to display a layered structure, with supporting structures emerging around the observation area. In the T36 reactor, the biofilm on coupons exhibits a distinct multi-layered structure, with horizontal columnar supporting structures observable within the observation area, indicating a significant increase in biofilm stratification. In the T48 reactor, the biofilm on coupons forms a relatively stable complex structure with rich stratification. The microbial diversity and abundance significantly increase in this reactor. Regarding the blank control TB reactor, highly enriched clustered structures develop on the biofilm coupons, with different parts mutually supporting each other.
Under high magnification (2000×), more detailed microbial composition and distribution patterns become observable. The biofilm on coupons in the T12 reactor primarily consists of uniformly distributed flagellated rod bacteria. Non-flagellated rod bacteria begin to appear on the coupon biofilms in the T24 reactor. The biofilm on coupons in the T36 reactor forms a multi-layered structure, with microorganisms beginning to embed within these structures. The bacterial distribution in the bottom layer of the biofilms on these coupons appears slightly sparser compared to that in the T12 reactor. The biofilm on coupons in the T48 reactor exhibits characteristic reticular multi-layered structures, with rod bacteria and cocci as the predominant microbial communities. No spiral bacteria are observed on these coupons. These microorganisms primarily attach to the network-like structures of the biofilm.
The biofilm on coupons in the blank control (TB) reactor presents complex architecture with higher porosity. These observations indicate that with the extension of sludge retention time and the decrease in tea polyphenol concentration, the biofilm attached to coupons in the simulated pipeline exhibits a continuous development process, characterized by the enrichment of stratification and an increase in microbial abundance. Additionally, the biofilm structures and their microbial community compositions at different monitoring points within the pipe network demonstrate significant variations.

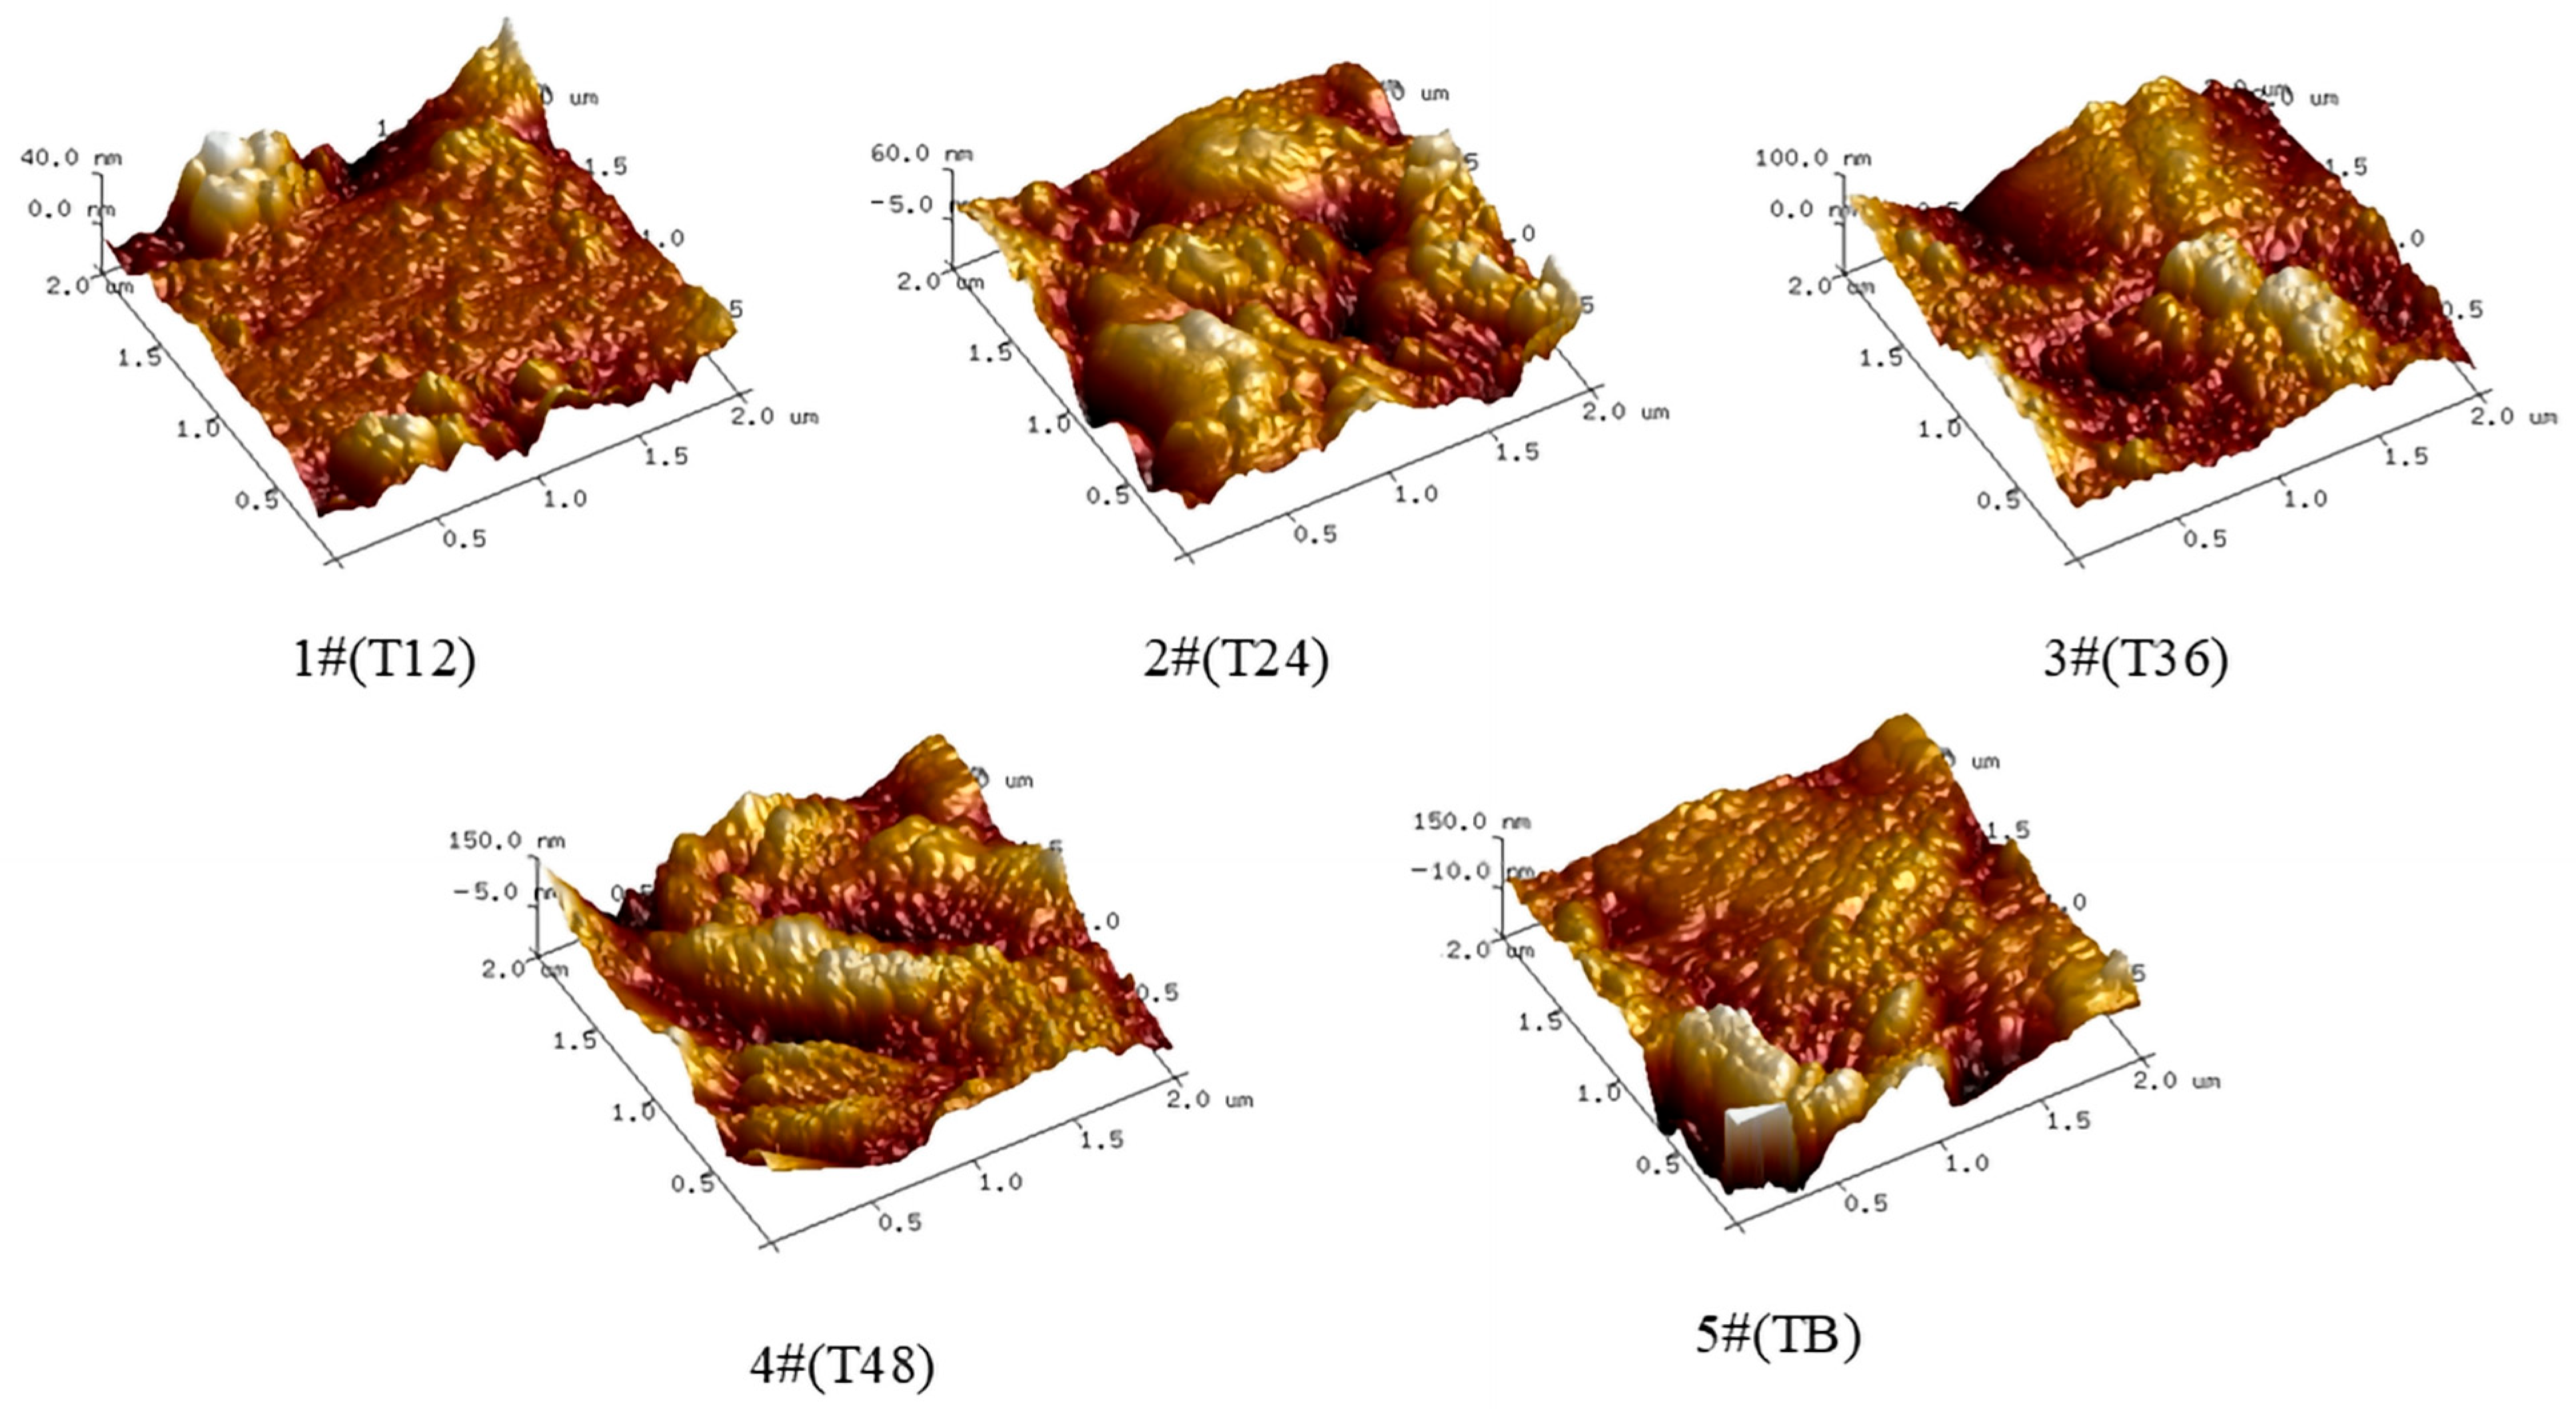
3.2.2. Roughness and Thickness Analysis

Figure 6 displays three-dimensional topographic images of biofilms from reactors with varying water ages, while Table 3 summarizes the corresponding surface roughness (Ra) and biofilm thickness data.
Atomic force microscopy observations reveal significant changes in biofilm surface characteristics with increasing water age. As the water age increases, the surface roughness Ra value gradually increases from 5.57 nm in T12 to 13.9 nm in T24 and 21.3 nm in T36, ultimately reaching 32.8 nm in T48. Similarly, the maximum thickness in the observed regions exhibits a comparable growth trend, increasing from 40 nm in T12 to 150 nm in T48. Notably, the biofilm surface roughness (32.8 nm) and maximum thickness (150 nm) in the T48 reactor are extremely close to the values of the blank control group TB (Ra = 32.1 nm, maximum thickness 150 nm), indicating that at this water age, the residual concentration of tea polyphenols is no longer sufficient to effectively inhibit biofilm growth.
Microstructural analysis indicates that the biofilm exhibits typical stratified characteristics: the basal layer structure is dense, occupying the main portion of the overall biofilm, and the surface layer demonstrates characteristic undulations and distinct porous structures. The significant increase in surface roughness (from 5.57 nm to 32.8 nm) reflects the increasing complexity of biofilm surface morphology. This structural change not only enhances the specific surface area of the biofilm but also provides more microenvironments for microbial attachment and colonization. Simultaneously, the increase in biofilm thickness (from 40 nm to 150 nm) further enhances its capacity to retain nutrients, which may potentially impact water quality.
AFM analysis results clearly reflect the process of gradual reduction in the inhibitory effects of tea polyphenols as their residual concentration decreases. Under shorter water ages (12 h, 24 h), higher residual concentrations of tea polyphenols effectively inhibit biofilm growth, maintaining a smaller range of surface height variations (40.0–60.0 nm). However, as the sludge retention time increases to 48 h, the tea polyphenol concentration decreases, and its inhibitory effect significantly weakens, with the range of biofilm surface height variations reaching the same level as the untreated control group (150.0 nm).
This finding suggests that in practical water distribution systems, maintaining effective tea polyphenol concentrations requires a careful consideration of water age to ensure that tea polyphenols can function effectively. The quantitative relationship established in this study between retention time and biofilm morphological parameters can serve as a reference for determining appropriate tea polyphenol concentrations in water treatment applications.

3.2.3. Spatial Structure Characteristics

As shown in Figure 7, SYTO-9 staining (green fluorescence) indicates viable cells, while PI staining (red fluorescence) indicates dead or membrane-damaged cells.
CLSM imaging revealed significant changes in both the spatial structure and viability distribution of biofilms with increasing water time. At 12 h water age, cells exhibited a punctate distribution pattern. Both green and red fluorescence were present in limited quantities, with the overall biofilm structure being relatively simple in scale. At 24 h water age, the intensity of green fluorescence signals increased, indicating a higher number of viable cells that began to show a clustering tendency. The biofilm structure appeared more complex compared to the 12 h condition. At 36 h water age, distinct clusters of red fluorescence appeared within the green fluorescent background. These red regions were concentrated, indicating aggregates of dead or membrane-damaged cells in specific areas. The green fluorescence exhibited a more continuous distribution, with certain regions showing higher fluorescence intensity, corresponding to denser communities of viable microorganisms. The biofilm became more complex, which corresponded with the increased surface roughness observed by AFM. At this stage, the red fluorescence signals were most prominent, indicating significant bactericidal effects while simultaneously allowing the survival of microorganisms with stronger adaptability. At 48 h water age, the biofilm exhibited denser and more uniform green fluorescence, indicating a significant increase in the number of viable cells with a more extensive spatial distribution. Compared to 36 h, the intensity of red fluorescence signals was significantly reduced. This change corresponds to the weakened capacity of tea polyphenols to disrupt microbial cell membranes as their residual concentration decreased, resulting in extensive cell proliferation with greater membrane integrity. This observation is consistent with biofilm development characteristics revealed by SEM and AFM analyses.
The control group (TB) showed abundant green fluorescence, indicating numerous viable cells. The proportion of red fluorescence was lower than observed at 36 h but higher than at 48 h. The biofilm structure was highly developed; however, the overall coverage was lower compared to 48 h. This observation corresponds with research indicating that low concentrations of tea polyphenols may undergo microbial degradation or metabolism [27].
Spatial distribution analysis revealed that biofilm maturity increased with water age. Biofilms under conditions of longer water age exhibited more ordered spatial arrangements, providing more favorable microenvironments for microbial colonization and proliferation.
Evaluating the efficacy of tea polyphenols as a disinfectant requires simultaneous consideration of two key indicators: the proportion of dead cells and the total quantity of viable cells. In short-water-age regions, maintaining higher concentrations can effectively inhibit biofilm formation; in moderate-water-age regions, selective inhibitory properties maintain microbial community diversity and stability; and in long-water-age regions, increasing the disinfectant concentration should be considered to prevent excessive microbial proliferation.

3.3. Microbial Community Analysis

3.3.1. Community Diversity Analysis

To assess the impact of tea polyphenol disinfection on the microbial community structure of pipe wall biofilms, this study conducted a systematic analysis of community diversity under different water age conditions using multiple α-diversity indices, as shown in Table 4. The results demonstrated that tea polyphenol disinfection significantly influenced the diversity and richness of microbial communities, with these effects exhibiting distinct spatiotemporal variation characteristics.
Analysis of community richness indices revealed significant differences in species richness among biofilms of various water ages. The Chao index reached its highest value (147.00) at T12 and in the control group (TB), while declining to its lowest value (134.58) at T24.
The ACE index was lowest at T24 (133.65) and reached its highest value at T48 (144.67). This U-shaped distribution pattern indicates that species richness was relatively lower under medium-water-age (24 h) conditions, while higher species richness was observed under both short-water-age (12 h) and long-water-age (48 h) conditions. This phenomenon may be associated with the decrease in tea polyphenol concentration and the adaptive recovery of the microbial community.
The increased microbial diversity observed with decreasing tea polyphenol concentration can be attributed to several mechanisms. At high concentrations, tea polyphenols strongly inhibit most microbial species, allowing only the most resistant taxa to survive, resulting in low diversity. As concentration decreases with water age, the antimicrobial components of tea polyphenols selectively target different microbial groups based on cell membrane composition and metabolic pathways. This selective inhibition prevents any single species from dominating the community while creating available ecological niches for microorganisms with diverse metabolic capabilities. Additionally, some microorganisms can utilize tea polyphenol degradation products as carbon sources, further promoting taxonomic diversification in the community as these compounds become available through partial degradation at lower concentrations.
Community diversity indices exhibited more complex dynamic variation characteristics. The Shannon index demonstrated an initial increase followed by a subsequent decrease with increasing water age: rising from 2.08 at T12 to 2.85 at T36, then declining to 2.54 at T48, with all values significantly higher than the control group (1.34). This indicates that tea polyphenol treatment enhanced the diversity of biofilm microbial communities. The Simpson index exhibited an initial decrease followed by a slight increase: declining from 0.31 at T12 to 0.10 at T36, then slightly increasing to 0.14 at T48, while consistently remaining below the level of the control group (0.43). This change indicates that, with increasing water age, the community structure transitioned from being dominated by a single dominant species to a more diversified community, with the T36 condition exhibiting a relatively balanced state.
Comprehensive analysis revealed that tea polyphenols, as a disinfectant, altered the composition of biofilm microbial communities through selective inhibition mechanisms [16], reducing the abundance of single species and promoting the formation of diversified communities. The highest diversity (Shannon = 2.85) and lowest dominance (Simpson = 0.10) observed at the T36 water age point (tea polyphenol residual concentration of 2.2 mg/L) represented an equilibrium point between tea polyphenol concentration and microbial community development.
This enhancement in diversity may contribute to the formation of a more stable microbial ecosystem, improving the ecological resilience and environmental adaptability of the community, while simultaneously inhibiting the excessive proliferation of potential pathogens through interspecies competition mechanisms, thereby providing additional safeguards for drinking water safety.

3.3.2. Community Composition Analysis

High-throughput sequencing results revealed the composition of pipe wall biofilm microbial communities under different water age conditions. With increasing water age and decreasing tea polyphenol concentration, the community structure transitioned from being single-species-dominated to multi-species-co-dominated, reflecting the response pattern of microbial communities to tea polyphenol effects, as shown in Figure 8.
At a water age of 12 h, proximal to the disinfection point, Methylophilus was the predominant genus in the community (54.41%), with a relative abundance similar to that observed in the control group (59.14%). Other genera with notable abundance included Caulobacter (7.76%) and unclassified_Saprospiraceae (5.12%). As the water age extended to 24 h, the community composition underwent a significant change: the proportion of Methylophilus decreased dramatically to 10.08%, while, simultaneously, a dual-predominant genus pattern led by Aquabacterium (28.95%) and unclassified_Alphaproteobacteria (23.85%) was formed. Additionally, multiple genera with relatively high abundance (relative abundance > 1%) were detected, indicating that the community structure began trending toward diversification. This significant shift in taxonomic distribution reflected the selective effect of tea polyphenols on different genera. When the water age reached 36 h, the microbial community exhibited further diversification, presenting a more balanced distribution pattern. During this period, Rhizobium (20.46%) and Methylophilus (20.44%) emerged as the predominant genera, while Sphingobium (11.34%) and Caulobacter (10.20%) also maintained substantial presence in the community.
However, Legionella exhibited a transient increase in abundance (6.50%) at 36 h, before declining back to a relatively low level (0.18%) at 48 h. The community composition at a water age of 48 h, distal to the disinfection point, underwent further adjustment, establishing a tripartite dominant pattern led by unclassified_Saprospiraceae (21.70%), Hydrogenophaga (16.52%), and Methylophilus (24.33%).
This transformation in community composition was associated with the continuous decrease in tea polyphenol residual concentration, reflecting the restructuring process of microbial communities under low tea polyphenol concentrations. Particularly, the significant increase in Hydrogenophaga indicated potential changes in the metabolic functions of the system.
Compared to the control group, all tea polyphenol treatment groups exhibited more diversified microbial profiles. In the control group, the relative abundances of Methylophilus and Haliscomenobacter were 59.14% and 28.50% respectively, together accounting for 87.64%, forming a highly concentrated community structure. This structure would reduce the ecological stability and functional diversity of the system. In contrast, the tea polyphenol treatment groups maintained higher community diversity across all water age stages, a structural characteristic that helps enhance the system’s resistance to disturbance and ecological resilience. The abundance of haliscomenobacter (28.50%) in the control group was significantly lower than 0.09% in T12, T24 and T36, and only slightly increased at T48 (1.02%).
Overall, as the water age increased, the composition of the pipe wall biofilm microbial communities exhibited a progression from simple to complex. This transition was primarily manifested in the following: (1) the succession of predominant genera; (2) the transformation from single-predominant-genus domination to multi-genera coexistence patterns; and (3) the diversification of community composition.

3.3.3. Functional Characteristics and Ecological Significance of Dominant Genera

Further investigation into the functional characteristics of predominant genera and their ecological significance was conducted based on the community composition analysis. The results indicated that the distribution patterns of different functional groups were closely associated with biofilm developmental stages and the evolution of system functions.
Within the complex process of biofilm formation, bacterial genera associated with attachment mechanisms serve as critical determinants of structural development. Among these, the genus Caulobacter exhibits particular significance due to its distinctive cell cycle progression and specialized adhesion mechanisms, which collectively contribute to the establishment and maturation of biofilm architecture. The abundance of this genus exhibited cyclical fluctuations (7.76% → 2.30% → 10.20% → 2.13%), reaching elevated levels at the T12 and T36 stages. This temporal pattern coincides with the formation of multilayered biofilm structures detected by SEM analysis at the T36 period, suggesting that Caulobacter species play a crucial role in the construction of three-dimensional spatial architectures within biofilms. The significant enrichment of Rhizobium (20.46%) and Sphingobium (11.34%) genera at the T36 stage collectively promoted EPS production, resulting in increased biofilm surface roughness (Ra = 21.3 nm). This microscale structural modification directly originates from the complex network architecture formed by extracellular polymeric substances secreted by these two bacterial genera on the biofilm surface.
This spatiotemporal synchronicity reveals the synergistic mechanism of attachment-related bacterial genera during biofilm structure formation. The periodic fluctuations in abundance of these attachment-related genera indicate that biofilm formation is a process of dynamic equilibrium. Tea polyphenols influence the structural characteristics of biofilms by regulating the abundance of these key genera.
With increasing water age, the distribution of bacterial communities with specialized metabolic functions undergoes significant changes within the microbial consortium. As obligate methylotrophic bacteria, the genus Methylophilus exhibited abundance variations (54.41% → 10.08% → 20.44% → 24.33%) that reflect the dynamic response process of single-carbon-compound-metabolizing bacterial communities under tea polyphenol treatment. The high abundance of this genus in the early stage of T12, which is proximal to the disinfection point, was comparable to that of the control group (59.14%), while the subsequent significant decrease in abundance might be associated with the effects of tea polyphenols. The maintenance of relatively high abundance (24.33%) during the extended water age stage T48, which is distal to the disinfection point, indicates that this taxonomic group possesses certain environmental adaptability.
Hydrogenophaga is capable of utilizing molecular hydrogen as an energy source for autotrophic growth, functioning as typical hydrogen-oxidizing bacteria. The data show that this genus maintains extremely low abundance (all <0.16%) during short-retention-time (T12 and T24) and medium-retention-time (T36) stages, but increases significantly to 16.52% at the T48 stage, becoming one of the major dominant genera during this period. This marked change may be related to alterations in the redox conditions within the system. Under long-water-age conditions, local microaerobic or anaerobic microenvironments likely formed. These conditions favor the growth of this bacterial genus. Compared to the control group (0.09%), the significant enrichment of Hydrogenophaga at T48 (16.52%) indicated that tea polyphenol treatment altered the niche distribution within the system, creating favorable conditions for the growth of specific functional bacterial groups.
The Sphingobium genus showed a dynamic abundance pattern across different stages (4.80% → 4.01% → 11.34% → 4.80%). This bacterial group is known for its ability to degrade aromatic compounds. Its enrichment (11.34%) at the T36 stage might be related to its capacity to metabolize tea polyphenol substances. This finding suggested that the active degradation of aromatic compounds might occur at this specific water retention time. Unclassified_Saprospiraceae became a dominant bacterial group (21.70%) at the T48 stage. These bacteria possess the ability to degrade complex organic compounds. The establishment of their dominant position suggested that the system might have developed a more complex organic matter degradation system.
Rhizobium genus showed a dominant distribution (20.46%) at the T36 stage, reflecting the diversification of metabolic functions in the system. As an important group of nitrogen-fixing bacteria, their enrichment in drinking water systems might affect the nutritional status of local microenvironments.
Aquabacterium genus showed significant enrichment (28.95%) at the T24 stage, suggesting a possible shift in specific carbon utilization patterns within the system. This genus has been studied for its ability to utilize various organic compounds as carbon and energy sources. The establishment of its dominant position reflected the community’s adaptive capacity to environmental changes.
The distribution characteristics of these bacterial genera with different metabolic functions across time and space indicated the gradual refinement process of the microbial community metabolic network under tea polyphenol treatment. This evolutionary pattern of functional diversity provides important support for water quality management in practical engineering applications.
The effective control of pathogenic bacterial genera is a key indicator for evaluating disinfectant performance. Legionella, as an important opportunistic pathogen, maintained levels lower than the control group (TB: 0.42%) during most periods under tea polyphenol treatment (T12: 0.21%, T24: 0.15%, T48: 0.18%), with only a temporary abundance increase (6.50%) occurring at the T36 period. Legionella species may possess adaptive capabilities to environmental fluctuations. Under disinfectant exposure, certain Legionella populations potentially enter dormancy or form biofilm structures as protective mechanisms against antimicrobial agents. When environmental conditions become favorable for proliferation, such as reduced disinfectant concentration, these persistent cells may resume replication, resulting in increased relative abundance. By the 48 h timepoint, multiple factors likely contribute to the subsequent decline in Legionella proportion, including nutrient depletion, accumulation of metabolic byproducts, and the emergence of a balanced tri-dominance community structure, collectively creating conditions unfavorable for Legionella proliferation.
In the stable community structure at the T48 period, Hydrogenophaga (16.52%), unclassified_Saprospiraceae (21.70%), and Methylophilus (24.33%) jointly dominated, potentially inhibiting Legionella growth through nutrient competition, spatial competition, or the production of inhibitory metabolites. Notably, Hydrogenophaga rapidly increased from low levels at T36 (<0.16%) to 16.52% at T48, with its growth showing a negative correlation with Legionella inhibition. This indirect inhibitory mechanism based on community structure reorganization complements the direct antimicrobial action of tea polyphenols.
Haliscomenobacter occupied a significant advantage in the control group (28.50%), but was effectively suppressed to extremely low levels in all tea polyphenol treatment groups (T12-T36 all <0.09%), with only a slight recovery at T48 (1.02%). This sustained inhibitory effect suggested that tea polyphenols exert a specific inhibitory action against this genus.
Although Haliscomenobacter is not classified as a typical pathogenic bacterium, its excessive proliferation in pipe networks may lead to a deterioration of water sensory properties and provide survival environments for other potential pathogenic bacteria. Therefore, the effective inhibition of this genus by tea polyphenols has positive implications for maintaining water quality stability.
Overall, the functional distribution of microbial communities in pipe wall biofilms under tea polyphenol disinfection treatment exhibited distinct temporal characteristics: (1) attachment and colonization-related bacterial genera (Caulobacter, Sphingobium) reached their peak at T36, coinciding with the biofilm formation characteristics under this operating condition; (2) bacterial genera with special metabolic functions (such as Methylophilus, Hydrogenophaga, unclassified_Saprospiraceae) occupied dominant positions at different stages, reflecting dynamic changes in the metabolic functions of the system; (3) opportunistic pathogenic Legionella bacteria were maintained at low levels, except for a temporary increase at T36.
This reorganization process of microbial community functional distribution suggests that tea polyphenols may regulate biofilm structural characteristics and functional metabolic networks through selective inhibition and promotion effects, ultimately forming a more diverse and stable microbial ecosystem.

4. Conclusions

  • Tea polyphenol disinfection significantly influenced the structural evolution of biofilms in pipeline systems: with increasing water age (12 h to 48 h), the surface roughness increased from 5.57 nm to 32.8 nm, and the biofilm thickness increased from 40 nm to 150 nm, establishing a quantitative relationship between tea polyphenol concentration and biofilm morphological characteristics.
  • Tea polyphenol disinfection maintained excellent biological stability in water distribution systems through a dual regulatory mechanism: (i) direct antimicrobial action effectively controlled microbial proliferation, maintaining total bacterial counts below 45 CFU/mL across all water age conditions; (ii) the modulation of organic matter metabolism pathways maintained CODMn values consistently below 0.75 mg/L and BDOC at approximately 0.21 mg/L throughout the distribution network.
  • Tea polyphenols promoted the formation of a more diverse and resilient microbial ecosystem by selectively inhibiting specific bacterial genera. This ecological regulation mechanism not only suppressed the excessive proliferation of potential pathogens (maintaining Legionella at levels below 0.21% except for a temporary increase at 36 h water age) but also enhanced microbial community diversity (Shannon index of 2.847 at 36 h water age compared to 1.336 in the control group). The community structure evolved from a single-dominant-genus pattern (Methylophilus at 54.41% at 12 h) to a balanced multi-genus coexistence structure at 48 h (Methylophilus at 24.33%, unclassified_Saprospiraceae at 21.70%, and Hydrogenophaga at 16.52%), indicating the capacity of tea polyphenols to foster a balanced microbial ecosystem.
  • Tea polyphenols as a disinfectant for ultrafiltration effluent are most suitable for water distribution systems with water ages not exceeding 36 h. Under these conditions, the maintained effective residual concentration (≥2.2 mg/L) achieves optimal balance between microbial control efficacy and ecological diversity, providing both microbiological safety and system stability for drinking water distribution. And from the perspective of microbial ecological distribution, the microbial safety of water in the pipeline network is better at the distal point than at the starting point after disinfection with tea polyphenols.

Author Contributions

Conceptualization and methodology, J.L.; software, validation, formal analysis and data curation, Z.W. and J.L.; investigation, and resources, T.Y. and Y.L. (Li Ying); writing—original draft preparation, Z.W.; writing—review and editing, J.L.; visualization, Y.L. (Li Yihao); supervision, project administration, and funding acquisition, C.F. All authors have read and agreed to the published version of the manuscript.

Funding

This research was funded by the National Natural Science Foundation of China (51678026).

Data Availability Statement

The data that support the findings of this study are available from the corresponding author upon reasonable request.

Acknowledgments

We would like to thank the Editor and Reviewers for their valuable feedback.

Conflicts of Interest

The authors declare no conflict of interest. The funders had no role in the design of the study; in the collection, analyses, or interpretation of data; in the writing of the manuscript; or in the decision to publish the results.

References

  1. Zhang, S.; Jiang, L.; Li, H.; Zhang, J.; Sun, T.; Dong, Y.; Ding, N. Disinfection kinetics of peracetic acid inactivation of pathogenic bacteria in water. Water Cycle 2022, 3, 79–85. [Google Scholar] [CrossRef]
  2. Xiao, R.; Deng, Y.; Xu, Z.; Chu, W. Disinfection Byproducts and Their Precursors in Drinking Water Sources: Origins, Influencing Factors, and Environmental Insights. Engineering 2024, 36, 36–50. [Google Scholar] [CrossRef]
  3. Li, W.; Han, J.; Zhang, X.; Chen, G.; Yang, Y. Contributions of Pharmaceuticals to DBP Formation and Developmental Toxicity in Chlorination of NOM-containing Source Water. Environ. Sci. Technol. 2023, 57, 18775–18787. [Google Scholar] [CrossRef] [PubMed]
  4. Duque-Sarango, P.; Delgado-Armijos, N.; Romero-Martínez, L.; Cruz, D.; Pinos-Vélez, V. Advancing Waterborne Fungal Spore Control: UV-LED Disinfection Efficiency and Post-Treatment Reactivation Analysis. Water 2025, 17, 922. [Google Scholar] [CrossRef]
  5. Guo, K.; Wu, Z.; Chen, C.; Fang, J. UV/Chlorine Process: An Efficient Advanced Oxidation Process with Multiple Radicals and Functions in Water Treatment. Acc. Chem. Res. 2022, 55, 286–297. [Google Scholar] [CrossRef] [PubMed]
  6. Wang, M.; Ateia, M.; Awfa, D.; Yoshimura, C. Regrowth of bacteria after light-based disinfection—What we know and where we go from here. Chemosphere 2021, 268, 128850. [Google Scholar] [CrossRef] [PubMed]
  7. Li, J.; Feng, C.; Jin, J.; Yang, W.; Wang, Z. Current Understanding on Antibacterial Mechanisms and Research Progress of Tea Polyphenols as a Supplementary Disinfectant for Drinking Water. J. Water Health 2022, 20, 1611–1628. [Google Scholar] [CrossRef]
  8. Feng, C.; Wei, T.; Qing, S.; Han, F.; Tao, X. Application of Tea Polyphenols and Their Effects on Ultrafiltration Effluent Disinfection and Microbial Risk. Water 2021, 13, 2559. [Google Scholar] [CrossRef]
  9. Xu, Z.; Yang, H.; Jiang, W.-B.; Li, X.-Q.; Eng, X.-J. Effects of Catechins on Growth Performance, Serum Antioxidant Indices, and Muscle Quality of Grass Carp. Chin. J. Anim. Nutr. 2020, 32, 836–846. [Google Scholar]
  10. Luo, D.-L.; Li, X.-Y.; Cao, S.; Ba, L.-J. Comparison on Several Antioxidant Components and Activity for Different Kinds of Guizhou Tea. Food Res. Dev. 2019, 49, 35–41. [Google Scholar]
  11. Ma, J.; Du, Z.; Gao, S.; Zang, J. Tea Polyphenols-Mediated Supramolecular Architectures: Design and Applications. Trends Food Sci. Technol. 2024, 152, 104665. [Google Scholar] [CrossRef]
  12. Cai, J.; Ye, R.; Jia, K.; Sun, W.; Zhao, L.-P. Review on Extraction and Antibacterial Activity of Tea Polyphenols. Chem. Reag. 2020, 42, 105–114. [Google Scholar]
  13. Wei, T.; Qing, S.; Feng, C.; Yao, R.; Zhu, N.; Xu, Z.; Wang, Y. Microbial Characterizations of Water Using Tea Polyphenols as a Disinfectant for Effluent Treatment after the Ultrafiltration Process. AQUA Water Infrastruct. Ecosyst. Soc. 2021, 70, 1170–1180. [Google Scholar] [CrossRef]
  14. Feng, C.; Wang, T.; Wang, C.; Chen, X.; Guo, Z.; Chen, Z. Disinfection Effects and Operating Conditions of Tea Polyphenols Combined with Ozone. Ozone Sci. Eng. 2020, 42, 551–557. [Google Scholar] [CrossRef]
  15. Liu, X.-Q.; Feng, C.-M.; Wang, C.-Z.; Wang, J.-L.; Sun, J.-Y. Disinfection Effect of Ultraviolet-Tea Polyphenols Combination on Water Supply Networks. China Environ. Sci. 2020, 40, 1563–1569. [Google Scholar]
  16. Afonso, A.C.; Saavedra, M.J.; Gomes, I.B.; Simões, M.; Simões, L.C. Current Microbiological Challenges in Drinking Water. J. Water Process Eng. 2025, 72, 107614. [Google Scholar] [CrossRef]
  17. Hemdan, B.A.; El-Taweel, G.E.; Goswami, P.; Pant, D.; Sevda, S. The role of biofilm in the development and dissemination of ubiquitous pathogens in drinking water distribution systems: An overview of surveillance, outbreaks, and prevention. World J. Microbiol. Biotechnol. 2021, 37, 36. [Google Scholar] [CrossRef] [PubMed]
  18. Oliveira, I.M.; Gomes, I.B.; Simões, L.C.; Simões, M. A review of research advances on disinfection strategies for biofilm control in drinking water distribution systems. Water Res. 2024, 253, 121273. [Google Scholar] [CrossRef]
  19. Zhang, Y.; Zhang, Y.; Liu, L.; Zhou, L.; Zhao, Z. Impacts of antibiotics on biofilm bacterial community and disinfection performance on simulated drinking water supply pipe wall. Environ. Pollut. 2021, 288, 117736. [Google Scholar] [CrossRef]
  20. Huang, C.; Ginn, T.R.; Clark, G.G.; Zaki, F.R.; Won, J.; Boppart, S.A.; Nguyen, T.H. Phosphate-Based Corrosion Inhibition in Drinking Water Systems and Effects on Disinfectant Decay and Biofilm Growth. Environ. Eng. Sci. 2023, 40, 634–644. [Google Scholar] [CrossRef]
  21. Javed, A.; Amjad, H.; Hashmi, I.; Miran, W. Investigating the Influence of Tank Material and Residual Chlorine on the Proliferation of Bacterial Biofilm Growth in the Drinking Water Storage Systems. J. Water Sanit. Hyg. Dev. 2025, 15, 305–321. [Google Scholar] [CrossRef]
  22. Blyth, W.E.; Shahsavari, E.; Aburto-Medina, A.; Ball, A.S.; Osborn, A.M. Variation in the Structure and Composition of Bacterial Communities within Drinking Water Fountains in Melbourne, Australia. Water 2022, 14, 908. [Google Scholar] [CrossRef]
  23. Kitajima, M.; Cruz, M.C.; Williams, R.B.H.; Wuertz, S.; Whittle, A.J. Microbial Abundance and Community Composition in Biofilms on In-Pipe Sensors in a Drinking Water Distribution System. Sci. Total Environ. 2021, 766, 142314. [Google Scholar] [CrossRef]
  24. Lin, W.-F.; Yu, Z.-S.; Chen, X.; Zhang, H.-X. Progress in Biofilm Reactors and Molecular Biology Research Methods for Water Supply Networks. Environ. Sci. Technol. 2012, 35, 71–78. [Google Scholar]
  25. Wang, Q.; Lu, Y.; Yang, W.; Liu, Z. Study on Conditions for Determining Permanganate Index in Water by Spectrophotometry. Nonferrous Met. Equip. 2020, 34, 36–39. [Google Scholar]
  26. Xin, C.; Khu, S.-T.; Wang, T.; Zuo, X.; Zhang, Y. Effect of Flow Fluctuation on Water Pollution in Drinking Water Distribution Systems. Environ. Res. 2024, 246, 118142. [Google Scholar] [CrossRef]
  27. Zhou, Y.; Li, X. Green Synthesis of Modified Polyethylene Packing Supported Tea Polyphenols-NZVI for Nitrate Removal from Wastewater: Characterization and Mechanisms. Sci. Total Environ. 2022, 806, 150596. [Google Scholar] [CrossRef]
Figure 1. Experimental system design of the parallel biofilm annular reactors (BARs).
Water 17 01545 g001
Figure 2. Schematic diagram of reactor structure.
Water 17 01545 g002
Figure 3. Effects of tea polyphenols on water quality parameters under different water ages: (a) changes in CODMn; (b) changes in BDOC; (c) total plate count in treatment group; (d) total plate count in control group.
Water 17 01545 g003
Figure 4. SEM images of biofilm morphology on pipe walls under different water ages (500×).
Water 17 01545 g004
Figure 5. SEM images of biofilm morphology on pipe walls under different water ages (2000×).
Water 17 01545 g005
Figure 6. AFM images of biofilm morphology on pipe walls under different water ages.
Water 17 01545 g006
Figure 7. Three-dimensional reconstructed images of biofilm on pipe walls under different water ages by CLSM.
Water 17 01545 g007
Figure 8. Distribution of microbial abundance at the genus level under different water age conditions.
Water 17 01545 g008
Table 1. Raw water quality.
ParameterValuesInstrumentsMethods
pH7.6 ± 0.2FiveGo Single-Channel Portable pH Meter (METTLER TOLEDO, Greifensee, Switzerland)
Temperature (℃)17.9 ± 0.6FiveGo Single-Channel Portable pH Meter(METTLER TOLEDO, Greifensee, Switzerland)
Chroma (degree)1 ± 1PFXi-995 High-Precision Automatic((The Tintometer Ltd., Amesbury, Wiltshire, UK))
Turbidity (NTU)0.084 ± 0.015HACH-2100ANTurbidity Meter(HACH Instrument Corporation, Loveland, CO, USA)
CODMn (mg/L)0.73 ± 0.11DR6000 (HACH Instrument Corporation, Loveland, CO, USA)Wang [24]
Total number of bacteria (CFU/mL)2 ± 2 Plate Counting
Notes: CODMn (mg/L)—chemical oxygen demand (COD) determined using potassium permanganate (Mn); total number of bacteria (CFU/mL)—number of bacteria per milliliter of water sample determined by plate count method.
Table 2. Concentrations of tea polyphenols at various water ages.
BAR Residual Concentrations of Tea Polyphenols (mg/L)Water Age (h)
1#(T12)3.612
2#(T24)2.824
3#(T36)2.236
4#(T48)1.548
5#(TB)048
Table 3. Roughness parameters of biofilm on reactor coupons.
BARRa (nm)Max Thickness (nm)Water Age (h)
1#(T12)5.574012
2#(T24)13.96024
3#(T36)21.310036
4#(T48)32.815048
5#(TB)32.115048
Table 4. Alpha diversity indices of biofilm microbial communities at different water age conditions.
BARWater AgeShannonSimpsonChaoACE
1#(T12)12 h2.080.31147.00140.47
2#(T24)24 h2.120.19134.58133.65
3#(T36)36 h2.850.10146.11142.24
4#(T48)48 h2.540.14144.07144.67
5#(Blank)48 h1.340.43147.00142.78
Notes: Shannon: measures community diversity and evenness, with higher values indicating more uniform species distribution and greater biodiversity. Simpson: measures community diversity with an emphasis on dominant species; lower values indicate higher community diversity. Chao: estimates species richness in a community, with a particular focus on rare species. ACE: a coverage estimator based on abundance that assesses species richness in a community, taking into account the number of rare species.
Disclaimer/Publisher’s Note: The statements, opinions and data contained in all publications are solely those of the individual author(s) and contributor(s) and not of MDPI and/or the editor(s). MDPI and/or the editor(s) disclaim responsibility for any injury to people or property resulting from any ideas, methods, instructions or products referred to in the content.

