Article

A New Insight into Sulfate Contamination in Over-Exploited Groundwater Areas: Integrating Multivariate and Geostatistical Techniques

1
School of Civil Engineering, Nanyang Institute of Technology, Nanyang 473004, China
2
School of Information Engineering, Nanyang Institute of Technology, Nanyang 473004, China
3
Shandong Coalfield Geological Planning Research Institute, Jinan 250000, China
4
Hebei and China Geological Survey Key Laboratory of Groundwater Remediation, Institute of Hydrogeology and Environmental Geology, Chinese Academy of Geological Sciences, Shijiazhuang 050061, China
*
Author to whom correspondence should be addressed.
Water 2025, 17(10), 1530; https://doi.org/10.3390/w17101530
Submission received: 11 March 2025 / Revised: 14 May 2025 / Accepted: 15 May 2025 / Published: 19 May 2025

Abstract

:
The issue of sulfate (SO42−) pollution in groundwater has already attracted widespread attention from scientists. However, at the large-scale regional level, especially in areas with groundwater overexploitation, the pollution mechanisms and sources of sulfate remain unclear. This study innovatively investigates the spatial distribution characteristics and sources of SO42− in the groundwater of the Hutuo River alluvial fan area, an understudied region facing significant environmental challenges due to overexploitation. Utilizing a combination of hydrochemical analysis, multivariate statistical methods, and geostatistical techniques, we reveal that the mean concentration of SO42− is significantly higher (127 mg/L) in overexploited areas, with an exceedance rate of 5.1%. Our findings uncover substantial spatial heterogeneity in SO42− concentrations, with particularly high levels in the river valley plain (RVP) (175 mg/L) and the upper area of the alluvial fan (UAF) (169 mg/L), which we attribute to distinct human activities. A novel contribution of our study is the identification of groundwater depth as a critical factor influencing SO42− distribution (p < 0.001). We also demonstrate that the higher proportion of sulfate-type waters in overexploited areas is primarily due to the accelerated oxidation of sulfide minerals caused by overexploitation. Principal component analysis (PCA) and correlation analysis further identify the main sources of SO42− as industrial wastewater, domestic sewage, the dissolution of evaporites, and the oxidation of sulfide minerals. By integrating geostatistical techniques, we present the spatial distribution of sulfate pollution sources at a fine scale, providing a comprehensive and spatially explicit understanding of the pollution dynamics. These results offer a novel scientific basis for developing targeted strategies to control sulfate pollution and protect the sustainable use of regional groundwater resources. Our study thus fills a critical knowledge gap and provides actionable insights for groundwater management in similar regions facing overexploitation challenges.

1. Introduction

Sulfate (SO42−) is one of the common soluble anions in groundwater, characterized by its chemical stability, strong solubility, and ease of migration [1,2]. Sulfate exhibits a certain degree of oxidizing properties, which can influence redox reactions in groundwater and alter the migration and transformation behaviors of other pollutants. Due to its diverse sources and complex migration and transformation processes [3], the distribution characteristics and source identification of sulfate in groundwater have long been a research focus and challenging issue in the field of hydrogeochemistry.
Excessive concentrations of sulfate in groundwater can pose multifaceted threats to ecosystems and human health [4]. For example, they can impact the respiration and reproduction of fish and may even lead to the death of aquatic organisms [5]. Regarding human health, the consumption of groundwater with sulfate levels exceeding the standard may cause gastrointestinal dysfunction, such as diarrhea and bloating, and long-term consumption may also damage organs such as the kidneys [6]. In the industrial sector, groundwater with elevated sulfate concentrations can corrode pipelines and equipment, increasing the difficulty and cost of industrial water treatment [7]. Therefore, studying the distribution characteristics and sources of sulfate in groundwater is of great significance for protecting the ecological environment, safeguarding human health, and the rational utilization of groundwater resources.
The accurate identification of sulfate pollution sources is a crucial step in formulating groundwater pollution prevention strategies and sustainable water resource management plans. Previous studies found that the sources of sulfate in water environments are extensive and diverse, including natural weathering, agricultural activities, industrial emissions, and domestic sewage [8], which greatly increases the complexity of pollution source identification. Current research endeavors to identify sulfate sources within aquatic environments have predominantly concentrated on elucidating the pollution sources of sulfate in surface water systems [8,9], while studies on the sources of sulfate pollution in groundwater are mainly concentrated in industrial zones and karst regions [3,10]. However, there is a relative lack of research on the identification of sulfate sources in large-scale overexploited groundwater areas. Especially in groundwater overexploitation areas where the flow and recharge conditions of the groundwater are complex, making the pollution characteristics and source identification of sulfate more challenging.
The Hutuo River alluvial fan is located in the North China Plain. In recent years, with the rapid increase in water demand for industrial and agricultural purposes, the area has experienced intense groundwater extraction and is considered a typical region of groundwater overexploitation [11]. As the intensity of groundwater extraction has increased, the groundwater level has declined annually, severely affecting the groundwater chemical and hydrodynamic fields. This has intensified the water–rock interactions [12]. Additionally, the region is characterized by well-developed coal-bearing strata and human activities have a significant impact on groundwater. As a result, the concentration of sulfate in groundwater has been increasing [13]. However, the characteristics of groundwater sulfate distribution and its pollution sources in this area have not yet received attention, posing a potential threat to the drinking water safety of local residents.
In this study, the Hutuo River alluvial fan is selected as the research site. By integrating hydrochemical analysis, multivariate statistical methods, and advanced geostatistical techniques, we provide a comprehensive and spatially explicit investigation of the sulfate pollution dynamics. Our study not only elucidates the spatial distribution patterns of sulfate and its primary sources but also reveals the underlying pollution mechanisms in this critical region. These findings fill a significant knowledge gap regarding sulfate pollution in overexploited groundwater systems and offer a novel scientific foundation for developing targeted strategies to mitigate and control sulfate contamination in similar regions worldwide.

2. Materials and Methods

2.1. Study Area Overview

The research area is situated in the central and upper reaches of the Hutuo River alluvial fan (Figure 1), stretching from the Gangnan Reservoir (located within the territory of Pingshan County) in the west to the western boundary of Gaocheng County in the east, covering a drainage area of 2442 km2. The Hutuo River basin is characterized by a scarcity of available surface water resources. Consequently, human activities such as domestic use, industrial production, and agricultural practices predominantly depend on groundwater [14]. The topography of the study area gradually slopes from west to east. The region experiences a temperate continental monsoon climate, with average annual precipitation and temperature varying between 400 and 750 mm and 13.3–15.0 °C, respectively. The majority of precipitation occurs during the months of June to September, accounting for more than 70% of the annual rainfall. The average annual temperature is approximately 13 °C, with the lowest temperature occurring in January, averaging 0.6 °C, and the highest temperature occurring in July, averaging 25 °C. The study area experiences significant seasonal variations in evaporation. The highest evaporation occurs in summer, ranging from 200 to 250 mm, which accounts for approximately 45% of the annual evaporation. In contrast, the lowest evaporation occurs in winter, ranging from 50 to 80 mm, representing about 10% of the annual evaporation.

2.2. Hydrogeological Conditions

The aquifer within the study area is part of the thick multi-layered Quaternary aquifer system in the North China Plain. This aquifer is relatively water-bearing, with groundwater flowing from the northwest to the southeast. The depth of the water table varies from 12 to 240 m, while the thickness of the aquifer ranges between 20 and 140 m. Both the water table and the aquifer exhibit favorable characteristics in terms of conductivity and water yield. Today, the acceleration of urbanization has led to persistent over-exploitation of groundwater in this area, resulting in a significant decline in groundwater depth. Specifically, the depth of the groundwater table has increased from 36 m in 2002 to 43 m in 2016 [12]. The dominant types of groundwater are fracture water in bedrock and pore water in loose rock layers. The primary sources of recharge are infiltration from atmospheric precipitation, infiltration from surface water, and return flow from agricultural irrigation, while the main discharge mechanism is artificial extraction. The lithology of the Quaternary sediments mainly comprises silty clay, sandy loam, gravelly sandy clay, and gravel and sand layers of various grain sizes (Supplementary Figure S1). The permeability coefficient of the vadose zone in the study area generally ranges from 37 to 145 m/d.
Based on the geological conditions and aquifer characteristics, the study area is divided into three hydrogeological units (Figure 1): (1) the fracture–pore water unit in the river valley plain (RVP) between the Gangnan Reservoir and Huangbizhuang Reservoir; (2) the pore water unit at the upper of the Hutuo River alluvial fan (UAF); and (3) the pore water unit in the central part of the alluvial fan (CAF). In the RVP, the aquifer thickness ranges from 10 to 20 m, with groundwater depths between 2 and 21 m. In the UAF, the aquifer thickness ranges from 20 to 35 m, with groundwater depths between 12 and 20 m. In the CAF, the aquifer thickness ranges from 25 to 60 m, with groundwater depths between 40 and 50 m.

2.3. Sample Collection and Analysis

2.3.1. Sample Collection

To eliminate the impact of spatial heterogeneity of groundwater samples, this study established sampling points at an interval of one per 20 km2, with a total of 118 sampling set ups (Figure 1) and were collected in January 2023. Furthermore, three sewage samples were collected. The groundwater samples were primarily obtained from domestic wells and agricultural irrigation wells, with well depths ranging from 4.0 to 50 m and an average depth of 9.8 m. Prior to sample collection, the wells were purged for 5–10 min until the groundwater pH and electrical conductivity (EC) values stabilized. Subsequently, groundwater samples were obtained through pumping operations from the wells. The sampling bottles were made of polyethylene, with one 1.5 L bottle and one 0.5 L bottle used for analyzing cations and anions, respectively. For cation analysis, the water samples were acidified with 1:1 HNO3 to adjust the pH to less than 2. Before sampling, the bottles were rinsed three times with distilled water and the original water samples. After collecting, the samples were transported to the laboratory in a portable cooler and tested within 48 h.

2.3.2. Sample Analysis and Testing

The monitoring indicators included the following: (1) on-site measurement indicators: pH, dissolved oxygen (DO); (2) laboratory analysis indicators: total dissolved solids (TDS), K+, Na+, Ca2+, Mg2+, NO3, SO42−, Cl, HCO3, and total hardness (TH, expressed as calcium carbonate). The analytical methods for the hydrochemical indicators are detailed in Supplementary Table S1.

2.4. Data Analysis

2.4.1. Data Preprocessing

Due to the requirement of normality in the distribution of each variable for principal component analysis (PCA), an initial assessment of the kurtosis and skewness of all data were conducted prior to PCA. Values of kurtosis and skewness beyond the range of −2 to +2 indicate a significant deviation from normality [15]. The statistical analysis revealed that the distributions of K⁺, Na⁺, and NO3 were skewed and not normally distributed, with standardized kurtosis and skewness values ranging from 10.1 to 30.7 and 2.84 to 7.29, respectively. Following a logarithmic transformation of these parameters, the kurtosis and skewness values were reduced to the range of 0.592 to 1.31 and −0.87 to 0.65, respectively. Subsequently, all water quality parameters underwent further standardization using the z-scale to mitigate the risk of misclassification arising from the substantial variability in data dimensions.

2.4.2. Statistical Analysis and Spatial Interpolation Analysis

In this research, the non-parametric Kruskal–Wallis and Mann–Whitney U tests were utilized to assess the significant differences in SO42− concentrations among various hydrogeological units. Spearman’s analysis was used to investigate the correlation between hydrochemical components. PCA was conducted to pinpoint the primary sources of sulfate pollution. Pollution sources were spatially visualized by projecting the source identification results from PCA onto the study area map through geostatistical interpolation, primarily using inverse distance weighting. All statistical analyses were performed using the R computing platform (version 4.3.2, Auckland, New Zealand), while geospatial analysis was carried out using ArcGIS v10.5 software (ESRI Inc., Redlands, CA, USA).

3. Results and Discussion

3.1. Characteristics of Groundwater Quality

To analyze the characteristics of groundwater quality in the study area, statistical analysis was conducted on the numerical ranges, means, and exceedance rates of various water quality indicators (Table 1). The results show that the pH of groundwater ranges from 6.53 to 8.47, indicating neutral to slightly alkaline conditions, with no exceedance of standards. The concentration of DO ranges from 1.04 to 13.8 mg/L, with a mean value of 4.91 mg/L, indicating an overall oxidizing environment.
The average concentrations of cations are ordered as follows: Ca2+ (131 mg/L) > Na+ (34.7 mg/L) > Mg2+ (32.0 mg/L) > K+ (2.29 mg/L). For anions, the concentration order is HCO3 (296 mg/L) > SO42− (127 mg/L) > Cl (71.4 mg/L) > NO3 (61.8 mg/L). The highest exceedance rate in the study area is for TH, with a rate of 50.0%, which is mainly related to the geological background of the region. Previous studies have shown that carbonate rocks are widely distributed in the study area, and the dissolution of these rocks leads to high concentrations of Ca2+ and Mg2+ in groundwater, resulting in significant exceedance of TH levels [17]. Additionally, exceedance of groundwater quality standards for NO3, TDS, SO42−, and Cl was observed, with exceedance rates of 22.0%, 8.47%, 5.08%, and 1.69%, respectively. It is worth noting that nitrate, with its high exceedance rate and mean value, indicates the significant impact of human activities on groundwater quality [18].

3.2. Spatial Distribution Characteristics of SO42− in Groundwater

3.2.1. Variations in SO42− Across Distinct Hydrogeological Units

The spatial heterogeneity in sulfate concentrations observed in the Hutuo River alluvial fan groundwater (Figure 2) provides critical insights into the interplay between human activities and natural hydrogeological conditions. The significantly higher sulfate concentrations in the RVP and UAF (175 mg/L and 169 mg/L, respectively) compared to the CAF (77.3 mg/L) (p < 0.001) highlight the profound impact of human activity on groundwater quality. In the RVP and UAF, especially around the Huangbizhuang Reservoir, there are large-scale power plants, the wastewater discharged from power plants may be an important cause of the elevated sulfate concentrations in the surrounding groundwater [19]. Additionally, the Ye River basin, a tributary of the Hutuo River (Flow into Huangbizhuang Reservoir), has extensive coal-bearing strata and hosts multiple coal mines and coal-washing plants. The discharge of industrial wastewater from these facilities is the other primary cause of elevated sulfate concentrations in the region. This suggests that even with existing regulations, there remains a critical gap in controlling industrial effluents, particularly in areas where groundwater serves as both a receptor and a resource. In addition, in the RVP, the lack of sewage treatment systems in villages leads to the discharge of sewage directly into the Hutuo River, and ultimately infiltrates into groundwater, which is another significant factor contributing to high sulfate concentrations in groundwater. In conclusion, the spatial differences in sulfate concentrations across the Hutuo River alluvial fan groundwater system represent more than a local pollution issue. They illustrate the complex interplay between development pressures, industrial activities, and natural hydrogeological conditions in an overexploited groundwater region.

3.2.2. Variation of SO42− with Groundwater Depth

The depth of groundwater burial significantly influences the pathway distance that pollutants must travel to reach the aquifer. In the present study, a significant negative correlation (p < 0.001) was observed between groundwater depth and sulfate concentration (Figure 3). Specifically, sulfate concentration decreased with increasing groundwater depth. These findings indicate that groundwater depth is a critical factor influencing the distribution of sulfate. Further analysis suggests that this relationship can be attributed to the fact that shallow groundwater levels facilitate the infiltration of pollutants, such as sulfate, from the surface, while deeper groundwater levels are less susceptible to such direct contamination due to longer flow paths and the filtering effect of the unsaturated zone [20]. Additionally, the redox conditions in deeper aquifers may also play a role in reducing sulfate concentrations, as the reducing environment may promote the precipitation of sulfate or the reduction in sulfate to sulfide [21]. The findings align with previous studies that have highlighted the importance of groundwater depth in determining the vulnerability of aquifers to contamination.

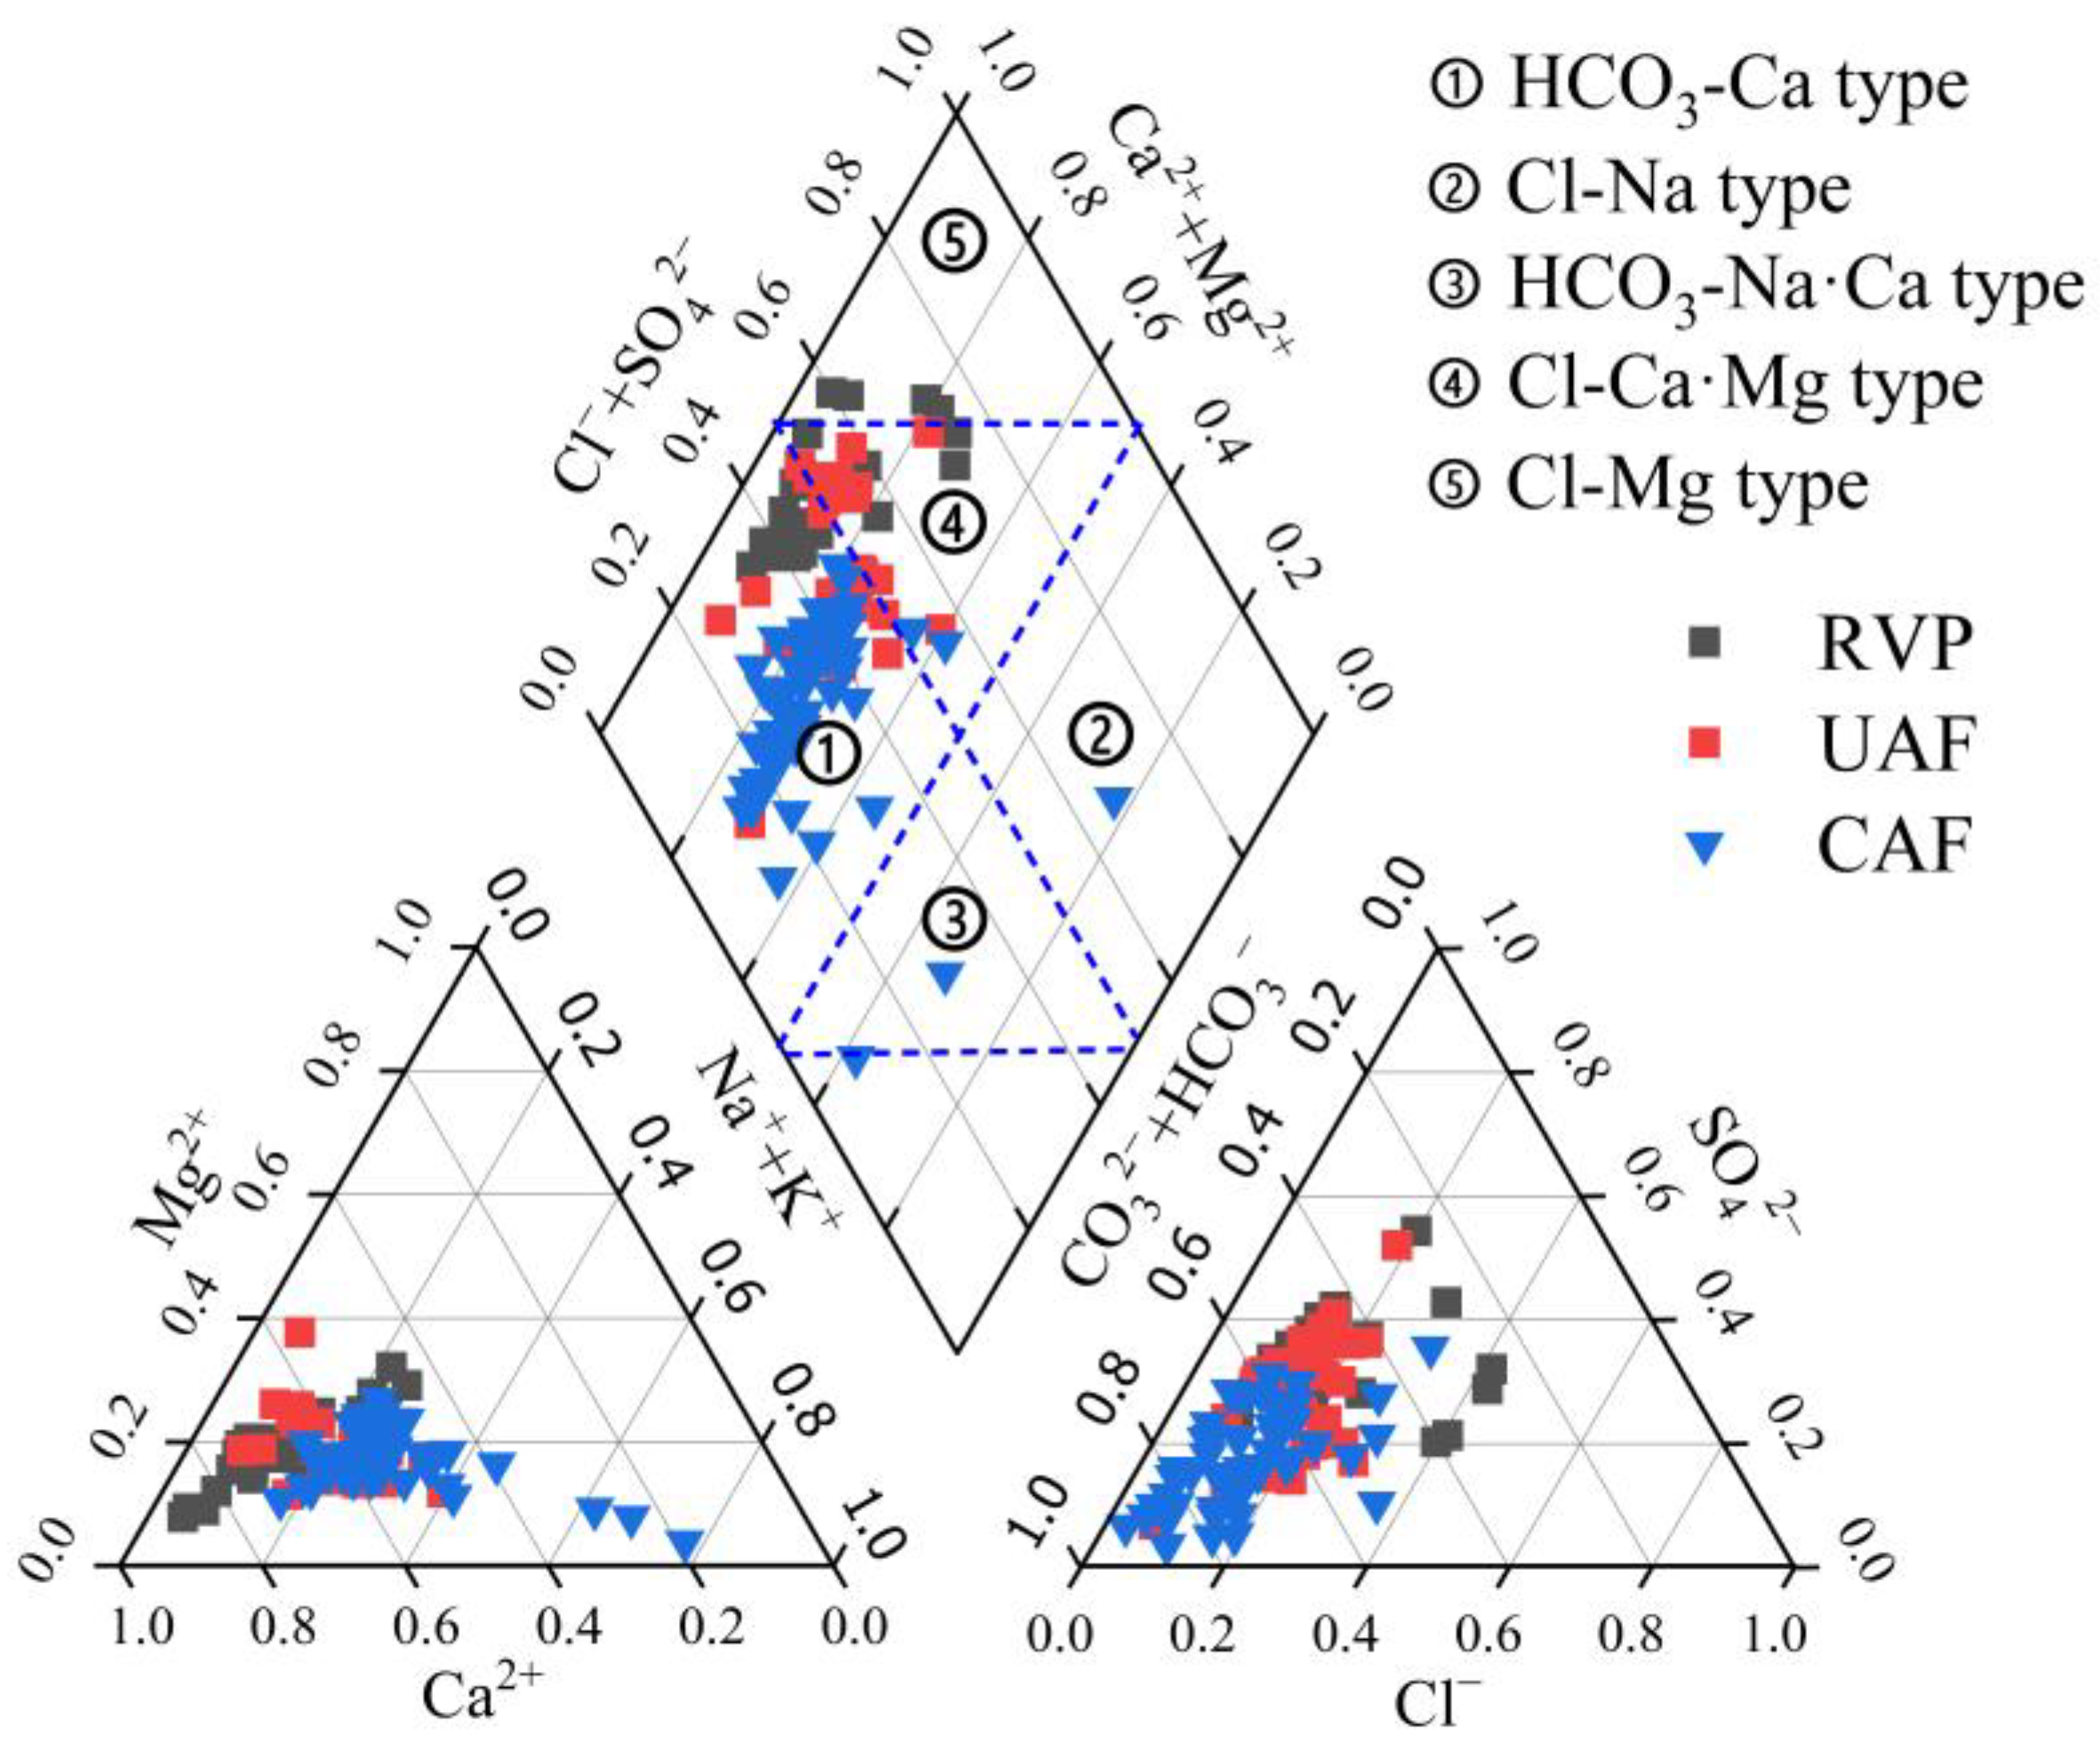
3.3. Hydrochemical Types of Groundwater

Using the Piper trilinear diagram, the hydrochemical types of groundwater in the three hydrogeological units of the study area were identified (Figure 4). At the same time, we integrated the Kurlov classification method (which classifies and names the types based on the content of anions and cations in the water, considering ions with a percentage greater than 25% of the milliequivalent as significant) to accurately calculate and distinguish the types and proportions of groundwater chemistry in different hydrogeological units. In the RVP and UAF, the dominant hydrochemical type of groundwater is HCO3·SO4–Ca, accounting for 65.4% and 39.8% of the sampling points, respectively. The secondary type is HCO3·SO4–Ca·Mg, with proportions of 11.5% and 27.8%, respectively. In the CAF, the primary hydrochemical type is HCO3–Ca·Mg, accounting for 48.2% of the sampling points, followed by HCO3·SO4–Ca·Mg and HCO3·Cl–Ca·Mg types, each with a proportion of 14.3%.
Overall, from the RVP to the CAP, the hydrochemical types of groundwater gradually evolve from HCO3·SO4–Ca to HCO3–Ca·Mg. This transition is mainly related to differences in lithology and human activities [22]. According to the hydrogeological conditions of the study area, coal-bearing strata are widely distributed in the RVP and UAF regions, and there are coal mines and power plants around the Huangbizhuang Reservoir. Both coal-bearing strata and industrial wastewater contribute to elevated SO42− concentrations in groundwater, resulting in a higher proportion of SO4-type water in these regions. In the CAF, the aquifer is primarily composed of quaternary loose sedimentary rocks. This area is mainly a residential zone without large industrial sources, leading to a shift in the hydrochemical type to predominantly HCO3–Ca·Mg. In the region characterized by overexploitation of the alluvial fan, the prevalence of SO4-type water significantly surpasses that observed in urban settings (dominated by HCO3–Ca·Mg-type water) [23], coastal zones (dominated by HCO3·Cl–Na-type waters) [24], and arid regions (dominated by HCO3–Ca·Mg-type waters) [25]. These findings imply that the intensification of groundwater extraction may be exacerbating the dissolution of sulfur-bearing minerals within the geological formations.

3.4. Identification of SO42− Sources in Groundwater

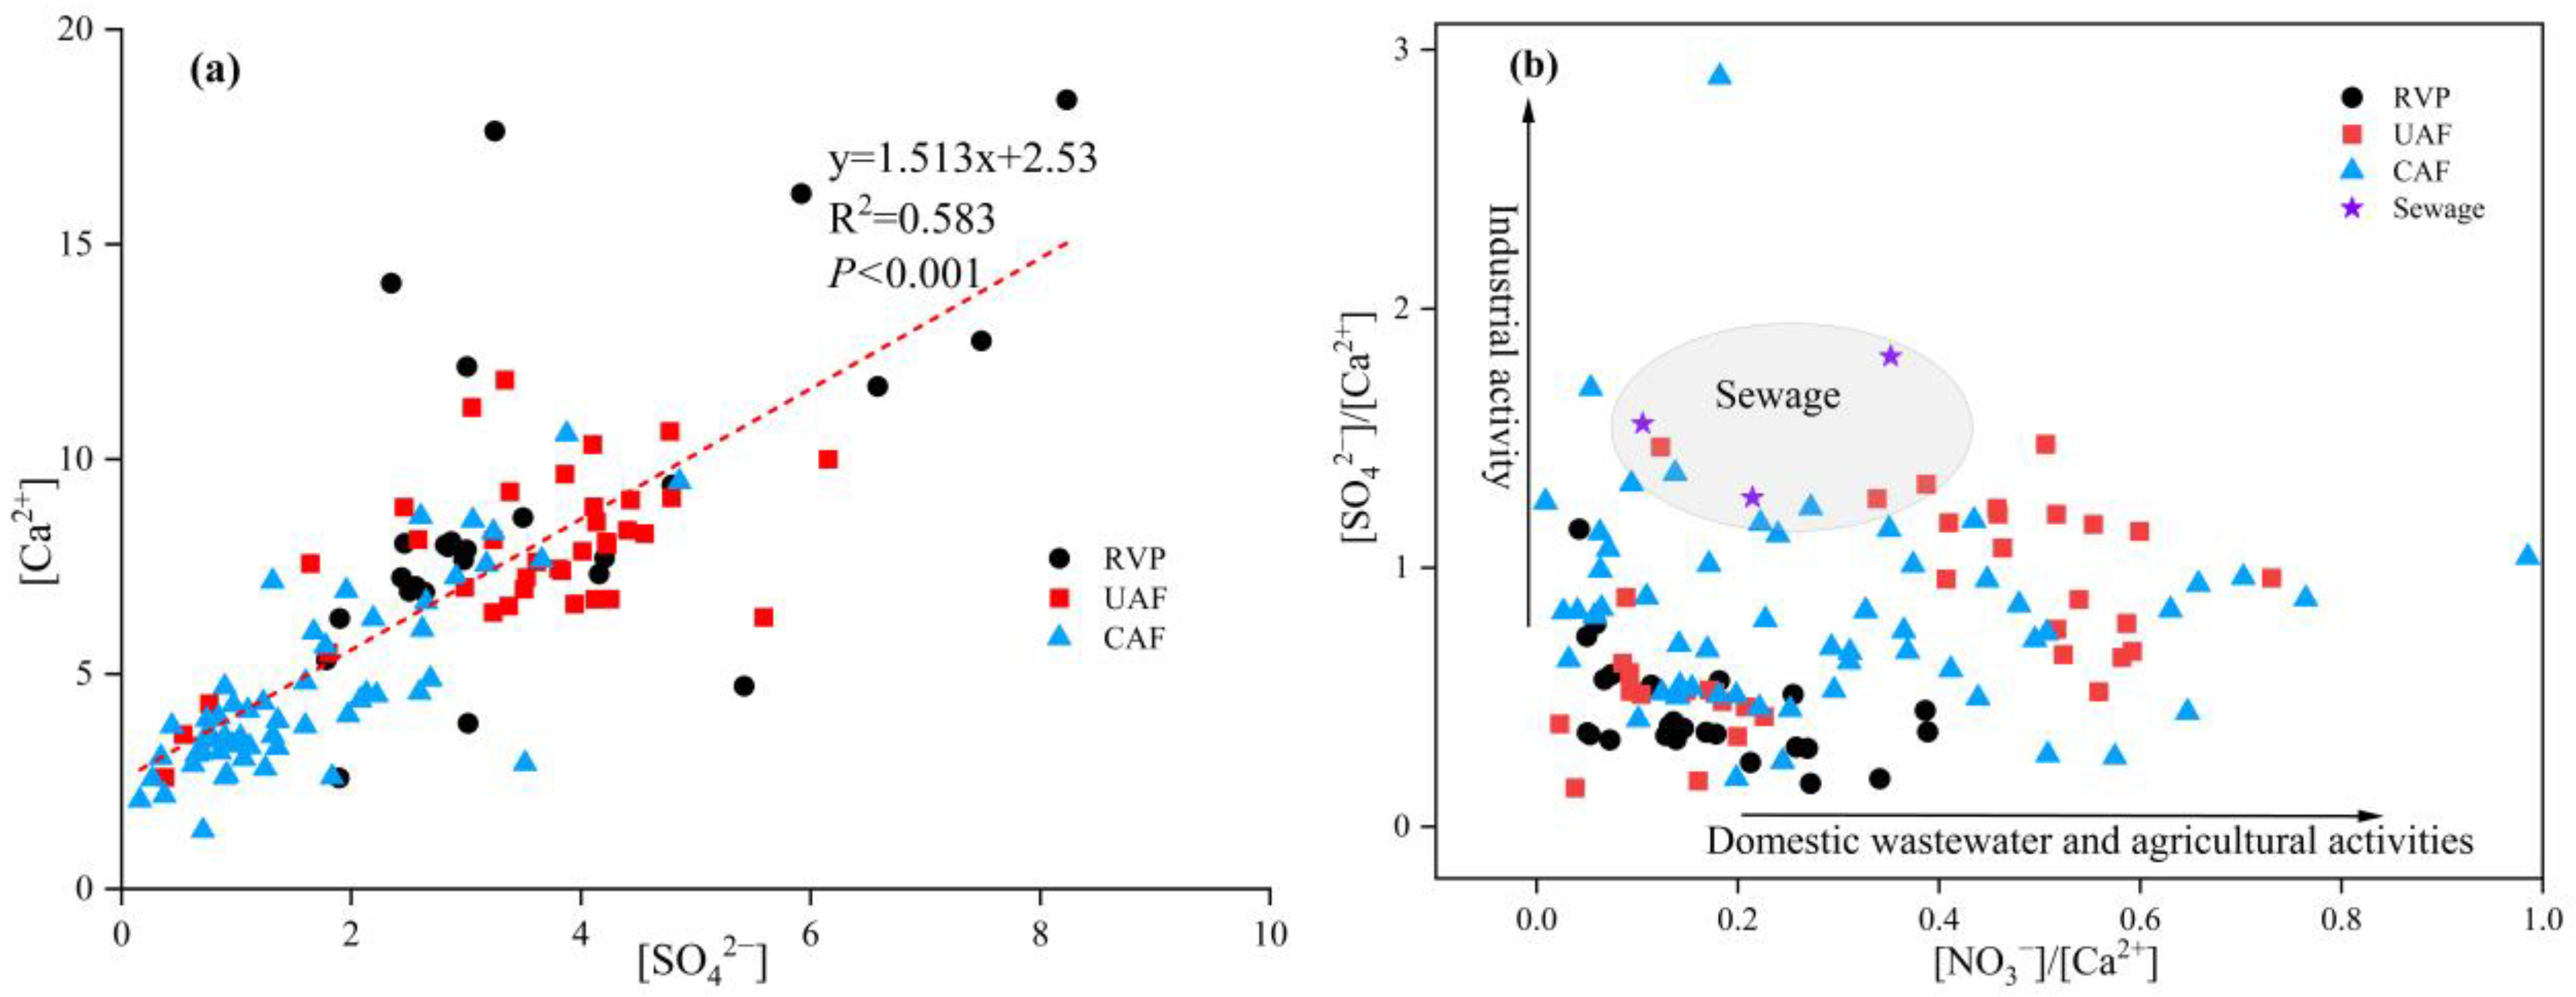
3.4.1. Identification of SO42− Sources Using Hydrochemical Methods

The use of hydrochemical ion ratio diagrams to identify the sources of pollutants in groundwater is a traditional method [26]. In this study, the ratios of [Ca2+]/[SO42−] and [NO3]/[Ca2+] to [SO42−]/[Ca2+] were used to identify the sources of sulfate in the Hutuo River alluvial fan groundwater.
Based on the [Ca2+]/[SO42−] ratio diagram (Figure 5a), a good correlation between Ca2+ and SO42− was observed in the groundwater of the three hydrogeological units in the study area (p < 0.001), indicating a common source for these ions, such as the dissolution of gypsum in coal-bearing strata. This result further corroborates that the spatial variability of sulfate concentrations is also influenced by natural factors, such as the distribution of coal-bearing strata.
To further clarify the sources of sulfate in groundwater, the relationship between [NO3]/[Ca2+] and [SO42−]/[Ca2+] was used to characterize the impact of human activities on groundwater. Previous studies have shown that industrial activities are characterized by higher [SO42−]/[Ca2+] values, while agricultural activities have higher [NO3]/[Ca2+] values [27]. As shown in Figure 5b, 93.2% of the groundwater samples had higher [SO42−]/[Ca2+] values than [NO3]/[Ca2+] in the study area, indicating that industrial activities are the primary human influence on groundwater in the study area. Specifically, the [SO42−]/[Ca2+] ratios ranged from 0.167 to 1.15, 0.149 to 1.48, and 0.186 to 2.89 in the RVP, UAF, and CAF, respectively. The [NO3]/[Ca2+] ratios ranged from 0.043 to 0.389, 0.022 to 0.731, and 0.009 to 0.985 in the RVP, UAF, and CAF, respectively. The markedly higher [SO42−]/[Ca2⁺] ratios across all sub-regions provide compelling evidence of the significant role of industrial activities in groundwater sulfate pollution. This conclusion is further supported by the analysis of three sewage samples, which also demonstrated elevated [SO42−]/[Ca2⁺] ratios, aligning with the observed groundwater patterns. These findings collectively underscore the need for targeted industrial pollution control measures to mitigate sulfate contamination in groundwater resources.

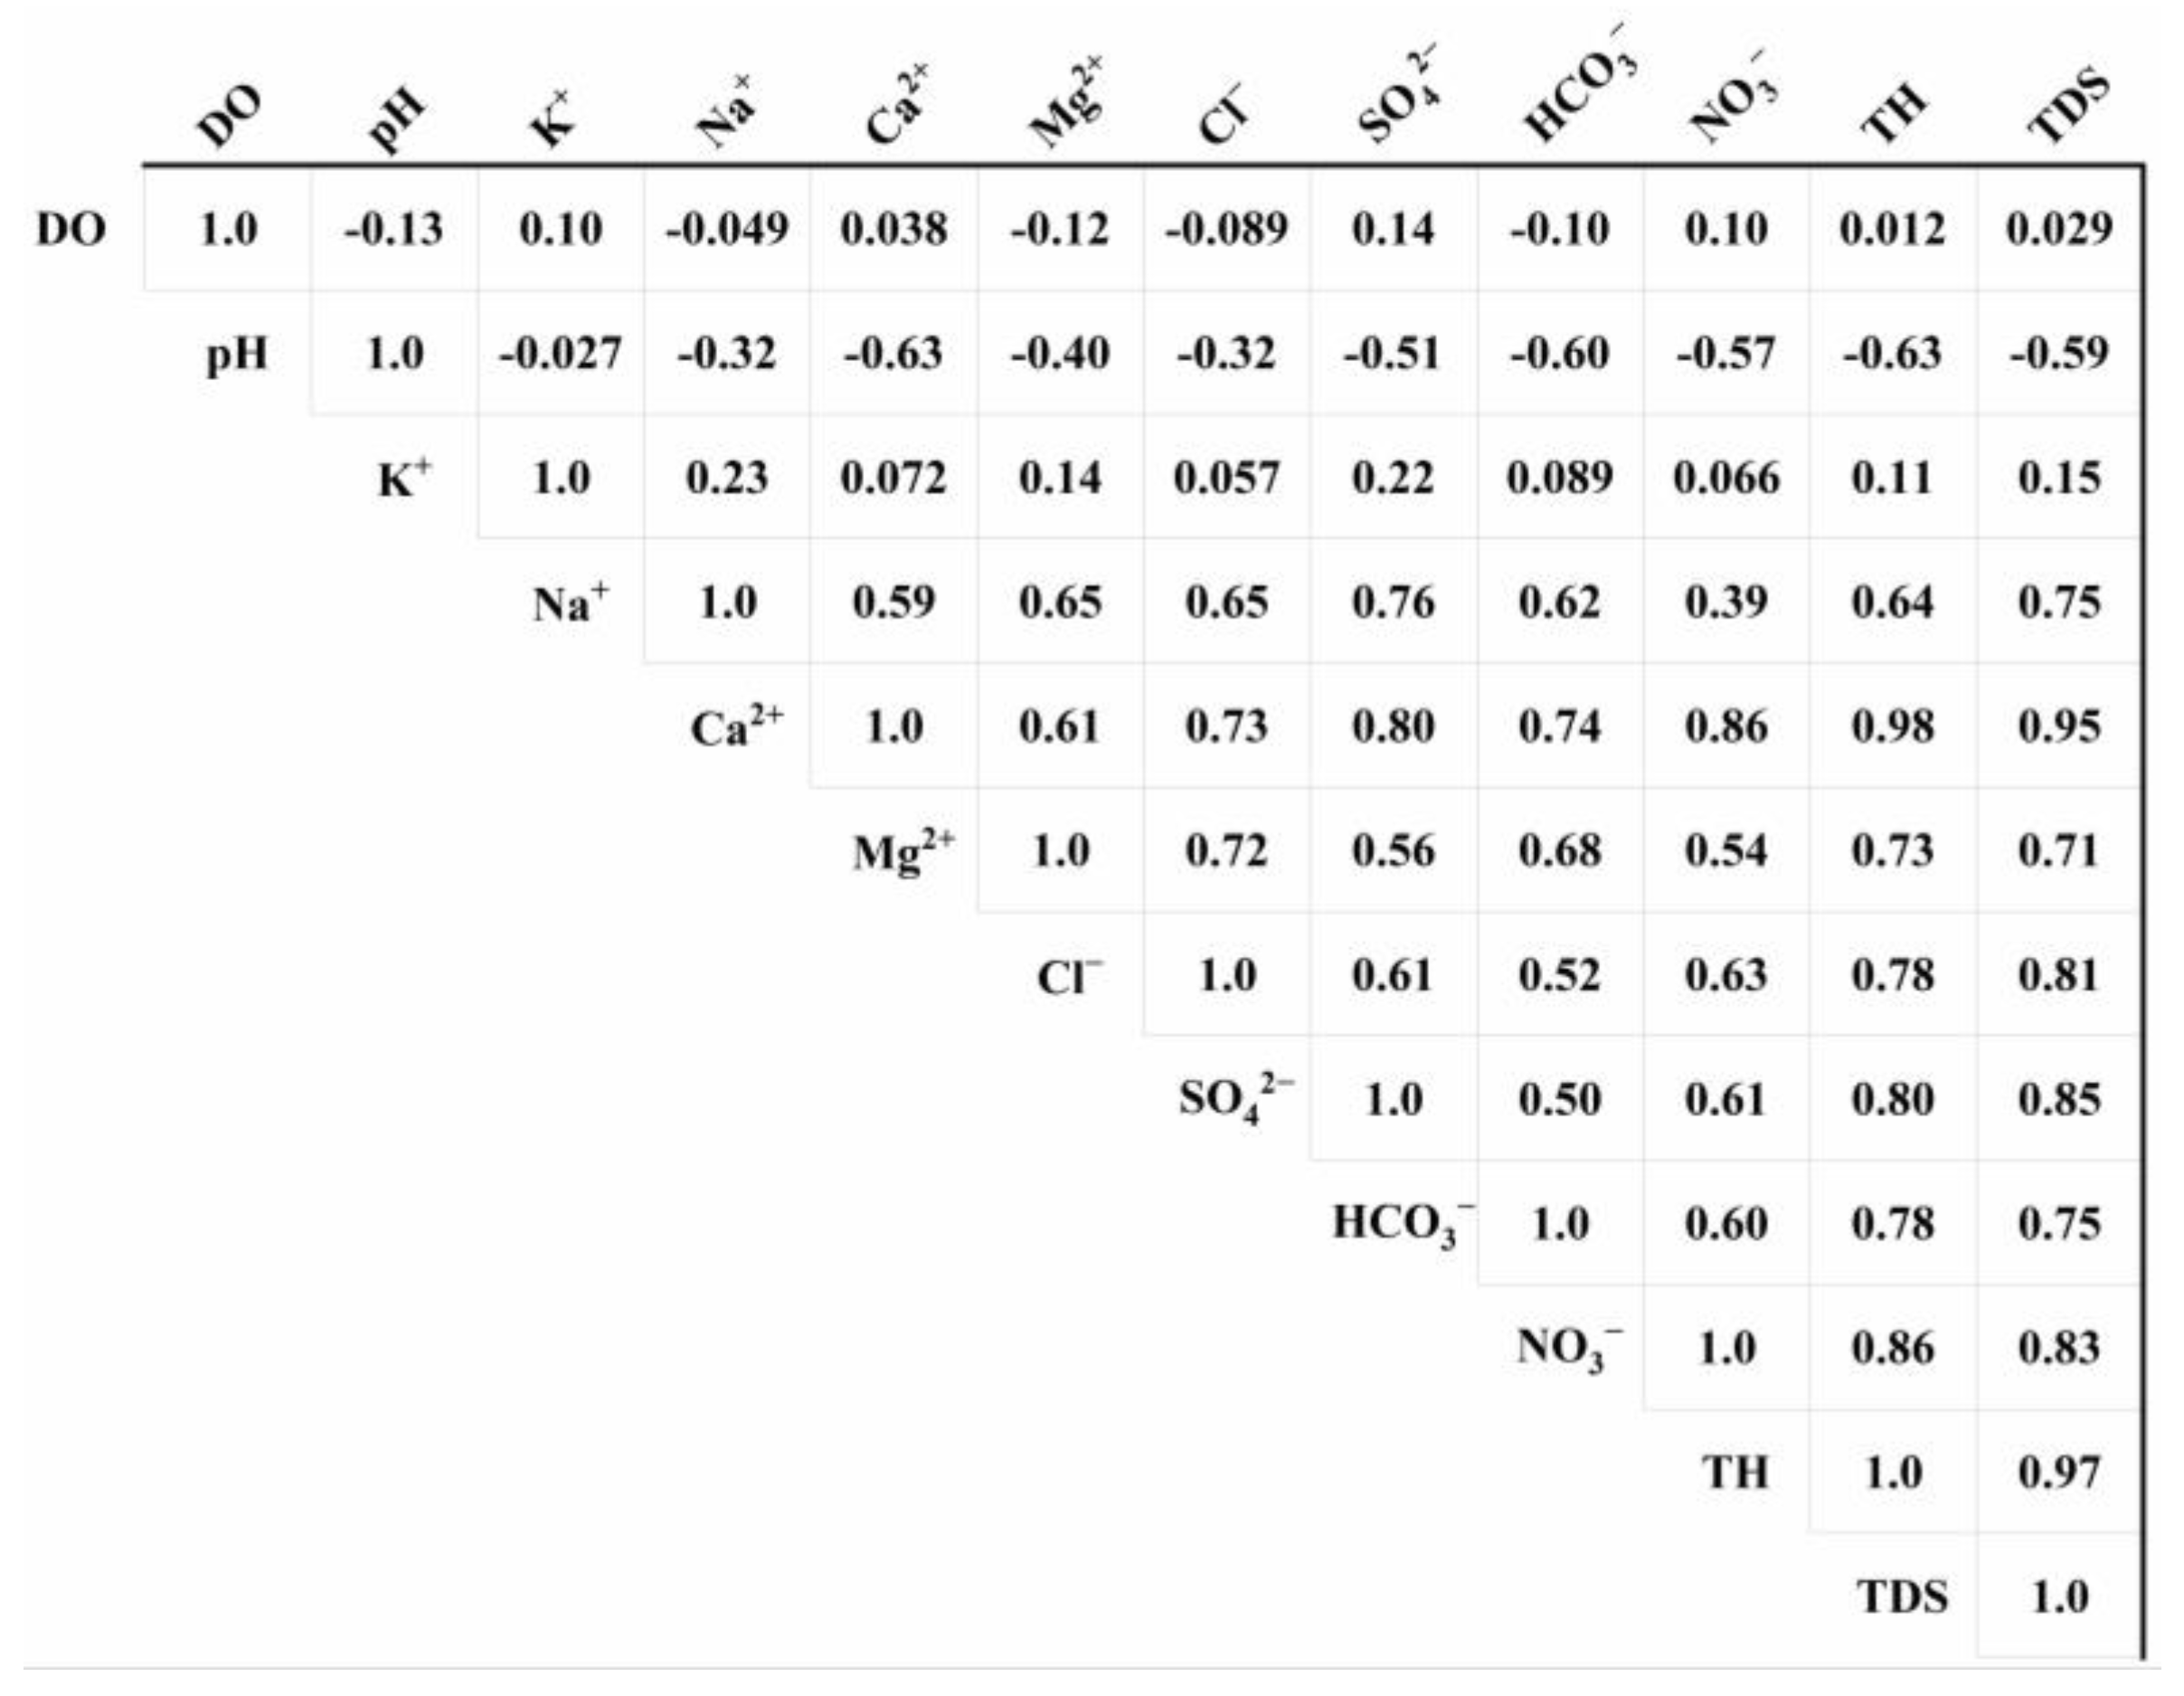
3.4.2. Identification of SO42− Sources Using Correlation Analysis

The relationships between groundwater quality indicators can reflect the sources of these parameters [28]. In this study, Pearson’s correlation analysis was conducted to explore the relationships between sulfate and other indicators, which offers crucial insights into the origins of SO42− in groundwater. As depicted in Figure 6, indicators with high correlation coefficients to SO42− include TDS, TH, Ca2+, Na+, Mg2+, Cl, and NO3, with correlation coefficients of 0.85, 0.80, 0.80, 0.76, 0.56, 0.61, and 0.61, respectively. The strong correlations between SO42− and Cl, Na+, and NO3 suggest common sources for these ions. Prior research has shown that domestic sewage and industrial activities are common sources of Cl and NO3 [26], suggesting that SO42− in the study area likely originates from industrial activities and domestic sewage. The significant correlation between SO42− and Ca2+ confirms that gypsum dissolution is one of the sources of sulfate, consistent with the earlier analysis. Additionally, the positive correlation between SO42− and TH, Mg2+ may be related to enhanced water–rock interactions caused by intensive groundwater extraction [29].

3.4.3. Identification of Sulfate Sources Using PCA

To delve deeper into the sources of sulfate in the groundwater in the area, PCA was conducted on 12 water quality parameters, including DO, pH, K+, Na+, Ca2+, Mg2+, Cl, SO42−, HCO3, NO3, TH, and TDS. Prior to the analysis, the Kaiser–Meyer–Olkin (KMO) and Bartlett’s sphericity tests were performed. The results showed that the KMO value was 0.740, and Bartlett’s sphericity test value was 2827 (p < 0.001), indicating that the water quality data met the requirements for PCA. Based on eigenvalues exceeding 1, three principal components were extracted, which collectively explained 78.5% of the total variance.
As indicated in Table 2, PC1 accounted for 58.2% of the total variance, with high factor loadings for TH, NO3, Ca2+, pH, HCO3, TDS, SO42−, and Mg2+. Common sources of groundwater sulfate include the oxidation of sulfides, the dissolution of evaporites, industrial wastewater, domestic sewage, and precipitation [8]. The positive correlation between NO3 and SO42− with PC1 suggests a common source for these ions. Previous studies have shown that the NO3 of groundwater in the area primarily originates from domestic sewage and fertilizers [14]. Given that nitrogen-based fertilizers are predominantly utilized in local agriculture, coupled with the minimal application of sulfur-containing fertilizers, it is reasonable to posit that domestic sewage constitutes a significant source of sulfate in the groundwater.
As discussed in Section 3.3 and Section 3.4.1, there are large-scale power plants around the Huangbizhuang Reservoir in the UAF of the study area, and the groundwater monitoring sites with exceedances are primarily located around the reservoir. A previous study found that the Ye River exhibits a relatively high average SO42− concentration of 216 mg/L [30]. Moreover, the mean SO42− concentration in the three sewage samples we collected reached 274.5 mg/L. These findings collectively suggest that industrial wastewater discharge from power plants and other industrial facilities, along with domestic sewage, are the predominant contributors to the elevated sulfate concentrations in the region. In summary, PC1 represents that the main sources of sulfate in groundwater are domestic sewage and industrial wastewater.
PC2 explained 10.8% of the total variance, with high factor loadings for K+, Na+, Cl, TDS, and SO42−. Moderate correlations were also observed between TH, Mg2+, Ca2+, and PC2. Since PC1, PC2, and PC3 are independent of each other, the strong correlation between Na⁺ and Cl is indicative of rock salt dissolution [31]. The good correlation between SO42− and Ca2+ with PC2 indicated that the evaporites (gypsum) are an important source of SO42−. Previous studies have shown that the increase in TH in groundwater in this region is caused by intensive groundwater extraction [19]. Indeed, in recent years, the Hutuo River alluvial fan area has experienced significant groundwater extraction, leading to a substantial decline in groundwater levels and enhanced water–rock interactions, which in turn accelerate the dissolution of rock salt and evaporites in the strata [32]. It is important to note that while rock salt dissolution contributes to the increase in Na⁺ and Cl, it does not directly provide sulfate ions. Therefore, the correlation between SO42− and Ca2⁺ with PC2, coupled with the presence of evaporites, strongly indicates that the SO42− in groundwater originates from the dissolution of evaporites such as gypsum. This conclusion is further supported by the hydrogeochemical processes prevalent in areas with significant groundwater extraction, where enhanced water–rock interactions play a crucial role in shaping groundwater chemistry. Thus, PC2 demonstrates that SO42− in groundwater originates from the dissolution of evaporites (gypsum).
PC3 explained 9.46% of the total variance, with high factor loadings for DO, and slight correlations were also observed between SO42− and PC3. The mean concentration of DO in groundwater in the study area is 4.91 mg/L, indicating an oxidizing environment. Previous studies have shown that sulfide minerals in the region mainly originate from pyrite in Carboniferous and Permian coal seams [33]. Moreover, large-scale coal mining in the study area has exposed reducing inorganic sulfur minerals, accelerating the processes of weathering, oxidation, and dissolution. These minerals then enter into the groundwater through rainfall runoff, thereby causing an increase in the sulfate concentration of groundwater [34]. The positive correlation between DO and SO42−, as reflected in PC3, supports the conclusion that the oxidation of sulfide minerals, particularly pyrite, is a significant source of sulfate in the groundwater. This finding aligns with the hydrogeochemical processes typical of mining-impacted regions, where the disruption of coal seams and associated sulfide minerals introduces additional pathways for oxidation and subsequent sulfate enrichment in groundwater. Therefore, PC3 demonstrates that SO42− in groundwater originates from the oxidation of sulfide minerals.

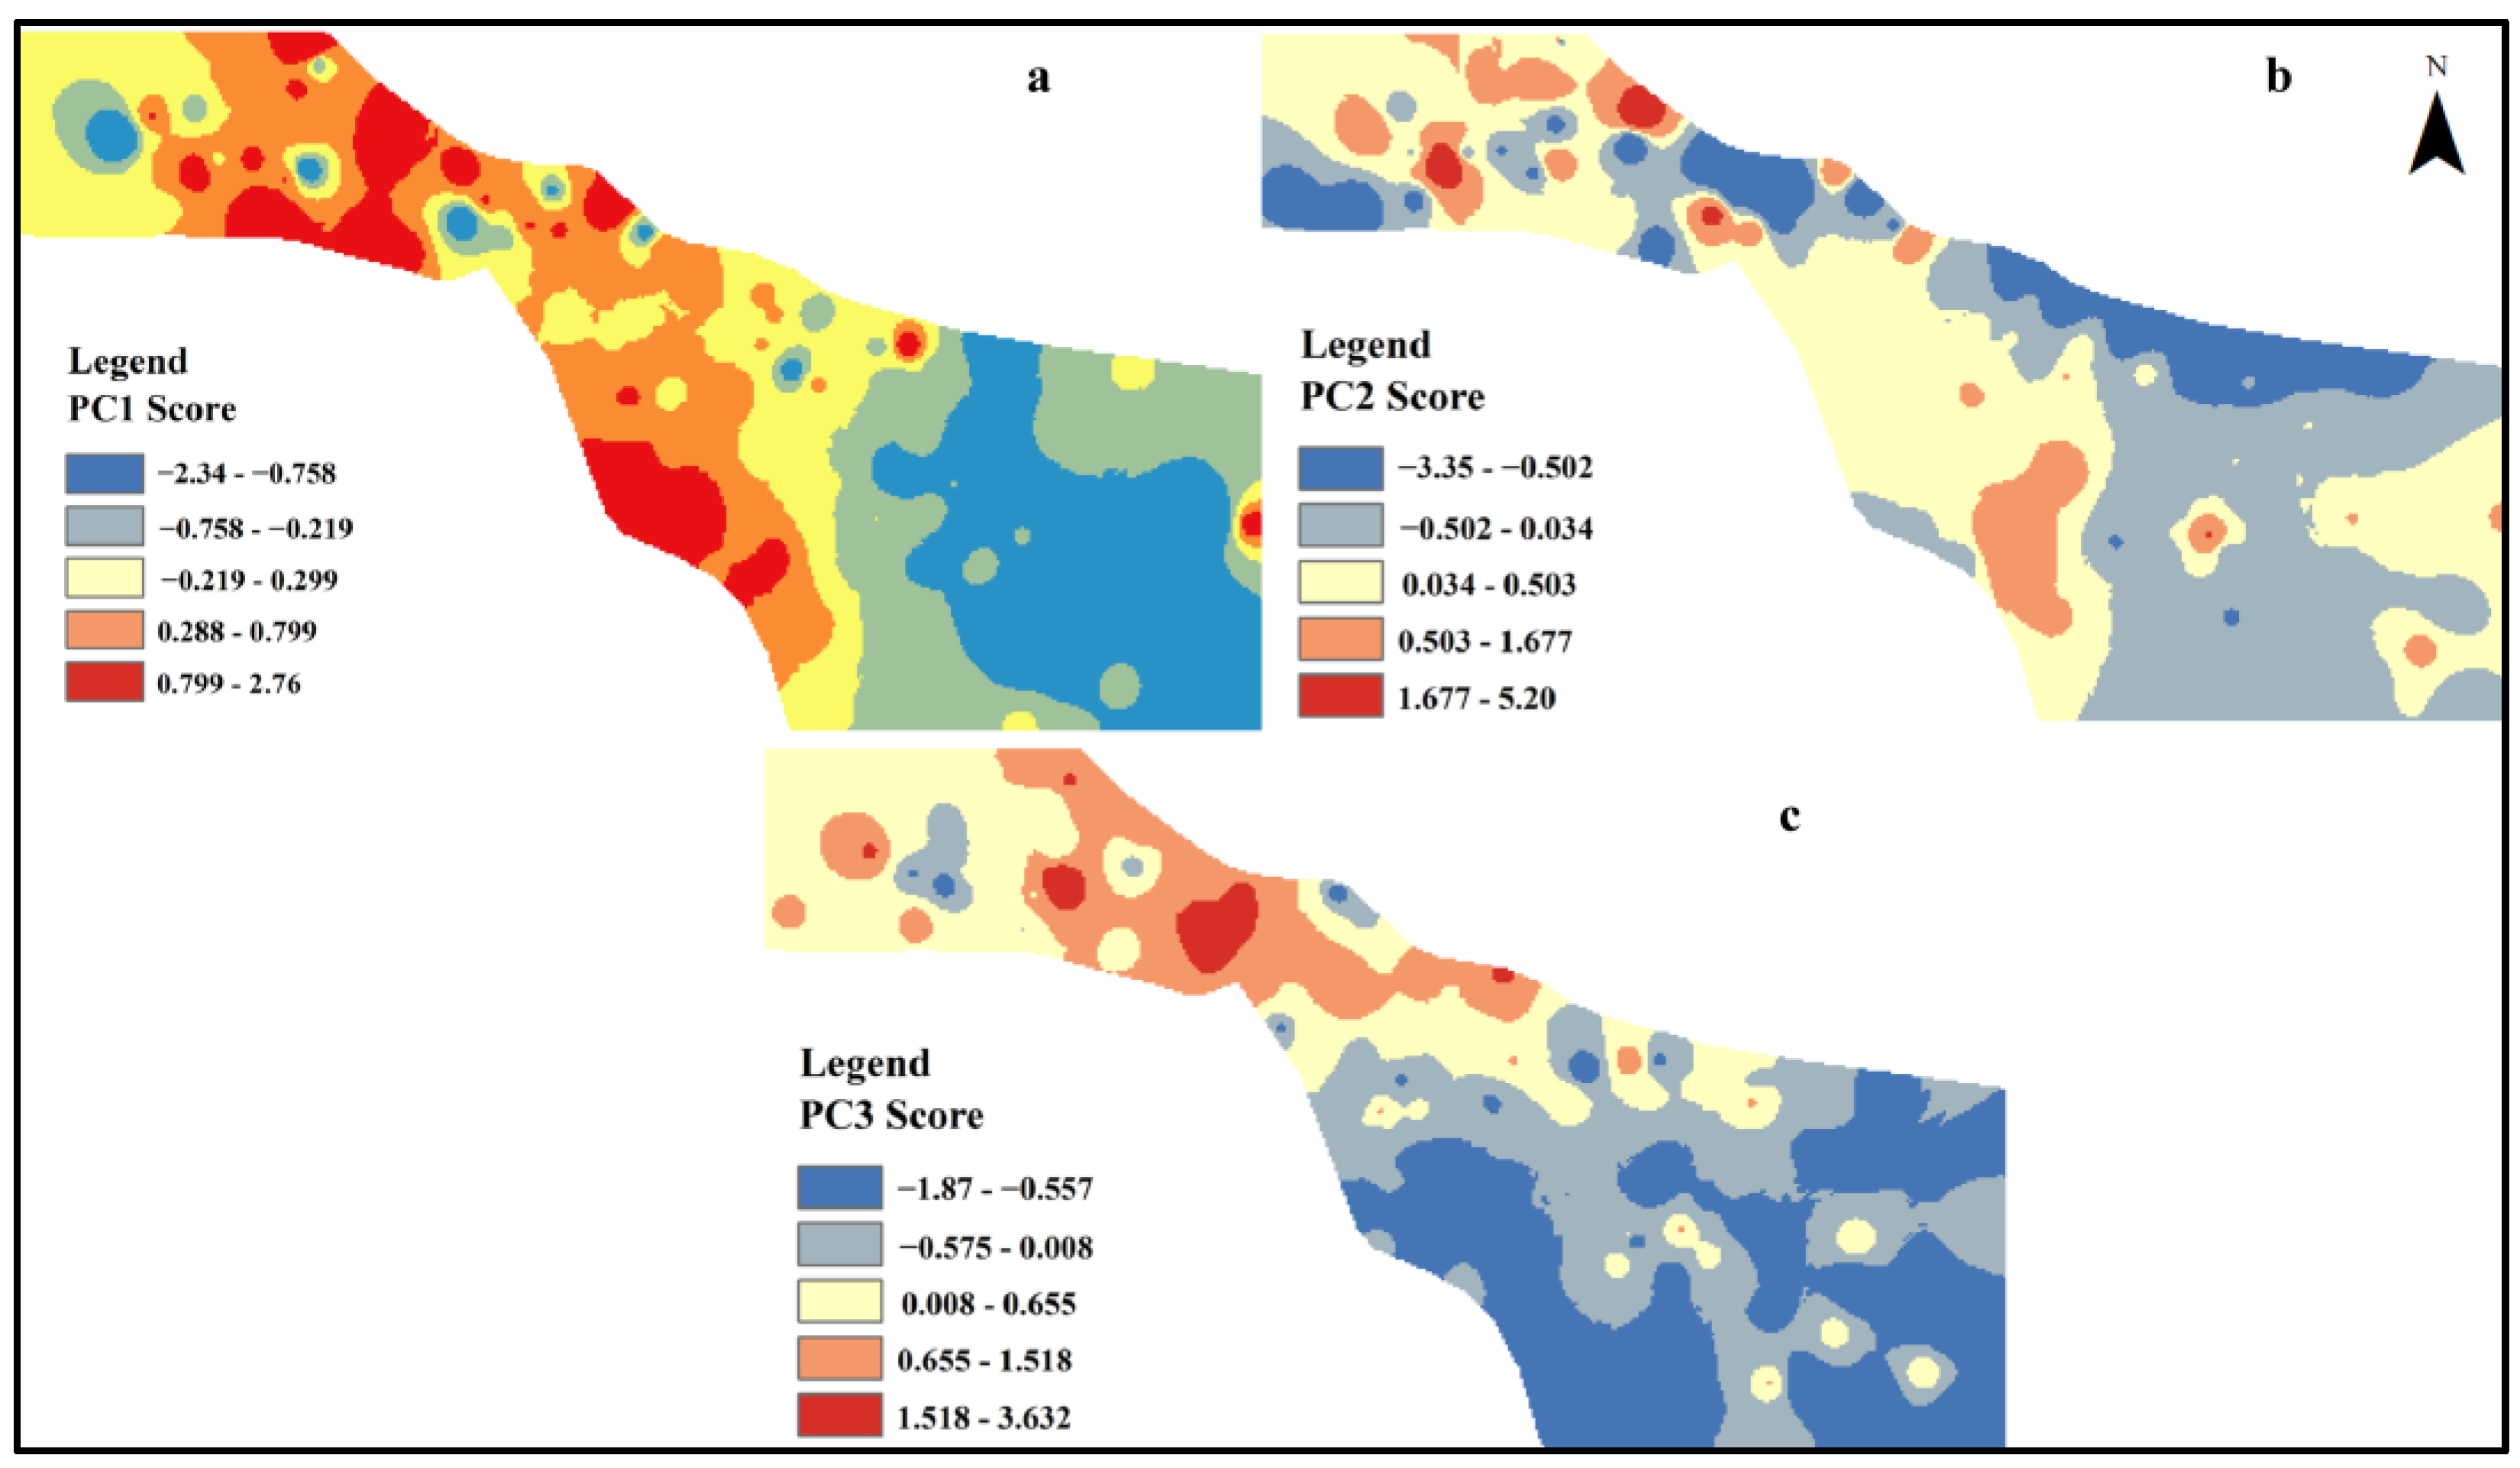
3.5. Spatial Distribution of Sulfate Sources in Groundwater

To analyze the spatial distribution characteristics of SO42− sources in the Hutuo River alluvial fan groundwater, inverse distance weighting interpolation was performed on the scores of the three factors, resulting in a spatial distribution map of sulfate pollution sources in the Hutuo River basin (Figure 7). We employed cross-validation techniques to assess the accuracy and reliability of our interpolation model. The results showed that the mean prediction errors for PC1, PC2, and PC3 were −0.018, 0.026 and 0.012, respectively, with root mean square errors of 0.938, 1.106, and 0.857. The results of the cross-validation demonstrated that our interpolation model performed well.
As shown in Figure 7, high scores of PC1 are mainly located in the RVP and UAF (around power plants and reservoirs) (Figure 7a), indicating that SO42− in groundwater in these regions primarily originates from industrial and domestic wastewater discharges. High scores of PC2 are mainly distributed in the RVP and sporadically in the study area (Figure 7b), suggesting that the dissolution of evaporites also contributes to sulfate in groundwater in these regions. High scores of PC3 are primarily located around the Huangbizhuang Reservoir in the river valley plain (Figure 7c), where coal-bearing strata are widely distributed. The oxidation of sulfide minerals is an important factor affecting SO42− concentrations in groundwater in this region.
Based on the above analysis, the elevated SO42− concentrations in the Hutuo River alluvial fan groundwater are mainly influenced by industrial activities around the Huangbizhuang Reservoir and coal mining in the Ye River basin. Intensive groundwater extraction has accelerated the dissolution of evaporites and the oxidation of sulfide minerals in the strata. Therefore, to control the continuous increase in SO42− concentrations in groundwater in the Hutuo River alluvial fan area, strict measures should be implemented to regulate the discharge of untreated wastewater and prevent the overexploitation of groundwater.

4. The Limitations of This Study

This study provides a comprehensive analysis of the pollution characteristics and mechanisms of sulfate in groundwater in over-exploited areas, which can offer scientific evidence for the prevention and control of sulfate pollution in groundwater in similar regions both domestically and internationally. However, there are some limitations in this study. For example, the identification of sulfate sources in groundwater mainly relied on hydrochemical methods, which can only qualitatively recognize the sources of sulfate in the water environment, without quantifying the contribution rates of each sulfate pollution source. Therefore, future research should focus on improving the accuracy of sulfate source apportionment in over-exploited areas. Additionally, the study area is a thick multi-layered aquifer system in the North China Plain. Due to limitations in research objectives and funding, this study only collected shallow groundwater samples once and conducted a preliminary exploration of the pollution mechanisms of sulfate in groundwater in over-exploited areas. Future research should involve high-frequency sampling of groundwater at different depths and times in this region to deeply analyze the pollution mechanisms and evolution mechanisms of sulfate in over-exploited areas.

5. Conclusions

This study provides a comprehensive analysis of the spatial distribution and sources of sulfate (SO42−) in the groundwater of the Hutuo River alluvial fan, an intensively exploited region where groundwater quality is influenced by complex natural and anthropogenic interactions. Our innovative integration of multivariate statistical techniques, including principal component analysis (PCA), with advanced geostatistical methods has revealed unprecedented insights into the heterogeneity of SO42− distribution across distinct hydrogeological units. A key novel finding is the demonstrated relationship between groundwater depth and SO42− concentration, establishing groundwater depth as a critical factor in sulfate distribution. This discovery enhances our understanding of how groundwater dynamics influence solute transport and distribution in overexploited aquifers.
Our spatially explicit analysis identifies industrial activities as the primary driver of elevated sulfate levels in the river valley plain and upper alluvial fan, contrasting with the central alluvial fan where natural processes dominate. Beyond anthropogenic sources, we have uncovered the significant contribution of natural processes—specifically evaporite dissolution and sulfide mineral oxidation—to groundwater sulfate pollution. The methodological framework developed in this study offers a cutting-edge approach for identifying and mapping pollution sources in complex hydrogeological settings. By combining PCA with geostatistical techniques, we created detailed spatial distributions of sulfate sources, providing a clearer picture of pollution dynamics than previously possible. These results highlight the need for a paradigm shift in groundwater management, emphasizing that effective pollution control requires both source-specific mitigation and systemic hydrogeological considerations.
The outcomes of this research not only advance the scientific understanding of sulfate pollution dynamics in groundwater systems but also deliver actionable knowledge for policymakers and water resource managers. By providing a robust scientific basis for sustainable groundwater management, this study serves as a model for addressing groundwater pollution challenges in other regions facing similar threats from overexploitation and contamination. This work represents a significant step forward in the development of science-based solutions for groundwater protection and sustainable water resource management.

Supplementary Materials

The following supporting information can be downloaded at: https://www.mdpi.com/article/10.3390/w17101530/s1. Figure S1: Hydrogeological cross-section of study area; Table S1: Hydrochemical parameters, analytical method, equipment and detection limits.

Author Contributions

L.W.: investigation, methodology, software, data curation, writing—original draft preparation. Q.W.: investigation, software, methodology. W.L.: investigation, software. Y.L.: investigation, data curation. Q.Z.: supervision, methodology, writing—reviewing and editing. All authors have read and agreed to the published version of the manuscript.

Funding

This work was supported by the Natural Science Foundation of Hebei Province of China (grant no. D2022504015) and the Nanyang Institute of Technology Doctoral Research Startup Fund Project (NGBJ-510069).

Data Availability Statement

The data are available from the authors upon reasonable request.

Acknowledgments

The authors gratefully acknowledge the editor and anonymous reviewers for their valuable comments on this manuscript.

Conflicts of Interest

The authors declare no conflicts of interest.

References

  1. Zhang, Q.; Wang, H.; Lu, C. Tracing sulfate origin and transformation in an area with multiple sources of pollution in northern China by using environmental isotopes and Bayesian isotope mixing model. Environ. Pollut. 2020, 265, 115105. [Google Scholar] [CrossRef] [PubMed]
  2. Liu, Y.; Ma, R. Human health risk assessment of heavy metals in groundwater in the luan river catchment within the north China Plain. Geofluids 2020, 2020, 8391793. [Google Scholar] [CrossRef]
  3. Jung, H.; Kim, J.; Lee, J. Seasonal and spatial contributions of sulfate and trace elements in river water in mining districts: Insights from hydrogeochemical and isotopic analysis based on statistical models. J. Hazard. Mater. 2025, 488, 137246. [Google Scholar] [CrossRef]
  4. Yustika, R.D.; Handayani, C.O.; Dewi, T.; Yanti, D.; Dariah, A. Risk assessment for non-carcinogenic effect posed by sulfates in water on the health of residents around The Sumpur River, West Sumatra-Indonesia. Toxicol. Rep. 2025, 14, 101921. [Google Scholar]
  5. Ren, B.; Shi, X.; Guo, J. Interaction of sulfate-reducing bacteria and methanogenic archaea in urban sewers, leads to increased risk of proliferation of antibiotic resistance genes. Environ. Pollut. 2025, 368, 125777. [Google Scholar] [CrossRef]
  6. Wang, H.; Zhang, Q. Research advances in identifying sulfate contamination sources of water environment by using stable isotopes. Int. J. Environ. Res. Public Health 2019, 16, 1914. [Google Scholar] [CrossRef]
  7. Tostevin, R.; Turchyn, A.V.; Farquhar, J.; Johnston, D.T.; Eldridge, D.L.; Bishop, J.K.; McIlvin, M. Multiple sulfur isotope constraints on the modern sulfur cycle. Earth Planet. Sci. Lett. 2014, 396, 14–21. [Google Scholar] [CrossRef]
  8. Li, X.; Liu, Y.; Zhou, A.; Zhang, B. Sulfur and oxygen isotope compositions of dissolved sulfate in the Yangtze River during high water period and its sulfate source tracing. Earth Sci. 2014, 39, 1647–1654. [Google Scholar]
  9. Qiong, X.I.A.O.; Wen, L.I.U.; Fang, G.U.O.; Moucheng, P.A.N.; Shi, Y.U. Using δ34S-SO42−and δ15N-NO3, δ18O-NO3 to trace the sources of sulfur and nitrate in Lihu lake undergound water, Guangxi. China Environ. Sci. 2015, 36, 2877–2886. [Google Scholar]
  10. Otero, N.; Soler, A. Sulphur isotopes as tracers of the influence of potash mining in groundwater salinization in the Llobregat Basin (NE Spain). Water Res. 2002, 36, 3989–4000. [Google Scholar] [CrossRef]
  11. Lu, Y.; Tang, C.; Chen, J.; Song, X.F.; Li, F.D.; Sakura, Y. Spatial characteristics of water quality, stable isotopes and tritium associated with groundwater flow in the Hutuo River alluvial fan plain of the North China Plain. Hydrogeol. J. 2008, 16, 1003–1015. [Google Scholar] [CrossRef]
  12. Zhang, Q.; Miao, L.; Wang, H.; Hou, J.; Li, Y. How rapid urbanization drives deteriorating groundwater quality in a provincial capital of China. Pol. J. Environ. Stud. 2020, 29, 441–450. [Google Scholar] [CrossRef]
  13. Ye, H.; Liu, C.L.; Jiang, J.M.; Pei, L.X.; Guo, J. Risk assessments of groundwater pollution in the shijiazhuang reach of the hutuo river, China. Geol. Bull. China 2008, 27, 1065–1070. [Google Scholar]
  14. Zhang, Q.; Wang, H. Assessment of sources and transformation of nitrate in the alluvial-pluvial fan region of north China using a multi-isotope approach. J. Environ. Sci. 2020, 89, 9–22. [Google Scholar] [CrossRef]
  15. Kannel, P.R.; Lee, S.; Kanel, S.R.; Khan, S.P. Chemometric application in classification and assessment of monitoring locations of an urban river system. Anal. Chim. Acta 2007, 582, 390–399. [Google Scholar] [CrossRef] [PubMed]
  16. GB/T14848-2017; Standard for Groundwater Quality. General Administration of Quality Supervision, Inspection and Quarantine of the People’ s Republic of China: Beijing, China, 2017.
  17. Li, Y.; Zhang, Z.; Fei, Y.; Chen, H.; Qian, Y.; Dun, Y. Investigation of quality and pollution characteristics of groundwater in the Hutuo River Alluvial Plain, North China Plain. Environ. Earth Sci. 2016, 75, 581. [Google Scholar] [CrossRef]
  18. Martín del Campo, M.A.; Esteller, M.V.; Expósito, J.L.; Hirata, R. Impacts of urbanization on groundwater hydrodynamics and hydrochemistry of the Toluca Valley aquifer (Mexico). Environ. Monit. Assess. 2014, 186, 2979–2999. [Google Scholar] [CrossRef]
  19. Zhang, Q.; Wang, H.; Wang, Y.; Yang, M.; Zhu, L. Groundwater quality assessment and pollution source apportionment in an intensely exploited region of northern China. Environ. Sci. Pollut. Res. 2017, 24, 16639–16650. [Google Scholar] [CrossRef]
  20. Xiong, Y.; Abdulraheem, M.I.; Li, L.; Moshood, A.Y.; Zhang, W.; Zhang, Y.Y.; Hu, J.D. Spatial analysis techniques for assessing groundwater vulnerability: A strategic approach to proactive conservation and mitigation strategies. Environ Earth Sci. 2024, 83, 621. [Google Scholar] [CrossRef]
  21. Jakóbczyk-Karpierz, S.; Ślósarczyk, K. Isotopic signature of anthropogenic sources of groundwater contamination with sulfate and its application to groundwater in a heavily urbanized and industrialized area (Upper Silesia, Poland). J. Hydrol. 2022, 612, 128255. [Google Scholar] [CrossRef]
  22. Jeong, C.H. Effect of land use and urbanization on hydrochemistry and contamination of groundwater from Taejon area, Korea. J. Hydrol. 2001, 253, 194–210. [Google Scholar] [CrossRef]
  23. Gao, Y.; Qian, H.; Ren, W.; Wang, H.; Liu, F.; Yang, F. Hydrogeochemical characterization and quality assessment of groundwater based on integrated-weight water quality index in a concentrated urban area. J. Clean. Prod. 2020, 260, 121006. [Google Scholar] [CrossRef]
  24. Qin, R.; Wu, Y.; Xu, Z.; Xie, D.; Zhang, C. Assessing the impact of natural and anthropogenic activities on groundwater quality in coastal alluvial aquifers of the lower Liaohe River Plain, NE China. Appl. Geochem. 2013, 31, 142–158. [Google Scholar] [CrossRef]
  25. Zhou, B.; Wang, H.; Zhang, Q. Assessment of the evolution of groundwater chemistry and its controlling factors in the Huangshui River Basin of northwestern China, using hydrochemistry and multivariate statistical techniques. Int. J. Environ. Res. Public Health 2021, 18, 7551. [Google Scholar] [CrossRef]
  26. Samantara, M.K.; Padhi, R.K.; Satpathy, K.K.; Sowmya, M.; Kumaran, P. Groundwater nitrate contamination and use of Cl/Br ratio for source appointment. Environ. Monit. Assess. 2015, 187, 50. [Google Scholar] [CrossRef]
  27. Murgulet, D.; Tick, G.R. Understanding the sources and fate of nitrate in a highly developed aquifer system. J. Contam. Hydrol. 2013, 155, 69–81. [Google Scholar] [CrossRef]
  28. Cao, W.; Zhang, Z.; Guo, H.; Fu, Y.; Gao, Z.; Nan, T.; Li, Z. Spatial distribution and controlling mechanisms of high fluoride groundwater in the coastal plain of Bohai Rim, North China. J. Hydrol. 2023, 617, 128952. [Google Scholar] [CrossRef]
  29. Liu, L.; Wang, G.; Li, Y.; Wei, Z.; Lin, W.; Qin, X.; Long, X. Hydrogeochemistry of geothermal water in Huangshadong and adjacent areas of Guangdong province: Implications for water-rock interaction. Geothermics 2024, 122, 103084. [Google Scholar] [CrossRef]
  30. Niu, C.; Zhang, Q.; Wang, H. Spatiotemporal variation in groundwater quality and source apportionment along the ye river of north China using the PMF model. Int. J. Environ. Res. Public Health 2022, 19, 1779. [Google Scholar] [CrossRef]
  31. Wang, L.; Yang, N.; Zhao, Y.; Zhang, Q. Research on the features and driving factors of shallow groundwater quality in arid areas, northwest China. Water 2025, 17, 934. [Google Scholar] [CrossRef]
  32. Wang, P.; Zhang, W.; Zhu, Y.; Liu, Y.; Li, Y.; Cao, S.; Li, B. Evolution of groundwater hydrochemical characteristics and formation mechanism during groundwater recharge: A case study in the Hutuo River alluvial–pluvial fan, North China Plain. Sci. Total Environ. 2024, 915, 170159. [Google Scholar] [CrossRef] [PubMed]
  33. Kong, J.; Zhou, Z.; Cao, W. Tracing the source and behaviour of sulphate in karst reservoirs, using stable isotopes and Bayesian isotopic-mixing models. Sci. Total Environ. 2025, 958, 177994. [Google Scholar] [CrossRef] [PubMed]
  34. Huang, P.; Zhang, Y.; Li, Y.; Gao, H.; Cui, M.; Chai, S. A multiple isotope (S, H, O and C) approach to estimate sulfate increasing mechanism of groundwater in coal mine area. Sci. Total Environ. 2023, 900, 165852. [Google Scholar] [CrossRef] [PubMed]
Figure 1. Distribution map of sampling sites in the Hutuo River basin.
Water 17 01530 g001
Figure 2. Comparison of spatial sulfate concentrations in the groundwater of the Hutuo River alluvial fan. Note: *** denotes a p-value < 0.001; NS: not significant. The shaded plots are violin plots, which are used to show the distribution of data across different groups. The size of each box in the box plot represents the interquartile range (IQR) of the data, which is the range between the first quartile (25th percentile) and the third quartile (75th percentile). The individual points within each region on the x-axis represent the actual data points for each group. These points are plotted to show the raw data distribution and to highlight outliers or extreme values that fall outside the whiskers of the box plot.
Water 17 01530 g002
Figure 3. Relation between groundwater depth and sulfate concentration.
Water 17 01530 g003
Figure 4. Hydrochemical type of groundwater in the Hutuo River alluvial fan. Note: The blue dashed line represents the boundary of the water chemical type.
Water 17 01530 g004
Figure 5. Ion ratio diagrams: (a) [Ca2+] vs. [SO42−] and (b) [SO42−]/[Ca2+] vs. [NO3]/[Ca2+].
Water 17 01530 g005
Figure 6. Spearman’s correlation analysis of hydrochemical components in the groundwater of the Hutuo River alluvial fan. Note: n = 118; p = 0.05. Very significant correlation—absolute value of the correlation coefficient ≥ 0.8; strongly significant correlation—absolute value of the correlation coefficient is between 0.6 and 0.8; significant correlation—absolute value of the correlation coefficient is between 0.4 and 0.6; not correlated—absolute value of the correlation coefficient < 0.4.
Water 17 01530 g006
Figure 7. Spatial distribution map of sulfate sources in the groundwater of the Hutuo River alluvial fan. (ac) represent the spatial interpolation maps of the scores for PC1, PC2, and PC3 in the principal component analysis, respectively.
Water 17 01530 g007
Table 1. Statistics of different groundwater parameters in the Hutuo River alluvial fan basin.
ParametersMinMaxMeanSDRES (%)Standard
DO1.0413.84.912.660
pH6.538.477.470.35606.5–8.5
K+0.1225.92.292.570
Na+8.7817234.726.40200
Ca2+27.236713163.80
Mg2+10.310232.013.80
Cl11.937971.459.71.7250
SO42−12.939512777.25.1250
HCO310956529672.60
NO30.2444061.870.222.088.6
TH115133945819850.0450
TDS17420916282928.51000
Note: Standard is the grade III standard for groundwater quality in China (GB/T 14848-2017) [16]. The pH value is dimensionless, while the units for all other indices are expressed in mg/L. The sample size for all indicators is 118. RES = rate of exceeded standard; SD = standard deviation. “—” indicates the absence of a corresponding standard.
Table 2. Results of principal component analysis for groundwater quality data in Hutuo River alluvial fan.
ParametersPC1PC2PC3
TH0.8250.529−0.024
NO30.8200.2240.178
Ca2+0.8140.4700.064
pH−0.8140.1570.070
HCO30.7510.225−0.305
TDS0.7390.6520.009
Mg2+0.5890.522−0.264
K+−0.1120.7810.044
Na+0.3590.769−0.065
Cl0.5230.688−0.138
SO42−0.5920.5950.222
DO−0.009−0.0060.940
Eigenvalue6.981.301.14
Contribution Rate (%)58.210.89.46
Cumulative Contribution Rate (%)58.269.078.5
Disclaimer/Publisher’s Note: The statements, opinions and data contained in all publications are solely those of the individual author(s) and contributor(s) and not of MDPI and/or the editor(s). MDPI and/or the editor(s) disclaim responsibility for any injury to people or property resulting from any ideas, methods, instructions or products referred to in the content.

