Article

Study on the Pollution Mechanism and Driving Factors of Groundwater Quality in Typical Industrial Areas of China

1
School of Civil Engineering, Nanyang Institute of Technology, Nanyang 473004, China
2
School of Information Engineering, Nanyang Institute of Technology, Nanyang 473004, China
3
No. 1 Geological Team of Shandong Provincial Bureau of Geology and Mineral Resources, Jinan 250100, China
*
Author to whom correspondence should be addressed.
Water 2025, 17(10), 1420; https://doi.org/10.3390/w17101420
Submission received: 5 April 2025 / Revised: 1 May 2025 / Accepted: 7 May 2025 / Published: 8 May 2025

Abstract

:
Uncovering the characteristics of groundwater pollution and its driving mechanisms are crucial for maintaining its ecological functions. This study focuses on hydrochemical changes and their driving factors in groundwater from different aquifers in industrial zones, taking Zibo City, Shandong Province, China, as the research area. During the dry and flood seasons of 2022, samples of phreatic water in pore media (17 sites) and karst confined water (23 sites) were collected and monitored. Piper trilinear diagrams, Gibbs diagrams, ion ratio diagrams, and a principal component analysis (PCA) were used for in-depth analyses. Pore phreatic water had higher excess rates of Na+, Cl, and NO3 than karst confined water, which indicated a greater degree of human impact compared with karst confined water. The main hydrochemical type was HCO3·SO4-Ca, but in the dry season, pore phreatic water shifted to HCO3·SO4·Cl-Ca. The ion ratios and PCA indicated that the groundwater quality was mainly controlled by water–rock interactions and industrial activities. In the flood season, pore phreatic water was influenced by evaporite dissolution, industrial activities, and domestic sewage, while in the dry season, it was affected by halite and carbonate weathering dissolution and domestic sewage. Karst confined water was controlled by water–rock interactions and industrial activities in both seasons. The findings reveal that the key drivers of groundwater quality displayed significant differences depending on the aquifer type and seasonal variations. As such, customized approaches are essential to efficiently address and counteract the decline in groundwater quality.

1. Introduction

Groundwater is crucial for human survival and development, and it is essential for sustainable social development and ecological stability [1]. With the acceleration of industrialization and urbanization, human activities are increasingly influencing groundwater quality, primarily through domestic sewage, industrial activities, and agricultural practices [2]. The concentration of and variation in chemical components in groundwater significantly impact water quality and human health. For instance, excessive nitrate levels can increase cancer risks [3], and high sulfate concentrations may cause diarrhea [4]. Therefore, understanding regional groundwater quality characteristics and their controlling factors is vital for scientific groundwater management and protection [5].
Groundwater quality is influenced by natural factors (e.g., topography, lithology, and recharge–discharge conditions) and anthropogenic factors (e.g., land use and agricultural and industrial activities) [6,7]. Previous studies have shown that in rapidly urbanized areas, groundwater quality is mainly controlled by water–rock interactions and domestic sewage [8], while in agricultural regions, it is influenced by water–rock interactions, fertilization, and sewage [9]. In arid areas, evaporation and human activities are dominant [10]. Although previous studies have explored the driving factors of groundwater quality in different regions, research on the pollution patterns and driving mechanisms of groundwater in large industrial cities remains limited. Compared with other regions, groundwater in industrial areas may have unique pollution mechanisms and driving factors. We hypothesize that industrial activities (such as the discharge of industrial wastewater, leakage of waste residues, and leakage of chemical raw materials) are the main driving forces of groundwater pollution in industrial areas, and its pollution patterns may exhibit characteristics of composite pollution, involving the simultaneous presence of multiple pollutants. In addition, the intensity of human activities in industrial areas is much higher than in other regions, and the rapid changes in land use patterns and urban infrastructure construction may further exacerbate the deterioration of groundwater quality.
Zibo City, a typical old industrial area in Shandong Province, China, with a 100-year industrial history based on coal, ceramics, and glass, has seen reduced groundwater recharge and local quality deterioration due to industrialization and urbanization, threatening the water supply [11]. However, the characteristics of groundwater pollution and its driving factors in this region remain unclear to date, posing a potential threat to the sustainable use of groundwater. This study focused on Zibo City to study groundwater quality and its driving factors across different geological settings. The objectives of this study included (1) analyzing the characteristics of changes in groundwater quality in industrial areas over different periods; (2) studying the evolution patterns of groundwater hydrochemistry and the sources of chemical components in industrial areas based on Piper trilinear diagrams, Gibbs diagrams, and ion ratio methods; and (3) applying a principal component analysis to identify the main controlling factors affecting groundwater quality and ultimately reveal the driving forces of groundwater pollution in industrial areas. This study not only fills the research gap in the pollution mechanisms and driving forces of groundwater in large industrial cities and enriches the theoretical framework of groundwater quality research, but also provides an important scientific basis for the sustainable development of groundwater resources and water ecological protection in Zibo City and similar industrial regions.

2. Materials and Methods

2.1. Overview of the Study Area

Zibo City is located at the junction of the Lu Zhong Mountains and the North China Plain, bordering Yimeng Mountains to the south, the North China Plain to the north, Weifang to the east, and Jinan to the west, with a total area of 5965 km2, including 1614 km2 of arable land. The topography includes plains in the north and center and low mountains and hills in the south. The terrain of the study area is generally higher in the south and lower in the north. The southern and central parts are mainly mountainous, hilly, and contain basins, while the northern part mainly comprises plains. The altitude ranges from 67.0 to 72.9 m. The industrial areas are mainly concentrated in the basins and plains in the central and northern parts, and the main agricultural areas are in the southern mountainous areas. The area has a warm temperate continental monsoon climate, with an average annual temperature of 12.5 °C–14.2 °C and precipitation of 650 mm.

2.2. Geology and Hydrogeology

Zibo City is in the northern part of the Lu Zhong Uplift in the Shandong Western Uplift Zone of the North China Plate, adjacent to the Jiyang Depression. The stratigraphy is of the North China type. To the north of Linzi district, Quaternary alluvial, fluvial, and marine deposits are widespread, while to the south, carbonate bedrock predominates. The city can be divided into the following three hydrogeological zones: the northern alluvial plain, the central basin, and a southern hilly area. The primary surface water bodies encompass Zi River, Fu River, and Xiaoqing River, among others. The presence of fault structures has facilitated a close hydrological connection between the surface water and groundwater. The main aquifers are fine sand layers in the north and the permeability is generally between 1 × 10⁻³ cm/s and 5 × 10⁻³ cm/s, with carbonate karst fracture and Quaternary porous layers in the central basin and limestone karst fracture layers in the south. Groundwater is primarily recharged by atmospheric precipitation and surface water infiltration, and is discharged through artificial extraction and evaporation. In the northern plain area, the groundwater flows from west to east. The central basin and the southern mountainous area are the main distribution areas of karst aquifers. The overall groundwater flow direction is from south to north. The mountainous area is the recharge area and the central basin is the main catchment area.

2.3. Sample Collection and Analysis

To study groundwater quality characteristics and their driving factors in Zibo City, 40 groundwater samples were collected in June 2022 (dry season) and October 2022 (flood season). These included 17 pore phreatic water samples (G01–G17) from depths of 30 to 90 m in the submountain alluvial flood plain and intermountain river basins and 23 karst confined water samples (G18–G40) from depths of 12 to 400 m in exposed and buried karst areas. All water samples were collected by pumping from wells, and thorough well flushing was conducted prior to pumping until the EC of the water samples stabilized. The sample sites are shown in Figure 1.
For sampling, 500 mL polyethylene bottles were used. Before sampling, the bottles were cleaned with distilled water and then rinsed three times with the water sample. Prior to the water sample collection, the wells were purged. Each sample was divided into two parts, one for cation (Na+, K+, Ca2+, Mg2+, and Fe3+) analyses, acidified with superior-grade nitric acid to pH < 2 on-site, and the other for anion (HCO3, SO42−, Cl, and NO3) analyses, with no reagents added. All samples were completely filled; stored without bubbles in a cool, dark place; and analyzed within a week.
The pH was measured on-site using a portable water quality multi-parameter analyzer (Hach-HQ40D, produced by Hach Company Water Quality Analysis Instruments (Shanghai) Co., Ltd., Shanghai, China). Dissolved solids (TDS) were determined using the gravimetric method. Cations were analyzed using inductively coupled plasma mass spectrometry (Agilent 7500ce ICP-MS, Tokyo, Japan). Anions were measured using ion chromatography (Perkin-Elmer Lambda 35, Waltham, MA, USA). Chemical oxygen demand (COD) was measured using alkaline permanganate oxidation and HCO3 by hydrochloric acid titration.

2.4. Data Analysis Methods

ArcGIS10.5 was used to create a sampling point distribution map. Excel was used for the statistical analysis of water sample data, including mean and exceedance rate calculations. Origin 2022 was used to create the ion ratio diagrams. Finally, SPSS25.0 was used for the standardization and principal component analysis of groundwater quality data.

3. Results and Discussion

3.1. Groundwater Chemical Composition Characteristics

To analyze the groundwater quality characteristics of pore phreatic water and karst confined water during the two hydrological periods, we statistically analyzed the ranges, means, and exceedance rates of the water quality indicators (Table 1). The results showed that, except for pH, the concentrations of hydrochemical indicators in pore phreatic water were higher than those in karst confined water in both the flood and dry seasons. Specifically, in the flood season, the mean concentrations of K+, Na+, Ca2+, Fe3+, HCO3, and NO3 in pore phreatic water were higher than in the dry season; for karst confined water, the mean concentrations of K+, Ca2+, Mg2+, Fe3+, SO42−, and COD were higher in the flood season.
In the flood season, the pH of pore phreatic water ranged from 7.55 to 8.19 (mean value of 7.66) and that of karst confined water ranged from 7.74 to 8.19 (mean value of 7.85), both weakly alkaline. The cation concentration order of both waters was Ca2+ > Na+ > Mg2+ > K+ > Fe3+; Na+ had the highest exceedance rate (17.7% in pore phreatic water and 8.70% in karst confined water, based on the Grade III standard for groundwater quality in China (GB/T14848-2017)) [12]. For anions, the concentration orders were SO42− > HCO3 > Cl > NO3 in pore phreatic water and HCO3 > SO42− > Cl > NO3 in karst confined water. SO42− and NO3 had the highest exceedance rates (52.9% and 8.70%, respectively). The higher concentration of HCO3 than SO42− in karst confined water was due to its occurrence in carbonate aquifers.
In the dry season, the pore phreatic water pH ranged from 7.11 to 8.03 (mean value of 7.66) and that of karst confined water ranged from 7.44 to 8.29 (mean value of 7.85). The cation and anion concentration orders were the same as in the flood season. However, the exceedance rates of NO3 and COD in karst confined water increased to 17.4% and 4.35% from 8.70% and 0 in the flood season. The new exceedance sample points (G20 and G23) were villages and farmlands in exposed karst areas. Nitrogen from domestic sewage and agricultural fertilizers could infiltrate into deep wells via surface runoff and irrigation return flow, causing NO3 and COD exceedances.
Overall, during a rainy season, the exceedance rates of groundwater chemical components are significantly higher than those in the dry season. This is mainly due to increased precipitation in the rainy season, which significantly enhances groundwater recharge, allowing more pollutants to enter the groundwater system through surface runoff and infiltration. During flood periods, the rapid recharge of surface water further exacerbates the input of pollutants. In areas with intensive human activities, the input of pollutants such as industrial wastewater discharge, domestic sewage leakage, and agricultural fertilization significantly increases, leading to higher exceedance rates of ions such as Na⁺, Cl, and NO3 [13]. Moreover, the exceedance rates of hydrochemical components in pore water are higher than those in karst confined water. This is primarily because pore water is closer to the surface and is more directly affected by human activities. The recharge pathways for pore water are relatively short, allowing pollutants to be more rapidly transported into the aquifer through precipitation and surface runoff [14], thereby exacerbating the exceedance of hydrochemical components. In contrast, karst confined water is mainly distributed in carbonate aquifers, where the longer recharge pathways and greater geological barriers limit the transport and diffusion of pollutants [15], resulting in relatively lower exceedance rates.

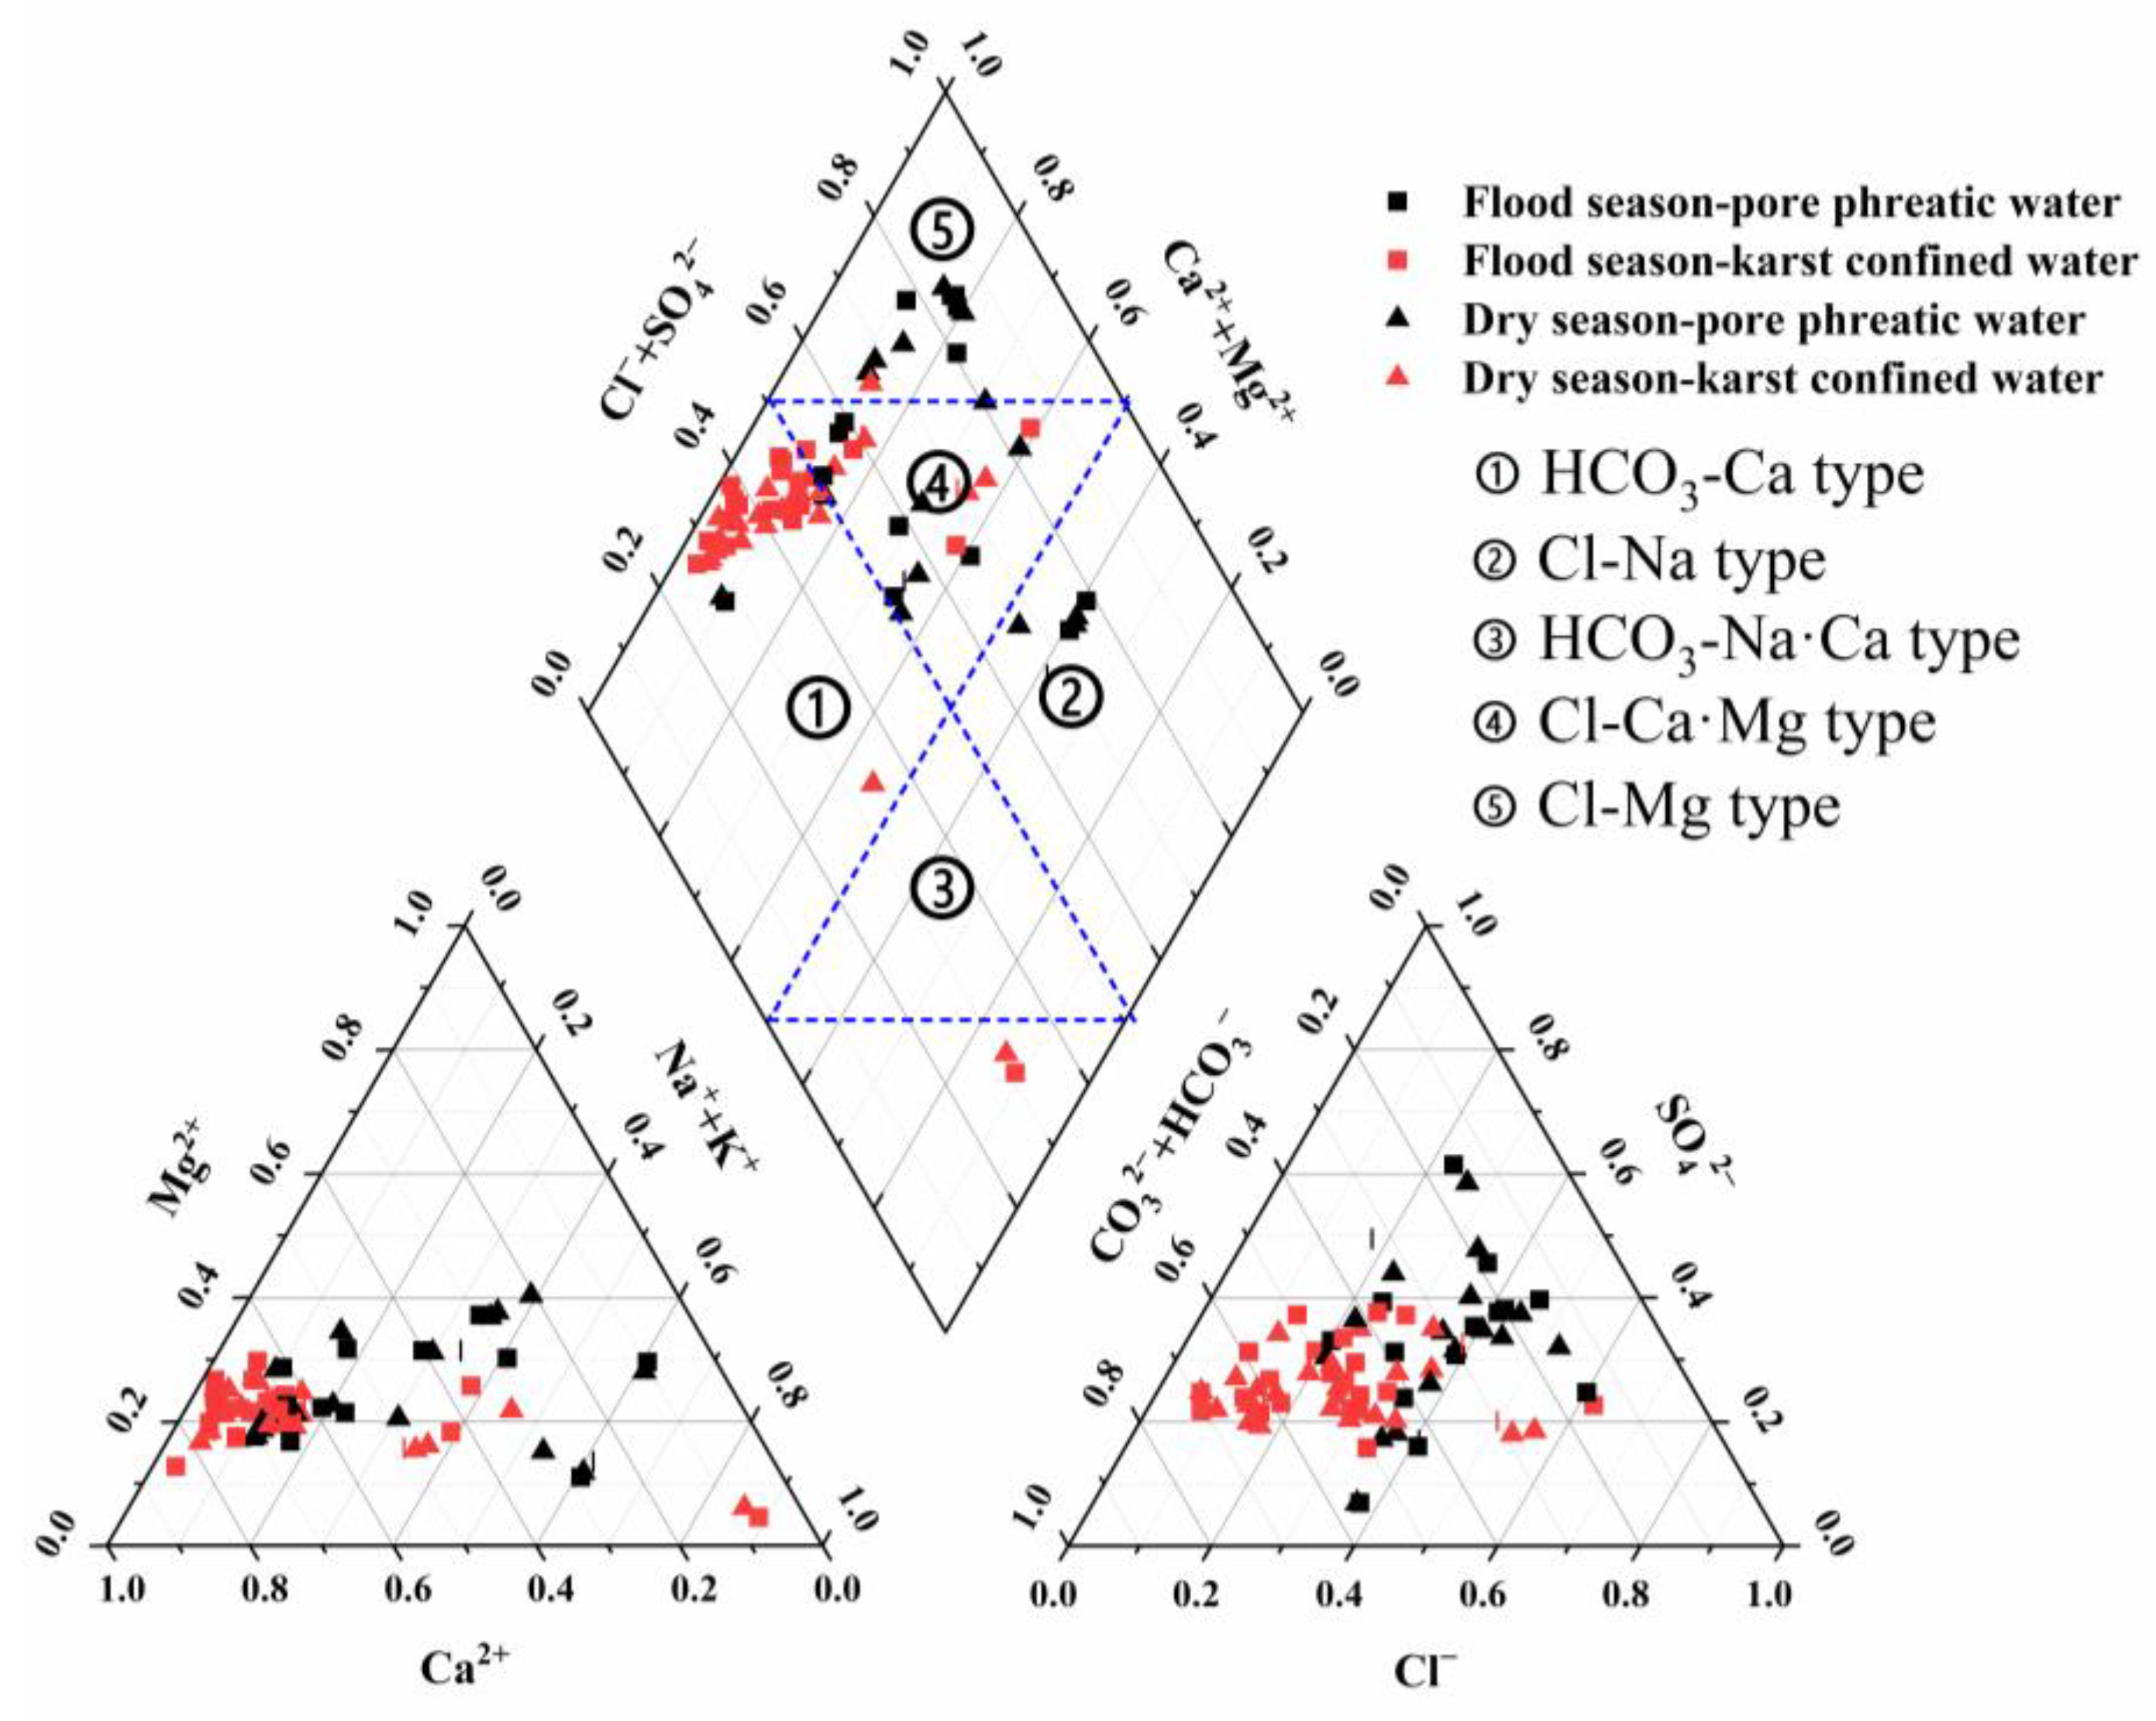
3.2. Analysis of Groundwater Chemical Types

A Piper trilinear diagram was used to determine the chemical types of the groundwater in the study area (Figure 2). During the flood season, pore phreatic water and karst confined water had 13 and 8 hydrochemical types, respectively, with HCO3·SO4—Ca being predominant (17.7% and 52.2% of the sampling points). In the dry season, there were 13 and 9 types, with HCO3·SO4·Cl—Ca and HCO3·SO4—Ca being the main types (17.7% and 43.5%, respectively). Overall, karst confined water remained predominantly HCO3·SO4—Ca in both seasons, while pore phreatic water shifted from HCO3·SO4—Ca in the flood season to HCO3·SO4·Cl—Ca in the dry season. For example, G10 and G11, located in the northern part of the study area in the porous aquifer region, changed from HCO3·SO4·Cl—Na·Ca in the flood season to HCO3·SO4·Cl—Ca in the dry season, increasing the proportion of this type from 5.88% to 17.7%. Overall, in both seasons, the proportion of sulfate-type water exceeded 50%, indicating a deteriorating trend in groundwater quality in the region, which could be associated with the intense industrial activities in the area [16].

3.3. Control Factors and Sources of Groundwater Ions

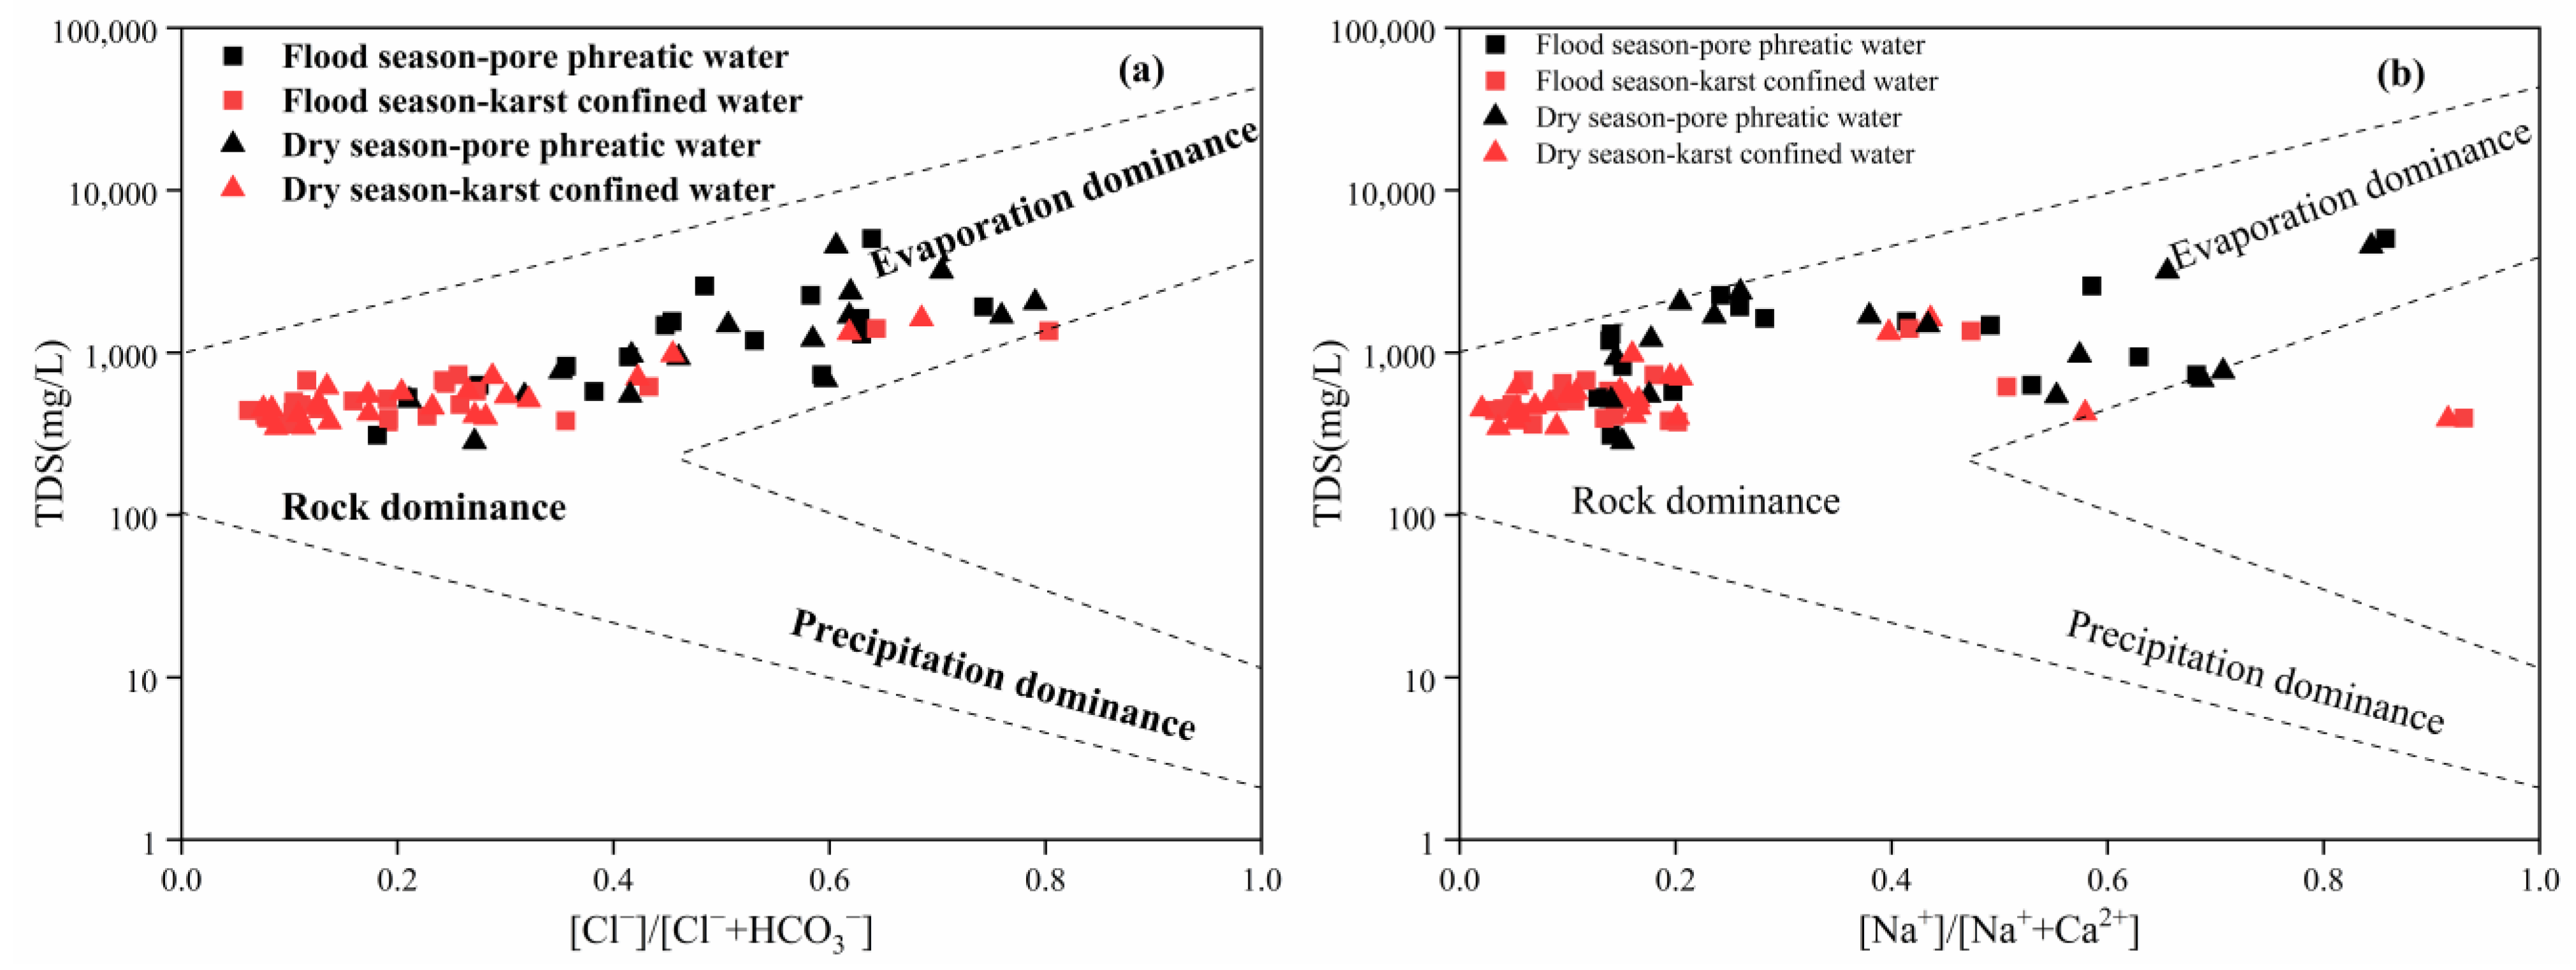
3.3.1. Analysis of Control Factors Based on Gibbs Diagrams

Rock weathering, atmospheric precipitation, and evaporation are the main factors affecting the chemical composition of natural waters [17]. In this study, Gibbs diagrams were used to analyze the hydrochemical control factors of pore phreatic water and karst confined water in the study area during both flood and dry seasons. Figure 3a,b show that in both seasons, the sampling points for pore phreatic water and karst confined water exhibited a shifting trend from the rock weathering zone to the evaporation zone, with a more pronounced shift in pore phreatic water. This indicated that rock weathering and evaporation were the primary control factors for the hydrochemistry of both waters, while the influence of atmospheric precipitation on the hydrochemistry was relatively smaller. It is worth noting that evaporation has a more significant impact on pore phreatic water than on karst confined water. This may be related to the shallower burial depth of pore phreatic water, its shorter recharge pathways, and the slower flow velocity and longer residence time of groundwater, which allow evaporation to have more time to influence the chemical composition of groundwater. Although Gibbs diagrams can qualitatively reveal the natural factors controlling groundwater chemistry, they are not effective at distinguishing the impacts of human activities [18], which will be analyzed in subsequent research.

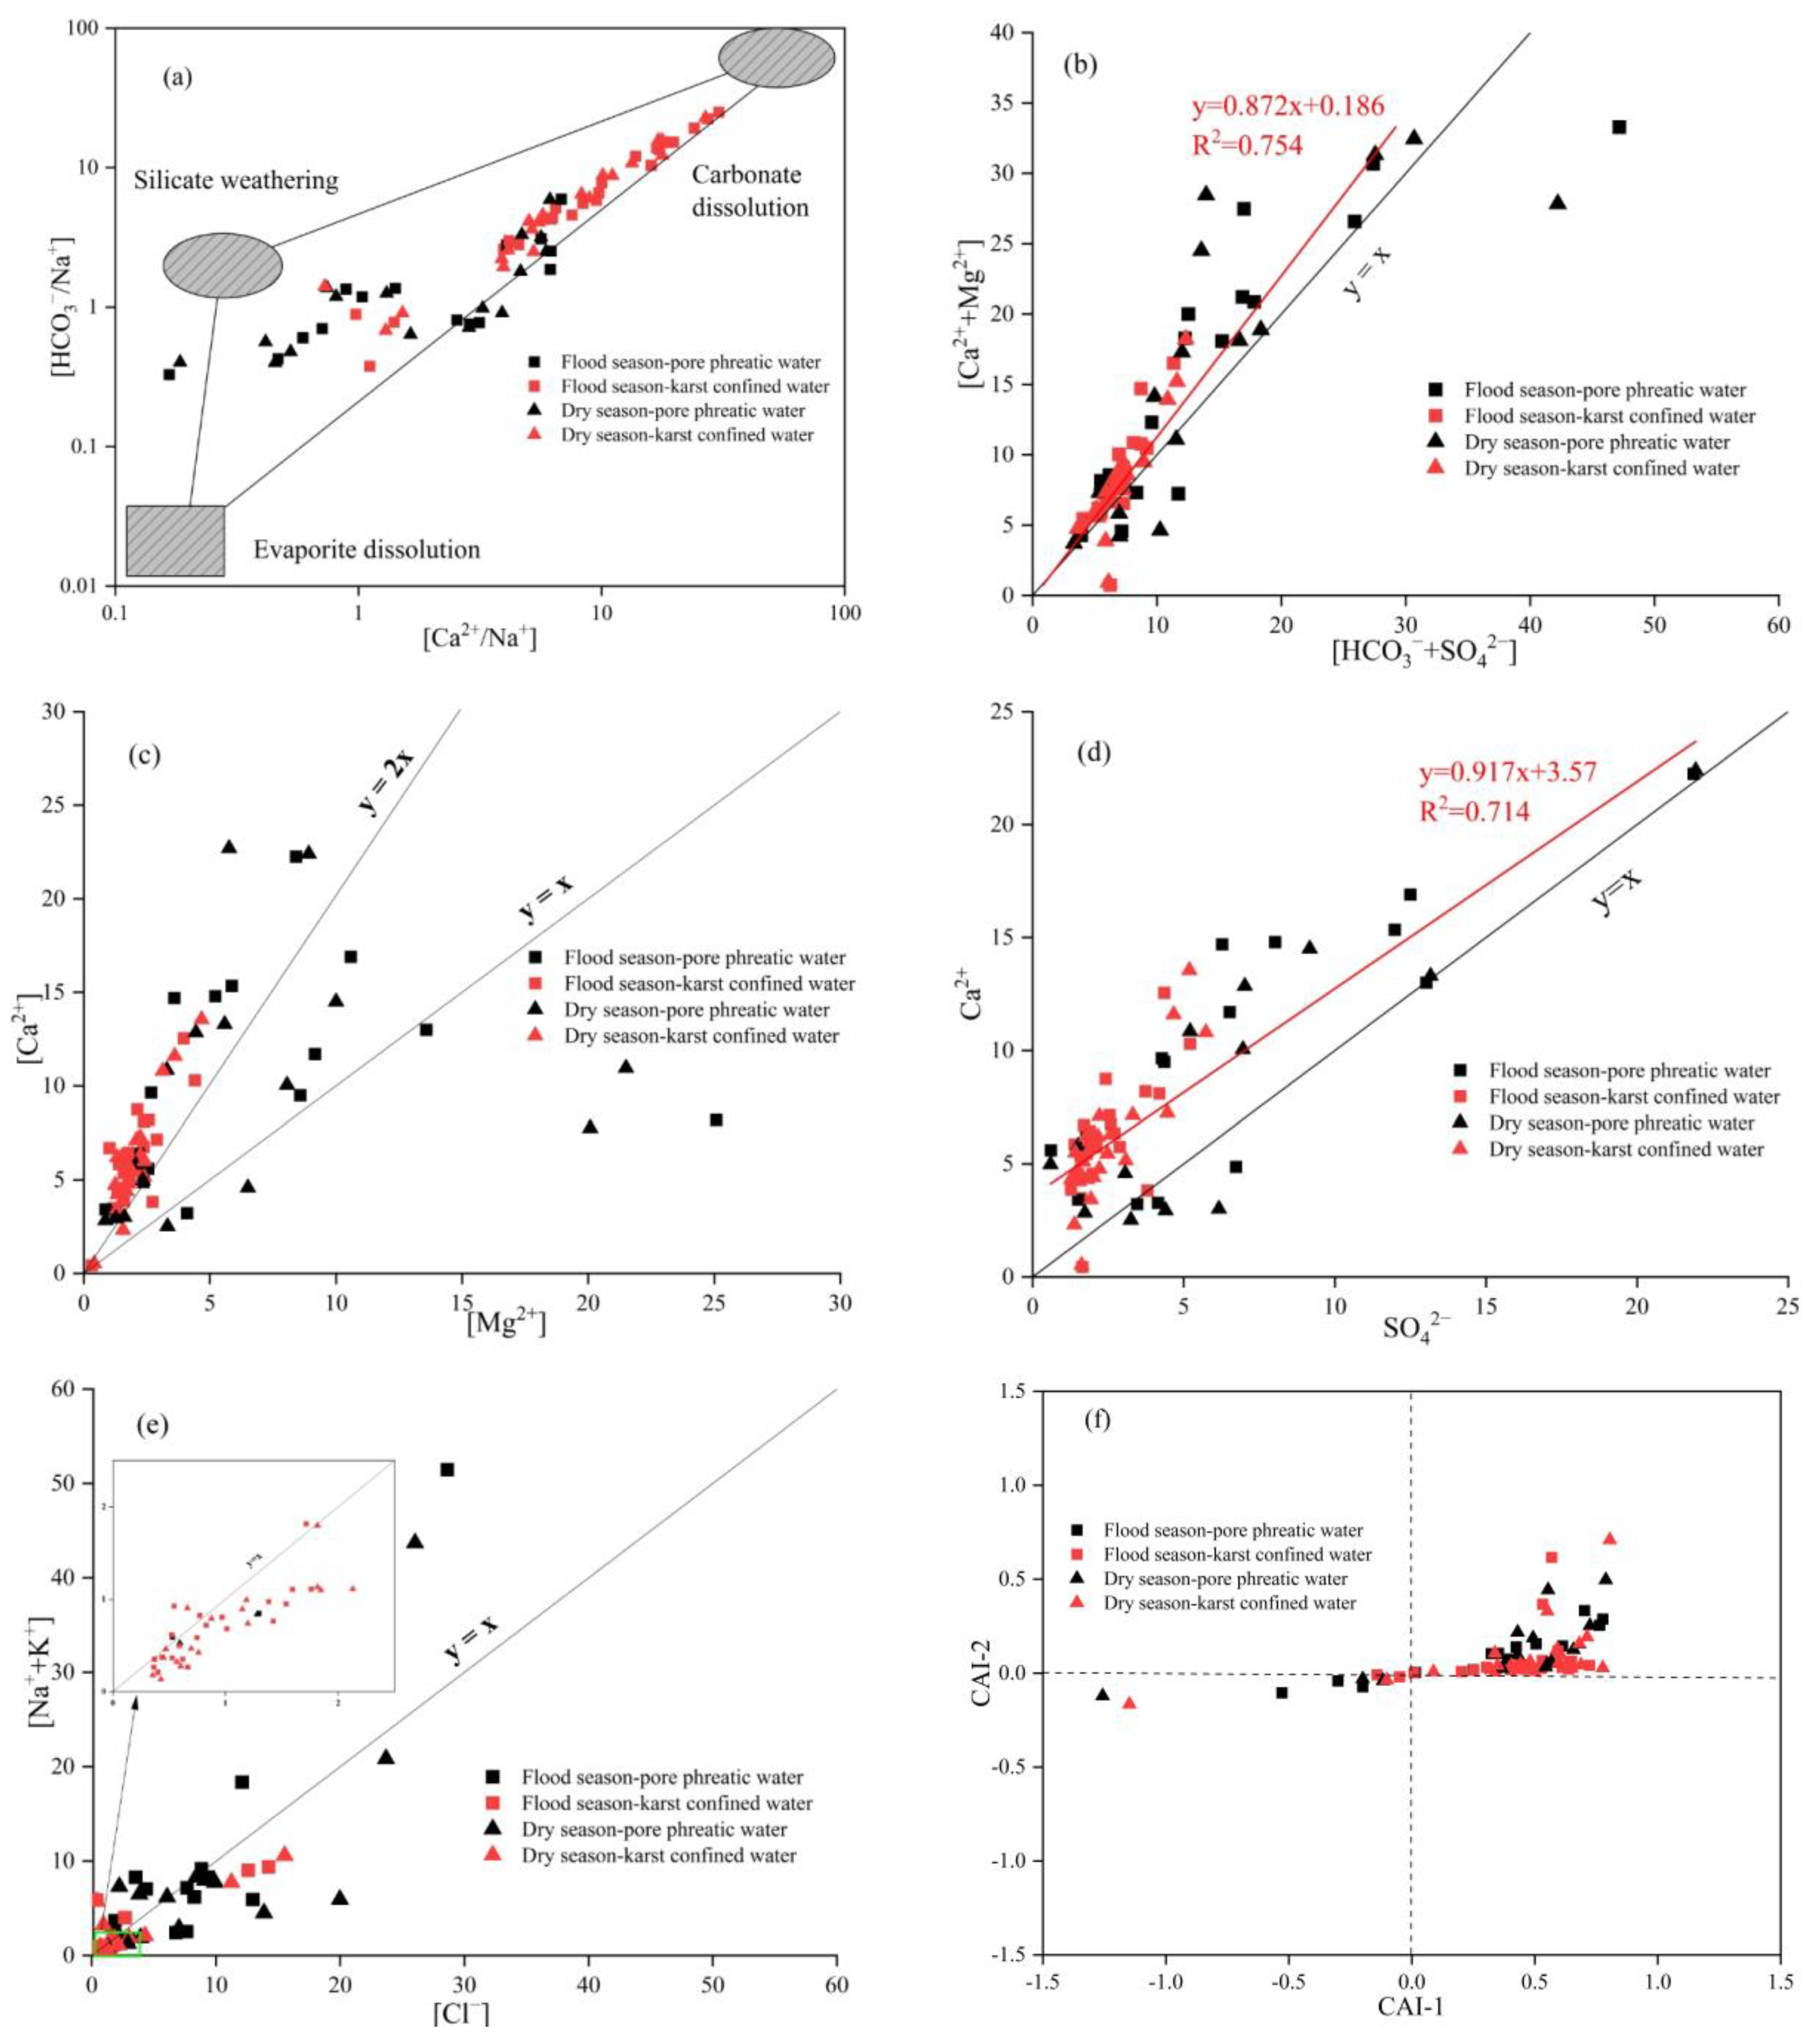
3.3.2. Identifying the Sources of Hydrochemical Parameters

Water–rock interaction is a significant factor influencing groundwater hydrochemistry. Research indicates that carbonate rock weathering releases Ca2+, Mg2+, and HCO3; silicate rock weathering releases Ca2+, Mg2+, Na+, K+, and HCO3; and evaporite rock weathering releases Ca2+, Mg2+, Na+, K+, SO42−, and Cl. Therefore, ion ratio diagrams can be used to analyze the sources of major ions in groundwater [19].
By examining the relationships between [Ca2+/Na+] and [HCO3/Na+] (Figure 4a), the effects of carbonate, silicate, and evaporite weathering on groundwater chemistry could be identified. Xing et al. found that for silicate rock end-members, the [Ca2+/Na+] and [HCO3/Na+] ratios are 0.35 ± 0.15 and 2 ± 1, respectively [20]; for carbonate rock end-members, they are 50 and 120; and for evaporite rock end-members, they are 0.25 ± 0.15 and 0.01 ± 0.01. In both flood and dry seasons, the pore phreatic water samples mainly clustered between the silicate and carbonate rock end-member regions, with a few near the evaporite dissolution area. This suggests that the Ca2+, Mg2+, Na+, and HCO3 in the pore phreatic water primarily originated from silicate and carbonate rock weathering, with minor contributions of Na+ and Ca2+ from evaporites like rock salt and gypsum [21]. This was because the phreatic aquifer consisted of sand and gravel layers rich in silicate and carbonate minerals. The karst confined water samples also fell within the carbonate and silicate weathering zones, with 87.0% being closer to the carbonate rock region, indicating a greater influence of carbonate rock weathering on their chemistry that was consistent with previous findings [22]. However, 13% of the karst confined water samples were close to the silicate end-member. This was mainly because these samples were primarily located in areas with a thicker cover of loose sediments. The pore water, acting as one of the recharge sources for the karst confined water in this region, caused a few karst confined water samples to approach the silicate end-member.
The molar ratio of [Ca2+ + Mg2+]/[HCO3 + SO42−] helps to assess the contribution of carbonate and silicate rock dissolution to ion components (Figure 4b) [23]. In both seasons, 92.3% and 84.6% of the pore phreatic water samples lay above the y = x line, while this proportion was 95.7% for karst confined water. This showed that carbonate rock dissolution dominated in pore phreatic water, with silicate rock dissolution being secondary, and was absolutely dominant in karst confined water. Additionally, [Ca2+ + Mg2+] and [HCO3 + SO42−] exhibited strong correlations (R2 = 0.754) in both seasons, indicating a common source for some Ca2+ and SO42−, likely gypsum dissolution [24].
The molar ratio of [Ca2+]/[Mg2+] helps to determine the extent of calcite and dolomite dissolution in carbonate rocks (Figure 4c) [25]. In both seasons, about 17.6% of the pore phreatic water samples fell between y = x and y = 2x and 76.5% fell above y = 2x, indicating that Ca2+, Mg2+ and HCO3 mainly originated from dolomite dissolution, with calcite being secondary. For karst confined water, 91.3% of the samples were above y = 2x, suggesting that dolomite weathering was the main source of these ions.
The ratio of [Ca2+]/[SO42−] indicates the source of SO42− (Figure 4d). Most samples from both waters fell above the y = x line in both seasons, with Ca2+ and SO42− showing a good correlation (R2 = 0.714). This implied that gypsum dissolution was the primary source of SO42− [26], while excess Ca2+ originated from carbonate rock weathering.
The molar ratio of (Na+ + K+) to Cl helps to identify the sources of Na+ and Cl. Most pore phreatic water samples in both seasons clustered around the y = x line with a positive correlation, indicating a common source (rock salt weathering) (Figure 4e). However, 58.8% and 70.6% of the samples fell below the y = x line, suggesting excess Cl may have originated from domestic sewage [27]. For karst confined water, 73.9% and 87.0% of the samples were below the y = x line, and most had low (Na+ + K+) and Cl equivalents (<2 meq/L), indicating a minimal contribution from rock salt weathering. Instead, Na+, K+, and Cl mainly originated from phreatic water inflow as carbonate rock weathering dominated.
The chlor-alkali index (CAI-1 and CAI-2) assesses cation exchange reactions (Figure 4f). Negative values indicate a forward exchange (Ca2+ releases Na+), while positive values indicate a reverse exchange (Na+ replaces Ca2+). Most samples in both seasons fell in regions with positive CAI-1 and CAI-2 values, indicating reverse cation exchange. Groundwater Na+ replaced adsorbed Ca2+ in the aquifer medium [28], reducing Na+ levels and potentially affecting the hydrochemical types, consistent with earlier conclusions.

3.4. Impact of Human Activities

Human activities exert a significant influence on groundwater quality. In regions characterized by intense human activities, the concentrations of NO3, Cl, SO42−, and Na+ in groundwater are elevated. Specifically, SO42− is predominantly influenced by industrial activities, while NO3, Cl, and Na+ are primarily affected by agricultural fertilization, fecal matter, and domestic sewage [29].
Figure 5a shows that in both seasons, 97.5% of the samples had higher [SO42−]/[Ca2+] ratios than [NO3]/[Ca2+]. Specifically, in the flood season, [SO42−]/[Ca2+] ranged from 0.107 to 3.78, while [NO3]/[Ca2+] ranged from 0.004 to 0.671. In the dry season, [SO42−]/[Ca2+] ranged from 0.119 to 3.27 and [NO3]/[Ca2+] ranged from 0.006 to 0.897. This finding indicated that industrial activities were the primary factor influencing groundwater quality, followed by agricultural activities. This was consistent with the study area’s long-standing industrial development, particularly its emphasis on heavy chemical industries [30]. Moreover, the pore phreatic water samples were mostly above the karst confined water samples, showing that industrial activities more strongly impacted pore phreatic water. This was because pore phreatic water is shallow and lacks a stable confining layer, allowing SO42− from industrial wastewater to more easily infiltrate into groundwater systems through surface runoff and leakage [31].
The relationship between [NO3]/[Cl] and [Cl] helps to identify NO3 sources. High [Cl] and low [NO3]/[Cl] suggest that NO3 is from sewage and fecal matter, low [Cl] and high [NO3]/[Cl] indicate agricultural origins, and low values for both suggest that soil nitrogen is the main source [32]. Figure 5b shows that in both seasons, 88.2% of the pore phreatic water and 52.2% of the karst confined water samples contained higher [Cl] than [NO3]/[Cl], indicating that NO3 in pore phreatic water was mainly from fecal matter and sewage, while in confined water, it originated from fecal matter, sewage, and agricultural fertilizers.
The pore phreatic water samples were mainly from the central and northern plains of the study area, in Linzi District and Huantai County, which are densely populated, with NO3 in groundwater mainly from fecal matter and sewage [33]. The karst confined water samples were from the plains and southern Boshan district, where farmland is mostly dry land (96.9%). According to the Zibo Statistical Yearbook, Boshan district’s average fertilizer application is 0.328 t/hm2, below the study area’s average of 0.491 t/hm2, but limited fertilizer absorption by dry-land crops could lead to excess fertilizer entering groundwater via rainwater runoff, increasing NO3 in karst confined water.

3.5. Identification of the Main Factors Controlling Groundwater Quality

To gain a deeper understanding of the impact of natural factors and human activities on the groundwater quality of the study area, we selected 12 parameters (K+, Na+, Ca2+, Mg2+, Fe3+, Cl, SO42−, HCO3, NO3, COD, TDS, and pH) and performed a PCA on pore phreatic water and karst confined water during both the flood and dry seasons. Prior to data entry, Kaiser–Meyer–Olkin (KMO) and Bartlett sphericity tests were conducted. The results showed that for flood-season pore phreatic water and karst confined water, the KMO values were 0.643 and 0.611, respectively, and the Bartlett sphericity test values were 589 and 497 (p < 0.001). For dry-season pore phreatic water and karst confined water, the KMO values were 0.650 and 0.765, respectively, and the Bartlett sphericity test values were 538 and 449 (p < 0.001). These results confirmed the suitability of the hydrochemical data for the PCA.
Based on eigenvalues > 1, during the flood season, two principal factors controlling the hydrochemical variations were identified for both pore phreatic water and karst confined water, explaining 80.8% and 77.0% of the total variance, respectively. During the dry season, two and three principal factors were identified for pore phreatic water and karst confined water, respectively, explaining 80.6% and 85.2% of the total variance.

3.5.1. Primary Factors Influencing Groundwater Quality During the Flood Season

As shown in Table 2, during the flood season, PC1 for pore phreatic water explained 62.3% of the information and was strongly correlated with Na+, Mg2+, Fe3⁺, TDS, K+, Cl, NO3, SO42−, and HCO3. As confirmed in Section 3.3.2, the Na+ and Cl of the pore phreatic water primary originated from the weathering and dissolution of rock salt. Typically, sulfate in groundwater mainly originates from the oxidation of sulfide minerals, the dissolution of gypsum, industrial wastewater, domestic sewage, and fertilizer application [34]. Nitrate in groundwater primarily stems from domestic sewage, fertilizers, soil nitrogen, and precipitation [35]. In this study, it was demonstrated in Section 3.3.2 that SO42− mainly originated from industrial activities and evaporite dissolution, while NO3 predominantly originated from fecal matter and domestic sewage. Thus, PC1 represented the combined influence of evaporite dissolution, industrial activities, and domestic sewage on the groundwater quality of pore phreatic water. PC2 accounted for 18.5% of the information and was strongly correlated with Ca2+ and pH values. Numerous studies have demonstrated that low-pH environments can significantly enhance the dissolution of carbonate rocks [36]. The Ca2+ in the pore phreatic water was mainly from the dissolution of carbonate rocks, which was also demonstrated in Section 3.3.2. Therefore, PC2 reflected the impact of carbonate rock dissolution on the quality of pore phreatic water.
For karst confined water during the flood season, PC1 explained 59.0% of the information and was mainly correlated with TDS, Na+, Cl, SO42−, and HCO3. Na+ and Cl predominantly originated from the weathering and dissolution of rock salt, while SO42−, HCO3, and Ca2+ were mainly influenced by carbonate rocks, gypsum, and industrial activities. Therefore, PC1 represented the influence of the weathering and dissolution of rock salt, carbonate rocks, and gypsum as well as industrial activities on karst confined water. PC2 accounted for 18.0% of the information and was strongly correlated with NO3 and pH. As mentioned earlier, in this study area, the high concentration of NO3 was primarily attributed to agricultural fertilizers and domestic sewage. Thus, PC2 mainly reflected the impact of agricultural activities and domestic sewage on the chemical composition of karst confined water.

3.5.2. Primary Factors Influencing Groundwater Quality During the Dry Season

During the dry season, PC1 for pore phreatic water explained 46.0% of the variables and was strongly correlated with K+, Na+, NO3, HCO3, TDS, and Mg2+. It also showed a certain positive correlation with Cl and SO42− (Table 3). Na+, HCO3, and Mg2+ mainly originated from the weathering and dissolution of rock salt and carbonate rocks, while NO3 predominantly originated from fecal matter and domestic sewage. Therefore, PC1 represented the influence of rock salt and carbonate rock weathering as well as domestic sewage on pore phreatic water. PC2 accounted for 34.6% of the information and was strongly correlated with Ca2+, pH, Cl, and SO42−. The common source of Ca2+ and SO42− is mainly gypsum and industrial activities can also increase the SO42− and Cl in groundwater. Thus, PC2 could be summarized as the impact of gypsum dissolution and industrial activities on pore phreatic water.
For karst confined water during the dry season, PC1 explained 51.1% of the information and was strongly correlated with Na+, Mg2+, TDS, HCO3, Ca2+, pH, Cl, and SO42−. As mentioned earlier, PC1 reflected the influence of water–rock interactions and industrial activities on karst confined water. PC2 accounted for 19.5% of the information and was strongly negatively correlated with NO3 and strongly positively correlated with COD. NO3 in karst confined water mainly originated from agricultural activities and domestic sewage. PC3 accounted for 14.6% of the variance and was strongly correlated with K+, while it moderately correlated with Fe3⁺. Previous studies have found that high concentrations of iron in groundwater can indicate industrial pollution as well as a reducing environment in water [37]. As the principal components were independent of each other, and as PC1 represented industrial pollution, it followed that PC3 represented the influence of the aquifer’s reducing environment on the groundwater chemistry.

4. Limitations of This Study

This study has comprehensively analyzed the characteristics of groundwater quality and their controlling factors in different aquifers within the industrial zone of Zibo during flood and dry seasons, revealing the significant impact of industrial activities on groundwater quality. However, the source tracing analysis in this study mainly relied on hydrochemical methods, which, although capable of qualitatively identifying the main sources of pollutants in groundwater, had limitations in distinguishing the migration and transformation patterns of different pollutants and in analyzing the contribution rates of each pollutant to groundwater pollution. For instance, this study identified that the high exceedance rates of SO42− and Cl were mainly due to the impact of industrial activities, but it was difficult to further distinguish whether these pollutants originated from specific industrial discharge points or were the result of cumulative effects from surface runoff and infiltration. Future studies could apply isotope tracing techniques in combination with source apportionment models to conduct more accurate research on the sources of pollutants in the region’s groundwater [38,39]. In addition, the sampling time and sample size of this study were limited, with sampling conducted only during the flood and dry seasons, which may not fully reflect the dynamic changes in groundwater quality. Future research could increase the sampling frequency, especially during flood periods and peak industrial activity periods, to gain a more comprehensive understanding of the trends in groundwater quality changes. Applying machine learning methods to predict pollution trends could provide stronger support for the long-term management and protection of groundwater quality.

5. Conclusions

This study comprehensively analyzed the characteristics of groundwater quality and their controlling factors in different aquifers within the industrial zone of Zibo during flood and dry seasons. The results indicated that, in the industrial area, the exceedance rates of SO42− and Cl in pore water reached as high as 52.9% and 44.5%, respectively, demonstrating a significant impact of industrial activities on groundwater. Rock weathering and evaporation were the primary control factors for the hydrochemistry of both waters, although evaporation had a more significant impact on pore phreatic water than on karst confined water. Water–rock interactions and industrial activities were the two primary factors affecting groundwater quality, with industrial activities having a more pronounced impact on pore phreatic water. These results demonstrate that the dominant factors influencing groundwater quality exhibited substantial variability across different aquifer media and seasons. Drawing from the research conclusions, we propose that preventing the discharge of untreated industrial wastewater is essential to mitigate the decline in groundwater quality within industrial regions. Although our study has shed light on the significant impact of industrial activities on groundwater pollution, it faced limitations in precisely quantifying the contributions of individual factors due to restricted sampling times and sample sizes. Future investigations should consider utilizing advanced source tracing techniques, such as isotope analysis, alongside machine learning algorithms to delve deeper into the factors influencing groundwater quality in industrial areas. To sum up, this study not only enhances the theoretical understanding of groundwater hydrochemical evolution in industrial settings, but also furnishes a scientific foundation for safeguarding groundwater quality in these locales.

Author Contributions

L.W.: Investigation, Methodology, Software, Data Curation, and Writing—Original Draft Preparation. Q.W.: Investigation, Software, and Methodology. D.Z.: Supervision, Methodology, and Writing—Reviewing and Editing. All authors have read and agreed to the published version of the manuscript.

Funding

This work was supported by the Nanyang Institute of Technology Doctoral Research Startup Fund Project (NGBJ-510069).

Data Availability Statement

The data are available from the authors upon reasonable request.

Acknowledgments

The authors gratefully acknowledge the editor and anonymous reviewers for their valuable comments on this manuscript. The authors also appreciate financial support from different organizations.

Conflicts of Interest

The authors declare no conflicts of interest.

References

  1. Velis, M.; Conti, K.I.; Biermann, F. Groundwater and human development: Synergies and trade-offs within the context of the sustainable development goals. Sustain. Sci. 2017, 12, 1007–1017. [Google Scholar] [CrossRef] [PubMed]
  2. Zhang, Q.; Miao, L.; Wang, H.; Hou, J.; Li, Y. How Rapid Urbanization Drives Deteriorating Groundwater Quality in a Provincial Capital of China. Pol. J. Environ. Stud. 2020, 29, 441–450. [Google Scholar] [CrossRef] [PubMed]
  3. Picetti, R.; Deeney, M.; Pastorino, S.; Miller, M.R.; Shah, A.; Leon, D.A.; Dangour, A.D.; Green, R. Nitrate and nitrite contamination in drinking water and cancer risk: A systematic review with meta-analysis. Environ. Res. 2022, 210, 112988. [Google Scholar] [CrossRef] [PubMed]
  4. Backer, L.C. Assessing the acute gastrointestinal effects of ingesting naturally occurring, high levels of sulfate in drinking water. Crit. Rev. Clin. Lab. Sci. 2000, 37, 389–400. [Google Scholar] [CrossRef]
  5. Teklearegay, T.; Atlabachew, A.; Abebe, A.; Jothimani, M. Comprehensive hydrogeochemical and statistical assessment of groundwater quality for drinking and irrigation in the Demie River catchment, Southern Ethiopia. SN Appl. Sci. 2025, 7, 1–35. [Google Scholar] [CrossRef]
  6. Qu, S.; Duan, L.; Shi, Z.; Liang, X.; Lv, S.; Wang, G.; Yu, R. Hydrochemical assessments and driving forces of groundwater quality and potential health risks of sulfate in a coalfield, northern Ordos Basin, China. Sci. Total Environ. 2022, 835, 155519. [Google Scholar] [CrossRef]
  7. Ewusi, A.; Sunkari, E.D.; Seidu, J.; Coffie-Anum, E. Hydrogeochemical characteristics, sources and human health risk assessment of heavy metal dispersion in the mine pit water-surface water-groundwater system in the largest manganese mine in ghana. Environ. Technol. Innov. 2022, 26, 102312. [Google Scholar] [CrossRef]
  8. Zhu, M.; Xie, Y.; Su, J.; Lu, S. Assessment of groundwater quality of unconfined aquifers in an urbanized area using the water quality index method. Environ. Sci. Pollut. Res. 2024, 31, 64870–64883. [Google Scholar] [CrossRef]
  9. Zhai, T.L.; Zhang, Q.Q.; Wang, L.; Wang, H.W. Temporal and spatial variations hydrochemical components and driving factors in Baiyangdian lake in the northern plain of China. J. Groundw. Sci. Eng. 2024, 12, 293–308. [Google Scholar] [CrossRef]
  10. Wang, G.S.; Wang, G.; Xia, J.; Chen, J. Quantification of effects of climate variations and human activities on runoff by a monthly water balance model: A case study of the Chaobai River basin in northern China. Water Resour. Res. 2009, 45, 1–12. [Google Scholar] [CrossRef]
  11. Li, J.; Zhang, Y.K.; Zhao, Y. Evaluation on quality and health risk of groundwater in a highly urbanized watershed, China. Environ. Sci. Pollut. Res. 2024, 31, 27136–27154. [Google Scholar] [CrossRef] [PubMed]
  12. GB/T14848-2017; Standard for Groundwater Quality. General Administration of Quality Supervision, Inspection and Quarantine of the People’ s Republic of China. Ministry of Natural Resources of the People’s Republic of China (MNRPRC): Beijing, China, 2017.
  13. Li, S.L.; Liu, C.Q.; Li, J.; Liu, X.; Chetelat, B.; Wang, B.; Wang, F. Assessment of the sources of nitrate in the Changjiang River, China using a nitrogen and oxygen isotopic approach. Environ. Sci. Technol. 2010, 44, 1573–1578. [Google Scholar] [CrossRef] [PubMed]
  14. He, H.; Xiong, X.; Wu, T.; Hu, R.; Chen, Y.F.; Yang, Z. Pore-scale study of particle transport and clogging mechanisms in a porous micromodel. Sep. Purif. Technol. 2025, 362, 131929. [Google Scholar] [CrossRef]
  15. Campanale, C.; Losacco, D.; Triozzi, M.; Massarelli, C.; Uricchio, V.F. An Overall Perspective for the Study of Emerging Contaminants in Karst Aquifers. Resources 2022, 11, 105. [Google Scholar] [CrossRef]
  16. Miao, Z.; Carroll, K.C.; Brusseau, M.L. Characterization and quantification of groundwater sulfate sources at a mining site in an arid climate: The Monument Valley site in Arizona, USA. J. Hydrol. 2013, 504, 207–215. [Google Scholar] [CrossRef]
  17. Xing, J.B.; Long, W.; Jie, Z.; Zhai, T.L. Hydrochemical variation characteristics and driving factors of surface water in arid Areas—A case study of Beichuan River in Northwest China. Front. Environ. Sci. 2024, 12, 1493390. [Google Scholar] [CrossRef]
  18. Andres, M.; Paul, S. Groundwater chemistry and the gibbs diagram. Appl. Geochem. 2018, 97, 209–212. [Google Scholar] [CrossRef]
  19. Pan, X.; Sun, B.; Zhang, S.; Li, G.; Tian, Z.; Guo, Z. Ion sources and seasonal recharge characteristics of groundwater around Dali lake in semi-arid region of inner Mongolia plateau, China. J. Geochem. Explor. 2025, 269, 107612. [Google Scholar] [CrossRef]
  20. Wang, Q.; Dong, S.; Wang, H.; Yang, J.; Huang, H.; Dong, X.; Yu, B. Hydrogeochemical processes and groundwater quality assessment for different aquifers in the Caojiatan coal mine of Ordos Basin, northwestern China. Environ. Earth Sci. 2020, 79, 1–15. [Google Scholar] [CrossRef]
  21. Zhao, Y.; Wang, C.; Xiang, W.; Zhang, S. Evaluation of the hydrochemical evolution characteristics and renewable capacity of deep fresh groundwater in the Hangzhou bay new zone, China. Environ. Earth Sci. 2019, 78, 1–15. [Google Scholar] [CrossRef]
  22. He, H.; Liu, G.; Zou, Y.; Li, X.; Ji, M.; Li, D. Coupled action of rock weathering and aquatic photosynthesis: Influence of the biological carbon pump effect on the sources and deposition of organic matter in Ngoring Lake, Qinghai–Tibet Plateau, China. Catena 2021, 203, 105370. [Google Scholar] [CrossRef]
  23. Xiao, Y.; Shao, J.; Cui, Y.; Zhang, G.; Zhang, Q. Groundwater circulation and hydrogeochemical evolution in Nomhon of Qaidam basin, northwest China. J. Earth Syst. Sci. 2017, 126, 1–16. [Google Scholar] [CrossRef]
  24. Ren, X.; Zhang, Z.; Yu, R.; Li, Y.; Li, Y.; Zhao, Y. Hydrochemical variations and driving mechanisms in a large linked river-irrigation-lake system. Environ. Res. 2023, 225, 115596. [Google Scholar] [CrossRef] [PubMed]
  25. Billong, P.T.N.; Feumba, R.; Ndjigui, P.D. Hydrogeochemical appraisal of groundwater quality in Ngoua watershed (Douala-Cameroon): Implication for domestic purposes. Sci. Afr. 2023, 22, e01910. [Google Scholar] [CrossRef]
  26. Wang, L.; Yang, N.; Zhao, Y.; Zhang, Q. Research on the Features and Driving Factors of Shallow Groundwater Quality in Arid Areas, Northwest China. Water 2025, 17, 934. [Google Scholar] [CrossRef]
  27. Cao, M.; Hu, A.; Gad, M.; Adyari, B.; Qin, D.; Zhang, L. Domestic wastewater causes nitrate pollution in an agricultural watershed, China. Sci. Total Environ. 2022, 823, 153680. [Google Scholar] [CrossRef]
  28. Gugulothu, S.; Subbarao, N.; Das, R.; Dhakate, R. Geochemical evaluation of groundwater and suitability of groundwater quality for irrigation purpose in an agricultural region of south India. Appl. Water Sci. 2022, 12, 1–13. [Google Scholar] [CrossRef]
  29. Zhang, Q.; Wang, H. Assessment of sources and transformation of nitrate in the alluvial-pluvial fan region of north China using a multi-isotope approach. J. Environ. Sci. 2020, 89, 9–22. [Google Scholar] [CrossRef]
  30. Zhang, Y.; Hou, K.; Qian, H.; Gao, Y.; Fang, Y.; Tang, S.; Zhang, Q. Natural-human driving factors of groundwater salinization in a long-term irrigation area. Environ. Res. 2023, 220, 115178. [Google Scholar] [CrossRef]
  31. Huang, H.; Liang, X.; Xiao, C.; Wang, Z. Analysis and assessment of confined and phreatic water quality using a rough set theory method in Jilin City, China. Water Sci. Technol. Water Sup. 2015, 15, 773–783. [Google Scholar] [CrossRef]
  32. Zhang, Y. Hydrochemical characteristics, controlling factors and groundwater sources of Zaozigou gold mine. Sustainability 2024, 16, 7989. [Google Scholar] [CrossRef]
  33. Cui, R.; Fu, B.; Mao, K.; Chen, A.; Zhang, D. Identification of the sources and fate of NO3-N in shallow groundwater around a plateau lake in southwest China using NO3 isotopes (δ15N and δ18O) and a Bayesian model. J. Environ. Manag. 2020, 270, 110897. [Google Scholar] [CrossRef] [PubMed]
  34. Zhang, D.; Li, X.-D.; Zhao, Z.-Q.; Liu, C.-Q. Using dual isotopic data to track the sources and behaviors of dissolved sulfate in the western North China Plain. Appl. Geochem. 2015, 52, 43–56. [Google Scholar] [CrossRef]
  35. Wang, F.; Liu, L.; Xu, W.; Li, Y.; Ruan, Q.; Cao, W. Multiple stable isotopic approaches for tracing nitrate contamination sources: Implications for nitrogen management in complex watersheds. Ecotox. Environ. Saf. 2024, 269, 115822. [Google Scholar] [CrossRef]
  36. Naz, M.; Dai, Z.; Hussain, S.; Tariq, M.; Danish, S.; Khan, I.U. The soil pH and heavy metals revealed their impact on soil microbial community. J. Environ. Manag. 2022, 321, 115770. [Google Scholar] [CrossRef]
  37. Juahir, H.; Zain, S.M.; Yusoff, M.K.; Hanidza, T.T.; Armi, A.M.; Toriman, M.E. Spatial water quality assessment of Langat River basin (Malaysia) using environmetric techniques. Environ. Monit. Assess. 2011, 173, 625–641. [Google Scholar] [CrossRef]
  38. Zhang, Q.; Wang, H.; Liu, L.; Zhai, T.; Zhang, X. Multiple isotopes reveal the driving mechanism of high NO3 level and key processes of nitrogen cycling in the lower reaches of Yellow River. J. Environ. Sci. 2024, 138, 597–606. [Google Scholar] [CrossRef]
  39. Xie, C.; Zhao, L.; Eastoe, C.J.; Wang, N.; Dong, X. An isotope study of the Shule River Basin, Northwest China: Sources and groundwater residence time, sulfate sources and climate change. J. Hydrol. 2022, 612, 128043. [Google Scholar] [CrossRef]
Figure 1. Geographical location map of the study area.
Water 17 01420 g001
Figure 2. The hydrochemical types’ map of groundwater in the study area.
Water 17 01420 g002
Figure 3. The controlling factors of groundwater hydrochemical variations in the study area. (a) [Cl]/[ Cl+ HCO3] vs. TDS; (b) [Na+]/[ Na+ + Ca2+] vs. TDS.
Water 17 01420 g003
Figure 4. The source identification diagram of groundwater hydrochemical components. (a) [Ca2+/Na+] vs. [HCO3/Na+]; (b) [HCO3+SO42−] vs. [Ca2+ + Mg2+]; (c) [Mg2+] vs. [Ca2+]; (d) [SO42−] vs. [Ca2+]; (e) [Cl] vs. [Na+ + K+]; (f) CAI-1 vs. CAI-2. CAI-1 = (γ(Cl) − [γ(Na+) + γ(K+))/γ(Cl). CAI-2 = (γ(Cl) − [γ(Na+) + γ(K+])/(γ(SO42−) + γ(HCO3) + γ(CO32) + γ(NO3)).
Water 17 01420 g004
Figure 5. The ratio diagram of groundwater hydrochemical components. (a) [NO3]/[Ca2+] vs. [SO42−]/[Ca2+] and (b) [Cl] vs. [NO3]/[Cl].
Water 17 01420 g005
Table 1. Statistical water sample index of the study area.
ParametersRange/(mg·L−1)Average/(mg·L−1)Exceedance Rate/%Standard
Flood SeasonDry SeasonFlood SeasonDry SeasonFlood SeasonDry Season
PWKWPWKWPWKWPWKWPWKWPWKW
pH7.55–8.197.74–8.197.11–8.037.44–8.297.868.017.667.850.000006.50–8.50
K+0.720–86.20.430–4.920.266–66.20.465–4.616.951.835.781.67
Na+12.8–11334.40–21311.6–9662.64–24118140.217540.817.78.7011.84.36200
Ca2+64.5–4458.75–25150.4–45410.4–271201120192116
Mg2+10.3–3013.63–52.810.3–2584.90–56.076.723.876.723.4
Fe3+0.040–0.6500.040–0.2800.040–0.2500.040–0.2400.1980.0880.1310.07717.70000.3
Cl18.8–101612.9–50521.11–92412.6–5512537230275.247.14.3541.24.35250
SO42−28.8–148860.9–25028.5–121561.0–27540011540811352.94.3552.94.35250
HCO3146–986140–42697.4–1031103–435400265363272
NO34.65–3461.01–1283.93–4310.016–13983.443.475.547.829.48.7011.817.488.6
COD0.96–1.980.95–2.30.600–4.300.300–3.901.541.571.841.09005.884.353.00
TDS310–5042362–1408282–4528345–16161422565143157152.98.7047.18.701000
Note: The units of all water quality parameters are mg‧L−1, except for pH, which is dimensionless. Standard is the quality standard for groundwater developed by China (GB/T14848-2017) [12]. PW: Pore phreatic water; KW: karst confined water.
Table 2. Principal component analysis of major ions during the flood season.
ParametersPore
Phreatic Water
Karst
Confined Water
PC1PC2PC1PC2
Na+0.9800.0550.9530.207
Mg2+0.9220.3410.875−0.228
Fe3+0.9190.2810.960−0.081
TDS0.9130.3880.993−0.013
K+0.913−0.1090.4450.696
Cl0.9010.3720.9260.282
NO30.8650.143−0.023−0.763
SO42−0.8430.2740.690−0.581
HCO30.8110.4490.8540.183
COD0.4420.054−0.2170.672
Ca2+0.1320.8960.852−0.186
pH−0.138−0.782−0.6810.233
Eigenvalue8.271.437.092.15
Contribution Rate (%)62.318.559.018.0
Cumulative Contribution Rate (%)62.380.859.077.0
Table 3. Principal component analysis of major ions during the dry season.
ParametersPore Phreatic WaterKarst Confined Water
PC1PC2PC1PC2PC3
K+0.9510.0210.2530.1500.909
Na+0.9180.3240.7250.5300.353
NO30.8920.0810.068−0.896−0.112
HCO30.8820.2880.7230.553−0.152
TDS0.7470.6590.9120.2400.310
Mg2+0.6900.6400.8070.466−0.205
COD0.3050.2610.5180.5680.294
Ca2+−0.0680.8740.847−0.0720.398
pH−0.105−0.801−0.778−0.069−0.192
Fe3+0.5400.7630.7610.3170.456
Cl0.6010.7600.8010.3850.410
SO42−0.6310.6910.852−0.0500.232
Eigenvalue7.901.777.861.351.01
Contribution Rate (%)46.034.651.119.514.6
Cumulative Contribution Rate (%)46.080.651.170.685.2
Disclaimer/Publisher’s Note: The statements, opinions and data contained in all publications are solely those of the individual author(s) and contributor(s) and not of MDPI and/or the editor(s). MDPI and/or the editor(s) disclaim responsibility for any injury to people or property resulting from any ideas, methods, instructions or products referred to in the content.

