
Identification and Assessment of Critical Waterways in Water Network Areas from a Community Detection Perspective


Abstract
1. Introduction
2. Data
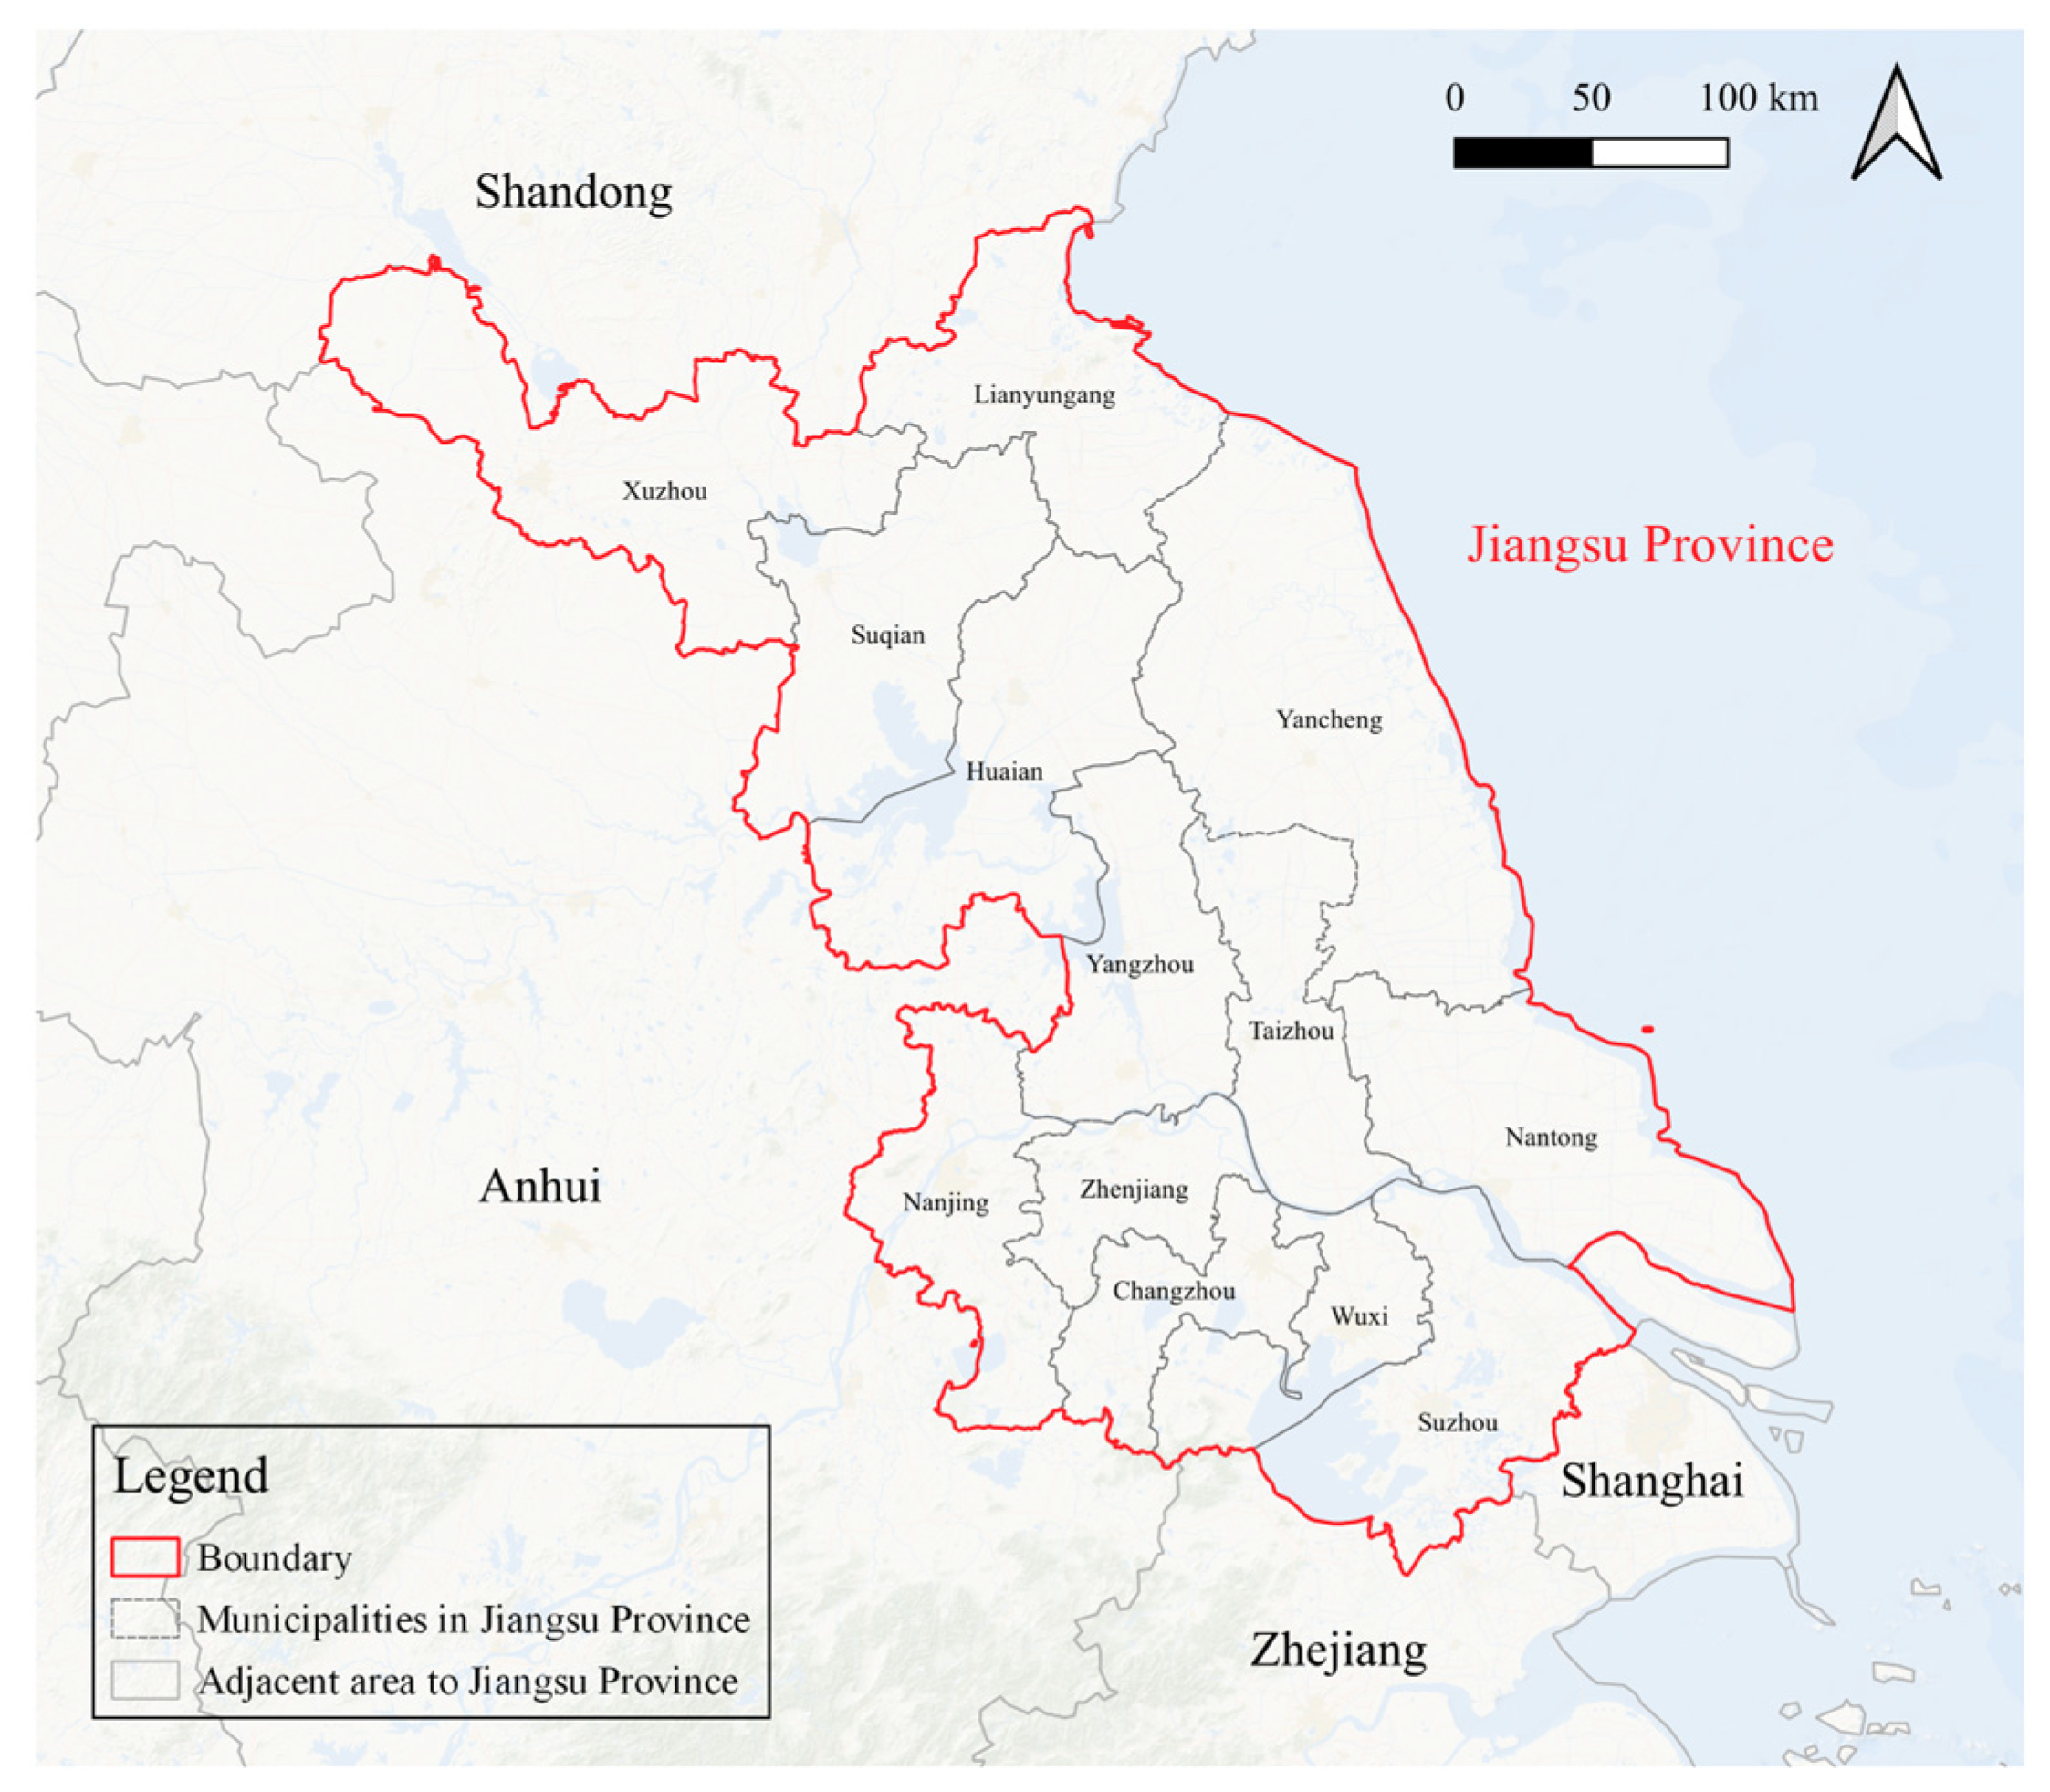
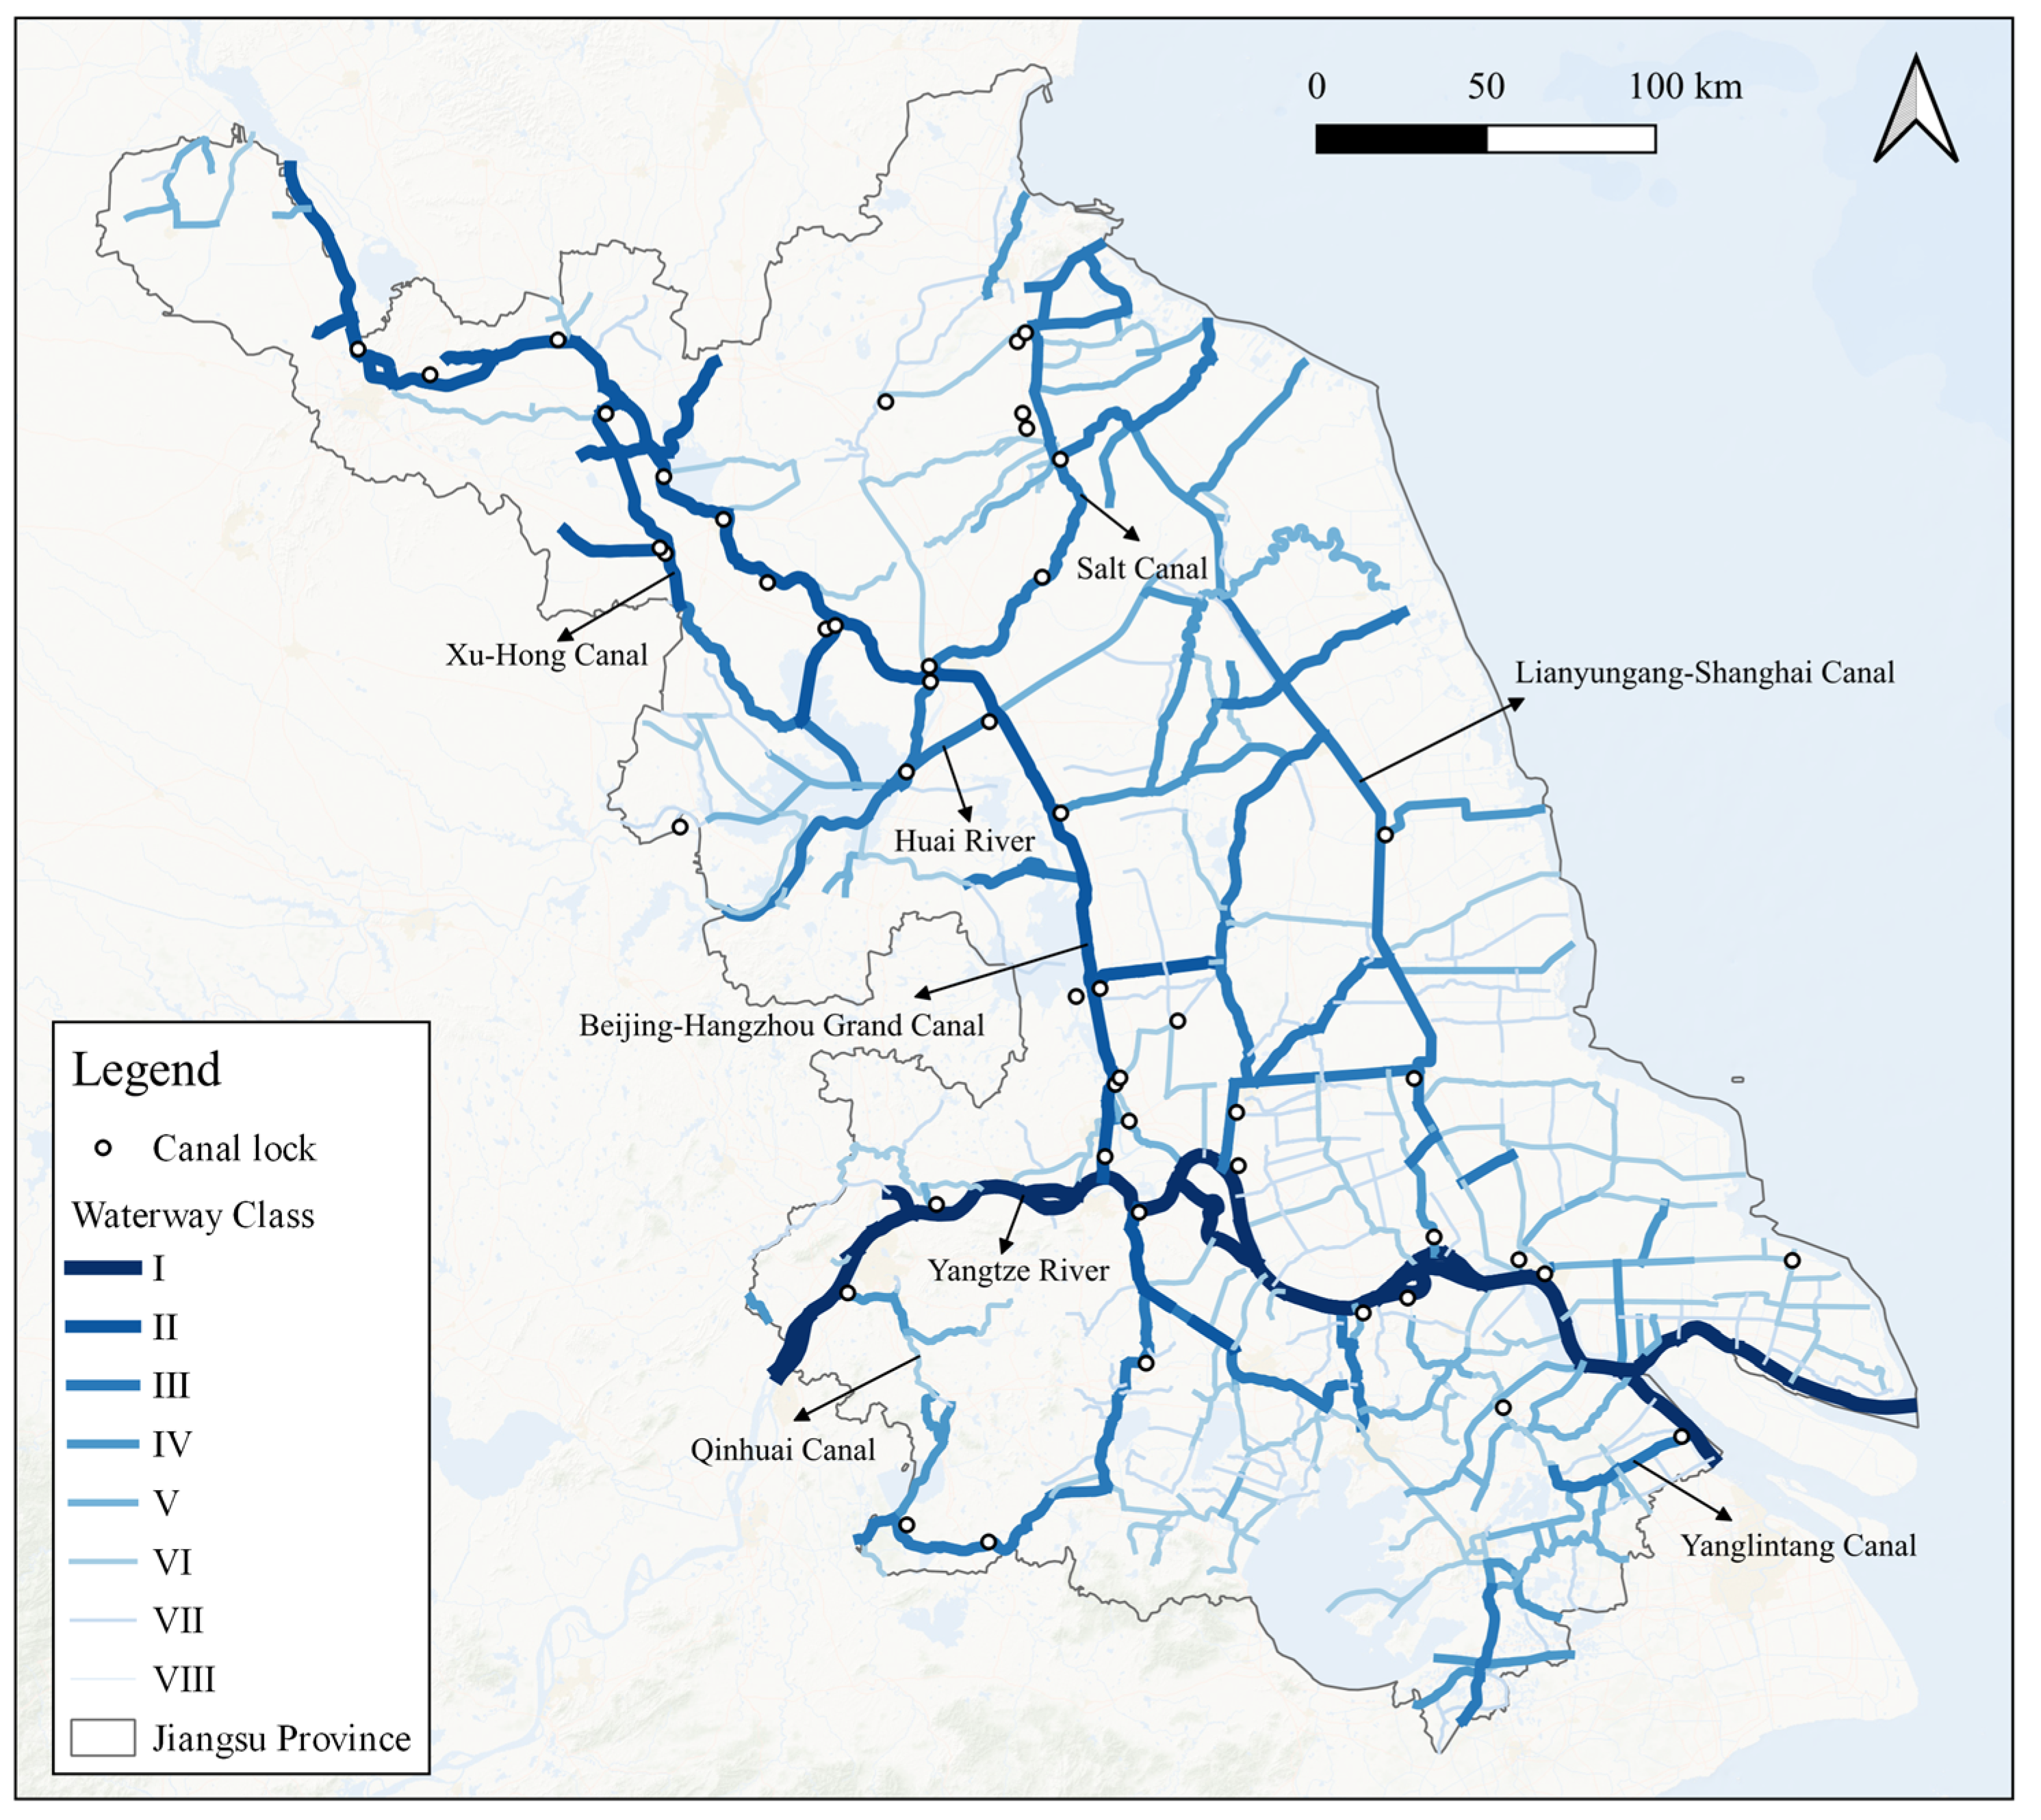
2.1. Data Sources
2.2. Data Processing
- Data Cleaning: Data beyond the geographical boundaries of Jiangsu Province were removed, and threshold filtering was applied to abnormal navigation parameters, including the removal of data records with abnormal speeds, unreasonable heading changes, and invalid MMSI [32];
- Spatial Matching: Vessel trajectories were geospatially joined with waterways using Python’s Geopandas library (v0.12.2), establishing spatial topology relationships between navigation paths and waterway networks;
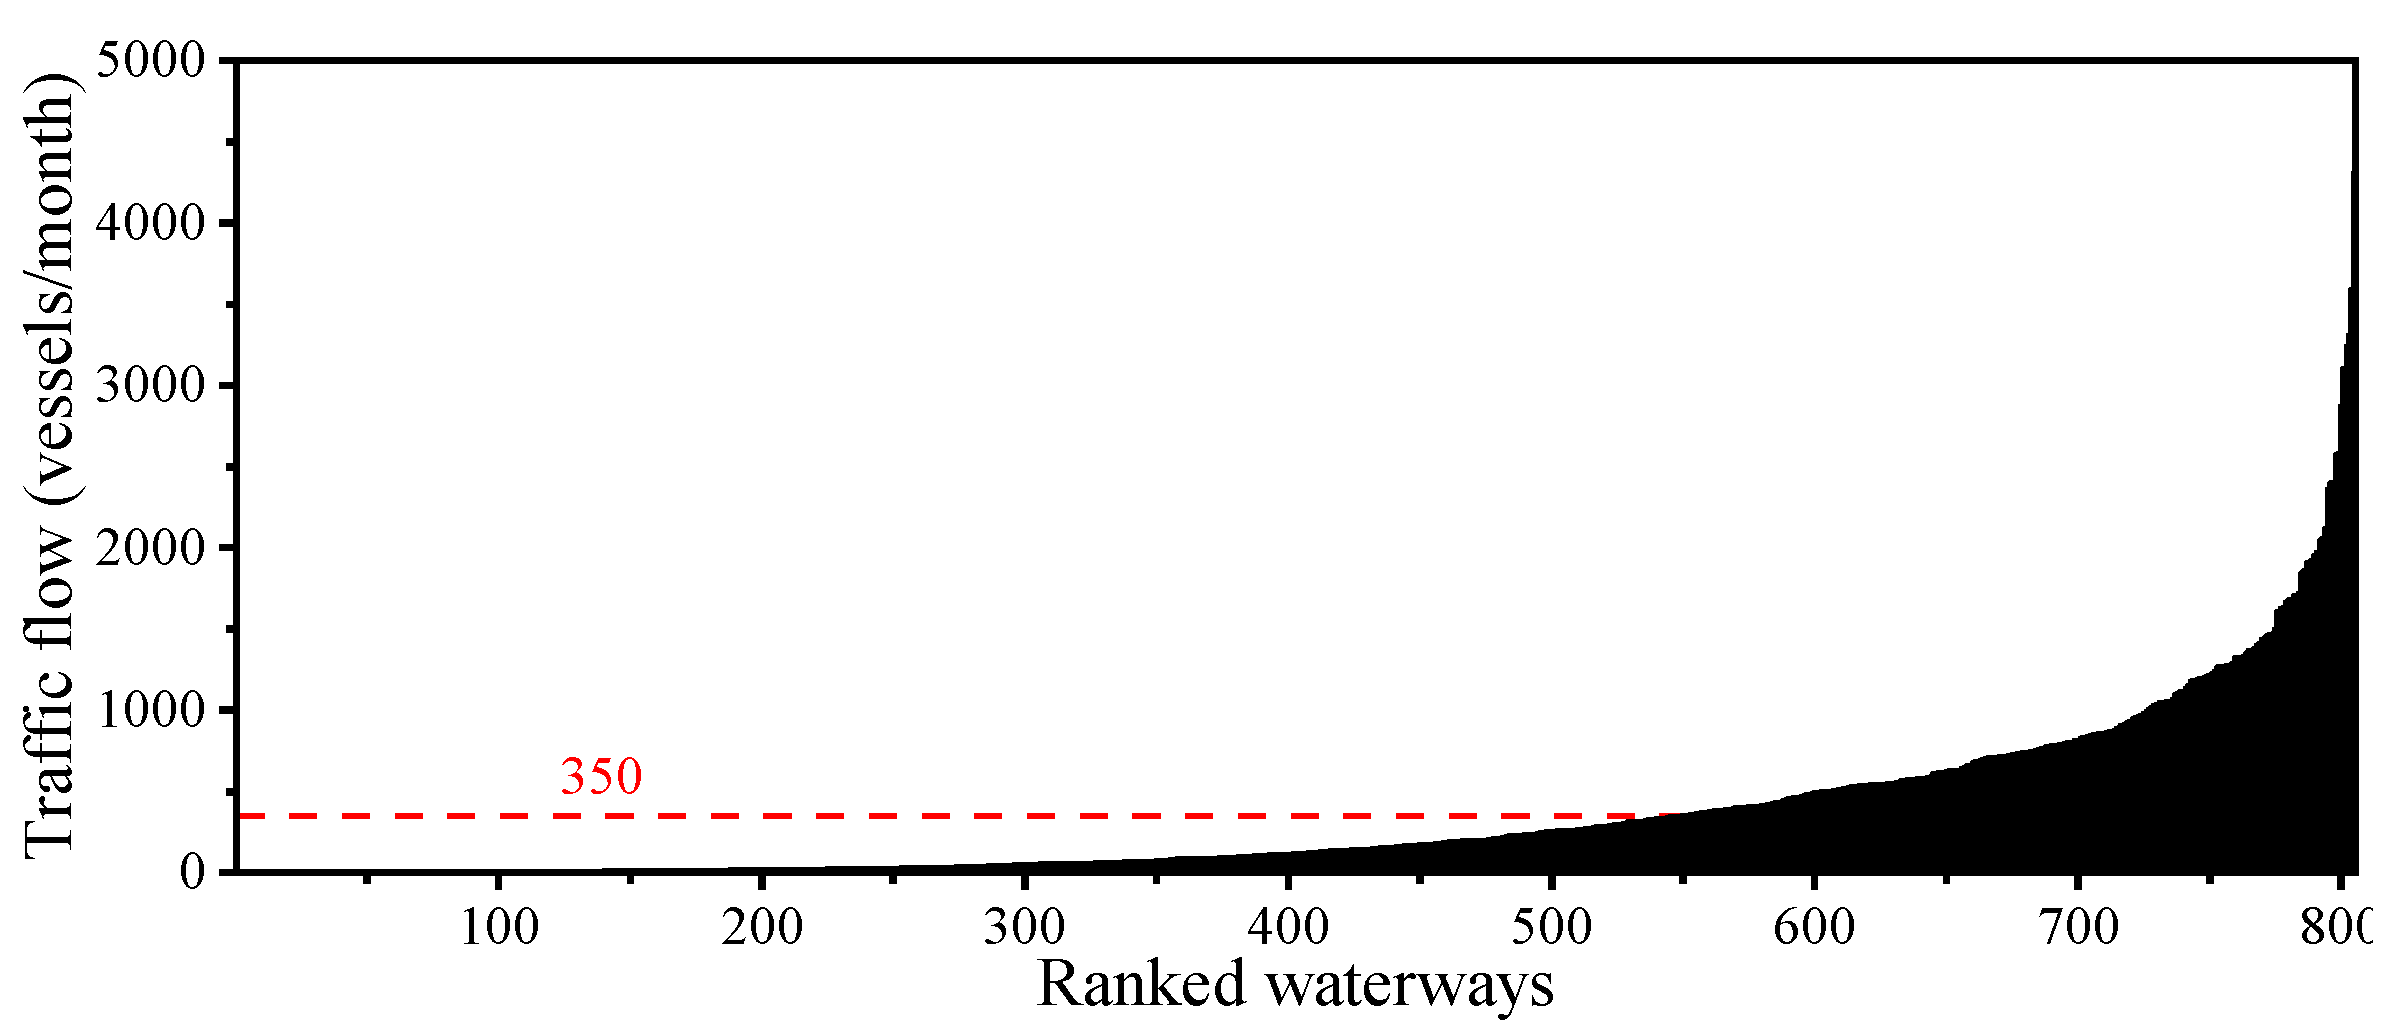
- Traffic Quantification: Unique MMSI counts per waterway were calculated as vessel traffic indicators. The waterway traffic flow distribution map was generated in ascending order, as shown in Figure 4. The analysis reveals pronounced heterogeneous traffic patterns across Jiangsu’s inland waterway network: approximately 68% of waterways exhibited monthly traffic volumes below the network-wide mean (350 vessels), while maximum traffic intensity reached 4304 vessels.
3. Methods
3.1. Construction of Weighted Topology Network
3.2. Community Detection Based on Leiden Algorithm
- Local Node Movement: Optimize community assignments by calculating modularity gain, relocating nodes to neighboring communities;
- Partition Refinement: Optimize preliminary community structures through hierarchical subdivision of established communities into sub-communities while eliminating suboptimal interconnections;
- Network Aggregation: Abstract communities into super nodes, constructing a higher-level network topology based on inter-community connection weights.
3.3. Critical Waterway Identification Based on Community Bridge
3.4. Verification of Recognition Effectiveness Based on Attack Simulation
- Random Attack: Simulates random disruptions (e.g., natural disasters, vessel accidents), with results averaged over 100 independent trials;
- Edge Betweenness Attack: Prioritizes removal of waterways with the highest edge betweenness centrality;
- Community Bridge Attack: Targets inter-community critical waterways identified by the proposed CB metric.
4. Results
4.1. Regional Waterway Network Detection
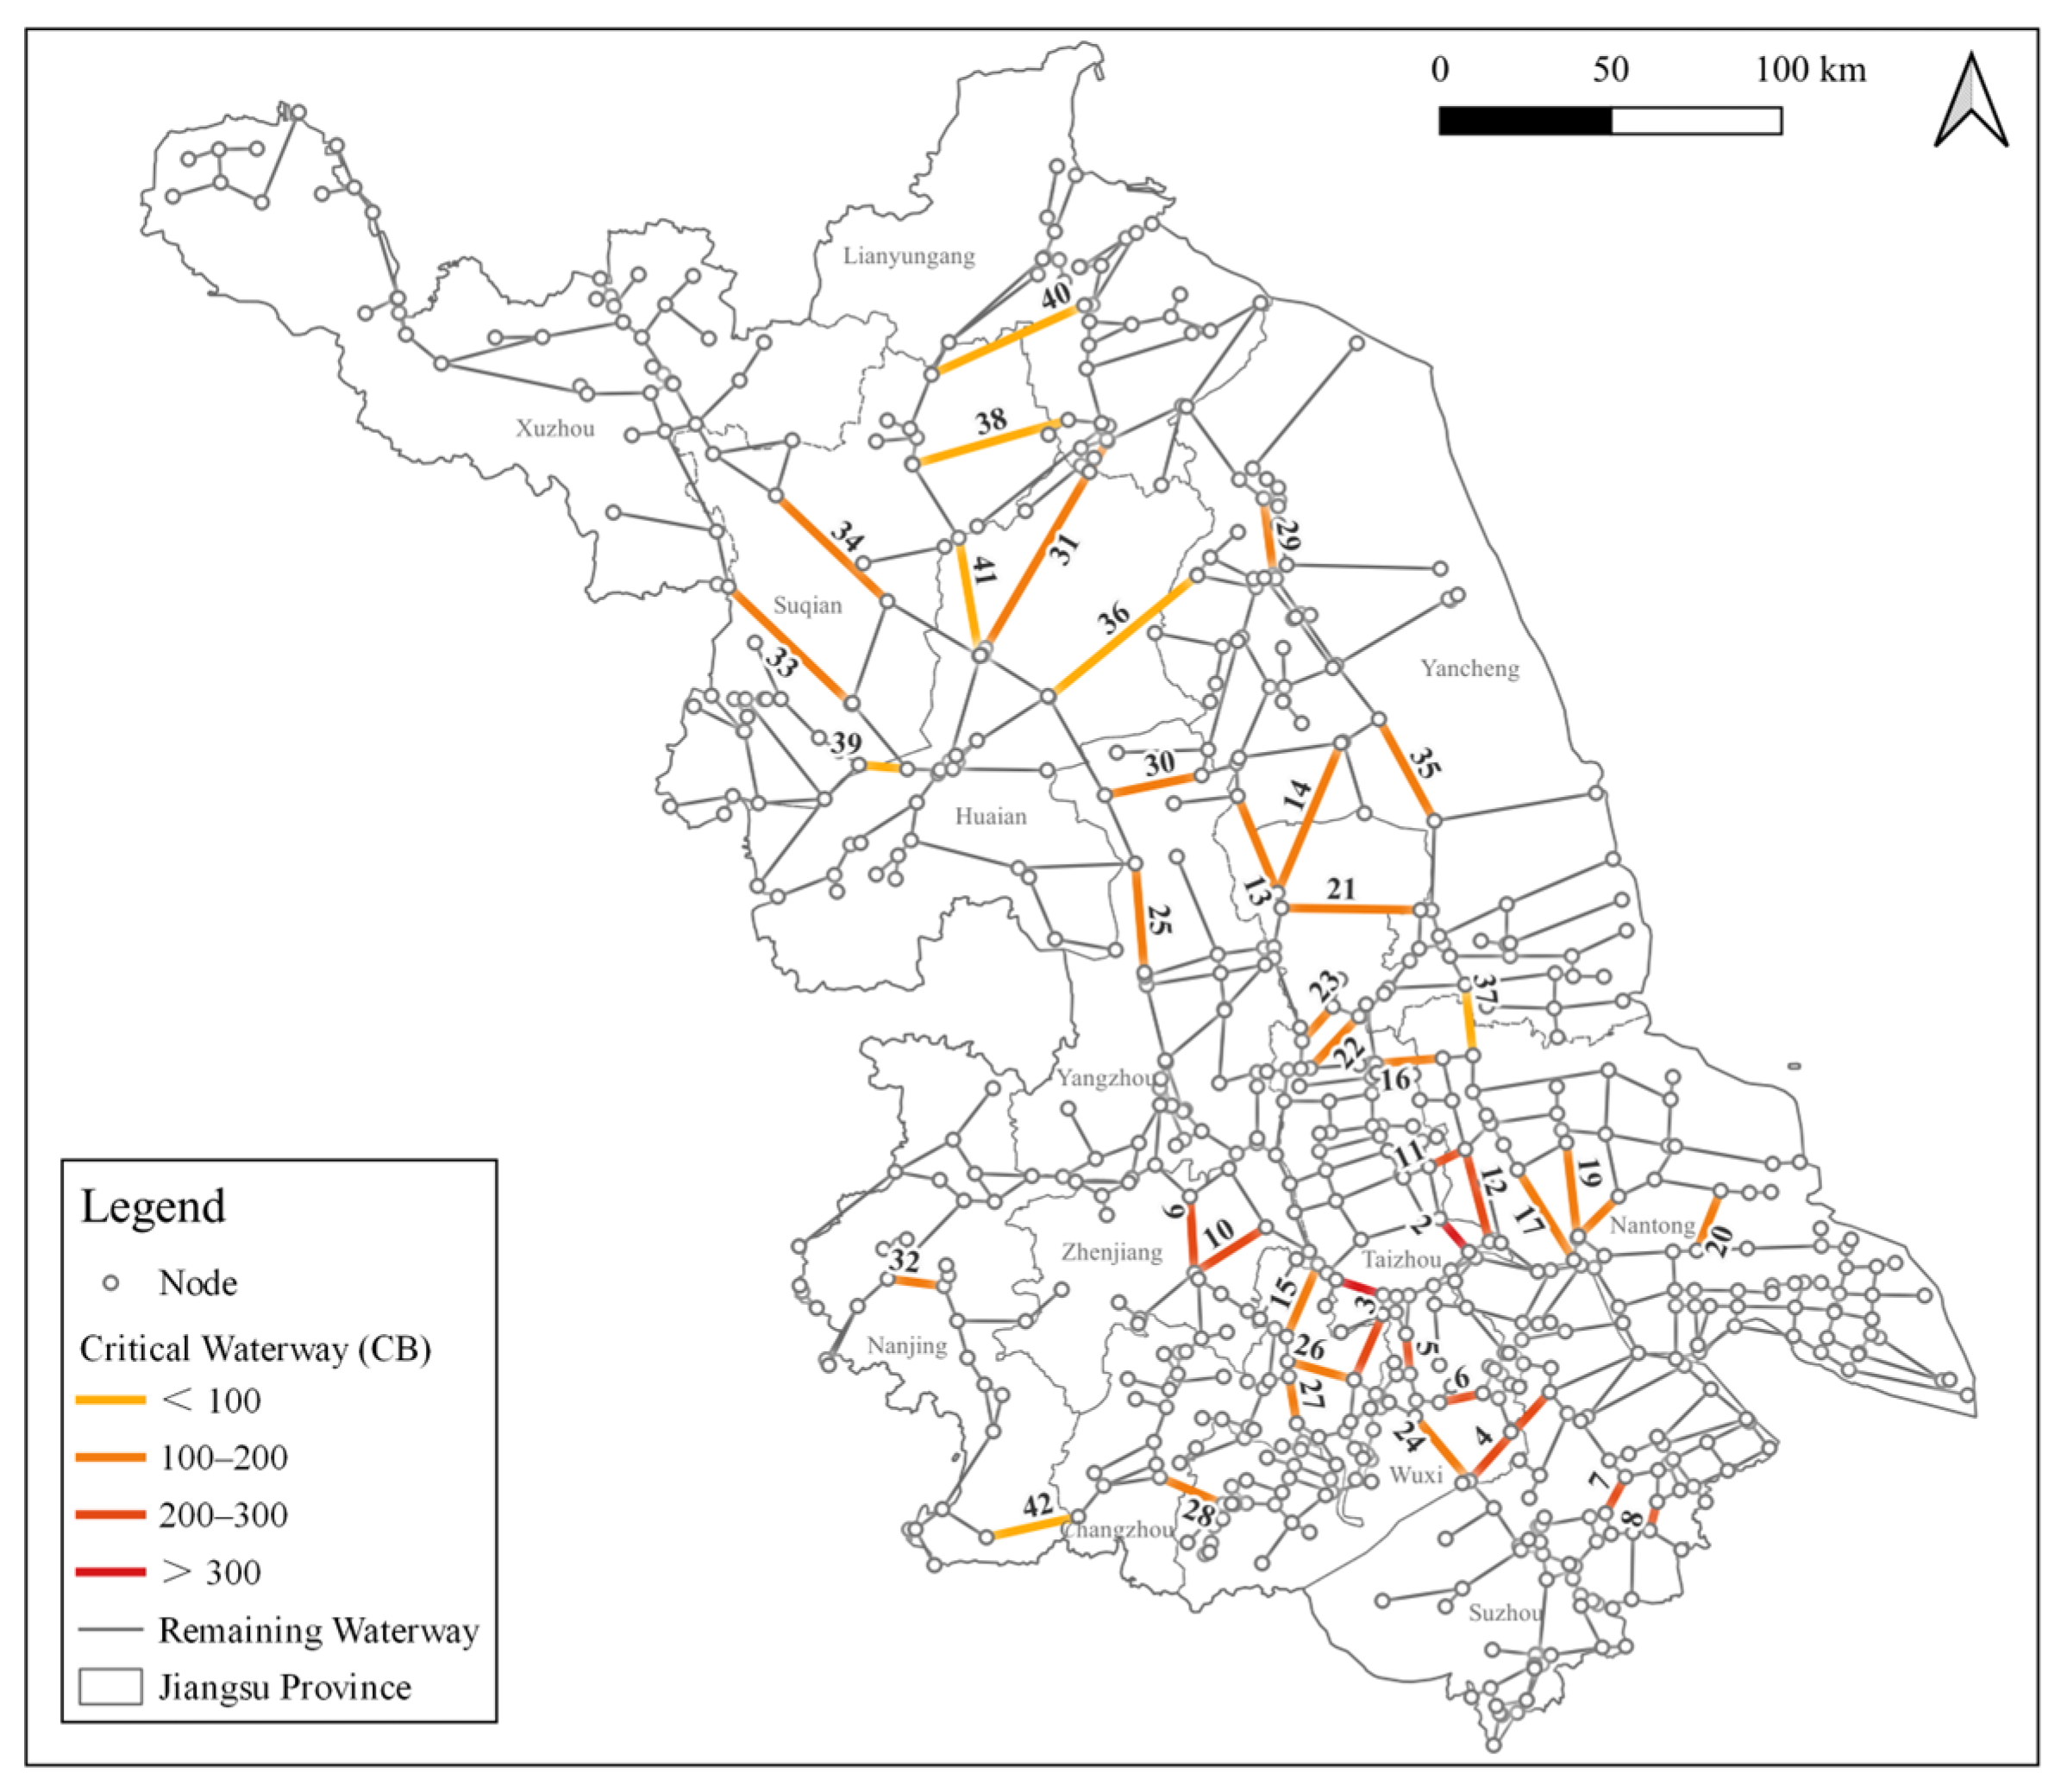
4.2. Critical Waterway Identification
4.3. Identification Effectiveness Verification
5. Discussion
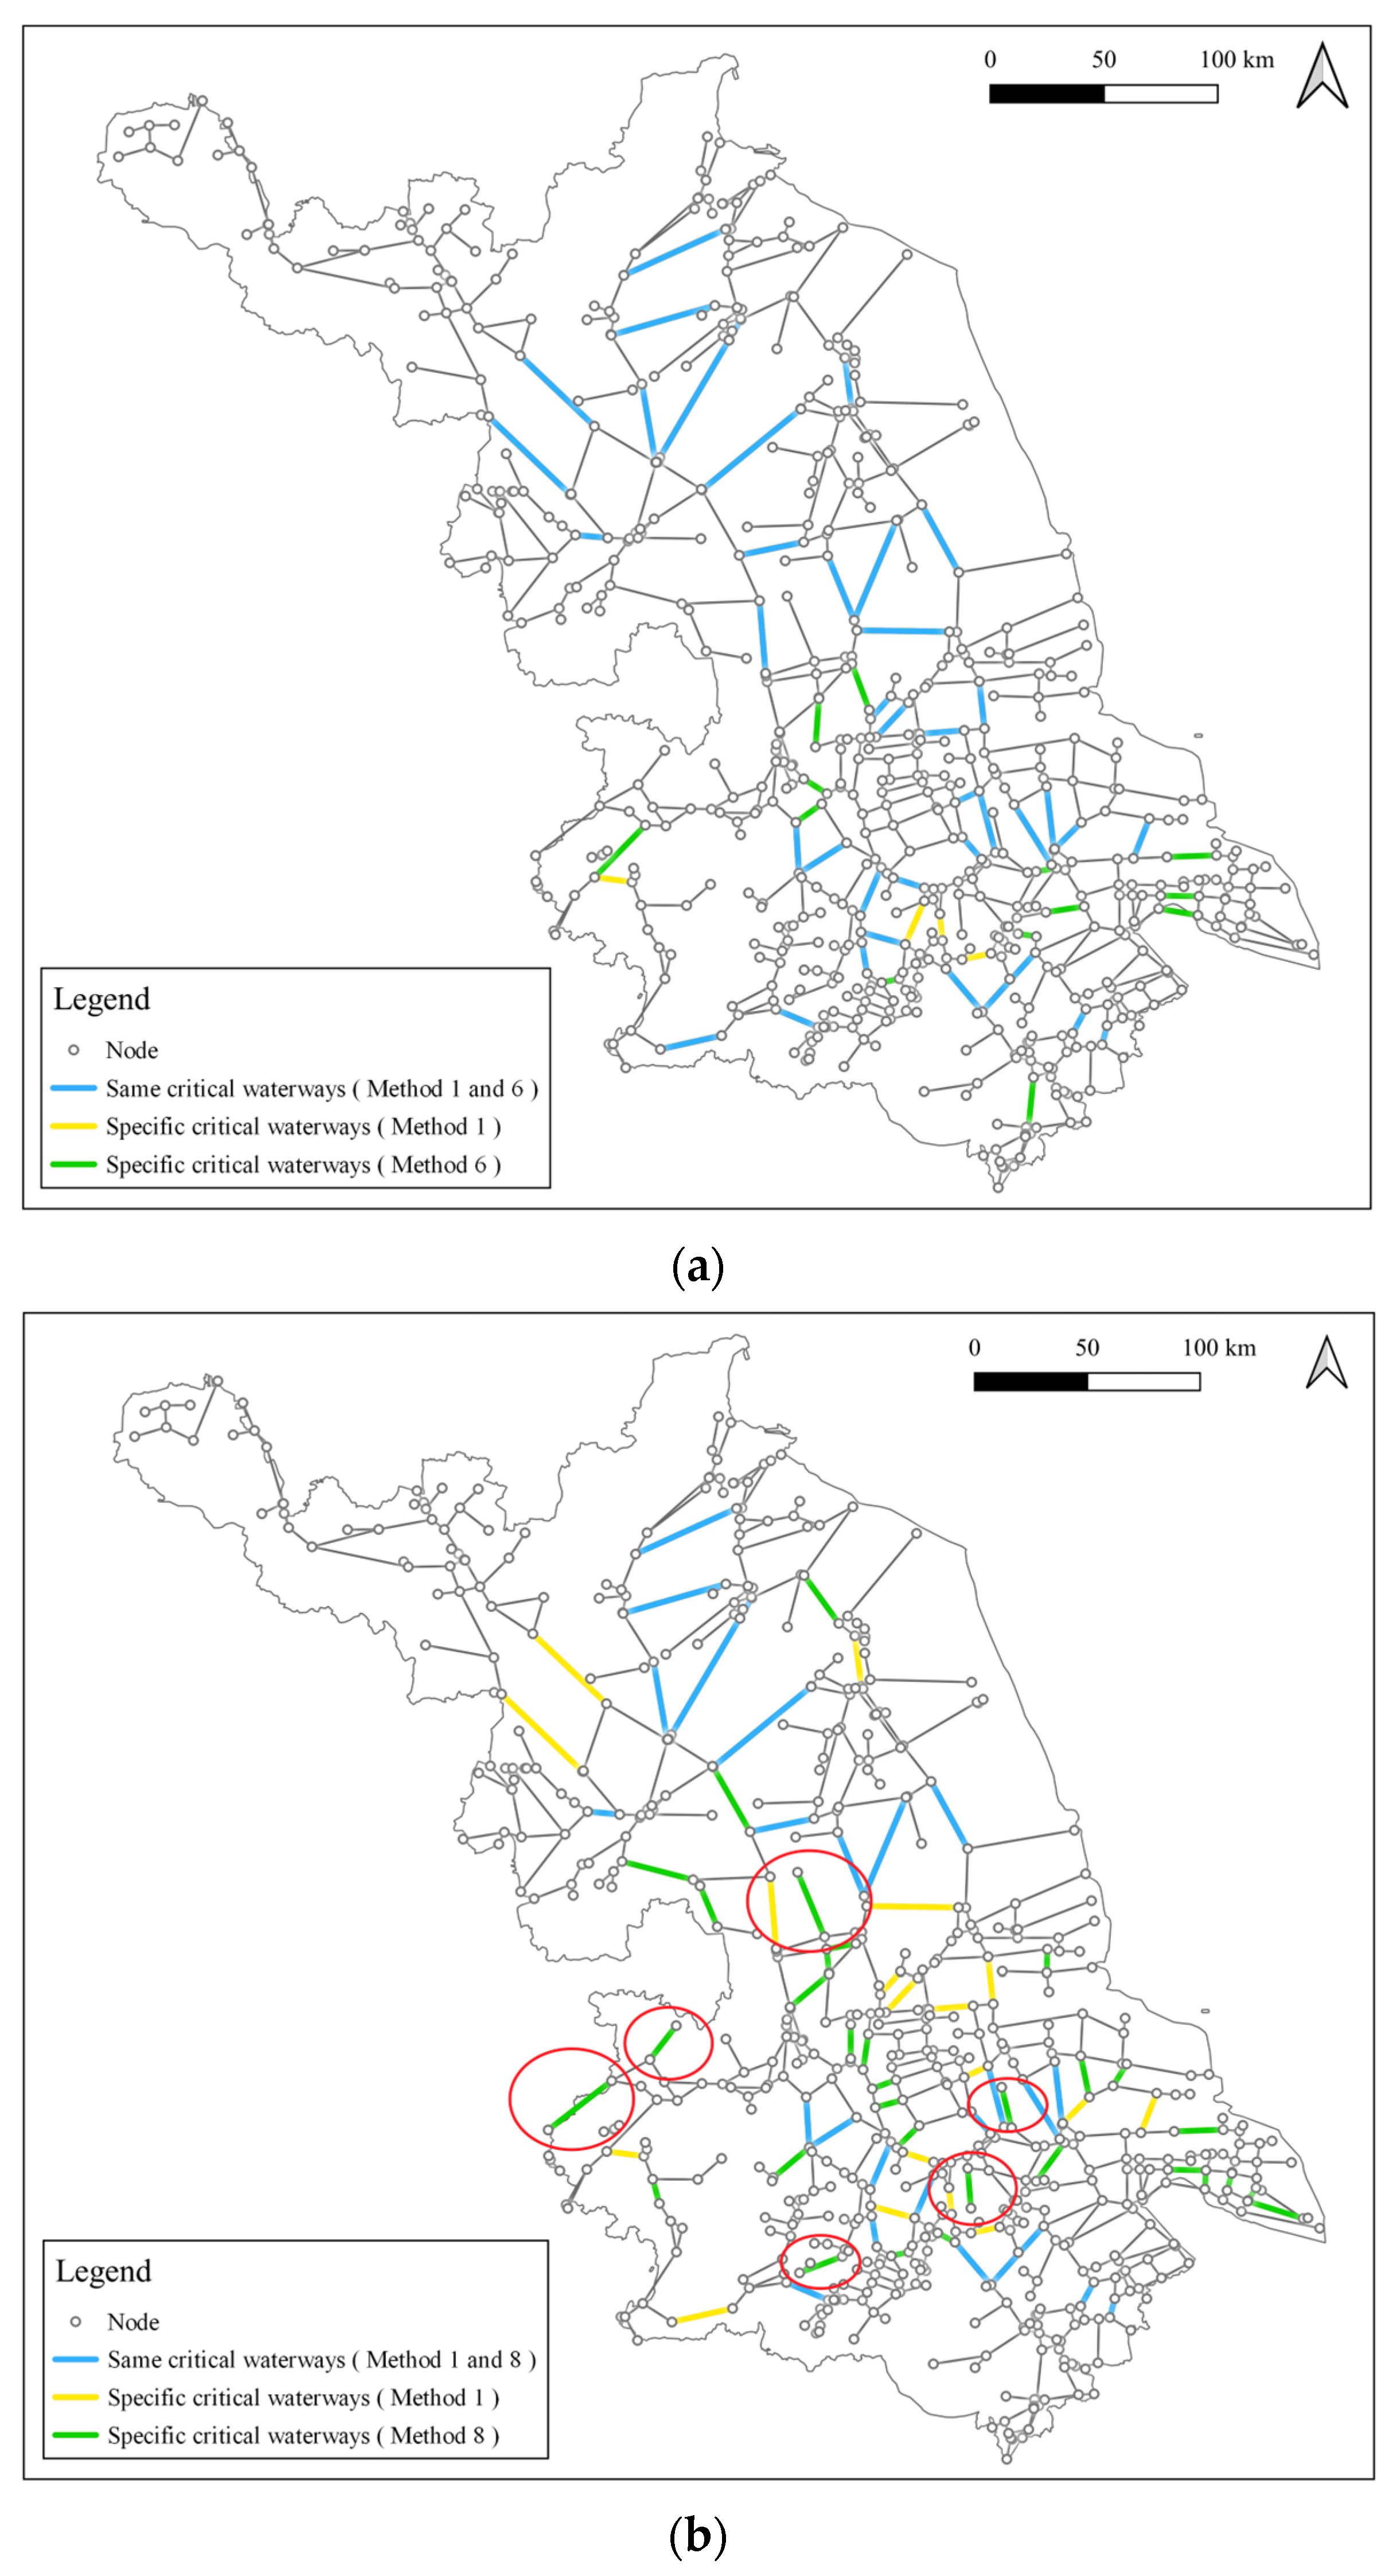
5.1. Impact Analysis of Waterway Class Assignment Methods
5.2. Policy Recommendations Based on Waterway Traffic Analysis
6. Conclusions
Author Contributions
Funding
Data Availability Statement
Acknowledgments
Conflicts of Interest
Abbreviations
| GIS | Geographic Information System |
| AIS | Automatic Identification System |
| MMSI | Maritime Mobile Service Identity |
References
- Wang, H.; Liu, Y.; Jin, Y.; Wang, S. Optimal Sailing Speeds and Time Windows in Inland Water Transportation Operations Management: Mathematical Models and Applications. Mathematics 2023, 11, 4747. [Google Scholar] [CrossRef]
- Krapesch, M.; Klösch, M.; Brinke, W.T.; Habersack, H. The Rhine Catchment: A Review of Sediment-Related Knowledge, Monitoring, and a Future Research Perspective. Water 2024, 16, 1121. [Google Scholar] [CrossRef]
- Yang, Y.; Liu, W. Resilience Analysis of Maritime Silk Road Shipping Network Structure under Disruption Simulation. J. Mar. Sci. Eng. 2022, 10, 617. [Google Scholar] [CrossRef]
- Wan, Z.; Su, Y.; Li, Z.; Zhang, X.; Zhang, Q.; Chen, J. Analysis of the Impact of Suez Canal Blockage on the Global Shipping Network. Ocean Coast. Manag. 2023, 245, 106868. [Google Scholar] [CrossRef]
- Zhang, M.; Huang, T.; Guo, Z.; He, Z. Complex-Network-Based Traffic Network Analysis and Dynamics: A Comprehensive Review. Phys. A 2022, 607, 128063. [Google Scholar] [CrossRef]
- Yin, K.; Wu, J.; Wang, W.; Lee, D.H.; Wei, Y. An Integrated Resilience Assessment Model of Urban Transportation Network: A Case Study of 40 Cities in China. Transp. Res. Part A Policy Pract. 2023, 173, 103687. [Google Scholar] [CrossRef]
- Saadat, Y.; Ayyub, B.M.; Zhang, Y.; Zhang, D.; Huang, H. Resilience of Metrorail Networks: Quantification With Washington, DC as a Case Study. ASCE-ASME J. Risk Uncertain. Eng. Syst. Part B Mech. Eng. 2019, 5, 041011. [Google Scholar] [CrossRef]
- Martín, B.; Ortega, E.; Cuevas-Wizner, R.; Ledda, A.; Montis, A.D. Assessing Road Network Resilience: An Accessibility Comparative Analysis. Transp. Res. Part D Transp. Environ. 2021, 95, 102851. [Google Scholar] [CrossRef]
- Bešinović, N.; Nassar, R.F.; Szymula, C. Resilience Assessment of Railway Networks: Combining Infrastructure Restoration and Transport Management. Reliab. Eng. Syst. Saf. 2022, 224, 108538. [Google Scholar] [CrossRef]
- Wei, J.; Kan, Z.; Kwan, M.-P.; Liu, D.; Su, L.; Chen, Y. Uncovering Travel Communities among Older and Younger Adults Using Smart Card Data. Appl. Geogr. 2024, 173, 103453. [Google Scholar] [CrossRef]
- Mou, N.; Sun, S.; Yang, T.; Wang, Z.; Zheng, Y.; Chen, J.; Zhang, L. Assessment of the Resilience of a Complex Network for Crude Oil Transportation on the Maritime Silk Road. IEEE Access 2020, 8, 181311–181325. [Google Scholar] [CrossRef]
- Saito, T.; Shibasaki, R.; Murakami, S.; Tsubota, K.; Matsuda, T. Global Maritime Container Shipping Networks 1969–1981: Emergence of Container Shipping and Reopening of the Suez Canal. J. Mar. Sci. Eng. 2022, 10, 602. [Google Scholar] [CrossRef]
- Wang, N.; Yuen, K.F. Resilience Assessment of Waterway Transportation Systems: Combining System Performance and Recovery Cost. Reliab. Eng. Syst. Saf. 2022, 226, 108673. [Google Scholar] [CrossRef]
- He, Y.; Yang, Y.; Wang, M.; Zhang, X. Resilience Analysis of Container Port Shipping Network Structure: The Case of China. Sustainability 2022, 14, 9489. [Google Scholar] [CrossRef]
- Wan, C.; Tao, J.; Yang, Z.; Zhang, D. Evaluating Recovery Strategies for the Disruptions in Liner Shipping Networks: A Resilience Approach. Int. J. Logist. Manag. 2022, 33, 389–409. [Google Scholar] [CrossRef]
- Qin, Y.; Guo, J.; Liang, M.; Feng, T. Resilience Characteristics of Port Nodes from the Perspective of Shipping Network: Empirical Evidence from China. Ocean Coast. Manag. 2023, 237, 106531. [Google Scholar] [CrossRef]
- Liu, Q.; Yang, Y.; Ng, A.K.Y.; Jiang, C. An Analysis on the Resilience of the European Port Network. Transp. Res. Part A Policy Pract. 2023, 175, 103778. [Google Scholar] [CrossRef]
- Wu, J.; Lu, J.; Zhang, L.; Fan, H. Spatial Heterogeneity among Different-Sized Port Communities in Directed-Weighted Global Liner Shipping Network. J. Transp. Geogr. 2024, 114, 103781. [Google Scholar] [CrossRef]
- Baroud, H.; Barker, K.; Ramirez-Marquez, J.E.; Rocco S, C.M. Importance Measures for Inland Waterway Network Resilience. Transp. Res. Part E Logist. Transp. Rev. 2014, 62, 55–67. [Google Scholar] [CrossRef]
- Hosseini, S.; Barker, K. Modeling Infrastructure Resilience Using Bayesian Networks: A Case Study of Inland Waterway Ports. Comput. Ind. Eng. 2016, 93, 252–266. [Google Scholar] [CrossRef]
- Akkermann, J.; Weiler, S. Vulnerabilität von Verkehrswasserbauwerken. Bautechnik 2020, 97, 377–386. [Google Scholar] [CrossRef]
- Han, D.; Sui, Z.; Xiao, C.; Wen, Y. Reliability of Inland Water Transportation Complex Network Based on Percolation Theory: An Empirical Analysis in the Yangtze River. J. Mar. Sci. Eng. 2024, 12, 2361. [Google Scholar] [CrossRef]
- Lou, N.; Huang, C.; Chen, Y.; Luan, Y.; Yuan, J. Network Characteristics and Robustness Analysis of High Level Waterway Network in the Yangtze River Delta. J. Dalian Marit. Univ. 2021, 47, 28–36. [Google Scholar] [CrossRef]
- Wu, A.K.; Tian, L.; Liu, Y.Y. Bridges in Complex Networks. Phys. Rev. E 2018, 97, 012307. [Google Scholar] [CrossRef] [PubMed]
- Girvan, M.; Newman, M.E.J. Community Structure in Social and Biological Networks. Proc. Natl. Acad. Sci. USA. 2002, 99, 7821–7826. [Google Scholar] [CrossRef]
- Zhang, H.; Wang, J.; Shi, B.; Lu, X.; Jia, J. Exploring Significant Edges of Public Transport Network under Targeted Attacks. Mod. Phys. Lett. B 2019, 33, 1950114. [Google Scholar] [CrossRef]
- Yu, E.Y.; Chen, D.B.; Zhao, J.Y. Identifying Critical Edges in Complex Networks. Sci. Rep. 2018, 8, 14469. [Google Scholar] [CrossRef]
- Wang, Y.; Hua, M.; Chen, X.; Chen, W. Sustainable Response Strategy for COVID-19: Pandemic Zoning with Urban Multimodal Transport Data. J. Transp. Geogr. 2023, 110, 103605. [Google Scholar] [CrossRef]
- Ge, J.; Wang, X.; Wan, Z.; Huang, T. Community Structure of World Container Shipping Network. J. Transp. Syst. Eng. Inf. Technol. 2019, 19, 231–236. [Google Scholar] [CrossRef]
- Jiangsu Province Statistical Yearbook. 2023. Available online: https://tj.jiangsu.gov.cn/2023/index.htm (accessed on 11 December 2023).
- GB 50139-2014; The Inland Waterway Navigation Standards. Ministry of Housing and Urban-Rural Development of the People’s Republic of China: Beijing, China, 2014. Available online: https://www.bzsb.info/public/articleHtml/GB_740_1_view.html (accessed on 11 April 2014).
- Cui, Y.; Chen, Y.; Chen, Y.; Cai, X.; Yin, C.; Cheng, Y. Spatial-Temporal Quantification of Yangtze River Traffic Flow Using AIS Data. Ocean Eng. 2025, 318, 120144. [Google Scholar] [CrossRef]
- Huang, C.; Hu, S.; Kong, F.; Xuan, S. Vulnerability Analysis of Inland Waterways Network Base on Complex Network Theory. Int. J. Comput. Appl. 2020, 42, 67–75. [Google Scholar] [CrossRef]
- Dráždilová, P.; Prokop, P.; Platoš, J.; Snášel, V. A Hierarchical Overlapping Community Detection Method Based on Closed Trail Distance and Maximal Cliques. Inf. Sci. 2024, 662, 120271. [Google Scholar] [CrossRef]
- Xiao, J.; Zou, Y.C.; Xu, X.K. A Metaheuristic-Based Modularity Optimization Algorithm Driven by Edge Directionality for Directed Networks. IEEE Trans. Netw. Sci. Eng. 2023, 10, 3804–3817. [Google Scholar] [CrossRef]
- Hu, F.; Liu, J.; Li, L.; Liang, J. Community Detection in Complex Networks Using Node2vec with Spectral Clustering. Phys. A 2020, 545, 123633. [Google Scholar] [CrossRef]
- Luo, X.; Liu, Z.; Jin, L.; Zhou, Y.; Zhou, M. Symmetric Nonnegative Matrix Factorization-Based Community Detection Models and Their Convergence Analysis. IEEE Trans. Neural Netw. Learn. Syst. 2022, 33, 1203–1215. [Google Scholar] [CrossRef]
- Jin, D.; Yu, Z.; Jiao, P.; Pan, S.; He, D.; Wu, J.; Yu, P.; Zhang, W. A Survey of Community Detection Approaches: From Statistical Modeling to Deep Learning. IEEE Trans. Knowl. Data Eng. 2021, 35, 1149–1170. [Google Scholar] [CrossRef]
- Newman, M.E.J.; Girvan, M. Finding and Evaluating Community Structure in Networks. Phys. Rev. E 2004, 69, 026113. [Google Scholar] [CrossRef]
- Traag, V.A.; Waltman, L.; Van Eck, N.J. From Louvain to Leiden: Guaranteeing Well-Connected Communities. Sci. Rep. 2019, 9, 5233. [Google Scholar] [CrossRef] [PubMed]
- Blondel, V.D.; Guillaume, J.L.; Lambiotte, R.; Lefebvre, E. Fast Unfolding of Communities in Large Networks. J. Stat. Mech. Theory Exp. 2008, 2008, P10008. [Google Scholar] [CrossRef]
- Hairol Anuar, S.H.; Abal Abas, Z.; Md Yunos, N.; Mukhtar, M.F.; Setiadi, T.; Shibghatullah, A.S. Identifying Communities with Modularity Metric Using Louvain and Leiden Algorithms. Pertanika J. Sci. Technol. 2024, 32, 1285–1300. [Google Scholar] [CrossRef]
- Wibisono, S.; Manongga, D.; Sembiring, I. Hendry Comparative Analysis of Louvain, Leiden, and Walktrap Algorithms for Community Detection in the Network of Indonesian Laws. In Proceedings of the 2024 IEEE 10th Information Technology International Seminar (ITIS), Surabaya, Indonesia, 6–8 November 2024; pp. 232–239. [Google Scholar]
- Du, Z.; Tang, J.; Qi, Y.; Wang, Y.; Han, C.; Yang, Y. Identifying Critical Nodes in Metro Network Considering Topological Potential: A Case Study in Shenzhen City—China. Phys. A 2020, 539, 122926. [Google Scholar] [CrossRef]
- Newman, M.E.J. Modularity and Community Structure in Networks. Proc. Natl. Acad. Sci. USA. 2006, 103, 8577–8582. [Google Scholar] [CrossRef] [PubMed]
- Approval of the Provincial Government on the Planning of Trunk Waterway Network in Jiangsu Province (2023–2035). Available online: https://www.jiangsu.gov.cn/art/2023/12/25/art_46143_11108998.html (accessed on 15 December 2023).


| Waterway Name | Source | Target | Class | Design Vessel Load (ton) | Design Water Depth (m) | Length (km) |
|---|---|---|---|---|---|---|
| Section 1, Yangtze River | 121.59, 31.74 | 121.95, 31.67 | I | 3000 | 3.5–4.0 | 35.74 |
| Gaoyou Section, Beijing-Hangzhou Grand Canal | 118.31, 33.98 | 118.65, 33.71 | II | 2000 | 2.6–3.0 | 52.68 |
| Lianshui Section, Salt Canal | 119.32, 34.12 | 118.95, 33.60 | III | 1000 | 2.0–2.4 | 89.57 |
| Wuzhong Section, Sushen Outer Port Canal | 120.73, 31.23 | 120.65, 31.26 | IV | 500 | 1.6–1.9 | 9.00 |
| Chongchuan Section, Tongzhou Bay Port Access | 120.76, 32.09 | 120.88, 32.19 | V | 300 | 1.3–1.6 | 16.80 |
| Tongzhou Section, Tongyang Canal | 120.76, 32.08 | 120.72, 32.33 | VI | 100 | 1.0–1.2 | 28.51 |
| Donghai County Section, Huashu New River | 118.83, 34.37 | 118.78, 34.29 | VII | 50 | 0.7–0.9 | 10.35 |
| Yuanjiaqiao Section, Yangtze River | 120.42, 31.90 | 120.38, 31.97 | VIII * | <50 | <0.7 | 9.15 |
| MMSI | Speed (knots/h) | Heading | Longitude | Latitude | Create Time |
|---|---|---|---|---|---|
| 413793342 | 5.2 | 101 | 120.2052 | 31.64514 | 2022/7/2 0:09 |
| 413791877 | 5.6 | 511 | 119.8354 | 32.30228 | 2022/7/2 0:24 |
| 413993278 | 4.5 | 310 | 119.8468 | 32.29357 | 2022/7/2 1:36 |
| 413832505 | 3.8 | 303 | 120.2407 | 31.63442 | 2022/7/2 1:54 |
| 413772333 | 4.5 | 352 | 119.9042 | 32.55611 | 2022/7/2 2:14 |
| 413809635 | 3.7 | 304 | 120.2415 | 31.63395 | 2022/7/2 2:25 |
| 413303620 | 6.6 | 305 | 120.8103 | 32.00513 | 2022/7/2 2:38 |
| 413984853 | 4.6 | 295 | 119.5679 | 32.19297 | 2022/7/2 3:21 |
| 413793059 | 6.9 | 109 | 118.6826 | 33.19103 | 2022/7/2 4:49 |
| No. | Waterway Name | Class | Length (km) | CB | Traffic Flow (Vessels/Month) |
|---|---|---|---|---|---|
| 1 | Section 2, Yangtze River | I | 14.21 | 327.51 | 1370 |
| 2 | Jingjiang Section, Xiashi Port | VI | 14.91 | 327.51 | 1004 |
| 3 | Changzhou Section, Sanshan Port | VII | 23.29 | 279.07 | 686 |
| 4 | Xiangcheng Section, Wangyu River | V | 40.45 | 271.35 | 679 |
| 5 | Jiangyin Section, Xicheng Canal | III | 12.14 | 241.68 | 1181 |
| 6 | Xishan Section, Xishiyiwei Canal | V | 14.80 | 241.68 | 1188 |
| 7 | Kunshan Section, Suliu Canal | V | 19.97 | 235.00 | 932 |
| 8 | Kunshan Section, Shenzhang Canal | V | 10.02 | 235.00 | 503 |
| 9 | Jiangdu Section, Beijing-Hangzhou Grand Canal | II | 23.45 | 222.92 | 3109 |
| 10 | Danyang Section, Jiuqu River | VI | 27.84 | 222.92 | 1056 |
| 11 | Taixing Section, Rutai Canal | VII | 11.72 | 216.48 | 23 |
| 12 | Rugao Section, Lianyungang-Shanghai Canal | IV | 29.50 | 202.64 | 3246 |
| 13 | Xinghua Section, Jiankou Canal | VI | 31.47 | 199.99 | 687 |
| 14 | Jianhu Section 1, Sheyang Port Access Channel | III | 50.24 | 199.99 | 775 |
| 15 | Changzhou Section, Desheng River | VI | 23.80 | 193.05 | 1271 |
| 16 | Tongyang Canal | III | 19.29 | 187.48 | 314 |
| 17 | Rugao Section, Ruhai River | VI | 33.66 | 175.49 | 713 |
| 18 | Chongchuan Section, Tongzhou Bay Port Access Channel | V | 16.80 | 175.49 | 816 |
| 19 | Tongzhou Section, Tongyang Canal | VI | 28.51 | 175.49 | 359 |
| 20 | Tongzhou Section, Tongyang Canal | IV | 19.27 | 175.49 | 3 |
| 21 | Xinghua Section, Xingdong Canal | VI | 41.03 | 173.20 | 1353 |
| 22 | Jiangyan Section, Taidong Canal | III | 20.88 | 173.20 | 1706 |
| 23 | Biancheng-Dongjiatan, Tangda Canal | VII | 14.79 | 173.20 | 120 |
| 24 | Huqiu Section, Hu-Guang Canal | VI | 25.88 | 160.44 | 4304 |
| 25 | Gaoyou Section 1, Beijing-Hangzhou Grand Canal | II | 32.10 | 149.74 | 2572 |
| 26 | Changzhou Section, Beijing-Hangzhou Grand Canal | III | 21.06 | 142.46 | 1611 |
| 27 | Changzhou Section, Changyi Canal | VI | 13.89 | 142.46 | 535 |
| 28 | Liyang Section 1, Wushen Canal | VI | 22.91 | 142.46 | 1681 |
| 29 | Xiangshui Section, Huai River Outbound Channel | IV | 21.99 | 130.49 | 390 |
| 30 | Jianhu Section, Yanbao Canal | IV | 28.59 | 121.05 | 108 |
| 31 | Lianshui Section, Yanhe River | III | 89.57 | 119.66 | 1637 |
| 32 | Dongshan Wharf-Xiaolongwan, Qinhuai Canal | IV | 17.59 | 116.77 | 171 |
| 33 | Sihong Section, Xu-Hong Canal | III | 57.41 | 115.41 | 44 |
| 34 | Gaoyou Section 2, Beijing-Hangzhou Grand Canal | II | 52.68 | 115.41 | 2059 |
| 35 | Jianhu Section 2, Sheyang Port Access Channel | III | 33.95 | 114.32 | 1139 |
| 36 | Funing Section, Northern Jiangsu Irrigation Main Channel | V | 55.56 | 98.83 | 93 |
| 37 | Dongtai Section, Lianyungang-Shanghai Canal | III | 25.20 | 92.81 | 1291 |
| 38 | Shuyang Section, Chaimi River | VI | 50.11 | 83.46 | 9 |
| 39 | Sihong Section, Lixi River | V | 14.04 | 81.61 | 23 |
| 40 | Shuyang Section, Gupo River | VI | 49.83 | 68.15 | 89 |
| 41 | Huaiyin Section, Huai-Shu-Xin River | VI | 34.65 | 63.21 | 93 |
| 42 | Liyang Section 2, Wushen Canal | III | 33.31 | 49.60 | 540 |
| Assignment Method | Modularity | Number of Communities | Number of Critical Waterways | Number of Critical Waterways Identical to the Baseline Method |
|---|---|---|---|---|
| 1: D = 1, 2, 3, 4, 5, 6, 7, 8 | 0.845 | 19 | 42 | - |
| 2: D = 1, 3, 5, 7, 9, 11, 13, 15 | 0.848 | 20 | 43 | 40 |
| 3: D = 1, 4, 7, 10, 13, 16, 19, 22 | 0.847 | 21 | 44 | 40 |
| 4: D = 2, 4, 6, 8, 10, 12, 14, 16 | 0.859 | 22 | 47 | 42 |
| 5: D = 10, 20, 30, 40, 50, 60, 70, 80 | 0.860 | 21 | 45 | 38 |
| 6: D = 11, 12, 13, 14, 15, 16, 17, 18 | 0.874 | 23 | 51 | 38 |
| 7: D = 5, 8, 11, 14, 17, 22, 28, 38 | 0.869 | 23 | 50 | 38 |
| 8: D = 1, 5, 10, 30, 50, 100, 200, 300 | 0.786 | 26 | 58 | 24 |
| 9: D = 10, 50, 100, 300, 500, 1000, 2000, 3000 | 0.773 | 26 | 54 | 22 |
Disclaimer/Publisher’s Note: The statements, opinions and data contained in all publications are solely those of the individual author(s) and contributor(s) and not of MDPI and/or the editor(s). MDPI and/or the editor(s) disclaim responsibility for any injury to people or property resulting from any ideas, methods, instructions or products referred to in the content. |
© 2025 by the authors. Licensee MDPI, Basel, Switzerland. This article is an open access article distributed under the terms and conditions of the Creative Commons Attribution (CC BY) license (https://creativecommons.org/licenses/by/4.0/).
Share and Cite
Liao, P.; Lu, W.; Yan, M. Identification and Assessment of Critical Waterways in Water Network Areas from a Community Detection Perspective. Water 2025, 17, 1529. https://doi.org/10.3390/w17101529
Liao P, Lu W, Yan M. Identification and Assessment of Critical Waterways in Water Network Areas from a Community Detection Perspective. Water. 2025; 17(10):1529. https://doi.org/10.3390/w17101529
Chicago/Turabian StyleLiao, Peng, Wenya Lu, and Muhua Yan. 2025. "Identification and Assessment of Critical Waterways in Water Network Areas from a Community Detection Perspective" Water 17, no. 10: 1529. https://doi.org/10.3390/w17101529
APA StyleLiao, P., Lu, W., & Yan, M. (2025). Identification and Assessment of Critical Waterways in Water Network Areas from a Community Detection Perspective. Water, 17(10), 1529. https://doi.org/10.3390/w17101529