Article

Linkage Analysis Between Coastline Change and Both Sides of Coastal Ecological Spaces

1
Faculty of Geography, Tianjin Normal University, Tianjin 300387, China
2
College of Artificial Intelligence, North China University of Science and Technology, Tangshan 063210, China
3
National Marine Environmental Monitoring Center, Dalian 116023, China
4
State Key Laboratory of Black Soils Conservation and Utilization, Northeast Institute of Geography and Agroecology, Chinese Academy of Sciences, Changchun 130102, China
*
Author to whom correspondence should be addressed.
Water 2025, 17(10), 1505; https://doi.org/10.3390/w17101505
Submission received: 9 April 2025 / Revised: 8 May 2025 / Accepted: 15 May 2025 / Published: 16 May 2025
(This article belongs to the Special Issue Advanced Remote Sensing for Coastal System Monitoring and Management)

Abstract

:
As the first marine economic zone, the coastal zone is a complex and active ecosystem, serving as an important resource breeding area. However, during the process of economic development, coastal zone resources have been severely exploited, leading to fragile ecology and frequent natural disasters. Therefore, it is imperative to analyze coastline changes and their correlation with coastal ecological space. Utilizing long-time series high-resolution remote sensing images, Google Earth images, and key sea area unmanned aerial vehicle (UAV) remote sensing monitoring data, this study selected the coastal zone of Ningbo City as the research area. Remote sensing interpretation mark databases for coastline and typical coastal ecological space were established. Coastline extraction was completed based on the visual discrimination method. With the help of the Modified Normalized Difference Water Index (MNDWI), Normalized Difference Vegetation Index (NDVI) and maximum likelihood classification, a hierarchical classification discrimination process combined with a visual discrimination method was constructed to extract long-time series coastal ecological space information. The changes and the linkage relationship between the coastlines and coastal ecological spaces were analyzed. The results show that the extraction accuracy of ground objects based on the hierarchical classification process is high, and the verification effect is improved with the help of UAV remote sensing monitoring. Through long-time sequence change monitoring, it was found that the change in coastline traffic and transportation is significant. Changes in ecological spaces, such as industrial zones, urban construction, agricultural flood wetlands and irrigation land, dominated the change in artificial shorelines, while the change in Spartina alterniflora dominated the change in biological coastlines. The change in ecological space far away from the coastline on both the land and sea sides has little influence on the coastline. The research shows that the correlation analysis between coastline and coastal ecological space provides a new perspective for coastal zone research. In the future, it can provide technical support for coastal zone protection, dynamic supervision, administration, and scientific research.

1. Introduction

The coastal zone is an important breeding area for marine biological resources and wetland resources, as well as a significant foreign exchange and trade port, with great ecological, economic, scientific research, and political value [1]. Due to the development of the coastal economy, population growth and land use expansion [2], the coastal zone has become the area with the most drastic land use changes. The ecological environment is relatively fragile [3], the ecological space is severely shrinking, and it is facing problems such as coastal erosion, siltation, and island area reduction [4]. Therefore, accurately and timely obtaining coastline information and studying its changing factors [5,6], strengthening the dynamic monitoring of ecological spatial patterns in the coastal zone, and finding the interactive relationship between the change in spatial utilization types and coastline changes [7] are of great significance for improving the living environment of coastal residents [8], the rational development of coastal resources [9], promoting sustainable development in coastal areas [10], and mitigating marine disasters [11,12].
Relying on the traditional field survey methods to study coastline or ecological space changes has the disadvantages of high cost, low efficiency, and long working cycles, with heavy field data collation and statistical work. With the advantages of wide coverage, dynamic real-time monitoring, and strong accessibility, remote sensing methods are widely used in land, marine, forestry, agriculture, and other departments, playing an increasingly important role [13,14]. With the application of image change detection algorithm in remote sensing information extraction [15], combined with machine learning algorithms, coastline and other feature extraction technologies have made significant progress [16,17,18] and can better realize the identification and classification of different types of features. However, to meet engineering applications, the model still needs to be optimized to improve the feature recognition and extraction accuracy. Research results show that the accuracy of support vector machine, multi-layer perceptron, and ensemble learning machine learning algorithms are greatly improved compared to traditional image processing technologies, but the recognition accuracy for different types of coastlines varies significantly, making it difficult to achieve uniform extraction accuracy [19]. In addition to updating extraction algorithms to improve accuracy, researchers have also focused on monitoring long-term coastline changes [20,21] to understand the impact of coastline changes or to seek reasons for the changes. To better reflect the correlation between the coastline and surrounding features and seek a multi-factor synergistic evolution mechanism [22,23], joint analysis between different features and coastlines has been conducted [20]. However, in most research processes, the correlation between coastline changes and surrounding features is analyzed in a static form [24]. It is rare to dynamically study the interaction of coastline changes and surrounding ecological space using long-time series data to find the linkage between the coastline and surrounding objects.
According to the above areas for improvement, the coastal zone of Ningbo city was selected as the study area. With the help of long-time series high-resolution remote sensing images, Google Earth images, and key sea area UAV remote sensing monitoring data, the coastline information was extracted based on the visual discrimination method. Using the MNDWI, NDVI, maximum likelihood classification, and visual discrimination method, a hierarchical classification discrimination process was constructed to extract long-time series coastal ecological space information. UVA remote sensing technology was used to verify the extraction accuracy. The changes and the linkage relationship between the coastlines and coastal ecological spaces were analyzed based on the extraction results. In the future, the research results can provide technical support for coastal zone protection, dynamic supervision, administration, and scientific research, and offer a new perspective for coastal zone research.

2. Study Area and Data

2.1. Study Area

Ningbo city (120°55′ E~122°16′ E, 28°51′ N~30°33′ N) is located in the northeast of Zhejiang Province, in the middle of the mainland coastline and the southern wing of the Yangtze River Delta. In the east, Zhoushan Islands act as a natural barrier, bordering Hangzhou Bay in the north, Shengzhou City, Xinchang County, and Shangyu District of Shaoxing City in the west, Sanmen Bay in the south, and connected with Sanmen County and Tiantai County of Taizhou City. The total land area of the city is 9816 km2, of which the urban area is 3730 km2. The total sea area is 8355.8 km2, and the total length of the coastline is about 950 km, accounting for about 24% of the total province. There are 614 islands of various sizes, covering an area of 255.9 km2. Ningbo city is a famous national historical and cultural city, thriving since ancient times. It is one of the earliest cities to open a port in China. The Tang Dynasty was the starting point of the “Maritime Silk Road”, a national shipping and logistics center, and an important node city of the “Belt and Road” port and shipping cooperation [25]. Zhoushan port is the third largest container port in the world, and its annual cargo throughput ranks first globally. The study area selects the coastal areas of various coastal districts and counties of Ningbo city to form a relatively complete coastal ecological space (Figure 1), which is conducive to the analysis of the linkage effect between coastline changes and coastal ecological space.

2.2. Data

Due to the long and narrow distribution of the study area, data from a single satellite cannot provide multi-temporal and full coverage. Domestic satellites with high spatial resolution (better than 5 m) were selected, supplemented by foreign high spatial resolution satellites. These include Gaofen-1, Gaofen-2, Gaofen-6, Resources satellite-3 (ZY-3), Systeme Probatoire d’ Observation de la Terre—6 (SPOT-6) and Mapping Satellite-1 (MS-1), among others. The spatial resolution after fusion is better than 3 m, achieving full coverage of the Ningbo coastal zone during the study period. To realize high-precision information extraction [26], the selected images are high spatial resolution images. Limited to the effective acquisition time of such data (the earliest being the MS-1 satellite, launched on 24 August 2010), the study period began in 2012. The image coverage includes the shoreline as the centerline, with the sea side including structures on the sea and the land side including land within 1 km. To meet the quality requirements for information extraction of various elements of coastal wetlands, the satellite transit time is preferred from May to September, and in areas affected by cloud coverage and noise, the transit time is relaxed to March to November. In coastal areas, cloud occlusion shall not exceed 10%, and the overlap of adjacent images shall not exceed 4%, as shown in Table 1.
Because the collected multi-source and multi-temporal images have different atmospheric conditions, topographic fluctuations, and imaging resolutions from different satellite sensors, there are problems such as image geometric distortion, inconsistent spatial resolution, and misalignment of adjacent images. The massive image batch processing function of the PCI GeoImaging Accelerator was used to pre-process the obtained images, including radiometric calibration, image registration, geometric correction, image fusion, and image uniformity [27]. The data quality has been greatly improved, and unified data resolution and image alignment have been achieved.

3. Coastline and Coastal Ecological Space Extraction

The coastline carries the natural and human attributes of the sea area and the land, and has its own ecological function and service value, serving as an important indicator factor to characterize the ecological environment of the coastal zone. According to the definition of the national standard “Term of Oceanology-Marine Geology (GB/T 18190-2017)” [28], the coastline “refers to the sea and land boundary trace line at the average high tide level for many years”. The national standard “Technical Regulations for the Compilation of Provincial Territorial Space Planning (GB/T 43214-2023)” [29] points out that, according to the functional positioning, the territorial space is divided into four categories: urban space, agricultural space, ecological space, and other spaces.

3.1. Extraction Method of Coastline

Because the main purpose is to conduct coastline change analysis, to ensure the accuracy of the extraction results, the visual interpretation method was used. Visual interpretation, with high interpretation accuracy and strong availability of extracted information, is the most common method for remote sensing image information extraction.
According to the analysis of coastal structure characteristics and the actual interpretation, referring to the classification standard of “National Technical Regulations for Coastline Repair and Survey”, the continental coastline was divided into 2 primary classes and 8 secondary classes. A remote sensing interpretation mark database was established, as shown in Table 2 for details.
In order to ensure that when the position and attributes of the multi-period coastline did not change, the morphology and attributes of the coastline remained consistent, the coastline of Ningbo city in 2016 was first extracted, and other continental coastlines in different periods were corrected on this basis. Based on the established coastline classification system and remote sensing interpretation mark database, the extracted 2016 coastlines were divided by attributes. Later, based on the results of 2016, the coastlines of 2014 and 2018 were revised. Finally, the coastlines of 2012 and 2020 were revised based on the coastlines of 2014 and 2018 and so on to complete the six extractions of coastline information. The principle of revision is: (i) if the location and type attributes of the coastline are unchanged, the attributes of the original coastline are retained, that is, the coastline is not processed. (ii) If the position of the coastline does not change, but the type changes, the coastline is reclassified according to the established classification system, and a new coastline type is corrected. (iii) The coastline type does not change, while the location morphology changes, so the original coastline type is retained, and only the position is corrected. (iv) If the coastline location and type attributes change, it is necessary to not only re-determine the location form of the coastline but also re-determine the coastline type attribute.

3.2. Extraction Method of Coastal Ecological Space

Coastal ecological space refers to territorial areas with natural attributes and a dominant function of providing ecological products or services. Based on the national standards “Technical Regulations for the Compilation of Provincial Territorial Space Planning (GB/T 43214-2023)” and “Guidelines for Remote Sensing Identification of Sea Area Use Classification”, a classification system for coastal ecological space and its remote sensing interpretation mark database was established for the study area, as shown in Table 3. Among them, there are fewer vegetation types in the study area, most of them overlap with the ecological space types in the classification system, and the biotope space has a mixed state of Spartina alterniflora and reeds in the study area, which makes it impossible to make a precise differentiation, so the vegetation in the study area is classified as coastal vegetation for extraction and analysis.
The ecological space classification was conducted through a hierarchical approach combining spectral and spatial analysis. Initially, water body and vegetation features were extracted using established spectral indices: the MNDWI for water bodies and the NDVI for vegetation cover. Subsequently, the remaining ecological spaces were classified through a two-stage methodology: primary classification was performed using maximum likelihood supervised classification [30], followed by detailed subclassification based on high-resolution image interpretation. This secondary classification incorporated spatial pattern analysis, considering both textural properties and geometric characteristics of distinct ecological features.
(1) Water space extraction
Within the agricultural ecological space, excluding digging areas, seven land cover types exhibiting high moisture content were preliminarily classified as water space for initial extraction. This classification approach is supported by the enhanced capability of MNDWI in detecting subtle hydrological variations, as demonstrated by recent studies [31]. The methodological workflow involved calculating MNDWI values across the study area, followed by water space extraction using an empirically derived threshold. The MNDWI computation follows Equation (1):
MNDWI = G r e e n M i r G r e e n + M i r
where G r e e n represents the green light band in the remote sensing image and M i r represents the infrared band in the remote sensing image.
(2) Vegetation space extraction
The NDVI has been extensively utilized in vegetation studies by researchers globally, serving as a robust indicator for assessing vegetation vigor and canopy coverage [32]. In this study, vegetation classification was achieved through threshold segmentation, where pixels with NDVI values exceeding an empirically determined threshold were identified as vegetated areas. The NDVI is computed as shown in Equation (2):
NDVI = N i r R e d N i r + R e d
where N i r represents the near-infrared band in the remote sensing image and R e d represents the red light band in the remote sensing image.
Based on the distinct characteristics of different ecological spaces, a comprehensive extraction framework was developed, incorporating a hierarchical classification system for accurate feature discrimination and information extraction. This methodological approach systematically processes ecological data through multiple classification levels, ensuring precise identification of various ecological spaces. The detailed workflow of this extraction process is illustrated in Figure 2.

3.3. Accuracy Verification

(1) Validation of classification results
In the process of classification and processing of remote sensing images, it is essential to verify the accuracy of the classification results. This verification process helps improve and refine the classification method, ultimately providing a final evaluation of the results. By combining Google Earth images, 600 sample points were randomly selected in the study area (see Figure 1 for details), ensuring that no fewer than 50 points fell on each site type. The classification results were validated using the “Confusion Matrix Using Ground Truth ROIs” tool in ENVI 5.3. Table 4 illustrates the classification effect of the hierarchical discriminant method with the 2022 ecospatial classification accuracy validation results.
According to the analysis of the classification results, it can be seen that the classification of multiple features based on the hierarchical discriminant method is more effective, with an overall classification accuracy of 96.18 and a kappa coefficient of 0.95. There are cases where the classification accuracy of similar ecological spaces is relatively low, e.g., ecological spaces such as irrigating land and agricultural flood wetland, pit ponds and water storage areas, where the similarity of epigenetic features leads to confusing classification results. Some studies have shown that image classification accuracy for analytical use generally requires an overall accuracy of more than 70% and a Kappa coefficient of more than 0.7, while an overall accuracy of more than 80% and a Kappa coefficient of more than 0.8 are considered to be a better result, which can satisfy the majority of analytical needs [13]. The hierarchical discriminant method can ensure that the classification accuracy of multiple feature types is more than 90%, which shows obvious advantages when classifying multiple features at the same time.
(2) Remote sensing monitoring by UVA in priority sea areas
In addition to selecting sample points on Google Earth for accuracy verification, key sea areas in Ningbo were chosen for UAV remote sensing monitoring to verify the extraction results. The verification points are shown in Figure 1. The pre-processing process of UAV remote sensing image data included image acquisition, survey area control point collection, field image control point setup according to encryption requirements and air three encryption. We used the current domestic advanced, mature and practical aerial remote sensing UAV platform (Figure 3), comprising the aerial platform, photographic sensor, ground control system and UAV flight control navigation system. Among them, the UAV flight control navigation system adopted can stably control unmanned aircraft of various layouts, with simple and convenient use, high control accuracy, and strong automatic flight function of GPS navigation, which ensures that the horizontal position accuracy of this aerial survey is ±1 cm + 1 ppm, and the elevation accuracy is ±1.5 cm + 1 ppm.
In order to ensure the accuracy requirements, the parameters of aerial photography are designed as follows: (a) the route is laid out according to the area, scope and shape of the survey area, and the route design of independent zones is adopted to take into account the influence of the difference in surface elevation when aerial photography is carried out. (b) The survey area belongs to flat, hilly and mountainous terrain, and in the process of independent zonal aerial photography, according to aerial height = focal length * ground resolution/single pixel size, the relative aerial height of this aerial photography is set at 770 m to ensure that the aerial photography meets the needs of digitized mapping at a scale of 1:2000 (ground resolution < 10 cm). (c) The heading overlap is set at 60–80% and not less than 53%; the side overlap is set at 30–35% and not less than 13%. (d) Air route picture pose: rotational deflection angle less than 8°, maximum not more than 10°; inclination angle less than 2°, maximum not more than 4°.
After pre-processing the UAV remote sensing image data, the necessary characteristics of points and lines were collected. A triangular network was constructed and interpolated to generate a digital elevation model with a regular network. Subsequently, the encryption results were used to digitally differentiate correctly and splice and crop the original images, producing the typical area digital orthographic image (Figure 4) to verify the accuracy of information extraction in the study area.

4. Change Monitoring and Association Analysis

4.1. Analysis of Coastline Change

Statistical analysis of coastline length over the years shows the coastline length change curve from 2012 to 2022, as shown in Figure 5.
Over the past decade, the coastline of Ningbo has shown a decreasing trend (Figure 5). To identify the types of coastline that have undergone significant changes and the main areas involved, the analysis of coastline length change was conducted based on coastline types and administrative regions. The multi-year distribution map of different attributes was used to illustrate the changes in the local coastline (Figure 6).

4.1.1. Change Analysis Based on Types

The changes in different types of coastlines in Ningbo from 2012 to 2022 are shown in Table 5.
The artificial coastline in the study area is significantly longer than the natural coastline, accounting for approximately 60% of the total coastline length (Table 5). The natural coastline is primarily composed of bedrock and biological coastlines, while the artificial coastline is dominated by marine aquaculture fishery coastline.
(1) Basically invariant type
Over the past decade, the lengths of fishery, estuary, silt, and bedrock coastlines in Ningbo have remained relatively stable. Notably, the minimal changes observed in the fishery coastline suggest that the development of surrounding pond aquaculture in Ningbo City has been limited during this period, with the overall scale reaching a state of equilibrium. The inherent characteristics of estuary, silt, and bedrock coastline types naturally contribute to their remarkable stability, making them resistant to significant alterations [33].
(2) Small range changes type
The sandy coastline, as well as coastlines designated for industrial, tourism, recreational, and land construction purposes, experienced a slight increase before stabilizing after 2016. This trend is closely tied to the development and construction activities in Ningbo’s coastal areas during the study period. For instance, the development of Meishan Bay Beach Park between 2013 and 2019 contributed to the expansion of the sandy shoreline. Despite Ningbo’s rich biological coastline resources, the impact of economic development on these natural assets has been inevitable [34]. The total length of the biological coastline reached its lowest point in 2018 before beginning to stabilize. In response, the “Construction Plan of Ningbo Ecological Coastal Zone”, issued in 2022, outlines initiatives for ecological restoration projects aimed at enhancing the preservation rate of the biological coastline.
(3) Big range changes type
The transportation coastline underwent a notable reduction around 2014, followed by a period of stabilization after an increase around 2018. This shift indicates that during this interval, portions of the transportation coastline were converted into other types of coastlines. Subsequently, the construction of protective dike projects was initiated to enhance the traffic capacity of the transportation coastline. These projects not only improve transportation efficiency but also serve to prevent saltwater intrusion, regulate water levels, and enhance shipping conditions. Additionally, they play a crucial role in safeguarding the ecological security of the coastal areas [35].

4.1.2. Change Analysis Based on Administrative Region

The changes in coastline length across different administrative regions of Ningbo from 2012 to 2022 are shown in Table 6.
The coastline length varies greatly across administrative regions (Table 6), which is closely related to the location of each administrative region and the development efforts in coastal areas.
(1) Continuous decrease
The coastline length of Yuyao City has undergone significant changes, experiencing a continuous decline since 2012. This decrease was particularly pronounced between 2014 and 2016, after which the coastline length began to stabilize. The primary driver of this change has been the straightening and flattening of the coastline, particularly through the conversion of the northwest biological coastline into a transportation coastline (Figure 6). This transformation is largely attributed to the encroachment on the biological coastline during the construction of irrigation areas and aquaculture ponds, as well as the development of protective dikes along the transportation coastline to prevent saltwater intrusion.
From 2012 to 2018, the coastline of Xiangshan County experienced a gradual decline before stabilizing. This change was primarily driven by the development of industrial zones and docks in the western area of Qingmen Mountain after 2014 (Figure 6), where bedrock shorelines were converted into industrial and land construction engineering coastlines [36].
(2) Small growth
Cixi City and Zhenhai District have maintained relative stability following a slight increase since 2012. In the northern part of Cixi City, the coastline expanded between 2012 and 2014 due to the implementation of ecological function area planning (Figure 6). Subsequently, from 2016 to 2018, the construction of protective dikes to prevent saltwater intrusion led to further changes in coastline types. Meanwhile, in Zhenhai District, the development of an industrial zone from 2012 to 2014 in the southeastern region of Niluo Mountain contributed to both the growth and transformation of the coastline. This transformation primarily involved the conversion of biological coastlines into industrial coastlines.
(3) First increase and then decrease
Beilun District experienced a slight increase in coastline length starting in 2014, followed by a period of stability until 2018, after which a gradual decline began in 2022. The changes in coastline types were relatively minor, primarily involving the interchange between sandy and biological coastlines near the Yangsha Mountain Tourist Resort in Chunxiao Town (Figure 6). These changes are closely linked to the ongoing planning and redevelopment of the beach tourism area and ecological zone, which have been part of the resort’s construction process since its inception in 2005 [37].
The coastal area of Fenghua District contains numerous small islands. Given the minimal correlation between island coastline dynamics and coastal ecological spatial patterns, island coastlines were excluded from this analysis. The mainland-adjacent coastline exhibited a slight increase in length between 2012 and 2016, followed by stabilization after a minor decrease from 2016 to 2020. These fluctuations are primarily attributed to the implementation of aquaculture zone planning around Yazui Mountain, which resulted in measurable length variations but no significant alterations in coastline types (Figure 6). The relative stability in coastal typology suggests that regional development activities during this period prioritized spatial optimization over fundamental functional transformations of the shoreline.
(4) Increase and decrease alternately change
From 2012 to 2022, Ninghai County experienced alternating periods of growth and decline in its coastline, though the magnitude of these changes remained relatively small. The expansion of the aquaculture industry near Zhangshu Fishing Village in the southwest prompted the conversion of land construction engineering coastlines into fishery coastlines (Figure 6). Concurrently, the straightening of depressed areas along the coastline contributed to a reduction in overall coastline length.
(5) No change
The coastline of Yinzhou District remained unchanged in length throughout the study period. This area primarily consists of a transportation shoreline, adjacent pond aquaculture zones, and ecological function areas (Figure 6). The functional planning of this region has remained relatively stable, with minimal alterations observed [38]. The consistent spatial configuration reflects the established land-use patterns and conservation priorities in this coastal zone.

4.2. Correlation Analysis Between Coastline Change and Coastal Ecological Space

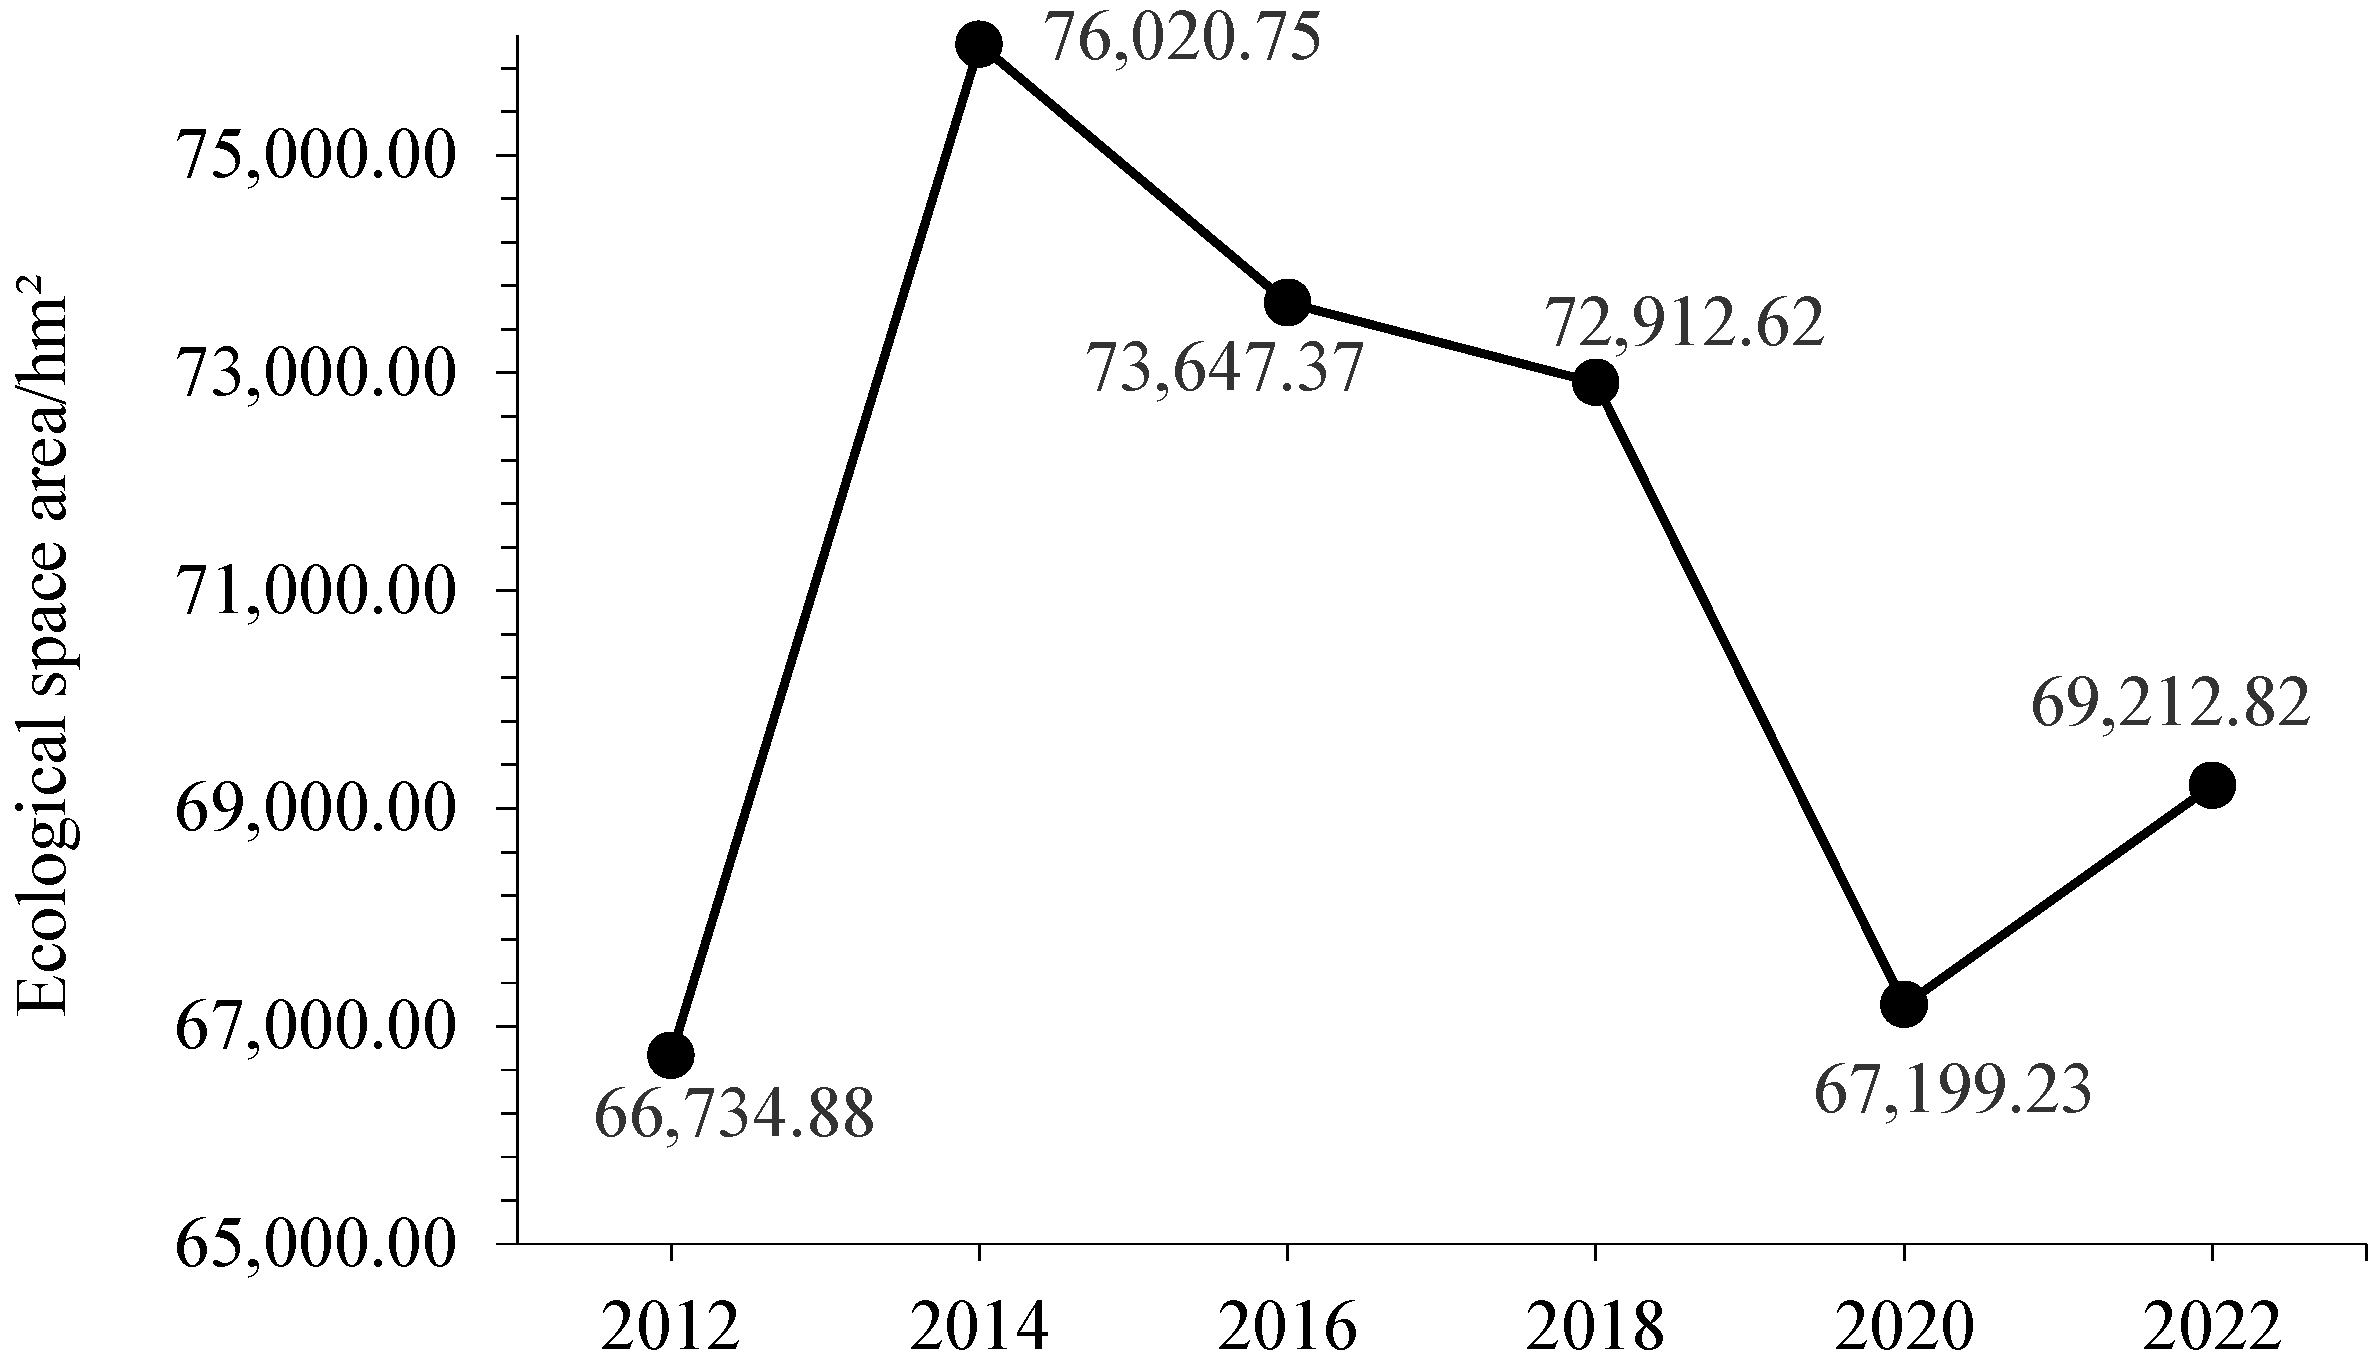
To reflect the overall changes in ecological space, the area of coastal ecological space around Ningbo from 2012 to 2022 was calculated, and the area change curve was obtained (Figure 7).
The coastal ecological space area in the study area began to decline continuously after the rapid growth in 2014, bottoming out around 2020 before starting to grow again (
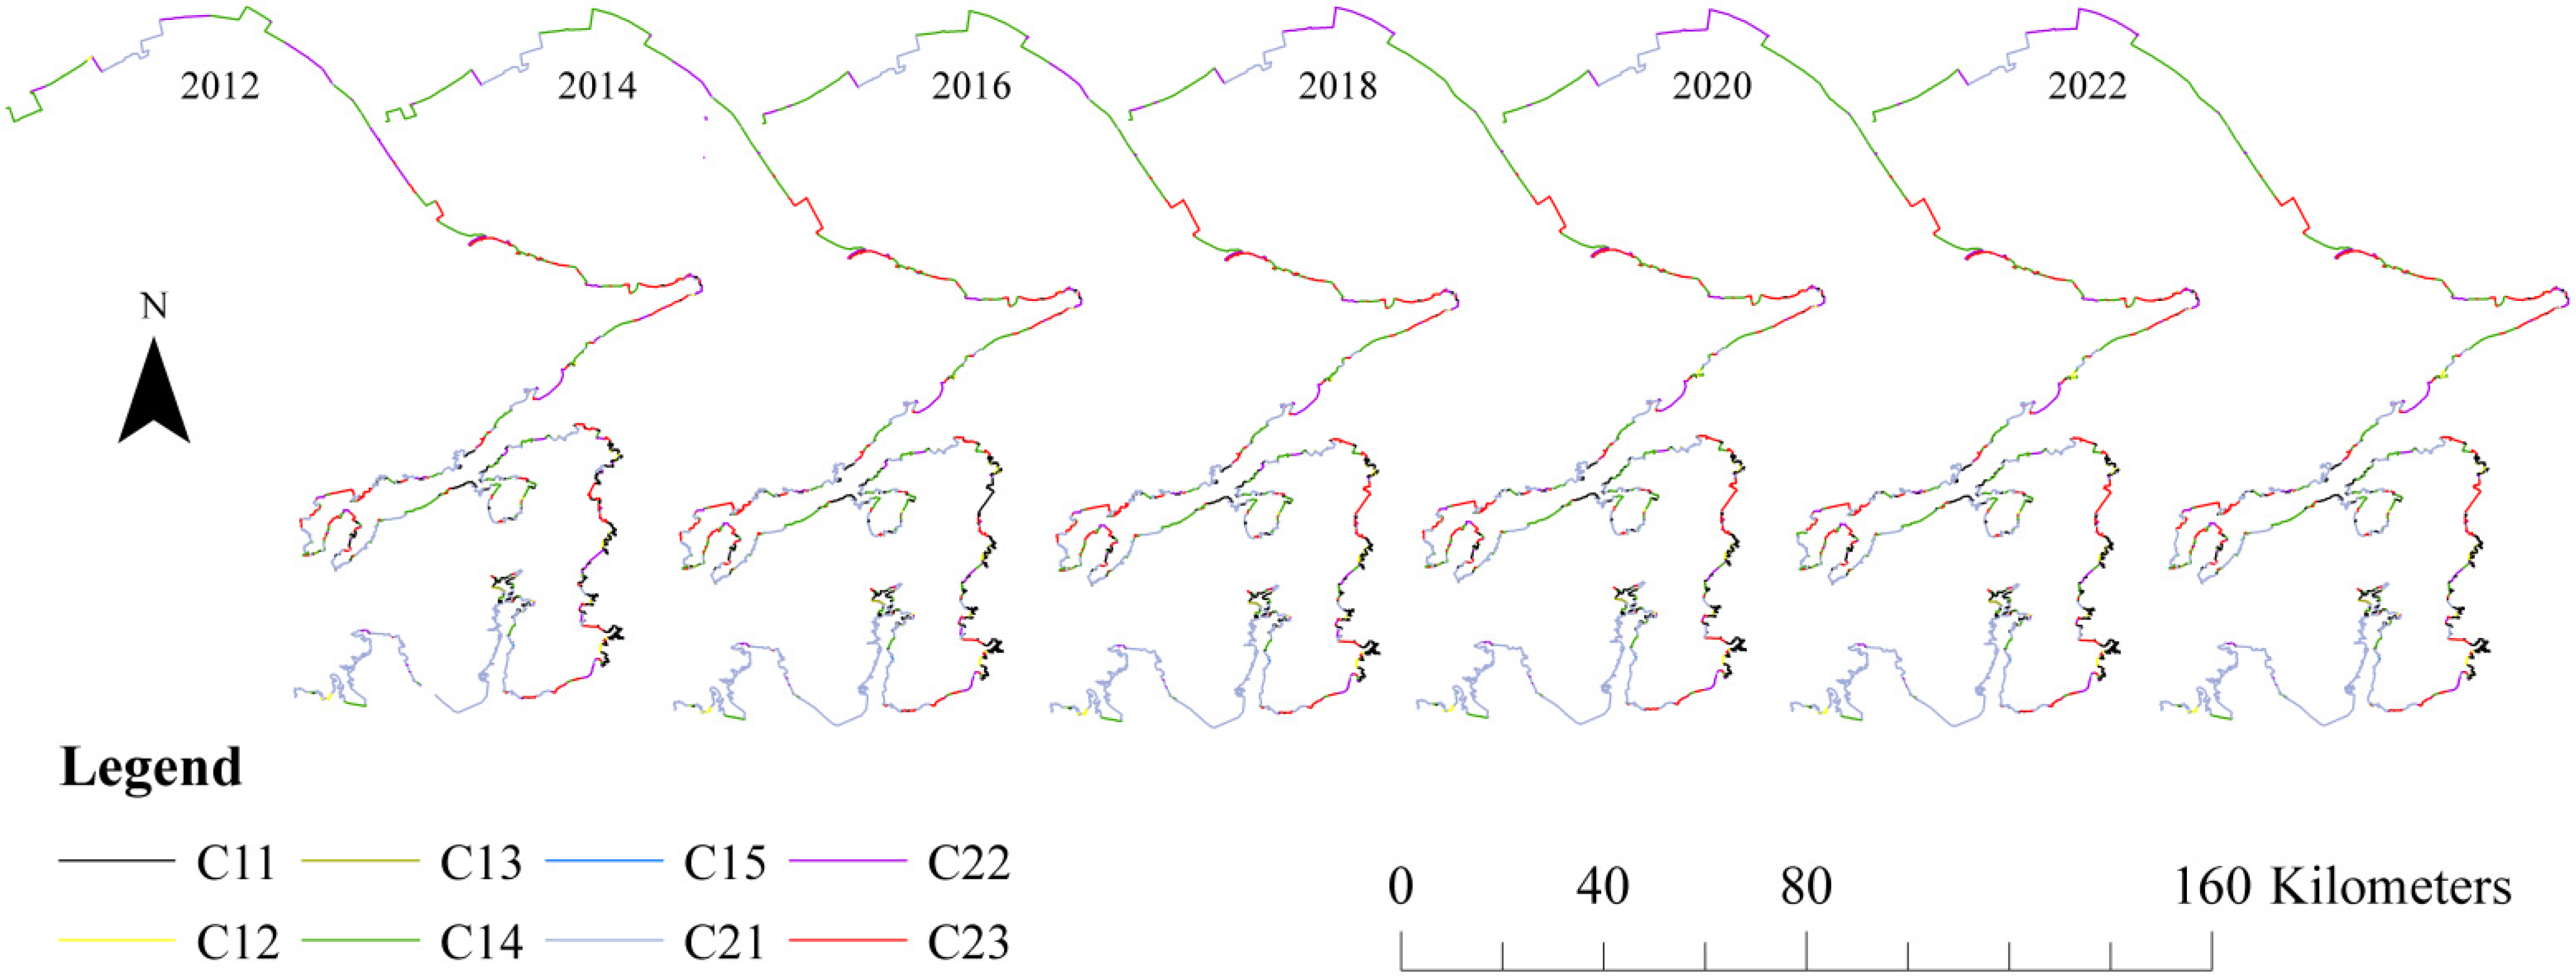
Figure 7). To better illustrate the changing trend of different categories of ecological space, the coastal ecological space area is counted according to the attributes of different categories, see 
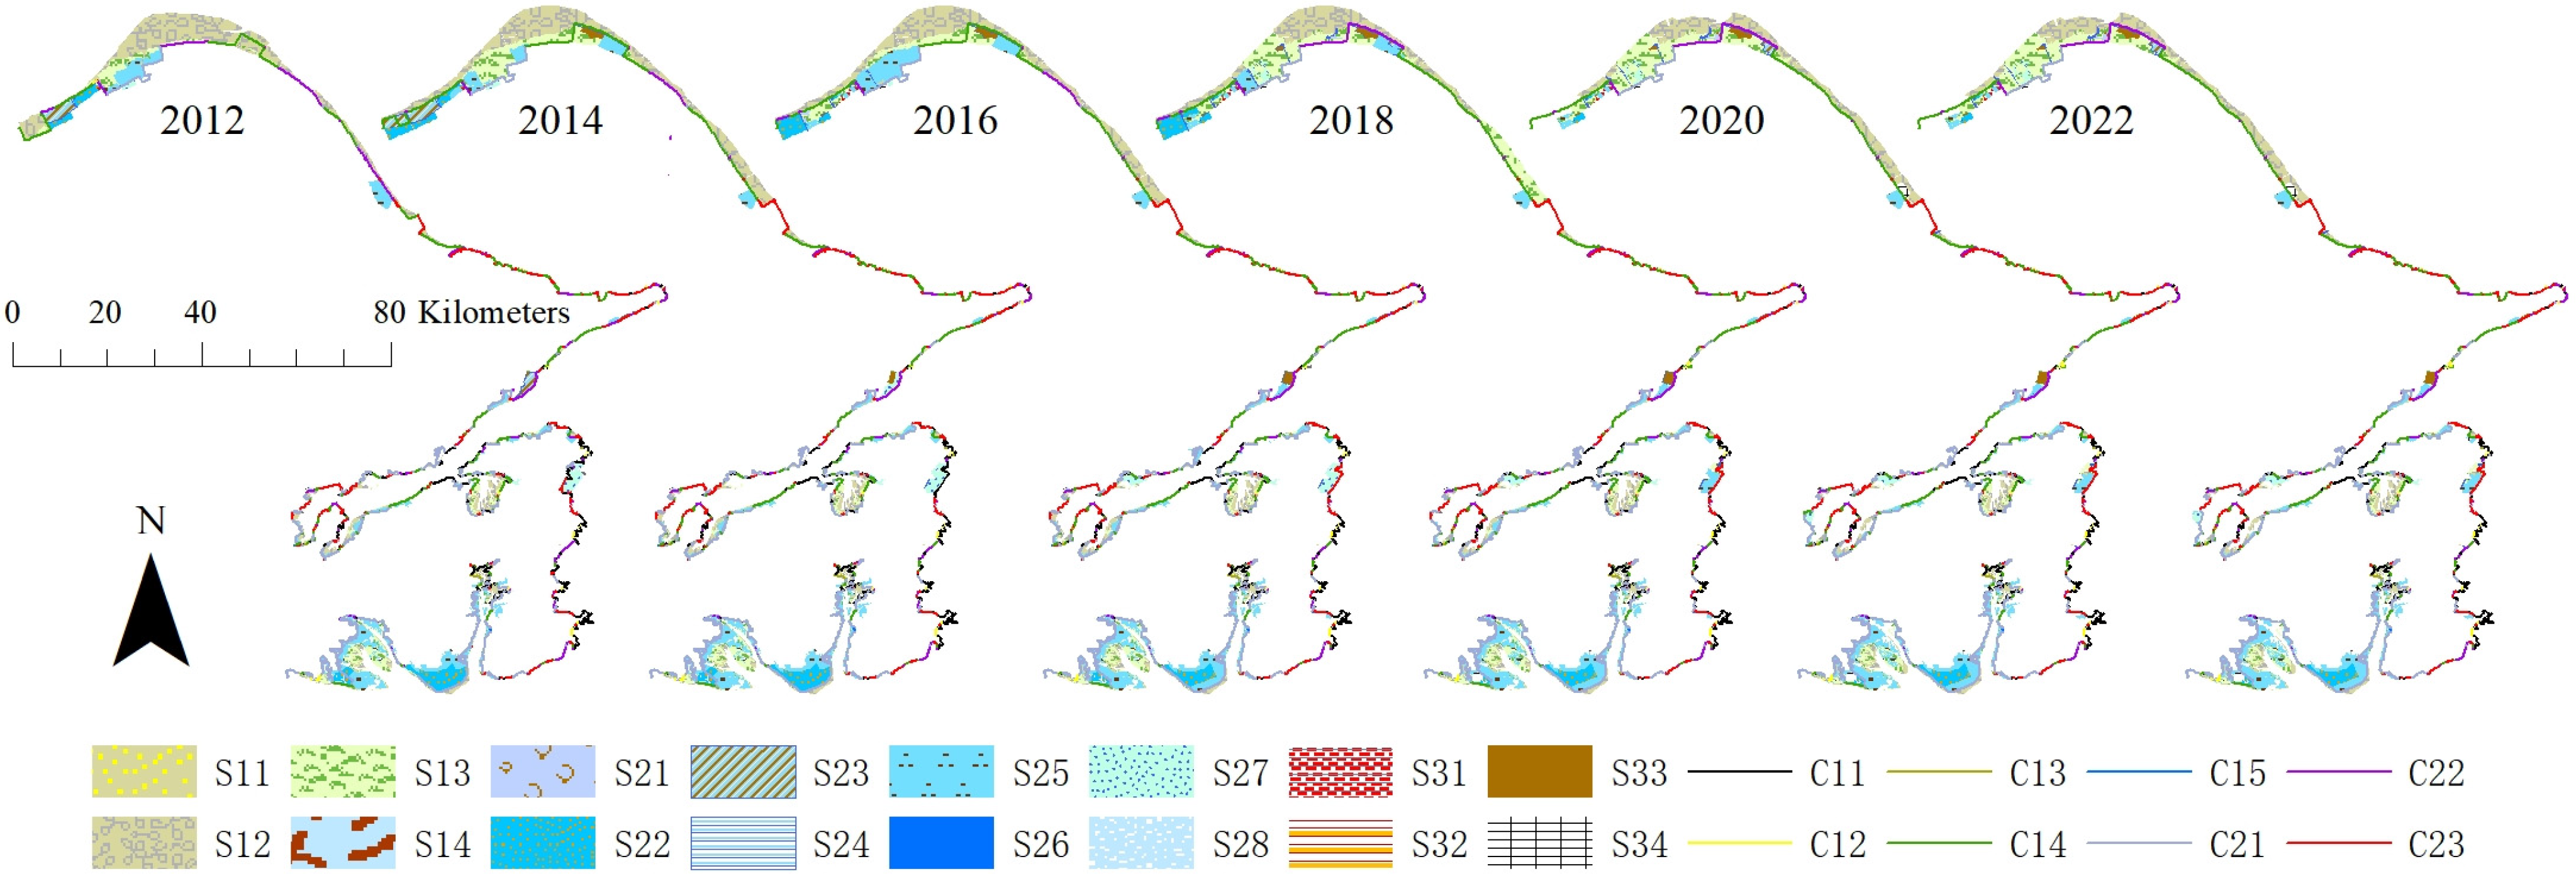
Table 7. Additionally, in order to reflect the linkage relationship between coastal changes and coastal ecological space types, the long time-series overlap analysis of coastline and coastal ecological space was conducted, as shown in Figure 8.
The ecological space area of the natural wetland in the study area is obviously larger than that of the artificial wetland, accounting for about 60% of the total ecological space area of the study area (Table 7). It is not consistent with the proportion of coastline types. After overlapping analysis, it is found that the development of coastal ecological space on the land side by humans led to the change in coastline types, and the natural ecological space on the seaside cannot represent the coastline type. In terms of change, except for rocky coasts and docks, other types of ecological space have varying degrees of change. This is because the rocky coast is composed of hard rocks [33]. Without the development of large engineering projects, it is not easy to change under the influence of seawater erosion, climate change, human activities and other factors, while other ecological spaces easily produce larger changes under the influence of different factors [39].
(1) Analysis of the correlation factors of bedrock and wharf coastline change
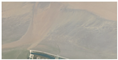
Due to the minimal alterations observed in rocky shores and wharves, the corresponding coastline types (bedrock coastline and industrial wharf coastline) underwent relatively insignificant changes. Based on the analysis of coastline changes in Xiangshan County, it is evident that variations in bedrock and wharf coastlines are predominantly driven by human activities, with natural environmental factors contributing only marginally to these changes.
(2) Analysis of the correlation factors of sandy coastline change
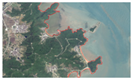
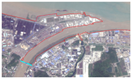
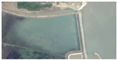
From 2014 to 2016, the intertidal sand beach exhibited a trend of stabilization following a minor expansion. This expansion primarily occurred at the artificial beach within the Yangsha Mountain Tourism Resort in Chunxiao Town (Figure 8). The additional beach area mainly resulted from the conversion of intertidal silt beaches, a transformation driven by the development and construction of the beach tourism zone as part of the resort’s overall planning [37]. Such coastal modifications, which lead to changes in coastline types, are predominantly influenced by human activities, particularly government-led tourism area development planning. Within a short temporal framework, the likelihood of significant natural beach formation through weathering or wave action is relatively low.
(3) Analysis of the correlation factors of silt coastline change
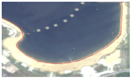
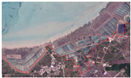
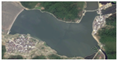
The intertidal silt beaches experienced a slight reduction followed by stabilization during 2016–2018, with minimal area fluctuations. Significant spatial transformations were observed in the coastal zones of Yuyao City, Cixi City, and Zhenhai District (Figure 8), primarily driven by the extensive colonization of Spartina alterniflora, which has substantially altered the ecological spatial patterns. Notably, in 2018, the southeastern coastal region of Cixi City witnessed substantial encroachment of its intertidal silt beaches by 
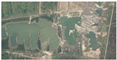
Spartina alterniflora. In contrast, the bay areas of Ninghai County and Xiangshan County maintained relative stability. The southwestern sector of Zhangshu Fishery Village underwent notable transformations due to the expansion of adjacent pond aquaculture operations, resulting in the conversion of beach areas into aquaculture zones and water storage facilities post-2016. Concurrently, the northwestern coastal region of Yuyao City experienced minor spatial modifications in its intertidal silt beaches, primarily attributable to the expansion of irrigation land. These silt beaches predominantly occur in peripheral coastal zones adjacent to open waters, exhibiting limited correlation with coastline typology. The silt-dominated coastlines are principally confined to river estuaries and undevelopable silt beach areas, reflecting their specific geomorphological characteristics and developmental constraints.
(4) Analysis of the correlation factors of biological coastline change
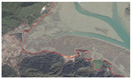
Spartina alterniflora exhibited a substantial expansion from 2016 to 2018, with minor fluctuations observed in other years. Its distribution demonstrates a strong spatial correlation with silt beach areas (Figure 8), predominantly occupying the landward side of these intertidal zones. Originally native to North America, Spartina alterniflora was introduced in 1996 for coastal protection and land reclamation purposes. This species demonstrates remarkable adaptability to saline-alkali soil conditions and tidal inundation, enabling rapid colonization of shallow beach and tidal flat environments. Consequently, it has become the predominant driver of biological coastline modifications in the study area.
The biological coastal zone also encompasses naturally occurring forest areas, which have maintained relative stability over time. These forested areas are primarily influenced by anthropogenic factors, particularly government-led planning and management interventions, rather than natural processes.
(5) Analysis of the correlation factors of artificial coastline change
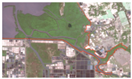
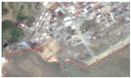
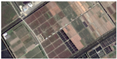
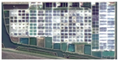
Irrigation land demonstrated a consistent, gradual decline throughout the study period, with a more pronounced reduction observed between 2018 and 2020. Agricultural flood wetlands exhibited a substantial decrease from 2014 to 2016, followed by a significant expansion and subsequent stabilization from 2016 to 2020. These two land use types frequently co-occur in spatial distribution (Figure 8), sharing similar functional characteristics but differentiated primarily by water volume capacity. This distinction is largely influenced by the timing of image acquisition. Both ecological space types show strong spatial correspondence with transportation and fishery coastline distributions. Their transformation processes substantially influence the evolutionary patterns of fishery and transportation-related coastlines, playing a dominant role in shaping the dynamics of these coastal zones.
Offtake exhibited a sustained incremental growth pattern, demonstrating strong hydrological connectivity with inland river networks. These engineered drainage features predominantly occur within industrial-agricultural development zones, showing spatial correlation with transportation infrastructure and coastal engineering projects (Figure 8). Specifically, the system channels inland river water through engineered conduits to establish interconnected drainage networks with marine environments. This engineered hydrological regulation effectively mitigates hydrodynamic impacts from unconstrained river flows on adjacent development zones, while simultaneously creating optimized water management conditions that facilitate coordinated regional planning implementation.
The aquatic product ponds maintained relative stability throughout the study period, exhibiting minor fluctuations in 2016 while remaining largely unchanged in other years. These ponds are spatially adjacent to irrigated lands and agricultural flood wetlands (Figure 8), collectively driving the evolution of fishery coastlines.
Pit ponds experienced substantial expansion from 2016 to 2018 before stabilizing. These features are predominantly located within cultivated lands and aquaculture zones, serving essential water storage and supply functions (Figure 8).
Salt fields demonstrated remarkable stability, with a modest increase observed from 2014 to 2016 followed by minimal changes. The salt industry’s relatively fixed operational requirements have primarily contributed to the formation of transportation and land construction engineering coastlines.
Water storage areas showed minor fluctuations around 2018 before stabilizing. These features are typically situated on the peripheries of urban areas, industrial zones, and agricultural lands (Figure 8), primarily functioning for flood control and irrigation purposes. They represent significant contributors to industrial and land construction engineering coastlines.
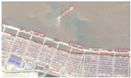
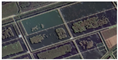
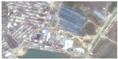
Building areas underwent rapid expansion between 2014 and 2016 before stabilizing. In Yuyao City’s northeastern coastal region, numerous industrial parks were developed through land reclamation during 2014–2016 (Figure 8), driving substantial area growth. Other regions predominantly consist of industrial zones, residential areas, and tourist resorts, serving as crucial generators of industrial, tourism, and land construction engineering coastlines.
(6) Other ecological spaces
The digging areas exhibited distinctive temporal patterns, initially emerging in 2016 and stabilizing after a minor decline in 2018. These areas demonstrate a dispersed spatial distribution pattern (Figure 8) and represent transitional rather than permanent ecological spaces. Their formation and evolution are strongly influenced by anthropogenic activities, frequently co-occurring with irrigated lands or agricultural flood wetlands. As temporally intermittent spatial features, they maintain no significant association with the coastline.
Bare areas have shown gradual expansion since their initial appearance in 2014. These areas predominantly occupy underutilized zones, including decommissioned ports and abandoned industrial sites (Figure 8). While spatially coexisting with various coastal ecological zones, their intermittent temporal characteristics preclude clear associations with specific coastline types.
Photovoltaic installations have experienced substantial growth since their introduction around 2016. Currently concentrated in the coastal regions of Cixi City, Ninghai County, and Xiangshan County (Figure 8), their distribution reflects government planning initiatives. These installations are primarily located in inland coastal zones, showing no spatial correlation with specific coastline typologies.

5. Conclusions

Using some years of high-resolution remote sensing images, Google Earth images, and UAV remote sensing monitoring data from key sea areas, the coastal zone of Ningbo was selected as the study area. Information extraction for coastline and coastal ecological space was completed based on the visual discrimination method and a hierarchical classification discrimination process, respectively. The changes and linkage relationship between coastlines and coastal ecological spaces were analyzed based on the extracted results. The following conclusions were obtained:
(1) Given the complex background environment of coastal ecological space, the key to improving the accuracy of information extraction lies in determining inter-category boundaries. Currently, machine learning algorithms are prone to boundary bias. By incorporating an artificial intervention mechanism into the hierarchical classification discrimination process, the correct classification boundaries can be ensured based on texture and geometric characteristics, effectively addressing such issues.
(2) The acquisition of field data using UAVs in key areas improves efficiency and safety compared to manual field sampling. Additionally, high-resolution images ensure the effectiveness of extraction accuracy verification, demonstrating that UAV remote sensing can serve as an important supplementary means for remote sensing information extraction and accuracy verification.
(3) Through long time-series change monitoring, it was found that changes in ecological space, such as industrial zones, urban construction, agricultural flood wetlands, and irrigation land, dominated the changes in artificial coastline, while the spread of Spartina alterniflora dominated the changes in biological coastline. Changes in ecological space far from the coastline on both land and sea sides had little influence on the coastline. The correlation analysis shows that there is a strong linkage effect between the nearshore ecological space and the coastline, and the closer the distance between the coastline and the ecological space the stronger the linkage effect.
In the study, due to the difficulty of obtaining high-resolution data, the time-series analysis could not be performed for a long enough period of time and in real time, and in the future, we will continue to obtain data to supplement the long time-series analysis. Analyzing shoreline changes caused by sea level rise, tides, and other factors requires long time series data of 20 or 30 years, but the earliest high-resolution imagery covering the study area is from 2010, so it has not been explored, and an attempt will be made to carry out such a study in the future.

Author Contributions

Conceptualization, X.F. and T.C.; methodology, T.C.; software, C.Z. and T.W.; validation, X.F., C.Z. and Q.Z.; formal analysis, C.Z.; investigation, X.F. and M.J.; resources, C.Z.; data curation, C.Z., T.W. and Q.Z.; writing—original draft preparation, X.F.; writing—review and editing, X.F.; visualization, C.Z., T.W. and M.J.; supervision, T.C.; project administration, C.Z.; funding acquisition, C.Z. All authors have read and agreed to the published version of the manuscript.

Funding

This research was funded by the CNOOC Marine Environmental and Ecological Protection Public Welfare Fund, grant number CF-MEEC/TR/2024-19, and the APC was funded by the CNOOC Marine Environmental and Ecological Protection Public Welfare Foundation.

Data Availability Statement

The original data presented in the study are openly available at [https://noda.ac.cn/rsgs/datasharing/imageFilmSearch or https://www.gscloud.cn/home (accessed on 13 April 2024)]. The UAV remote sensing data presented in this study are included in the article material. Further inquiries can be directed to the corresponding author(s).

Acknowledgments

We thank the expert reviewers and editors for their constructive comments on the paper, which were important for the finalization of the paper.

Conflicts of Interest

The authors declare no conflicts of interest.

Abbreviations

The following abbreviations are used in this manuscript:
UAVUnmanned aerial vehicle
MNDWIModified Normalized Difference Water Index
NDVINormalized Difference Vegetation Index
ZY-3Resources satellite three
SPOT-6Systeme Probatoire d’ Observation de la Terre-6
MS-1Mapping Satellite-1
PCIPeripheral Component Interconnect
ROIRegion of Interest
ENVIThe Environment for Visualizing Images

References

  1. Liang, L.; Wei, X.; Qi, Y.; Xin, T.; Heng, H. Problems and countermeasures of coastline protection and utilization in China. Ocean Coast. Manag. 2018, 153, 124–130. [Google Scholar] [CrossRef]
  2. Yong, L.; Zheng, W.M.; Heng, Y.; Peng, Y.; Cui, W.F.; Fu, W. Changes of coastline and tidal flat and its implication for ecological protection under human activities: Take China’s Bohai Bay as an example. China Geol. 2024, 7, 26–35. [Google Scholar] [CrossRef]
  3. Lu, Z.L.; Rong, H.L.; Yi, Z.C.; Hui, Z.G.; Wei, T.; Dian, Z.; Ting, Z.J. Identification and assessment of the mudflat ecological vulnerability dominated by coastline evolution in Jiangsu. Ecol. Indic. 2024, 168, 112761. [Google Scholar] [CrossRef]
  4. Hao, L.; Xin, Z.Y.; Chao, F.; Yong, H.X.; Ling, Z.; Peng, G. Characteristics and models of anthropogenic disturbances on islands from perspective of coastline: Extensive cases from Indian Ocean and mediterranean sea. Ecol. Indic. 2024, 160, 111835. [Google Scholar] [CrossRef]
  5. Xin, Z.Y.; Dong, L.; Chao, F.; He, X.; Yong, H.X. Southeast Asia island coastline changes and driving forces from 1990 to 2015. Ocean Coast. Manag. 2021, 215, 105967. [Google Scholar] [CrossRef]
  6. Lin, C.H.; Ming, L.C.; Ke, L.X.; Bo, A.; Yan, Y.L.; Zhen, W. Analysis of the spatiotemporal evolution of the coastline of Jiaozhou Bay and its driving factors. Ocean Coast. Manag. 2022, 226, 106246. [Google Scholar] [CrossRef]
  7. Chao, L.Y.; Lin, L.J.; Chao, S.; Xin, W.X.; Peng, T.; Meng, C.L.; Tao, Z.H.; Dong, Y.X.; Li, H.G. Thirty-year changes of the coastlines, wetlands, and ecosystem services in the Asia major deltas. J. Environ. Manag. 2023, 326, 116675. [Google Scholar] [CrossRef]
  8. Elizabeth, A.M.; Ethan, J.T.; Joshua, P.; Richard, K.N.; Erin, L.B. Citizen perceptions of Great Lakes coastline change and management efforts. Ocean Coast. Manag. 2024, 255, 107243. [Google Scholar] [CrossRef]
  9. Ying, L.Y.; Jun, F.J.; Ming, C.Q.; Jin, Y.T.; Bo, H.; Xu, J.C.; Lin, Y.Y.; Zhi, Z.Y. Investigating spatiotemporal coastline changes and impacts on coastal zone management: A case study in Pearl River Estuary and Hong Kong’s coast. Ocean Coast. Manag. 2024, 257, 107354. [Google Scholar] [CrossRef]
  10. Lei, Z.; Xue, L.G.; Dong, D.; Lu, Q.L.; Jin, W.; Qi, L.M.; Yang, X.L.; Yu, L.S.; Xuan, S.J.; Zuo, L.M. Coastline eco-efficiency and sustainable development of Bohai Rim cities. Ocean Coast. Manag. 2023, 243, 106769. [Google Scholar] [CrossRef]
  11. Durap, A. Mapping coastal resilience: A Gis-based Bayesian network approach to coastal hazard identification for Queensland’s dynamic shorelines. Anthr. Coasts 2024, 7, 23. [Google Scholar] [CrossRef]
  12. Hamzaoglu, C.; Dihkan, M. Automatic extraction of highly risky coastal retreat zones using Google earth engine (GEE). Int. J. Environ. Sci. Technol. 2023, 20, 353–368. [Google Scholar] [CrossRef]
  13. Jie, H.; Ying, Z.; Yi, X.S. Summary of Research Progress on Application of Domestic Remote Sensing Image Classification Technology. Comput. Eng. Appl. 2021, 57, 1–13. [Google Scholar] [CrossRef]
  14. Abdelouahad, B.; Khoudir, M. Long and short-term evolution of the Algerian coastline using remote sensing and GIS technology. Reg. Stud. Mar. Sci. 2023, 61, 102893. [Google Scholar] [CrossRef]
  15. Feng, P.D.; Lian, L.X.; Jun, Z.Y.; Yan, G.H.; Sheng, L.Y.; Lorenzo, B. Deep learning change detection techniques for optical remote sensing imagery: Status, perspectives and challenges. Int. J. Appl. Earth Obs. Geoinf. 2025, 136, 104282. [Google Scholar] [CrossRef]
  16. Kinh, B.D.; Van, B.D.; Van, L.N.; Kim, C.V.; Hieu, N.; Duc, A.N.; Thi, D.L.N.; Thi, P.N.P.; Tuan, L.G.; Huu, D.N.; et al. Application of deep learning models to detect coastlines and shorelines. J. Environ. Manag. 2022, 320, 115732. [Google Scholar] [CrossRef]
  17. Catherine, S.; Thomas, R.; Paul, C.; ChunBo, L.C.; Kari, D. Coastline detection in satellite imagery: A deep learning approach on new benchmark data. Remote Sens. Environ. 2022, 278, 113044. [Google Scholar] [CrossRef]
  18. Pietro, S.; Giorgio, M.; Giuseppe, C. Semantic segmentation of coastal aerial/satellite images using deep learning techniques: An application to coastline detection. Comput. Geosci. 2024, 192, 105704. [Google Scholar] [CrossRef]
  19. Osman, İ.Ç.; Cem, G. Coast type based accuracy assessment for coastline extraction from satellite image with machine learning classifiers. Egypt. J. Remote Sens. Space Sci. 2022, 25, 289–299. [Google Scholar] [CrossRef]
  20. Ting, C.W.; Yu, Z.Y.; Rui, L.; Cao, L.X. Mapping changes in coastlines and tidal flats in developing islands using the full time series of Landsat images. Remote Sens. Environ. 2020, 239, 111665. [Google Scholar] [CrossRef]
  21. Qi, Q.M.; Xu, L.Y.; Peng, C.; Jie, H.N.; Shuai, W.; Zi, H.X.; Jie, F.B. Spatio-temporal Changes and Hydrological Forces of Wetland Landscape Pattern in the Yellow River Delta during 1986–2022. Landsc. Ecol. 2024, 39, 51. [Google Scholar] [CrossRef]
  22. Lu, Z.L.; Yi, Z.C.; Hui, Z.G.; Wei, T.; Dian, Z.; Ting, Z.J. Synergetic evolution mechanism of coastal resources utilization and coastline change of muddy coast in Jiangsu. Ocean Coast. Manag. 2024, 251, 107089. [Google Scholar] [CrossRef]
  23. Hao, N.Z.; Bo, J.C.; Jie, C.; Yuan, W.Z.; Zhen, Y.; Yuan, M.; An, D.T.; Lin, C.Y. Long-term spatiotemporal analysis of coastline morphological evolutions and their underlying mechanisms in the Pearl River Delta region of China. Ocean Coast. Manag. 2024, 258, 107426. [Google Scholar] [CrossRef]
  24. Feng, Y.J.; Cong, M.C.; Zhen, S.F.; Zhu, Z.Y. Association mining of coastline change and land use patterns to enhance conservation. Ecol. Inform. 2024, 80, 102544. [Google Scholar] [CrossRef]
  25. Wen, X.S.; Tong, Q.B.; Min, Y.Y. The rise of the Maritime Silk Road about 2000 years ago: Insights from Indo-Pacific beads in Nanyang, Central China. J. Archaeol. Sci. Rep. 2022, 42, 103383. [Google Scholar] [CrossRef]
  26. Luis, V.L.; Francisco, F.S.; León, F.Á.S.; Francisco, F.V.; Ranulfo, R.S. The influence of spatial resolution on coastline detection by means of multisource remote sensing data. Remote Sens. Appl. Soc. Environ. 2024, 35, 101258. [Google Scholar] [CrossRef]
  27. Wei, Z.; Tao, Z.; Wei, Z.X.; Wei, Q.J.; Hui, W.G. Application of the software development kit of GXL in the processing of domestic satellite data. Remote Sens. Nat. Resour. 2022, 34, 176–183. [Google Scholar] [CrossRef]
  28. GB/T 18190-2017; Ocean(SAC/TC 283). Oceanological Terminology—Marine Geology. Standards Press of China: Beijing, China, 2017.
  29. GB/T 43214-2023; Natural Resources and Territory Spatial Planning(SAC/TC 93). Code of Practice for Territorial and Spatial Planning at Provincial-Level. Standards Press of China: Beijing, China, 2023.
  30. Kumari, A.; Karthikeyan, S. Comparative Performance of Maximum Likelihood and Minimum Distance Classifiers on Land Use and Land Cover Analysis of Varanasi District (India). In Advanced Network Technologies and Intelligent Computing. ANTIC 2022. Communications in Computer and Information Science; Woungang, I., Dhurandher, S.K., Pattanaik, K.K., Verma, A., Verma, P., Eds.; Springer: Cham, Switzerland, 2023; Volume 1798. [Google Scholar] [CrossRef]
  31. Fabio, C.; José, M.D.B.; Clara, I. Improving rapid flood impact assessment: An enhanced multi-sensor approach including a new flood mapping method based on Sentinel-2 data. J. Environ. Manag. 2024, 369, 122326. [Google Scholar] [CrossRef]
  32. Alex de, L.I.M.; Labib, S.M. Demystifying normalized difference vegetation index (NDVI) for greenness exposure assessments and policy interventions in urban greening. Environ. Res. 2023, 220, 115155. [Google Scholar] [CrossRef]
  33. Elizabeth, S.P.; Camila, A.D.S.; Ruan, V.; Ivandro, P.D.O.C.; Kátia, L.M.; Jhone, C.D.A.; Marcus, F.E.C.; Elisa, E.D.S.S.; Guilherme, B.F.; Pedro, M.; et al. Coastline variations on a section of a coast dominated by cliffs: Past, current and future changes in the municipality of São Francisco de Itabapoana, Brazil. Evol. Earth 2024, 2, 100037. [Google Scholar] [CrossRef]
  34. Yin, C.X.; Ma, R.F.; Mao, J.X. Spatial-temporal evaluation and optimization of spatial conflict in ecological-production-living spaces of coastal region. Shanghai Land Resour. 2021, 42, 78–84. [Google Scholar] [CrossRef]
  35. Steven, L.; Dykstra, S.A.; Talke, A.E.; Yankovsky, R.T.; Enrica, V. Reflection of Storm Surge and Tides in Convergent Estuaries with Dams, the Case of Charleston, USA. J. Geophys. Res. Oceans 2024, 129, e2023JC020498. [Google Scholar] [CrossRef]
  36. Bing, Z.H.; Yi, Z.R. The transformation and upgrading of the industrial park is the planning idea of the Bay New Area-Take the Chengdong Industrial Park of Xiangshan County, Zhejiang Province as an example. Glob. Mark. Inf. Guide 2016, 1, 57–60. [Google Scholar]
  37. Gang, C.; Sang, D.G.; Xu, C.; Biao, P.J. Landscape Design of Waterfront Ecological Wetland. J. Chin. Urban For. 2013, 11, 28–31. [Google Scholar]
  38. Cheng, C. Coastline Resources Evaluation of Coastal Ningbo City. Resour. Sci. 2013, 35, 950–957. [Google Scholar] [CrossRef]
  39. Olawale, A.; Huan, L.; Samuel, D.; Busolami, A.; Zheng, G. Effects of localized development on land use and coastline dynamics: A focus on recent changes along the Lekki Peninsula. Reg. Stud. Mar. Sci. 2024, 78, 103744. [Google Scholar] [CrossRef]
Figure 1. Study area.
Water 17 01505 g001
Figure 2. Hierarchical classification discrimination process.
Water 17 01505 g002
Figure 3. V100 hybrid wing UAV aerial photography system. (V100 hybrid wing UAV, Aerial platform (a); Aerial camera photography sensor, SONY RX1R II, 42 million effective pixel, 35 mm fixed focus (b); Measurement and control ground station, ground control system (c)).
Water 17 01505 g003
Figure 4. UAV orthographic image verification area. ((a) Gaotu enclose tideland for cultivation and breeding area; (b) Xia Yangtu enclose tideland for cultivation and breeding area; (c) Tiger Tsui shipyard).
Water 17 01505 g004
Figure 5. Coastline length change curve.
Water 17 01505 g005
Figure 6. Map of variation in the spatial distribution of different types of coastlines.
Water 17 01505 g006
Figure 7. Change curve of coastal ecological space area.
Water 17 01505 g007
Figure 8. Sequential change diagram of coastline and coastal ecological space overlap.
Water 17 01505 g008
Table 1. Data information.
NumberTimeSatellite NameSpatial Resolution (m)Number (View)
12012MS-1, SPOT-6, ZY-32, 1.5, 2.115
22014MS-1, SPOT-6, Gaofen-12, 1.5, 220
32016SPOT-6, Gaofen-11.5, 213
42018MS-1, Gaofen-1, ZY-32, 2, 2.117
52020Gaofen-1, Gaofen-6, ZY-32, 2, 2.110
62022Gaofen-1, Gaofen-2, ZY-32, 0.8, 2.113
Table 2. Coastline remote sensing interpretation mark database.
Primary Classes (Serial Number)Secondary Classes (Serial Number)Remote Sensing Image CharacteristicsInterpretation Mark
Natural coastline (C1)Bedrock coastline (C11)Typical undulating state, the bay and headland characteristics are obvious, the coastline is tortuous, many serrations. The land and water boundary line with obvious coastal tone change is the bedrock coastline (Red line in the figure).Water 17 01505 i001
Sandy coastline (C12)The sandy beach on the land side is dry, generally bright white, the seaside sandy beach water content is high, the spectral reflectivity is low, and the color is slightly darker. The obvious junction of dry sandy beach and wet sandy beach is the coastline (Red line in the figure).Water 17 01505 i002
Silt coastline (C13)It is mostly distributed in the estuary of the river and the long and narrow bay extending to the land. The vegetation generally grows luxuriant on the land side and the vegetation on the seaside is relatively sparse or has no vegetation. The obvious difference line in vegetation growth is the coastline (Red line in the figure).Water 17 01505 i003
Biological coastline (C14)It mainly includes Spartina alterniflora shoreline and reed shoreline, which is green on the image. The obvious boundary between vegetation and buildings is the coastline (Red line in the figure).Water 17 01505 i004
Estuary coastline (C15)Clear estuarine, sea and land boundaries, historical habits or management lines. Road, bridge, moisture-proof gates and other boundary lines or the sudden widening highlight point connecting the line of the estuary as the estuary coastline (Blue line in the figure).Water 17 01505 i005
Artificial coastline (C2)Fishery coastline (C21)It is regularly square and long-shaped, mostly located on bedrock and silt beaches. The land side of the pond is the fishery coastline (Red line in the figure).Water 17 01505 i006
Traffic and transportation coastline (C22)Straight narrow and coastal extension distribution, smooth texture, in the brightness of the image, gray white or white. There is a moisture dike, breakwater, slope protection and wave retaining wall and other ancillary structures. The oceanic side edge is the coastline (Red line in the figure).Water 17 01505 i007
Industrial, tourism, recreational, and land construction purposes coastline (C23)It has obvious characteristics of sea reclamation, land and sea staggered, and the coastline is relatively flat and neat. Industrial towns, tourism and entertainment development areas with the edge of the sea is the coastline. In the image, the jetty is mostly gray and white, with obvious prominent thin strips. The coastline of the port is the outer boundary of the port, and the coastline of the jetty is determined at the connection between the root of the jetty and the land (Red line in the figure).Water 17 01505 i008Water 17 01505 i009
Table 3. Remote sensing interpretation mark database of coastal ecological space.
Primary Classes (Serial Number)Secondary Classes (Serial Number)Texture/Geometric FeaturesInterpretation Mark
Natural ecological space (S1)Intertidal sandy beach (S11)Characterized by a flat expanse along the coastal belt, exhibiting high reflectivity, a bar-like distribution pattern, and a bright white appearance on the image.Water 17 01505 i010
Intertidal silt beach (S12)Typically found in river estuaries and bay areas. Its surface exhibits a gentle slope with a patchy distribution pattern, characterized by distinct boundaries between dense and sparse vegetation. On remote sensing imagery, these areas display a muddy-toned coloration.Water 17 01505 i011
coastal vegetation (S13)Imagery exhibits distinct vegetation signatures, with characteristics manifesting as greenish tones in the visible spectrum. These vegetated areas predominantly occur along the terrestrial margins of the silt-dominated intertidal zone.Water 17 01505 i012
Rock coast (S14)Near the steep cliff, the beach is directly adjacent to the bedrock bank. The steep cliff has obvious bedrock coastal texture characteristics, and the beach surface under the steep cliff has been submerged by seawater for a long time, with high water content, showing gray or gray whiteWater 17 01505 i013
Agricultural ecological space (S2)Digging area (S21)It has obvious mining characteristics. Water area and bare land interlace, with the characteristics of both bare land and water area in the image.Water 17 01505 i014
Irrigating land (S22)With water remote sensing optical characteristics, the image shows a regular block structure. The crop growing season shows the optical characteristics of vegetation, with obvious seasonality (irrigating land). Generally accompanied by ponds or drainage channels present (agricultural flood wetland).Water 17 01505 i015
Agricultural flood wetland (S23)Water 17 01505 i016
Offtake (S24)It has the remote sensing optical characteristics of a water body, the image is dark in color, the boundary is obvious and the shape is relatively neat. The type is divided in detail by texture and geometric characteristics. Specificity manifestations are: a typical strip, generally connected with the seawater (offtake, red arrow in the diagram points to the location); the shape is regular, and the area is generally larger than the irrigating land (aquatic product pond); irregular in shape, and generally associated with agricultural flood wetland (pit ponds); irregular shape, large area, dam and drain outlet structure associated (water storage area); typical square structure with high reflectivity and bright white (salt field).Water 17 01505 i017
Aquatic product pond (S25)Water 17 01505 i018
Pit ponds (S26)Water 17 01505 i019
Water storage area (S27)Water 17 01505 i020
Salt field (S28)Water 17 01505 i021
Others (S3)Building (S31)A regular shape and a patchy, highlighted structure on the image.Water 17 01505 i022
Wharf (S32)The typical structure extends to the sea and is gray-white on the image.Water 17 01505 i023
Bare area (S33)Distributed in pieces, dark yellow on the image.Water 17 01505 i024
Photovoltaic (S34)The shape is neat, with a typical striped texture and a dark blue color.Water 17 01505 i025
Table 4. Verification of the accuracy of classification results.
Primary Classes (Serial Number)Secondary Classes (Serial Number)Classification Accuracy (%)Average Precision (%)Overall Accuracy (%)Kappa Factor
Natural ecological space (S1)Intertidal sandy beach (S11)93.0596.2696.180.95
Intertidal silt beach (S12)97.40
coastal vegetation (S13)98.09
Rock coast (S14)97.45
Agricultural ecological space (S2)Digging area (S21)95.32
Irrigating land (S22)92.42
Agricultural flood wetland (S23)93.09
Offtake (S24)99.16
Aquatic product pond (S25)95.24
Pit ponds (S26)92.91
Water storage area (S27)94.04
Salt field (S28)99.00
Others (S3)Building (S31)99.31
Wharf (S32)99.81
Bare area (S33)94.58
Photovoltaic (S34)99.25
Table 5. Variation in length of different types of coastlines.
Secondary Classes (Serial Number)201220142016201820202022
Bedrock coastline (C11)166.88167.30155.32154.86154.85154.85
Sandy coastline (C12)14.7714.7714.7716.0516.2116.21
Silt coastline (C13)8.779.129.128.778.778.77
Biological coastline (C14)168.41196.14189.18175.50180.37177.35
Estuary coastline (C15)1.281.251.251.251.251.25
Fishery coastline (C21)368.40370.74370.96369.73367.26363.89
Traffic and transportation coastline (C22)105.1069.9972.7384.5281.9781.97
Industrial, tourism, recreational, and land construction purposes coastline (C23)130.20130.35139.54138.12137.57137.57
Table 6. Changes in the length of the coastline in different administrative areas.
Administrative Areas201220142016201820202022
Yuyao24.5322.9418.1218.1218.1518.15
Cixi91.2894.1094.5494.5494.5494.54
Zhenhai25.5526.7426.7426.7426.7426.74
Beilun100.20100.20101.03101.99101.99101.97
Yinzhou32.9432.9432.9432.9432.9432.94
Fenghua70.1070.1770.7267.3966.7866.78
Ninghai243.27248.05247.07247.45246.84240.62
Xiangshan368.55357.99355.17353.08353.75353.58
Table 7. Changes in the area of different types of ecological space in the coastal region.
Secondary Classes (Serial Number)201220142016201820202022
Intertidal sandy beach (S11)27.4427.4441.9541.9541.9541.95
Intertidal silt beach (S12)29,538.9928,199.8428,334.1521,782.2422,302.1822,532.18
coastal vegetation (S13)9343.6213,970.1612,069.5320,761.1718,361.1019,363.10
Rock coast (S14)3.933.933.933.933.933.93
Digging area (S21)--215.9897.73209.85359.27
Irrigating land (S22)5629.806306.174910.325061.322667.922667.92
Agricultural flood wetland (S23)2343.552516.9243.37211.05427.68427.68
Offtake (S24)327.75730.86850.911032.391046.301147.40
Aquatic product pond (S25)17,392.9220,529.8022,915.7519,967.0117,498.5317,908.27
Pit ponds (S26)27.3727.3727.3798.6698.6698.66
Water storage area (S27)1834.102434.172179.001351.131622.461622.46
Salt field (S28)108.24108.24133.12133.12133.12105.67
Building (S31)110.88113.65366.64366.66341.93354.54
Wharf (S32)46.2946.2946.2946.2946.2946.29
Bare area (S33)-1005.911361.361453.641472.011498.24
Photovoltaic (S34)--147.697504.33925.321035.26
Disclaimer/Publisher’s Note: The statements, opinions and data contained in all publications are solely those of the individual author(s) and contributor(s) and not of MDPI and/or the editor(s). MDPI and/or the editor(s) disclaim responsibility for any injury to people or property resulting from any ideas, methods, instructions or products referred to in the content.

