Abstract
Jordan is a relatively small country with limited natural resources, but it faces a burgeoning demand for water, energy, and food to accommodate a growing population, refugee migration, and the challenges of climate change that will persist through the rest of this century. Jordan’s Main Water Conveyance System is the backbone of distributing scarce water resources to meet domestic and agricultural demands. Therefore, understanding how the future energy requirements of this system may change is critical for managing the country’s water, energy, and food resources. This paper applied a water balance model to calculate the energy consumption of Jordan’s Main Water Conveyance System between 2015 and 2050, and the results point to high energy requirements for the future of distributing Jordan’s water. In the base year of 2015, the unmet water demand was 134.55 MCM, and the supplied water volume delivered was 438.75 MCM, while the energy consumption was 1496.7 GWh. The energy intensities for water conveyance and water treatment were 7.11 kWh/m3 and 0.5 kWh/m3, respectively. We examined five scenarios of future water and energy demand within Jordan: a reference scenario, a continuation of current behavior, two scenarios incorporating improved water management strategies, and a pessimistic scenario with no interventions. According to all scenarios, the energy consumption is expected to be doubled by the year 2050, reaching approximately 3172 GWh. It is recommended that Jordan prioritizes solar-powered conveyance and pumping to reduce the projected doubling of energy demand by 2050. Across all scenarios, the demand for nonrenewable energy associated with water conveyance is projected to rise significantly, particularly in the absence of renewable integration or efficiency interventions. Total water demand is expected to increase by up to 35% by 2050, with urban and agricultural sectors being the primary contributors.
1. Introduction
The Water–Energy–Food (WEF) nexus is a cross-sectional approach to using resources efficiently. Introduced by Hoff (2011) [1] at the Bonn Conference in 2011 for the Green Economy of Water, Energy, and Food Security, the WEF security nexus is a response to emerging trends such as urbanization, globalization, and the unprecedented increase in the demand for resources. While these challenges are global in scope, they acutely impact Jordan, where the migration of refugees and population growth exacerbate urbanization. Jordan’s dependence on imports for energy and food leave it vulnerable to the shifting dynamics of global trade which makes the forces of globalization, a very relevant phenomenon even for a relatively small, arid country. The WEF nexus emphasizes a balance of water needs that consider its forward and backward linkages to neighboring sectors such as the water used for producing energy, agriculture, as well as the energy required for extracting, treating, distributing, and disposing of water [2]. Interdependencies of water, energy, and food are strategic assets that may bear long-term benefits if used properly—improper balancing of these resources can upset the security of one resource [3].
Several studies have provided evidence of strong interaction between water, energy, and food. On a fundamental level, food security requires agriculture which in turn requires irrigation and the energy to deliver it to fields. The value-chain of water requires energy at every step [4]. The typical water use cycle involves energy inputs in five major stages [5]:
- Source and conveyance;
- Treatment;
- Distribution;
- End use;
- Wastewater treatment.
Water utilities use large amounts of energy to treat and deliver water to residential, agricultural, and commercial users [6] (Cohen et al. 2004). The “virtual energy” imbedded within the value chain of water is an important parameter underlying the cycle of water usage. This reflects the total energy required for the use of a given amount of water at a specific location, and the energy intensity required can vary widely due to the quality of water, the requirements of pumping, and the overall efficiency of the infrastructure [7] (see Table 1).

Table 1.
Range of energy intensities for water use cycle segments [5].
Water and energy impact one another beyond the energy requirements of water infrastructure. Stokes and Horvath (2006) [8] and Lundie (2004) [9] provide examples of the correlation between water and energy. These studies applied a life cycle assessment for importing, recycling, and desalinating water and found that desalination required several times the energy demand as its alternatives while also causing significantly more harmful environmental emissions. Cohen et al. (2004) [6] arrived at a similar conclusion, citing how water recycling is a very energy efficient source of water for both urban and agricultural environments which requires half the energy as imported water and is not as energy intensive as desalination. Ramirez et al. (2022) [10] later affirmed this result, arguing that desalination alone is not sufficient to address water scarcity and that desalination projects must be paired with a low-carbon energy source to avoid negative externalities such as pollution that exacerbate the effects of climate change. The same study also casts light on the interplay between domestic and agriculture water uses. Improving the municipal infrastructure to meet domestic demand does not address agricultural demand for water, and as long as farmers’ water requirements are not met, they will continue to unsustainably extract groundwater, endangering the health of groundwater resources and consuming a lot of energy in the process [10]. In a network study of water and energy, Liu and Chen (2020) [11] analyzed how joint water–energy scarcity can spill over into other sectors and transmit risk to other areas of the economy. They found a significant difference between the initial risk posed by water or energy scarcity in one region and the integral risk felt by many regions after taking into account the cumulative losses incurred by water–energy scarcity [11]. Hansen (1996) [12] found empirical evidence that municipal water and energy are complementary products: demand for water increases as energy prices drop and vice versa. This provides further evidence of the strong correlation between water and energy. The value chains of water and energy transfer risk, loss, and benefit to other domains of the WEF nexus, further confirming their interconnected relationship, and consequently, the need for an integrated approach to managing water, energy, and their downstream activities.
Other studies highlight the interplay of water and energy in the agricultural sector, which further demonstrates the intersections of water, energy, and food systems and the need for a WEF nexus framework to study them. Social factors such as population growth and migration induce more demand for natural resources, which can threaten the sustainability of water, energy, and food systems [13]. Albatayneh (2023) [14] points to how integrating water, energy, and food can create synergies that are more robust to the challenges of climate change: precision agriculture, sustainable agriculture methods, and desalination coupled with renewable energy are all potential investments for better resource management. Albatayneh (2023) [14] recommended reusing treated wastewater in agriculture, which can provide a sustainable source of irrigation water at a comparatively lower energy cost. On-farm resource optimization that balances cropping patterns, water quality, water availability, labor, and the role of solar energy have been shown to significantly increase the income and security to rural farmers [15]. Purwanto et al. (2021) [13] applied model simulations to understanding the WEF nexus in India, which explained the various trade-offs between how agriculture, industry, and environmental conservation influence water, energy, and food security. Strategic pricing of irrigation water can help conserve energy by reducing the need for pumping while also allocating water efficiently [16]. All of these results lend further credence to the importance of adopting a WEF nexus to resource management. Inconsistent cooperation between water, energy, and food sectors can at best manage resources temporarily and, at worst, deplete water resources altogether with significant water, energy, agricultural, and environmental losses [17].
While these studies highlight the necessity of a WEF nexus approach to resource management, it must be applied uniquely to each case. Jordan’s water, energy, and food security all face a unique set of factors that alter the country’s portfolio of the Water–Energy–Food nexus. Jordan is an arid to semi-arid country with limited renewable water resources. Refugees constitute nearly 7% of Jordan’s total population making the country ranked second globally for hosting the most refugees per capita [18]. Population growth, challenges of transboundary water management with its neighbors, and drought brought on by climate change individually stress Jordan’s water supply while also amplifying the effects of the others, thereby snow-balling into a complex management problem for sustainably managing Jordan’s Water–Energy–Food nexus [19]. Klauer et al. (2022) [20] designed a participatory approach for understanding the WEF nexus within Amman, and their findings identified three principal forces impacting the WEF nexus of Jordan: climate change, population growth, and refugee immigration, as well as a lack of strong resource governance and enforcement [20].
Jordan’s water supply comes from three main sources: surface water, ground water, and reused treated wastewater, each contributing 26%, 58%, and 16% of the total water budget, respectively [21] (Figure 1). While Jordan has invested in expanding its non-conventional sources of water, such as reusing treated wastewater, ground water still makes up the majority of Jordan’s water supply and represents the primary water source for domestic use. There are twelve major aquifers in Jordan, with the majority being exploited at unsustainable levels that threaten Jordan’s water and agricultural sectors (Figure 2). According to the standard put forth by Meinzer (1923), the safe yield of groundwater abstraction is “the rate at which water can be withdrawn from an aquifer for human use without depleting the supply to such an extent that withdrawal at this rate is no longer economically feasible” [22]. Past studies have identified the safe yield abstraction for each of Jordan’s aquifers, and current estimates for groundwater usage show that nearly all of Jordan’s underground aquifers are over-exploited. Deficits in groundwater pumping have increased between 2013 and 2017 for nearly all of Jordan’s aquifers: particularly the Disi aquifer which supplies Amman with a critical source of domestic water (Figure 2). Major over-abstractions occur in the basins of Amman-Zarqa, Azraq, Jordan Side Valley, and the Dead Sea, where the groundwater level drops at an annual rate from 2 m per year to 20 m per year in some depleted aquifers [23]. The continuation of the current situation makes over 90% of the low-income population threatened by critical water insecurity in less than a century [24].
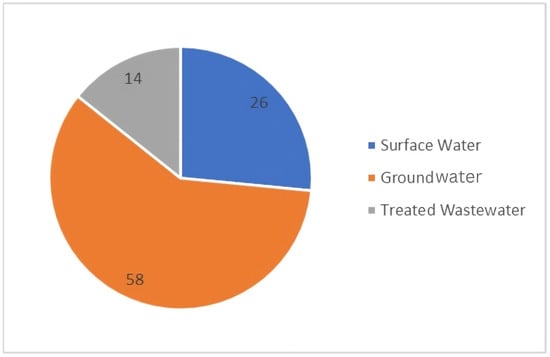
Figure 1.
Composition of Jordan’s water resources, 2022.
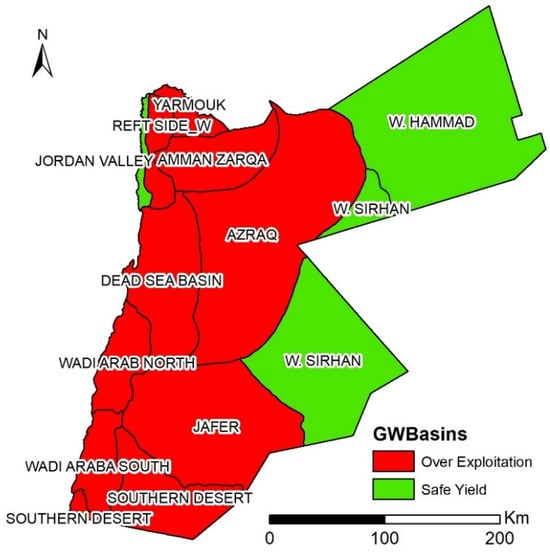
Figure 2.
Groundwater basins in Jordan classified by the sustainability of extraction.
Energy has an inseparable role in Jordan’s water sector both as the recipient of water as an industrial input and as the provider of power to water infrastructure. On a global level, the energy sector ranks as the second largest water consumer behind agriculture [25]. Approximately 10% of global water extractions are used across the supply chain of energy production, ranging from operating power plants to cooling, and producing fossil fuels and biofuel [26]. Conversely, water can only be extracted, transported, and allocated with energy-demanding pumps and pipe infrastructure. Jordan’s water sector consumes around 20% of the country’s total energy and 15% of its electricity, which qualifies the energy sector as a vital actor in the management of Jordan’s water resources [27,28].
The water conveyance system is a critical asset for Jordan’s water infrastructure that transports water from distant sources to urban centers like Amman and Zarqa. Due to elevation and distance, this causes high energy demand [28]. Jordan’s energy sector is heavily dependent on fossil fuel imports with over 90% of energy needs met through external sources [28]. In 2014, electricity demand in the water sector accounted for nearly 15% of total national consumption. Recent national strategies aim to diversify energy sources by expanding solar and wind projects, which have reached grid parity and now contribute over 20% of electricity generation. The water–energy interlink thus has growing implications for national energy planning and sustainability policy.
Agriculture and water pumping constituted 15.34% of Jordan’s total energy consumption in 2018 (Figure 3). The Water Authority of Jordan is the largest electricity consumer in the country, and the water sector will need to depend on a robust energy sector to support achieving water efficiency in its domestic sector [29]. Groundwater is the principal source of Jordan’s entire water supply. Strategically implementing energy and water allocation policies together will produce greater advances in sustainability and equity of groundwater delivery compared to an alternative in which both sectors are managed separately [30].
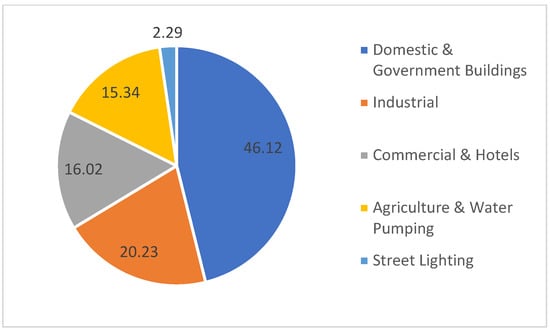
Figure 3.
Jordan’s electricity consumption by sector, 2020.
Jordan relies heavily on imports to cover its energy demand. Jordan’s energy demand was 7.58 mega tons of oil equivalent (Mtoe) in 2007, and this demand increased to 15.08 Mtoe in 2020 [27]. In addition to its overall consumption of electricity, the activities along the value chain of Jordan’s water sector are also highly energy-intensive. Additionally, the steep elevation across the country add to the energy needs of the water conveyance system [31]. The specific energy consumption for water pumping in 2015 was approximately 8.01 kWh/m3, considerably higher than the requirements of other nations [32] (see Figure 4).
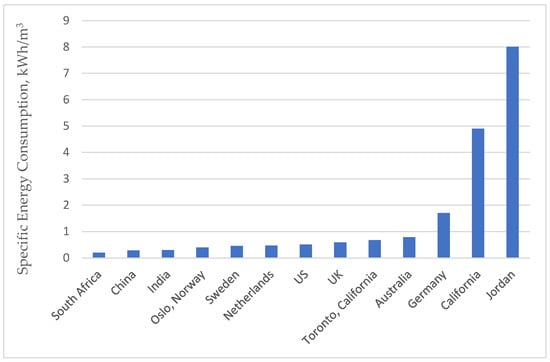
Figure 4.
Comparison of specific energy consumption for water pumping across global regions [32,33]. The figure was constructed by the authors using publicly available data compiled from two sources: (1) the Jordanian Ministry of Water and Irrigation’s “Energy Efficiency and Renewable Energy Policy” (2016) and (2) Wakeel et al. (2016)’s “Energy consumption for water use cycles in different countries: A review”, published in Applied Energy [33]. The figure was not reproduced or adapted directly from either source but was independently constructed to summarize and compare the information.
The connections between water, energy, and food security are abundantly clear from the literature, and Jordan’s unique circumstances of limited resources combined with a strong dependence on food and energy imports will require a WEF nexus approach to studying the country’s future water security. As the country’s population increases, an integrated water-energy approach will become increasingly necessary to accommodate the accompanying transition toward urbanization [34]. Climate challenges and food security will continue to force Jordan to balance carefully its limited resources between domestic, industrial, and agricultural uses. This study aims to advance the understanding of the WEF nexus within Jordan by examining the future of Jordan’s principal infrastructural asset that distributes the country’s water supply: the main water conveyance system. This conveyance system brings water from various sources to demand sites across the country, servicing industry, residential areas, and agriculture with water. Because of the importance of this system, this paper estimates the energy requirements of Jordan’s main water conveyance system for the duration of 2015–2050 based on different scenarios of energy requirements. While private and local sources of water may exist, our study focuses on the main infrastructure that serves the majority of Jordan’s urban and agricultural users. The Water Evaluation and Planning (WEAP) model is used to investigate the conveyance system’s energy requirements and to identify areas of high energy intensity within the system, enabling decision-makers to better target inefficiencies and optimize resource use within the WEF nexus.
2. Methodology and Data
We fit a WEAP (Water Evaluation and Planning, Stockholm Environment Institute, Stockholm, Sweden) model for Jordan’s main water conveyance system that considers all major pipelines, demand sites, and sources of water. Data from the Jordanian Ministry of Water and Irrigation (MWI), Miyahuna Water Company, and annual published reports by Jordanian authorities were all compiled to create a water balance model for modeling water transfer within the system. To compute the energy required, we partitioned the pipeline network into segments of 3000 m length and assigned elevations to the points separating each segment in order to capture the change in elevation and, by extension, model the energy demand throughout the path of the water transfer. ArcGIS (Esri, Redlands, CA, USA) was used to extract elevation points from the digital elevation model (DEM) for Jordan. Five separate scenarios were developed to adapt the WEAP model to changes in Jordan’s future energy demand for its water conveyance system. We developed a baseline reference for the current consumption patterns of energy usage, a “business-as-usual” scenario under the assumption that current consumption continues into the future, and two management scenarios where Jordan successfully develops new projects, reduces water loss, and maintains high living standards. The fifth scenario is a pessimistic scenario that forecasts energy demand in the event Jordan is unable to develop new water projects, does not reduce water loss, and continues to experience high population growth (see Figure 5).
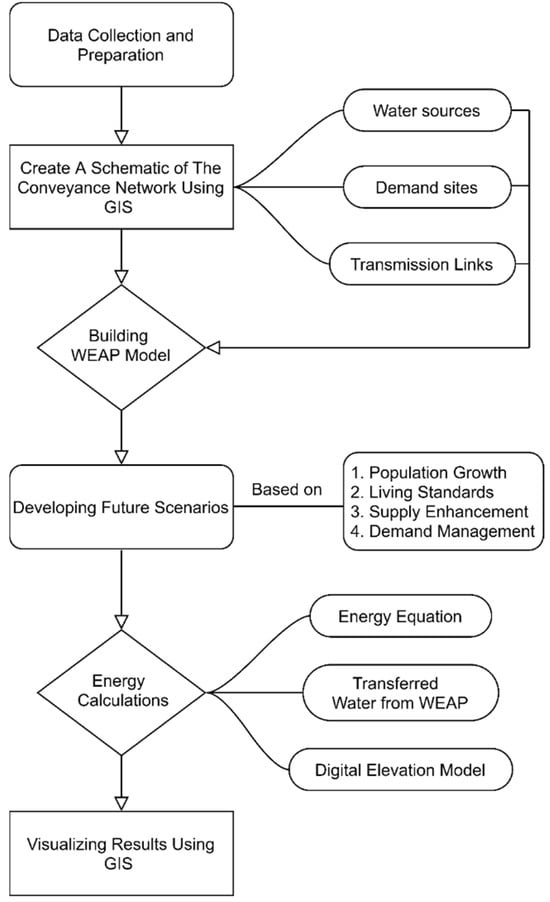
Figure 5.
Framework for integrated water and energy planning using GIS (ArcMap 10.2) and WEAP 2019.202 software.
2.1. Designing the WEAP Model for Jordan’s Main Water Conveyance Network
Jordan’s national water conveyance system consists of main pipelines punctuated with pumping stations and internal distribution networks that deliver water to consumers located at major demand sites throughout the country. The WEAP model developed in this study incorporated various source nodes and demand sites to accurately represent Jordan’s water conveyance system. The source nodes included groundwater wells such as Muhajreen, Al Rusaifa, Swaqa, Wadi Al Qattar, Al Musaitbah, Al Muwaqqar, Areenbah, and Al-Taj in Amman; Al-Haidan and Al Walah wells in Madaba; and Al Azraq, Al-Hallabaat, Karridor, Supply, Al-Zarqaa, Hashemite, Aujan, Marhab, Rusaifah, and Bereen wells in Zarqa. Surface water sources included the Zay Station from King Abdullah Canal, Zara Maeen Station (Wadi Al-Mujib, Al-Zara, Wadi Al-Zarqa Maayan), as well as Rusaifeh, Wadi Sir, and Ras Al Ain stations. Additionally, external water resources such as the Disi Water Supply (Disi Basin) were integrated into the model. Future water supply projects considered in the model included Wadi Arab Water System II (Tiberias_RSDS_1), Hisban Wells, Mujib Dam Water Treatment and Conveyance to Karak, Al-Wala Dam Water Treatment and Conveyance to Madaba, Tannour Dam Water Treatment and Conveyance to Karak, augmentation of water supply for Central and Northern Jordan (Sheediyya—Al Hasa), as well as increasing the water pumped from Disi Aquifer from 100 million cubic meters (MCM) to 115 MCM.
The study utilized the WEAP model to simulate Jordan’s Main Water Conveyance System, accounting for municipal, industrial, and agricultural demands. Input data were sourced from national entities including the Ministry of Water and Irrigation (MWI), Miyahuna, and the Yarmouk Water Company, covering aspects such as water production, distribution, transmission losses, and groundwater abstraction. The model structure included key water sources, groundwater wells, surface water systems, and desalination plants along with transmission links and pumping stations. Elevation data from a Digital Elevation Model (DEM) was used to segment transmission lines and estimate pumping requirements. Assumptions included uniform per capita water use (100–120 L/c/d), sustainable abstraction limits, and a targeted reduction in water losses from 52% to 30%, in line with the National Water Strategy 2016–2025. The demand sites were categorized into municipal, industrial, agricultural, and ecological sectors. Municipal demand sites included the major urban centers of Amman, Zarqa, Madaba, Balqa, Irbid, Ajloun, Mafraq, Karak, Tafila, Ma’an, and Aqaba. Industrial water demand was modeled for secondary and tertiary industrial sectors, particularly in Amman and Zarqa. Agricultural demand was primarily concentrated in the Jordan Valley for irrigation along with other agricultural lands across different governorates. Ecological water demand was also accounted for, ensuring the maintenance of base flows in rivers and reservoirs. The integration of these diverse supply and demand components in the WEAP model enabled a comprehensive analysis of water availability, distribution, and energy consumption across Jordan’s main conveyance system. Local sources of water usage, such as private agricultural pumping, were not considered in our study. Our focus is solely on national infrastructure for major demand sites (see Figure 6).
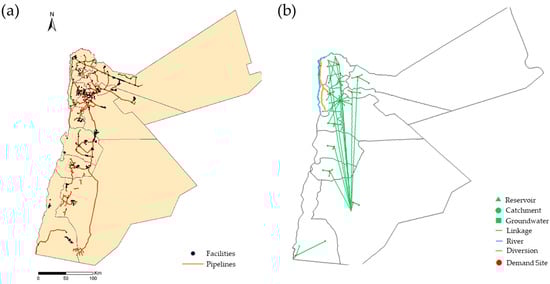
Figure 6.
(a) Jordan’s main water conveyance network; (b) WEAP schematic of the conveyance network.
The Disi water was taken to be the reference source that measures the water transfers between governorates because it is the only source that was constructed for this purpose. Transmission links were connected from the Disi source to all governorates. Using the accumulative quantities in transmission links, the water transfers in the conveyance lines between governorates are computed. For example:
QDisi Madaba Junction to Amman = QDisi to Amman + QDisi to Northern Governorates
The Disi water was taken to be the reference source to track water transfers between governorates, as it is the only major supply source specifically designed to serve multiple regions via the national conveyance network. Transmission links were modeled from the Disi source to each major governorate using WEAP, allowing water flow to be tracked independently through each route.
For instance, water traveling from the Disi wellfield to Amman via the Madaba Junction is split between two primary destinations: Amman and the Northern Governorates. Therefore, to calculate the total Disi water flow reaching the Madaba Junction toward Amman, the flow contributions to both Amman and the Northern Governorates must be summed as follows:
where
QDisi Madaba Junction → Amman = QDisi → Amman + QDisi → Northern Governorates
- QDisi Madaba Junction → Amman = the flow of water from the Disi wellfield, passing through the Madaba Junction, heading toward Amman.
- QDisi → Amman = the volume of Disi water was delivered directly to Amman via the main pipeline.
- QDisi → Northern Governorates = the volume of Disi water that continues beyond Amman to supply northern areas such as Zarqa, Irbid, etc.
This equation ensures that the cumulative volume of Disi water routed through the Madaba Junction accurately reflects all downstream demands serviced by this pathway.
2.2. Modeling Future Scenarios for Jordan’s Main Water Conveyance Network
Jordan’s water supply situation is exposed to numerous demand-side and supply-side constraints: population growth and rising living standards will continue to raise the demand for water while new infrastructure projects and improving water efficiency can increase the water available to meet demand. Each of these factors can take on different values and magnitudes in the future, and we develop five scenarios examining their impact on the energy requirements of the main water conveyance system under different combinations of these values. We investigate the future energy consumption of Jordan’s conveyance network according to four factors: population growth (high or moderate), living standards (high or low), as well as water development projects and water loss reduction whose magnitude is modeled as a binary value: either Jordan develops new water projects or not; either water loss is reduced or not. The simulated reduction in non-revenue water for future management scenarios followed the parameters stated in Jordan’s National Water Strategy 2016–2025 such that water loss will be reduced gradually from 52% to 30% within 10 years [35]. The model incorporates dynamic population growth rates and applies projections up to 2050 considering high (2.3%) and moderate (1.4%) growth scenarios based on national planning figures [24]. Per capita water use is aimed to be equally distributed across the country with 120 L/c/d available in Amman while the other governorates receive 100 L/c/d [24,35]. Our modeling procedures do not directly incorporate climate variability, temperature variability, or rainfall uncertainty due to data limitations and the scope of this study (see Figure 7).
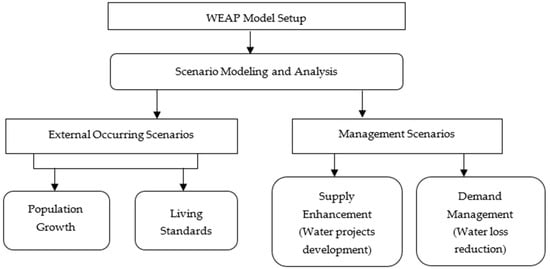
Figure 7.
Scenarios development for the WEAP Model.
The first scenario is the “reference” scenario representing Jordan’s current situation including the recommended standard of per capita water demand, water sector development, and no water loss reduction. The second scenario is the “continue same water use behavior” scenario which simulates no change in the per capita water use over time as well as no new water project development and no reduction in water loss. The third and fourth scenarios, labeled as management scenario 1 and 2, respectively, reflects different combinations of demand stress with supply enhancement and demand management where new projects are constructed and water loss is reduced. Management scenario 1 and management scenario 2 consider identical conditions except for population growth. Management scenario 1 models future energy consumption in the conveyance network under high population growth while the second management scenario uses moderate population growth. The fifth scenario is a “pessimistic” scenario that represents the worst-case of water scarcity in Jordan where no new projects are developed while Jordan continues to experience high population growth, high living standards, and no reduction in water loss (see Table 2).
Table 2.
Scenario design *.
Our modeling process for the future energy demand of Jordan’s main water conveyance is based on existing sources of water as well as strategic goals and infrastructural investments stated by the Jordanian government. Groundwater contributes more than half of the annual water budget in Jordan but is rapidly depleting with important implications for the future of Jordan’s WEF nexus dynamic. Groundwater supplies were around 619 MCM in 2021, and of this quantity, about 450 MCM was abstracted mostly from renewable aquifers and 169 MCM from non-renewable resources in the Disi and Jafer Basins. The estimated sustainable abstraction from renewable groundwater is only 280 MCM annually. A summary of the existing supply sites as well as levels of groundwater extraction used in the WEAP model are given in Table 3 and Table 4, respectively. These data were taken from public reports published by the Miyahuna Water Company and Yarmouk Water Company.
Table 3.
Scenario development summary based on government planning strategies.
Table 4.
Water production and maximum production from other sources 2015 [36].
To meet the country’s perennial water shortage, the MWI has developed a Capital Investment Plan to identify potential projects and investments for sustainable management of water resources [37,38]. Additional planned sources of water were taken from the Food, Water, Energy for Urban Sustainable Environments (FUSE) Project [39] conducted by the Helmholtz-Center for Environmental Research (UFZ) as well as the National Water Strategy 2016–2025 [35]. Table 5 outlines the capacities of potential projects identified by the MWI to augment Jordan’s water supply and improve demand management. Some projects, such as the Wadi Al-Arab System II, have already been constructed while others exist at other stages of development. It should be pointed out that scenario analysis in this study was limited to estimating the energy required for each scenario based on WEAP-modeled water volumes. The scenarios were not evaluated or ranked for efficiency or performance outcomes. Comparative evaluation of scenario energy efficiency remains an area for future research.
Table 5.
Total ground water abstraction limits by governorate in 2015 [37].
Domestic water consumption in Jordan fluctuates throughout the year, especially when comparing the share of water used during the year for winter and summer months. When constructing the WEAP model, we assign a proportional share of water to each month to reflect natural variation in water consumption between seasons. Winter months make up between 7% and 8% of the average annual total while summer months will consume 8.5% to 9.5% (Figure 8).
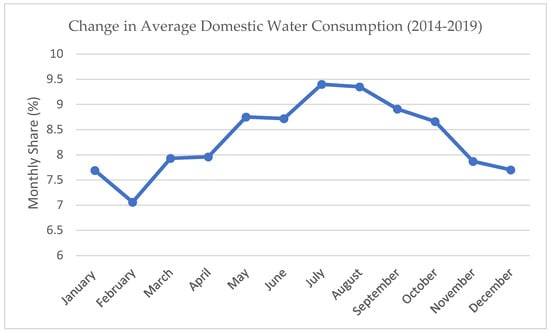
Figure 8.
Change in the monthly share of average annual water consumption (2014−2019).
The proportion assigned to each month is calculated as the ratio of each month’s average water consumption and the average total consumption between 2014 and 2019 (Table 6 and Table 7).
Table 6.
Amount of additional water sources that will supply the drinking water from future projects [35].
Table 7.
Calculation of monthly variation from the water supply to Amman. All values are in million cubic meters (MCM) [39].
2.3. Methodology for Energy Calculations
The WEAP model divides the distances between two locations in the conveyance system into segments of 3000 m in order to allow for a more accurate assessment of energy required to pump water across Jordan’s uneven, rugged terrain. This allows us to use the energy equation to compute the energy required to pump water between each segment and estimate the entire volume of energy consumption throughout the whole network (Equation (2)). Energy requirements for water conveyance were calculated using the standard hydraulic energy equation, factoring in water flow rate, elevation head (including friction losses), and pump efficiency. Elevation data were processed using ArcGIS and pipe friction losses were estimated via the Darcy–Weisbach formula. External calculations were performed using Excel.
Several assumptions were made in order to estimate the energy required by the conveyance system. Pump efficiency was defined as the ratio of hydraulic output to electrical energy input. For this study, average efficiency values were derived from performance tests and technical documentation at Zai and Zara Maeen stations. Measurements involved recording real-time flow and head data using installed instrumentation and comparing these with energy usage data from operational electric meters. Calculated efficiencies ranged from 50% to 72%, depending on the system and time of year, and were validated by maintenance logs and pump audit reports. We assume that the pumping of water is between two open tanks. The pipe length and diameter were obtained from ArcGIS, and the volume of water transferred was taken from the WEAP model. Energy calculations are performed using the fundamental hydraulic power equation, which has been used in national and international studies and is considered credible due to its physical grounding and alignment with water utility engineering standards [40]. It allows for site-specific estimation of energy consumption based on realistic infrastructure parameters and operational efficiency ranges.
where
- Energy = Energy output, kWh;
- = Flow rate, m3/s;
- = Height (head) of water, m;
- = Density of the fluid (water), kg/m3;
- = Gravitational acceleration, m/s2, typically 9.81 m/s2;
- = Efficiency of the system (dimensionless, typically a percentage or decimal value).
According to mathematical procedures for calculating the energy of pumping fluids, the velocity of water in pipes should range between 1 and 2 m/s to avoid sedimentation and erosion [40]. We adopt an initial velocity of 1.3 m/s, with some later modification, to remain within hydraulic requirements.
where
- P1: Pressure at point 1, Pa;
- P2: Pressure at point 2, Pa;
- Y:;
- V1: Velocity of fluid at point 1, m/s;
- V2: Velocity of fluid at point 2, m/s;
- g = Gravitational acceleration, m/s2, typically 9.81 m/s2;
- z1: Elevation (height) of point 1 relative to a reference level, m;
- z2: Elevation (height) of point 2 relative to a reference level, m;
- hp: the added head with pump;
- ht: the consumable head;
- hl: headloss between two nodes.
Assumptions:
- Water transfer is between two open tanks. Thus, P1 = P2 = Patm, V1 = 0 and V2 = Vave.
- The are no turbines so ht = 0.
Applying the assumptions given above produced the reduced energy equation below:
The loss of head of pipe friction (m) can be calculated using the Darcy–Weisbach equation:
where is the friction factor; is pipe length (m); is the pipe diameter (m); and V is the flow velocity of the fluid (m/s). The fraction factor is calculated using the Swamee–Jain equation:
where is the friction coefficient and is the Reynold number, which may be calculated as follows:
where is fluid density (kg/m3); is absolute viscosity (Pa·s); and is the velocity of water (m/s). In Equation (4), is the relative pipe roughness (RPR), which can be calculated according to the material of the pipe. We assume that all pipelines in the main water conveyance network are made of commercial steel similar to the pipelines used in the construction of the Disi conveyance pipeline. The friction coefficient for commercial steel equals 0.045 mm [41]. Measuring the electricity demand for the main water conveyance system in kilowatt hours (kWh) may be performed by calculating the power and time needed for pumping the total quantity of water by the flow rate:
where is the power (kWh); is the shaft head (m); is specific weight (N/m3); is the flow rate (m3/s); and is the pump efficiency. The number of operating hours was calculated as follows:
where
- t = Time required to pump the volume, h;
- Q: Total volume of water to be pumped, m3;
- q = Flow rate or discharge rate of the system, m3/h;
- which gives the total energy for pumping water in kilowatt hours as follows:
To find the energy intensity and compare it with the value published in official Jordanian government reports, other components of the water cycle need to be studied. This study focused on the energy consumed in the water conveyance system; however, an initial estimation for the water treatment can be calculated. From the model, the total water supply in 2015 was 438,748,776.2 m3 and the billed quantity without the losses was 210,599,412.6 m3. The calculated energy consumption in the system for the water conveyance was 1496.7 GWh. Thus, the energy intensity is calculated as follows:
Considering the water treatment, it was mentioned previously that the annual water desalination in Jordan is 70 MCM and most desalination plants work with reverse osmosis (RO) technology. It also was mentioned that the energy consumption in RO plants ranges from 0.5 to 2.5 kWh/m3 [42]. For an initial estimation, the average 1.5 kWh/m3 was taken to calculate the energy to desalinate the 70 MCM of water.
The energy intensity relative to the total delivered water supply is calculated.
It is shown in Table 2 that water conveyance and water treatment are the two major parts of the energy components in the water cycle. Other components of the water cycle were ignored in this study due to their small contribution to the total energy intensity. Table 3 shows the energy intensity of the components and the total energy intensity in 2015. According to the Water Authority of Jordan, the published official value of the total energy intensity in 2015 was 8.01 kWh/m3. Therefore, from calculations, conveying water is the largest energy intensity of 7.11 kWh/m3. This figure is within the upper range of energy efficiencies measured among arid countries. For example, Tunisia’s water transfer systems consume between 5.3 and 7.8 kWh/m³, while a study from Morocco reports intensities of 6.2 to 8.5 kWh/m³ depending on pumping distance and technology [43,44]. Israel, with an advanced energy–water management system and widespread use of solar-powered desalination, achieves transfer intensities as low as 4.5 to 5.5 kWh/m³ [45]. Compared to these examples, Jordan’s higher energy demand results from significant elevation differences (e.g., pumping water over 1200 m from Disi to Amman), aging infrastructure, and limited adoption of energy-efficient technologies.
Finally, energy calculations are validated using energy data from the base year (2015). For example, in the Zai–Amman conveyance line, the calculated energy was 143 GWh compared to 147 GWh reported by the utility, showing a deviation of 2.7%. Similarly, Zara Maeen–Amman recorded 122 GWh, and the model estimated 124.5 GWh (2% deviation). The WEAP model integrated DEM-based elevation data, technical pipeline specifications, and actual water transfer volumes to simulate realistic system behavior. Error margins were verified by comparing model output with field reports.
3. Results and Discussion
3.1. Validating Simulated Water Transfer
A spatial model validation was made for water transfers using actual data obtained from Miyahuna Water Company. Monthly records of water imported and exported from Amman Governorate were used to make this validation. These monthly records extend from January 2016 to November 2020. Six conveyances were used for this validation: Amman–Zarqa, Zai–Amman, Zara Maeen–Amman, Disi–Amman, Amman–Balqa, and Amman to Northern Governorates. The comparison between the WEAP simulation and actual observed data reveals a co-integrated relationship between each set of time series data, providing strong evidence that the WEAP model accurately captures water transfer throughout the main water conveyance system (see Figure 9, Figure 10, Figure 11 and Figure 12).
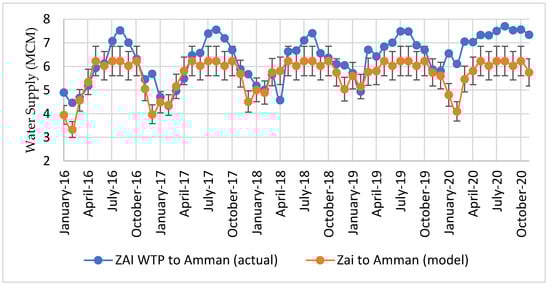
Figure 9.
Water supply trend for Zai–Amman conveyance line; error bars at 10%.
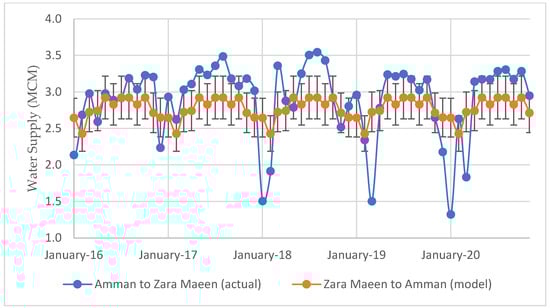
Figure 10.
Water supply trend for Amman–Zara Maeen conveyance line; error bars at 10%.
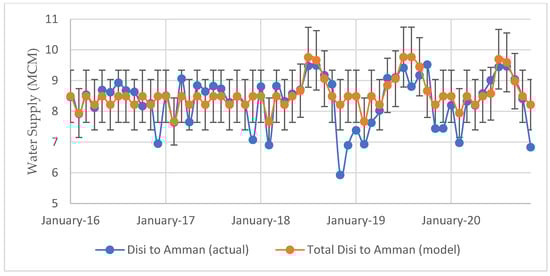
Figure 11.
Water supply trend for Disi–Amman conveyance line; error bars at 10%.
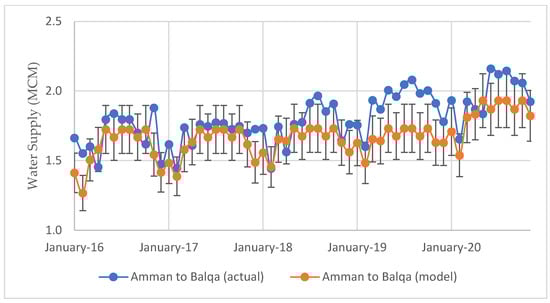
Figure 12.
Water supply trend for Amman–Balqa conveyance line; error bars at 10%.
3.2. Validating Energy Consumption for Base Year 2015
The energy consumption for Zai–Amman and Zara Maeen–Amman conveyance lines were compared to observed data from 2015 to validate the WEAP simulation results. Due to limitations in reported data, we were only able to validate the simulation results for these two conveyance pipelines with official data from the Annual Energy Report published by the Miyahuna Water Company from 2015 [46]. We obtained pump efficiencies for both conveyance lines from the same report, tabulated below. The average pump efficiencies were used for the energy calculations.
The calculated energy consumption (GWh) for the Zara Maeen and Zai conveyance lines are compared to reported energy consumption from the Miyahuna Water Company (Table 8). The WEAP simulation provided an accurate estimation of energy consumed through the selected conveyance lines, with errors ranging between 2.29% to 12.89%, likely reflecting minor uncertainty in our assumptions regarding water velocity, pipe material, and pump efficiency rather than a structural deficiency in the simulation. The availability of monthly energy consumption data for the Zai conveyance line allowed us to further validate the results of the WEAP model, and we find that the error between our simulated energy consumption results and observed data are within a small (0.50–4.14%) margin of error (Table 9 and Table 10).
Table 8.
Energy intensity for water use cycle segments based on the study.
Table 9.
Pump efficiency for different pumps in the Zai and Zara Maeen Projects [46].
Table 10.
Results of power calculation.
To investigate the sensitivity of simulated energy consumption due to different water velocities, we compute the error between calculated energy consumption and reported data for different water velocities between 1 m/s and 2 m/s, and we find that the error between simulated values and observed data remained lower than 10% (see Figure 13).
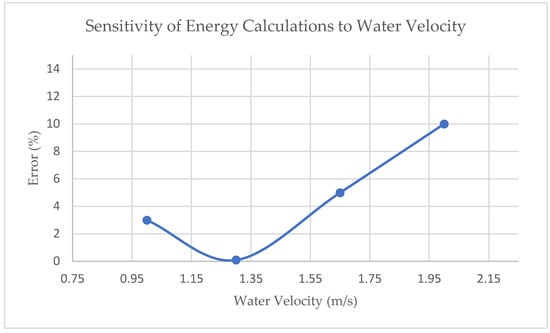
Figure 13.
Sensitivity analysis of energy consumption calculations for the Zai–Amman conveyance line under varying water velocities.
This study does not include sensitivity analysis on variables such as future energy prices, pump efficiency improvements, or emerging desalination technologies due to an absence of data. We recommend future research to incorporate uncertainty and scenario sensitivity, such as Monte Carlo methods, to better understand future energy consumption under sources of uncertainty.
3.3. Scenario Modeling Results for Jordan’s Future Water Supply
Under current conditions, the reference scenario points to 134.55 MCM of unmet demand in 2015, given the current rate of population growth, water supply, living standards, and no reduction in current levels of water loss in the network. Even if Jordan can implement all planned infrastructure projects to bolster its water supply, this will only produce a temporary decrease in unmet water demand, and the deficit will rise to 442 MCM by 2050 (Figure 14). Management scenario 1 considers the future of unmet water demand with high population growth but with additional infrastructure projects to reduce water loss. This scenario only reduces unmet demand temporarily until 2030, and then it gradually increases, reaching 257 MCM in 2050 (Figure 14). Management scenario 2 considers the same set of factors but with a moderate population increase. This scenario provides the best long-term result, with very low unmet water demand through the remainder of the 2020s and into the 2030s and 2040s. Unmet water demand only reaches 40 MCM by 2050.
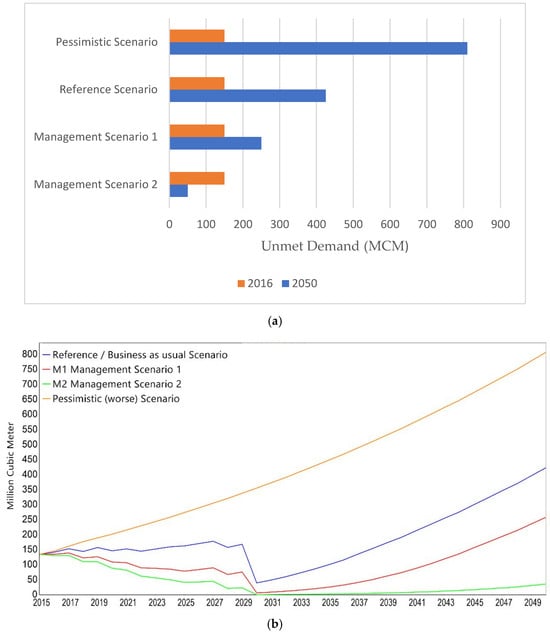
Figure 14.
(a) The future of unmet water demand in Jordan for each scenario compared to the baseline year (b) change in the unmet demand over time for each scenario.
In all scenarios, population growth, along with high living standards, places enormous strain on water resources. This implies that improving water supply infrastructure through new projects and reducing water loss can lead to significant strides in reducing unmet water demand in Jordan and even reducing over-abstraction of groundwater resources. The difference between the reference scenario and management scenario 1 highlights the long-term impact of reducing water loss on Jordan’s unmet demand. In 2050, the difference between unmet demand in the reference scenario and management scenario 1 is around 150 MCM, largely due to reduced water loss. When we compare the difference between management scenario 1 and management scenario 2 in 2050, the moderate population growth led to a reduction of 200 MCM in unmet water demand. These comparisons highlight the acute impact population growth has on Jordan’s future water security, but moderating its population growth must be met with water loss reduction and an improved supply in order to minimize unmet water demand in the long-term.
3.4. Scenario Modeling Results for the Energy Consumption of Jordan’s Main Water Conveyance System
In the baseline year, the total energy consumption for all conveyance lines was 1496.7 GWh which closely matches the actual electricity consumption in 2015, which was 1745 GWh, including water treatment and wastewater treatment [28]. Energy consumption of the network is the highest in the south of the country, where the junctions traversing Maan, Tafila, Kerak, and Madaba cross over highly rugged terrain as the water is transported to demand sites in the north of the country. On the other hand, several sites in the Jordan Valley and the northern governorates consume relatively low to no energy, as several pipelines use gravity to transport water. High energy consumption was observed in conveyance lines with a large change in elevation and large quantities of water transfer. The Zai–Amman conveyance line, which conveys water from a low elevation near the Dead Sea to Amman, was the largest energy consumer, requiring almost 339 GWh and a specific energy consumption of 4.96 kWh/m3. The Disi to Maan junction is another leading energy consumer, with an energy requirement of almost 274 GWh, followed by the Zara Maeen to Amman line, which consumed 176.7 GWh with a specific energy consumption of 5.59 kWh/m3. Table 11 shows the values of the energy consumption for each conveyance line (see Figure 15 and Table 12).
Table 11.
Error between actual and calculated energy consumption for Zai conveyance line.
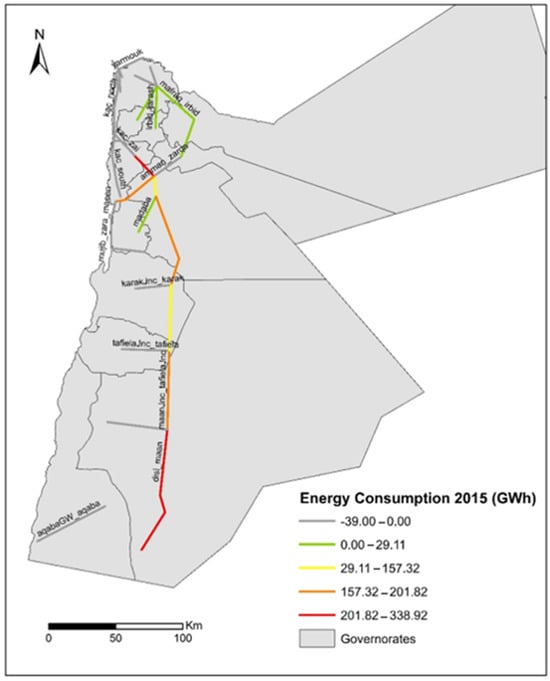
Figure 15.
Energy consumption of the main water conveyance system in the base year 2015 (GWh).
Table 12.
Pumping energy consumption in the base year 2015 (GWh).
The water transfer results from the WEAP model scenarios were used to estimate the energy consumption throughout the entire network. The energy consumption from each linkage in the main water conveyance network for the reference scenario, management 1 scenario, and management 2 scenario are mapped spatially in Figure 16, Figure 17 and Figure 18. The reference scenario suggests that no change would occur for the current water use, which is high in some governorates, such as Amman and Irbid, and lower in other governorates, such as Aqaba and Kerak. In 2020, the Zai–Amman link was the highest energy consumer using 351 GWh and the link from Disi to Maan Junction is the second highest energy consumer (map 4). The links of Zara Maeen to Amman, Karak Junction to Madaba Junction, and Maan Junction to Tafiela Junction were the next highest energy consumers, using between 176 GWh and 209 GWh. Most of the north of Jordan uses less than 29 GWh or no energy, and this trend persists through 2050. In 2030, new projects were added to the water supply system, such as the Red Sea Dead Sea project (RSDS), which have the largest water supply capacity. However, the Zai–Amman pipeline was the highest energy consumer, because in 2030 the water demand in Amman is covered and only part of the RSDS water is used. Other projects, such as Tiberias RSDS Phase 1 and 2, will start operating, producing low and moderate energy consumption estimates in links to these water sources. In 2040, RSDS is expected to work in full capacity due to the high demand. Thus, it will be the highest energy consumer with approximately 654 GWh from the desalination plant near the Dead Sea to Amman and almost 429 GWh from the Red Sea to the Dead Sea. In 2050, the energy consumption for RSDS to Amman rises to more than 873 GWh and 578 GWh in its two stages: from the Red Sea to Dead Sea and then to Amman, making this alternative the highest energy consumer in the system.
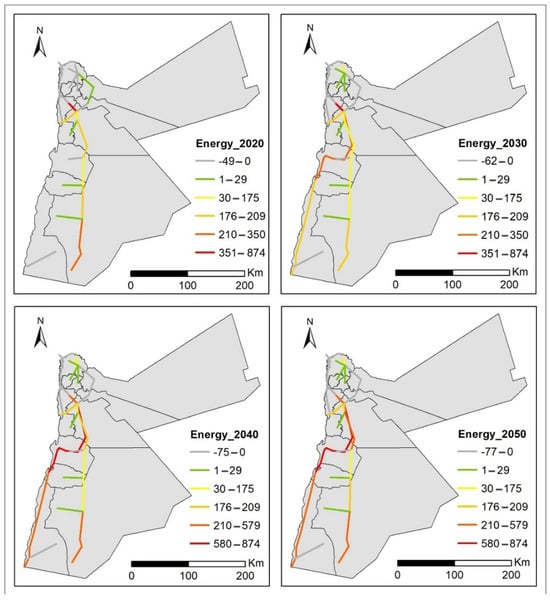
Figure 16.
Energy consumption of the main water conveyance system in the reference scenario (GWh).
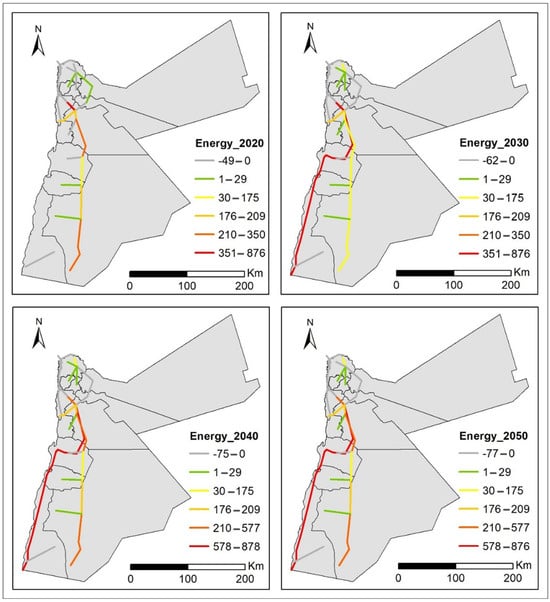
Figure 17.
Energy consumption of the main water conveyance system in management scenario 1 (GWh).
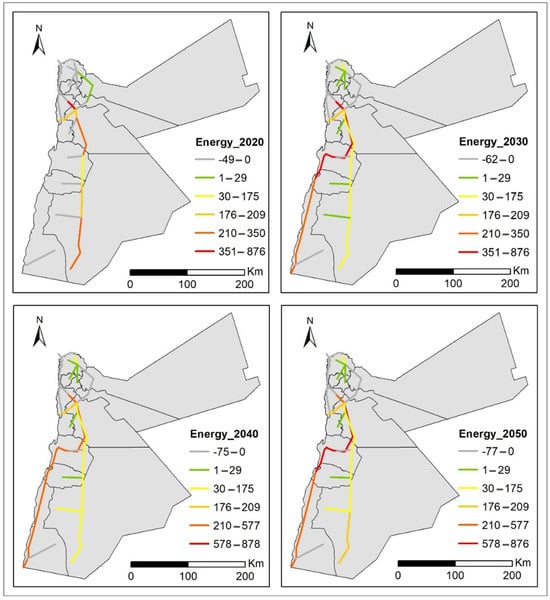
Figure 18.
Energy consumption of the main water conveyance system in management scenario 2 (GWh).
Management scenario 1 considers the future of water supply in the case of high population growth which means Jordan must meet high per capita water usage and the RSDS will operate at a high capacity in 2030. This results in high energy consumption that reaches approximately 700 GWh from the desalination plant near the Dead Sea to Amman (Figure 17). Other conveyances minimize the gap between the water demand and delivered supply. In 2040 and 2050, more energy will be consumed by the RSDS conveyance line, which will then be operating at full capacity.
Management scenario 2 considers the same conditions as management scenario 1 but with a more moderate population growth rate, which reduces the long-term energy consumption of the main water conveyance network. Energy consumption in the southern pipelines are considerably lower compared to future energy consumption under management scenario 2, highlighting the mitigating effects moderate population growth may have on conserving Jordan’s future energy and water supply. The RSDS and Zai–Amman conveyance pipelines are the highest energy consumers. However, supplying water from the RSDS to Amman reduces the volume transferred from Disi aquifer, resulting in moderate energy consumption along that conveyance line.
The change in the consumption of energy during the study period in the three developed scenarios is shown in Figure 19. The energy consumption for the reference scenario for the network increases gradually from 1496.7 GWh in 2015 to reach 3171.6 GWh by 2050 (see Figure 19). Referring to management scenario 1, the increase reaches 3182.3 GWh in 2050. Looking at the period from 2015 to 2020, there is no significant increase in the consumption in all scenarios. This is due to the lack of water sources, which means there is less water available to be transferred by the network, resulting in high unmet demand, as illustrated by Figure 14b. New projects completed by 2030 provide more water supply, which leads to a precipitous decline in unmet water demand (Figure 14b) but has the simultaneous effect of raising the energy consumption of the system.
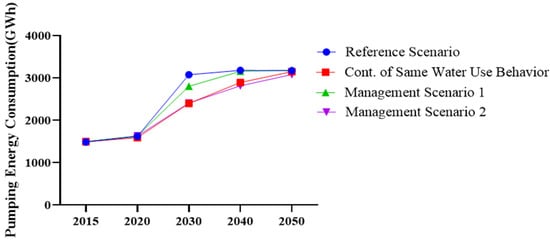
Figure 19.
Energy consumption of the main water conveyance system under different scenarios.
Energy consumption under all scenarios between 2040 and 2050 begins to plateau and reach an upper bound where the system can no longer deliver more water. Yet despite rising demand for water under most scenarios, the energy consumption does not follow the diverging paths shown in Figure 14. Instead, energy consumption for the main water conveyance system begins to converge to a limit between 3078.67 GWh and 3182.34 GWh by 2050. The strong qualitative differences in unmet water demand (Figure 14b) and energy consumption (Figure 19) are due to population growth and rising living standards, which increase the demand for additional water while the capabilities of the system remain relatively constant. Unmet demand represents all of the water not delivered by the system, which means no energy is expended delivering it. This does not mean, however, that the main water conveyance system is incapable of meeting Jordan’s water demand. Management scenario 2 supplies close to the country’s water needs through 2050 with only an average annual unmet demand of 34.8 MCM even while operating at a similar energy level as the other scenarios (Figure 14b). The key is that management scenario 2 considers moderate population growth, which reduces the unmet demand in addition to improving water infrastructure and reducing water loss in the system. Management scenario 2 operates at lower energy consumption than the other scenarios while also achieving a lower unmet demand between 2030 and 2040.
The improved scenarios reduce energy use primarily through water loss reduction programs aimed at decreasing non-revenue water from 52% to 30%, in alignment with the National Water Strategy 2016–2025. In addition, implementation of strategic water projects like Disi, Zara Maeen expansion, and KAC–Zai interconnection contributes to reducing conveyance loads from distant sources. While the management scenarios primarily consider loss reduction and supply augmentation from new projects, additional measures supported by the recent literature include enhancing equity in water distribution to reduce reliance on informal energy-intensive sources, reallocation of a portion of agricultural groundwater to municipal use, and integration of large-scale desalination projects into modern distribution systems [24]. These strategies collectively enhance energy efficiency across the water sector and build resilience to future supply–demand pressures. Renewable-powered conveyance technologies such as solar PV and wind-integrated pumps offer viable options to reduce energy dependency [47,48]. Additional efficiency gains can be achieved through the installation of variable-speed drives (VSDs), which optimize pump operations under varying load conditions, as well as supervisory control and data acquisition (SCADA) systems that enable real-time flow and energy monitoring. Energy recovery systems, such as inline turbines, can capture excess pressure and convert it into usable electricity in sloped or gravity-fed segments. Integration of distributed renewable sources across pumping stations has been successfully demonstrated in regional projects in Tunisia and Egypt, indicating technical and financial feasibility for Jordan’s infrastructure.
These results provide important insights into Jordan’s Water–Energy–Food nexus in the near future. The energy consumption from 2015 is expected to double by 2050, and Jordan must prepare its energy resources for this additional pressure. Nevertheless, Jordan’s existing water infrastructure is capable of supporting the distribution of water to meet its population’s demand as long as the country optimizes its water resource management by following the conditions of management scenario 2 and takes action to limit water demand, reduce water losses, and augment the current supply with additional investment. These results demonstrate that water is the principal limiting factor for Jordan’s WEF nexus, which is in line with the findings of Klauer et al. (2022) [20], who show that water is the most severely scarce resource in Jordan, as emphasized in broader discussions with experts on the country’s current WEF nexus.
4. Conclusions
Through this study, the energy consumption of the main water conveyance system in Jordan was studied to explore future energy requirements and the feasibility of meeting them. For this purpose, a WEAP model was built to study the impact of future water projects suggested in the NWP (2016–2025) regarding water scarcity in Jordan. The WEAP model was also used to obtain and estimate the transferred water quantities for energy calculations. Results of the transferred water in some conveyance lines were validated with data obtained from Miyahuna Water Company. An analysis of the results was conducted to compare the different scenarios. Energy calculations were conducted using the basics of the energy equation and some assumptions were taken to overcome the difficulty of obtaining elaborate data related to the water and energy sectors. ArcGIS was used for extracting required data, such as elevations and paths, as well as for results visualization. Furthermore, this study attempted to assess the scarcity in Jordan’s water sector and to provide an insight into the behavior of energy consumption in the country’s main municipal conveyance lines.
In 2024, Jordan’s water crisis intensified, with severe scarcity exacerbating the nation’s challenges. Nearly all groundwater aquifers are critically overdrawn, straining the country’s already limited resources. Even with the implementation of new projects outlined in the 2016 Jordan Water Policy, the situation remains dire, as highlighted in every scenario developed in this study. Achieving a sustainable standard of per capita water use has become increasingly elusive. In a nation grappling with such extreme water scarcity, desalination emerges as the only viable and promising solution to secure Jordan’s future. In the base year 2015, the results of the energy calculations of the studied conveyance network showed that the Zai–Amman and Zara Maeen–Amman conveyances were the highest energy consumers, with the high specific energy intensity of 4.96 kWh/m3 and 5.59 kWh/m3, respectively. The Disi to Maan Junction also consumed a large amount of energy, with less specific energy consumption. The total energy consumption in the base year was 1496.7 kWh. The energy intensities for water conveyance and water treatment were 7.11 kWh/m3 and 0.5 kWh/m3, respectively. The energy intensity for the water conveyance is expected to decline if supply enhancement solutions would be applied while the energy intensity for the water treatment is expected to increase due to high dependency on water desalination in the future.
The developed scenarios showed different high energy consumption amounts based on the transferred water; however, the energy requirements are constrained by the scarcity of water in all scenarios. According to all scenarios, the energy consumption is expected to double by the year 2050 and reach more than 3170 GWh. However, the “Continue with the Same Water Use Behavior” scenario offers less total energy consumption through the study period, as compared to the reference and management scenario 1. It does not distribute the water equitably, as most governorates have low living standards in terms of the water use. Management scenario 2 represents the ideal scenario in terms of the water distribution and energy consumption. Yet, implementing this scenario requires significant efforts and resources to apply the proposed management options.
5. Limitations of the Study
This study provides a national-level assessment of the future energy demand for Jordan’s main water conveyance infrastructure. However, several limitations should be acknowledged. First, the analysis focused exclusively on the main water systems managed by public utilities. It did not account for secondary water, particularly private agricultural pumping, which is widespread in rural areas but difficult to quantify due to unregulated practices and the absence of consistent energy consumption data. Second, the temporal scope of the data were limited to figures available up to 2015. Although we intended to incorporate more recent data, these figures were not publicly available at the time of writing. Consequently, Table 3 and Table 4 are based on earlier referenced sources.
Additionally, while climate change risks such as declining rainfall and rising temperatures were discussed qualitatively, the study did not include climate scenario modeling or quantitative projections due to scope limitations and a lack of localized inputs for integration into the WEAP model. Furthermore, although multiple future scenarios were developed to explore potential energy trajectories, the study did not include an efficiency comparison or optimization across scenarios. Sensitivity analysis of key drivers such as energy prices, technological advancements, and population dynamics was also beyond the scope. Finally, this study was conducted within the framework of a master’s research project, which imposed certain constraints on data access, modeling resources, and the ability to expand the timeline or analytical depth. Future work should aim to address these gaps by leveraging new datasets, expanding spatial and temporal coverage, and applying comparative or multi-criteria evaluation frameworks.
Future Work and Policy Implications
Under the management scenarios modeled in this study, conveyance energy demand is projected to double by 2050 if current practices continue. This surplus energy requirement places significant pressure on Jordan’s national electricity grid, which is already strained and heavily reliant on imported fossil fuels. Increased water-related electricity consumption may lead to trade-offs with other critical sectors, including health, industry, and education—especially during peak demand periods—or fuel supply interruptions. climate risks is projected to decrease average annual rainfall 15% to 20% by 2050, while temperatures may rise by 1.5–2.5 °C, increasing both water scarcity and evaporation losses [49,50]. Such shifts would likely increase the energy needed for water conveyance due to reduced gravity-fed options and a greater dependence on pumped sources. As a result, future planning should integrate climate-resilient infrastructure design and renewable energy expansion to buffer against these compounded risks. Our findings suggest that Jordan pursue a variety of actional policy steps to address these challenges:
- Implement renewable energy systems (solar PV and wind) at key pumping stations to reduce energy dependency [47,48].
- Integrate renewable sources across pumping stations with the highest levels of energy consumption.
- Install VSDs and SCADA systems on pumps for better monitoring and optimizing of existing systems.
- Complement improvements to infrastructure with initiatives to improve water distribution efficiency and reduce leakages.
- Shift water allocation toward lower-energy-use sources when possible.
- Exploit the mountainous terrain to install inline turbines that can generate electricity using gravity along the path of the conveyance system.
- Cross-sectoral planning and inclusion of water-energy interactions in national energy strategies will be essential to reducing the long-term economic and environmental burden of water conveyance.
- More detailed data would improve the accuracy of energy calculations of the conveyance system and reduce the need for researchers and planners to make assumptions regarding key system parameters: annual energy consumptions, pump efficiencies, pump curves, and pipe materials for conveyance lines.
- Energy auditing will be required for system links with high energy and specific energy consumption. More detailed data and site visits would be part of the auditing to provide elaborate insight and optimization alternatives.
- Conduct a multi-criteria site selection analysis can be applied to specify the best suggested locations for wind and solar energy alternatives for the system.
Author Contributions
Conceptualization, A.A.-K., S.T. and C.K.; methodology, S.T. and A.A.-K.; software, A.A.-K.; validation, A.A.-K.; formal analysis, A.A.-K.; investigation, A.A.-K.; resources, S.T. and C.K.; data curation, A.A.-K., S.T. and C.K.; writing—original draft preparation, A.A.-K.; writing—review and editing, S.T. and C.K.; visualization, A.A.-K.; supervision, S.T. and C.K.; project administration, S.T. and C.K. All authors have read and agreed to the published version of the manuscript.
Funding
This research did not receive any grant or funding.
Data Availability Statement
The original contributions presented in this study are included in the article. Further inquiries can be directed to the corresponding author(s).
Acknowledgments
We thank Miyahuna Water Company, the Yarmouk Water Company, and Jordan’s Ministry of Water and Irrigation for providing valuable data for our analysis. We express our gratitude to Bernd Klauer from the Helmholtz-Center for Environmental Research (UFZ) for his support and Raphael Karutz for his valuable assistance in reviewing the paper.
Conflicts of Interest
The authors declare no conflicts of interest.
Abbreviations
The following abbreviations are used in this manuscript:
| MWI | Ministry of Water and Irrigation Digital Publishing Institute |
| WEF | Water–Energy–Food (nexus) |
| MCM | Million cubic meters (of water) |
| DEM | Digital Elevation Model |
| GWh | Gigawatt hours |
| RO | Reverse Osmosis |
| RSDS | Red Sea, Dead Sea (project) |
References
- Hoff, H. Understanding the Nexus. In Background Paper for the Bonn 2011 Conference: The Water, Energy, and Food Nexus; Stockholm Environment Institute: Stockholm, Sweden, 2011. [Google Scholar]
- Spang, E.S.; Moomaw, W.R.; Gallagher, K.S.; Kirshen, P.H.; Marks, D.H. The water consumption of energy production: An international comparison. Environ. Res. Lett. 2014, 9, 105002. [Google Scholar] [CrossRef]
- Albatayneh, A.; Hindiyeh, M.; Alamawi, R. Potential of Renewable Energy in Water-Energy-Food Nexus in Jordan. Energy Nexus 2022, 7, 100140. [Google Scholar] [CrossRef]
- Maftouh, A.; Fatni, O.; Fayiah, M.; Liew, R.K.; Lam, S.S.; Bahaj, T.; Butt, M.H. The Application of Water-Energy Nexus in the Middle East and North Africa (MENA) Region: A Structured Review. Appl. Water Sci. 2022, 12, 83. [Google Scholar] [CrossRef]
- Griffiths-Sattenspiel, B.; Wilson, W. The Carbon Footprint of Water; The River Network: Portland, OR, USA, 2009. [Google Scholar]
- Cohen, R.; Nelson, B.; Wolff, G. Energy Down the Drain: The Hidden Costs of California’s Water Supply; Natural Resources Defense Council: Oakland, CA, USA, 2004. [Google Scholar]
- Wilkinson, R. Methodology for Analysis of the Energy Intensity of California’s Water Systems, and an Assessment of Multiple Potential Benefits Through Integrated Water-Energy Efficiency Measures; California Institute for Energy Efficiency: Berkeley, CA, USA, 2000. [Google Scholar]
- Stokes, J.; Horvath, A. Life Cycle Energy Assessment of Alternative Water Supply Systems. Int. J. Life Cycle Assess. 2006, 11, 335–343. [Google Scholar] [CrossRef]
- Lundie, S.; Peters, G.M.; Beavis, P.C. Life Cycle Assessment for Sustainable Metropolitan Water Systems Planning. Environ. Sci. Technol. 2004, 38, 3465–3473. [Google Scholar] [CrossRef]
- Ramirez, C.; Almulla, Y.; Nerini, F.F. An Assessment of Strategies for Sustainability Priority Challenges in Jordan Using a Water-Energy-Food Nexus Approach. Discov. Sustain. 2022, 3, 3–23. [Google Scholar] [CrossRef]
- Liu, Y.; Chen, B. Water-Energy Scarcity Nexus Risk in the National Trade System based on Multiregional Input-Output and Network Environ Analyses. Appl. Energy 2020, 268, 114974. [Google Scholar] [CrossRef]
- Hansen, L.G. Water and Energy Price Impacts on Residential Water Demand in Copenhagen. Land Econ. 1996, 72, 66–79. [Google Scholar] [CrossRef]
- Purwanto, A.; Susnik, J.; Suryadi, F.X.; Fraiture, C. Quantitative Simulation of the Water-Energy-Food Security Nexus in a Local Planning Context in Indonesia. Sustain. Prod. Consum. 2021, 25, 198–216. [Google Scholar] [CrossRef]
- Albatayneh, A. Water Energy Food Nexus to Tackle Climate Change in the Eastern Mediterranean. Air Soil Water Res. 2023, 16, 11786221231170222. [Google Scholar] [CrossRef]
- Sabella, R.; Veen, W.; Wesenbeeck, L.; Sonneveld, B. The Water-Energy-Food Nexus in a Farm Model for the Jordan River Basin: Introducing Solar Panels on Farmland; Amsterdam Centre for World Food Studies: Amsterdam, The Netherlands, 2020. [Google Scholar]
- Schuck, E.C.; Green, G.P. Supply-based Water Pricing in a Conjunctive use System: Implications for Resource and Energy use. Resour. Energy Econ. 2002, 24, 175–192. [Google Scholar] [CrossRef]
- Antipova, E.; Zyryanov, A.; McKinney, D.; Savitsky, A. Optimization of Syr Darya Water and Energy Uses. Water Int. 2002, 27, 504–516. [Google Scholar] [CrossRef]
- International Labor Organization: Jordan. Available online: https://www.ilo.org/projects-and-partnerships/projects/partnership-improving-prospects-forcibly-displaced-persons-and-host/countries/jordan#:~:text=The%20second%20highest%20share%20of%20refugees%20per%20capita%20in%20the%20world&text=In%20real%20terms%2C%20this%20means,hosting%20country%20per%20capita%20worldwide (accessed on 25 January 2025).
- Rajsekhar, D.; Gorelick, S.M. Increasing Drought in Jordan: Climate Change and Cascading Syrian Land-use Impacts on Reducing Transboundary Flow. Sci. Adv. 2017, 3, e1700581. [Google Scholar] [CrossRef] [PubMed]
- Klauer, B.; Küblböck, K.; Omann, I.; Karutz, R.; Klassert, C.; Zhu, Y.; Zozmann, H.; Smilovic, M.; Talozi, S.; Figueroa, A.J.; et al. Stakeholder Workshops Informing System Modeling—Analyzing the Urban Food–Water–Energy Nexus in Amman, Jordan. Sustainability 2022, 14, 11984. [Google Scholar] [CrossRef]
- Jordanian Ministry for Water and Irrigation. Facts and Figures: 2022; Jordanian Ministry for Water and Irrigation: Amman, Jordan, 2022.
- Meinzer, O.E. Geological Survey Water Supply Paper 494: Outline of Groundwater Hydrology; United States Department of the Interior: Washington, DC, USA, 1923.
- Jordanian Ministry of Water and Irrigation. Jordan Water Sector: Facts and Figures; Jordanian Ministry of Water and Irrigation: Amman, Jordan, 2020.
- Yoon, J.; Klassert, C.; Selby, P.; Lachaut, T.; Knox, S.; Avisse, N.; Harou, J.; Tilmant, A.; Klauer, B.; Mustafa, D.; et al. A Coupled Human-natural System Analysis of Freshwater Security Under Climate and Population Change. Proc. Natl. Acad. Sci. USA 2021, 118, e2020431118. [Google Scholar] [CrossRef]
- Hightower, M.; Pierce, S.A. The Energy Challenge. Nature 2008, 452, 285–286. [Google Scholar] [CrossRef]
- International Energy Agency. Water Energy Nexus; International Energy Agency: Paris, France, 2017. [Google Scholar]
- Al-Masri, R.A.; Chenoweth, J.; Murphy, R.J. Exploring the Status Quo of Water-Energy Nexus Policies and Governance in Jordan. Environ. Sci. Policy 2019, 100, 192–204. [Google Scholar] [CrossRef]
- Jordanian Ministry of Energy and Mineral Resources. Annual Report; Jordanian Ministry of Energy and Mineral Resources: Amman, Jordan, 2021.
- Sandri, S.; Hussein, H.; Alshyab, N. Sustainability of the Energy Sector in Jordan: Challenges and Opportunities. Sustainability 2020, 12, 10465. [Google Scholar] [CrossRef]
- Kumar, M.D. Impact of Electricity Prices and Volumetric Water Allocation on Energy and Groundwater Demand Management: Analysis from Western India. Energy Policy 2005, 33, 39–51. [Google Scholar] [CrossRef]
- Hoff, H.; Alrahaife, S.A.; el Hajj, R.; Lohr, K.; Mengoub, F.E.; Farajalla, N.; Fritzsche, K.; Jobbins, G.; Özerol, G.; Schultz, R.; et al. A Nexus Approach for the MENA Region—From Concept to Knowledge to Action. Front. Environ. Sci. 2019, 7, 48. [Google Scholar] [CrossRef]
- Jordanian Ministry of Water and Irrigation. Energy Efficiency and Renewable Energy Policy; Jordanian Ministry of Water and Irrigation: Amman, Jordan, 2016.
- Wakeel, M.; Chen, B.; Hayat, T.; Alsaedi, A.; Ahmad, B. Energy Consumption for Water Use Cycles in Difference Countries: A Review. Appl. Energy 2016, 178, 868–885. [Google Scholar] [CrossRef]
- Fayiah, M.; Dong, S.; Singh, S.; Kwaku, E.A. A Review of Water-Energy Nexus Trends, Methods, Challenges, and Future Prospects. Int. J. Energy Water Resour. 2020, 4, 91–107. [Google Scholar] [CrossRef]
- Jordanian Ministry of Water and Irrigation. National Water Strategy: 2016–2025; Jordanian Ministry of Water and Irrigation: Amman, Jordan, 2016.
- Miyahuna Website: Who We Are? Miyahuna Official Website. Available online: https://www.miyahuna.com.jo/En/Pages/About_Us (accessed on 4 March 2021).
- Ministry of Water and Irrigation (MWI). Row Data Form Jordan Water Project ‘Unpublished’ Jordan; Ministry of Water and Irrigation: Amman, Jordan, 2017.
- Jordanian Ministry of Water and Irrigation. Water Sector Capital Investment Plan 2016–2025; Jordanian Ministry of Water and Irrigation: Amman, Jordan, 2016.
- Food Water Energy for Urban Sustainable Environments (FUSE). Standford Doerr School of Sustainability. Available online: https://fuse.stanford.edu/ (accessed on 20 March 2021).
- Rogers, P.; Jalal, K.; Boyd, J. An Introduction to Sustainable Development; Earthscan: London, UK, 2008. [Google Scholar]
- Houghtalen, R.J.; Akan, A.O.; Hwang, N.H.C. Fundamentals of Hydraulic Engineering Systems, 4th ed.; Prentice Hall: Boston, MA, USA, 2010. [Google Scholar]
- Dabbagh, T. The Management of Desalinated Water. Desalination 2001, 135, 7–23. [Google Scholar] [CrossRef]
- Kertolli, E.; Prosperi, P.; Harbouze, R.; Moussadek, R.; Echchgadda, G.; Belhouchette, H. The water–energy–food–ecosystem nexus in North Africa dryland farming: A multi-criteria analysis of climate-resilient innovations in Morocco. Agric. Food Econ. 2024, 12, 34. [Google Scholar] [CrossRef]
- El-Fadel, M.; Maroun, R. Virtual Water Trade as an Adaptation Method to the Impact of Climate Change on Water Resources in the Middle East. In Climatic Changes of and Water Resources in the Middle East and North Africa; Zereini, F., Hötzl, H., Eds.; Springer: Berlin/Heidelberg, Germany, 2008. [Google Scholar]
- Cohen, E. The Israeli Water Policy and Its Challenges During Times of Emergency. Water 2024, 16, 2996. [Google Scholar] [CrossRef]
- Miyahuna Water Company. Annual Electricity Report; Miyahuna Water Company: Amman, Jordan, 2015. [Google Scholar]
- International Renewable Energy Agency. Renewable Energy in the Water, Energy, and Food Nexus; International Renewable Energy Agency: Abu Dhabi, United Arab Emirates, 2015. [Google Scholar]
- Schnetzer, J.; Pluschke, L. Solar-Powered Irrigation Systems: A Clean-Energy, Low-Emission Option for Irrigation Development and Modernization; Global Alliance for Climate-Smart Agriculture & the Food and Agriculture Organization of the United Nations: Rome, Italy, 2017. [Google Scholar]
- United Nations Development Program. Climate Change Risk Assessment for Jordan; United Nations Development Program: New York, NY, USA, 2021. [Google Scholar]
- United States Agency for International Development—Jordan. Climate Change Adaptation and Water in Jordan; United States Agency for International Development—Jordan: Amman, Jordan, 2020. [Google Scholar]
Disclaimer/Publisher’s Note: The statements, opinions and data contained in all publications are solely those of the individual author(s) and contributor(s) and not of MDPI and/or the editor(s). MDPI and/or the editor(s) disclaim responsibility for any injury to people or property resulting from any ideas, methods, instructions or products referred to in the content. |
© 2025 by the authors. Licensee MDPI, Basel, Switzerland. This article is an open access article distributed under the terms and conditions of the Creative Commons Attribution (CC BY) license (https://creativecommons.org/licenses/by/4.0/).