Article

Distribution Patterns and Human Exposure Risks of Microplastics in Dominant Wild Edible Shrimp: A Case Study of Haizhou Bay Marine Ranch

1
College of Oceanography and Ecological Science, Shanghai Ocean University, Shanghai 201306, China
2
Environmental Monitoring and Evaluation Center, Shanghai Ocean University, Shanghai 201306, China
3
School of Civil Enigeering, Kashi University, Kashi 844008, China
4
College of Marine Living Resource Sciences and Management, Shanghai Ocean University, Shanghai 201306, China
5
Joint Laboratory for Monitoring and Conservation of Aquatic Living Resources in the Yangtze Estuary, Shanghai 202150, China
6
Atmosphere and Ocean Research Institute, The University of Tokyo, Kashiwa 277-8564, Chiba, Japan
*
Author to whom correspondence should be addressed.
Water 2025, 17(10), 1495; https://doi.org/10.3390/w17101495
Submission received: 26 March 2025 / Revised: 17 April 2025 / Accepted: 8 May 2025 / Published: 15 May 2025
(This article belongs to the Section Water, Agriculture and Aquaculture)

Abstract

:
“Edible wild shrimp” play a crucial role in marine ecosystems and food chains, yet research on microplastic (MP) impacts on the dominant shrimp species of the Haizhou Bay Marine Ranch remains scarce. This study examined shrimp from Haizhou Bay, evaluating the distribution, nutritional characteristics, and health risks associated with microplastics in their tissues. Analytical techniques included Fourier transform infrared spectroscopy, the hot needle method, stable isotope analysis, and microplastic risk assessment. The results revealed that microplastics comprised 40.93% of all particles identified, with Oratosquilla oratoria exhibiting the highest intestinal contamination, followed by Alpheus distinguendus. Most MPs were fibrous (86.3%), predominantly blue (57.32%), and approximately 80% consisted of Polyethylene Terephthalate. Significant interspecies differences were observed in the gastrointestinal distribution of MPs, while individuals of the same species showed no notable differences across body-length groups due to molting. The estimated daily intake and margin of exposure for human consumers remained well below the no-observed-adverse-effect level, suggesting negligible health risks. These findings provide a theoretical and empirical basis for understanding the migration, sources, and ecological implications of microplastics in shrimp, offering valuable insights for assessing nearshore environmental pollution and food web dynamics.

1. Introduction

As we all know, plastics are widely used in various fields, such as healthcare, construction, cosmetics, and fishing equipment. In 2023, due to mass plastic production and waste mismanagement, global plastic production reached 430 million tons [1,2,3]. Meanwhile, plastics ultimately enter the ocean through multiple pathways, including river input, coastal tourism, aquaculture and fishing activities, atmospheric deposition, and ship transportation. Rivers convey 0.8–2.7 million metric tons of plastics annually, with the top 20 polluting rivers (primarily in Asia) contributing 67% of global riverine plastic flux [4]. Beaches in Zanzibar, Tanzania, exhibit 48.5% higher MP concentrations during peak tourist seasons, predominantly from packaging materials and degraded recreational gear [5]. Studies estimate that approximately 18% of marine plastic debris originates from fisheries, predominantly derived from abandoned, lost, or otherwise discarded fishing gear [6]. Among these, purse seine ropes are identified as some of the most significant contributors to oceanic plastic pollution, generating approximately 311 metric tons of microplastics annually through mechanical degradation [7]. Recent modeling estimates suggest that 1.3 × 10⁴ to 2.5 × 10⁷ metric tons of micro- and nanoplastics undergo atmospheric transport annually through the marine atmospheric boundary layer, with subsequent deposition into ocean basins [8]. It is estimated that over 5.25 trillion tons of plastic waste are floating in the ocean, with microplastics (MPs) being the dominant component [9]. In marine ecosystems, plastic waste gradually degrades into smaller fragments (<5 mm) through photodegradation, ultraviolet radiation, mechanical wear, and biodegradation. These MPs can act as carriers for persistent organic pollutants (POPs), heavy metals, and pathogens, allowing these harmful substances to enter marine organisms from the surrounding environment [10,11,12,13]. Therefore, a new global environmental crisis caused by plastic waste—“MP pollution”—is constantly increasing environmental pressure. MPs can directly or indirectly threaten the survival and growth of marine organisms [14,15]. For example, microplastics and plasticizers increased the risk of hepatotoxicity in zebrafish [16]. In addition, a recent study confirmed that long-term exposure to MPs in zebrafish caused anxiety-like behavior and cognitive impairment, which may be related to the disruption of the gut–liver–brain axis, thus inducing inflammation and disrupting the normal functioning of the body [17]. Their presence has been confirmed in nearly all marine environments, from the equator to the polar regions, including seawater and sediments [18,19].
According to reports, a wide range of marine organisms, including plankton, mollusks, crustaceans, fish, shellfish, and whales, have been found to ingest MPs [20,21,22,23,24,25]. Shrimp, as large crustaceans with significant economic and commercial value, are particularly vulnerable to MP contamination [26]. MPs enter shrimp through their diet, which includes polychaetes, mollusks, small crustaceans, arthropods, annelids, and fish larvae, and can induce mechanical obstruction in their gastrointestinal tracts [18,27]. In marine ecosystems, shrimp play a crucial role in the nutrient transfer of MPs, as they serve as prey for higher-trophic-level predators and are also caught for human consumption [28]. This poses concerns for human health, as many people consume whole shrimp, especially small ones, without removing their digestive organs. As a result, shrimp contaminated with MPs provide a direct pathway for human exposure to MPs through dietary intake [26].
Meanwhile, edible wild shrimp are also considered important bioindicators of habitat environmental quality, reflecting the degree of environmental pollution. Their role in the food chain transfer and accumulation of MPs in seafood highlights potential risks to food security and human health.
At present, although MPs have been found in various shrimp species in different regions, including Fenneropenaeus indicus (H. Milne-Edwards, 1837), Penaeus monodon (Fabricius, 1798), Aristeus antennatus (Risso, 1816), Pleoticus muelleri (Bate, 1888), Euphasuia superba (Dana 1852), and Crangon Crangon (Linnaeus, 1758) [1,26,27,28,29,30], there is still a need for extensive research to assess MP pollution levels in shrimp populations.
Previous studies have investigated the presence of MPs in seawater, sediments, and marine organisms in the Haizhou Bay Marine Ranch [21,31]; however, no direct evidence has been reported for MPs in wild shrimp from this area. The abundance of MPs in sediments and seawater was 3.09 ± 1.16 n/g and 8.78 ± 3.15 n/m3, respectively [31]. The abundance of MPs ingested by fish was 2.98 ± 2.64 pieces/fish, which was much lower than that in water and sediment [21]. Monitoring MPs in seawater and sediments alone cannot accurately reflect the levels of MPs in shrimp organisms or assess their potential health impacts on humans. Therefore, this study aimed to (1) analyze the distribution characteristics of prominent shrimp gastrointestinal MPs in the Haizhou Bay Marine Ranch and determine the pollution status of MPs, (2) analyze the correlation and differences between MP abundance and body length/weight and nutritional level based on stable isotope technology, and (3) conduct estimated daily intake and polymer hazard index risk assessments in relation to the pollution level of MPs in “edible wild shrimp”. These results will provide a theoretical basis and new insights for future research on MPs ingested along the coast, as well as supporting data for further understanding the accumulation and amplification mechanisms of MPs in the marine food web.

2. Materials and Methods

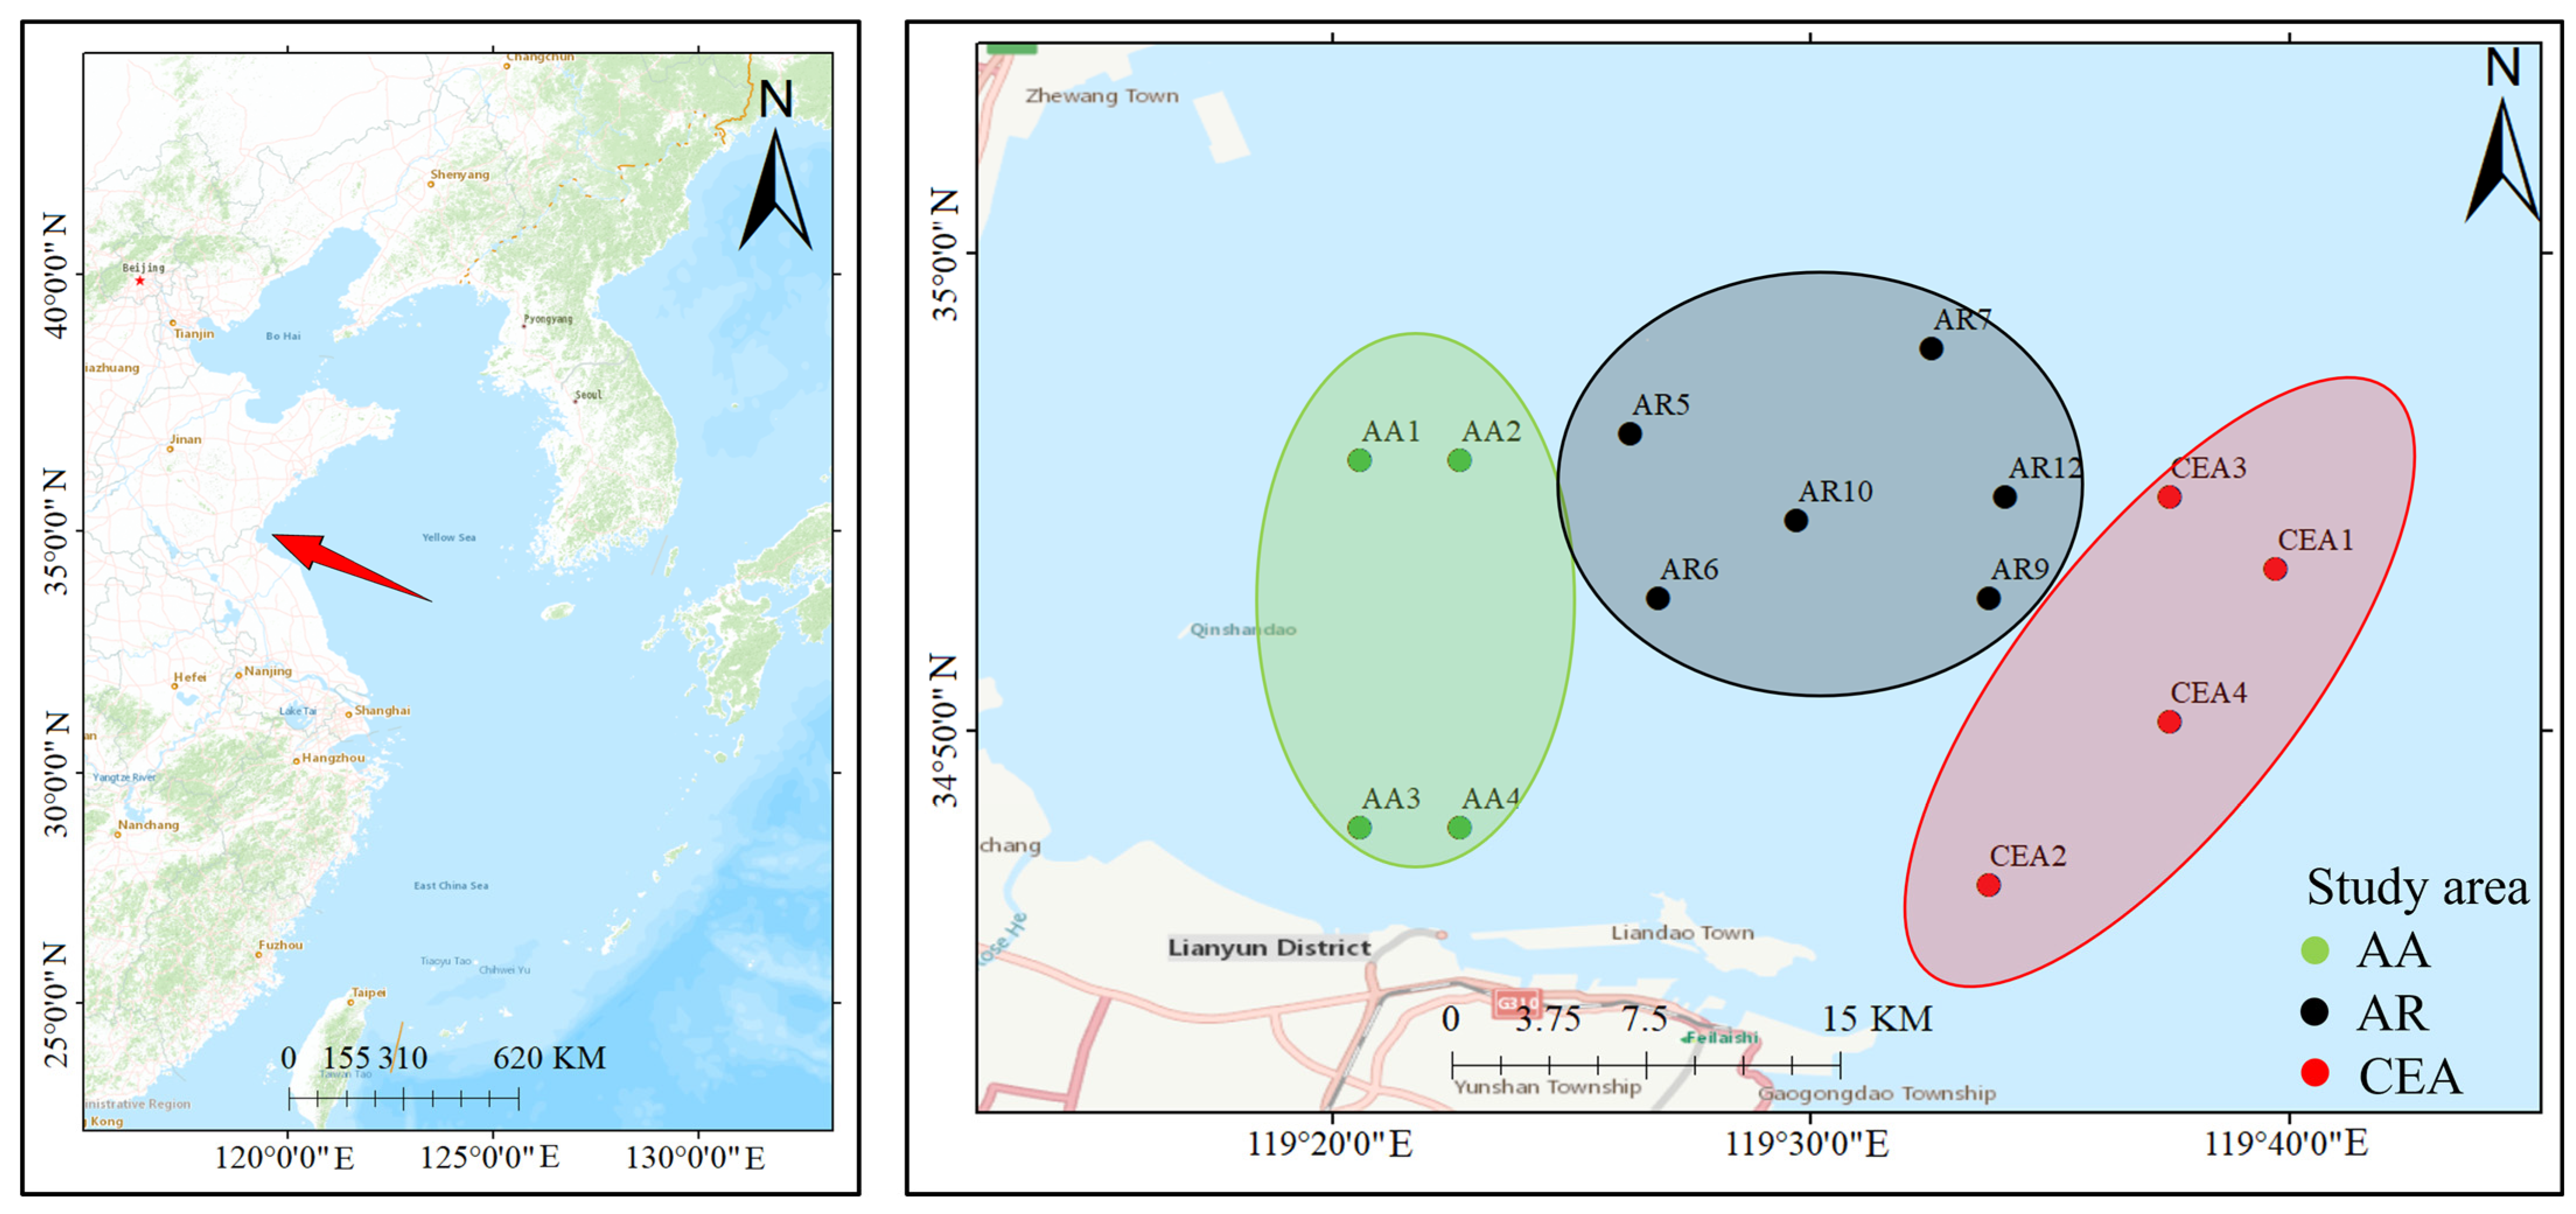
2.1. Survey Area and Sampling Collection

The survey was conducted in November 2021 using a single bottom trawl (15 × 4 × 8 m; mesh size: 1 × 1 cm) in the artificial reef area and adjacent waters of Haizhou Bay (34°49.20′ N–34°55.00′ N, 119°16.167′ E–119°50.00′ E), where three main survey areas were set up: an artificial reef area (AR), an aquaculture area (AA), and a comprehensive effect area (CEA) (Figure 1). The AA is mainly used for the aquaculture of shellfish and algae; the AR is a protected area composed of a series of underwater reefs; and the CEA denotes a coastal ecotone characterized by the coexistence of multiple benthic habitats subject to synergistic pressures from anthropogenic activities and hydrodynamic forcing. The southern CEA hosts intensive mariculture of Pacific oysters (Crassostrea gigas) and nori seaweed (Pyropia yezoensis), which alter the sediment organic carbon flux. To the west, an artificial reef complex elevates fish biomass. Eastern waters could be influenced by the Yellow Sea Cold Current. To remove sediment adhering to the samples’ surfaces during the trawl fishing, the samples were rinsed repeatedly with clear seawater until their surfaces were clean. In this study, O. oratoria (Kemp, 1911), a member of the Stomatopoda, is classified under wild edible shrimp based on two main considerations. First, although O. oratoria exhibits significant taxonomic differences from decapod shrimp, both groups share typical crustacean morphological features—including a segmented exoskeleton and a gill-based respiratory system—and the common name for O. oratoria can lead to cognitive confusion. Second, both groups represent important marine products in terms of edibility and market circulation, possessing similar eco-economic attributes. A total of 189 samples (6 species) were collected, and the types and quantities of the samples are shown in Table 1.
The Relative Importance Index (IRI) was used to analyze the dominance of shrimp species [32]. The calculation formula is as follows:
IRI = ( N + W ) · F
where N is the percentage of a certain shrimp species relative to the total catch of shrimp species (%), W is the percentage of the total mass of this species of shrimp relative to the total mass of captured shrimp (%), and F is the percentage of the number of sites where this shrimp species appears relative to the total number of survey sites (%). This article selected the species with IRIs > 1000 as the dominant species. All samples were euthanized as per the “Technical Specifications for Euthanasia in Animal Experiments” (RB/T 061-2021) [33]. In order to avoid contamination during transportation, after euthanizing the shrimp, every 20 shrimp were divided into groups, wrapped in three layers of aluminum foil, and stored in a freezer at −20 °C for further processing.

2.2. Sample Pretreatment

Firstly, all samples were thawed on a clean workbench (SW-CJ-2FD; Airtech, Tokio, Japan), and then the total length, the body length, and the weight of each shrimp’s carapace were measured. In order to investigate the correlation and differences between the abundance of MPs in shrimp and different total lengths, the samples were classified according to specific body-length groups. The classification of species based on total length was conducted according to the Chinese National Standard (GB/T 12763.6-2007) [34], which specifies that the total length of offshore fish is recorded at 1 cm intervals. Then, each shrimp was dissected using a surgical knife, forceps, and scissors to separate the stomach, intestines, and muscles tissues. The muscle samples were washed three times with distilled water, placed in centrifuge tubes, freeze-dried (Alpha 1–2 LDplus; Christ, Hagen, Germany) at −80 °C for approximately 24 h, and then ground into powder using a ball mill (F-MM400; Focucy, Changsha, China) for stable isotope analysis. The stomach and intestinal samples were directly placed into conical flasks for digestion.
Each shrimp’s stomach and intestinal samples were placed in a 100 mL conical flask, to which 20 mL of 30% H2O2 solution was added, with the volume adjusted according to the tissue weight [31,35]. To avoid contamination, the flask was immediately covered with aluminum foil. Then, it was placed in a shaking incubator (SHA-C; Lichen, Jinjiang, China) at 60 °C for 24 h (rotation speed: 100 rpm) [36]. The subsequent solution was filtered through a microporous membrane (5 μm, 47 mm; Longjin).

2.3. MP Extraction and FT–IR Identification

The filter membrane obtained after filtration was observed under a stereomicroscope (SMZ 745T; Nikon, Tokyo, Japan). The plastic particles or suspected microplastic particles were selected using the “hot needle test” [37]. Then, the size, shape, and color of the particles were photographed and recorded using the camera processing software ImageJ (V. 1.50). According to their length, the particle sizes of the MPs were divided into five categories: <1.0 mm, 1.0–2.0 mm, 2.0–3.0 mm, 3.0–4.0 mm, and 4.0–5.0 mm. This study did not include MPs less than 0.075 mm because they are challenging to detect and remove [38]. All MPs larger than 75 μm were examined to identify their composition at wavelengths between 4000 cm−1 and 400 cm−1.
The polymer types of the particles were identified using Fourier transform infrared spectroscopy (FTIR–ATR; Nicolet iN10, Thermo Fisher Scientific, Waltham, MA, USA). Next, OMNIC software (V. 8.2) was used to compare the scanned spectra with spectra in the database and analyze them to obtain the chemical compositions of the particles and to determine whether they were MPs [39]. The abundance of MPs in shrimp is represented by “n/ind”.

2.4. Quality Assurance and Control

To reduce experimental errors, the researchers wore pure-cotton lab coats and nitrile gloves during the whole experiment. To avoid secondary contamination, the utensils and tools used in the experiment were rinsed three times with deionized water and sealed and dried before use. A blank control was performed to account for MP pollution from the air during the experiment, and procedural blanks were performed in parallel with the samples. Ten blank samples were set, and no MPs were found on the filter membranes in the blank control [40,41].

2.5. Stable Isotope Analysis

The freeze-dried muscle tissue was analyzed using a Vario Isotope Cube Isotope elemental analyzer imported from Germany based on internationally recognized standard materials (PeeDee limestone for carbon and nitrogen) as reference standards. The calculation formulas for δ 13C and δ 15N are as follows [37,38]:
δ X = R sample R standard 1 × 10 3
where X is 13C or 15N and R is the ratio of 13C/12C or the ratio of 15N/14N. If a single sample’s carbon-to-nitrogen ratio was less than 3.7, no extraction experiment was conducted [42]. The formula for calculating nutritional grade is as follows:
TL = δ 15 N sample δ 15 N baseline TEF + 1
where TL is the trophic level of the calculated organism; δ15Nsample is the ratio of stable nitrogen isotopes; δ15Nbaseline is the baseline organism’s δ15N; and TEF is the Trophic Enrichment Factor between TLs, which is taken as 3.4 ‰ [43]. Particulate organic matter (POM) was used as the baseline organism in this study [21].

2.6. Bioaccumulation Factor Analysis

The organism’s trophic-level amplification factor (TMF) was measured in the accumulation pattern of MPs in shrimp organisms [36]. A linear regression curve was drawn to fit the logarithmic values of the MP intake in the shrimp samples to their δ15N values:
lgCI = a · δ 15 N + b
TMF = 10 a
where CI is the number of MPs ingested by shrimp in the stomach or intestines (n/ind), a is the slope, and b is the intercept. TMF value can be calculated by a. If TMF > 1, the number of MPs gradually increases with the increase in TL in the food chain, indicating trophic-level amplification; if TMF < 1, this indicates that the number of MPs gradually decreases with the increase in TL in the food chain, that is, nutrient dilution [44].

2.7. Risk Assessment

2.7.1. Polymer Hazard Index (H Score)

To assess the effects of MPs in dominant species on human health, the risk levels induced by MPs across dominant species were assessed based on MP abundance and the hazard associated with each polymer type. The polymer hazard index (H), adapted from established methodologies [45,46], was employed to evaluate the ecological risk of MP pollution. The index is calculated as follows:
PHI = P n × S n
where Pn is the percentage of specific polymers in the sample and Sn is the hazard coefficient for specific MP particles developed by Lithner et al. (2011) [45].

2.7.2. Estimated Daily Intake (EDI) and Margin of Exposure (MOE)

EDI has been used to assess the human health risks of MPs in seafood [47,48], representing the estimated daily MP intake (unit: g/kg BW/day). The per capita daily shrimp intake is 5.86 × 10⁻³ kg/per day [49]. The average weight of males and females aged 18 and above in China is 69.6 kg and 59 kg, respectively. The average mass of MPs is 2.8 × 10⁻⁶ g/n [50]. When humans eat shrimp, they usually remove the shrimp shell and the shrimp’s stomach, foregut, and midgut to reduce the risk of human ingestion of MPs in these parts [26]. However, people usually eat shrimp without removing the hindgut located in the muscles of shrimp [25], so the abundance of MPs ingested by humans is calculated based on the average abundance of MPs in each individual’s gut. EDI was calculated as follows:
EDI = A × B / BW
where A represents the MP content (g/kg) of shrimp (hindgut), B represents the daily consumption of shrimp (kg/d), and BW is the Chinese per capita weight (kg). The margin of exposure (MOE) was calculated as follows:
MOE = NOAEL   animal   study / EDI
Rodents are commonly used to predict human responses to toxic substances. According to the no-observed-adverse-effect level (NOAEL) for MPs in rodents, it is 0.025 g/kg BW/d [51]. MOE = 100 is used as the default uncertainty factor to calculate the NOAEL for animal studies (European Food Safety Authority (EFSA)’s 2005 proposal) [26], which is used to determine whether MPs have genotoxicity and carcinogenicity in human ingestion. MOE > 100 is considered to be within the healthy threshold for intake regarding genetic toxicity or carcinogenicity. The higher the MOE, the more significant the gap between exposure to the substance and any potential effects on human health [51].

2.8. Statistical Analysis

The abundance of MPs in shrimp gastrointestinal tracts (GITs) is expressed as n/ind. The Shapiro–Wilk test was used to test the normality of all data. The Kruskal–Wallis test was selected to test the differences in MP abundance among different shrimp species and organs. The Mann–Whitney U test was used to compare the differences in the abundance of MPs in the stomachs and intestines of the same shrimp species. The relationship between MP abundance and biological indicators of the sample was analyzed using the Spearman correlation coefficient. Clustering analysis based on Euclidean distance was used to analyze the relationship between MP abundance and samples of different body lengths. All data analysis was conducted using Excel 2021, “SPSS” (v 25.0), and R (v. 4.3.0). The significance level for all tests was 0.05, and the extreme significance level was set to 0.01.

3. Results

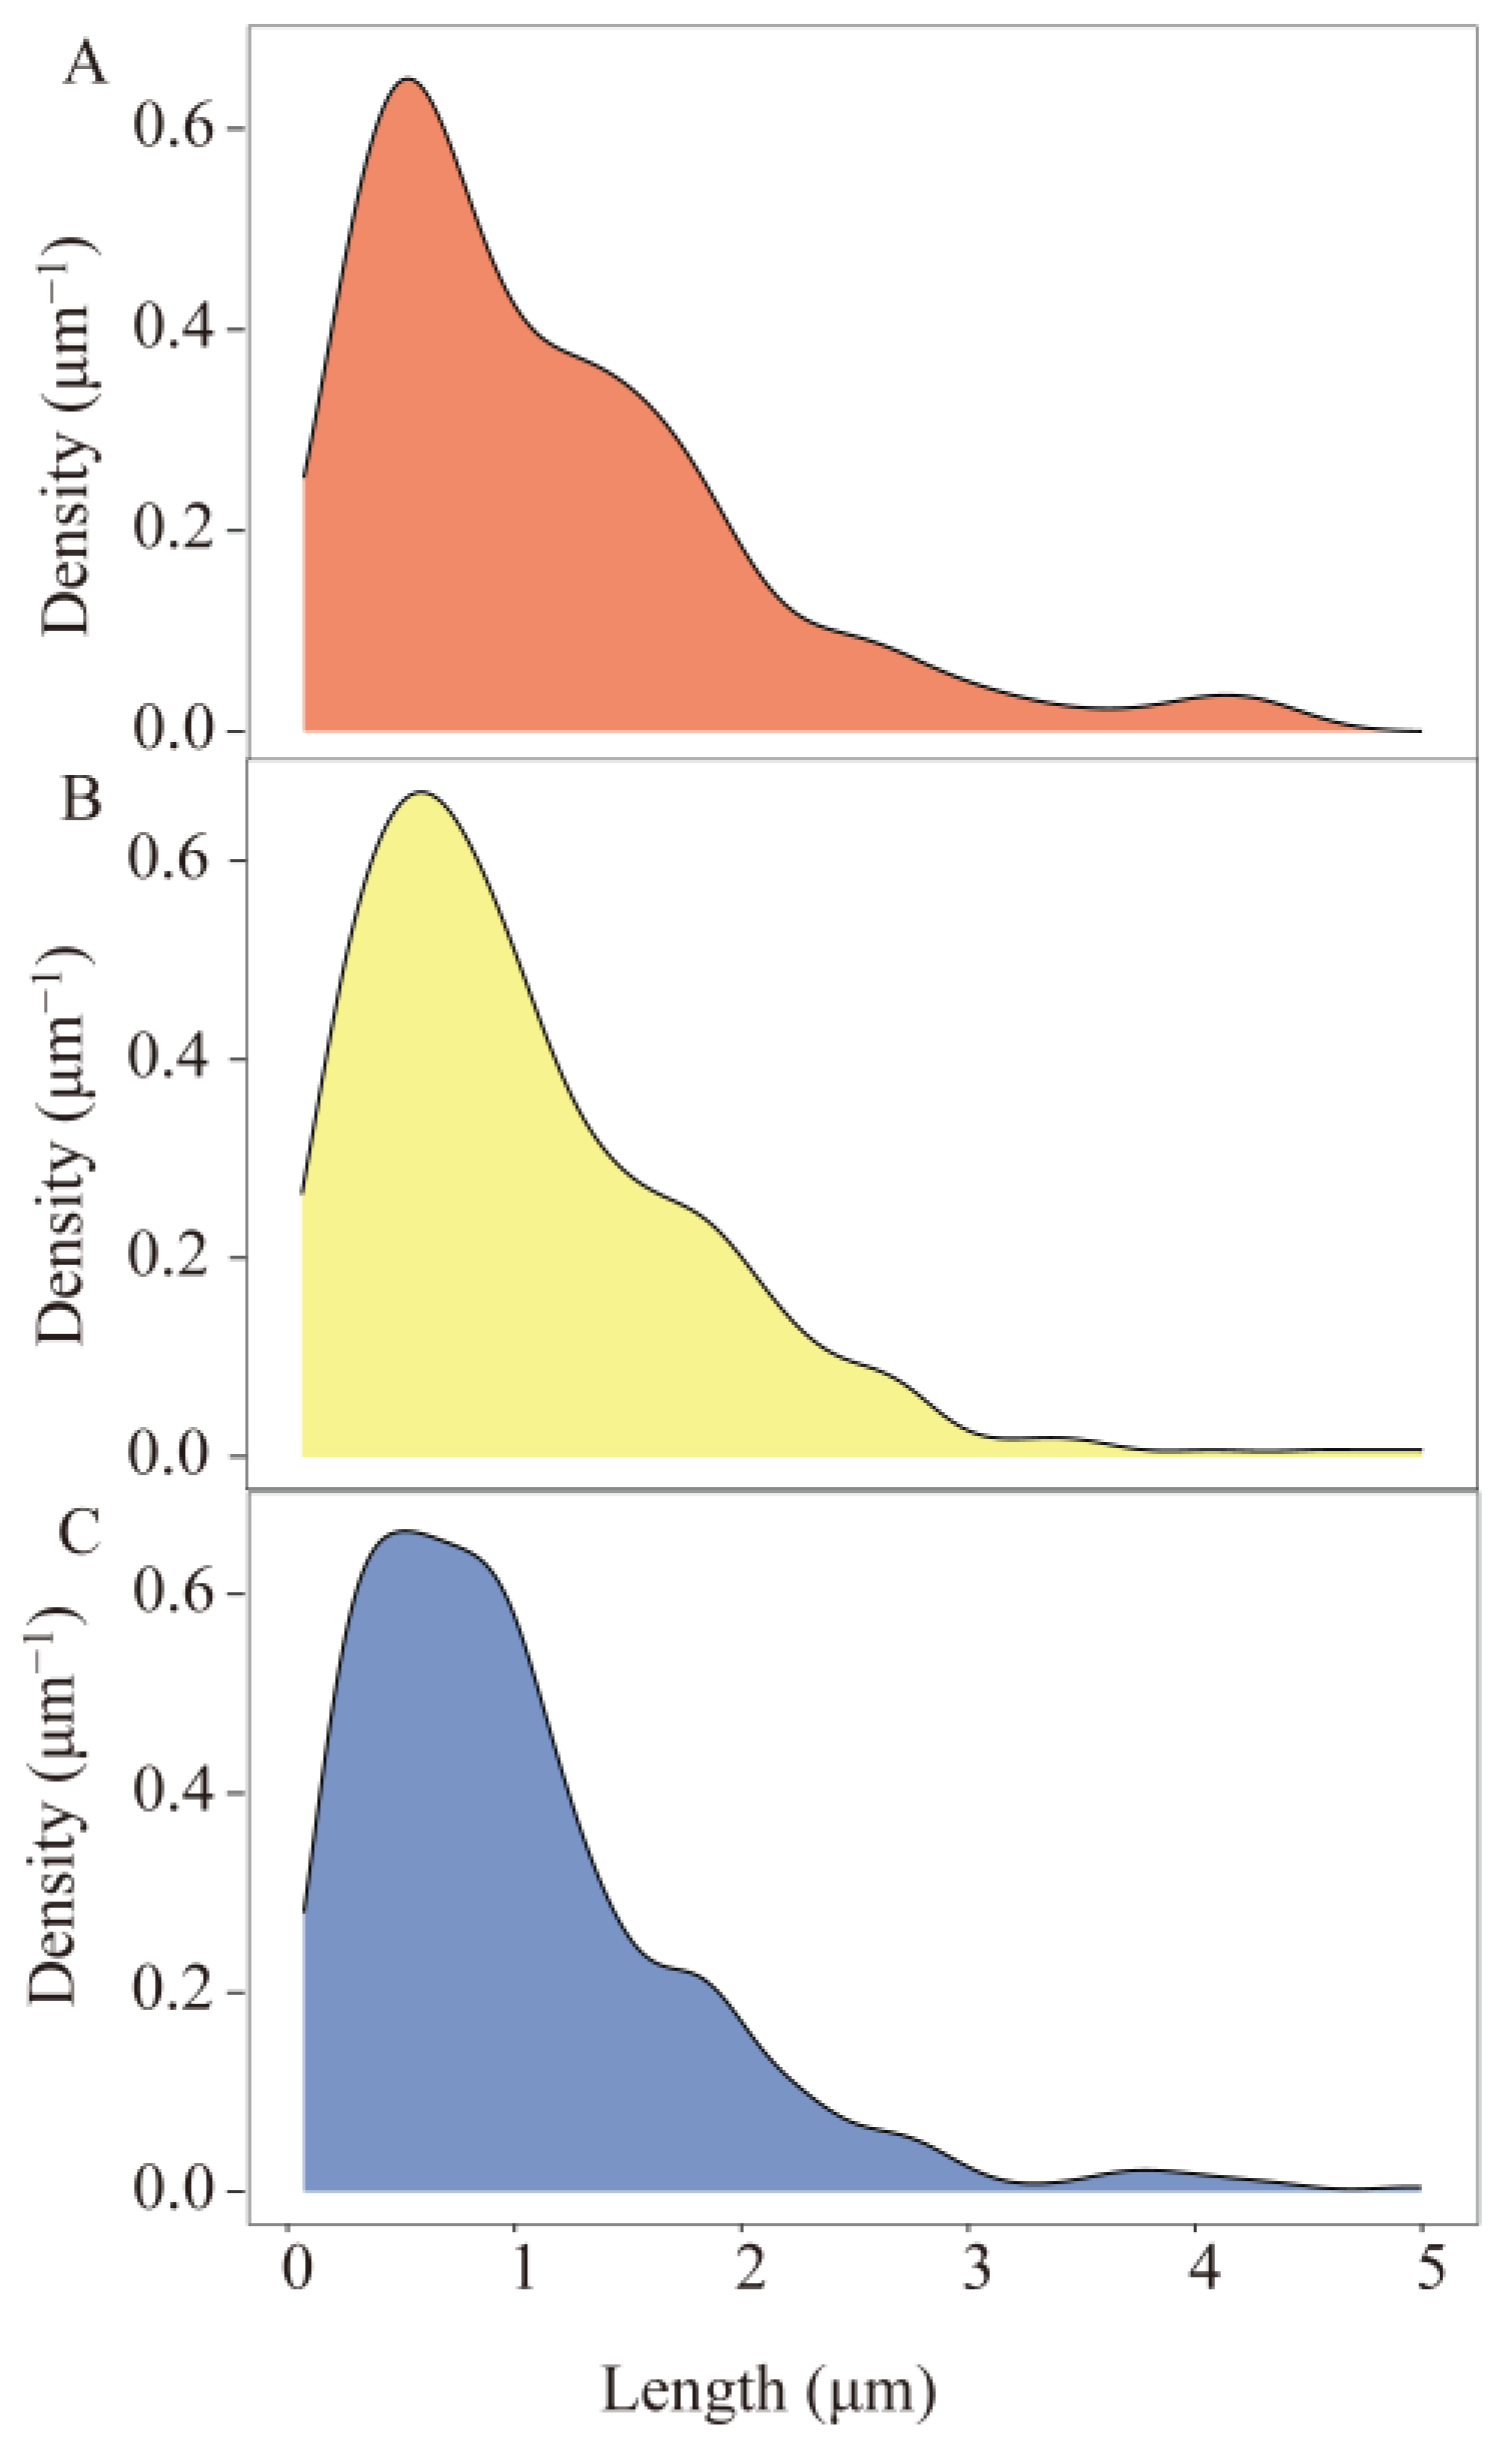
3.1. Morphological Characteristics of MPs in Shrimp

The number of MPs (n = 1277) detected by ATR-FTIR and the “hot needle method” in 189 shrimp accounted for 40.93% of the total identification. The distribution of MPs in different types of shrimp is shown in Figure 2. The number of MPs found in O. oratoria was the highest (42.44%), followed by A. distinguendus (28.06%), then A. japonicus (21.30%). Overall, the number of MPs in the stomach (59.36%) was higher than in the intestines (40.64%). From a morphological perspective, the MPs were mainly fibrous, accounting for 86.30%. Next were fragmented MPs, accounting for 11.20%. The primary color of MPs was blue (57.32%). The proportion of black MPs was 22.55%. From the perspective of MP material, PET accounted for nearly 80%. PET and PP MPs accounted for over 90% (PET: 79.17%, PP: 11.20%). MPs < 2 mm accounted for 88.17% of the total (<1 mm: 56.38%, 1–2 mm: 31.79%).

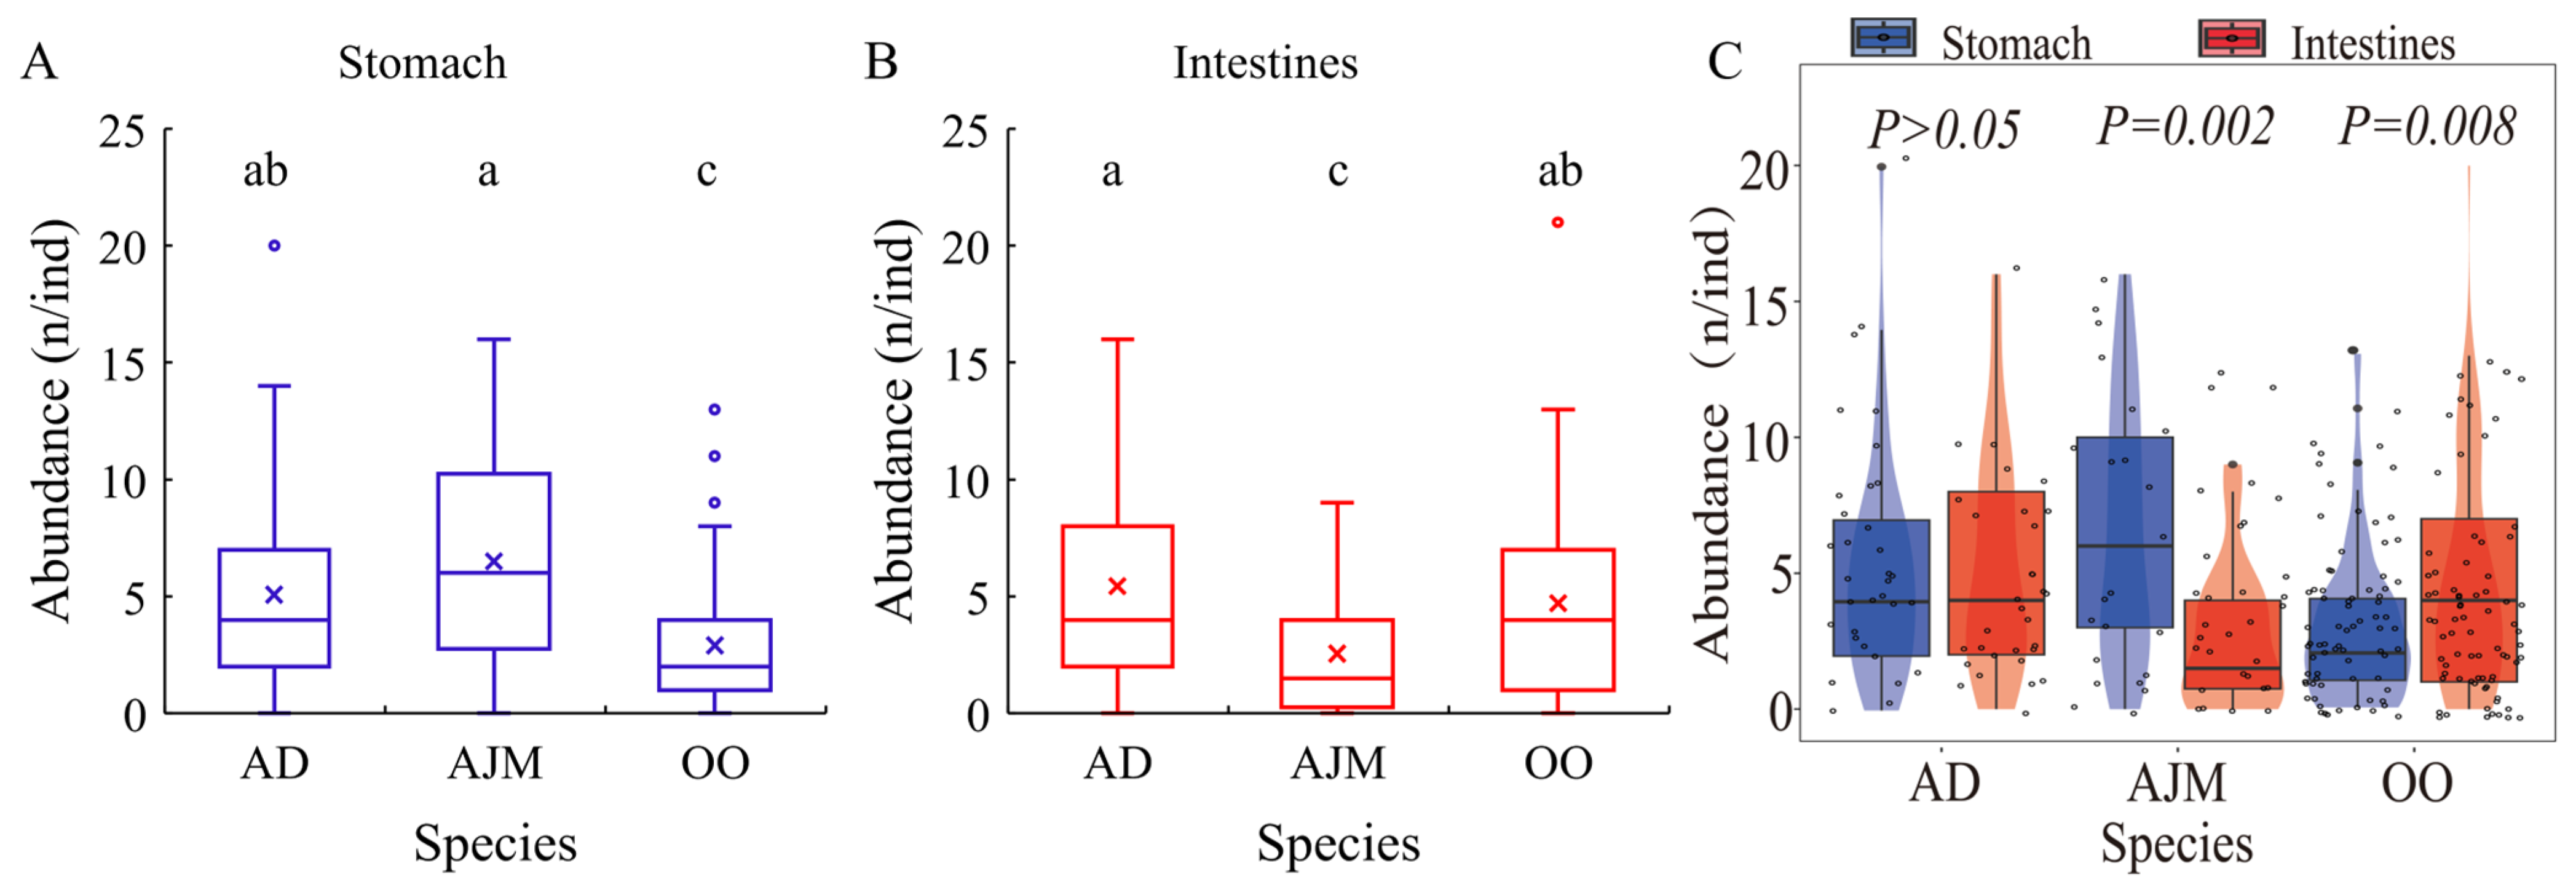
3.2. The Abundance and Distribution of MPs in Dominant Species

The results showed significant differences in the abundance of MPs in the stomachs of the three dominant species (Kruskal–Wallis, p < 0.05). As shown in Figure 3A, the abundance of MPs in A. japonicus and A. distinguendus was 6.50 ± 4.58 n/ind and 5.07 ± 3.94 n/ind, respectively, significantly higher than that of MPs in O. oratoria (2.90 ± 2.76 n/ind) (Kruskal–Wallis, P1 = 0.0001 < 0.05, P2 = 0.001 < 0.05). There was no significant difference in MP abundance in the stomach between A. japonicus and A. distinguendus (Kruskal–Wallis, p = 0.348 > 0.05). According to Figure 3B, the abundance of MPs in the intestines of A. japonicus (2.55 ± 2.56 n/ind) was significantly lower than that of A. distinguendus and O. oratoria (5.43 ± 4.21 n/ind, 4.71 ± 4.20 n/ind) (Kruskal–Wallis, P1 = 0.016 < 0.05, P2 = 0.03< 0.05), which illustrated that there was no significant difference in MP abundance in the intestines between A. distinguendus and O. oratoria (Kruskal–Wallis, p = 0.472 > 0.05). Figure 3C compares MP abundance in the GIT in the same species. The comparison results for MP abundance in the stomachs and intestines of three shrimp species were not the same. The MP abundance distributions in the stomach and intestines of A. distinguendus were similar (Mann–Whitney U, p = 0.827 > 0.05). The MP abundance in the stomach of A. japonicus was significantly higher than that in the intestines (Mann–Whitney U, p = 0.002 < 0.05). However, the MP abundance in the stomach of O. oratoria was significantly lower than that in the intestines (Mann–Whitney U, p = 0.008 < 0.05). There was no significant difference in MP abundance in the GIT between different body lengths of the same dominant species (Table 2).
From Figure 4, it can be seen that the size distribution of MPs in the three dominant species is similar and is mainly focused in the range of <2 mm. The peak nuclear density of the three advantageous MP sizes appears to be around 500 μm. When the particle size is less than 500 μm, the core density gradually increases with the increase in particle size. When the particle size of MPs is more significant than 500 μm, their nuclear density gradually increases with the increase in particle size.

3.3. The Relationship Between the Distribution of MPs and Biological Indicators

3.3.1. Distribution of MPs in the Gastrointestinal Tracts of Dominant Species in Different Body-Length Groups

The results of Euclidean clustering analysis (Figure 5) showed that for MPs in the stomach, O. oratoria of different body lengths belonged to the same cluster of 3–4 cm as A. japonicus; A. distinguendus of different body lengths were identical to 4–5cm A. japonicus; A. distinguendus and O. oratoria did not belong to the same category. A. japonicuss of 3–4 cm, 4–5 cm, and 5–6 cm belonged to different clusters. For MPs in the intestines, the clustering of A. japonicus for different body lengths was the same as that for A. distinguendus of 5–6 cm. A. distinguendus of different body lengths belonged to different clusters. O. oratoria of 10–13 cm and A. distinguendus of 4–5 cm belonged to the same cluster, while O. oratoria of the other two body lengths and A. distinguendus of 3–4 cm belonged to the same cluster.

3.3.2. The Correlation Between the Distribution of MPs in Dominant Species and Biological Indicators

According to the Spearman correlation analysis results, except for the indicators related to δ13C, there was a strong correlation between the abundance of MPs in A. japonicus stomachs and other indicators (Table 3). There was a significant correlation between the abundance of MPs in O. oratoria stomachs and body weights (r = −0.244, p < 0.05). However, the correlation with other indicators was extremely weak. The abundance of MPs in the gastrointestinal tracts of A. distinguendus was not correlated with biological indicators (p > 0.05), while the correlation of these indicators with MP abundance in GITs of A. japonicus and O. oratoria was extremely weak (Table 4).

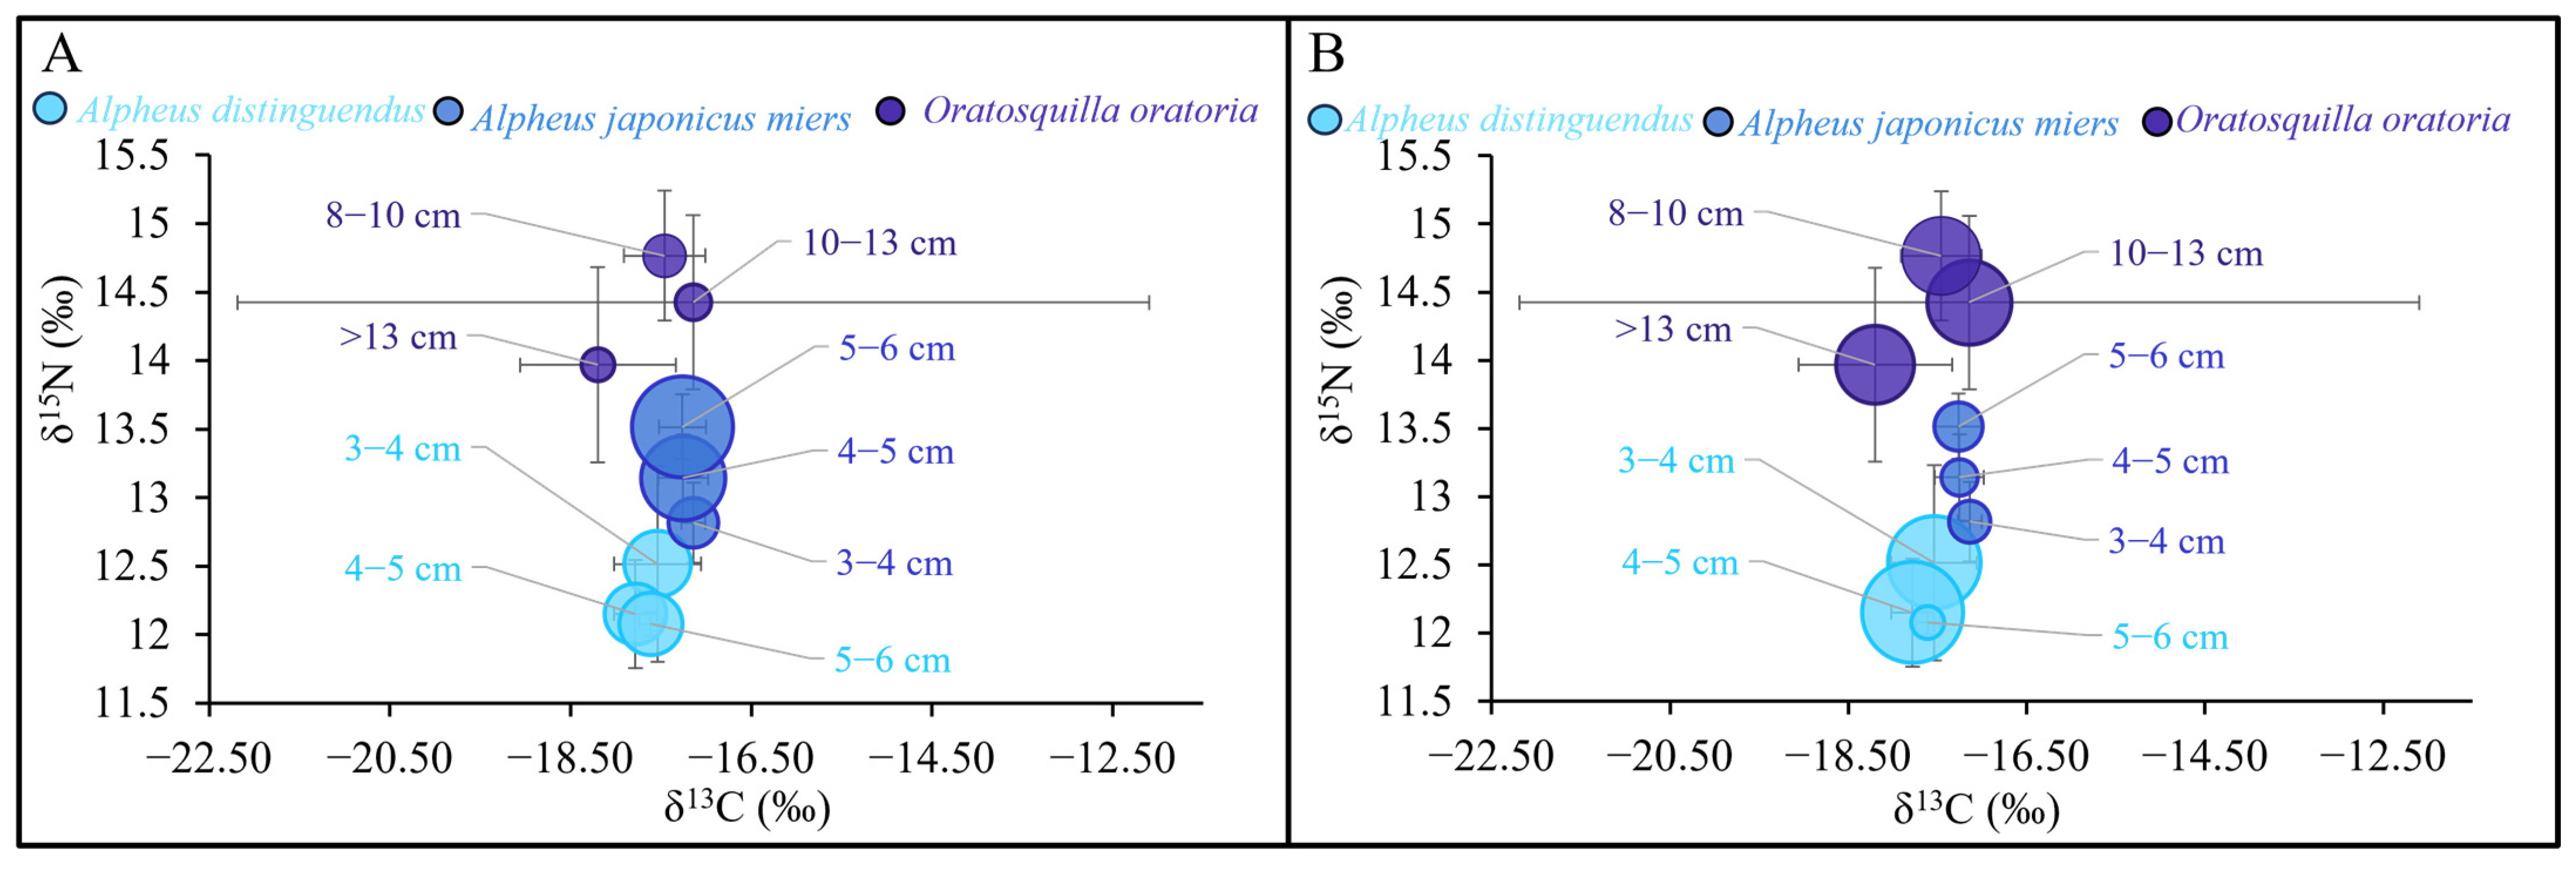
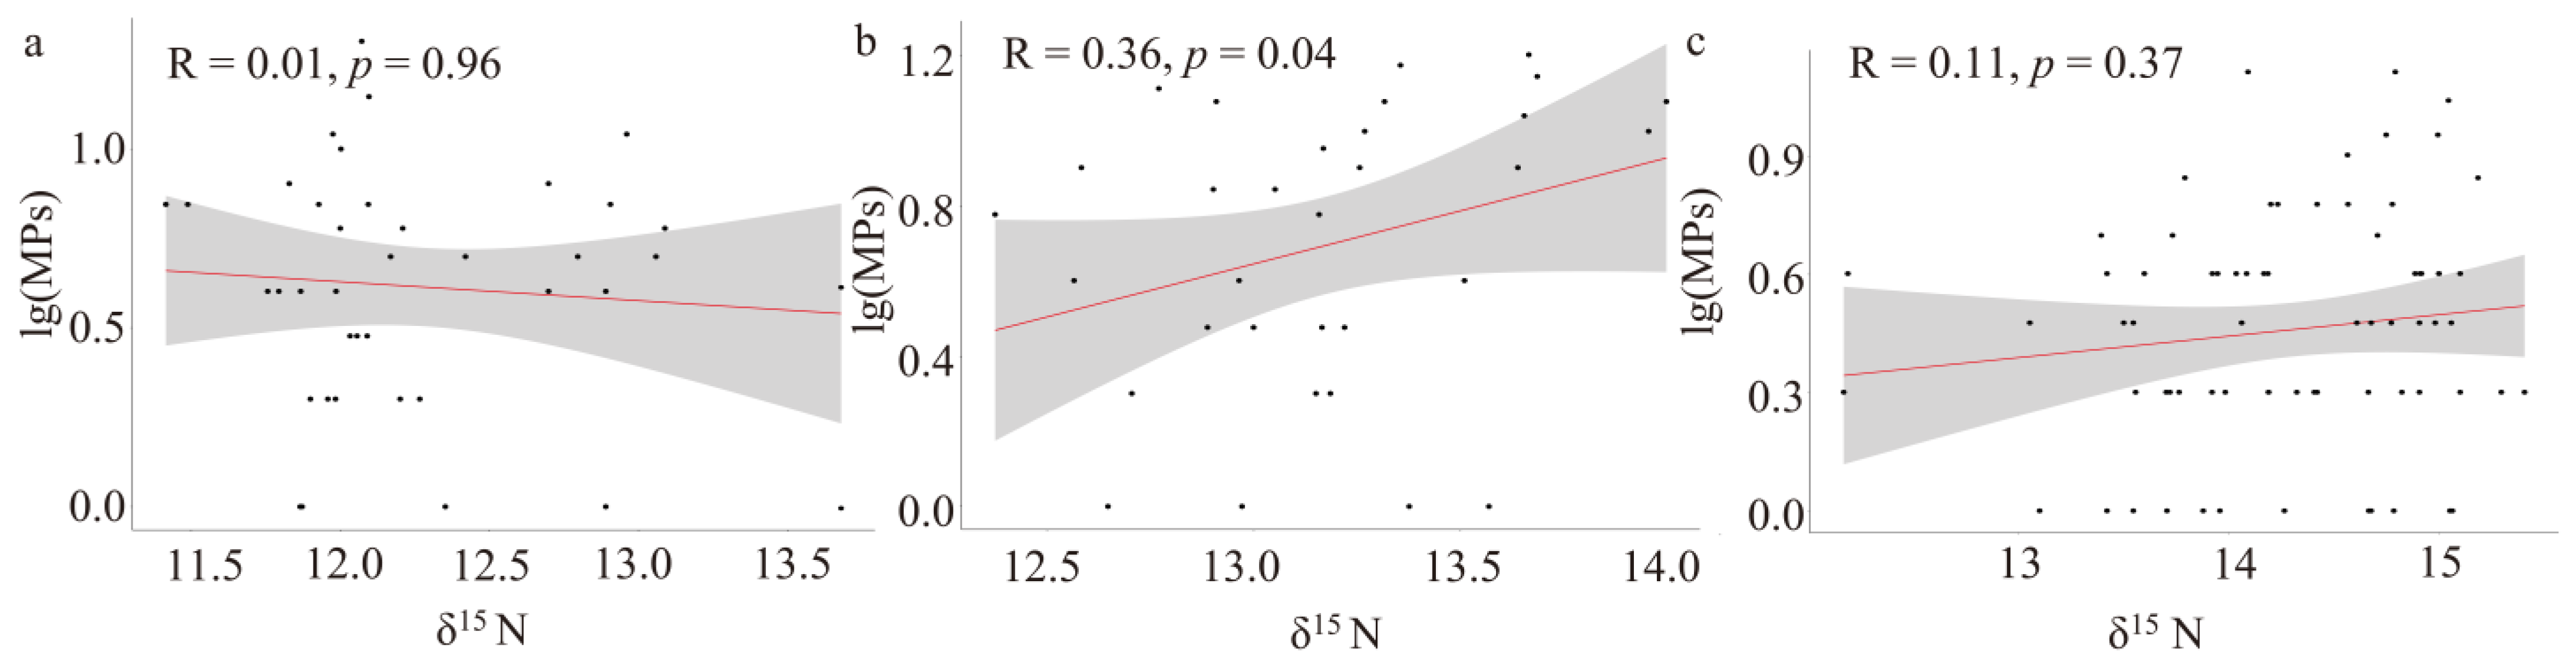
3.3.3. Changes in MP Abundance in Dominant Species with Nutrient Levels

The δ13C/δ15N ratios of the three dominant species exhibited significant ecological niche separation (Figure 6). The phenomenon of niche separation of the same dominant species was not apparent. In Figure 7, the relationship between the abundance of MPs in the stomachs of A. distinguendus and OO and TL was lgCI = −0.0529δ15N + 1.2634 and lgCI = 0.054515N − 0.3193 (R1 = 0.01, R2 = 0.11; Spearman, p > 0.05), respectively. The relationship between the abundance of MPs in A. japonicus stomachs and TL was lgCI = 0.2827δ15N − 3.0289 (R = 0.36; Spearman, p < 0.05), TMF = 1.92 > 1. A phenomenon of nutritional amplification was observed.

3.4. Health Risk Assessment

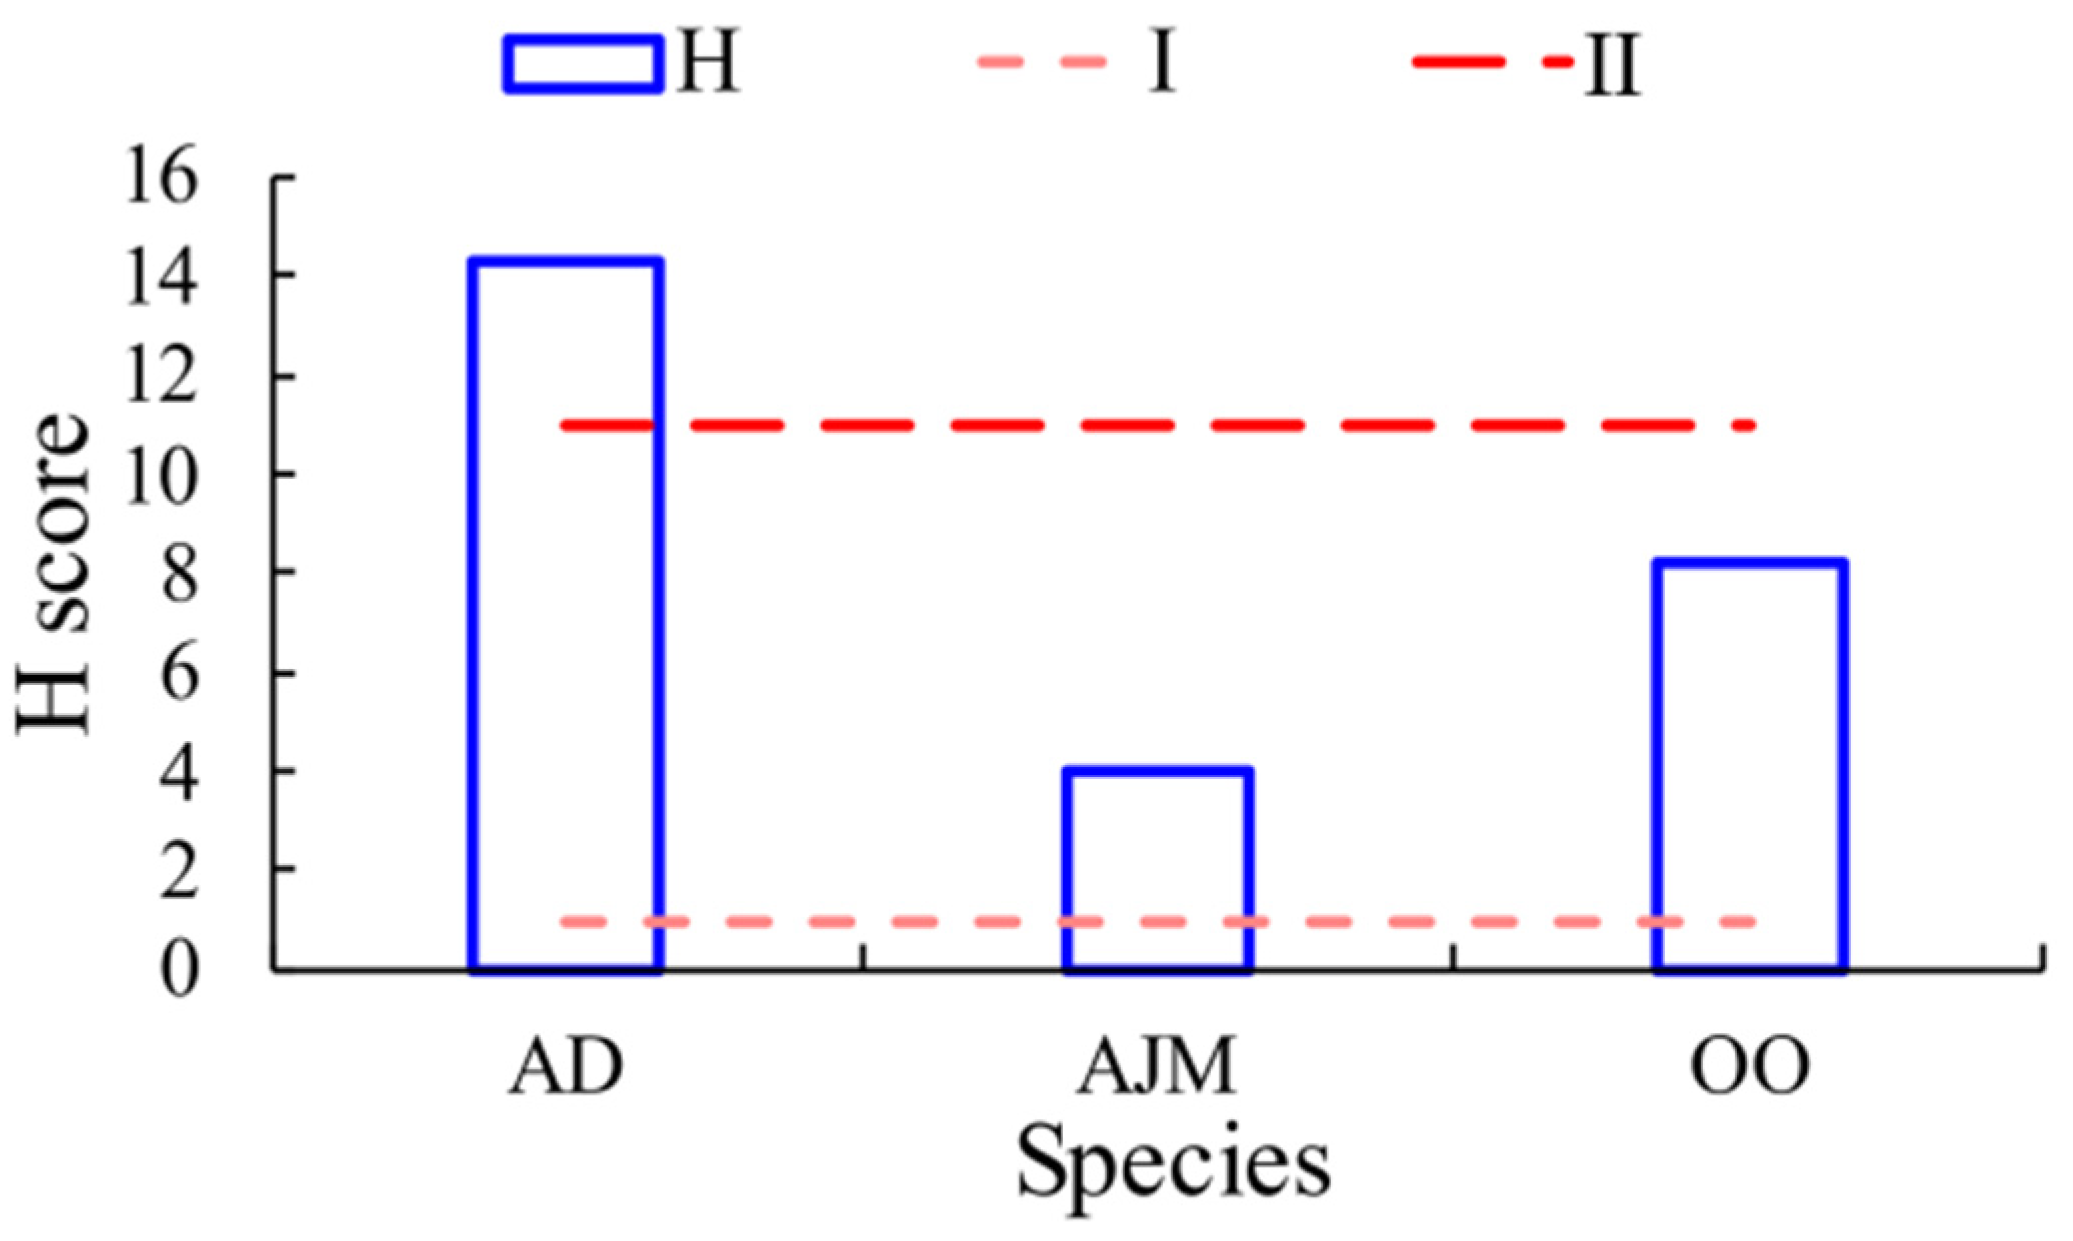
3.4.1. Hazard Index of Dominant Species’ MPs (H Score)

The H score of A. distinguendus (mean: 14.27) was above the level II threshold (see Figure 8), belonging to level III risk (10–100). The H scores of A. japonicus and O. oratoria were below the level II risk threshold. The H score of A. japonicus was the lowest, at 3.99.

3.4.2. EDI and MOE Risk Assessment

The average abundance (hindgut) of the dominant species’ MPs in this study was 346.59 n/kg. The results of the EDI and MOE risk assessments are shown in Table 5. MOE values for males and females are much higher than 100.

4. Discussion

4.1. Composition of MPs in Shrimp Samples

Fibrous MPs are the primary shape type of gastrointestinal MPs in shrimp, accounting for up to 86.30%, which is common in marine ecosystems [27,52,53]. Research has shown that fibers account for as much as 91% of MPs in the global ocean [54]. Meanwhile, from a morphological perspective, fibrous MPs resemble algae, such as Enteromorpha prolifera, facilitating their ingestion by shrimp [3], indicating a high abundance and bioavailability of fibrous MPs in marine ecosystems [54]. Numerous studies have also demonstrated that fibers are the MP components with the highest proportions in the gastrointestinal tracts of shrimp. For example, the detection rate of fibrous MPs in Palaemon elegans (Ratlike, 1837) and Macrobrachium nipponense (De Haan, 1849) on Chongming Island exceeded 90% [53]. The proportion of fibrous MPs in the bodies of Indian white shrimp inhabiting the coastal waters of Kochin, Kerala, India, was 83% [55], while in Pleoticus muelleri (Bate, 1888) from the southwestern Atlantic Ocean, the content of fibrous MPs reached as high as 95% [56]. Although some experts predict that shrimp have specific feeding preferences for MPs [27], no direct research has confirmed that marine organisms in the Haizhou Bay Marine Ranch preferentially ingest fibrous MPs. The proportion of hard, fragmented MPs in this study was 11.20%. The combined proportion of fibrous and fragmented MPs was similar to that observed in fish, suggesting that the high proportion of fibrous MPs in the shrimp is not attributable to selective feeding preferences [21,57,58]. Aging fishing nets and ropes used in seaweed farming can also release significant amounts of fibrous MPs [31,59]. Moreover, fibrous MPs originating from wastewater transported from estuaries to oceans represent an important source of marine fibrous MPs [60], further contributing to their high prevalence in shrimp populations. In addition to their shape, the color and composition of MPs in shrimp are more complex. Consistent with observations in seawater, blue and PET MPs are the main components [31]. Regarding size, the proportion of <1 mm MPs in the gastrointestinal tracts (GITs) of the dominant species was 56.38%, and the proportion of 1–2 mm MPs was 31.79%. The proportion of MPs <1 mm in seawater is 39%, and the proportion of 1–2 mm MPs is 29% [21]. The proportion of MPs < 2 mm in GITs was higher than that in the environment, indicating that the shape, color, and material of MPs in GITs in the study area mainly depend on the composition of the MPs in the environment. Regarding MP size, shrimp populations may be more inclined to consume more minor MPs, which often have more significant potential toxicity to organisms, from their living environment due to their feeding preferences. These smaller MPs not only carry higher intrinsic toxicity risks due to their bioavailability but may also serve as vectors for adsorbed toxic chemicals (such as PCBs and PAHs) and pathogenic microorganisms (such as Escherichia coli.), collectively amplifying ecological and human health risks through trophic transfer [61]. While dominant MPs in the shrimp species shared key traits (color, morphology, and polymer composition) with those in environmental media (seawater/sediments), canonical correspondence analysis revealed no statistically significant correlations in MP abundance across shape, color, polymer types, or size fractions between the dominants and environmental media (Table 6) [31]. Notably, PVC—a prevalent seawater polymer—was undetected in the dominants, and the <2 mm fraction constituted 75.90% (seawater) versus 88.17% (dominants) [31]. These findings imply that environmental MP pools partially shape bioaccumulation patterns, yet there is a degree of selectivity in the uptake of microplastics by dominants [50]. In summary, environmental media represent one influencing factor in MP ingestion, sharing similarities with MP characteristics in organisms, but are not deterministic. The MP distribution within organisms varies by species and is further modulated by ecological behaviors [21,58]. Current mechanistic understanding remains fragmented, underscoring that research on environment–organism MP transfer dynamics remains at a preliminary stage.

4.2. Analysis of Gastrointestinal MP Pollution Characteristics in Dominant Shrimp Species

The abundance of MPs in the digestive tract (stomach + intestines) of A. distinguendus was the highest (10.50 ± 8.51 n/ind), while that in A. japonicus was slightly lower (9.05 ± 7.14 n/ind). This is the first study on the distribution characteristics of MPs in the GITs of A. japonicus and A. distinguendus in the Haizhou Bay Marine Ranch. Compared with existing research, the results of this study indicate a relatively high level of pollution. The abundance of MPs in the digestive tracts of the Arabian Sea’s New Penaeus vannamei (Boone, 1931) was 7.23 n/ind [62]. Moreover, the abundance in South American white shrimp in Gorgon Bay of the Caspian Sea and in Penaeus vannamei (Boone, 1931) from the northern Gulf of Bangladesh was 5.74 n/ind [46] and 6.67 n/ind [25], respectively. The abundance of MPs in Crangon affinis (De Haan, 1849) living in the South Yellow Sea was 8.5 n/ind [63]. These studies reported lower levels of MP contamination in GITs compared to those reported for A. japonicus and A. distinguendus in the present study, though they all show relatively high levels of contamination. O. oratoria were the largest individuals among the three dominant species in terms of body size. Individuals with larger body sizes may have more space in their stomachs and intestines for plastic to pass through [64]. As a result, the abundance of O. oratoria was lower than that of A. japonicus, reaching 6.71 ± 6.96 n/ind. This suggests that the digestive tracts of the three dominant species in Haizhou Bay all exhibit relatively high levels of MP pollution. According to the Mann–Whitney U test, the abundance of MPs in the stomach of A. japonicus was significantly higher than that in the intestines. This may be due to the small size of A. japonicus individuals, where the stomach acts as a size bottleneck in transferring MPs to the digestive tract, enhancing the retention effect on large-sized MPs [65]. The abundance of MPs in the GIT of A. distinguendus was at a relatively high level of contamination. Therefore, it cannot be determined whether the stomach’s bottleneck effect impacts it. However, according to the Kruskal–Wallis test, the abundance of MPs in the stomach of O. oratoria was much lower than that of the dominant species in Decapoda. The stomach of Decapoda shrimp contains a structure formed by the stratum corneum on the stomach wall, which may include protruding structures such as gastric teeth that help grind or chew food. This chewing structure on the stomach wall is called a gastric grinder. During digestion, the “gastric grinder” grinds food particles. However, for plastic materials, the cutting and grinding actions, combined with the shape of the teeth themselves, may entangle the fibers into balls instead of decomposing them, hindering the excretion of MPs in shrimp and prolonging their retention, particularly larger MPs [29,66]. Additionally, the formation of balls increases the overall size of plastic debris, hindering their excretion and increasing their time of residence, leading to microplastic retention associated with reduced nutritional status in N. norvegicus, which ultimately increases the likelihood of negative effects on the shrimp’s condition [66]. According to Cole et al. (2011) [67], exposure of Centropages typicus to polystyrene spheres significantly reduced their feed intake because of a false sense of satiety. MP and NPs can accumulate in the hepatopancreas of shrimp, leading to immune responses such as phagocytosis, encapsulation, nodule formation, and apoptosis [68,69,70]. These increase the mortality rate of the organisms. O. oratoria does not digest food using stomach grinding because there is no gastric grinding structure in the stomach [71]. Therefore, O. oratoria’s stomach cannot intercept MPs.

4.3. Relationship Between the Distribution of MPs in Dominant Species and Biological Indicators

The δ13C/δ15N values of different species exhibit significant ecological niche segregation (Figure 6), indicating that they belong to different trophic levels. The ecological niche separation between individuals in different body-length groups of the same dominant species is insignificant, suggesting that the trophic-level range of these individuals is not extensive, which is consistent with the results obtained from previous differential analysis and clustering analysis. Overall, there were significant differences in the distribution of MPs in GITs among the different dominant species, indicating that trophic levels may affect the distribution characteristics of MPs in shrimp. The presence of fibers in the discarded gut linings of molted Nephrops norvegicus (Linnaeus, 1758) was found by experts, indicating that MPs can be lost at ecdysis [64]. And the markedly reduced MP load observed in recently molted Nephrops norvegicus from the Clyde suggests that molting facilitates the elimination of substantial plastic accumulations, a mechanism further corroborated by the detection of plastic particles in the shed guts of animals subjected to eye ablation [64]. Consequently, the authors believe molting to be the main route by which MP aggregations are lost in shrimp. As the gaps in the gastric mill increase with growth, the increased size of the gaps between plates of the gastric mill may allow a greater amount of microplastics to be egested by larger individuals. As organisms grow, the gaps in the gastric mill widen, which may enable larger individuals to egest a greater quantity of microplastics due to the increased size of these openings between the plates [72]. Therefore, this result also helps explain the previous Spearman similarity analysis results: the correlation between the abundance of MPs in the sample and trophic level is not significant, and the correlation with body length and weight is similarly weak. A similar phenomenon has also been observed in Australian Pasiphaea, where smaller shrimp consume more MPs [3,73], which invisibly increases the risk of low-trophic-level larvae ingesting MPs and raises the risk of MPs being transported from low to high trophic levels in the food web.

4.4. Health Risks

The results of the risk-level model based on polymer chemical toxicity indicate that the dominant species of shrimp in the study area exhibit a lower risk level [45] because the gastrointestinal polymer toxicity score of the sample was relatively low. This suggests that MPs in shrimp from the study area do not pose a threat to human health. Currently, there is very limited research on the assessment of the EDI and MOE of MPs through shrimp consumption by humans. In this study, both the EDI and MOE were found to be at an extremely low level, significantly lower than those associated with shrimp from the Bay of Bengal and the Red Sea [26,45]. According to the latest research, except for a few heavily polluted areas, the levels were lower than the NOAEL and pose no significant risk to human health [48]. Overall, while current estimates suggest that the quantity of MPs ingested by humans falls below thresholds for acute health risks, the presence of MPs in organisms, particularly those with persistent biofilm coatings enriched through prolonged environmental aging, cannot be overlooked. These biofilm-laden MPs may serve as reservoirs for pathogenic bacteria (e.g., Vibrio spp. and antibiotic-resistant strains) and amplify risks through synergistic interactions with adsorbed chemical contaminants (e.g., heavy metals and endocrine disruptors), posing multifaceted threats to food safety and long-term human health [61].

5. Conclusions

This study analyzed the effects of body length, ecological niche, and other indicators on the abundance of MPs in three dominant species and showed a significant difference in the abundance of MPs in the stomach. In contrast to O. oratoria, the stomachs of the two species of Alpheus shrimp possess “gastric grinding” structures, which create a “bottleneck” effect in the transfer of MPs to the intestines. The differences in ecological niche and physiological structure affect the distribution characteristics and variability of GIT abundance of MPs among different dominant species. Consequently, the abundance of MPs in the stomachs of these two species (6.50 ± 4.58 n/individual and 5.07 ± 3.94 n/individual, respectively) was significantly higher than that in the stomachs of O. oratoria (2.90 ± 2.76 n/individual) (Kruskal–Wallis, P1 = 0.0001 < 0.05, P2 = 0.001 < 0.05). The loss of MPs during the molting process may reduce the variation in GIT MP abundance among different body-length groups of the same dominant shrimp species, leading to less pronounced differences in GIT MP abundance. Because the MOE values of the three dominant species consumed by humans are much higher than the NOAEL (MOE = 100), the risk of MPs ingested by humans is extremely low. However, the food chain and food web are the main pathways for energy flow and material cycling in marine ecosystems, and humans are at the top of the food web. So, the effect of MPs on health hazards needs to be researched further.

Author Contributions

Conceptualization, C.G. and S.Z.; Methodology, C.G.; Formal analysis, C.G.; Investigation, C.G., M.C., B.L. and E.C.; Resources, C.G.; Data curation, B.L.; Writing—original draft, C.G. and B.L.; Writing—review and editing, C.G., S.Z. and S.G.; Supervision, C.G., S.Z. and S.G.; Project administration, S.Z.; Funding acquisition, C.G., S.Z. and S.G. All authors have read and agreed to the published version of the manuscript.

Funding

This research was funded by the Shanghai Ocean Bureau Research Project (Shanghai 2019-05), the 2024 Special Monitoring Project for Marine Biologicals in Coastal Waters (grant number: JSZC-320000-HWZX-G2024-0187), Haizhou Bay National Oceanic Ranch 2024 Demonstration Area Annual Monitoring and Typical Habitat Shellfish Carbon Sequestration Potential Evaluation Research (XSDCG20240029), and the China Postdoctoral Science Foundation (E-6005-00-0042-39; 2024TI70542), the Postdoctoral Fellowship Program of CPSF (GZC20231539). This study was specially financed by the China Scholarship Council (202308310175).

Data Availability Statement

The data that support the findings of this study are available from the corresponding author [Chunmei Gao] upon reasonable request.

Acknowledgments

The authors thank the Shanghai Ocean Bureau Research Project (Shanghai 2019-05), the 2024 Special Monitoring Project for Marine Biologicals in Coastal Waters (grant number: JSZC-320000-HWZX-G2024-0187), Haizhou Bay National Oceanic Ranch 2024 Demonstration Area Annual Monitoring and Typical Habitat Shellfish Carbon Sequestration Potential Evaluation Research (XSDCG20240029), the China Postdoctoral Science Foundation (E-6005-00-0042-39; 2024TI70542), and the Postdoctoral Fellowship Program of CPSF (GZC20231539) for their support.

Conflicts of Interest

The authors declare that they have no known competing financial interests or personal relationships that could have appeared to influence the work reported in this paper.

References

  1. Acaroğlu, H.; Güllü, M.; Sivri, N.; Marquez, F.P.G. How can there be an economic transition to a green ecosystem by adapting plastic-to-fuel technologies through renewable energy? Sustain. Energy Technol. Assess. 2024, 64, 103691. [Google Scholar] [CrossRef]
  2. Green, D.S.; Kregting, L.; Boots, B.; Blockley, D.J.; Brickle, P.; da Costa, M.; Crowley, Q. A comparison of sampling methods for seawater microplastics and a first report of the microplastic litter in coastal waters of Ascension and Falkland Islands. Trends Anal. Chem. 2018, 116, 346–359. [Google Scholar] [CrossRef]
  3. Yin, J.; Li, J.-Y.; Craig, N.J.; Su, L. Microplastic pollution in wild populations of decapod crustaceans: A review. Chemosphere 2022, 291, 132985. [Google Scholar] [CrossRef]
  4. Lebreton, L.C.M.; van der Zwet, J.; Damsteeg, J.-W.; Slat, B.; Andrady, A.; Reisser, J. River plastic emissions to the world’s oceans. Nat. Commun. 2017, 8, 15611. [Google Scholar] [CrossRef] [PubMed]
  5. Maione, C. Quantifying plastics waste accumulations on coastal tourism sites in Zanzibar, Tanzania. Mar. Pollut. Bull. 2021, 168, 112418. [Google Scholar] [CrossRef]
  6. Macfadyen, G.; Huntington, T.; Cappell, R. Abandoned, Lost or Otherwise Discarded Fishing Gear; United Nations Environment Programme: Food and Agriculture Organization of the United Nations: Nairobi, Kenya, 2009. [Google Scholar]
  7. Syversen, T.; Lilleng, G.; Vollstad, J.; Hanssen, B.J.; Sønvisen, S.A. Oceanic plastic pollution caused by Danish seine fishing in Norway. Mar. Pollut. Bull. 2022, 179, 113711. [Google Scholar] [CrossRef] [PubMed]
  8. Allen, D.; Allen, S.; Abbasi, S.; Baker, A.; Bergmann, M.; Brahney, J.; Butler, T.; Duce, R.A.; Eckhardt, S.; Evangeliou, N.; et al. Microplastics and nanoplastics in the marine-atmosphere environment. Nat. Rev. Earth Environ. 2022, 3, 393–405. [Google Scholar] [CrossRef]
  9. Eriksen, M.; Lebreton, L.C.M.; Carson, H.S.; Thiel, M.; Moore, C.J.; Borerro, J.C.; Galgani, F.; Ryan, P.G.; Reisser, J. Plastic Pollution in the World’s Oceans: More than 5 Trillion Plastic Pieces Weighing over 250,000 Tons Afloat at Sea. PLoS ONE 2014, 9, e111913. [Google Scholar] [CrossRef]
  10. Guan, J.; Qi, K.; Wang, J.; Wang, W.; Wang, Z.; Lu, N.; Qu, J. Microplastics as an emerging anthropogenic vector of trace metals in freshwater: Significance of biofilms and comparison with natural substrates. Water Res. 2020, 184, 116205. [Google Scholar] [CrossRef]
  11. Kinigopoulou, V.; Pashalidis, I.; Kalderis, D.; Anastopoulos, I. Microplastics as carriers of inorganic and organic contaminants in the environment: A review of recent progress. J. Mol. Liq. 2022, 350, 118580. [Google Scholar] [CrossRef]
  12. Mei, G.; Zhang, X.; Gu, J.; Fang, Y.; Yang, W. Assessment of Heavy Metals, Polycyclic Aromatic Hydrocarbons, and Perfluorinated Alkyl Substances in two Marine Crustaceans (Oratosquilla oratoria and Portunus trituberculatus) in the Zhoushan Fishing Ground of China East Sea. J. Ocean Univ. China 2021, 20, 1587–1596. [Google Scholar] [CrossRef]
  13. Xie, Q.; Li, H.-X.; Lin, L.; Li, Z.-L.; Huang, J.-S.; Xu, X.-R. Characteristics of expanded polystyrene microplastics on island beaches in the Pearl River Estuary: Abundance, size, surface texture and their metals-carrying capacity. Ecotoxicology 2021, 30, 1632–1643. [Google Scholar] [CrossRef] [PubMed]
  14. Farrell, P.; Nelson, K. Trophic level transfer of microplastic: Mytilus edulis (L.) to Carcinus maenas (L.). Environ. Pollut. 2013, 177, 1–3. [Google Scholar] [CrossRef] [PubMed]
  15. Sharifinia, M.; Bahmanbeigloo, Z.A.; Keshavarzifard, M.; Khanjani, M.H.; Lyons, B.P. Microplastic pollution as a grand challenge in marine research: A closer look at their adverse impacts on the immune and reproductive systems. Ecotoxicol. Environ. Saf. 2020, 204, 111109. [Google Scholar] [CrossRef]
  16. Wen, J.; Li, T.; Pu, Q.; Li, Y.; Ding, X.; Wang, L.; Li, X. Co-exposure of TMPs and antibiotics in zebrafish: The influence of additives on the risk of hepatotoxicity. Environ. Res. 2025, 275, 121430. [Google Scholar] [CrossRef]
  17. Luan, J.; Wen, L.; Bao, Y.; Bai, H.; Zhao, C.; Zhang, S.; Man, X.; Yin, T.; Feng, X. Systemic toxicity of biodegradable polyglycolic acid microplastics on the gut-liver-brain axis in zebrafish. Sci. Total. Environ. 2024, 954, 176898. [Google Scholar] [CrossRef]
  18. Hossain, M.S.; Rahman, M.S.; Uddin, M.N.; Sharifuzzaman, S.; Chowdhury, S.R.; Sarker, S.; Chowdhury, M.S.N. Microplastic contamination in Penaeid shrimp from the Northern Bay of Bengal. Chemosphere 2020, 238, 124688. [Google Scholar] [CrossRef]
  19. Rochman, C.M.; Hoellein, T. The global odyssey of plastic pollution. Science 2020, 368, 1184–1185. [Google Scholar] [CrossRef]
  20. Graham, E.R.; Thompson, J.T. Deposit- and suspension-feeding sea cucumbers (Echinodermata) ingest plastic fragments. J. Exp. Mar. Biol. Ecol. 2009, 368, 22–29. [Google Scholar] [CrossRef]
  21. Gao, S.; Yan, K.; Liang, B.; Shu, R.; Wang, N.; Zhang, S. The different ways microplastics from the water column and sediment accumulate in fish in Haizhou Bay. Sci. Total. Environ. 2022, 854, 158575. [Google Scholar] [CrossRef]
  22. Hara, J.; Frias, J.; Nash, R. Quantification of microplastic ingestion by the decapod crustacean Nephrops norvegicus from Irish waters. Mar. Pollut. Bull. 2020, 152, 110905. [Google Scholar] [CrossRef]
  23. Moore, R.; Loseto, L.; Noel, M.; Etemadifar, A.; Brewster, J.; MacPhee, S.; Bendell, L.; Ross, P. Microplastics in beluga whales (Delphinapterus leucas) from the Eastern Beaufort Sea. Mar. Pollut. Bull. 2020, 150, 110723. [Google Scholar] [CrossRef] [PubMed]
  24. Sun, X.; Liang, J.; Zhu, M.; Zhao, Y.; Zhang, B. Microplastics in seawater and zooplankton from the Yellow Sea. Environ. Pollut. 2018, 242, 585–595. [Google Scholar] [CrossRef] [PubMed]
  25. Waite, H.R.; Donnelly, M.J.; Walters, L.J. Quantity and types of microplastics in the organic tissues of the eastern oyster Crassostrea virginica and Atlantic mud crab Panopeus herbstii from a Florida estuary. Mar. Pollut. Bull. 2018, 129, 179–185. [Google Scholar] [CrossRef] [PubMed]
  26. Mercy, F.T.; Alam, A.R. Assessment of microplastic contamination in shrimps from the Bay of Bengal and associated human health risk. Mar. Pollut. Bull. 2024, 201, 116185. [Google Scholar] [CrossRef]
  27. Devriese, L.I.; van der Meulen, M.D.; Maes, T.; Bekaert, K.; Paul-Pont, I.; Frère, L.; Robbens, J.; Vethaak, A.D. Microplastic contamination in brown shrimp (Crangon crangon, Linnaeus 1758) from coastal waters of the Southern North Sea and Channel area. Mar. Pollut. Bull. 2015, 98, 179–187. [Google Scholar] [CrossRef]
  28. Walkinshaw, C.; Lindeque, P.K.; Thompson, R.; Tolhurst, T.; Cole, M. Microplastics and seafood: Lower trophic organisms at highest risk of contamination. Ecotoxicol. Environ. Saf. 2020, 190, 110066. [Google Scholar] [CrossRef]
  29. Carreras-Colom, E.; Constenla, M.; Soler-Membrives, A.; Cartes, J.E.; Baeza, M.; Padrós, F.; Carrassón, M. Spatial occurrence and effects of microplastic ingestion on the deep-water shrimp Aristeus antennatus. Mar. Pollut. Bull. 2018, 133, 44–52. [Google Scholar] [CrossRef]
  30. Curren, E.; Leaw, C.P.; Lim, P.T.; Leong, S.C.Y. Evidence of Marine Microplastics in Commercially Harvested Seafood. Front. Bioeng. Biotechnol. 2020, 8, 562760. [Google Scholar] [CrossRef]
  31. Liang, B.; Gao, S.; Wang, Z.; Shu, R.; Wang, N.; Tan, W.; Gao, C.; Zhang, S. Spatial distribution characteristics of microplastics in the seawater column and sediments of the artificial reef area and adjacent water in Haizhou Bay. Sci. Total. Environ. 2023, 900, 166236. [Google Scholar] [CrossRef]
  32. McGregor, S.; Strydom, N.A. Feeding ecology and microplastic ingestion in Chelon richardsonii (Mugilidae) associated with surf diatom Anaulus australis accumulations in a warm temperate South African surf zone. Mar. Pollut. Bull. 2020, 158, 111430. [Google Scholar] [CrossRef]
  33. RB/T 061-2021; Technical Specifications for Euthanasia in Animal Experiments. The Standardization Administration of the People’s Republic of China: Sichuan, China, 2021.
  34. GB/T 12763.6-2007; Specifications for Oceanographic Survey—Part 6: Marine Biological Survey. People’s Republic of China Standardization Administration of China: Beijing, China, 2007.
  35. Parvin, F.; Jannat, S.; Tareq, S.M. Abundance, characteristics and variation of microplastics in different freshwater fish species from Bangladesh. Sci. Total. Environ. 2021, 784, 147137. [Google Scholar] [CrossRef]
  36. Shu, R.; Hu, W.; Gao, S.; Zhang, S.; Li, Z.; Liang, B.; Yu, W. Transfer pattern of microplastics at an individual level: A case study of two typical Sciaenidae fish in coastal waters. Sci. Total. Environ. 2023, 901, 165570. [Google Scholar] [CrossRef] [PubMed]
  37. De Witte, B.; Devriese, L.; Bekaert, K.; Hoffman, S.; Vandermeersch, G.; Cooreman, K.; Robbens, J. Quality assessment of the blue mussel (Mytilus edulis): Comparison between commercial and wild types. Mar. Pollut. Bull. 2014, 85, 146–155. [Google Scholar] [CrossRef]
  38. Hidalgo-Ruz, V.; Gutow, L.; Thompson, R.C.; Thiel, M. Microplastics in the Marine Environment: A Review of the Methods Used for Identification and Quantification. Environ. Sci. Technol. 2012, 46, 3060–3075. [Google Scholar] [CrossRef] [PubMed]
  39. Xu, C.; Zhou, G.; Lu, J.; Shen, C.; Dong, Z.; Yin, S.; Li, F. Spatio-vertical distribution of riverine microplastics: Impact of the textile industry. Environ. Res. 2022, 211, 112789. [Google Scholar] [CrossRef] [PubMed]
  40. Xu, S.; Chen, L.; Zhang, K.; Cao, Y.; Ma, Y.; Chau, H.S.; Tao, D.; Wu, C.; Li, C.; Lam, P.K. Microplastic occurrence in the northern South China Sea, A case for Pre and Post cyclone analysis. Chemosphere 2022, 296, 133980. [Google Scholar] [CrossRef]
  41. Xu, L.; Liu, J.; Ma, X.Y.D.; Li, Z.; He, C.; Lu, X. Facile anchoring mussel adhesive mimic tentacles on biodegradable polymer cargo carriers via self-assembly for microplastic-free cosmetics. J. Colloid Interface Sci. 2022, 612, 13–22. [Google Scholar] [CrossRef]
  42. Sweeting, C.J.; Polunin, N.V.C.; Jennings, S. Effects of chemical lipid extraction and arithmetic lipid correction on stable isotope ratios of fish tissues. Rapid Commun. Mass Spectrom. 2006, 20, 595–601. [Google Scholar] [CrossRef]
  43. Post, D.M. Using stable isotopes to estimate trophic position: Models, methods, and assumptions. Ecology 2002, 83, 703–718. [Google Scholar] [CrossRef]
  44. Lotze, H.K.; Tittensor, D.P.; Bryndum-Buchholz, A.; Eddy, T.D.; Cheung, W.W.L.; Galbraith, E.D.; Barange, M.; Barrier, N.; Bianchi, D.; Blanchard, J.; et al. Global ensemble projections reveal trophic amplification of ocean biomass declines with climate change. Proc. Natl. Acad. Sci. USA 2019, 116, 12907–12912. [Google Scholar] [CrossRef] [PubMed]
  45. Lithner, D.; Larsson, Å.; Dave, G. Environmental and health hazard ranking and assessment of plastic polymers based on chemical composition. Sci. Total Environ. 2011, 409, 3309–3324. [Google Scholar] [CrossRef] [PubMed]
  46. Liang, B.; Gao, S.; Zhang, S.; Gao, C. Distribution characteristics and ecological risk assessment of microplastics in intertidal sediments near coastal water. Mar. Environ. Res. 2024, 195, 106353. [Google Scholar] [CrossRef]
  47. Ferrante, M.; Pietro, Z.; Allegui, C.; Maria, F.; Antonio, C.; Pulvirenti, E.; Favara, C.; Chiara, C.; Grasso, A.; Omayma, M.; et al. Microplastics in fillets of Mediterranean seafood. A risk assessment study. Environ. Res. 2022, 204, 112247. [Google Scholar] [CrossRef] [PubMed]
  48. Yuan, Z.; Nag, R.; Cummins, E. Human health concerns regarding microplastics in the aquatic environment—From marine to food systems. Sci. Total. Environ. 2022, 823, 153730. [Google Scholar] [CrossRef]
  49. Ra, W.-J.; Yoo, H.J.; Kim, Y.-H.; Yun, T.; Soh, B.; Cho, S.Y.; Joo, Y.; Lee, K.-W. Heavy metal concentration according to shrimp species and organ specificity: Monitoring and human risk assessment. Mar. Pollut. Bull. 2023, 197, 115761. [Google Scholar] [CrossRef]
  50. Zhang, K.; Zheng, S.; Liang, J.; Zhao, Y.; Li, Q.; Zhu, M.; Dai, S.; Sun, X. Microplastic load of benthic fauna in Jiaozhou Bay, China. Environ. Pollut. 2023, 320, 121073. [Google Scholar] [CrossRef]
  51. Kim, J.; Maruthupandy, M.; An, K.S.; Lee, K.H.; Jeon, S.; Kim, J.-S.; Cho, W.-S. Acute and subacute repeated oral toxicity study of fragmented microplastics in Sprague-Dawley rats. Ecotoxicol. Environ. Saf. 2021, 228, 112964. [Google Scholar] [CrossRef]
  52. Keshavarzifard, M.; Vazirzadeh, A.; Sharifinia, M. Occurrence and characterization of microplastics in white shrimp, Metapenaeus affinis, living in a habitat highly affected by anthropogenic pressures, northwest Persian Gulf. Mar. Pollut. Bull. 2021, 169, 112581. [Google Scholar] [CrossRef]
  53. Wang, T.; Tong, C.; Wu, F.; Jiang, S.; Zhang, S. Distribution characteristics of microplastics and corresponding feeding habits of the dominant shrimps in the rivers of Chongming Island. Sci. Total. Environ. 2023, 888, 164041. [Google Scholar] [CrossRef]
  54. Barrows, A.; Cathey, S.; Petersen, C. Marine environment microfiber contamination: Global patterns and the diversity of microparticle origins. Environ. Pollut. 2018, 237, 275–284. [Google Scholar] [CrossRef]
  55. Daniel, D.B.; Ashraf, P.M.; Thomas, S.N. Abundance, characteristics and seasonal variation of microplastics in Indian white shrimps (Fenneropenaeus indicus) from coastal waters off Cochin, Kerala, India. Sci. Total. Environ. 2020, 737, 139839. [Google Scholar] [CrossRef] [PubMed]
  56. Fernández Severini, M.D.; Buzzi, N.S.; Forero López, A.D.; Colombo, C.V.; Chatelain Sartor, G.L.; Rimondino, G.N.; Truchet, D.M. Chemical composition and abundance of microplastics in the muscle of commercial shrimp Pleoticus muelleri at an impacted coastal environment (Southwestern Atlantic). Mar. Pollut. Bull. 2020, 161, 111700. [Google Scholar] [CrossRef]
  57. Gao, S.; Li, Z.; Wang, N.; Lu, Y.; Zhang, S. Microplastics in different tissues of caught fish in the artificial reef area and adjacent waters of Haizhou Bay. Mar. Pollut. Bull. 2021, 174, 113112. [Google Scholar] [CrossRef]
  58. Zhang, S.; Wang, N.; Gong, S.; Gao, S. The patterns of trophic transfer of microplastic ingestion by fish in the artificial reef area and adjacent waters of Haizhou Bay. Mar. Pollut. Bull. 2022, 177, 113565. [Google Scholar] [CrossRef]
  59. Browne, M.A.; Crump, P.; Niven, S.J.; Teuten, E.; Tonkin, A.; Galloway, T.; Thompson, R. Accumulation of Microplastic on Shorelines Woldwide: Sources and Sinks. Environ. Sci. Technol. 2011, 45, 9175–9179. [Google Scholar] [CrossRef] [PubMed]
  60. Bai, M.Y.; Zhao, S.Y.; Peng, G.Y.; Gao, L.; Li, D.J.; Li, D.J. Occurrence, characteristics of microplastic during urban sewage treatment process. Zhongguo Huanjing Kexue 2018, 38, 1734. [Google Scholar] [CrossRef]
  61. Pol, W.; Mierzyńska, K.; Włodarczyk, T.; Hauschild, T.; Zieliński, P. No trophy for the trophy? How lake trophy impacts bacterial assemblages of biofilm on microplastic. Ecohydrol. Hydrobiol. 2023, 23, 602–613. [Google Scholar] [CrossRef]
  62. Gurjar, U.R.; Xavier, M.; Nayak, B.B.; Ramteke, K.; Deshmukhe, G.; Jaiswar, A.K.; Shukla, S.P. Microplastics in shrimps: A study from the trawling grounds of north eastern part of Arabian Sea. Environ. Sci. Pollut. Res. 2021, 28, 48494–48504. [Google Scholar] [CrossRef]
  63. Wang, J.; Wang, M.; Ru, S.; Liu, X. High levels of microplastic pollution in the sediments and benthic organisms of the South Yellow Sea, China. Sci. Total. Environ. 2018, 651, 1661–1669. [Google Scholar] [CrossRef]
  64. Welden, N.A.; Cowie, P.R. Environment and gut morphology influence microplastic retention in langoustine, Nephrops norvegicus. Environ. Pollut. 2016, 214, 859–865. [Google Scholar] [CrossRef]
  65. Cau, A.; Avio, C.G.; Dessì, C.; Moccia, D.; Pusceddu, A.; Regoli, F.; Cannas, R.; Follesa, M.C. Benthic Crustacean Digestion Can Modulate the Environmental Fate of Microplastics in the Deep Sea. Environ. Sci. Technol. 2020, 54, 4886–4892. [Google Scholar] [CrossRef]
  66. Welden, N.A.; Cowie, P.R. Long-term microplastic retention causes reduced body condition in the langoustine, Nephrops norvegicus. Environ. Pollut. 2016, 218, 895–900. [Google Scholar] [CrossRef]
  67. Cole, M.; Coppock, R.; Lindeque, P.K.; Altin, D.; Reed, S.; Pond, D.W.; Sørensen, L.; Galloway, T.S.; Booth, A.M. Effects of Nylon Microplastic on Feeding, Lipid Accumulation, and Moulting in a Coldwater Copepod. Environ. Sci. Technol. 2019, 53, 7075–7082. [Google Scholar] [CrossRef] [PubMed]
  68. Li, Y.; Liu, Z.; Li, M.; Jiang, Q.; Wu, D.; Huang, Y.; Jiao, Y.; Zhang, M.; Zhao, Y. Effects of nanoplastics on antioxidant and immune enzyme activities and related gene expression in juvenile Macrobrachium nipponense. J. Hazard. Mater. 2020, 398, 122990. [Google Scholar] [CrossRef] [PubMed]
  69. Timilsina, A.; Adhikari, K.; Yadav, A.K.; Joshi, P.; Ramena, G.; Bohara, K. Effects of microplastics and nanoplastics in shrimp: Mechanisms of plastic particle and contaminant distribution and subsequent effects after uptake. Sci. Total. Environ. 2023, 894, 164999. [Google Scholar] [CrossRef] [PubMed]
  70. Xing, Y.; Zhu, X.; Duan, Y.; Huang, J.; Nan, Y.; Zhang, J. Toxic effects of nitrite and microplastics stress on histology, oxidative stress, and metabolic function in the gills of Pacific white shrimp, Litopenaeus vannamei. Mar. Pollut. Bull. 2023, 187, 114531. [Google Scholar] [CrossRef]
  71. Castejón, D.; Rotllant, G.; Ribes, E.; Guerao, G. Morphological description of the midgut tract and midgut–hindgut junction in the larvae of the spider crab Maja brachydactyla Balss, 1922 (Malacostraca: Decapoda). Arthropod Struct. Dev. 2022, 70, 101168. [Google Scholar] [CrossRef]
  72. Welden, N.A.; Cowie, P.R.; Taylor, A.C. Growth and gut morphology of the lobster Nephrops norvegicus. J. Crustac. Biol. 2015, 35, 20–25. [Google Scholar] [CrossRef]
  73. Nan, B.; Su, L.; Kellar, C.; Craig, N.J.; Keough, M.J.; Pettigrove, V. Identification of microplastics in surface water and Australian freshwater shrimp Paratya australiensis in Victoria, Australia. Environ. Pollut. 2020, 259, 113865. [Google Scholar] [CrossRef]
Figure 1. Shrimp sample trawling in different functional areas in the site. The Haizhou Bay Marine Ranch is strategically situated in the southwestern Yellow Sea, approximately 15–25 km offshore from Lianyungang City, Jiangsu Province, China. The red arrow indicates the geographic location of the Hai Chau Bay Sea Ranch.
Water 17 01495 g001
Figure 2. Distribution of microplastics in the gastrointestinal tracts of different species.
Water 17 01495 g002
Figure 3. Comparison of the distribution of MPs in the gastrointestinal tracts of dominant species. (A) indicates the comparison of MPs abundance in the stomach of different dominant species, (B) indicates the comparison of MPs in the intestine between different dominant species, and (C) indicates the comparison of MPs abundance in the stomach and intestine of dominant species. AD: A. distinguendus, OO: O. oratoria, AJM: A. japonicus. Letters above the box plots indicate the results of the Kruskal-Wallis test (p < 0.05), and the same letter indicates a nonsignificant difference between groups.
Water 17 01495 g003
Figure 4. Kernel density distribution curves for the size of microplastics in the gastrointestinal tracts of dominant species: (A) A. distinguendus, (B) A. japonicus, (C) O. oratoria.
Water 17 01495 g004
Figure 5. Abundance visualization and Euclidean cluster analysis of microplastics in the gastrointestinal tracts of dominant species from different body-length groups. AD: A. distinguendus, OO: O. oratoria, AJM: A. japonicus.
Water 17 01495 g005
Figure 6. Abundance of microplastics in the gastrointestinal tracts of dominant species in relation to stable isotopes: (A) stomach, (B) intestines.
Water 17 01495 g006
Figure 7. Abundance of microplastics in the stomachs of dominant species as a function of trophic level: (a) A. distinguendus, (b) A. japonicus, (c) O. oratoria.
Water 17 01495 g007
Figure 8. Evaluation of microplastic hazard index in the dominant species of shrimp in the marine ranch of Haizhou Bay. AD: A. distinguendus, OO: O. oratoria, AJM: A. japonicus.
Water 17 01495 g008
Table 1. Quantity of shrimp trawling.
SpeciesA. distinguendus
(De Man, 1909)
Alpheus japonicus (Miers, 1884)Exopalaemon carinicauda
(Holthuis, 1950)
Metapenaeus joyneri
(Miers, 1879)
O. oratoriaPalaemon graviera
(Rathbun, 1914)
Number4134135915
IRI2240.192624.84334.34162.2513,176.3478.60
Table 2. Significance results of Kruskal–Wallis test for microplastics in the gastrointestinal tracts of different body-length groups.
OrganSpeciesSignificance
StomachA. distinguendus0.990
A. japonicus0.237
O. oratoria0.733
Gastrointestinal tractA. distinguendus0.598
A. japonicus0.799
O. oratoria0.628
Table 3. Correlation coefficients and significance of lg (MPs) in “dominant species’” stomachs for biological indicators.
Species13C15NTLs13C/15NCarapace Length (cm)Total Length (cm)Weight (g)
A. distinguendus−0.0030.0080.008−0.0440.1170.036−0.025
A. japonicus0.3410.361 *0.361 *0.2180.363 *0.385 *0.352 *
O. oratoria0.1530.1060.1060.23−0.181−0.193−0.244 *
Note: “*” denotes p-value < 0.05.
Table 4. Correlation coefficients and significance of lg (MPs) in “dominant species’” intestines for biological indicators.
Species 13C15NTLs13C/15NCarapace Length (cm)Total Length (cm)Weight (g)
A. distinguendusCorrelation coefficient0.314−0.396−0.396−0.092−0.274−0.1060.107
Sig. (2-tailed)0.1550.0680.0680.6850.2180.6390.635
A. japonicusCorrelation coefficient−0.0630.2420.2420.2820.0470.1440.027
Sig. (2-tailed)0.8220.3850.3850.3080.8680.6080.925
O. oratoriaCorrelation coefficient−0.1660.1270.127−0.0360.1020.0550.076
Sig. (2-tailed)0.2390.3690.3690.7990.4730.6980.594
Table 5. The results of the EDI and MOE risk assessments.
EDI (g/kg BW/d)MOE
Male8.17 × 10−83.06 × 10⁵
Female9.64 × 10−82.59 × 10⁵
Table 6. Canonical correspondence analysis of MPs between dominant species and environmental media.
pShapeColorPolymer TypeSize
Seawater–dominants0.7940.7510.6270.889
Sediment–dominants0.9450.2080.7790.699
Disclaimer/Publisher’s Note: The statements, opinions and data contained in all publications are solely those of the individual author(s) and contributor(s) and not of MDPI and/or the editor(s). MDPI and/or the editor(s) disclaim responsibility for any injury to people or property resulting from any ideas, methods, instructions or products referred to in the content.

