Abstract
Fluoride-enriched geothermal groundwater poses chronic health risks (e.g., dental and skeletal fluorosis) through prolonged exposure; nevertheless, hydrochemical-driven factors and the genetic mechanism of fluoride enrichment in such systems remain inadequately identified. This study employed hydrochemical characterization, isotopic tracing, and health risk models to elucidate the genetic mechanism of fluoride-enriched geothermal groundwater. The key findings reveal the following. (1) Geothermal groundwater (Cl-Na type; TDS 90–345 mg/L; pH 6.25–7.42) contrasts with alkaline river water (pH 7.48–8.05; SO4-Na/HCO3-Na) and saline seawater (TDS 23.9–28.2 g/L). Stable isotopes (δD, δ1⁸O) confirm atmospheric precipitation recharge with an elevation of 69–635 m. (2) The Self-Organizing Map algorithm categorized 30 geothermal samples into three groups: Cluster I—low temperature and pH, high TDS; Cluster II—high temperature, low F− concentration; and Cluster III—low TDS, and high pH and F− concentration. (3) Fluoride enrichment in Cluster III originated from the evaporite/fluorite dissolution under alkaline conditions and cation exchange interactions, while the inhibition of CaF2 dissolution by reverse cation exchange limited the accumulation of F− in Cluster II and Cluster III samples. (4) Health risks disproportionately affect children (80% high risk) and women, necessitating pre-use defluorination.
1. Introduction
Geothermal energy has attracted significant attention as a sustainable alternative to fossil fuels due to its extensive global distribution and minimal carbon footprint [1,2]. Recent assessments by the authorities indicate that China’s geothermal potential reaches 2.5 × 10²² J, with technically recoverable resources approximating 7.5 × 10²¹ J [3]. This vast energy reservoir has driven remarkable technological advancements in geothermal resource utilization [4,5,6,7]. However, while the exploitation of geothermal resources offers substantial benefits, it has also given rise to a range of geo-environmental problems, such as groundwater level declines, land subsidence, and water quality deterioration [8,9,10,11,12]. Therefore, the integration of hydrochemical analysis and research into the genetic mechanisms of geothermal resources constitutes a crucial foundation for the efficient utilization of these resources.
Hydrogeochemical fingerprinting and isotopic characteristics are indispensable tools for deciphering the evolution process of geothermal resources [13,14,15]. Distinct groundwater flow regimes, ranging from shallow meteoric circuits to deep crustal circulations, exhibit significant differences in ionic composition and isotopic characteristics [16,17]. Stable isotopes (δ2H, δ1⁸O) provide critical constraints on recharge processes. Ionic ratios effectively elucidate hydrogeochemical processes, including water–rock interactions, dissolution/precipitation, and cation exchange reactions [18,19]. In reservoir temperature estimation, multi-cation geothermometers exhibit varying levels of applicability: K-Mg equilibria (80–160 °C), Na-K calibrations (180–250 °C), and Na-Li correlations (>250 °C).
Fluorine plays a vital role in maintaining skeletal and dental health. However, excessive fluoride intake may cause adverse health effects, such as dental fluorosis and skeletal fluorosis. Groundwater containing fluoride concentrations above 1.0 mg/L is considered to be fluoride-enriched. The genetic mechanism of fluoride-enriched groundwater is a complex process primarily driven by various hydrogeochemical processes, including the dissolution of fluoride-bearing minerals, evaporative concentration, and cation exchange [20,21]. The coastal regions of Guangdong Province are known for their abundant geothermal resources. Previous studies have predominantly focused on the impact of seawater intrusion on the circulation and evolution of geothermal fluids; nevertheless, the hydrogeochemical characteristics and mechanisms of fluoride-enriched geothermal fluids have been relatively neglected. Deciphering the genetic mechanisms of fluoride-enriched geothermal resources is crucial for preventing the potential health hazards associated with the utilization of these geothermal resources.
To enhance the scientific understanding and sustainable utilization of geothermal resources, this study utilized an integrated research framework that incorporates field investigations, hydrochemical characteristics, and isotopic tracing techniques. The research objectives were centered on four critical aspects of geothermal groundwater systems: (1) determining hydrochemical characteristics and identifying the dominant controlling mechanisms; (2) identifying the recharge source and conducting a quantitative assessment of recharge elevation using isotopic characteristics; (3) elucidating the fluoride enrichment mechanisms through mineral dissolution equilibrium analysis and hydrogeochemical evaluations; and (4) performing a comprehensive health risk assessment of geothermal groundwater utilization by employing exposure pathway analyses and quantitative risk assessment models. These systematic investigations aim to establish a scientific foundation for optimizing geothermal resource exploitation, while ensuring environmental and public health protection.
2. Geological and Hydrogeological Setting
The study area is located in the southeast coastal region of China. Its topographical features mainly consist of basins, plains, hills, mountains, and tidal flats. The study area is situated within a subtropical maritime monsoon climate regime, exhibiting moderate thermal conditions with a mean annual temperature of 22.8 °C. Precipitation exhibits distinct seasonal variations, generating significant annual precipitation (2390 mm), with roughly 80% concentrated in the April–September monsoon period [22].
The strata outcropped in the study area include the Middle–Late Proterozoic, Sinian, Cambrian, Cretaceous, and Quaternary strata. The main rock types are metamorphic rocks, sedimentary rocks, and igneous rocks [23] (Figure 1). Metamorphic rock consists of gneiss and schist. Sedimentary rock is composed of clastic rocks and marine turbidite. Quaternary strata comprise gravel, sand, silt, and clay. Igneous rocks are closely related to the genetic mechanism of geothermal resources. In the study, granite is an important component of igneous rocks, accounting for more than 40%. Previous studies revealed that the primary geothermal heat source originates from the decay of radioactive elements in granites [24].
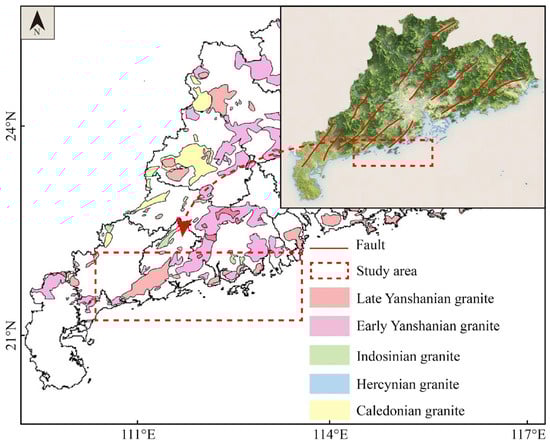
Figure 1.
Geological setting and distribution of the sampling sites.
In the study area, geothermal groundwater is predominantly localized at the intersection zones of fault networks. Tectonically, the region is situated at a triple junction where the Eurasian Plate, Pacific Plate, and Philippine Sea Plate interact. Several violent tectonic movements and multi-stage magma intrusions cause a series of deep faults and nearby secondary faults. The main tectonic activities occur in the Caledonian, the Indosinian, and the Yanshan–Himalayan [25]. Under the superimposed influence of several geological processes, a series of N-NE and N-NW trending faults are developed. As permeation and runoff channels, the existence of fault structure plays a vital role in the recharge and discharge of geothermal resources. In the study area, geothermal activity is predominantly associated with two distinct structural orientations. NNE- to NE-trending fault systems are interpreted as thermally dominant structures, primarily controlling the distribution and localization of heat sources within the subsurface [26]. In contrast, NW-oriented fault systems are considered to function as conductive pathways, facilitating both heat transfer and fluid migration. These structural orientations likely reflect differential stress regimes and tectonic histories, with NW-trending faults potentially representing reactivated shear zones that enhance permeability and hydraulic connectivity.
3. Sampling, Measurement, and Method
3.1. Sampling and Measurement
In order to identify the genetic mechanism of fluoride-enriched geothermal groundwater and assess the health risk to human health quantitatively, a total of 39 samples were collected from the coastal area of Guangdong province in 2024, including 30 geothermal groundwater samples, 5 river samples, 2 groundwater samples, and 2 sea water samples. Before the sampling, the bottles were pre-washed by the target sample, and all samples were filtered by 0.45 μm cellulose filters, which could ensure the accuracy of sample measurement and analysis. In addition, the sampling water was acidified by nitric acid for cation analysis, which could effectively avoid precipitation. After that, all sampling water was stored in a refrigerator at 4 °C for transportation.
For the in situ test, the physicochemical parameters, including water temperature (T, °C), pH, and total dissolved solids (TDS, mg/L), were measured by the multi-parameter measuring instrument (HANNA, Laval, QC, Canada). For the laboratorial measurement, the sample testing is conducted by Guirui Testing Technology (Beijing) Co., LTD (Beijing, China).
The cations (K⁺, Ca2⁺, Na⁺, and Mg2⁺) were quantified using inductively coupled plasma–optical emission spectrometry (ICP-OES). Bicarbonate (HCO₃−) concentrations were determined via acid titration with standardized solutions (0.025 mol/L). Sulfate (SO42−) and chloride (Cl−) ions were analyzed using ion chromatography. The δD and δ18O isotopes were measured by the water isotope analyzer LGR-DLT-100. The Vienna Standard Mean Ocean Water (VSMOW) was considered the reference.
The reliability of hydrochemical analysis results was assessed using the charge balance error (CBE), as indicated by Equation (1) [15]. The CBE value exceeding 10% suggests that the measurement results are unreliable and unacceptable. Conversely, a CBE value below 10% indicates that the hydrochemical analysis results are credible and can be accepted for further study. Under such circumstances, the ion concentrations obtained can be effectively utilized in hydrochemical analysis. The test results indicated that the CBE of all samples was less than 10%. Thus, the test results can be used for hydrogeochemical analysis.
3.2. Self-Organizing Map (SOM)
The Self-Organizing Map (SOM), a machine learning algorithm pioneered by Kohonen [27], has emerged as a robust machine learning technique for deciphering complex hydrogeochemical patterns. Distinct from the conventional multivariate analyses (e.g., principal component analysis, hierarchical clustering), this approach demonstrates unique advantages through its self-adaptive nature and nonlinear processing capabilities [28,29]. The algorithm’s core strength lies in its topological preservation mechanism, enabling effective dimensionality reduction while maintaining essential geochemical relationships. Through competitive learning processes, SOM projects high-dimensional hydrogeochemical datasets into organized two-dimensional lattices where spatial proximity reflects chemical similarity.
In the constructed SOM architecture, each neuron represents a prototype vector that encapsulates specific hydrogeochemical signatures. Notably, geothermal groundwater samples mapped to identical neurons exhibit statistically indistinguishable characteristics, whereas their spatial distribution patterns within the matrix reveal evolutionary associations between water groups. This visualization framework allows for the simultaneous interpretation of variable weight matrices and sample clustering patterns, providing critical insights into dominant hydrogeochemical processes. The SOM implementation follows a rigorous computational workflow comprising two principal phases: self-organizing training and feature map generation. Our methodology incorporates three critical optimization stages: (1) initial network configuration determined through empirical formula [m = 5], where n denotes sample size; (2) neural matrix optimization using dual error metrics, i.e., quantization error (QE) for clustering accuracy and topographic error (TE) for topological preservation; (3) and cluster validation through Davies–Bouldin Index (DBI) minimization to ensure optimal group separation.
The SOM analysis, conducted on 30 geothermal samples, included 11 hydrochemical parameters (K⁺, Ca2⁺, Na⁺, Mg2⁺, HCO₃−, Cl−, SO₄2−, F−, pH, T, TDS). Algorithm execution wasperformed using MATLAB R2021b.
4. Results
4.1. Hydrochemistry Characteristics
Geothermal groundwater samples exhibited a wide range of total dissolved solid (TDS) values, spanning 564 mg/L to 9861 mg/L, with a mean value of 4451 mg/L. The pH value of these samples ranged between 7.00 and 8.30, indicating a predominantly neutral-to-alkaline environment. Regarding the ionic composition, the major cations in the geothermal groundwater were present in the order of Na+ > Ca2+ > K+ > Mg2+, while the anions followed the sequence of Cl− >SO42− > HCO3−. The geothermal groundwater was characterized by a Cl-Na type (Figure 2). As summarized in Table 1, the coefficient of variation (CV) for Na+, Ca2+, Mg2+, Cl−, SO42−, and HCO3− displayed substantial variability, which underscores the complexity and diversity of the hydrochemical factors influencing the characteristics of geothermal groundwater. Additionally, the fluoride (F−) concentrations in the samples ranged from 3 to 12 mg/L, with an average of 4.7 mg/L. Given that all samples possessed F− concentrations higher than 1.0 mg/L, they can be classified as fluoride-enriched geothermal groundwater.
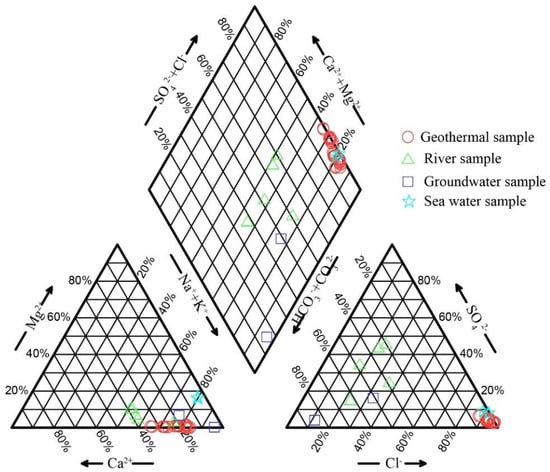
Figure 2.
The Piper diagram of the collected samples.

Table 1.
The hydrochemistry and isotope results of the collected samples.
Groundwater samples exhibited a slightly acidic-to-neutral pH environment (6.25–7.42, average value of 6.84) with moderate mineralization (TDS 90–345 mg/L, average value of 217 mg/L), dominantly classified as a HCO3-Na type (Figure 2). River samples demonstrated a neutral-to-weakly alkaline environment (pH 7.48–8.05, and TDS 54–114 mg/L), displaying mixed hydrochemical characteristics of SO4-Na and HCO3-Na type (Figure 2). Comparatively, seawater maintained a near-constant alkaline pH (7.80–7.85) with significantly elevated salinity (TDS 23.9–28.2 g/L), reflecting typical marine hydrochemical characteristics.
4.2. Isotope Characteristic
Stable isotope signatures serve as critical tracers in elucidating the provenance, residence time, and hydrogeochemical evolution of groundwater. As summarized in Table 1, the analyzed samples exhibited distinct isotopic fingerprints between geothermal groundwater and sea water. The geothermal waters demonstrated relatively depleted isotopic compositions, with δD values ranging between −47.0‰ and −35.0‰ (average value of −41.0‰), coupled with δ1⁸O values ranging from −8.2‰ to −5.1‰ (average value of −6.5‰). In contrast, sea waters displayed significantly enriched signatures, characterized by δD and δ1⁸O values varying from −17.3‰ to −7.9‰, and −5.2‰ to −1.4‰, respectively. The isotopic distribution patterns presented in Figure 3 provide critical insights into hydrological recharge processes. All samples plot along the Global Meteoric Water Line (GMWL: δD = 8δ1⁸O + 10). In addition, few geothermal groundwater samples display systematic isotopic deviations characterized by rightward shifts below the GMWL, indicative of oxygen isotope exchange associated with water–rock interactions.
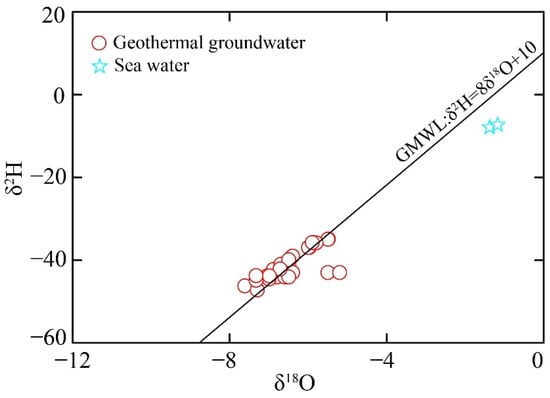
Figure 3.
The δ2H-δ18O value of geothermal and shallow groundwater in the study area.
4.3. SOM Clustering Results
In this study, a dataset of 30 geothermal groundwater samples was analyzed. The dataset included measurements of 11 different hydrochemical variables: K+, Ca2+, Na+, Mg2+, HCO3−, SO42−, Cl−, NO3−, F−, pH, and temperature (°C). Based on the empirical formula, a 6×5 neuron grid was selected for the neural matrix. As shown in Figure 4a, the color scheme in the SOM visualization represents the magnitude of the neuron parameters, with yellow indicating high values and blue indicating low values.
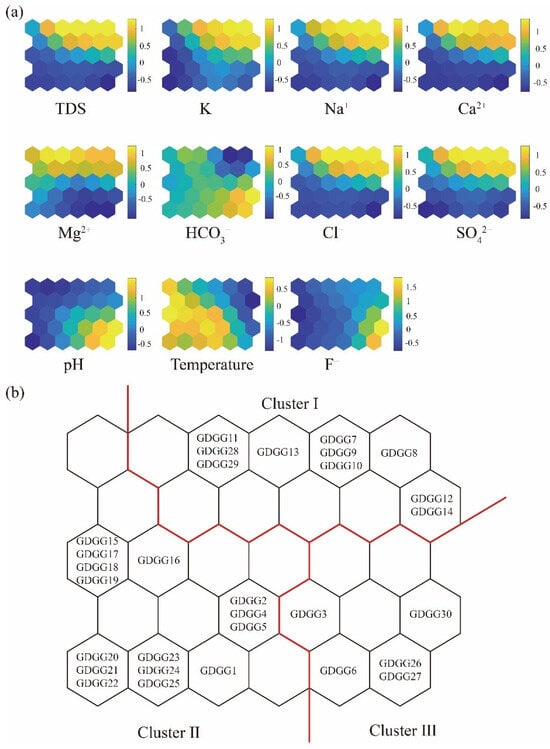
Figure 4.
(a) Component planes of the SOM, illustrating the weight vector values of the 11 variables. Neurons are color-coded, with blue and yellow representing low and high parameter values, respectively. (b) Cluster formation pattern of geothermal groundwater with red solid lines indicating clustering boundaries.
The color gradient variations among the eleven hydrochemical variables offer an effective visualization tool for deciphering hydrogeochemical processes (Figure 4b). The comparative analysis of these gradients reveals four distinct relationships. Firstly, the nearly identical gradients between Na+ and Cl−, increasing from the lower left to the upper right, suggest a common origin, likely attributable to a halite dissolution. Secondly, the similar gradients between Ca2+ and SO42−, decreasing from the top right to the bottom left, were consistent with the gypsum dissolution or precipitation dynamics. Thirdly, the divergent gradients between Ca2+ and HCO3− imply potential cation exchange or carbonate precipitation. Finally, the parallel gradients, declining from the lower right to the upper left, indicate that the F− concentration in geothermal groundwater is influenced by pH variability.
The Davies–Bouldin Index (DBI) analysis reveals that the geothermal groundwater samples can be categorized into three distinct clusters (Table 2), each exhibiting notable differences in hydrochemical composition. The calculation steps of the DBI value can be referred to Kohonen [27]. While fluoride (F−) concentrations in all samples surpass the permissible limit, significant variations were observed among the clusters. Cluster I comprises ten samples (33.3%), characterized by relatively low temperatures, low pH, and elevated total dissolved solids (TDS). Cluster II, which includes the majority of samples (53.3%), displayed the lowest F− concentrations among the three clusters, along with higher temperatures, defining it as a “high-temperature, low F− concentration” group. The remaining four samples (13.4%) constituted Cluster III, distinguished by an alkaline pH, low TDS, and exceptionally high F− levels, exceeding regulatory standards. Consequently, Cluster III is classified as a “low TDS, high pH, and high F−”.
Table 2.
The Davies–Bouldin indices (DBI) of different clustering.
5. Discussion
5.1. Recharge Source
Stable isotopes of δD and δ18O serve as effective tracers for determining the recharge sources and elevation of geothermal groundwater systems. The isotopic altitude effect generally shows a negative correlation between recharge elevation and δD/δ18O values, with higher elevations typically associated with more depleted isotopic compositions. As is shown in Figure 3, the analysis results indicate atmospheric precipitation as the primary recharge source for geothermal groundwater. To quantitatively estimate the recharge elevation, four distinct methodological approaches were used [30]:
where h represents the sampling elevation (m), while H denotes the recharge elevation (m). The δD value of local precipitation (δP) and the isotopic altitudinal gradient (K) were determined as −37.3‰ and −2‰/100m [31,32], respectively.
H = h + (δD − δP)/K
H = −50(δD + 27)
δ18O = −0.0031H − 6.2
δD = −0.026H − 30.2
The recharge area temperature is estimated by the following equation [30]:
where T (°C) is the temperature of the recharge area.
δD = 3T − 92
δD = 5.6T − 100
δ18O = 0.695T − 13.6
δ18O = 0.176T − 10.39
δ18O = (0.521 ± 0.014)T − (14.96 ± 0.21)
The calculated results are summarized in Table 3. The average value of recharge elevation ranged from 69 m to 635 m, and the average temperature of the recharge area was approximately 13~18 °C. Within the northwestern part of the study area, mountains ranging from 500 m to 1200 m in elevation were considered the primary recharge area for geothermal groundwater. Temperatures at the mountain summits averaged approximately 15 °C, a value consistent with typical recharge zone temperatures.
Table 3.
The recharge elevation of geothermal groundwater.
5.2. Hydrogeochemical Processes
The F− concentrations of 30 geothermal samples are all greater than 1 mg/L, classifying as the fluoride-enriched geothermal groundwater. The results of the Self-Organizing Map (SOM) reveal that geothermal groundwater samples could be divided into three groups with distinct hydrochemical characteristics: (i) Cluster I: low temperatures, low pH, and high TDS, (ii) Cluster II: high temperature, low F− concentration, and (iii) Cluster III: low TDS, high pH, and high F−. This section analyzes the differences in hydrogeochemical processes among the three groups by examining water–rock interactions, mineral saturation indices, alkaline environment, and cation exchange.
5.2.1. Water–Rock Interactions
Ionic ratios serve as critical indicators for delineating hydrochemical processes in geothermal systems. Gibbs diagrams effectively differentiate dominant mechanisms such as evaporative function, rock–water interactions, and atmospheric precipitation [33]. As illustrated in Figure 5, geothermal groundwater samples exhibited Na⁺/(Na⁺+Ca2⁺) ratios ranging from 0.65 to 0.96, and Cl−/(Cl−+HCO3−) ratios ranging from 0.63 to 1.00. The samples clustered predominantly within the central region of the Gibbs diagram, suggesting that the water–rock interaction controls hydrochemical evolution. Furthermore, the large range of Na+/(Na++Ca2+) ratios in geothermal groundwater implies the occurrence of cation exchange interactions [15,30].
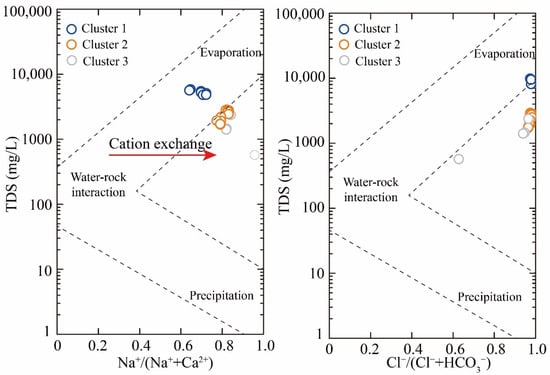
Figure 5.
Gibbs diagram.
The bivariate plots of Ca2⁺/Na⁺ versus Mg2⁺/Na⁺, and Ca2⁺/Na⁺ versus HCO₃−/Na⁺ reveal that geothermal water samples predominantly cluster within the evaporite rock domains (Figure 6). To further identify the principal source of ionic, the ionic ratios, including (Na⁺+K⁺)/Cl− and (Ca2⁺+Mg2⁺)/(HCO₃−+SO₄2−), were employed. As shown in Figure 7a, the ionic ratio of Na⁺/Cl− of Cluster 3 samples exhibited remarkable consistency with the 1:1 line, demonstrating that chloride ions in these clusters predominantly originate from the dissolution of evaporite minerals, specifically halite and sylvite. Furthermore, the (Ca2⁺+Mg2⁺)/(HCO₃−+SO₄2−) ratio served as an effective hydrochemical indicator for distinguishing weathering processes between carbonate minerals (calcite, dolomite, etc.) and sulfate minerals (gypsum, magnesium sulfates, etc.). Notably, Cluster 3 samples were distributed along the 1:1 line, indicating that the dissolution of carbonate and sulfate mineral is the principal source of Ca2⁺, Mg2⁺, HCO₃−, and SO₄2− (Figure 7b). However, Cluster 1 and Cluster 2 samples were characterized by the lowest ratio (Na++K−)/Cl− and the highest ratio of (Ca2++Mg2+)/(HCO3−+SO42−), suggesting that other hydrogeochemical processes influenced the ion equilibrium.
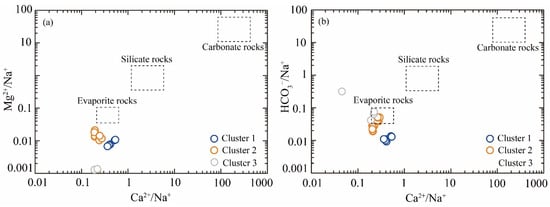
Figure 6.
The bivariate plots of molar ratios: (a) Ca2+/Na+ vs. Mg2+/Na+; and (b) Ca2+/Na+ vs. HCO3−/Na+.
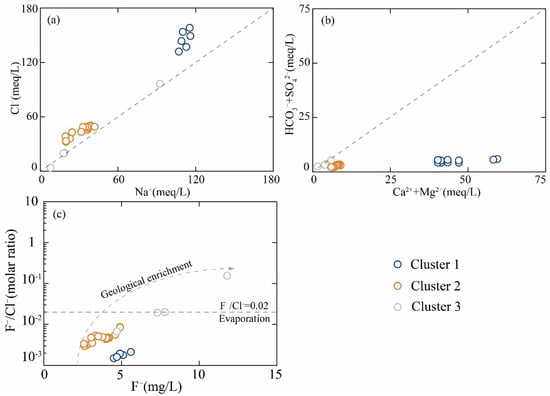
Figure 7.
The ionic ratio of (a) Na+ vs. Cl−, (b) Ca2++Mg2+ vs. HCO3−+SO42−, and (c) F− vs. F−/Cl−.
The F−/Cl− molar ratio served as an efficient tool for discriminating between geogenic and evaporative origins of fluoride enrichment in geothermal groundwater systems. Figure 7c reveals a positive correlation between F− concentrations and F−/Cl− ratios in each cluster. This co-enrichment pattern precludes evaporative concentration as the dominant mechanism, as evaporative processes would proportionally amplify Cl− and F− concentrations without altering their ratio. The observed decoupled behavior strongly supports a lithologically controlled fluoride source, wherein prolonged water-r-ock interactions (e.g., dissolution of fluoride-bearing minerals) govern the hydrogeochemical evolution of the geothermal aquifer.
5.2.2. Mineral Dissolution
The saturation index (SI) is of vital significance, as it reflects the state of specific minerals within geothermal systems. In this study, the SI values for fluorite in Cluster 2 and Cluster 3 samples, calculated by the PHREEQC Version 3 software, were found to be below 0 (Figure 8a), revealing that fluorite is in an unsaturated state. This observation suggests that the elevated F− concentration in geothermal groundwater may stem from the dissolution of fluorite. Furthermore, a negative correlation between F− and Ca2⁺ was evident (Figure 8b), implying that an excess of Ca2⁺ might hinder the dissolution of fluorite. When compared to Cluster 1 and Cluster 2, Cluster 3 exhibited the lowest Ca2⁺ concentration and consequently the least inhibition of fluorite dissolution. This factor could potentially account for the highest F− concentration observed in Cluster 3 samples. Additionally, the SI value for calcite was found to be above 0 (Figure 8c), indicating that calcite is in a saturated or supersaturated state. The precipitation of calcite leads to a reduction in the Ca2⁺ concentration of geothermal groundwater, which, in turn, facilitates the dissolution of fluorite.
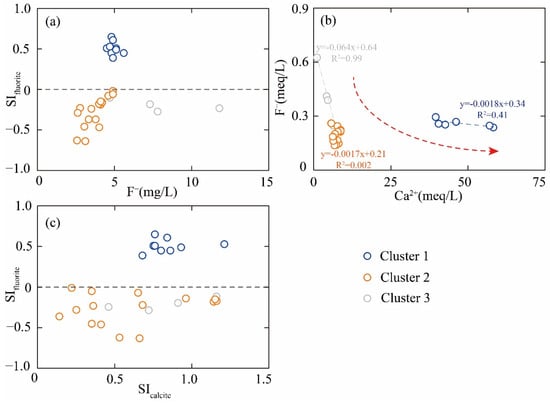
Figure 8.
The ionic ratio of (a) F− vs. SIfluorite, (b) Ca2+ vs. F−, and (c) SIcalcite vs. SIfluorite.
Granite is widely distributed in the study area, with lithologies predominantly consisting of biotite monzogranite, granodiorite, and monzogranite. The primary constituent minerals include biotite, amphibole, potassium feldspar, plagioclase, and tourmaline. At the margin of magma intrusion enclaves, the granite body is prone to mingling with the magma, leading to metasomatism. This geological process facilitates the recrystallization of fluorite [34]. During the circulation and evolution processes, geothermal groundwater undergoes water–rock interactions with the aquifer media, where the hydrolysis of fluorine-enriched minerals in the surrounding rocks serves as the significant source of fluoride in high-fluoride geothermal water in the study area.
5.2.3. Alkaline Environment
The solubility of fluoride in geothermal groundwater is significantly influenced by the pH value [30]. Specifically, the solubility of fluoride is minimized when the pH value is within the range of 5.0–6.5. In this study, the F− concentration in all geothermal samples increased with a rising pH (Figure 9). The pH values of Cluster 1, Cluster 2, and Cluster 3 were 6.77–7.34, 6.86–7.72, and 7.68–8.37, respectively. The F− concentrations of Cluster 2 and Cluster 3 samples showed relatively less sensitivity to pH variations. In contrast, the F− concentration was the highest in Cluster 3 samples, which exhibited the greatest sensitivity to the change inpH. The variation in F− concentration with pH could be attributed to the elevated concentration of OH−, which drives the chemical equilibrium of Equation (11) to shift to the right, thereby promoting the dissolution of CaF₂ [30]. Moreover, the similar ionic radii of F− and OH− facilitate the release of F− from fluorine-bearing minerals into geothermal groundwater through ion exchange interactions [29,30].
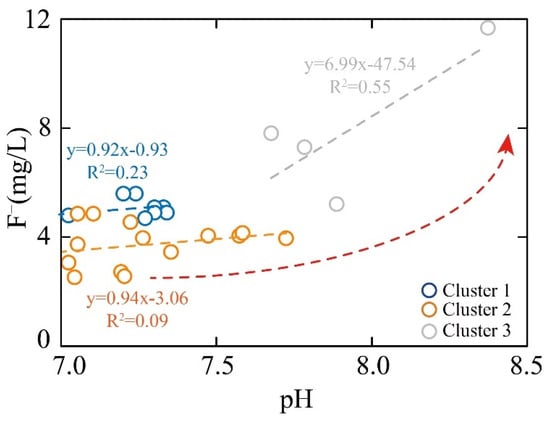
Figure 9.
The relationship of pH and F−.
5.2.4. Cation Exchange Interactions
The cation exchange interaction is a common hydrochemical process that regulates the ionic concentration in geothermal systems. The relationship between (Na++K+−Cl−) and (Ca2++Mg2+−HCO3−−SO42−), and chloro-alkaline indices is widely used to determine whether cation exchange is occurring. If the slope of the ionic ratio between (Na++K+−Cl−) and Ca2++Mg2+−HCO3−−SO42− is equal to −1, it indicates the occurrence of cation exchange in the groundwater environment. As shown in Figure 10a, most groundwater samples met this condition. The cationic exchange process was further judged by chlor-alkali index; the chemical equation is as follows [29]:
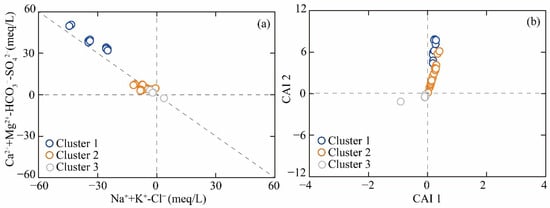
Figure 10.
The ionic ratio of (a) Na++K+−Cl− vs. Ca2++Mg2+−HCO3−−SO42−, and (b) CAI 1 vs. CAI 2.
Figure 10b illustrates that Custer 1 and Cluster 2 samples exhibited positive chloro-alkaline indices (CAI 1 > 0 and CAI 2 > 0), indicating the predominance of reverse cation exchange processes in the hydrochemical evolution [29,30]. Na⁺ and K⁺ ions in groundwater were replaced by Ca2⁺ and Mg2⁺ ions from the surrounding rock, which caused the decrease in Na+ and the increase in Ca2+ in geothermal groundwater. The elevated Ca2⁺ concentration subsequently suppressed the dissolution equilibrium of fluorite (CaF₂). The shift in ionic equilibrium toward the left (reactant side) consequently reduced F− concentration in geothermal waters. Therefore, the reverse cation exchange exerted a negative control on F− enrichment, rather than serving as a primary driving mechanism for fluoride accumulation [29,30]. This is the main reason for the low F− concentration in Cluster 1 and Cluster 2 samples.
The Cluster 3 samples had the negative value of CAI-1 and CAI-2, indicating the occurrence of positive cation exchange interactions (Figure 10b). The sodium adsorbed in clay minerals was replaced by the calcium in geothermal groundwater. The decrease in Ca2⁺ promoted the dissolution equilibrium of fluorite (CaF₂). Thus, the cation exchange interaction is an important hydrochemical interaction for regulating the F− concentration in Cluster 3 samples.
5.3. Human Health Risk Assessment
Quantifying health risks associated with contaminant exposure is critical for the sustainable exploitation and utilization of geothermal resources. Human Health Risk Assessment (HHRA) establishes a quantitative relationship between geothermal groundwater and human health impacts by evaluating potential hazards. The methodology involves calculating hazard quotients (HQs) for oral (HQOral) and dermal (HQDermal) exposure pathways across demographic groups (e.g., age and gender). These values are derived using the following equations [29]:
The empirical coefficients for Equations (16) and (17) are presented in Table 4. To evaluate potential non-carcinogenic effects from fluoride exposure through geothermal groundwater utilization, the total hazard index (HI) was computed using the following equation [29]:
Table 4.
The empirical parameters of the HHRA.
Fluoride-enriched geothermal groundwater may pose health risks to human health. The HHRA method was introduced to assess fluoride exposure risks in three groups: children, adult females, and adult males. The HITotal value is a key indicator of non-carcinogenic health effects, with values above 1 indicating significant health concerns needing intervention. As shown in Figure 11, the HITotal values for children range from 3.01 to 13.82, with an average value of 5.51. For adult females, the values are 1.76~8.08, with an average of 3.22. The HITotal value of adult males is from 1.29 to 5.93, averaging 2.36. The health risk order is children > adult females > adult males. Compared to adults, children are more susceptible to non-carcinogenic risks from fluoride-rich geothermal groundwater. This finding is consistent with the previous research results. The cause of this phenomenon may be due to children’s lower body weight and underdeveloped metabolism.
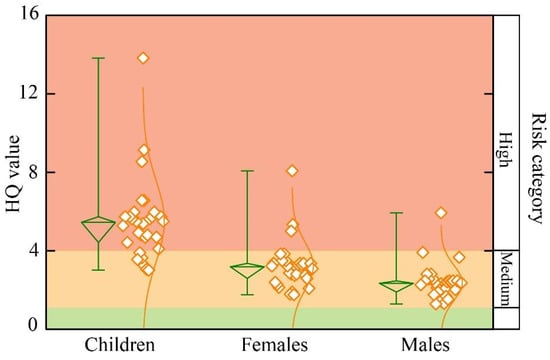
Figure 11.
Box plot of HQ value for fluoride-enriched geothermal groundwater.
6. Conclusions
This study used an integrated hydrogeochemical–isotopic approach, coupled with health risk assessment to elucidate the genetic mechanisms of fluoride-enriched geothermal groundwater in China’s southeastern coastal regions. The key findings are summarized as follows:
- (1)
- Geothermal groundwater exhibited Cl-Na type characteristics, with an elevated TDS (90–345 mg/L) and pH (6.25–7.42). All samples exceeded the fluoride threshold (>1.0 mg/L), classifying them as fluoride-enriched. Stable isotope signatures (δD and δ1⁸O) aligned with the Global Meteoric Water Line, indicating meteoric recharge from elevations of 69–635 m. Distinct hydrochemical contrasts emerged between geothermal groundwater (HCO₃-Na type), river water (mixed SO₄−Na/HCO₃−Na; pH 7.48–8.05), and seawater (high salinity: 23.9–28.2 g/L; pH 7.80–7.85).
- (2)
- SOM-based clustering categorizes 30 geothermal samples into three groups: Cluster I (33.3%) features lower temperatures/pH with high TDS; Cluster II (53.3%) shows elevated temperatures but reduced F− levels; and Cluster III (13.4%) displays optimal F− enrichment (low TDS, high pH). Fluoride mobilization primarily derives from evaporite dissolution (fluorite) and alkaline-driven water–rock interactions. Cluster III’s pronounced F− enrichment correlated with favorable alkaline conditions and cation exchange, while the suppressed CaF₂ dissolution in Clusters I and Cluster II due to reverse cation exchange limited fluoride accumulation.
- (3)
- Health risk assessments reveal significant fluoride exposure threats across demographics, with children exhibiting heightened vulnerability (80% of sampling sites pose high risks). Gender disparities indicate greater health impacts on females versus males. Mandatory defluorination measures are imperative prior to geothermal resource utilization to mitigate public health risks.
These findings provide critical insights for the sustainable management of fluoride-contaminated geothermal waters in coastal regions.
Author Contributions
Methodology, L.L.; Software, L.L. and S.Z.; Validation, L.L. and S.Z.; Formal analysis, S.Z.; Investigation, J.H. and L.W.; Data curation, L.W.; Writing—original draft, L.L.; Writing—review & editing, S.Z. and J.H.; Project administration, S.Z.; Funding acquisition, S.Z. All authors have read and agreed to the published version of the manuscript.
Funding
This research was supported by the Deep Earth Probe and Mineral Resources Exploration National Science and Technology Major Project (2024ZD1004103), the project of China Geological Survey (DD20221677-2), and the Chinese Academy of Geological Sciences Basal Research Fund (no. JKY202406, no. JKYZD202401, no. JKYQN202307).
Data Availability Statement
The original contributions presented in this study are included in the article. Further inquiries can be directed to the corresponding authors.
Acknowledgments
We are grateful to the editorial team for their guidance throughout the review process. We deeply appreciate the anonymous reviewers for their insightful comments and valuable feedback, which significantly improved the quality of this work.
Conflicts of Interest
The authors declare no conflict of interest.
References
- Mukherjee, I.; Singh, U.K. Groundwater fluoride contamination, probable release, and containment mechanisms: A review on Indian context. Environ. Geochem. Health 2018, 40, 2259–2301. [Google Scholar] [CrossRef] [PubMed]
- Wei, Z.-A.; Shao, H.; Tang, L.; Deng, B.; Li, H.; Wang, C. Hydrogeochemistry and geothermometry of geothermal waters from the Pearl River Delta region, South China. Geothermics 2021, 96, 102164. [Google Scholar] [CrossRef]
- Zhang, S.; Liu, K.; Yu, C.; Deng, Y.; Zhang, Y.; Jia, W. Identifying the genetic mechanism of medium–low temperature fluoride-enriched geothermal groundwater by the self-organizing map and evaluating health risk in the Wugongshan area, southeast China. Environ. Geochem. Health 2024, 46, 274. [Google Scholar] [CrossRef] [PubMed]
- Wang, J.Q.; Zhou, X.; Li, X.L.; Wang, M.M.; Shen, Y.; Fang, B. Chemical Characteristics and Origin Analysis of Hot Spring Water for Sheep Honey-eating in Lanping Basin, Yunnan Province. Geoscience 2017, 31, 822–831. [Google Scholar]
- Xiao, Y.; Shao, J.; Frape, S.K.; Cui, Y.; Dang, X.; Wang, S.; Ji, Y. Groundwater origin, flow regime and geochemical evolution in arid endorheic watersheds: A case study from the Qaidam Basin, northwestern China. Hydrol. Earth Syst. Sci. 2018, 22, 4381–4400. [Google Scholar] [CrossRef]
- Zhang, Y.; Dai, Y.; Wang, Y.; Huang, X.; Xiao, Y.; Pei, Q. Hydrochemistry, quality and potential health risk appraisal of nitrate enriched groundwater in the Nanchong area, southwestern China. Sci. Total Environ. 2021, 784, 147186. [Google Scholar] [CrossRef]
- Ye, X.Q.; Wu, G.D.; Yang, Y.; Huang, X. Hydrogen and Oxygen Stable Isotope Characteristics of Geothermal Spring Water in Shigaze Area, Tibet. J. Environ. Chem. 2022, 41, 2880–2895. [Google Scholar]
- Yeh, H.F.; Lee, C.H.; Hsu, K.C. Oxygen and hydrogen isotopes for the characteristics of groundwater recharge: A case study from the Chih-Pen Creek basin, Taiwan. Environ. Earth Sci. 2011, 62, 393–402. [Google Scholar] [CrossRef]
- Rashid, A.; Guan, D.-X.; Farooqi, A.; Khan, S.; Zahir, S.; Jehan, S.; Khattak, S.A.; Khan, M.S.; Khan, R. Fluoride prevalence in groundwater around a fluorite mining area in the flood plain of the River Swat, Pakistan. Sci. Total Environ. 2018, 635, 203–215. [Google Scholar] [CrossRef]
- Zhang, Y.; He, Z.; Tian, H.; Huang, X.; Zhang, Z.; Liu, Y.; Xiao, Y.; Li, R. Hydrochemistry appraisal, quality assessment and health risk evaluation of shallow groundwater in the Mianyang area of Sichuan Basin, southwestern China. Environ. Earth Sci. 2021, 80, 576. [Google Scholar] [CrossRef]
- Yuan, X.C.; Zhang, Y.H.; Wang, Y.; Huang, X.; Sun, M.; LÜ, G. Geothermal water chemical characteristics and scaling analysis of Xianshuihe fault zone. Sediment. Geol. Tethyan Geol. 2023, 43, 357–372. [Google Scholar]
- Qu, S.; Zhao, Y.; Zhang, K.; Wang, J.; Li, M.; Yang, X.; Ren, X.; Hao, Y.; Yu, R. Multi isotopes (δD, δ18Owater, 87Sr/86Sr, δ34S and δ18Osulfate) as indicators for groundwater salinization genesis and evolution of a large agricultural drainage lake basin in Inner Mongolia, Northwest China. Sci. Total Environ. 2024, 946, 174181. [Google Scholar] [CrossRef]
- Bromley, C.J.; Currie, S.; Manville, V.R.; Rosenberg, M.D. Recent ground subsidence at Crown Road, Tauhara and its probable causes. Geothermics 2009, 38, 181–191. [Google Scholar] [CrossRef]
- Zhou, X.; Ma, Z.Y.; Xi, L.P.; Dou, H.P. Study and Simulation of mixing action of thermal storage fluid in Xianyang City. Ground Water 2012, 34, 36–39. [Google Scholar]
- Qu, S.; Duan, L.; Mao, H.; Wang, C.; Liang, X.; Luo, A.; Huang, L.; Yu, R.; Miao, P.; Zhao, Y. Hydrochemical and isotopic fingerprints of groundwater origin and evolution in the Urangulan River basin, China’s Loess Plateau. Sci. Total Environ. 2023, 866, 161377. [Google Scholar] [CrossRef] [PubMed]
- Xing, L.N.; Zhan, Y.H.; Guo, H.M. Groundwater hydrochemical characteristics and processes along flow paths in the North China Plain. J. Asian Earth Sci. 2013, 70–71, 250–264. [Google Scholar] [CrossRef]
- Marandi, A.; Shand, P. Groundwater chemistry and the Gibbs Diagram. Appl. Geochem. 2018, 97, 209–212. [Google Scholar] [CrossRef]
- Zhang, W.; Tan, H.; Zhang, Y.; Wei, H.; Dong, T. Boron geochemistry from some typical Tibetan hydrothermal systems: Origin and isotopic fractionation. Appl. Geochem. 2015, 63, 436–445. [Google Scholar] [CrossRef]
- Qu, S.; Zhao, Y.; Li, M.; Zhang, K.; Wang, J.; Duan, L.; Ma, H.; Miao, P.; Yu, R. Spatio-seasonal characteristics and controlling factors of surface water stable isotope values (δ 18 O and δD) across the Inner Mongolia Reaches of the Yellow River Basin, China: Implication for hydrological cycle. J. Hydrol. Reg. Stud. 2024, 53, 101843. [Google Scholar] [CrossRef]
- Zhang, Y.; Xu, M.; Li, X.; Qi, J.; Zhang, Q.; Guo, J.; Yu, L.; Zhao, R. Hydrochemical Characteristics and Multivariate Statistical Analysis of Natural Water System: A Case Study in Kangding County, Southwestern China. Water 2018, 10, 80–96. [Google Scholar] [CrossRef]
- Yu, X.; Yuan, X.; Guo, H.; Zhang, Y.; Cao, H.; Luo, T.; Gong, Z.; Huang, H. Coupling Hydrochemistry and Stable Isotopes (δ2H, δ18O and 87Sr/86Sr) to Identify the Major Factors Affecting the Hydrochemical Process of Groundwater and Surface Water in the Lower Reaches of the Yarlung-Zangbo River, Southern Tibet, Southwestern China. Water 2022, 14, 3906. [Google Scholar] [CrossRef]
- Wang, X.; Lu, G.P.; Hu, B.X. Hydrogeochemical Characteristics and Geothermometry Applications of Thermal Waters in Coastal Xinzhou and Shenzao Geothermal Fields, Guangdong, China. Geofluids 2018, 2018, 8715080. [Google Scholar] [CrossRef]
- Lu, G.; Liu, R. Aqueous chemistry of typical geothermal springs with deep faults in Xinyi and Fengshun in Guangdong Province, China. J. Earth Sci. 2015, 26, 60–72. [Google Scholar] [CrossRef]
- Cao, J.J. Rare Earth Elements Geochemistry of Dongtian Gold Deposit in Western Guangdong. J. Rare Earths 2004, 4, 484–488. [Google Scholar]
- Chen, L.; Ma, T.; Du, Y.; Xiao, C.; Chen, X.; Liu, C.; Wang, Y. Hydrochemical and isotopic (2H, 18O and 37Cl) constraints on evolution of geothermal water in coastal plain of Southwestern Guangdong Province, China. J. Volcanol. Geotherm. Res. 2016, 318, 45–54. [Google Scholar] [CrossRef]
- Lin, Y.; Gao, L.; Li, S.; Wang, Z.; Ye, Z.; Chen, J.; Yang, Z. Hydrogeochemical characteristics and source identification of geothermal waters in Jiangmen, Guangdong Province. Environ. Chem. 2020, 39, 512–523. [Google Scholar]
- Kohonen, T. Self-organized formation of topologically correct feature maps. Biol. Cybern. 1982, 43, 59–69. [Google Scholar] [CrossRef]
- Mao, H.; Wang, G.; Rao, Z.; Liao, F.; Shi, Z.; Huang, X.; Chen, X.; Yang, Y. Deciphering spatial pattern of groundwater chemistry and nitrogen pollution in Poyang Lake Basin (eastern China) using self-organizing map and multivariate statistics. J. Clean. Prod. 2021, 329, 129697. [Google Scholar] [CrossRef]
- Qu, S.; Duan, L.; Shi, Z.; Mao, H.; Wang, G.; Liu, T.; Yu, R.; Peng, X. Identifying the spatial pattern, driving factors and potential human health risks of nitrate and fluoride enriched groundwater of Ordos Basin, Northwest China. J. Clean. Prod. 2022, 376, 134289. [Google Scholar] [CrossRef]
- Zhang, J.; Yao, D. Hydrogeochemical characteristics of coal mine based on box-plot and its application in water inrush source identification. Energy Sources Part A Recovery Util. Environ. Eff. 2024, 46, 11167–11180. [Google Scholar] [CrossRef]
- Moussaoui, I.; Rosa, E.M.; Cloutier, V.; Neculita, C.M.; Dassi, L. Chemical and isotopic evaluation of groundwater salinization processes in the Djebeniana coastal aquifer, Tunisia. Appl. Geochem. 2023, 149, 105555. [Google Scholar] [CrossRef]
- Zhang, F.; Li, Y.; Zhao, C.Y. Geochemical behaviors of rare earth elements in granite-hosted geothermal systems in SE China. Geothermics 2023, 115, 102826. [Google Scholar] [CrossRef]
- Gibbs, R.J. Mechanisms Controlling World Water Chemistry. Science 1970, 170, 1088–1090. [Google Scholar] [CrossRef]
- Wu, C.; Wu, X.; Zhang, Y.S. Distribution characteristics and genesis of high-fluoride groundwater in the Niuxin Mountain, Oinhuangdao. Earth Sci. Front. 2018, 25, 307–315. [Google Scholar]
- GB/T 17017-2010; Chinese Ministry of Health. Control Criteria for Endemie Fluorosis Areas. National Disease Control and Prevention Administration: Beijing, China, 2010.
- USEPA. Risk Assessment Guidance for Superfund Volume I: Human Health Evaluation Manual (Part E Supplemental Guidance for Dermal Risk Assessment); EPA/540/R/99/005; Office of Superfund Remediation and Technology Innovation: Washington, DC, USA, 2004.
- USEPA. Drinking Water Standards and Health Advisories; Office of Water, U.S. Environmental Protection Agency: Washington, DC, USA, 2012.
- USGS. National Water Summary 1990–1991: Hydrologic Events and Stream Water Quality; Water Supply Paper 2400; U.S. Geological Survey: Reston, VA, USA, 1993; p. 59.
- WHO. WHO Guidelines for Drinking-Water Quality, 4th ed.; World Health Organization: Geneva, Switzerland, 2011. [Google Scholar]
Disclaimer/Publisher’s Note: The statements, opinions and data contained in all publications are solely those of the individual author(s) and contributor(s) and not of MDPI and/or the editor(s). MDPI and/or the editor(s) disclaim responsibility for any injury to people or property resulting from any ideas, methods, instructions or products referred to in the content. |
© 2025 by the authors. Licensee MDPI, Basel, Switzerland. This article is an open access article distributed under the terms and conditions of the Creative Commons Attribution (CC BY) license (https://creativecommons.org/licenses/by/4.0/).