Article

Urban Flood Risk Assessment Based on DEMATEL-ANP Hybrid Fuzzy Evaluation and Hydrodynamic Model

College of Environmental Science and Engineering, Tongji University, Shanghai 200092, China
*
Author to whom correspondence should be addressed.
Water 2025, 17(10), 1494; https://doi.org/10.3390/w17101494
Submission received: 20 March 2025 / Revised: 27 April 2025 / Accepted: 12 May 2025 / Published: 15 May 2025
(This article belongs to the Section Urban Water Management)

Abstract

:
The escalating severity of urban flood issues endangers both civilian security and property safety. Urban flood risk assessment delivers critical guidance for urban flood risk management and flood-prevention planning. This study introduces a hybrid methodological model for assessing urban flood risks that integrate scenario simulation and index system methodologies. A hydraulic model was established to simulate water accumulation scenarios in urban areas, thereby acquiring requisite data for the index system. The causal dependencies among indexes were identified through the Decision-Making Trial and Evaluation Laboratory (DEMATEL) method, while indexes weights were obtained by hybridized Analytic Network Process (ANP) method. Finally, a fuzzy comprehensive evaluation (FCE) method is applied to complete the risk assessment. The results showed that the area proportions corresponding to the five risk levels (low risk, relatively low risk, moderate risk, relatively high risk, and high risk) in the study area are 68.98%, 22.75%, 0.86%, 0.10%, and 7.31%, respectively. By using the raster calculation method, the model evaluation can achieve a 10 m × 10 m spatial resolution, which is suitable for fine simulation at small scales within the city, and provides specific high-risk locations for flood-prevention planning.

1. Introduction

Regarded as a common environmental hazard, frequent urban flood ranks among the most pressing issues facing modern societies [1]. Urban flood is operationally defined to the occurrence where continuous precipitation or intense rainfall occurs within a short period, exceeding the absorption thresholds of engineered drainage systems and flood prevention capacity of urban areas, resulting in water accumulation and flood disasters [2]. Currently, the rapid growth of urban areas, along with the resultant climate change and alterations in land-use types, is considered a primary cause of urban flood [3]. In terms of climate change, carbon dioxide emissions exacerbate the urban heat island effect, leading to an increased frequency of heavy and extreme rainfall events [4]. Regarding changes in land-use types, the expansion of urbanized land consumption, and the increase in impenetrable ground cover water cycle dynamics such as infiltration, evaporation, and surface runoff, thereby elevating the urban flood risk. Furthermore, unplanned urban growth and inadequate management of drainage facilities are also significant contributors in the emergence of urban flood [5].
China is suffering from the adverse impacts of urban flood, with the frequency and severity of urban flood incidents continuously increasing. During a three-day period starting 19 July 2021, Zhengzhou experienced an unprecedented torrential rainstorm, resulting in approximately 300 fatalities and affecting 14.786 million residents, with direct economic damages soaring to as much as 53.2 billion yuan [6]. From 27 July to 1 August 2023, Hebei Province and the surrounding Beijing-Tianjin-Hebei region were struck by extreme heavy rainfall, with localized areas in the Taihang Mountain front receiving over 1000 mm of precipitation [7]. Approximately 3.8886 million residents in Hebei Province were impacted by this flood disaster, resulting in direct economic damages amounting to 95.811 billion yuan. According to the 2023 China Flood and Drought Disaster Prevention Bulletin, over the decade from 2013 to 2023, tens of millions of people nationwide were affected by flood annually, with direct economic losses exceeding hundreds of billions of yuan each year. It is evident that urban flood disasters have a profound impact on the socio-economic progress of China and the safety and property of its residents.
Although it is impossible to completely prevent the occurrence of heavy rainfall events, effective management of flood risk can significantly mitigate the impacts of flood disasters [8]. Through flood risk analysis, it is possible to identify potential high-risk locations for flood, enabling the development of appropriate flood-prevention planning and the implementation of various measures aimed at reducing the severity of flood disasters and minimizing associated losses. Given the necessity of flood risk management, selecting appropriate methods for urban flood risk assessment, accurately identifying high-risk areas among numerous classification criteria to implement effective flood prevention and control measures, thereby achieving the goal of managing urban flooding, has emerged as an important area of research [9].
Currently, there is no unified evaluation standard for flood risk assessment. Scholars have adopted diverse methodologies based on their research focuses, primarily utilizing historical statistical analysis [10,11], scenario simulation [12,13], and index system methods [14,15]. However, each of these methods has its own limitations [16]. Historical statistical methods rely on accurate, complete, and continuous disaster data, which can be challenging to obtain. Moreover, with the advancement of urbanization, changes in surface environments and meteorological factors have further diminished the applicability of this method. The scenario simulation method only evaluates the riskness of the hazard-causing factors, without incorporating the hazard-formative environment and the hazard-affected bodies into a comprehensive assessment framework, which limits its application in disaster management decision-making that necessitates a thorough evaluation of various factors. In the case of index system method, the indexes are primarily at the urban scale, making it difficult to refine assessments to the street or intersection level, which is not suitable for detailed evaluations of urban flood risks. Therefore, this study adopts a comprehensive method that integrates both the index system method, and scenario-based simulation technique, tackling the limitations in each individual method.
When applying the index system methodology to assess the flood risk, it is crucial to establish the index weights. The determination of index weights is a crucial step in conducting urban flood risk assessments using the index system method. Many methods for assessing the risk of urban flood are based on the Analytic Hierarchy Process (AHP) [17,18,19]. As an example, Duan et al. [20] considered the AHP method to be a widely accepted Multi-Attribute Decision-Making (MADM) approach, and they employed this method to assess the flood risk in Changchun City. Most MADM methods typically require the assumption of criterion independence, neglecting the intercorrelations that inherently exist among them [21]. This fundamental premise proves inadequate for urban flood risk assessment where complex interdependencies exist among evaluation indexes [22]. For instance, topographical factors significantly influences the max depth of flood [23]. The Analytic Network Process (ANP), a MADM method, can be utilized to determine the weights of indexes while allowing for dependency relationships among them [24]. However, the ANP method requires multiple pairwise comparisons, and this process is effortful and may lead to inconsistencies in results [25]. Additionally, the causal dependencies among flood risk indexes remain to be fully explored. The Decision-Making Trial and Evaluation Laboratory (DEMATEL) method, a system developed based on graph theory that employs causal impact diagrams to address complex relationships among indexes [26], can be applied to resolve this issue and enhance the subjective evaluation limitations of the ANP method [27]. The DEMATEL-ANP hybrid technique has been successfully applied in the evaluative analysis of various fields, including water resource and environmental management [28], energy planning [29], and market analysis [30]. The DEMATEL-ANP method has seen certain applications in the field of flood risk assessment in recent years [22,31,32]. As evidenced by Taherizadeh et al.’s study [33], this methodology was successfully applied to develop flood susceptibility maps for Golestan Province, Iran, through systematic integration of remote sensing-derived geomorphological parameters.
In addition, in the course of flood risk assessment, it is essential to determine the risk levels. The term “high risk” is a vague qualitative statement that needs to be transformed into a concept that can be quantitatively evaluated. The fuzzy comprehensive evaluation (FCE) method effectively addresses the ambiguity in risk classification. For instance, Cui et al. [34] established an urban community resilience framework using the FCE method, which effectively measured the resilience of urban communities in the aftermath of flood disasters. Li et al. [35] used the FCE method to assess flood risk based on a socio-economic indicator system from both single-factor and multi-factor dimensions. Shaikh et al. [36] also achieved good flood risk assessment results using linear fuzzy membership functions and the AHP method, finding that the risk maps based on fuzzy logic exhibited the highest consistency when compared to natural breakpoint classification.
This study aims to establish a practical and effective model for assessing flood risk. The assessment model determines index weights through the hybrid DEMATEL-ANP method, combines the FCE method for systematic assessment, and generates risk distribution maps through ArcGIS software 10.2 version, making it suitable for fine-scale assessments within urban areas. The model provides a basis for the planning and implementation of urban flood mitigation measures.

2. Materials and Methods

2.1. Index System for Flood Risk Assessment

Based on the theory of district disaster system [37], this study categorizes the flood risk indexes into three clusters: riskiness of hazard-causing factors, stability of hazard-formative environment, and vulnerability of hazard-affected bodies. In order to conduct this assessment, after consulting various experts and conducting a scoping review of relevant studies, this study selected 11 primary indexes for quantitative assessment, and the structure is presented in Figure 1. Si (I = 1, 2, 3) denotes the i-th cluster, and sij (j = 1, 2, 3, 4) denotes the j-th index within the i-th cluster.
In the urban flood risk assessment index system, the cluster of the riskiness of hazard-causing factors contains four indexes: total flood duration, max depth of flood, flood area, max speed of two-dimensional (2D) water flow. These four indexes reflect the direct risk of urban flood, enabling the identification of the intensity and spatial location of flood occurrences. Total flood duration indicates the length of time that the flood persists. Prolonged flood can affect the daily lives of residents and transportation. Max depth of flood represents the vertical level of accumulated water. Deeper water impedes rescue operations and paralyzes traffic by submerging vehicles and infrastructure. Flood area reflects the spatial coverage of inundation. A larger affected area implies a higher population exposed to flood hazards. Max speed of 2D water flow refers to the maximum surface runoff velocity. Higher velocities generate greater impact forces, which may sweep away pedestrians or vehicles and exacerbate structural damage to buildings. Relevant data were obtained through a scenario-based simulation method, and the flood simulation was conducted using Infoworks ICM software 7.0 version.
The spatial heterogeneity of ground elevation, slope and impermeability characterize the underlying surface conditions, which therefore serve as critical indexes for quantifying the stability of hazard-formative environment. Elevated terrains with substantial altitudinal advantages and regions exhibiting lower impervious surface ratios significantly reduce susceptibility to pluvial inundation [38].
Hazard-affected bodies, as the target of hazard-causing factors, encompass a conglomeration of human activities and various property resources [39]. The vulnerability of hazard-affected bodies can be operationally achieved through a four-index cluster: Gross Domestic Product (GDP), point of interest (POI) density, population density and building density. The four indexes collectively represent the vulnerability of hazard-affected bodies from the perspectives of economic activity, location of critical facilities, demographic factors, and urban structural composition. GDP reflects the vulnerability of the affected bodies from the perspective of economic resources. POI density refers to the concentration of essential facilities such as shopping malls, hospitals, and schools within urban areas. This index primarily considers functional sensitivity, as damage to key points of interest can easily trigger secondary disasters and amplify the overall impact. Population density addresses vulnerability from the standpoint of personal safety, as areas with higher population density tend to have greater harm inflicted on vulnerable groups. Building density relates to urban structural vulnerability. Regions with high building density are more prone to water accumulation, and it also concentrates on human activities and economic assets, thereby exacerbating risks to personal safety and socioeconomics. The data sources for 11 indexes are shown in Table 1.

2.2. Index Weight Determination

This study employs a hybrid DEMATEL-ANP method for weight calculation. In contrast to the conventional AHP method, which operates under the assumption of independence among criteria, the ANP method acknowledges and incorporates the interdependencies among indexes during the calculation of their weights. Furthermore, by employing the DEMATEL method, the causal dependencies among the indexes can be elucidated, thereby facilitating the construction of the causal impact diagrams required for the ANP methodology. The hybrid method constructs an unweighted supermatrix through the total-relation matrix, and weights the appropriate parts of the supermatrix using the total-relation matrix of the clusters [40], thereby avoiding the ANP method’s 9-scale pairwise comparison surveys.

2.2.1. The Computational Steps of the DEMATEL

The DEMATEL method, an advanced system analysis technique grounded in graph theory and matrix algebra, has emerged as a powerful computational tool for modeling complex causal relationships. The specific calculation steps are as follows:
Step 1. Obtain the direct-relation matrix based on scoring
This study uses grading scales of 0, 1, 2, 3, 4, representing scores from 0 (no effect) to 4 (very high influence), and invites experts to evaluate the degree of direct influence of each dimension/criteria i on each dimension/criteria j. After averaging all the scoring data, a direct relation matrix S is obtained.
S = s i j n × n = 0 s 12 s 1 n s 21 0 s 2 n s n 1 s n 2 0
Step 2. Generate the normalized direct-relation matrix
The direct-relation matrix must be normalized to facilitate subsequent calculations. The maximum row vector sum value was selected as the criterion for calculating the normalization factor K.
K = M i n 1 M a x 1 i n ( j = 1 n s i j )
The normalized direct-relation matrix D can be obtained by multiplying the direct-relation matrix S and K.
D = K × S
Step 3. Generate the total-relation matrix and conduct corresponding analysis
The normalized direct-relation matrix D is subjected to limit operations to derive the total-relation matrix Q, which reflects the interrelationships among the various indexes. By conducting the aforementioned calculations separately for the dimension layer and the criteria layer, the total-relation matrices QD and QC can be obtained.
Q = lim h ( D + D 2 + D 3 + + D h ) = D ( I D ) 1
In the total-relation matrix, the influence of the i-th index on the j-th index is denoted by qij. The sum of the i-th row is represented by ti, which reflects the total influence of the i-th index on all other indexes. The sum of the j-th column is represented by rj, which reflects the total influence received by the j-th index from all other indexes.
t i = j = 1 n q i j ( i = 1 , 2 , , n )
r j = i = 1 n q i j ( j = 1 , 2 , , n )
When i = j, the centrality and causality can be calculated. Centrality Fi is represented by (ti + ri), where Fi denotes the overall influence and influenced degree of index i. Causality Mi is represented by (tiri). If Mi is positive, it indicates that index i has a significant influence on other indexes, categorizing it as a causal index. Conversely, if Mi is negative, it suggests that index i is primarily influenced by other indexes, classifying it as a resultant index. By using Fi as the horizontal axis and Mi as the horizontal axis, a visual causal diagram can be constructed.

2.2.2. DANP Method for Obtaining Weights

This study obtains the index weights through the hybrid ANP method. Various hybridization methods exist for DEMATEL-ANP, and in this study, the DEMATEL-Based ANP (DANP) method, which has been most widely used in recent years, was adopted to determine index weights [40]. The hybridization process of ANP and DEMATEL is outlined in the steps below:
Step 1. Attain the unweighted supermatrix.
The total-relation matrix can be divided into submatrices based on dimensions (clusters), and normalization is performed on each submatrix. Taking the submatrix Q C 13 as an example, as shown in Equation (7), we can demonstrate the normalization process of the submatrix.
Q C 13 = q 11 13 q 12 13 q 1 m 3 13 q 21 13 q 22 13 q 2 m 3 13 q m 1 1 13 q m 1 2 13 q m 1 m 3 13
We can sum the row vectors of the submatrix and normalize the resulting elements, the normalized submatrix is Q C α 13 , as shown in Equations (8) and (9).
t i 13 = j = 1 m 3 t i j 13 ,   i = 1 , 2 , , m 1
Q C α 13 = q 11 13 / t 1 13 q 12 13 / t 1 13 q 1 m 3 13 / t 1 13 q 21 13 / t 2 13 q 22 13 / t 2 13 q 2 m 3 13 / t 2 13 q m 1 1 13 / t m 1 13 q m 1 2 13 / t m 1 13 q m 1 m 3 13 / t m 1 13 = q 11 α 13 q 12 α 13 q 1 m 3 α 13 q 21 α 13 q 22 α 13 q 2 m 3 α 13 q m 1 1 α 13 q m 1 2 α 13 q m 1 m 3 α 13
Step 2. Calculate the unweighted supermatrix.
Each submatrix undergoes row normalization to obtain the normalized total-relation matrix Q C α , and subsequently, by transposing the whole matrix, the normalized total-relation matrix Q C α can be transformed into the unweighted supermatrix Y , as shown in Equation (10).
Y = Q C α Τ = Y 11 Y 12 Y 1 N Y 21 Y 22 Y 2 N Y N 1 Y N 2 Y N N
Step 3. Obtain the weighted supermatrix.
Similarly, the total-relation matrix QD also requires row normalization, as shown in Equation (11).
Q D α = q D 11 / t 1 q D 12 / t 1 q D 1 N / t 1 q D 21 / t 2 q D 22 / t 2 q D 2 N / t 2 q D N 1 / t N q D N 2 / t N q D N N / t N = q D α 11 q D α 12 q D α 1 N q D α 21 q D α 22 q D α 2 N q D α N 1 q D α N 2 q D α N N
By transposing the normalized total-relation matrix Q D α to obtain matrix Q D α Τ , and multiplying it with the unweighted matrix Y, the weighted supermatrix can be obtained, as shown in Equation (12).
Y α = ( Q D α ) Τ Y = q D α 11 × Y 11 q D α 21 × Y 12 q D α N 1 × Y 1 N q D α 12 × Y 21 q D α 22 × Y 22 q D α N 2 × Y 2 N q D α 1 N × Y N 1 q D α 2 N × Y N 2 q D α N N × Y N N
Step 4. Limit the weighted supermatrix.
Based on the fundamental concepts of Markov chains, the weighted supermatrix Y α is repeatedly multiplied by itself until it converges to a stable state, generating the limit supermatrix Y α , as illustrated in Equation (13).
Y α = lim h Y α h

2.3. Establish the Urban Flood Risk Assessment Model

After obtaining the index weights, the FCE method can be employed to establish the risk assessment model. The FCE method transforms inherent ambiguities in urban flood risk assessment into a quantitative analytical framework by establishing membership functions, thereby enabling systematic determination of risk assessment levels [41].
The equal interval classification method discretizes continuous phenomena through fixed thresholds, which can induce abrupt transitions in evaluation results due to minor data fluctuations near classification boundaries. For instance, when assessing the total flood duration using this method, a measurement of 10.04 h might be categorized as “Relatively Low Risk”, whereas 10.05 h would shift to “Moderate Risk”. This evaluation method is highly sensitive to monitoring errors, as even minimal data fluctuations can trigger excessive changes in risk levels [36]. In contrast, the FCE method utilizes membership functions and the principle of maximum membership to determine the risk category to which the data belongs, thereby avoiding the binary opposition inherent in the evaluation process. For example, in Figure 2, when the element x1 falls within the intervals e2 and e3, the membership degrees for “Relatively Low Risk” and “Moderate Risk” are calculated separately. The higher membership value for e3 classifies as “Moderate Risk”, reflecting the continuous nature of hydrological processes.
The initial step involves establishing a linguistic assessment set for risk assessment. The risk indexes are categorized into five hierarchical levels P = (p1, p2, p3, p4, p5), where the subscript indices 1–5 systematically correspond to “Low Risk, Relatively Low Risk, Moderate Risk, Relatively High Risk, and High Risk”, respectively. The risk classification intervals are discretized using equidistant breakpoints, where the interval spacing Δ is determined by selecting the minimum value between the standard deviation and mean value of the dataset. The breakpoints of the risk classification are denoted as ei (i = 1, 2, 3, 4, 5). The risk classification intervals are illustrated in Table 2.
This study constructs triangular membership functions for implementation in the urban flood risk assessment model, as shown in Table 3. The triangular membership function is a commonly used type of membership function that is simple to compute and suitable for linear fuzzy evaluation. Figure 3 depicts the assessment framework.

3. Results

3.1. Study Area

The study area is a typical drainage Zone VII located in Z City, H Province, covering an area of 15.29 square kilometers. The study area is situated in a transitional zone between subtropical and warm temperate climates, characterized by distinct seasonal variations. The region experiences an annual average temperature of approximately 14.9 °C, with extreme maximum temperatures reaching around 42 °C and extreme minimum temperatures dropping to approximately −18 °C. The multi-year average precipitation in the region measures 908 mm, with the majority of rainfall concentrated from June to September, a seasonal pattern that frequently triggers flood hazards [42].
The drainage system in this area primarily follows a combined sewer system, which encompasses two rivers, as shown in Figure 4. One of the main rivers has its upstream section at K Lake, serving as a storage and regulation body of water, while the downstream section, known as K River, flows eastward and discharges into S Lake. A tributary channel, the Southern Main Canal, runs eastward from the west, entering the downstream water bodies outside the urban area. Characterized by high population density and frequent severe flood incidents, this region necessitates comprehensive risk assessment for flood mitigation planning.

3.2. Reults of 2D Flood Model and Index Processing

After generalizing the drainage system, this study established a one-dimensional (1D) drainage model for the research area using the Infoworks ICM software 7.0 version. Following the processing of DEM data, a ground Triangulated Irregular Network (TIN) model was generated, which subsequently served as the basis for developing a 2D flood inundation model, as illustrated in Figure 5. The entire model comprises 576 manholes, 26 outfalls, 639 conduits, and 134,818 2D-meshes.
This study used the “821” and “713” rainfall events for model calibration and validation. The rainfall records from the hydrological station, shown in Figure 6, were recorded in minutes. Due to the absence of flood monitoring stations in the study area, four convenient locations for rainfall measurement were selected to measure flood in the field, and the selected locations are labeled in Figure 5. The four measured points are indicated by red circles in the Figure 5.
The results of the model calibration and validation are shown in Table 4, and the simulated water depth error is not more than 10%, which proves the accuracy of the model. The 2D area boundary of the model adopts normal conditions, and rainfall is applied to all regions. In the simulation initial conditions, the land infiltration type uses the Horton model, and the flow concentration model is SWMM. The surface Manning’s roughness coefficient is set to 0.0125, and the Manning’s roughness value for drainage conduits is 0.013.
After completing the modeling, a design storm event characterized by a 30-year return period and 240 mm cumulative rainfall over a 24 h duration was simulated, thereby generating the necessary data of riskiness of hazard-causing factors for establishing the risk assessment model.
The obtained scenario simulation data, along with all other index data, were represented in ArcGIS, with all data types converted to raster format to facilitate subsequent calculations. To ensure the accuracy of raster calculations, the coordinate system of all data were converted to the GCS_WGS_1984 coordinate system, with systematic raster alignment implemented to maintain spatial correspondence. The raster size can be accurate to 10 m × 10 m. Gaussian kernel density estimation was employed to derive flood area and building density indexes, while standard kernel density analysis was subsequently applied to calculate POI density index. The raster sizes of different index data were inconsistent, so resampling was performed to convert all index data to the same spatial resolution. The GIS images of all index data are presented in Figure 7.
As can be seen from Figure 7a,c, the central area has a longer flood duration and a larger flood area, which is attributed to the extensive drainage network coverage and lack of drainage outlets in this region. From Figure 7b,d, it can be seen that the northeastern area exhibits higher water depth and faster flow velocities, which is consistent with the topographic trend of higher elevation in the west and lower elevation in the east.

3.3. Interdependencies and Weighting Results of the Index System

Through the DEMATEL method, total-relation matrices of the dimension layer and the criteria layer were calculated, as shown in Table 5 and Table 6. Each value in the matrices indicates the influence of the row header index on the column header index.
From the total-relation matrix, the centrality and causality can be calculated, and the centrality–causality diagram is plotted, as shown in Figure 8.
As shown in Figure 6, an analysis of the causality reveals that the indexes of the S2 cluster and the S3 cluster are both positive, indicating that they exert a stronger influence on the indexes of other clusters. In contrast, the indexes of the S1 cluster are negative, suggesting that the water accumulation indexes are primarily attributable to the integrated influences of other indexes. The occurrence of water accumulation is influenced by various factors, including topographical and economic factors.
Centrality is obtained by summing the influence degree (ti) and being influenced degree (rj), reflecting the importance of the indexes. The figure shows the building density (s34) has the highest centrality (9.422), and the ground elevation (s21) has the lowest centrality (6.798). Additionally, most indexes in the S1 cluster (total flood duration, max depth of flood, flood area) and all indexes in the S3 cluster show high centrality (>8.000), indicating that these indexes are relatively more important for the flood risk assessment system. In contrast, the centrality of all the indexes in the S2 cluster are all below 8.000, suggesting that their importance is lower compared to other indexes, and they have a lesser impact on the flood risk assessment system. Indexes with high centrality are more important in the risk assessment system, while indexes with high influence degree have a broader impact on other indexes. Therefore, these indexes are the key focus for urban flood risk assessment, necessitating prioritized attention to their data reliability, timeliness, and precision.
By employing the integrated DEMATEL-ANP method, the weights of the index system were calculated, as illustrated in Table 7 and Figure 9. Among these indexes, the cluster of the riskiness of hazard-causing factors exhibits the highest weight, indicating that water accumulation remains the most critical determinant in assessing urban flood risk. The total flood duration reflects the temporal persistence of the hazard, the flood area demonstrates the hazard’s magnitude, while the max depth of flood and the max speed of 2D water flow collectively characterize the hazard intensity.

3.4. Results of Flood Risk Assessment

3.4.1. Spatial Distribution of Riskiness of Hazard-Causing Factors

When applying the FCE method, the linguistic assessment set in this study comprises five hierarchical levels. The membership degrees of four indexes within the hazard-causing factor cluster to each hierarchy were calculated using the Raster Calculator module within ArcGIS software 10.2 version, as illustrated in Figure 10. For a given area, a higher membership degree for the high-risk level corresponds to a lower membership degree for the low-risk level. For instance, in the central area, due to fewer drainage outlets and longer pipeline lengths, water accumulation is more severe, resulting in lower membership degrees to p1 and p2, and higher membership degrees to p4 and p5.
According to the principle of maximum membership, the water accumulation raster is assigned to the risk class corresponding to the risk level for which its membership degree is the highest. Similarly, the Con function of the raster calculator is utilized to achieve the corresponding class classification.
As shown in Figure 11, in the risk assessment, high-risk areas are primarily concentrated in the central and eastern zones. The central zone is characterized by larger flood area and longer durations of flood, and the eastern zone is the area with higher waterlogged depth and faster water flow speed. After comprehensive assessment, there are high-risk areas in both zones. The high-risk areas in the central zone are distributed in the form of a slice, whereas in the eastern zone, they are arranged in strips. The shape of the boundaries is influenced by the local topography.
From the analysis of the data distribution maps of various indexes, the combined effects of the total flood duration (s11) and the flood area (s13) led to more and wider high-risk areas in the central zone, and the synergistic effect of the max depth of flood (s12) and the max speed of 2D water flow (s14) led to a small number of waterlogged high-risk areas in the eastern zone. All four indexes play a decisive role in the fuzzy evaluation of hazard risk.

3.4.2. Spatial Distribution of Stability of Hazard-Formative Environment

From Figure 12, it can be observed that the stability results generally exhibit a pattern, with lower values in the southwestern zone and higher values in the northeastern zone, which aligns with the characteristics of surface elevation changes. The impermeability and slope do not show a piecewise effect on the overall risk assessment impact due to a more uniform distribution of data, only in some areas with high impermeability, which increases the sensitivity of stability assessment. Therefore, the ground elevation should be the determining factor for most of the stability risk classification, and the remaining two indexes help to detect high-risk areas of smaller size.

3.4.3. Spatial Distribution of Vulnerability of Hazard-Affected Bodies

As can be seen from Figure 13, as a result of the individual evaluations, only the vulnerability indexes are considered, without involving the water accumulation index. Thus, some high-risk areas do not actually exhibit flood conditions. The overall high-risk areas show a blocky and clustered distribution pattern. There are fewer moderate-risk and high-risk areas in the western zone, mostly low-risk areas. In the northeast, there are low-risk and moderate-risk areas, as well as sporadic high-risk areas. And most of the high-risk areas are concentrated in the southeastern zone.
This distribution shows a high degree of consistency with GDP, POI density, population density, and building density. There is a strong correlation among the four indexes, with the index data for the southeast zone being significantly higher than the other zones. Except for the GDP distribution data, which has a lower resolution, the building density, population density, and POI density in the southeastern zone all vary with the distribution of streets and buildings, which results in a block-like distribution of high-risk areas. Therefore, all indexes within the cluster of hazard-affected bodies are the basis for the classification of risk levels.

3.4.4. Results of Urban Flood Risk Assessment Using the FCE Method

The results of the FCE method are influenced by the operational operators [43]. This study employed a weighted average operator M , to perform computations on both the weight matrix and the fuzzy matrix [44], thereby obtaining the evaluation matrix. The evaluation results are presented in Figure 14. The high-risk areas are primarily concentrated in the central and eastern zones. Based on the analysis of individual fuzzy evaluation results, the high-risk condition in the central zone is primarily influenced by hazard-causing indexes, whereas the high-risk condition in the southeastern zone is mainly attributed to the indexes of hazard-affected bodies.

3.4.5. Model Validation

To validate the accuracy of the evaluation results, this study collected urban flood events from various online sources including news reports, government websites, and social media platforms, as well as historical records maintained by relevant departments, ultimately integrating these data to identify 15 flood points. The identified flood points are illustrated in the risk distribution map, as shown in Figure 15. The 15 flood points selected in this study represent documented water accumulation sites that significantly impact residents’ livelihoods, including 10 water-logged flood points at transportation hubs and 5 water-logged flood points in low-lying commercial and residential areas. The selection of these water accumulation points takes into account both the riskiness of hazard-causing factors and the vulnerability of hazard-affected bodies, using the criteria of whether the water accumulation poses a danger and whether it has a tangible impact on people’s lives.
The probability of overlap between the calculated flood points and high-risk rasters was analyzed. The analysis determined the number of locations predicted as high-risk that were actually confirmed as flood points. The number of correctly identified locations is 13, with a true positive rate (TPR) of 86.67%. The flood points exhibit a high degree of overlap with the high-risk areas identified in the fuzzy comprehensive evaluation, and the evaluation results are largely consistent with historical disaster records, thereby demonstrating the reliability of the urban flood risk assessment model.

4. Discussion

4.1. Feasibility of the Urban Flood Risk Assessment Model

The quantities of waterlogged rasters with different risk levels were statistically analyzed and the results are shown in Table 8. The proportion of high-risk areas is 7.31%, falling within the range of 5% to 10%. This proportion is neither excessively high, which could obscure key priorities and negatively impact corresponding flood-prevention planning and hazard mitigation, nor excessively low, which could lead to a lack of risk assessment capability and undermine the significance of the assessment [45]. An appropriate proportion of high-risk areas substantiates the feasibility of the urban flood risk assessment model.
Comparing the results of the fuzzy comprehensive evaluation with the fuzzy evaluation of hazard-causing factors, the proportion of high-risk areas decreased from 14.35% to 7.31%. In the fuzzy evaluation of hazard-causing factors, the high-risk areas exhibit a large-scale contiguous distribution, whereas in the fuzzy comprehensive evaluation, the distribution is relatively dispersed. This discrepancy arises because the risk of flood disasters is influenced not only by the hazard-causing factors but also requires a comprehensive consideration of the hazard-formative environment and the hazard-affected bodies. The more sensitive the hazard-formative environment and the more vulnerable the hazard-affected bodies, the more severe the impact of flood will be. In the northeastern area, due to unfavorable topographical conditions, flood exerts a more significant impact on the hazard-formative environment; thus, the majority of high-risk areas in the risk assessment have been retained. In contrast, for the western area, the lower building density and population density result in reduced economic losses and various damages caused by flood, leading to a decrease in the extent of high-risk areas. This further underscores the importance of employing a comprehensive evaluation in the classification of urban flood risk levels. Such an evaluative approach enables the assessment of urban flood risks to be more comprehensive, detailed, and rational.

4.2. Analysis of Advantages in Urban Flood Risk Assessment Model

The majority of previous studies employed a singular evaluation model, utilizing either the indicator system method or scenario simulation method [46]. This research integrates multiple assessment approaches: The index system method is adopted to select appropriate indexes and construct an index system for flood risk assessment, in which the hazard-causing indexes are obtained through the scenario simulation method. Ultimately, the results are coupled in ArcGIS to generate a flood risk assessment map. The integrated application of multiple methods expands the application scope of the evaluation model, enabling the use of smaller-scale rasters as assessment units. Most studies use provincial and municipal administrative divisions or river basins as the evaluation unit [47,48], which is only applicable to the observation of the overall risk distribution. In contrast, this model employs raster-based calculations to achieve a refined risk assessment within urban areas, thereby facilitating the identification of high-risk locations within the city.
Identifying specific high-risk locations holds significant importance for the construction of urban flood-prevention planning. For locations with a high risk of hazard-causing factors, the implementation of storage facilities and the renovation in the drainage system can effectively mitigate flood conditions [49]. These measures enable the timely collection and discharge of rainwater during heavy rainfall events, thereby reducing the probability of urban flood. High-risk locations with poor environmental stability for breeding hazards, can be improved by incorporating green infrastructure. Green infrastructure, including rain gardens, permeable pavements, and ecological ditches, not only facilitates the absorption and purification of rainwater but also enhances the esthetic appeal of urban landscapes [50]. Locations with high vulnerability to hazards, such as hospitals, schools, and important intersections, require focused prevention and emergency management to minimize casualties and property damage. Through a comprehensive flood risk assessment, the prioritization of high-risk locations can be clearly identified, allowing for more targeted and effective implementation of flood prevention measures. This approach facilitates the rational allocation of resources and supports both short-term and long-term planning.
Compared to most evaluations that employ the AHP method [51,52], this study utilizes the ANP method to avoid the assumption of independence among indexes. By hybridizing the DEMATEL method, the interrelationships among indexes are effectively captured, resulting in a more objective distribution of index weights. Additionally, this study adopts an FCE method to address the uncertainties and ambiguities in risk level assessment, thereby enhancing the rationality of the risk assessment results.

4.3. Analysis of Limitations in Urban Flood Risk Assessment Model

This study did not integrate objective weight determination methods, primarily because, when conducting flood risk assessment, objective assessment methods tend to emphasize the degree of data variation, overlooking the inherent significance of the indexes themselves [53]. The focus of this study is also centered on the causal pathways of risk indexes, which presents a different premise for use compared to objective evaluation methods [54]. Future study could explore the integration of the urban flood risk assessment model with other methods to enhance the overall rationality of the assessment outcomes.
Furthermore, the urban flood risk distribution map created is based solely on historical data, which limits its capability for dynamic and real-time risk assessment. The data quality of historical datasets significantly influences the accuracy of flood risk assessments. In this study, the historical data used, such as GDP data, has a low resolution, with only seven economic sub-regions defined within the study area. This coarse classification has a certain impact on the fine simulation of small drainage areas. Future research could consider integrating real-time updated detailed data into the risk assessment system, establishing a multi-departmental data-sharing mechanism, and integrating real-time monitoring data from municipal drainage networks. This would enable the assessment results to provide real-time decision-making support for flood emergency responses.
Due to time constraints, this study did not conduct sensitivity and uncertainty analyses. Future studies should prioritize investigating the robustness of the model evaluation and systematically analyzing how variations in input indexes affect urban waterlogging risk assessments.

5. Conclusions

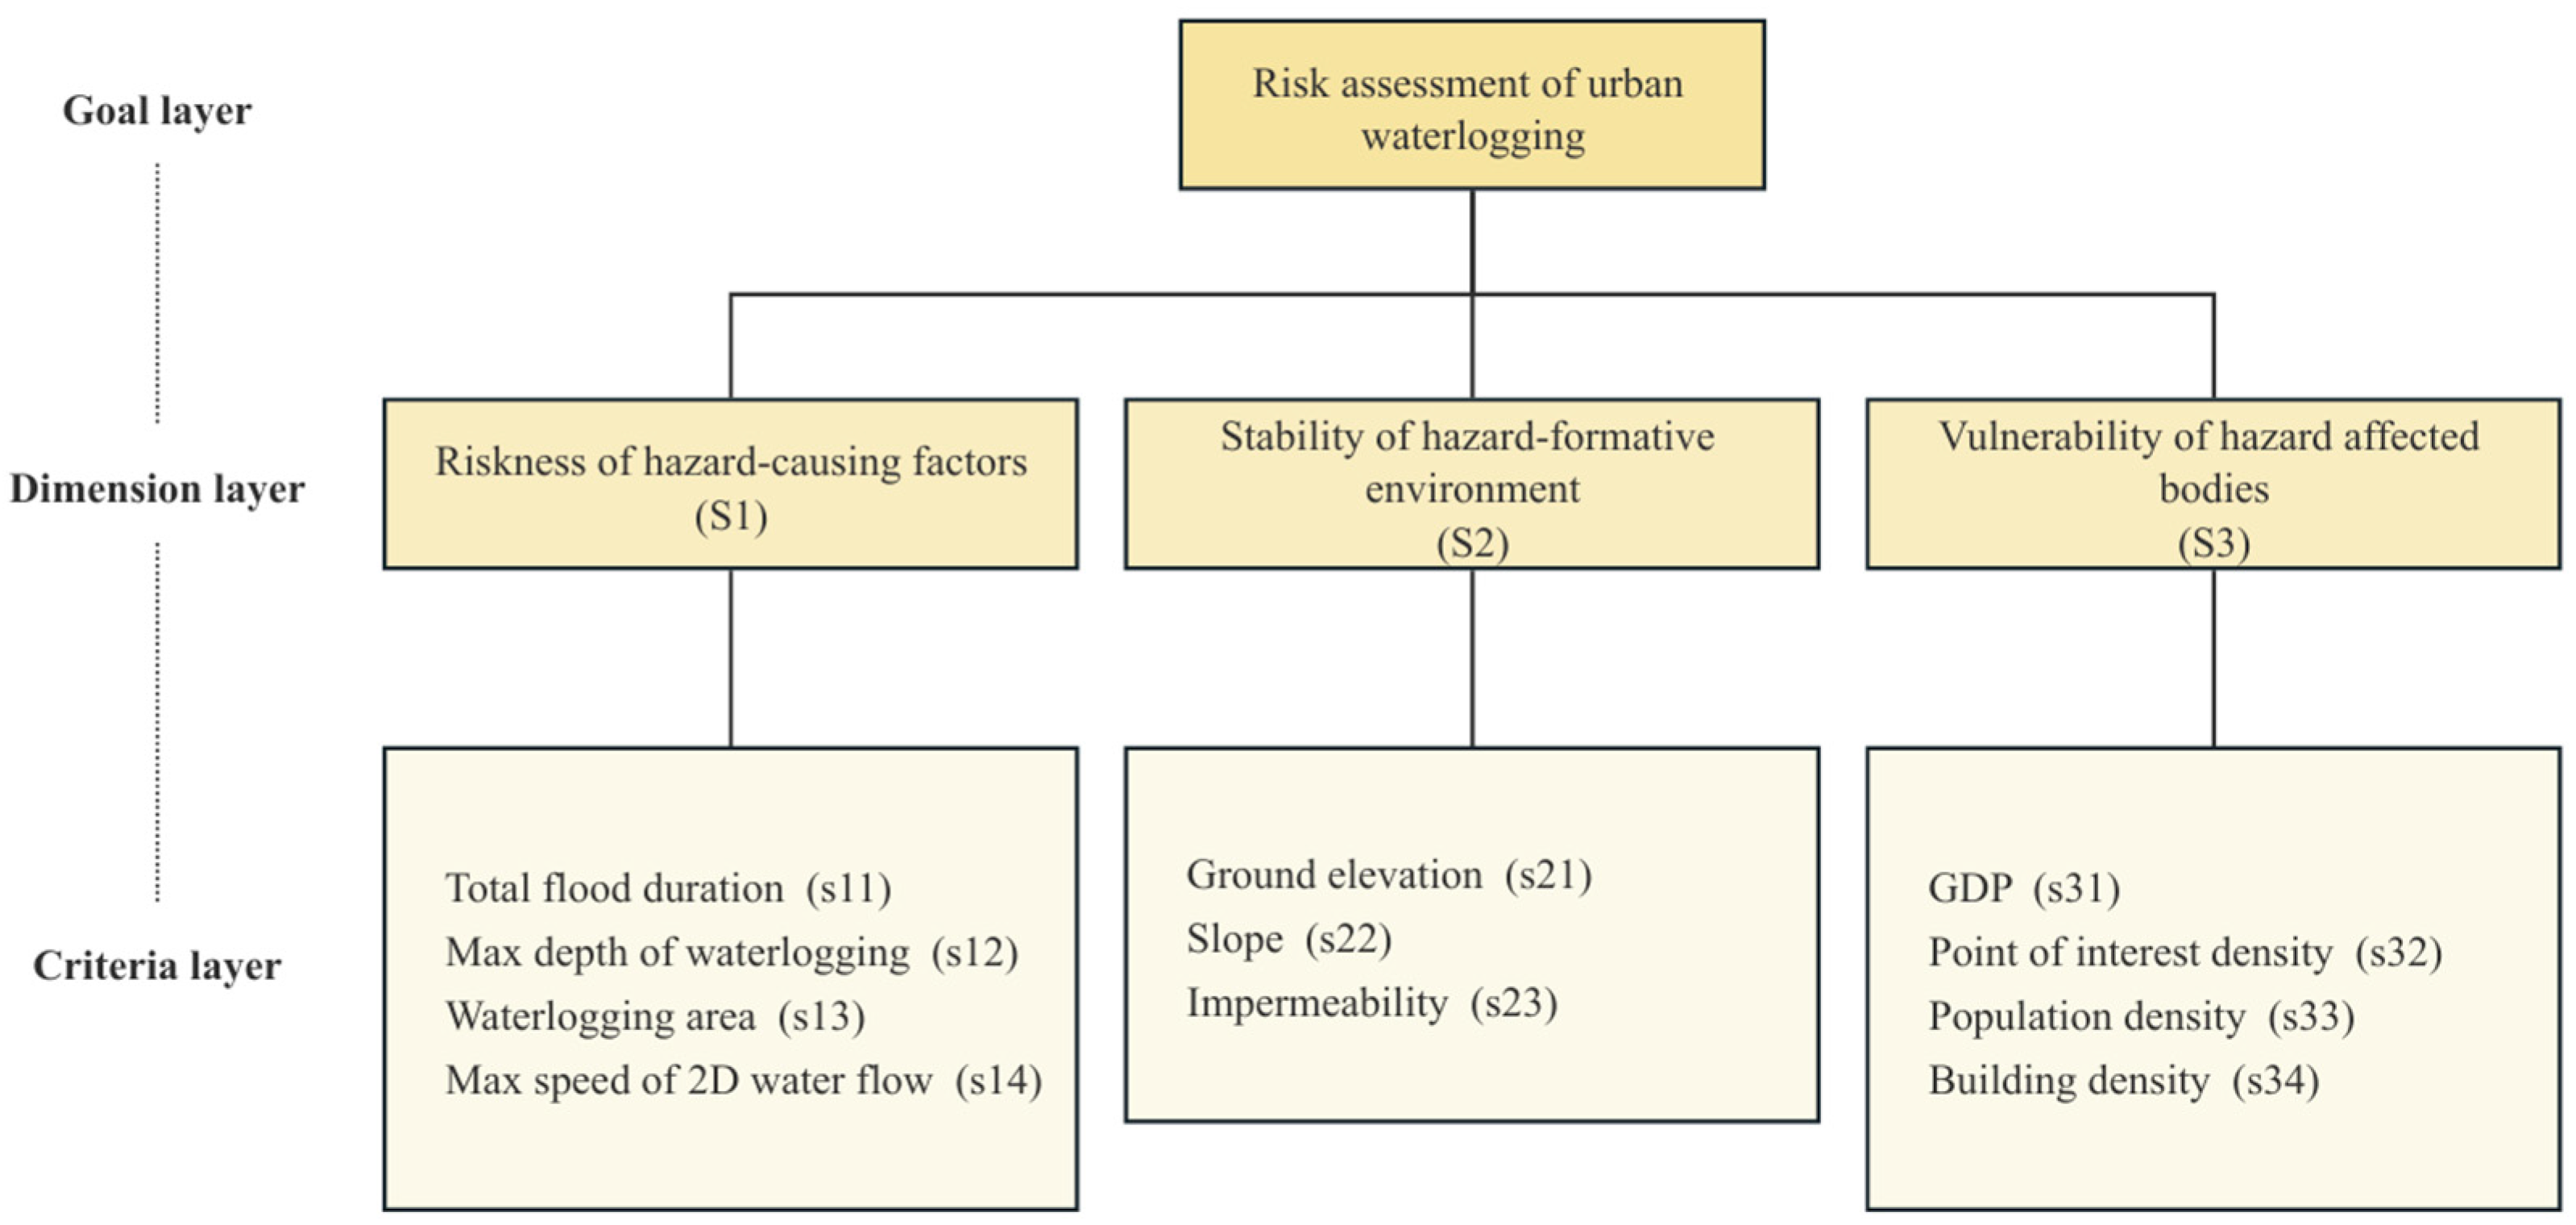
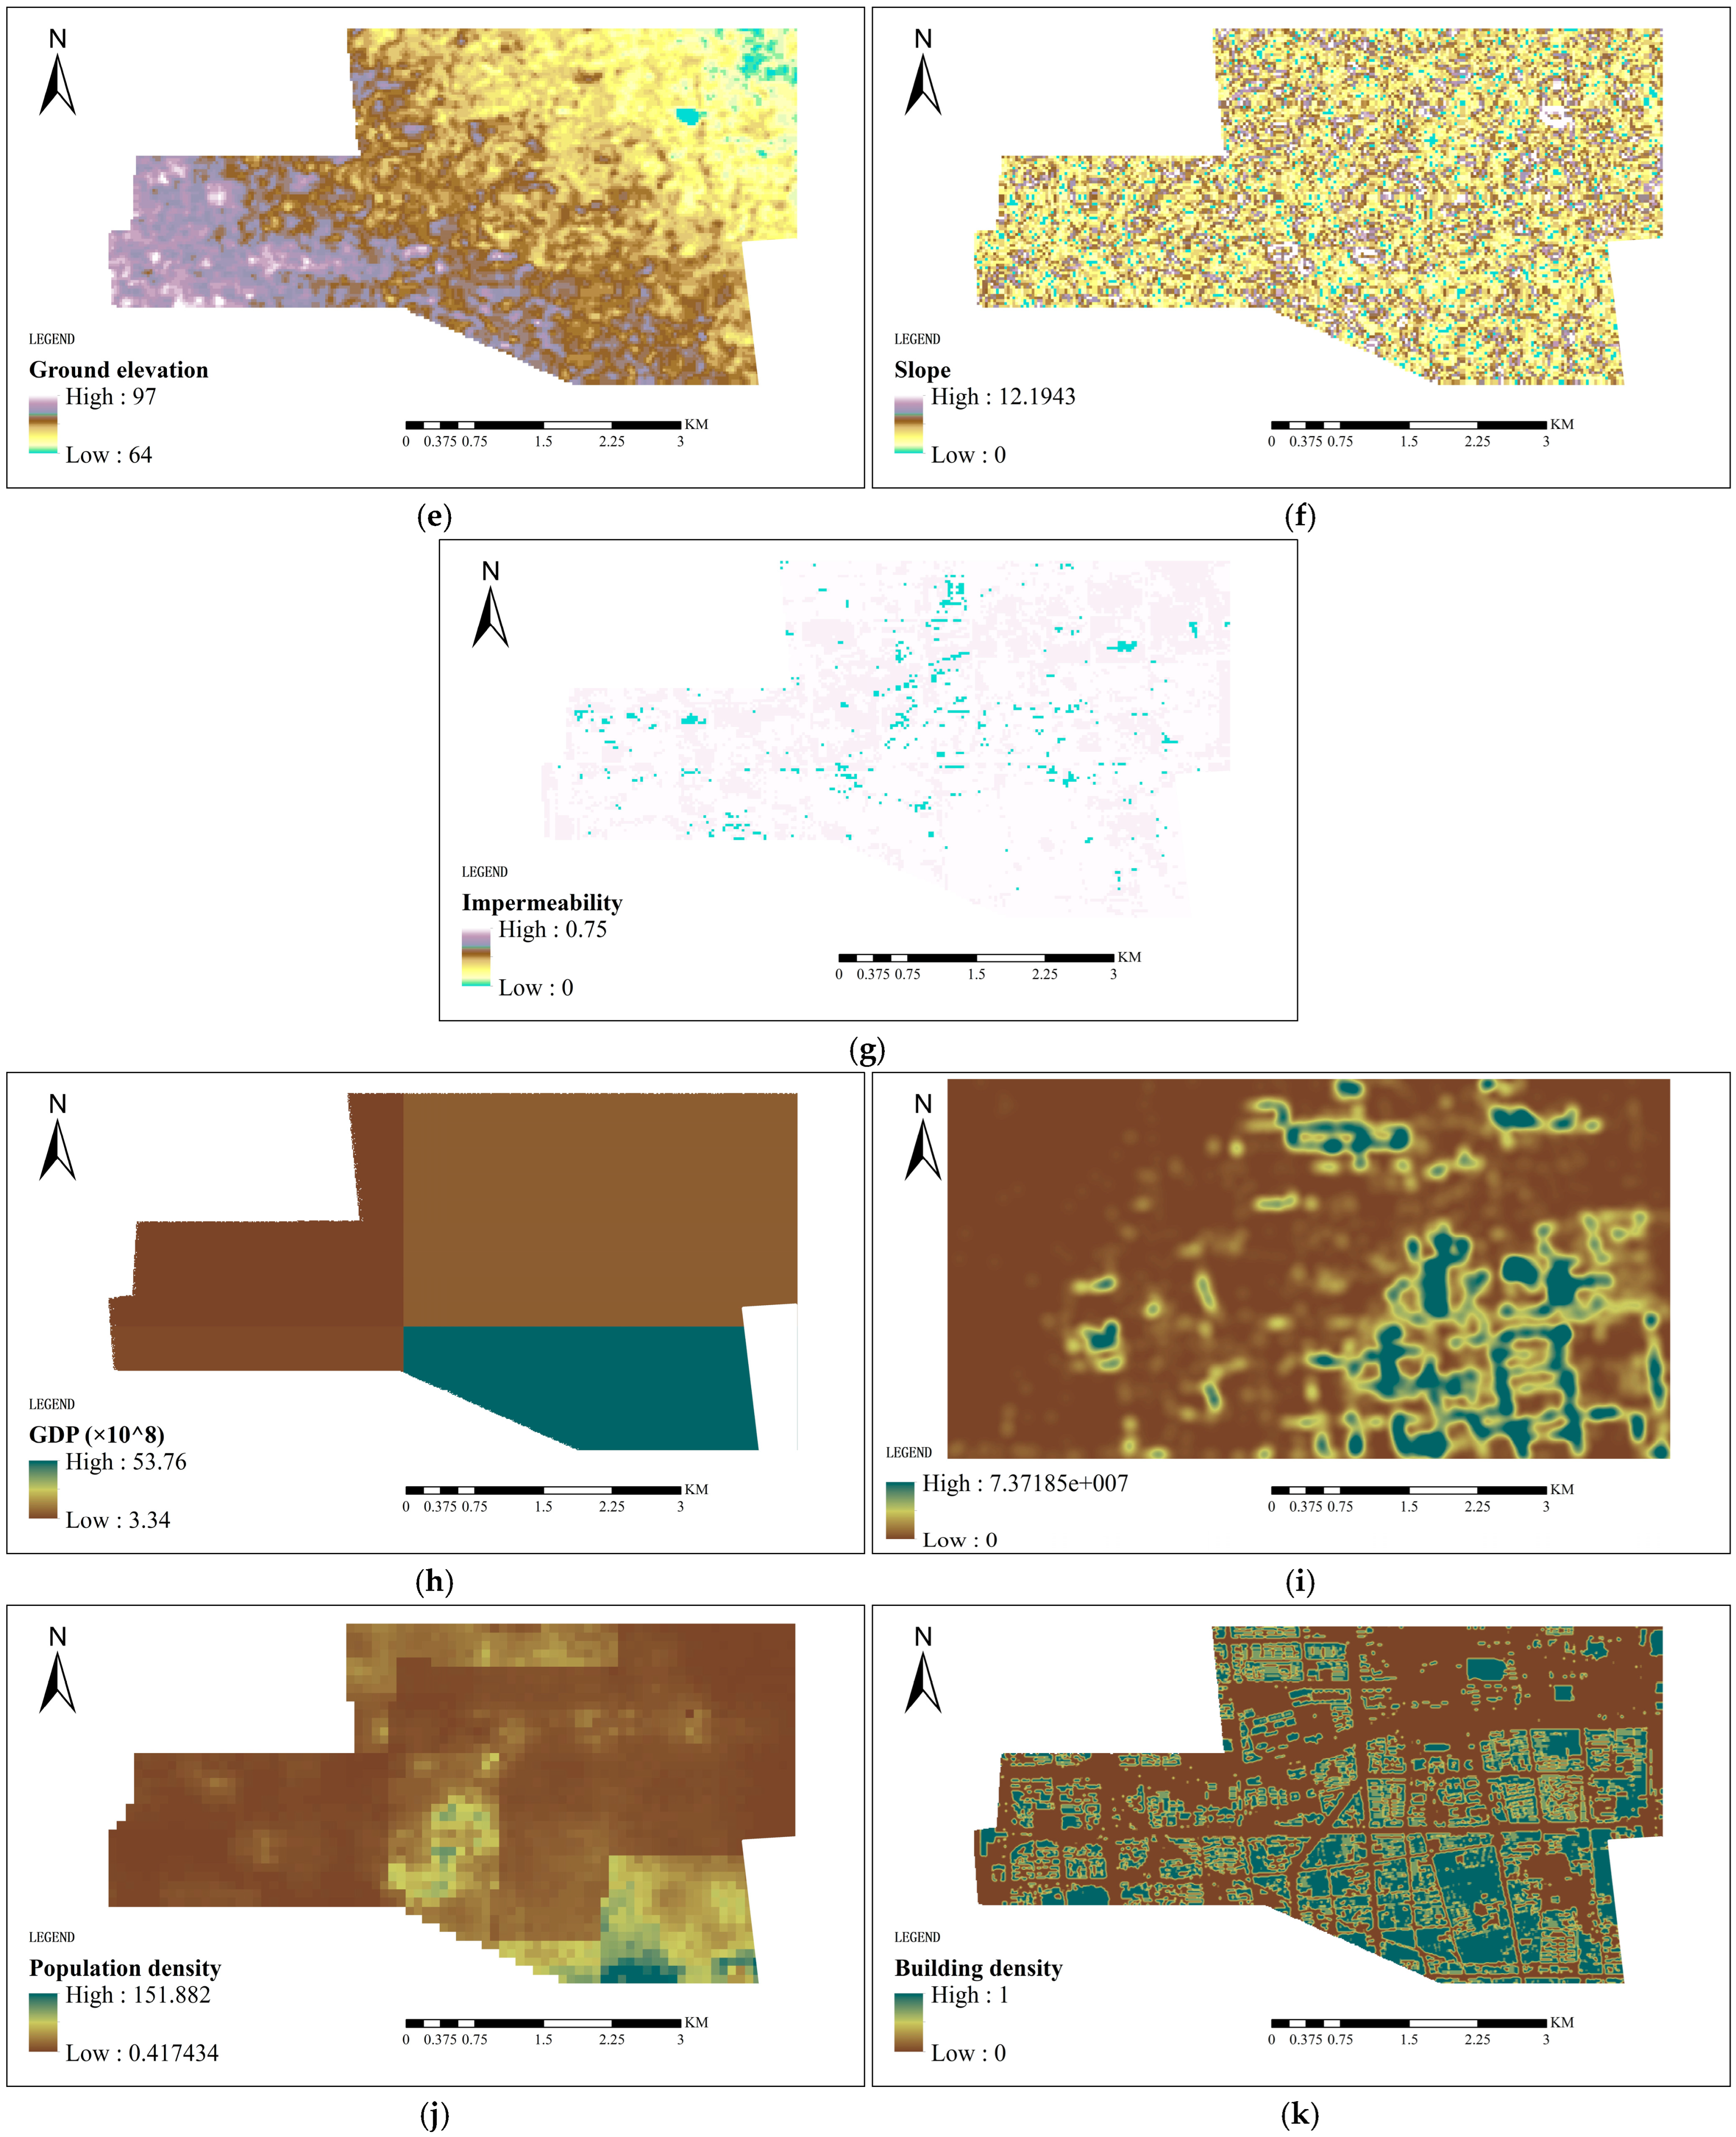
Faced with the increasingly severe challenge of urban flood, this study established a risk assessment index system for flood hazards, and obtained the water accumulation data through the Infoworks ICM drainage model. The weights of the indexes were calculated using a hybrid approach combining DEMATEL and ANP methods. Furthermore, this study developed an urban flood risk assessment model employing the FCE method, which facilitated a comprehensive assessment of flood risk. The results are as follows:
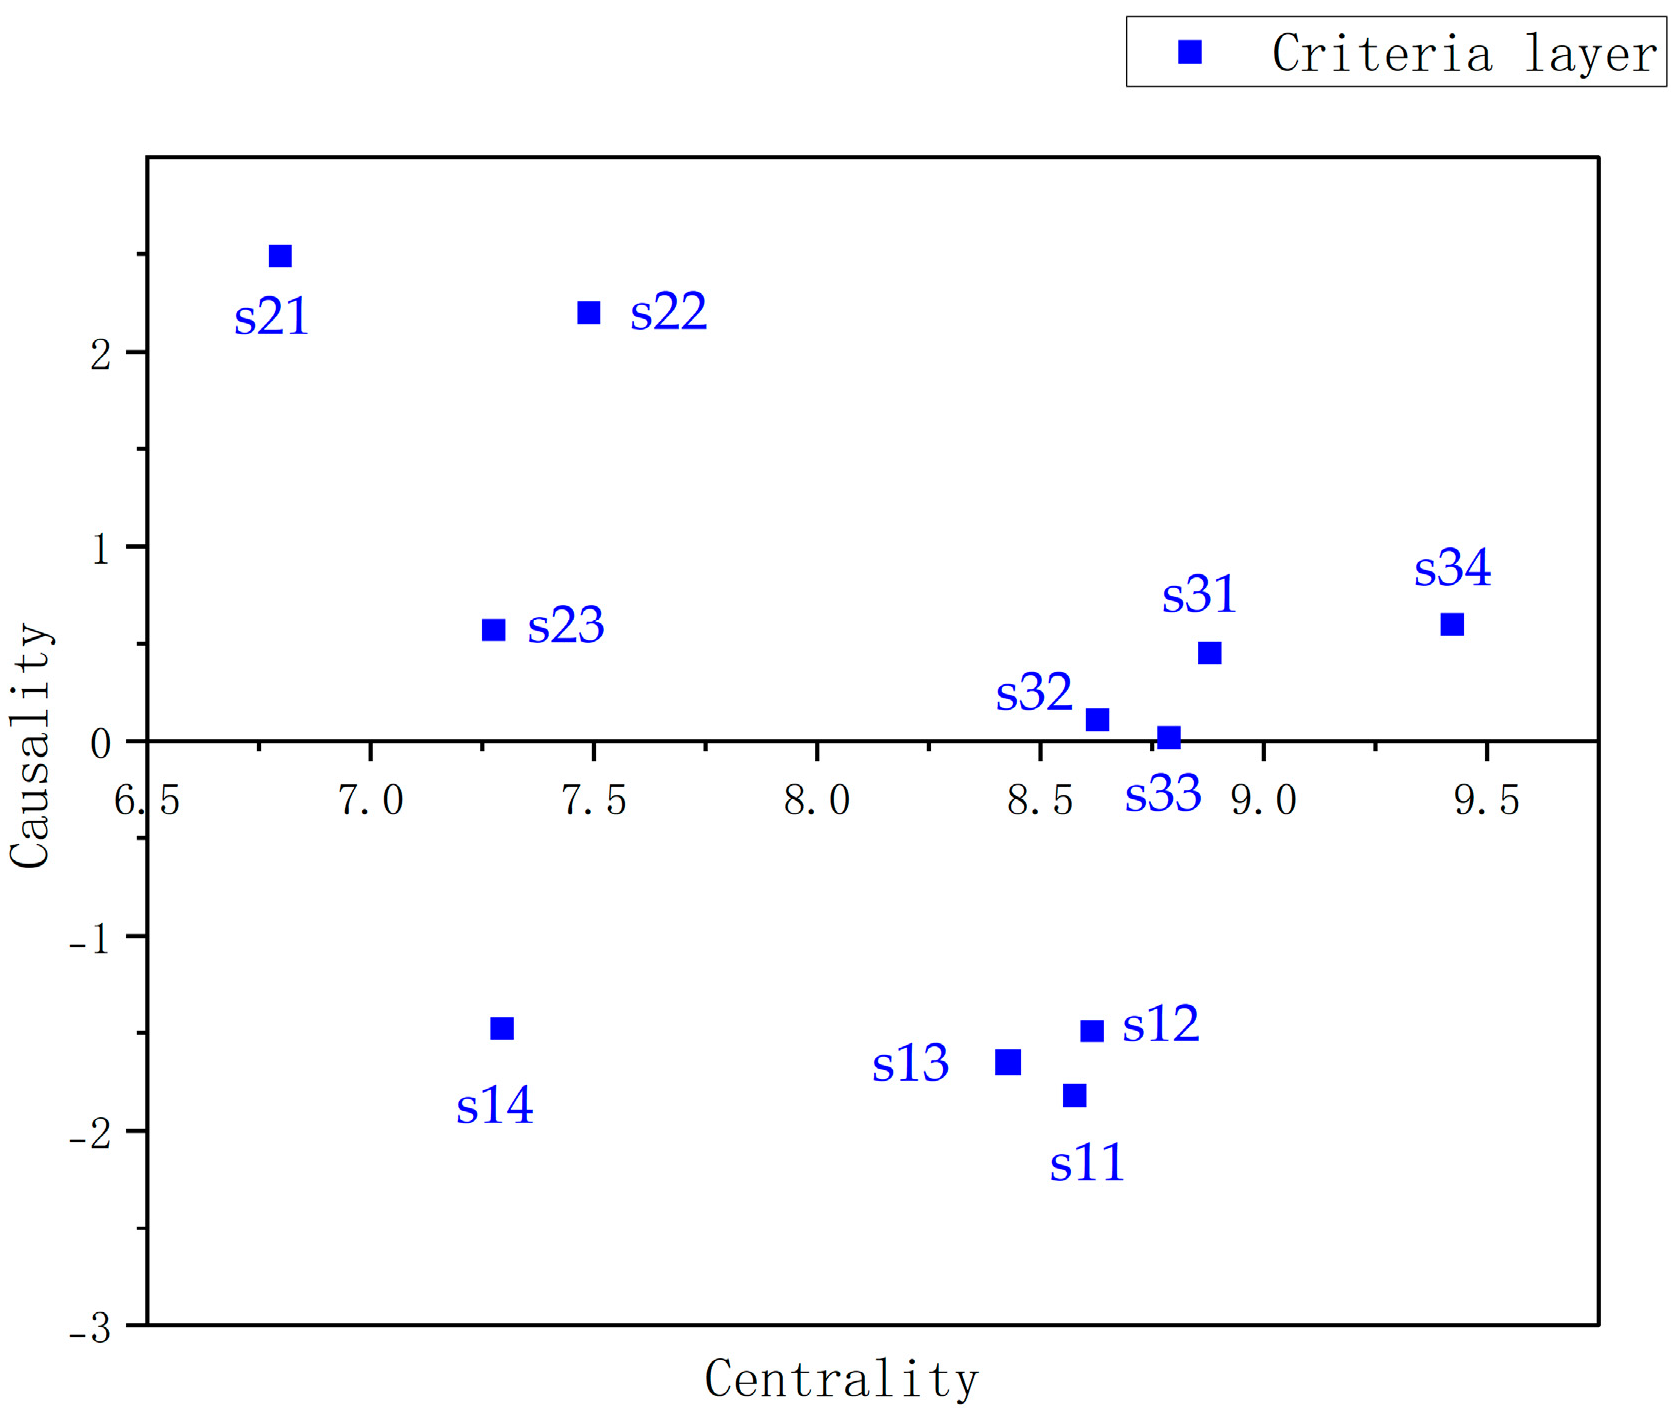
Based on the theory of district disaster system, this study has established an index system for flood hazard risk, which includes 3 clusters and 11 indexes. The DEMATEL method was used to analyze the interrelationships among the indexes and establish a network relationship map. The hybrid method of DEMATEL and ANP was employed to assign weights to the indexes.
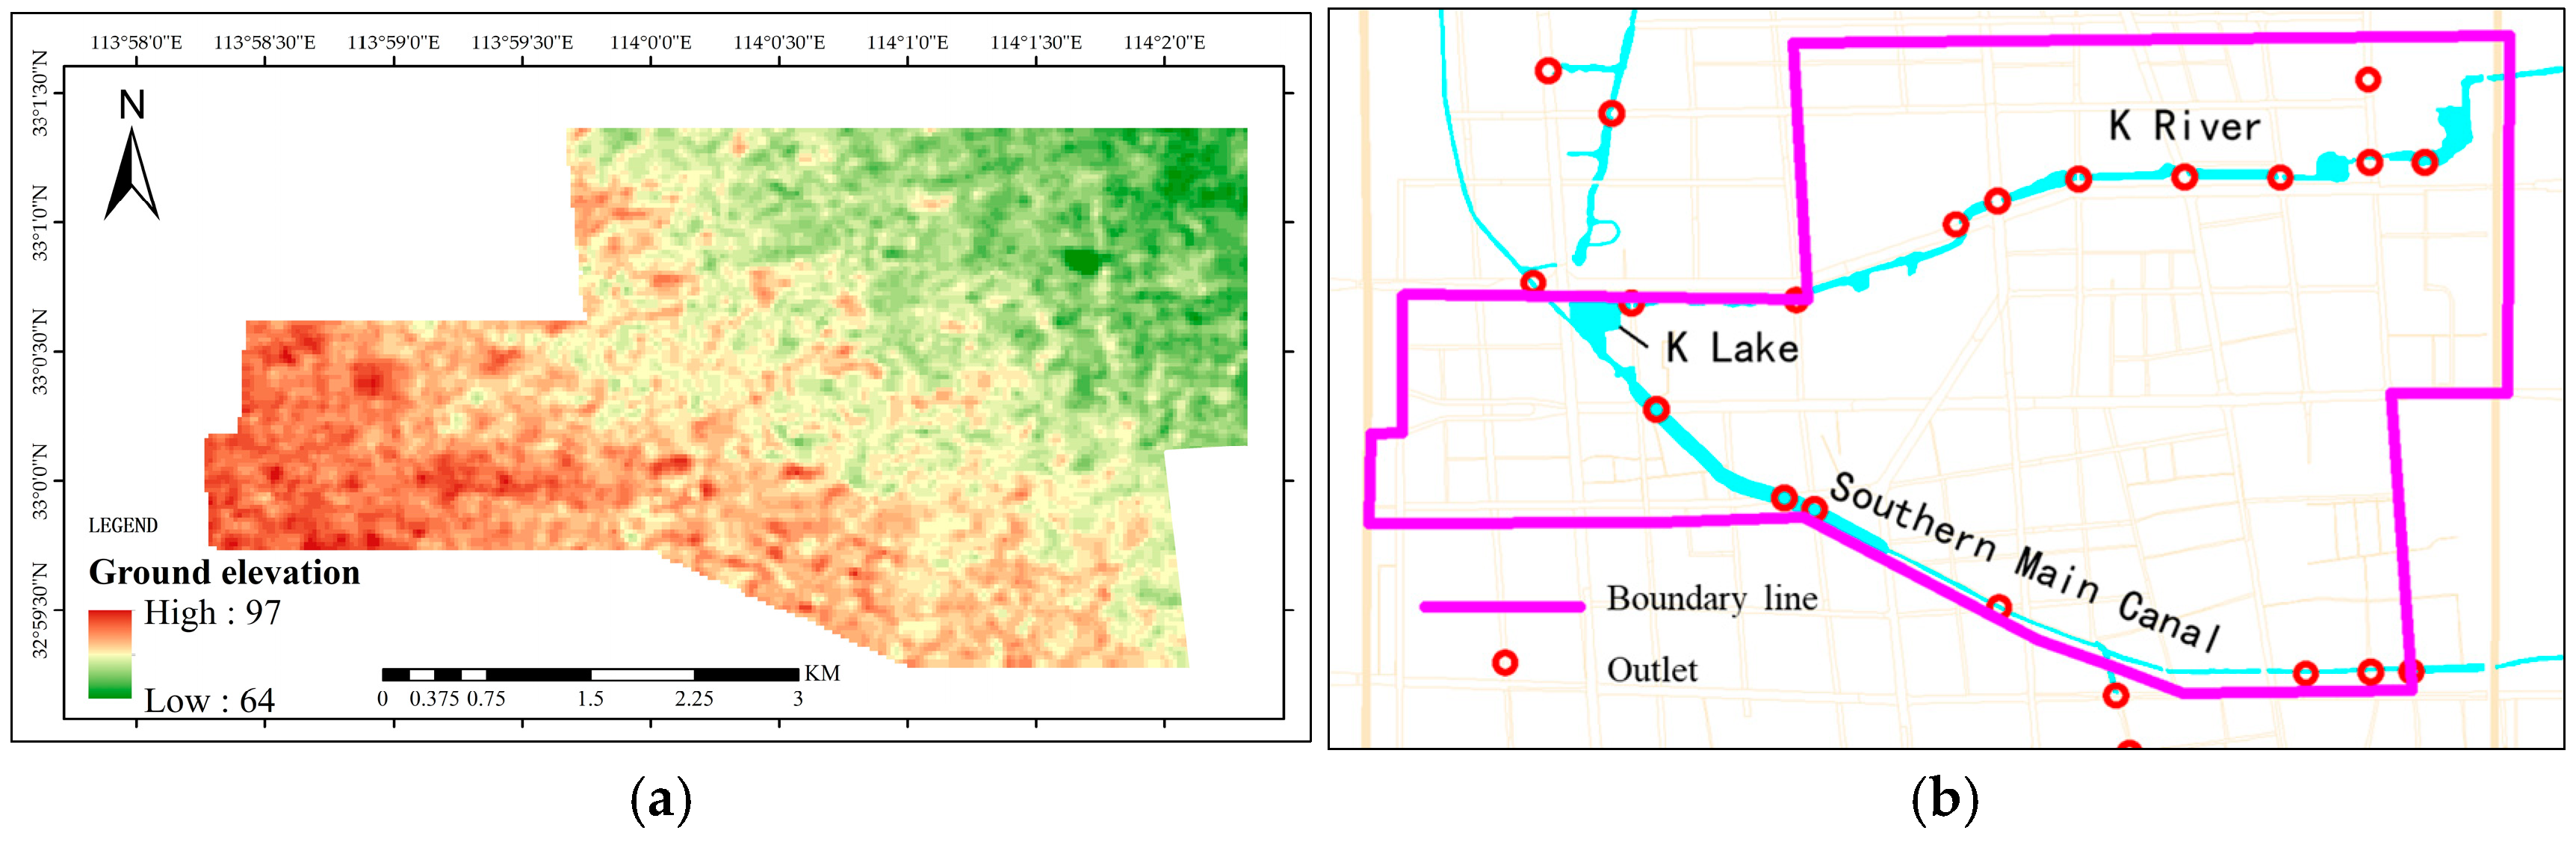
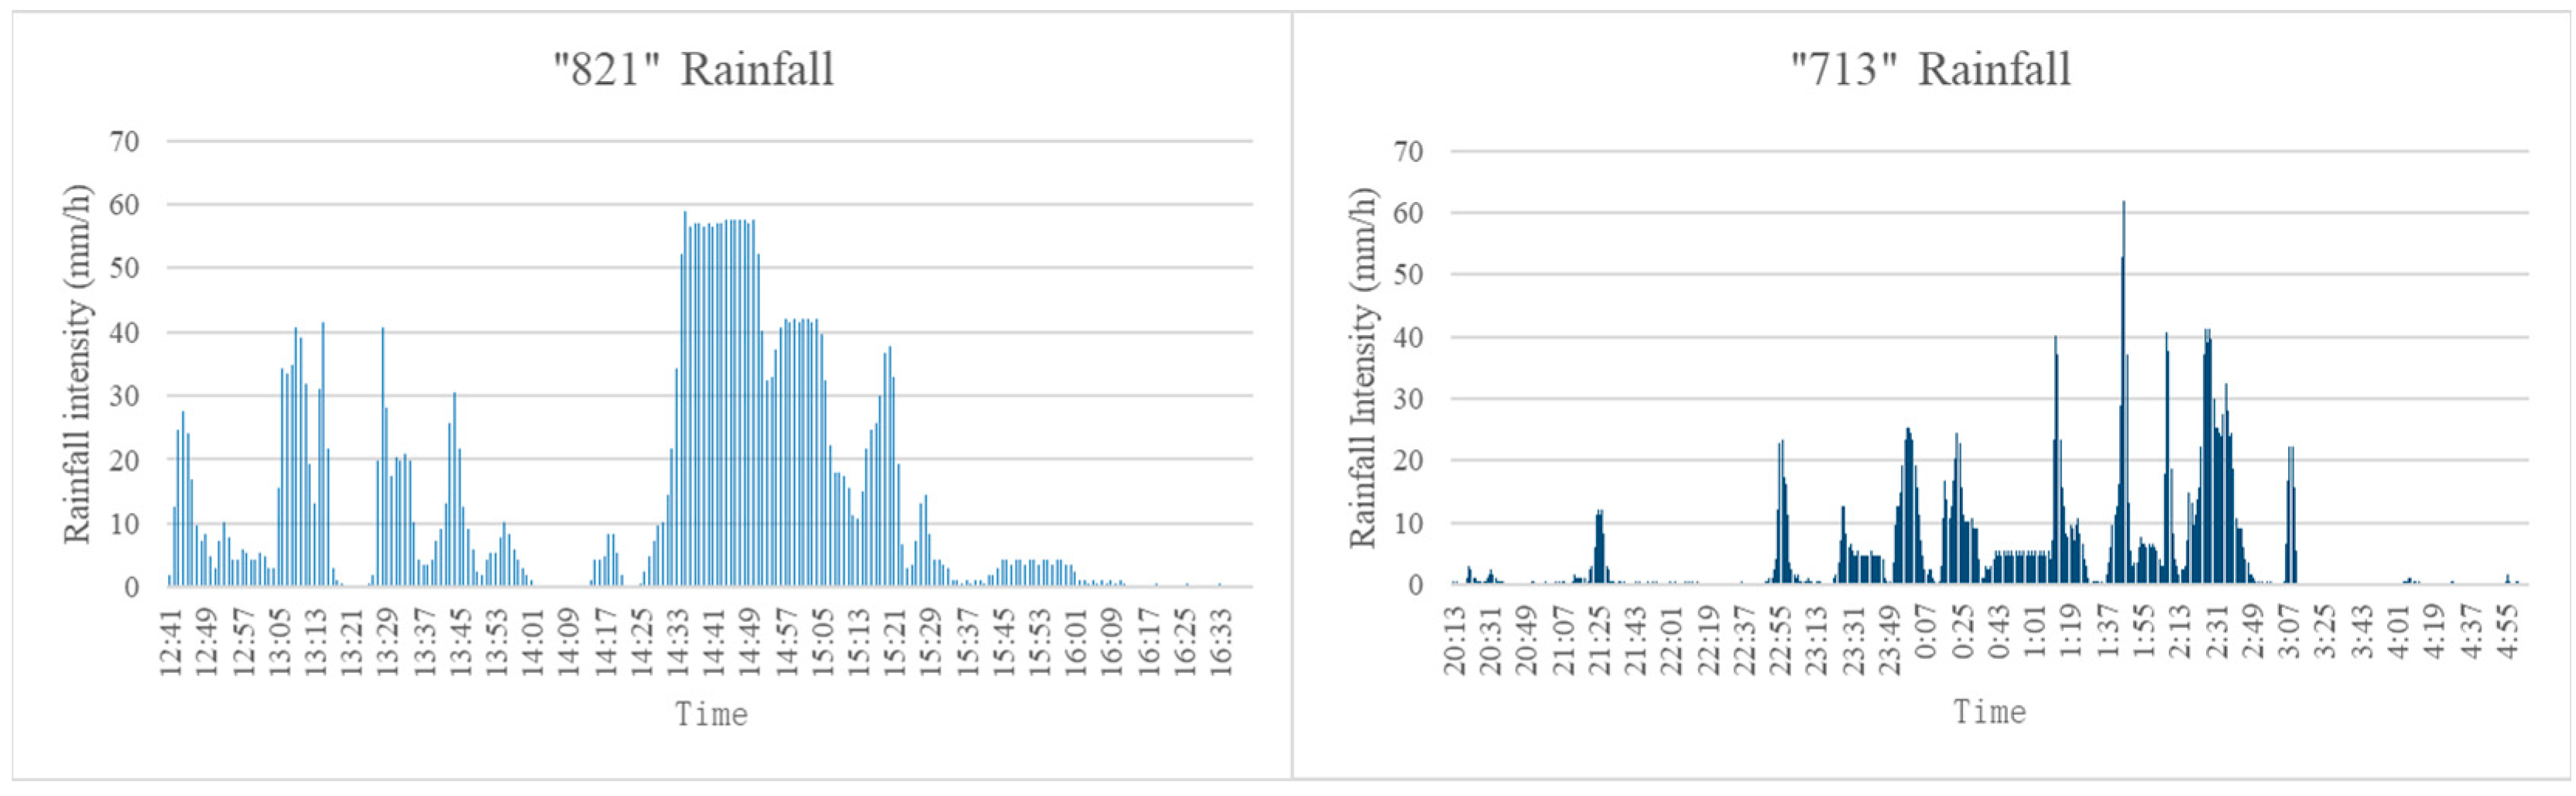
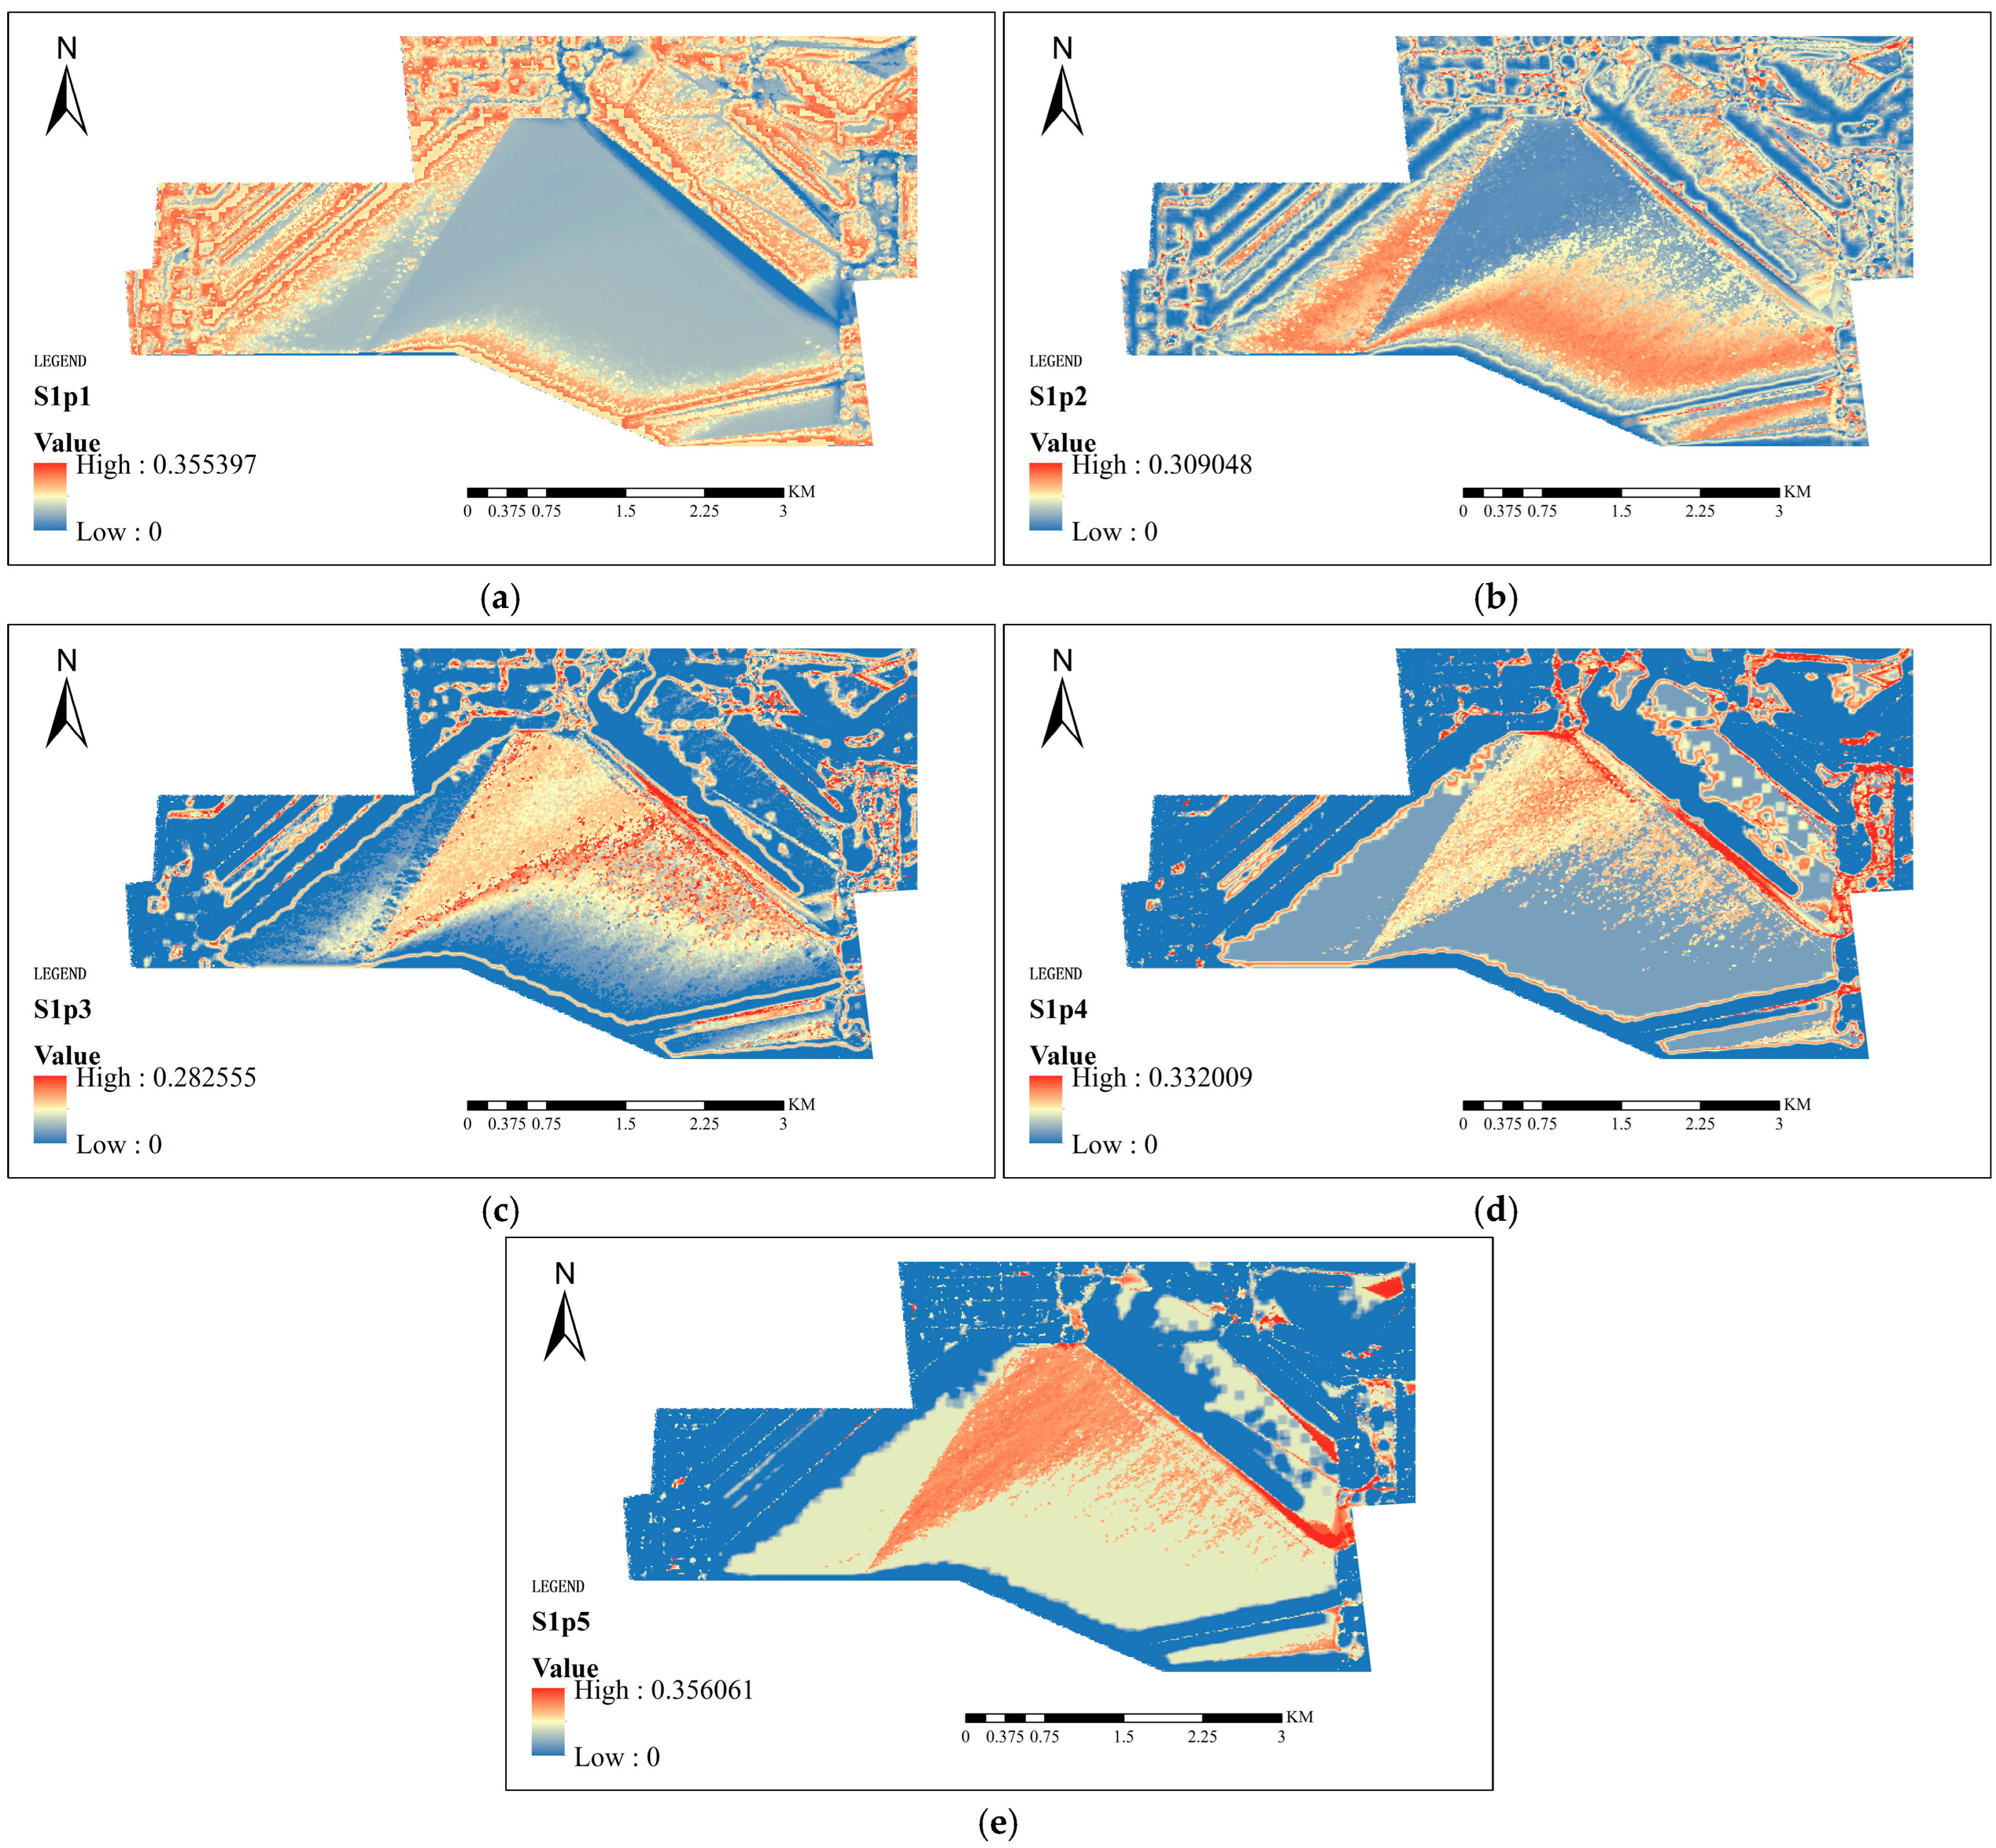
Taking a drainage zone in Z City as the research object, a 1D drainage model and a 2D urban inundation model based on the Infoworks ICM model were established. A 24 h long-duration rainfall pattern was designed for scenario simulation, and the flood data required for the flood risk assessment was obtained, realizing the integration of the scenario simulation and the index system methodology.
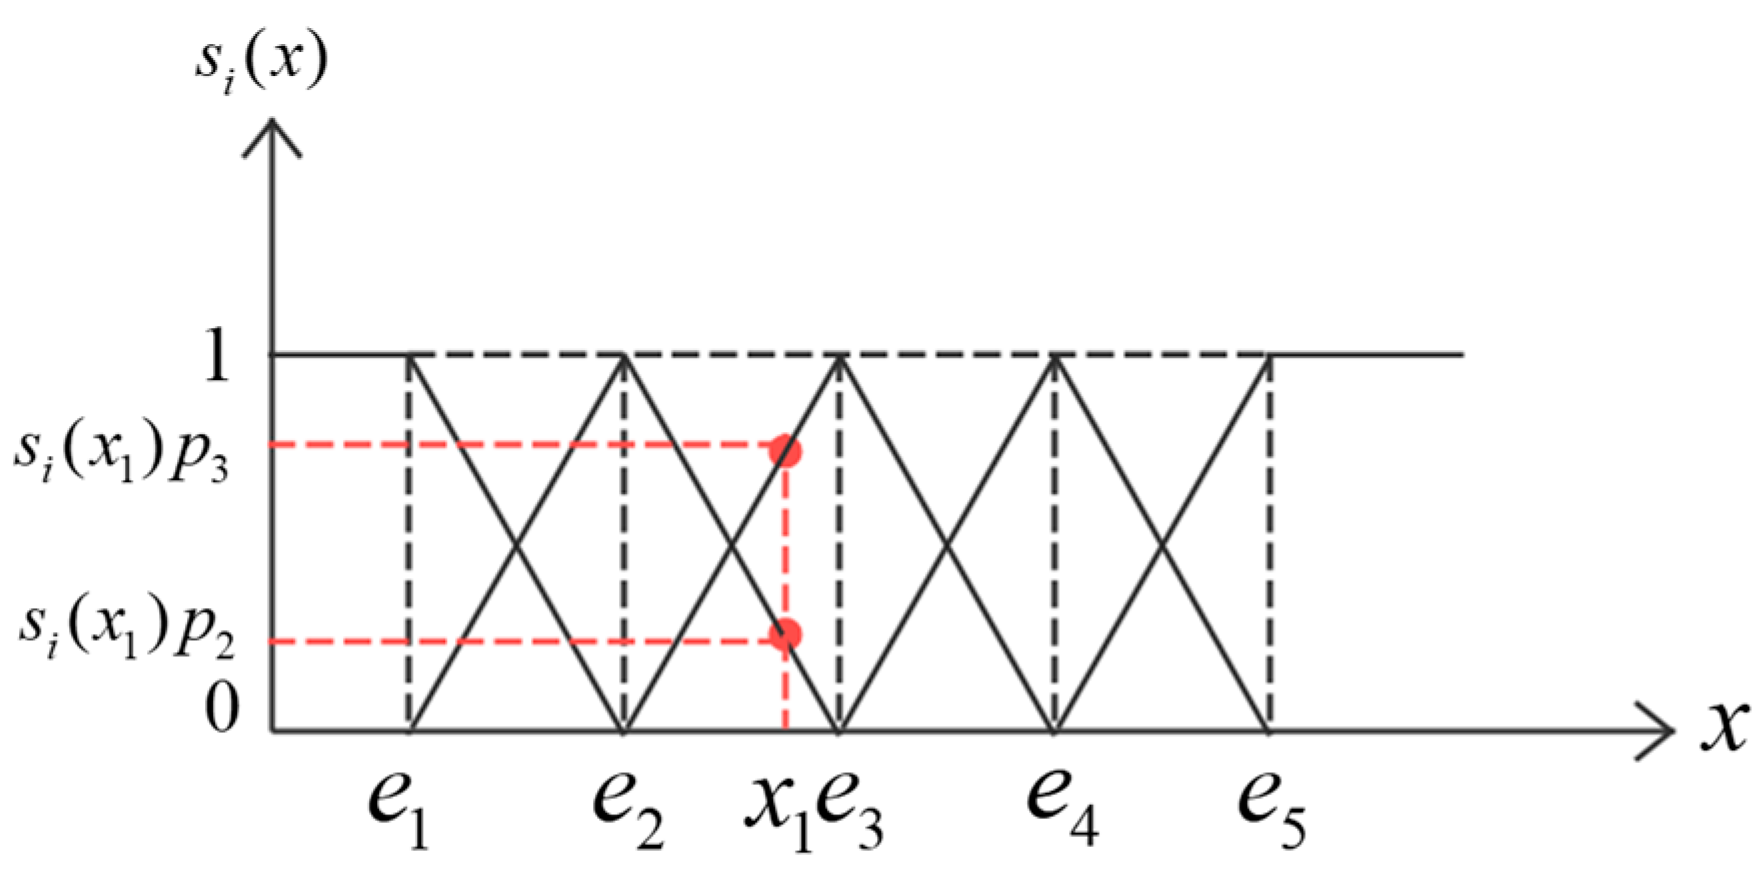
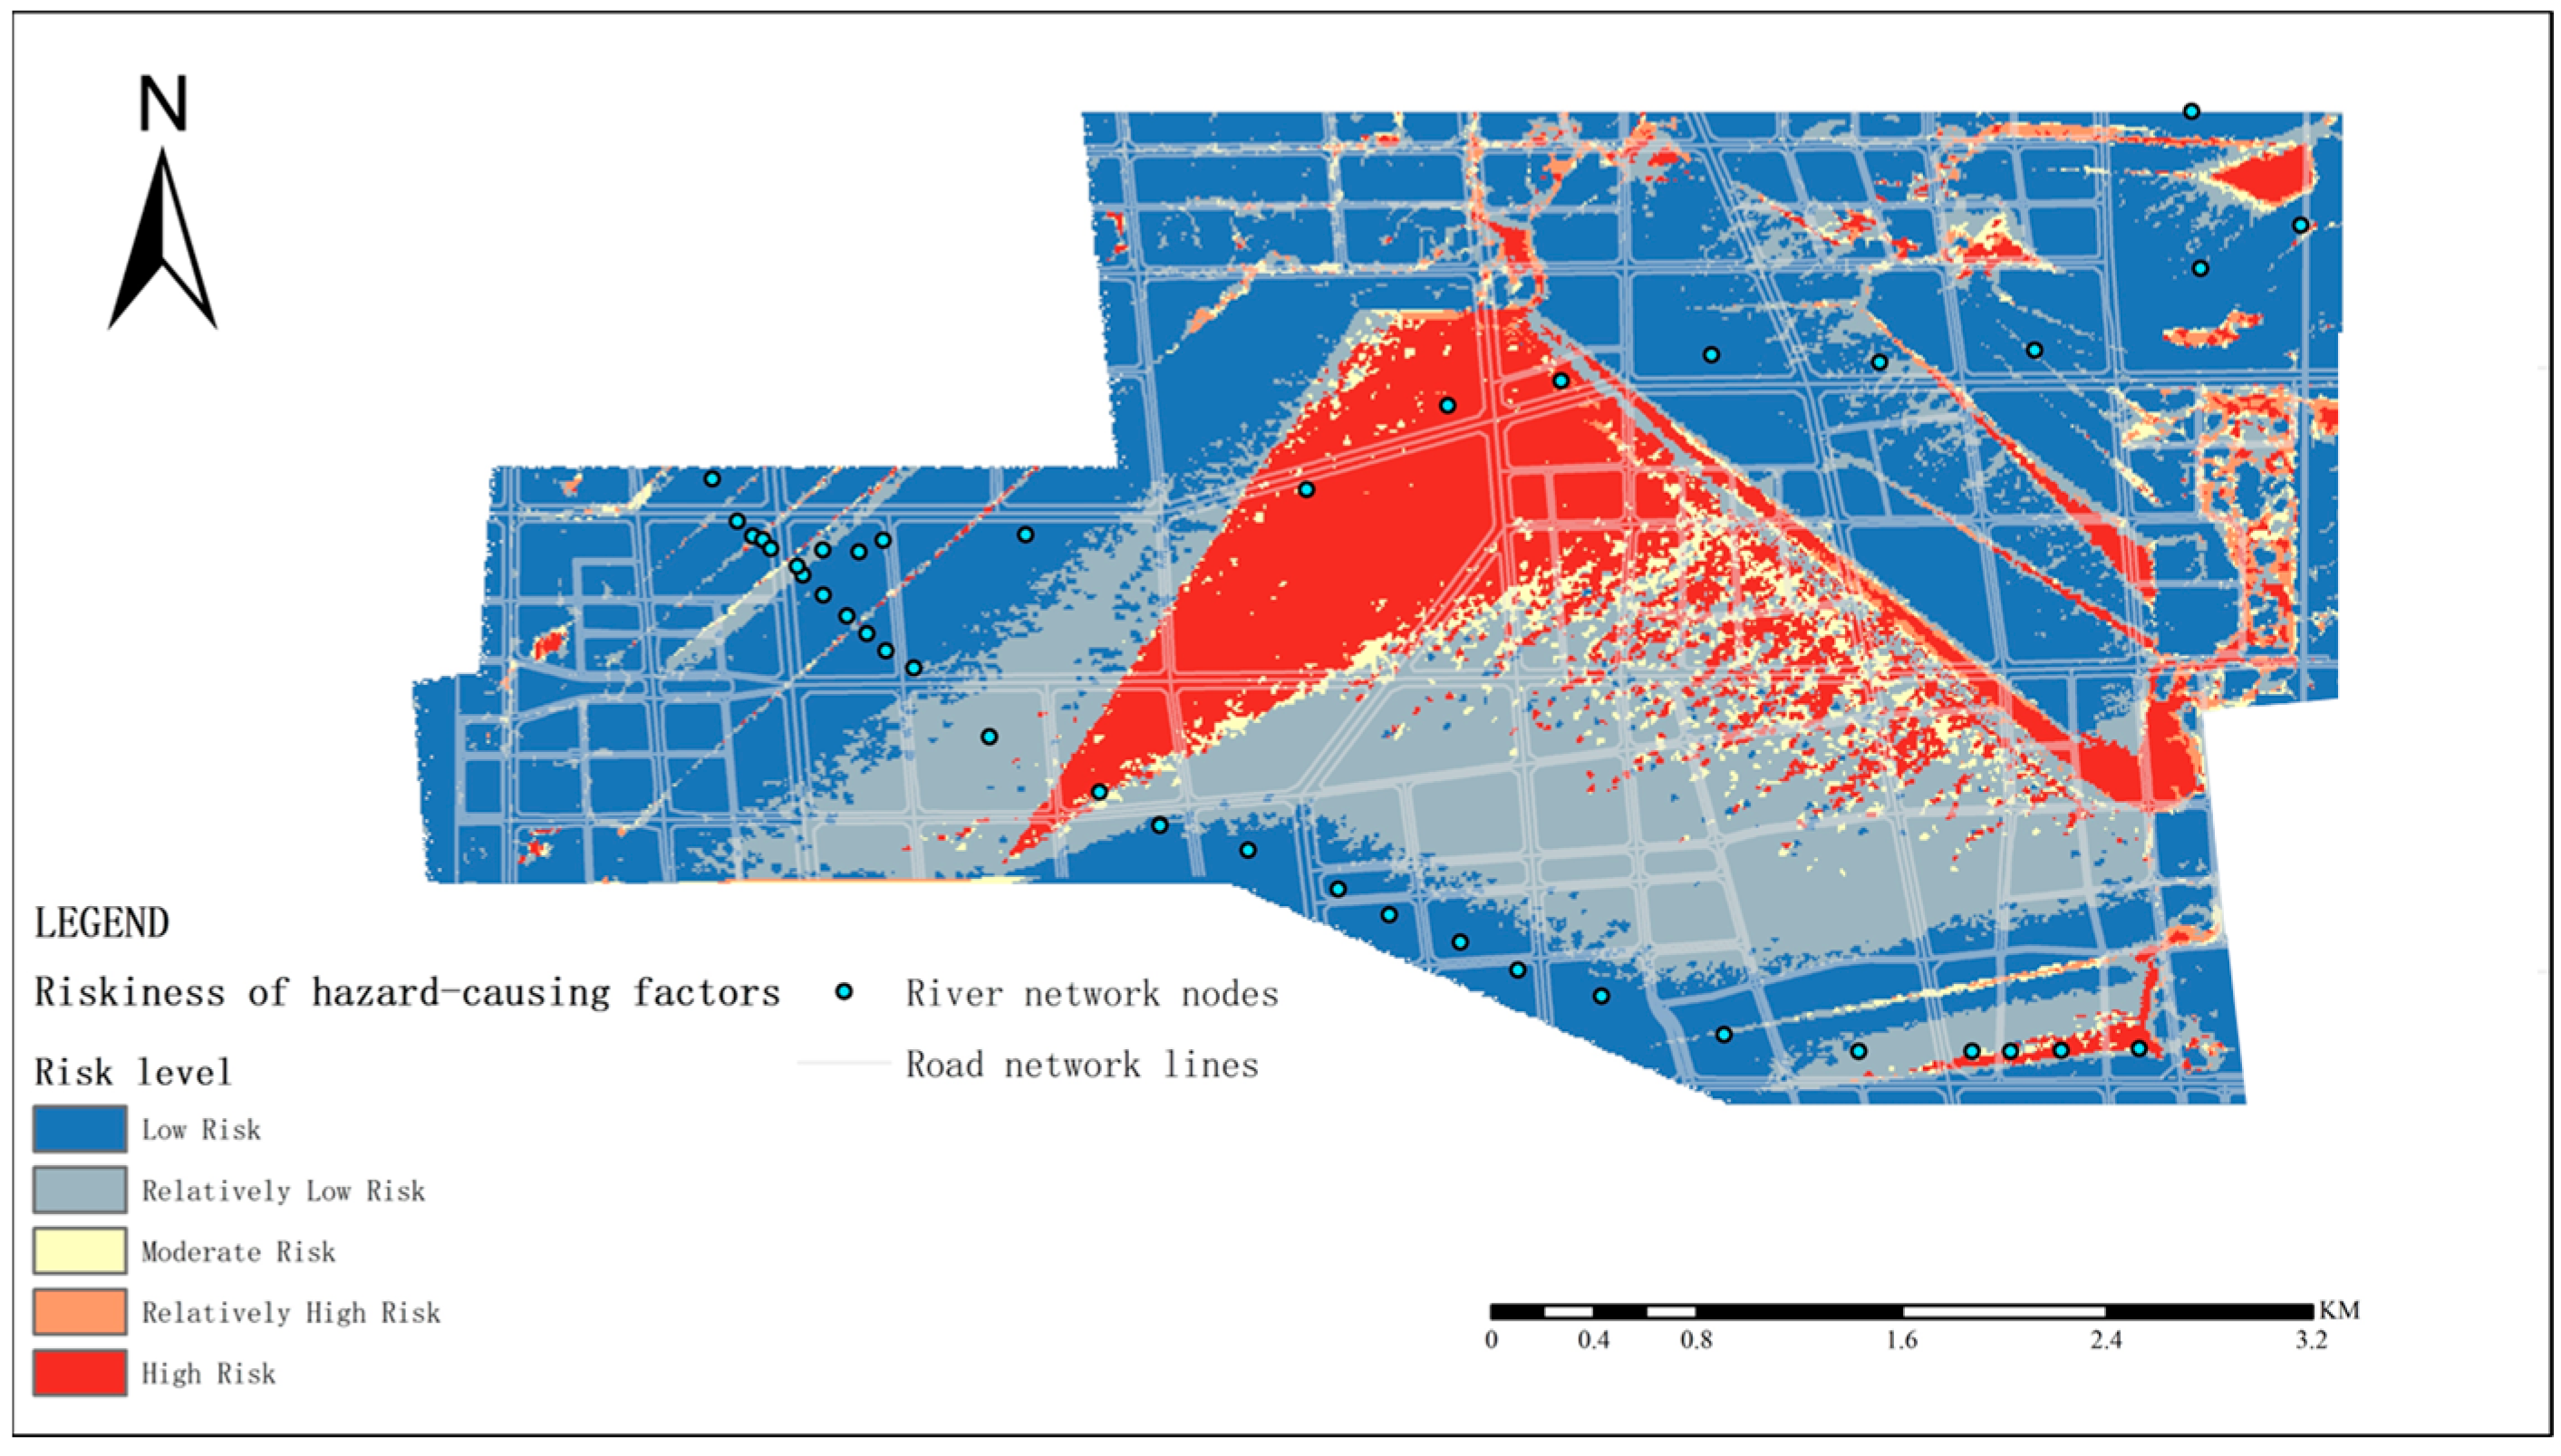
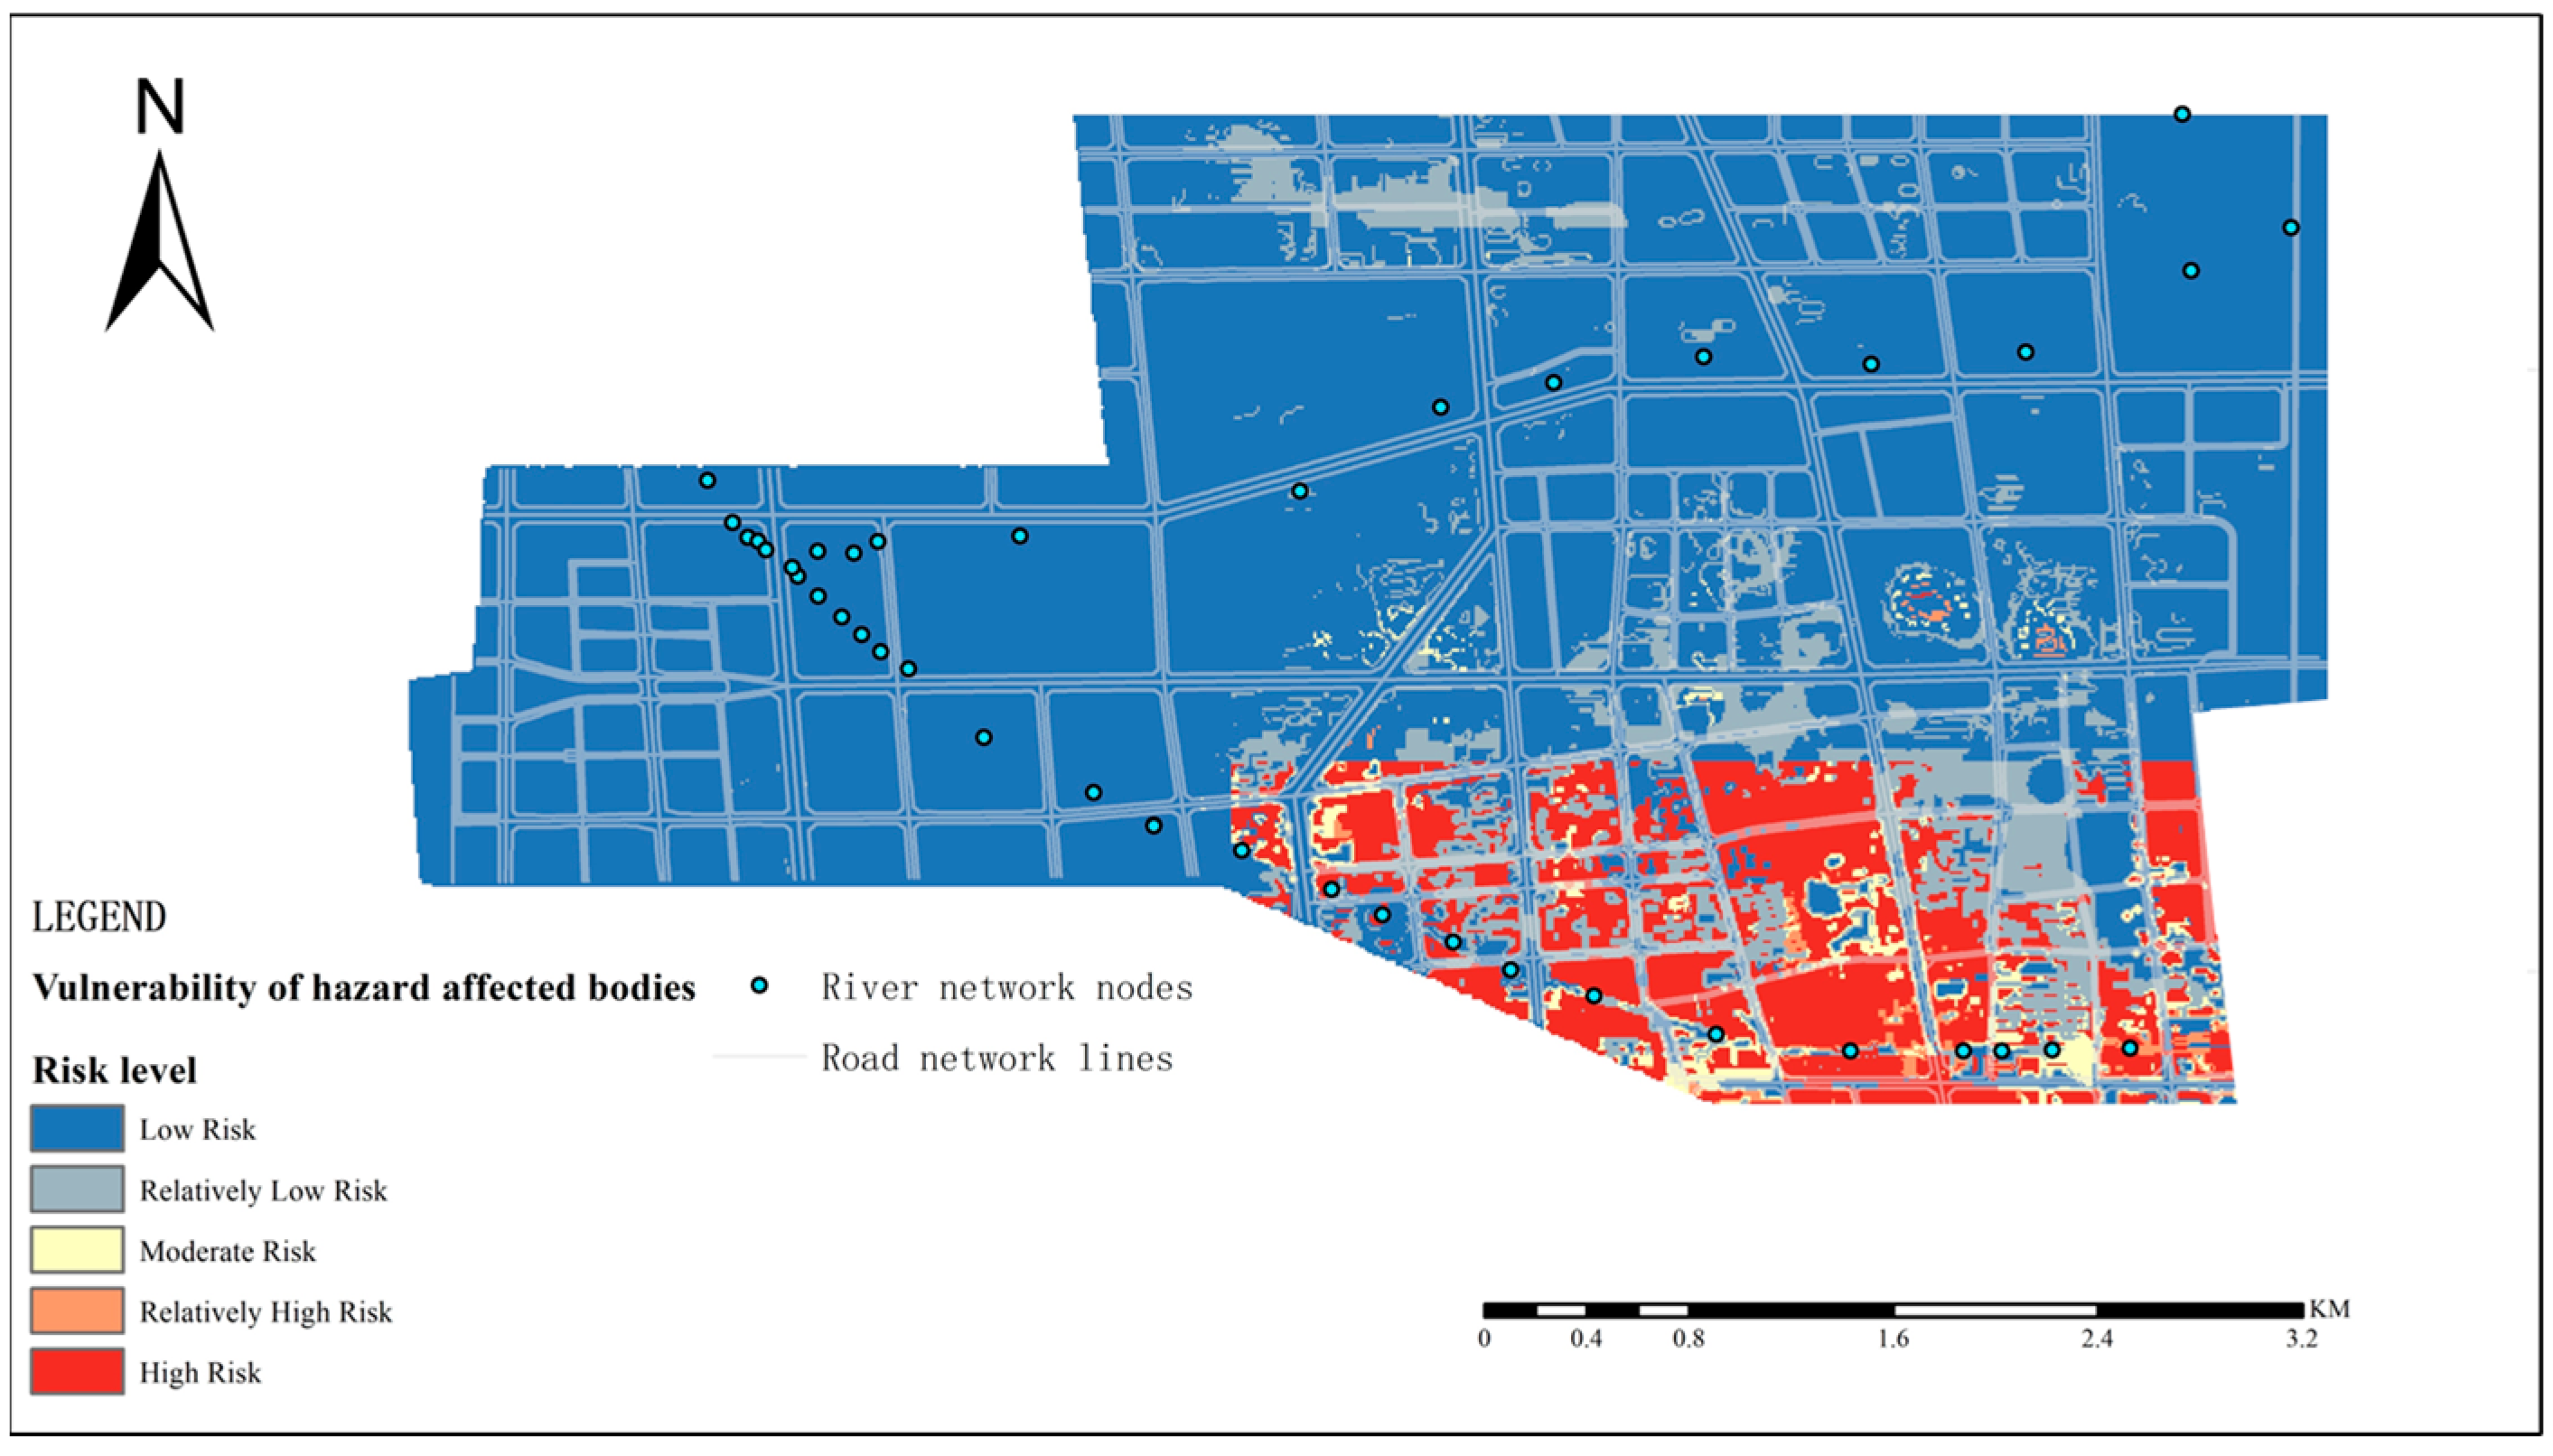
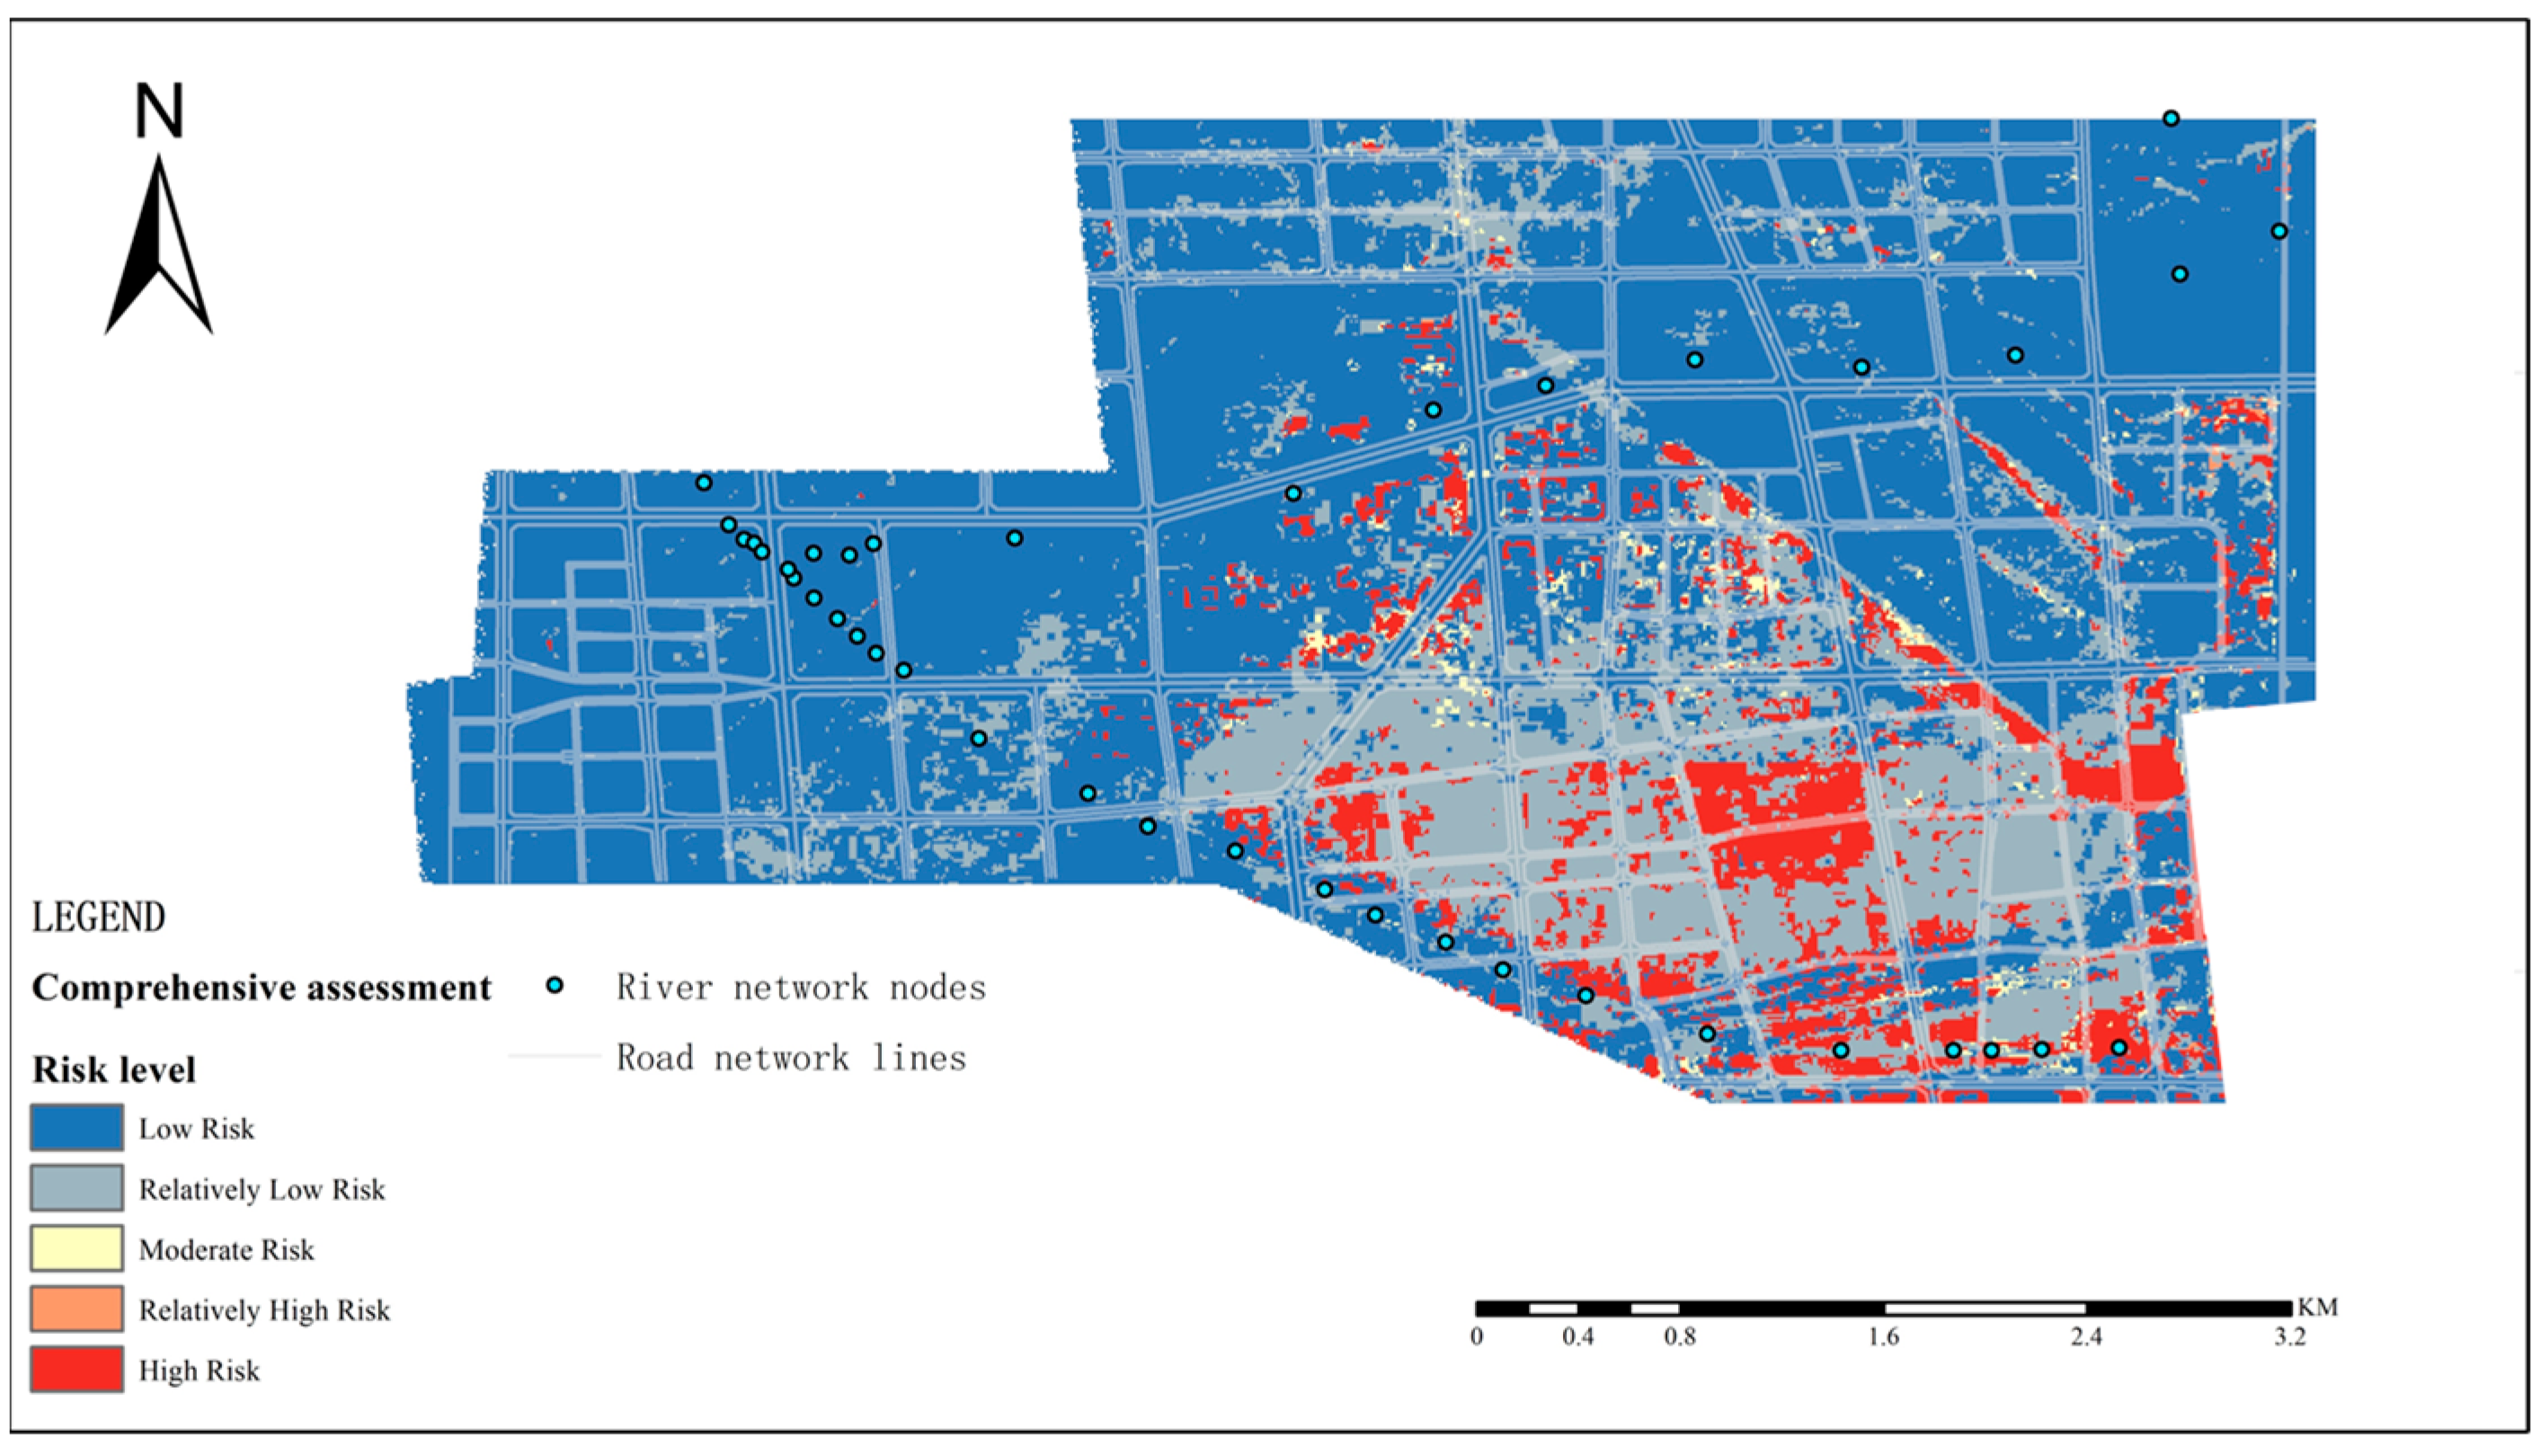
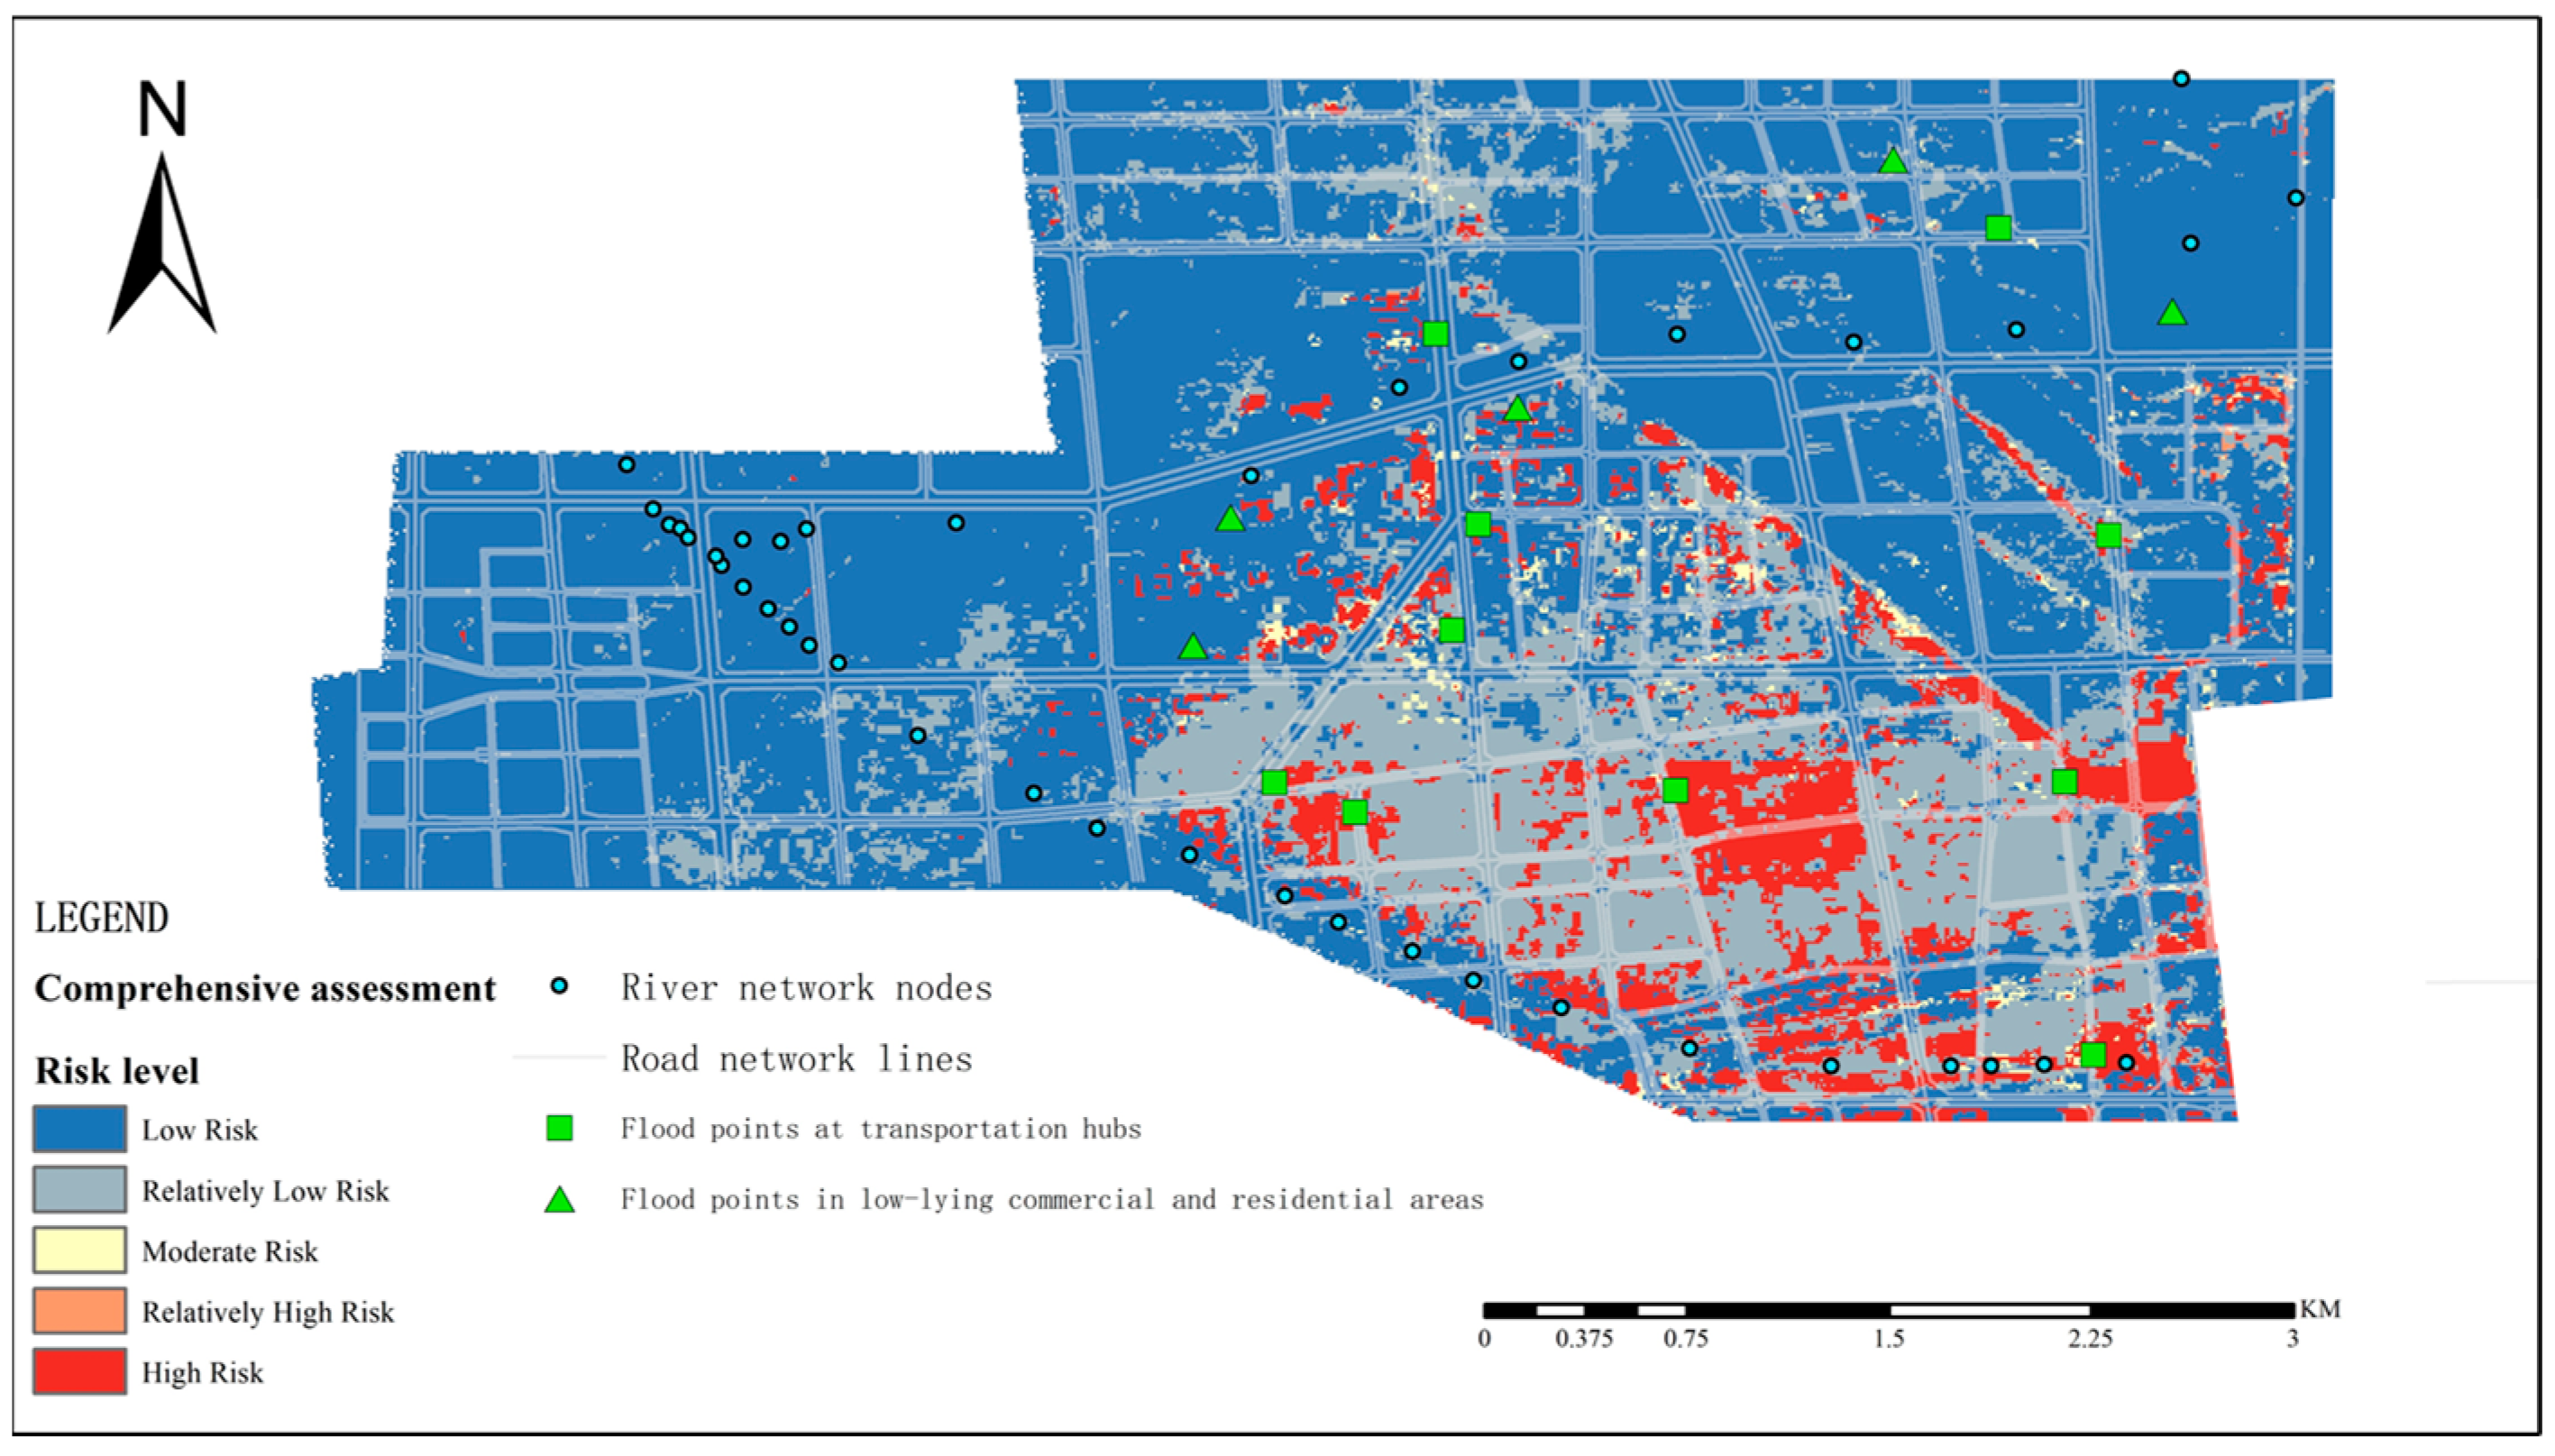
Using the FCE method, this study has established an urban flood risk fuzzy evaluation model with triangular membership functions, conducting fuzzy evaluations of the 11 indexes from the perspectives of hazard-causing factors, hazard-formative environment and hazard-affected bodies, as well as an overall fuzzy evaluation. The study area was categorized into five risk levels: “low risk, relatively low risk, moderate risk, relatively high risk, and high risk”, with area proportions of 68.98%, 22.75%, 0.86%, 0.10%, and 7.31%, respectively. The model’s evaluation accuracy can reach a raster resolution of 10 m × 10 m, making it suitable for detailed simulations within urban environments and providing a basis for the implementation of flood-prevention planning measures.

Author Contributions

X.M.: formal analysis, investigation, methodology, software, visualization, Writing—original draft. Y.W.: writing—review and editing. Z.T.: software. S.L.: supervision. All authors have read and agreed to the published version of the manuscript.

Funding

This research was supported by National Key Research and Development Program of China (2023YFC3208205).

Data Availability Statement

Datasets from this study are available from the corresponding author upon request.

Conflicts of Interest

The authors declare no conflicts of interest.

References

  1. Huang, Y.Q.; Lin, J.Y.; He, X.Y.; Lin, Z.C.; Wu, Z.F.; Zhang, X.C. Assessing the scale effect of urban vertical patterns on urban waterlogging: An empirical study in Shenzhen. Environ. Impact Assess. Rev. 2024, 106, 14. [Google Scholar] [CrossRef]
  2. Yin, Z.E.; Yin, J.; Xu, S.Y.; Wen, J.H. Community-based scenario modelling and disaster risk assessment of urban rainstorm waterlogging. J. Geogr. Sci. 2011, 21, 274–284. [Google Scholar] [CrossRef]
  3. Wei, W.S.; Mojtahedi, M.; Yazdani, M.; Kabirifar, K. The Alignment of Australia’s National Construction Code and the Sendai Framework for Disaster Risk Reduction in Achieving Resilient Buildings and Communities. Buildings 2021, 11, 429. [Google Scholar] [CrossRef]
  4. Al-Aizari, A.R.; Al-Masnay, Y.A.; Aydda, A.; Zhang, J.Q.; Ullah, K.; Islam, A.M.T.; Habib, T.; Kaku, D.U.; Nizeyimana, J.C.; Al-Shaibah, B.; et al. Assessment Analysis of Flood Susceptibility in Tropical Desert Area: A Case Study of Yemen. Remote Sens. 2022, 14, 4050. [Google Scholar] [CrossRef]
  5. Abd-Elaty, I.; Kuriqi, A.; Pugliese, L.; Zelenakova, M.; El Shinawi, A. Mitigation of urban waterlogging from flash floods hazards in vulnerable watersheds. J. Hydrol.-Reg. Stud. 2023, 47, 16. [Google Scholar] [CrossRef]
  6. Zhang, J.P.; Li, X.C.; Zhang, H.R. Research on urban waterlogging risk prediction based on the coupling of the BP neural network and SWMM model. J. Water Clim. Chang. 2023, 14, 3417–3434. [Google Scholar] [CrossRef]
  7. Chen, J.N.; Wang, Y.J.; Chen, Z.Y.; Si, L.L.; Liu, Q.Y.; Jiang, T. Changes in Population Exposure to Rainstorm Waterlogging for Different Return Periods in the Xiong’an New Area, China. Water 2024, 16, 205. [Google Scholar] [CrossRef]
  8. Yao, Y.C.; Hu, C.H.; Liu, C.S.; Yang, F.; Ma, B.Y.; Wu, Q.; Li, X.A.; Soomro, S.E.H. Comprehensive performance evaluation of stormwater management measures for sponge city construction: A case study in Gui’an New District, China. J. Flood Risk Manag. 2022, 15, 16. [Google Scholar] [CrossRef]
  9. Tehrany, M.S.; Jones, S.; Shabani, F. Identifying the essential flood conditioning factors for flood prone area mapping using machine learning techniques. Catena 2019, 175, 174–192. [Google Scholar] [CrossRef]
  10. de Moel, H.; Aerts, J.; Koomen, E. Development of flood exposure in the Netherlands during the 20th and 21st century. Glob. Environ. Change-Human Policy Dimens. 2011, 21, 620–627. [Google Scholar] [CrossRef]
  11. Du, S.Q.; Gu, H.H.; Wen, J.H.; Chen, K.; Van Rompaey, A. Detecting Flood Variations in Shanghai over 1949-2009 with Mann-Kendall Tests and a Newspaper-Based Database. Water 2015, 7, 1808–1824. [Google Scholar] [CrossRef]
  12. Zhao, L.D.; Zhang, T.; Fu, J.; Li, J.Z.; Cao, Z.X.; Feng, P. Risk Assessment of Urban Floods Based on a SWMM-MIKE21-Coupled Model Using GF-2 Data. Remote Sens. 2021, 13, 4381. [Google Scholar] [CrossRef]
  13. Wang, S.M.; Jiang, R.G.; Yang, M.X.; Xie, J.C.; Wang, Y.P.; Li, W. Urban rainstorm and waterlogging scenario simulation based on SWMM under changing environment. Environ. Sci. Pollut. Res. 2023, 30, 123259–123273. [Google Scholar] [CrossRef]
  14. Chen, Y.; Alexander, D. Integrated flood risk assessment of river basins: Application in the Dadu river basin, China. J. Hydrol. 2022, 613, 11. [Google Scholar] [CrossRef]
  15. Song, Y.Q.; Guo, L.; Wang, C.H.; Zhu, J.S.; Li, Z.W. Urban road waterlogging multi-level assessment integrated flood models and road network models. Transport. Res. Part D-Transport. Environ. 2024, 133, 17. [Google Scholar] [CrossRef]
  16. Zheng, C.X.; Yang, W.C.; Jiang, X.L.; Lian, J.J.; Hu, D.; Yan, X.; Yan, L. A novel integrated Urban flood risk assessment approach coupling GeoDetector-Dematel and clustering method. J. Environ. Manag. 2024, 354, 13. [Google Scholar] [CrossRef]
  17. Su, J.H.; Li, J.K.; Gao, X.J.; Yao, Y.T.; Jiang, C.B. Comprehensive analysis of waterlogging control and carbon emission reduction for optimal LID layout: A case study in campus. Environ. Sci. Pollut. Res. 2022, 29, 87802–87816. [Google Scholar] [CrossRef]
  18. Sun, X.L.; Jin, K.; Tao, H.; Duan, Z.; Gao, C.; Loukas, A. Flood Risk Assessment Based on Hydrodynamic Model-A Case of the China-Pakistan Economic Corridor. Water 2023, 15, 4295. [Google Scholar] [CrossRef]
  19. Kazakis, N.; Kougias, I.; Patsialis, T. Assessment of flood hazard areas at a regional scale using an index-based approach and Analytical Hierarchy Process: Application in Rhodope-Evros region, Greece. Sci. Total Environ. 2015, 538, 555–563. [Google Scholar] [CrossRef]
  20. Duan, C.Y.; Zhang, J.Q.; Chen, Y.A.; Lang, Q.L.; Zhang, Y.C.; Wu, C.Y.; Zhang, Z. Comprehensive Risk Assessment of Urban Waterlogging Disaster Based on MCDA-GIS Integration: The Case Study of Changchun, China. Remote Sens. 2022, 14, 3101. [Google Scholar] [CrossRef]
  21. Chen, F.H. Application of a hybrid dynamic MCDM to explore the key factors for the internal control of procurement circulation. Int. J. Prod. Res. 2015, 53, 2951–2969. [Google Scholar] [CrossRef]
  22. Sahraei, R.; Kanani-Sadat, Y.; Homayouni, S.; Safari, A.; Oubennaceur, K.; Chokmani, K. A novel hybrid GIS-based multi-criteria decision-making approach for flood susceptibility analysis in large ungauged watersheds. J. Flood Risk Manag. 2023, 16, 26. [Google Scholar] [CrossRef]
  23. AlAli, A.M.; Salih, A.; Hassaballa, A. Geospatial-Based Analytical Hierarchy Process (AHP) and Weighted Product Model (WPM) Techniques for Mapping and Assessing Flood Susceptibility in the Wadi Hanifah Drainage Basin, Riyadh Region, Saudi Arabia. Water 2023, 15, 1943. [Google Scholar] [CrossRef]
  24. Kheybari, S.; Rezaie, F.M.; Farazmand, H. Analytic network process: An overview of applications. Appl. Math. Comput. 2020, 367, 35. [Google Scholar] [CrossRef]
  25. Ghosh, S.; Chatterjee, N.D.; Dinda, S. Urban ecological security assessment and forecasting using integrated DEMATEL-ANP and CA-Markov models: A case study on Kolkata Metropolitan Area, India. Sust. Cities Soc. 2021, 68, 15. [Google Scholar] [CrossRef]
  26. Efraimidou, E.; Spiliotis, M. A GIS-Based Flood Risk Assessment Using the Decision-Making Trial and Evaluation Laboratory Approach at a Regional Scale. Environ. Process. 2024, 11, 39. [Google Scholar] [CrossRef]
  27. Zayat, W.; Kilic, H.S.; Yalcin, A.S.; Zaim, S.; Delen, D. Application of MADM methods in Industry 4.0: A literature review. Comput. Ind. Eng. 2023, 177, 36. [Google Scholar] [CrossRef]
  28. Chen, Y.C.; Lien, H.P.; Tzeng, G.H. Measures and evaluation for environment watershed plans using a novel hybrid MCDM model. Expert Syst. Appl. 2010, 37, 926–938. [Google Scholar] [CrossRef]
  29. Büyüközkan, G.; Güleryüz, S. An integrated DEMATEL-ANP approach for renewable energy resources selection in Turkey. Int. J. Prod. Econ. 2016, 182, 435–448. [Google Scholar] [CrossRef]
  30. Wang, Y.L.; Tzeng, G.H. Brand marketing for creating brand value based on a MCDM model combining DEMATEL with ANP and VIKOR methods. Expert Syst. Appl. 2012, 39, 5600–5615. [Google Scholar] [CrossRef]
  31. Jamali, A.; Robati, M.; Nikoomaram, H.; Farsad, F.; Aghamohammadi, H. Urban resilience assessment using hybrid MCDM model based on DEMATEL-ANP method (DANP). J. Indian Soc. Remote Sens. 2023, 51, 893–915. [Google Scholar] [CrossRef]
  32. Chukwuma, E.; Okonkwo, C.; Orakwe, L.; Dioha, M.O. GIS-Based Vulnerability Evaluation of Climate Change Hazards of Flood and Erosion Using an Integrated IVFRN-DEMATEL-ANP Decision Model. In Climate Change Impacts on Nigeria: Environment and Sustainable Development; Springer: Berlin/Heidelberg, Germany, 2023; pp. 379–408. [Google Scholar]
  33. Taherizadeh, M.; Niknam, A.; Nguyen-Huy, T.; Mezösi, G.; Sarli, R. Flash flood-risk areas zoning using integration of decision-making trial and evaluation laboratory, GIS-based analytic network process and satellite-derived information. Nat. Hazards 2023, 118, 2309–2335. [Google Scholar] [CrossRef]
  34. Cui, P.; Li, D.Z. Measuring the Disaster Resilience of an Urban Community Using ANP-FCE Method from the Perspective of Capitals. Soc. Sci. Q. 2019, 100, 2059–2077. [Google Scholar] [CrossRef]
  35. Li, F.; Yan, J.; Xiong, X.; Yan, H.; Tao, T.; Wang, L. GIS-based fuzzy comprehensive evaluation of urban flooding risk with socioeconomic index system development. Environ. Sci. Pollut. Res. 2023, 30, 53635–53647. [Google Scholar] [CrossRef]
  36. Shaikh, M.P.; Yadav, S.M.; Manekar, V.L. Flood hazards mapping by linking CF, AHP, and fuzzy logic techniques in urban areas. Nat. Hazards Rev. 2024, 25, 04023048. [Google Scholar] [CrossRef]
  37. Shi, P. Disaster Risk Science, 2nd ed.; Beijing Normal University Press: Beijing, China, 2019; pp. 49–96. [Google Scholar] [CrossRef]
  38. Roy, S.; Bose, A.; Chowdhury, I.R. Flood risk assessment using geospatial data and multi-criteria decision approach: A study from historically active flood-prone region of Himalayan foothill, India. Arab. J. Geosci. 2021, 14, 999. [Google Scholar] [CrossRef]
  39. Zhang, B.; Yuan, H.Y.; Huang, Q.Y.; Wen, R.Q.; Gu, J.Q. Research on fine Spatial Quantitative Model about vulnerability of hazard-affected bodies. Int. J. Digit. Earth 2010, 3, 395–405. [Google Scholar] [CrossRef]
  40. Golcuk, I.; Baykasoglu, A. An analysis of DEMATEL approaches for criteria interaction handling within ANP. Expert Syst. Appl. 2016, 46, 346–366. [Google Scholar] [CrossRef]
  41. Chen, J.F.; Hsieh, H.N.; Do, Q.H. Evaluating teaching performance based on fuzzy AHP and comprehensive evaluation approach. Appl. Soft. Comput. 2015, 28, 100–108. [Google Scholar] [CrossRef]
  42. Zhao, J.F.; Wang, Y.P.; Xu, J.W.; Xie, H.F.; Sun, S. Soil Moisture Assessment Based on Multi-Source Remotely Sensed Data in the Huaihe River Basin, China. J. Am. Water Resour. Assoc. 2020, 56, 935–949. [Google Scholar] [CrossRef]
  43. Xu, X.; Yu, F.; Pedrycz, W.; Du, X. Multi-source fuzzy comprehensive evaluation. Appl. Soft. Comput. 2023, 135, 110042. [Google Scholar] [CrossRef]
  44. Zhao, H.L.; Yao, L.H.; Mei, G.; Liu, T.Y.; Ning, Y.S. A Fuzzy Comprehensive Evaluation Method Based on AHP and Entropy for a Landslide Susceptibility Map. Entropy 2017, 19, 396. [Google Scholar] [CrossRef]
  45. Zheng, Q.; Shen, S.L.; Zhou, A.N.; Lyu, H.M. Inundation risk assessment based on G-DEMATEL-AHP and its application to Zhengzhou flooding disaster. Sust. Cities Soc. 2022, 86, 12. [Google Scholar] [CrossRef]
  46. Zhang, H.P.; Wu, W.M.; Hu, C.H.; Hu, C.W.; Li, M.; Hao, X.L.; Liu, S. A distributed hydrodynamic model for urban storm flood risk assessment. J. Hydrol. 2021, 600, 21. [Google Scholar] [CrossRef]
  47. Azareh, A.; Sardooi, E.R.; Choubin, B.; Barkhori, S.; Shahdadi, A.; Adamowski, J.; Shamshirband, S. Incorporating multi-criteria decision-making and fuzzy-value functions for flood susceptibility assessment. Geocarto Int. 2021, 36, 2345–2365. [Google Scholar] [CrossRef]
  48. Nachappa, T.G.; Piralilou, S.T.; Gholamnia, K.; Ghorbanzadeh, O.; Rahmati, O.; Blaschke, T. Flood susceptibility mapping with machine learning, multi-criteria decision analysis and ensemble using Dempster Shafer Theory. J. Hydrol. 2020, 590, 17. [Google Scholar] [CrossRef]
  49. Hu, H.; Liu, Y.K.; Du, J.K.; Liu, R.Q.; Wu, B.L.; Zeng, Q.W. Systematic Assessment on Waterlogging Control Facilities in Hefei City of Anhui Province in East China. Water 2024, 16, 620. [Google Scholar] [CrossRef]
  50. Meerow, S.; Newell, J.P. Spatial planning for multifunctional green infrastructure: Growing resilience in Detroit. Landsc. Urban Plan. 2017, 159, 62–75. [Google Scholar] [CrossRef]
  51. Mann, R.; Gupta, A. Mapping flood vulnerability using an analytical hierarchy process (AHP) in the Metropolis of Mumbai. Environ. Monit. Assess. 2023, 195, 25. [Google Scholar] [CrossRef]
  52. Chen, X.S.; Jiang, S.L.; Xu, L.S.; Xu, H.G.; Guan, N.N. Resilience assessment and obstacle factor analysis of urban areas facing waterlogging disasters: A case study of Shanghai, China. Environ. Sci. Pollut. Res. 2023, 30, 65455–65469. [Google Scholar] [CrossRef]
  53. Liu, J.Y.; Zheng, W.W.; Li, H.M.; Chen, J. Evaluation of Flooding Disaster Risks for Subway Stations Based on the PSR Cloud Model. Sustainability 2023, 15, 15552. [Google Scholar] [CrossRef]
  54. Alvarez, P.A.; Ishizaka, A.; Martinez, L. Multiple-criteria decision-making sorting methods: A survey. Expert Syst. Appl. 2021, 183, 23. [Google Scholar] [CrossRef]
Figure 1. The structure of urban flood risk assessment index system.
Water 17 01494 g001
Figure 2. Piecewise membership function graph.
Water 17 01494 g002
Figure 3. Framework of the urban flood risk assessment model.
Water 17 01494 g003
Figure 4. Study area. (a) Location. (b) Water system distribution.
Water 17 01494 g004
Figure 5. Two-dimensional flood model of the study area.
Water 17 01494 g005
Figure 6. Measured rainfall records at the hydrological station.
Water 17 01494 g006
Figure 7. The distribution of indexes. (a) Total flood duration. (b) Max depth of flood. (c) Flood area. (d) Max speed of 2D water flow. (e) Ground elevation. (f) Slope. (g) Impermeability. (h) GDP. (i) Point of interest density. (j) Population density. (k) Building density.
Water 17 01494 g007aWater 17 01494 g007b
Figure 8. Centrality—causality diagram of the index system.
Water 17 01494 g008
Figure 9. Index weight diagram of the urban flood risk assessment model. (a) Dimension layer. (b) Criterion layer.
Water 17 01494 g009
Figure 10. The membership degree images of indexes to each risk level p. (a) S1p1. (b) S1p2. (c) S1p3. (d) S1p4. (e) S1p5.
Water 17 01494 g010
Figure 11. The flood risk distribution map of hazard-causing factors.
Water 17 01494 g011
Figure 12. The flood risk distribution map of hazard-formative environment.
Water 17 01494 g012
Figure 13. The flood risk distribution map of hazard-affected bodies.
Water 17 01494 g013
Figure 14. The flood risk distribution map.
Water 17 01494 g014
Figure 15. The flood points in the risk distribution map.
Water 17 01494 g015
Table 1. Data sources for urban flood risk assessment index system.
SI.NOIndexesData TypesData Sources
1Total flood durationShapefileInfoworks ICM
2Max depth of floodShapefileInfoworks ICM
3Flood areaShapefileInfoworks ICM
4Max speed of 2D water flowShapefileInfoworks ICM
5Ground elevationRaster dataNASADEM Merged DEM Global 1 arc second V001 [dataset]. NASA EOSDIS Land Processes DAAC
6SlopeRaster dataNASADEM Merged DEM Global 1 arc second V001 [dataset]. NASA EOSDIS Land Processes DAAC
7ImpermeabilityRaster dataGLC_FCS30D
8GDPRaster data (TIFF)Gridded global datasets for Gross Domestic Product and Human Development Index over 1990–2015
9Point of interest densityVector dataGuihuayun POI data (http://www.guihuayun.com), accessed on 6 November 2024
10Population densityRaster dataHigh resolution population distribution maps for Southeast Asia in 2010 and 2015
11Building densityShapefileGABLE: A first fine-grained 3D building
Table 2. The urban flood risk classification intervals.
SI.NOIndexes Δ e1e2e3e4e5
1Total flood duration(h)5.020.015.0310.0515.0720.09
2Max depth of flood(m)0.280.010.290.570.851.13
3Flood area0.240.010.250.490.730.97
4Max speed of 2D water flow(m/s)0.250.010.260.510.761.01
5Ground elevation (m)8.2597.0088.7580.5072.2564.00
6Slope (%)3.060.013.076.139.1912.25
7Impermeability0.190.010.200.390.580.77
8GDP (×108)12.673.3015.9728.6441.3153.98
9Point of interest density (×107)1.900.011.913.815.717.61
10Population density37.650.4038.0575.70113.35151.00
11Building density0.240.010.250.490.730.97
Table 3. The membership function of urban flood risk assessment model.
Risk Level 1Risk Level 2Risk Level 3Risk Level 4Risk Level 5
s i p 1 = 1 ,   x e 1 e 2 x e 2 e 1 ,   e 1 < x < e 2 0 ,   x e 2 s i p 2 = 0 ,   x e 1 x e 1 e 2 a 1 ,   e 1 < x e 2 e 3 x e 3 e 2 ,   e 2 < x < e 3 0 ,   x e 3 s i p 3 = 0 ,   x e 2 x e 2 e 3 e 2 ,   e 2 < x e 3 e 4 x e 4 e 3 ,   e 3 < x < e 4 0 ,   x e 4 s i p 4 = 0 ,   x e 3 x e 3 e 4 e 3 ,   e 3 < x e 4 e 5 x e 5 e 4 ,   e 4 < x < e 5 0 ,   x e 5 s i p 5 = 0 ,   x e 4 x e 4 e 5 e 4 ,   e 4 < x < e 5 1 ,   x e 5
Table 4. Model calibration and validation results.
SI.NOLocation“821” Rainfall Event“713” Rainfall Event
Simulated Water Depth (cm)Measured Water Depth (cm)Relative Error (%)Simulated Water Depth (cm)Measured Water Depth (cm)Relative Error (%)
1Taishan Road—Wenming Road Intersection3430–360000
2Taishan Road—Jinshan Road Intersection4539–442.2720.50–30
3Near Leshan Avenue—Jinjun Street2822–280000
4Fuqiang Road—Yude Road Intersection6250–594.843529–336.07
Table 5. The total-relation matrix QD.
Riskiness of Hazard-Causing Factors (S1)Stability of Hazard-Formative Environment (S2)Vulnerability of Hazard-Affected Bodies (S3)
Riskiness of hazard-causing factors (S1)0.6730.6470.757
Stability of hazard-formative environment (S2)1.5360.8261.213
Vulnerability of hazard-affected bodies (S3)1.3481.0720.841
Table 6. The total-relation matrix QC.
S11S12S13S14S21S22S23S31S32S33S34
S110.3200.4150.4140.3490.1700.1930.2580.3180.3160.3080.318
S120.4610.3280.4220.3650.1970.2170.2630.3270.3340.3260.323
S130.4260.4110.3100.3450.1700.2030.2580.3190.3170.3180.310
S140.3620.3540.3530.2310.1520.1810.2080.2630.2650.2790.261
S210.5460.5520.5310.4820.1860.3360.3020.4150.4220.4270.445
S220.5780.5690.5670.5240.2690.2330.3240.4340.4330.4600.455
S230.4960.4780.4780.4100.1700.2020.2390.3490.3520.3680.381
S310.5020.4880.4940.4170.2070.2690.3810.3680.4990.5160.523
S320.4700.4570.4580.3890.1950.2500.3580.4670.3490.4840.491
S330.4780.4610.4610.4060.2020.2570.3500.4600.4690.3630.496
S340.5610.5410.5510.4660.2360.3040.4120.4940.5030.5370.408
Table 7. Index weights of the urban flood risk assessment model.
Dimension LayerWeightOrderCriteria LayerWeightOrder
Riskiness of hazard-causing factors (S1)0.3841Total flood duration0.1022
Max depth of flood0.0993
Flood area0.0984
Max speed of 2D water flow0.0856
Stability of hazard-formative environment (S2)0.2933Ground elevation0.07811
Slope0.0955
Impermeability0.1201
Vulnerability of hazard-affected bodies (S3)0.3232GDP0.07910
Point of interest density0.0809
Population density0.0827
Building density0.0827
Table 8. The proportion of rasters with different risk levels.
Riskiness of Hazard-Causing Factors (S1)Stability of Hazard-Formative Environment (S2)Vulnerability of Hazard-Affected Bodies (S3)The Comprehensive Risk Assessment
Low risk 53.09%0.99%76.87%68.98%
Relatively low risk26.50%41.04%10.65%22.75%
Moderate risk4.06%12.63%1.85%0.86%
Relatively high risk1.99%0.07%0.64%0.10%
High risk14.35%45.27%9.99%7.31%
Disclaimer/Publisher’s Note: The statements, opinions and data contained in all publications are solely those of the individual author(s) and contributor(s) and not of MDPI and/or the editor(s). MDPI and/or the editor(s) disclaim responsibility for any injury to people or property resulting from any ideas, methods, instructions or products referred to in the content.

