Article

A New Method for Calculating the Roughness Coefficient of Salt Marsh Vegetation Based on Field Flow Observation

1
National Key Laboratory of Water Disaster Prevention, Hohai University, Nanjing 210098, China
2
Shanghai Estuarine and Coastal Science Research Center, Shanghai 201201, China
3
College of Water Conservancy and Hydropower Engineering, Hohai University, Nanjing 210098, China
*
Author to whom correspondence should be addressed.
Water 2025, 17(10), 1490; https://doi.org/10.3390/w17101490
Submission received: 26 February 2025 / Revised: 28 March 2025 / Accepted: 2 April 2025 / Published: 15 May 2025
(This article belongs to the Section Ecohydrology)

Abstract

:
Salt marsh vegetation significantly changes water motion and sediment transport in coastal wetlands, which further influences the geomorphological evolution of coastal wetlands. Accurate determination of the vegetation drag coefficient (Manning’s roughness coefficient) is critical to vegetation flow resistance research. Previous studies on the vegetation roughness coefficient mainly conducted flume experiments under the one-dimensional steady flow condition, which could not reflect the two-dimensional unsteady flow condition in salt marsh vegetated zones. Through theoretical formula analysis and synchronized field observations in a salt marsh vegetated zone, we propose a novel method for calculating the roughness coefficient of salt marsh vegetation especially under the two-dimensional unsteady flow condition. The results indicate that the vegetation roughness coefficient under the two-dimensional unsteady flow condition can be obtained by integrating the flow resistance equation with the discretized momentum conservation equation. Then, in combination with field observation data, the temporal variations in the vegetation roughness coefficient can be derived. The salt marsh vegetated zone in the Jiuduansha Wetland is dominated by flooding currents, and ebbing currents are of secondary importance. The flow resistance of vegetation on flooding and ebbing currents is remarkable. Moreover, the roughness coefficient shows an inverse power-law relationship with the product of flow velocity and water depth (i.e., Ufhf) at the control volume center. Under the same Ufhf scenario, due to the increase in the water-facing area of vegetation, the roughness coefficient during the submerged period is generally greater than that during the non-submerged period. The calculated roughness coefficients and their relationships with Ufhf are consistent with those shown in previous flume experiments, indicating that our proposed method is reasonable. This new method could help determine vegetation flow resistance accurately (particularly under the two-dimensional unsteady flow condition), and it may provide implications for eco-geomorphological simulations of coastal wetlands.

1. Introduction

Vegetation is an important component of wetland ecosystems in riverine, estuarine, and coastal zones [1,2]. Vegetation is a key indicator of wetland ecosystem health, and it plays a significant role in water and soil conservation, sediment trapping and deposition, water quality purification, and habitat improvement [3,4]. Hydrodynamics is an important factor for the evolution of wetlands, affecting wetland ecological functions [5,6,7]. Moreover, hydrodynamic conditions in wetlands are primarily controlled by vegetation-induced flow resistance [8,9]. The presence of vegetation increases flow resistance, decreases flow velocity, and changes the flow structure [10,11], which can influence sediment transport and thus the geomorphological evolution of coastal wetlands [12,13]. Recently, many ecological protection and restoration projects have been implemented to facilitate ecosystem services and sustainability of coastal wetlands [14]. Therefore, flow resistance associated with vegetation needs further research to help predict the evolution trends of coastal wetlands and devise conservation measures.
The flow resistance coefficient is of significance for engineering projects [15,16,17]. Among the different kinds of flow resistance coefficients, Manning’s resistance coefficient is a famous one and has been widely applied in flow resistance calculation and engineering project construction [18,19]. It uses a roughness coefficient (i.e., n ) to quantify the flow resistance induced by the vegetation and bed. Previous studies have indicated that Manning’s roughness coefficient ( n ) is primarily influenced by factors such as flow velocity, water depth, and vegetation characteristics. Kouwen and Fathi-Moghadam [20] conducted flume experiments and found that the flow current could cause vegetation to bend, and the vegetation flow resistance varied significantly with increasing flow velocity. Kumar et al. [21] demonstrated that flexible vegetation (paddy plants) achieved a 90% velocity reduction—far exceeding that of rigid vegetation (24%). Further, Iqbal et al. [22] revealed that flexible patches exhibit reverse trends in energy reduction (decreasing with higher Froude numbers) compared to rigid vegetation. Through flume experiments, Wilson et al. [23] demonstrated that Manning’s roughness coefficient decreased with increasing water depth and maintained a relatively stable value when the water depth increased to a certain threshold. Bing Shi [24] observed and analyzed the relationships between the roughness coefficient and factors such as slope and the bending height of flexible submerged vegetation. Using prototype vegetation, Shucksmith et al. [25] conducted experiments to investigate the relationship between the roughness coefficient and vegetation submergence (particularly under the different growth stages of vegetation). Additionally, numerous researchers have utilized artificial vegetation to experimentally study the relationships between the roughness coefficient and flow velocity, water depth, plant density, submerged condition, and vegetation coverage [16,18,25,26,27,28]. Some researchers have also explored the relationships between the roughness coefficient of natural vegetation and flow and vegetation conditions through laboratory or field flume experiments [17,25,29,30].
In summary, previous studies on Manning’s roughness coefficient were predominantly based on laboratory and field flume experiments. Their results (i.e., relationships of the roughness coefficient with influencing factors) were obtained by fitting experimental data. Consequently, these proposed relationships are highly dependent on vegetation species and experimental conditions, and they still have some limitations, particularly in practical application. Moreover, the existing studies on the vegetation roughness coefficient were mainly conducted through flume experiments under the one-dimensional steady flow condition. These one-dimensional flume experiments could not reproduce the complex conditions of two-dimensional unsteady flow in salt marsh vegetated zones. The findings from laboratory flume experiments should be further validated by detailed observations of the hydrodynamics in situ.
By deriving the theoretical formula for the equivalent Manning roughness coefficient under the two-dimensional unsteady flow condition, this study proposes a method to simultaneously observe the hydrodynamics of the control volume in vegetation areas. This approach facilitates the calculation of the actual equivalent Manning roughness coefficient in the study area. This study aims to provide an insight into the accurate determination of vegetation flow resistance in coastal wetlands. This paper is organized as follows: Section 2 describes the used methods (i.e., theoretical derivation of formulas and field observations of hydrodynamics) in detail. Then, the variations in hydrodynamics (e.g., water depth, flow velocity, and flow direction) and Manning’s roughness coefficient are shown in Section 3. Section 4 further validates the findings of our study against the results of previous flume experiments, compares the differences between the submerged and non-submerged conditions, and discusses the applications and limitations of this study. Finally, the main conclusions of our study are summarized in Section 5.

2. Methods

The existing formulas of flow resistance are based on the resistance coefficient, which determines the accuracy of the calculated resistance. There are several methods (e.g., theoretical analysis and flume experiments) to derive the resistance coefficient under the condition of one-dimensional steady flow. However, for two-dimensional unsteady flow, the resistance coefficient is selected empirically [31,32]. That is, few studies obtain the two-dimensional unsteady flow resistance coefficient from theoretical analysis or field observation.

2.1. Theoretical Formulas

The flow resistance of vegetation under the scenario of one-dimensional steady flow is calculated as follows [16,18,25,26,27,28]:
τ = ρ g n 2 U 2 h 1 / 3
where τ is the flow resistance caused by vegetation (N/m2); ρ is the water density (kg/m3); g is the acceleration of gravity (m/s2); n is the equivalent Manning roughness coefficient, which is often derived experimentally or empirically and represents the integrated roughness of the bed and vegetation; U is the depth-averaged velocity (m/s); and h is the water depth (m).
The flow resistance under the two-dimensional unsteady flow condition originates from Equation (1). It is composed of τ x and τ y in the x and y directions, respectively, which read as follows:
τ x = ρ g n 2 u U h 1 / 3 τ y = ρ g n 2 v U h 1 / 3
in which U = u 2 + v 2 , and u and v are the depth-averaged velocity components (m/s) in the x and y directions, respectively. Note that the value of n is often determined based on a laboratory experiment (e.g., one-dimensional steady flow flume experiment) or just experience.
The relatively smaller value terms (e.g., higher order, wind stress, and Coriolis force terms) are neglected based on field measurements. The momentum conservation equation under the condition of two-dimensional unsteady flow can be written as follows:
h u t + h u u x + h u v y = g h η x τ x ρ h v t + h v u x + h v v y = g h η y τ y ρ
where t is the time (s) and η is the water level (m).
Then, the formulas of flow resistance under two-dimensional unsteady flow can be derived from Equation (3):
τ x = ρ h u t + h u u x + h u v y + g h η x τ y = ρ h v t + h v u x + h v v y + g h η y
The discretization of Equation (4) over the control volume element (Figure 1) is performed using the finite difference and finite volume methods. The formulas of flow resistance within the control volume element are thus shown as follows:
τ x = ρ ( h u ) f m + 1 ( h u ) f m Δ t + j = 1 k ( ( h u u ) j m Δ x j + ( h u v ) j m Δ y j ) Δ x j Δ y j / d a + g h f m j = 1 k η j m Δ x Δ x j Δ y j / d a τ y = ρ ( h v ) f m + 1 ( h v ) f m Δ t + j = 1 k ( ( h v u ) j m Δ x j + ( h v v ) j m Δ y j ) Δ x j Δ y j / d a + g h f m j = 1 k η j m Δ y Δ x j Δ y j / d a
in which m is the time step index; Δ x j and Δ y j are, respectively, the increments (m) in the x and y directions for the j -th edge of the control volume element; k is the edge number of the control volume element, and it is 3 in this study; f is the center (m) of the control volume element; and d a is the area (m2) of the control volume element.
Combining Equations (2) and (5), the formula of the equivalent Manning roughness coefficient under the two-dimensional unsteady flow scenario can be written as follows:
n = τ x + τ y ρ g U f m u f m + v f m h f m 1 / 3

2.2. Field Observation

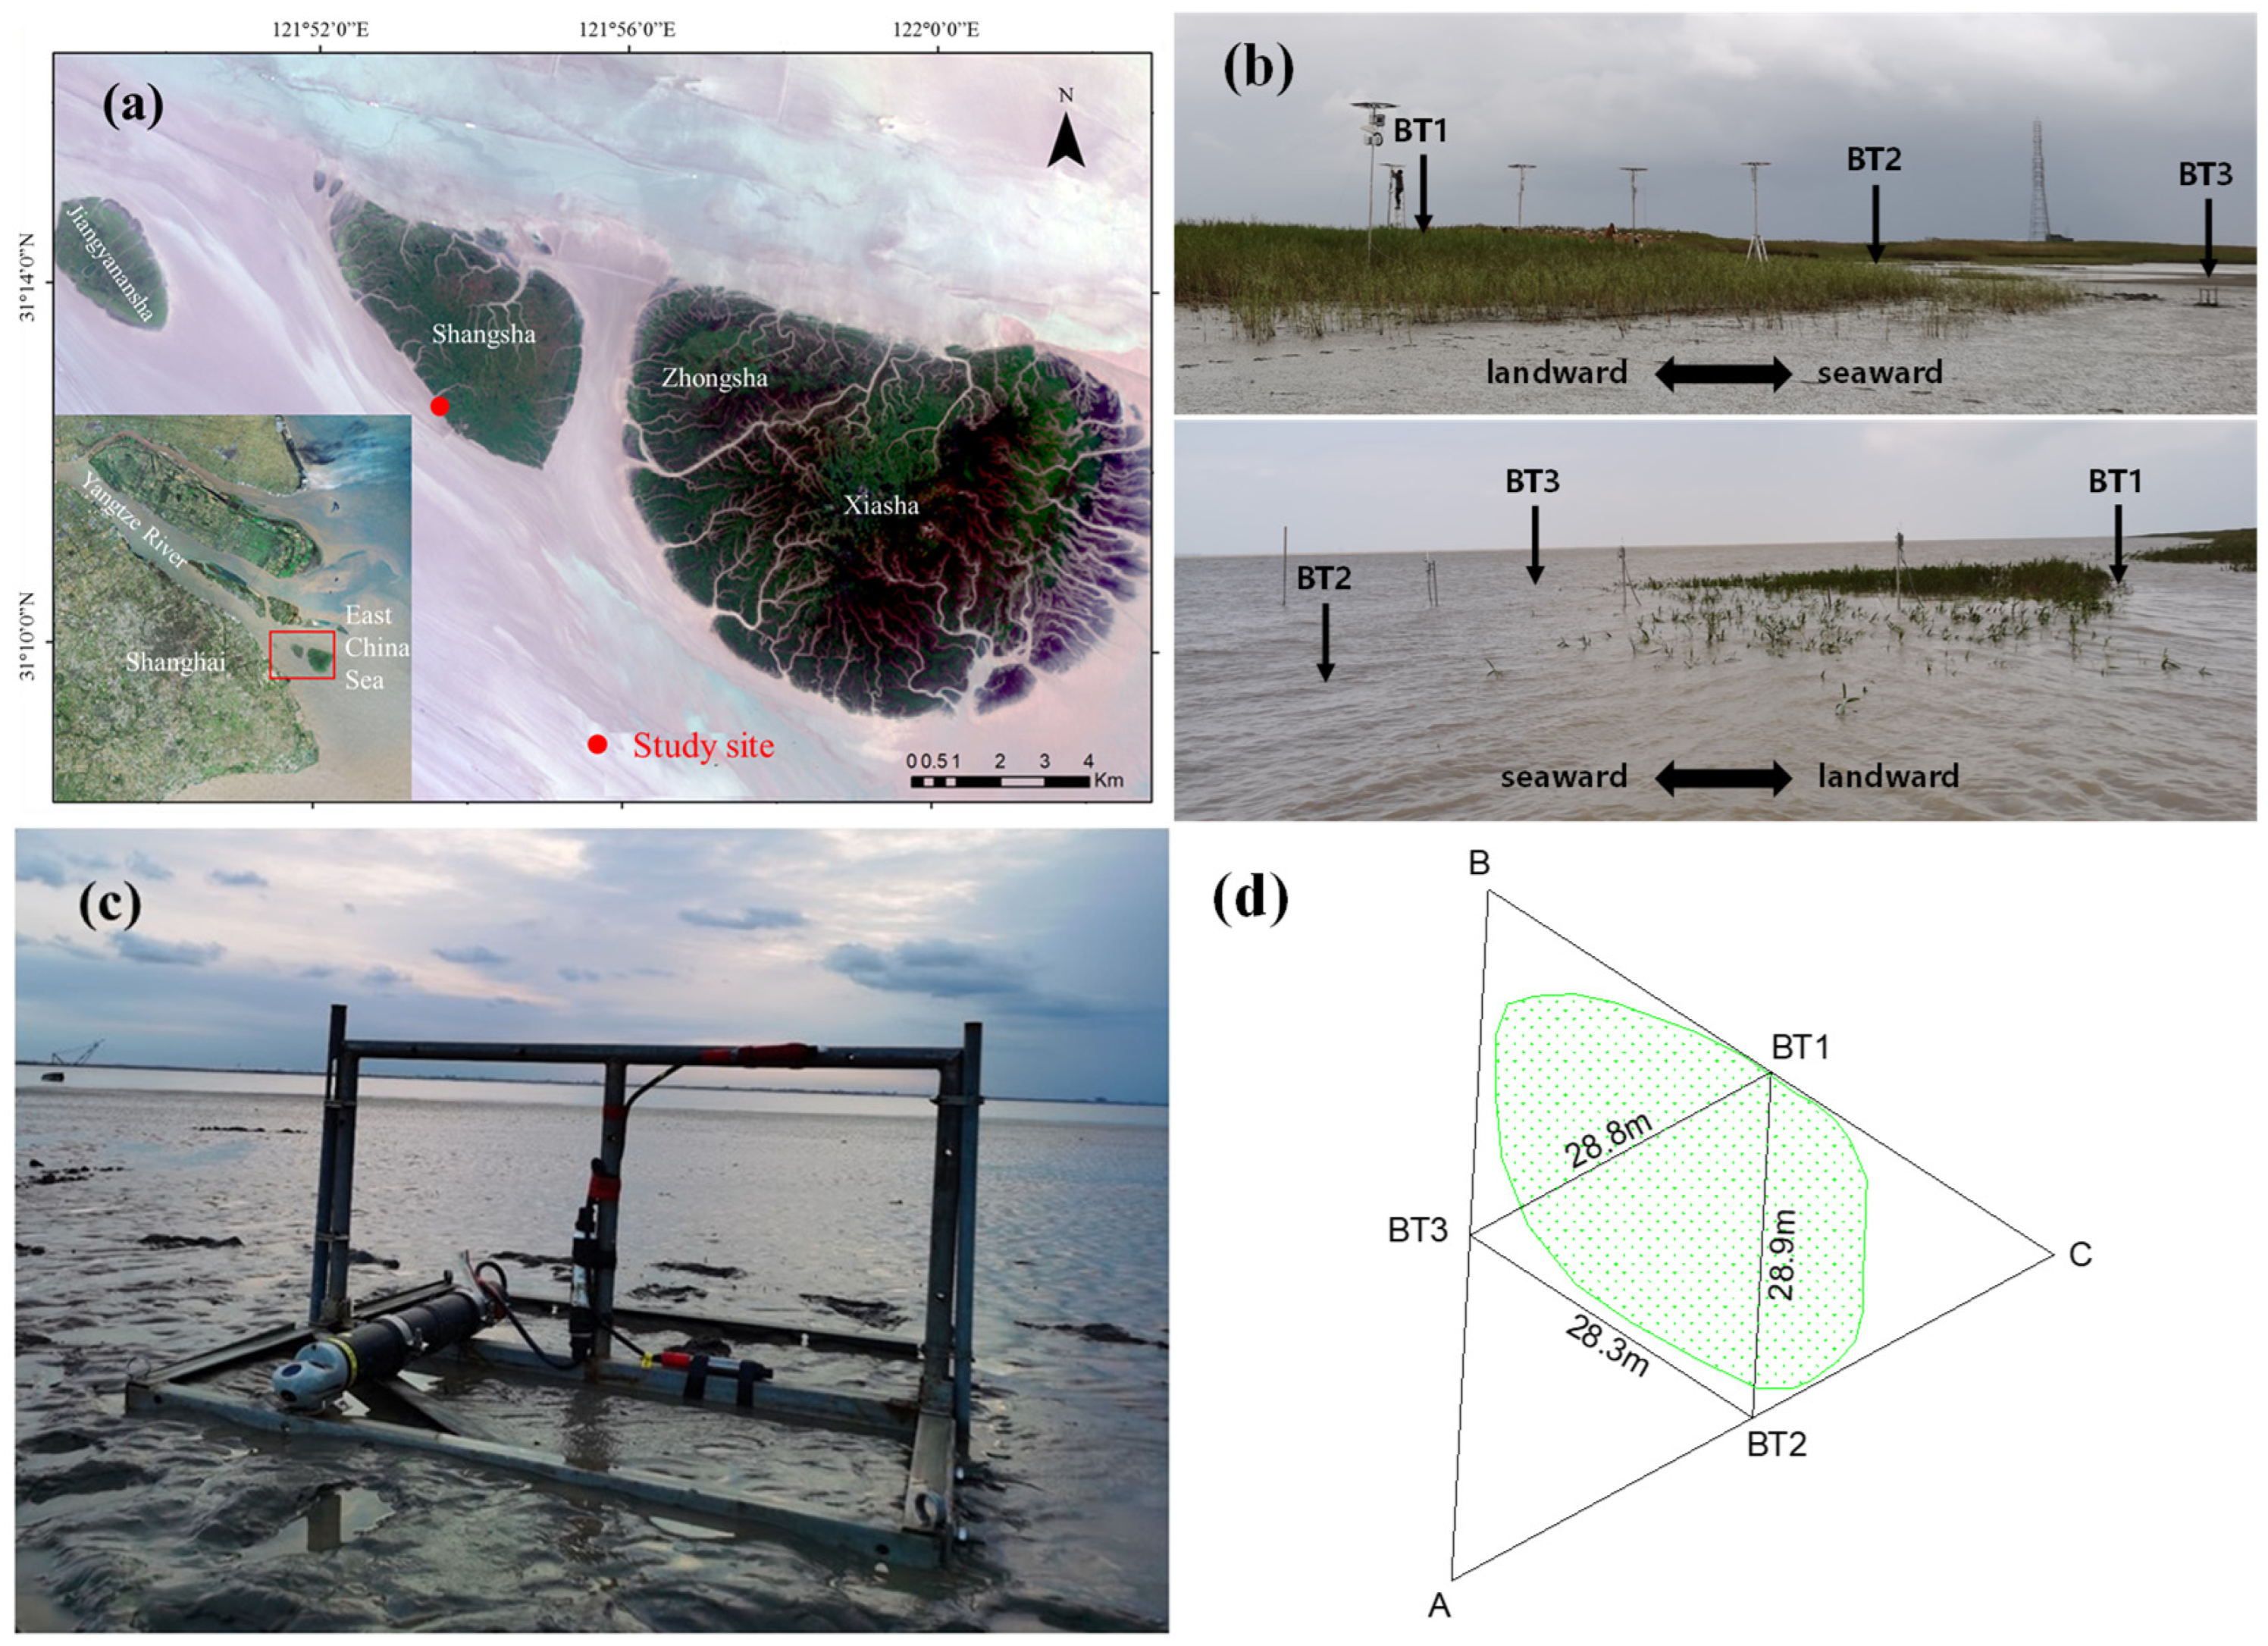
The Yangtze Estuary is a transition zone between the Yangtze River and East China Sea (Figure 2a), which is subject to riverine and tidal forcings. The tidal regime in the Yangtze Estuary is semidiurnal, and the tidal current is characterized by two-dimensional unsteady flow. The Jiuduansha Wetland (E 121°46′~122°15′, N 31°03′~31°17′), situated at the forefront of the Yangtze Estuary, encompasses intertidal salt marsh areas such as Jiangyanansha, Shangsha, Zhongsha, and Xiasha and their adjacent subtidal zones. The Jiuduansha Wetland is an important coastal wetland in the Yangtze Estuary, and it has been listed as a national nature reserve (Figure 2a). Recently, the ecological and geomorphological evolution of the Jiuduansha Wetland has attracted widespread attention.
In this study, three bottom-mounted observation systems (i.e., BT1, BT2, and BT3) were deployed along the edge of the salt marsh vegetated zone in southern Xiasha in the Jiuduansha Wetland (Figure 2b,c). Each bottom-mounted observation system was equipped with an Acoustic Doppler Current Profiler (ADCP, Aqua Pro 600KHz) (Figure 2c), which has been widely applied in the monitoring of water flow in coastal areas. These observation systems can measure vertical flow velocity, flow direction, and water depth in situ. Moreover, the ADCP used in this study (designed by Nortek AS, Vangkroken, Norway) features a flow velocity measurement range of ±10 m/s and an accuracy of ±1% (or ±0.005 m/s). It can measure the flow direction in the range of 0–360° and has a water depth measurement (based on a pressure sensor) accuracy of ±0.25%. These characteristics make the bottom-mounted observation systems suitable for measurement of water flow in the Jiuduansha Wetland. The control volume method’s vegetation-independent nature stems from its fundamental momentum balance formulation, which integrates variable drag effects through spatial flux integration.
As shown in Figure 2d, the three observation stations BT1, BT2, and BT3 were, respectively, located at the midpoints of the three edges of the triangular control volume (ABC). In addition, a distinct vegetated zone was distributed within the control volume (Figure 2b). These settings correspond with the theoretical methods detailed in Section 2.1. It should be noted that we did not conduct observations at the centroid of the control volume (with vegetation cover). Thus, the disturbance of nearby vegetation on the flow current can be minimized, and the damage of vegetation near the center can be avoided. The flow velocity, flow direction, and water depth at the centroid were derived from data collected at observation stations BT1, BT2, and BT3, using the triangle interpolation method.
In the current research, the field observation of water flow was conducted from 7 September to 10 September in 2021, and the tidal regime in the Yangtze Estuary was spring tide during this period. The observation sites (including a bare tidal flat and vegetated area) were exposed to air during low tides and could be inundated by currents during high tides. The elevations (relative to mean sea level) of observation stations BT1, BT2, and BT3 were 1.3, 0.54, and 0.40 m, respectively (Table 1). The distances between the observation stations ranged from 28.3 to 28.9 m, and the edge lengths of the triangular control volume were in the range of 56.6 to 57.8 m. The field vegetation quadrat survey indicated that the vegetated area within the control volume was covered by Phragmites australis (also known as reed and commonly distributed in coastal wetlands), with a stem density of about 100 stem/m2, an average stem height of 0.62 m, and a maximum stem height of 1.10 m.

3. Results

3.1. Spatio-Temporal Variations in Hydrodynamics

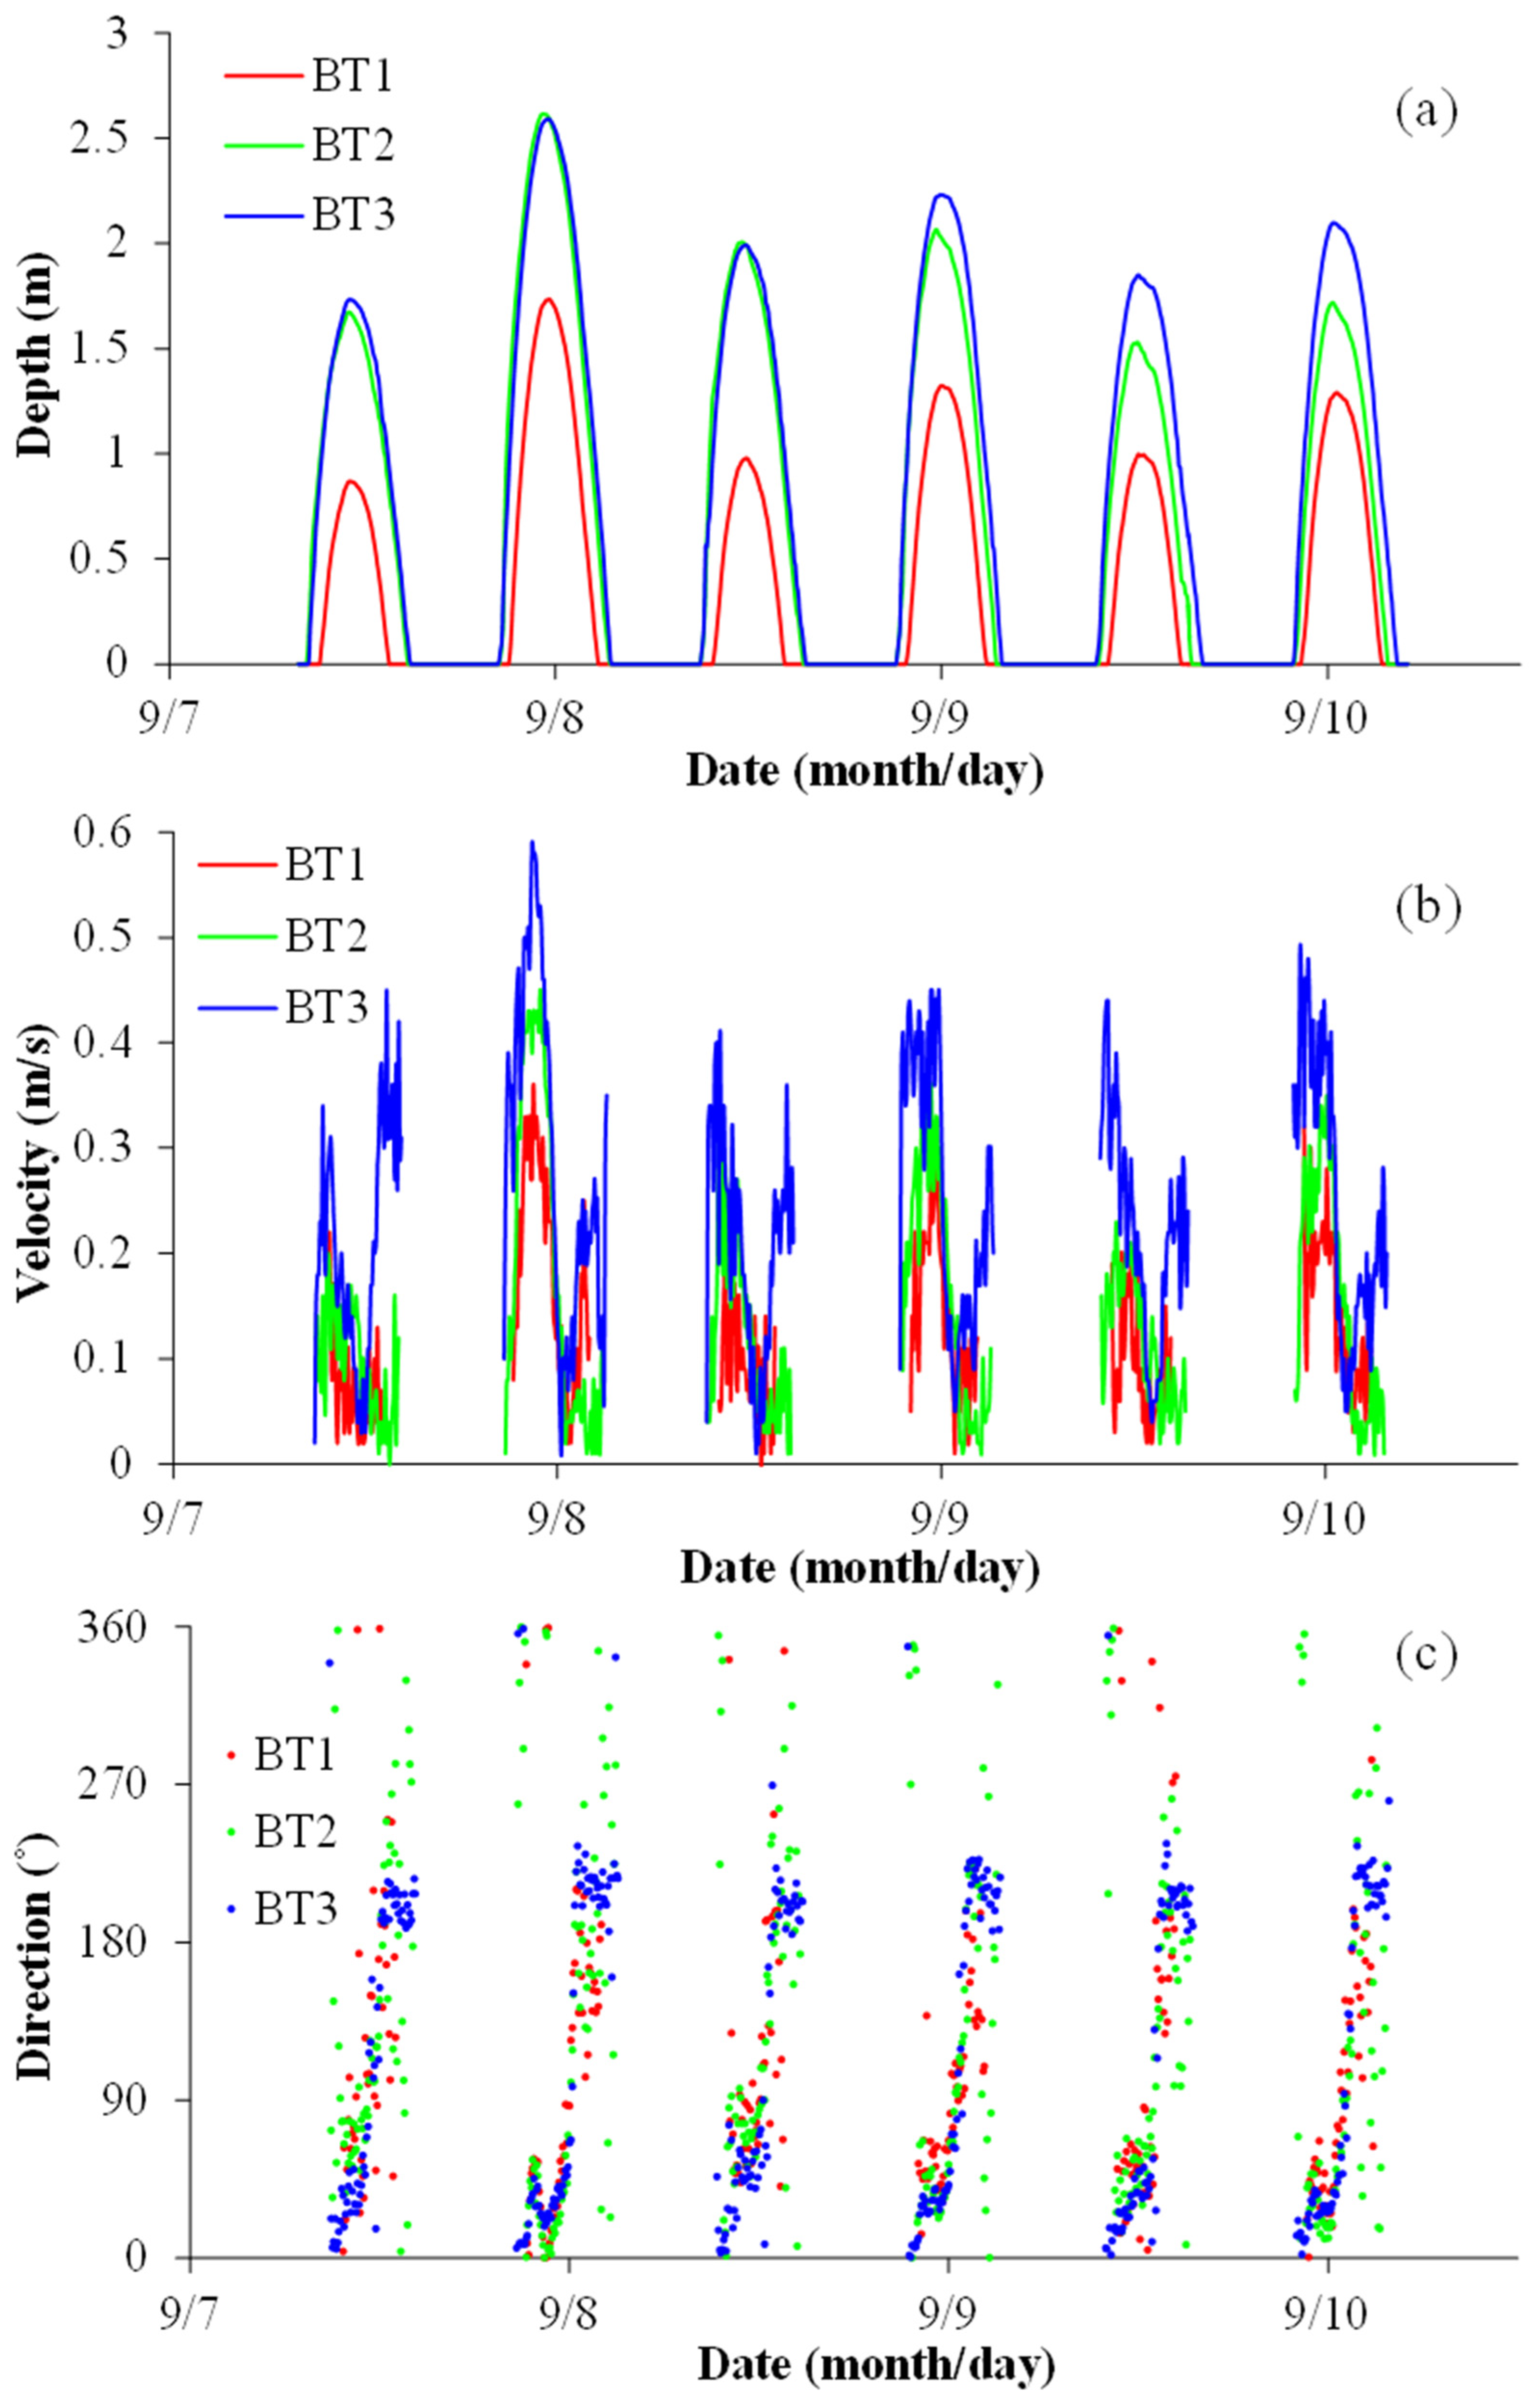
Figure 3 shows the tidal variations in the water depth, flow velocity, and flow direction at the observation stations. Overall, the hydrodynamic conditions at the observation sites transitioned from strong to weak during the observation period. Moreover, the nocturnal tide (i.e., a flooding and ebbing tidal cycle before each day) exhibited relatively stronger hydrodynamic conditions, which was consistent with the general characteristics of tides in the Yangtze Estuary. Among these tidal cycles, the tidal cycle before 8 September 2021 was characterized by the highest water level, longest inundation duration, and greatest flow velocity. Meanwhile, the maximum water depth at observation station BT1 reached 1.74 m, indicating that the vegetation (with a maximum height of 1.10 m) in the observation sites could be well submerged. Note that the water depth at observation station BT2 decreased notably and changed anomalously from 9 to 10 September (Figure 3a). The pressure sensor was observed to be clogged by silt, which may result in abnormal data collection. Data quality was ensured by excluding periods with sensor anomalies (e.g., BT2 clogging on 9–10 September), limiting primary analysis to the fully consistent 7–8 September dataset, where all stations exhibited stable measurements.
The elevations of observation stations BT2 and BT3 were lower than that of observation station BT1. Consequently, the water depths and flow velocities at observation stations BT2 and BT3 were both greater than those at observation station BT1. On 8 September, the maximum water depths at observation stations BT2 and BT3 were 2.62 and 2.60 m, respectively (Table 1). The maximum depth-averaged flow velocities at these two observation stations were 0.45 and 0.59 m/s, respectively. Meanwhile, the maximum water depth and maximum flow velocity at observation station BT1 were 1.74 m and 0.36 m/s, respectively.
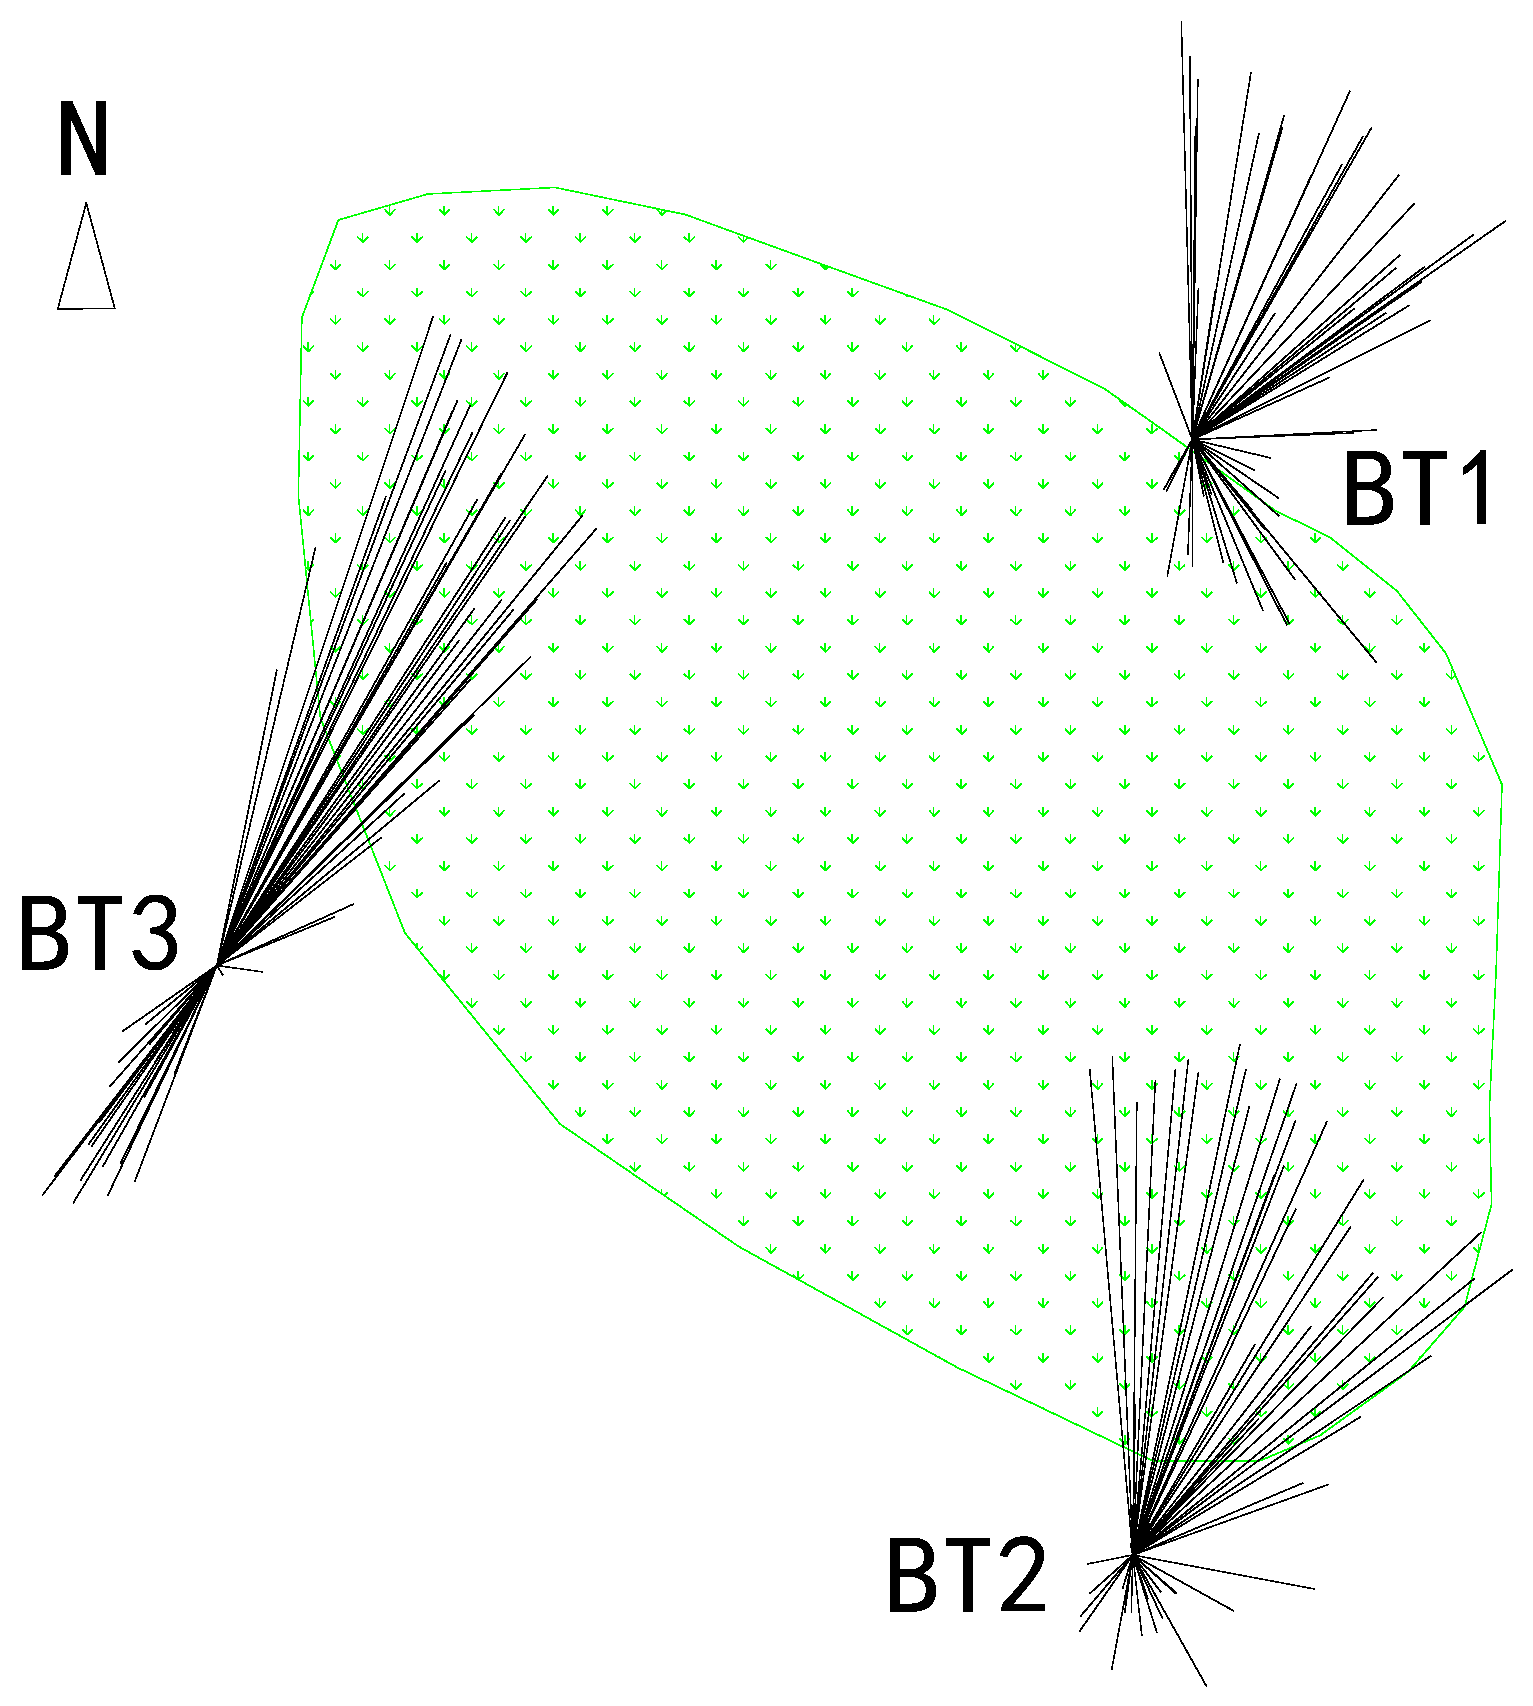
Figure 4 illustrates the planar distributions of flow velocity and direction at the observation stations during the tidal cycle before 8 September. The results show that the flooding currents were more significant than ebbing currents, which suggests that the observation sites were characterized by flood dominance. Taking observation station BT3 as an example, the durations of flooding and ebbing tides were about 3.5 and 3.0 h, respectively. Additionally, the maximum flooding and ebbing velocities were 0.59 and 0.35 m/s, respectively. The flooding and ebbing flow fields at the observation sites had the following characteristics: The flooding currents exhibited features of overland flow along the elevation gradient (from low flat to high flat) and flowed northeastward. Moreover, the flooding velocity remarkably decreased after flowing through the vegetated zone. The maximum flow velocities at observation stations BT1, BT2, and BT3 were 0.36, 0.43, and 0.59 m/s, respectively. Compared to flooding currents, the ebbing currents at the observation sites were less noticeable, and they were also significantly influenced by vegetation. For example, observation stations BT1 and BT2 were, respectively, situated upstream and downstream of the vegetated zone (relative to the ebbing tide direction). Due to the flow resistance of the vegetation, the ebbing current at observation station BT1 generally flowed southeastward. At observation station BT2, the ebbing velocity significantly decreased, and the flow direction tended to be more dispersed. In comparison to observation stations BT1 and BT2, observation station BT3 demonstrated a greater ebbing velocity and a more concentrated flow direction. This is because observation station BT3 was far away from the vegetated zone, and there was less vegetation distributed upstream of this station. Overall, these results indicate that the presence of vegetation exerted a pronounced influence on the flooding and ebbing currents.

3.2. Variation Characteristics of Manning’s Roughness Coefficient

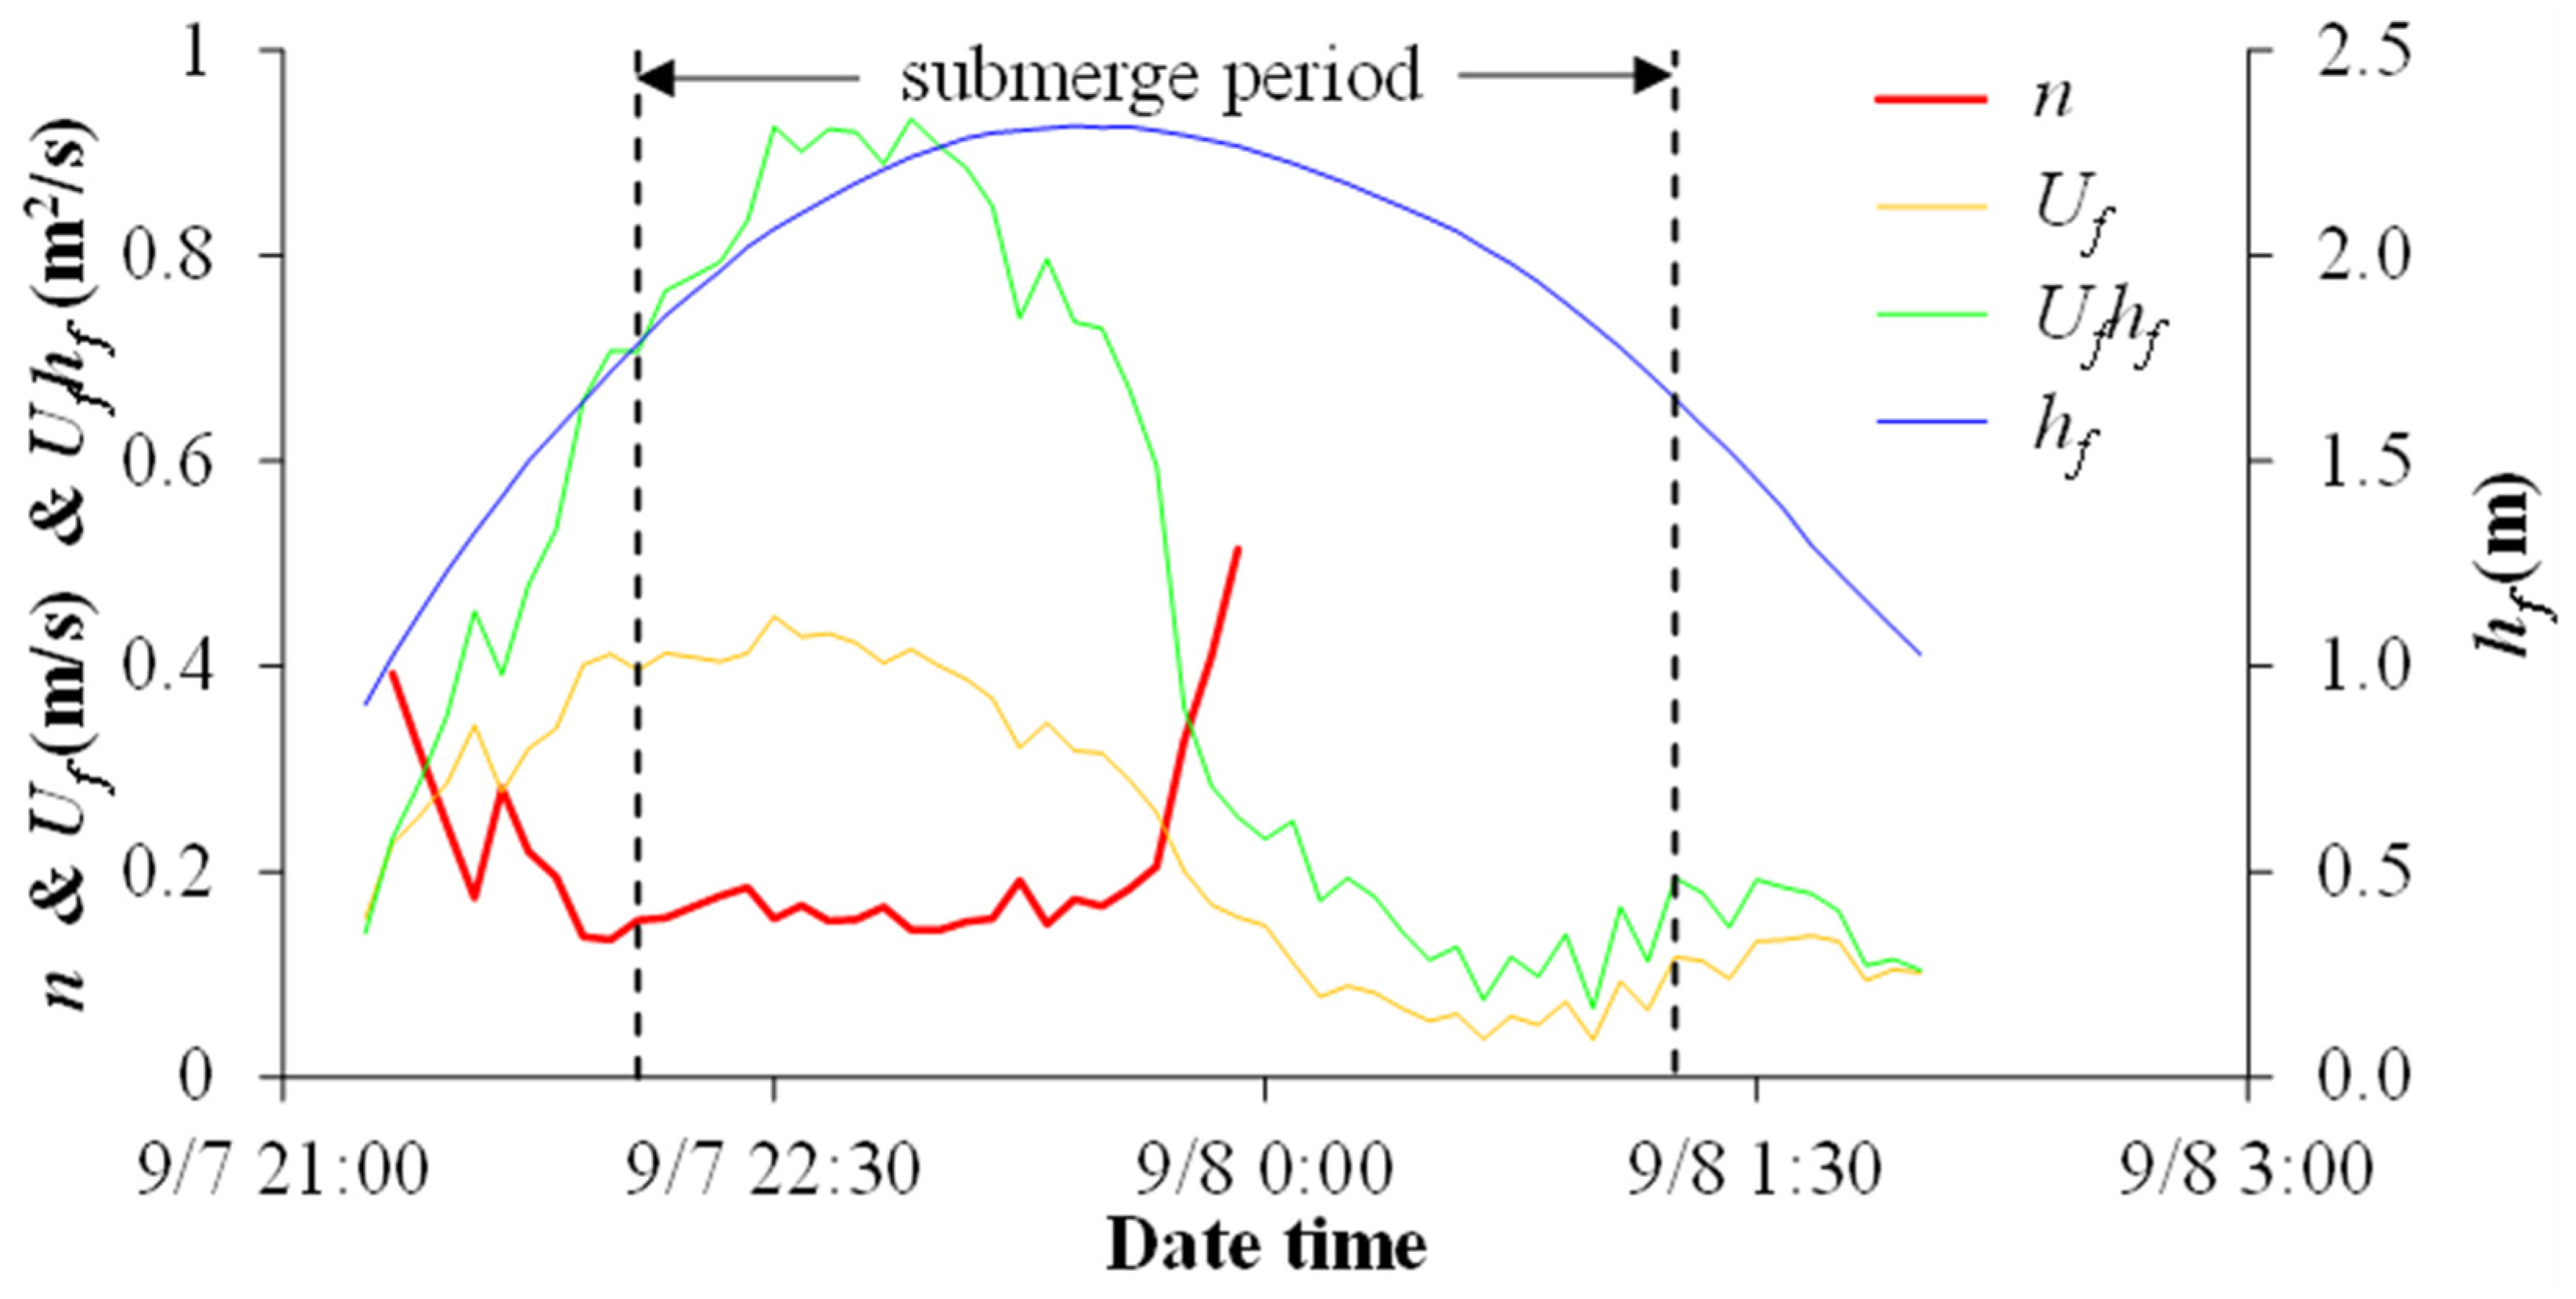
Following the method of triangle interpolation, we calculated the depth-averaged velocity Uf, the water depth hf, the product of depth-averaged velocity and water depth Ufhf at the center of the control volume, and the equivalent Manning roughness coefficient n (Figure 5). As shown in Figure 3b,c, the flow direction at the observation stations fluctuated significantly and irregularly when the flow velocity was low (e.g., <0.1 m/s). It is thus indicated that the flow current was susceptible to external factors (e.g., winds, waves) when the flow velocity was low, which could lead to unstable flow patterns. To minimize this disturbance, the equivalent Manning roughness coefficient n was derived when the flow velocity was greater than 0.1 m/s.
As shown in Figure 5, the observation sites were gradually inundated as the tide rose. Consequently, the water depth and flow velocity both increased. The flow velocity reached its maximum 1 h before the highest water level (maximum water depth) occurred. Subsequently, the flow velocity decreased rapidly during the period of high-tide slack water. The ebbing velocity was relatively lower during the period of ebbing tide. These results demonstrate a noticeable phase difference between the water level and flow velocity variations, especially in intertidal zones of estuarine wetlands.
The equivalent Manning roughness coefficient n had a relatively greater value during the early stage of flooding tide. Under the condition of a water depth of 1.03 m and flow velocity of 0.23 m/s at the center of the control volume (7 September, 21:20), the value of n reached 0.39. Then, the value of n decreased significantly as the water depth and flow velocity both increased. As a result, n reached its minimum value of 0.13 before the vegetated zone was completely submerged. One hour after the vegetated zone was submerged, the flooding velocity changed slightly and the water depth continued to increase, which caused minor fluctuations in n . During the period of slack water, the value of n increased rapidly as the water depth and flow velocity both decreased. Consequently, n reached its maximum value of 0.51 when the water depth was 2.27 m and the flow velocity was 0.16 m/s at the center of the control volume (7 September, 23:55). In summary, the flow resistance of vegetation notably increased under the less significant hydrodynamic conditions (including both flow velocity and water depth). Furthermore, flow velocity exerted a more pronounced influence on n than water depth. These findings align with the law that the roughness coefficient is inversely proportional to the product of flow velocity and water depth.
It is noteworthy that, from 22:00 to 22:25 on 7 September (a short period during the flooding tide), the vegetated zone was nearly submerged, and the hydrodynamic condition was enhanced (with Ufhf showing an increase). However, the roughness coefficient exhibited an increasing trend, which seemed contrary to the known pattern.
Moreover, the relationship between the equivalent Manning roughness coefficient n and Ufhf is illustrated in Figure 6. The roughness coefficient in the vegetated zone decreased with increasing flow velocity and water depth, and vice versa. In particular, when Ufhf was less than 0.4 m2/s, the decreasing rate of n was significant as Ufhf increased. Conversely, when Ufhf was greater than 0.4 m2/s, the decreasing rate of n gradually slowed down. These results indicate that the resistance of vegetation on flow became more pronounced under weak hydrodynamics than under strong hydrodynamics. We further implemented the least squares fitting of n and Ufhf (Figure 6). It was found that n shows an inverse power-law relationship with Ufhf. The fitted relationship is expressed as n = a(Ufhf)b, where a = 0.1337 (relative error: 11.0%), b = −0.775 (relative error: 14.2%), and R2 = 0.89.

4. Discussion

4.1. Verification of Calculation Results

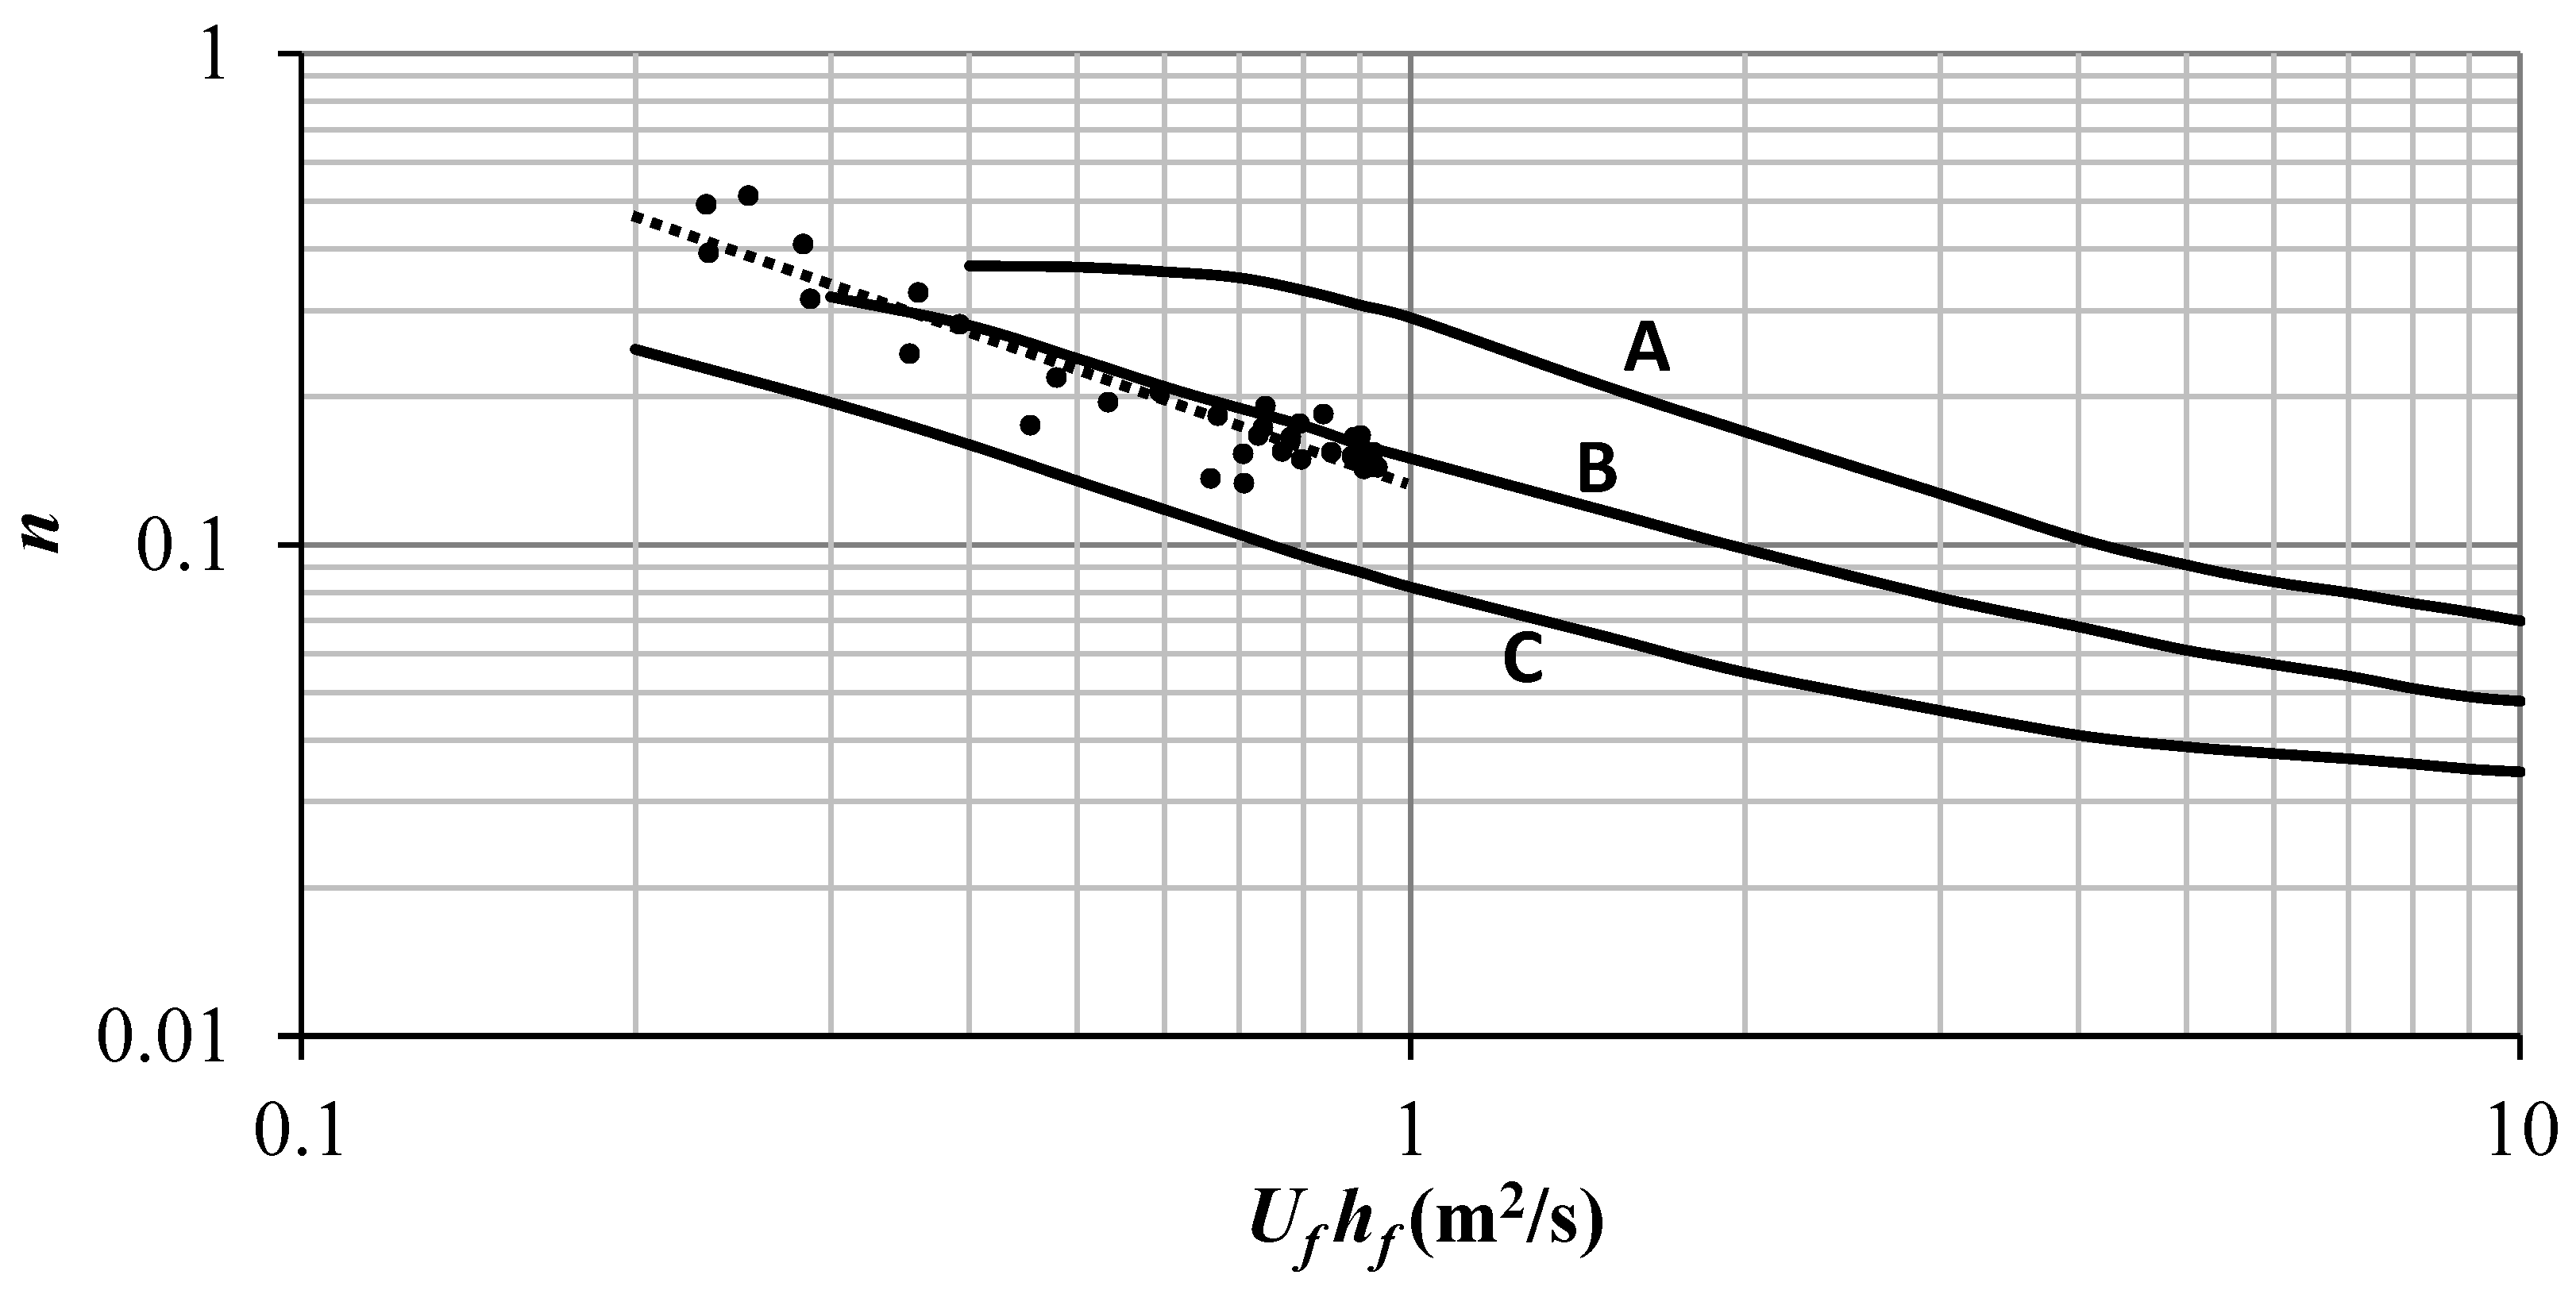
To validate the results of our study, we also compared the calculated roughness coefficients and their relationship with the product of flow velocity and water depth with previous results from flume experiments [18,19] (Figure 7). Specifically, curve A shows the average experimental results of weeping love grass (with a 0.76 m mean stem height) and yellow bluestem ischaemum (with a 0.91 m average stem height). Curve B refers to the average experimental results of multiple vegetation types (with a 0.28–0.61 m mean stem height), and they are consistent with the experimental results of weeping love grass (with a 0.61 m mean stem height). Curve C denotes the average experimental results of multiple vegetation types (with a 0.15–0.31 m mean stem height).
Overall, the fitted line of n and Uf hf in this study is close to curve B from a previous study. Curve B was determined based on the average results of flume experiments, which considered multiple vegetation types with a mean stem height ranging from 0.28 to 0.61 m. Additionally, curve B corresponded with the experimental results of weeping love grass, which had a mean stem height of 0.61 m (nearly equal to the mean stem height, i.e., 0.62 m, in this study). The validation shows that the values of n derived in this study are generally reasonable and reliable.
In addition, the inverse power-law trend aligns remarkably well with flexible vegetation studies [33] ( n = 0.10–0.60) while showing the expected deviation from rigid vegetation benchmarks [34] ( n = 0.044–0.134) due to dynamic reconfiguration effects. The consistency across studies in both magnitude and the functional dependence of n on Uh reinforces the reliability of our approach for the two-dimensional unsteady flow condition.

4.2. Differences Between Submerged and Unsubmerged Conditions

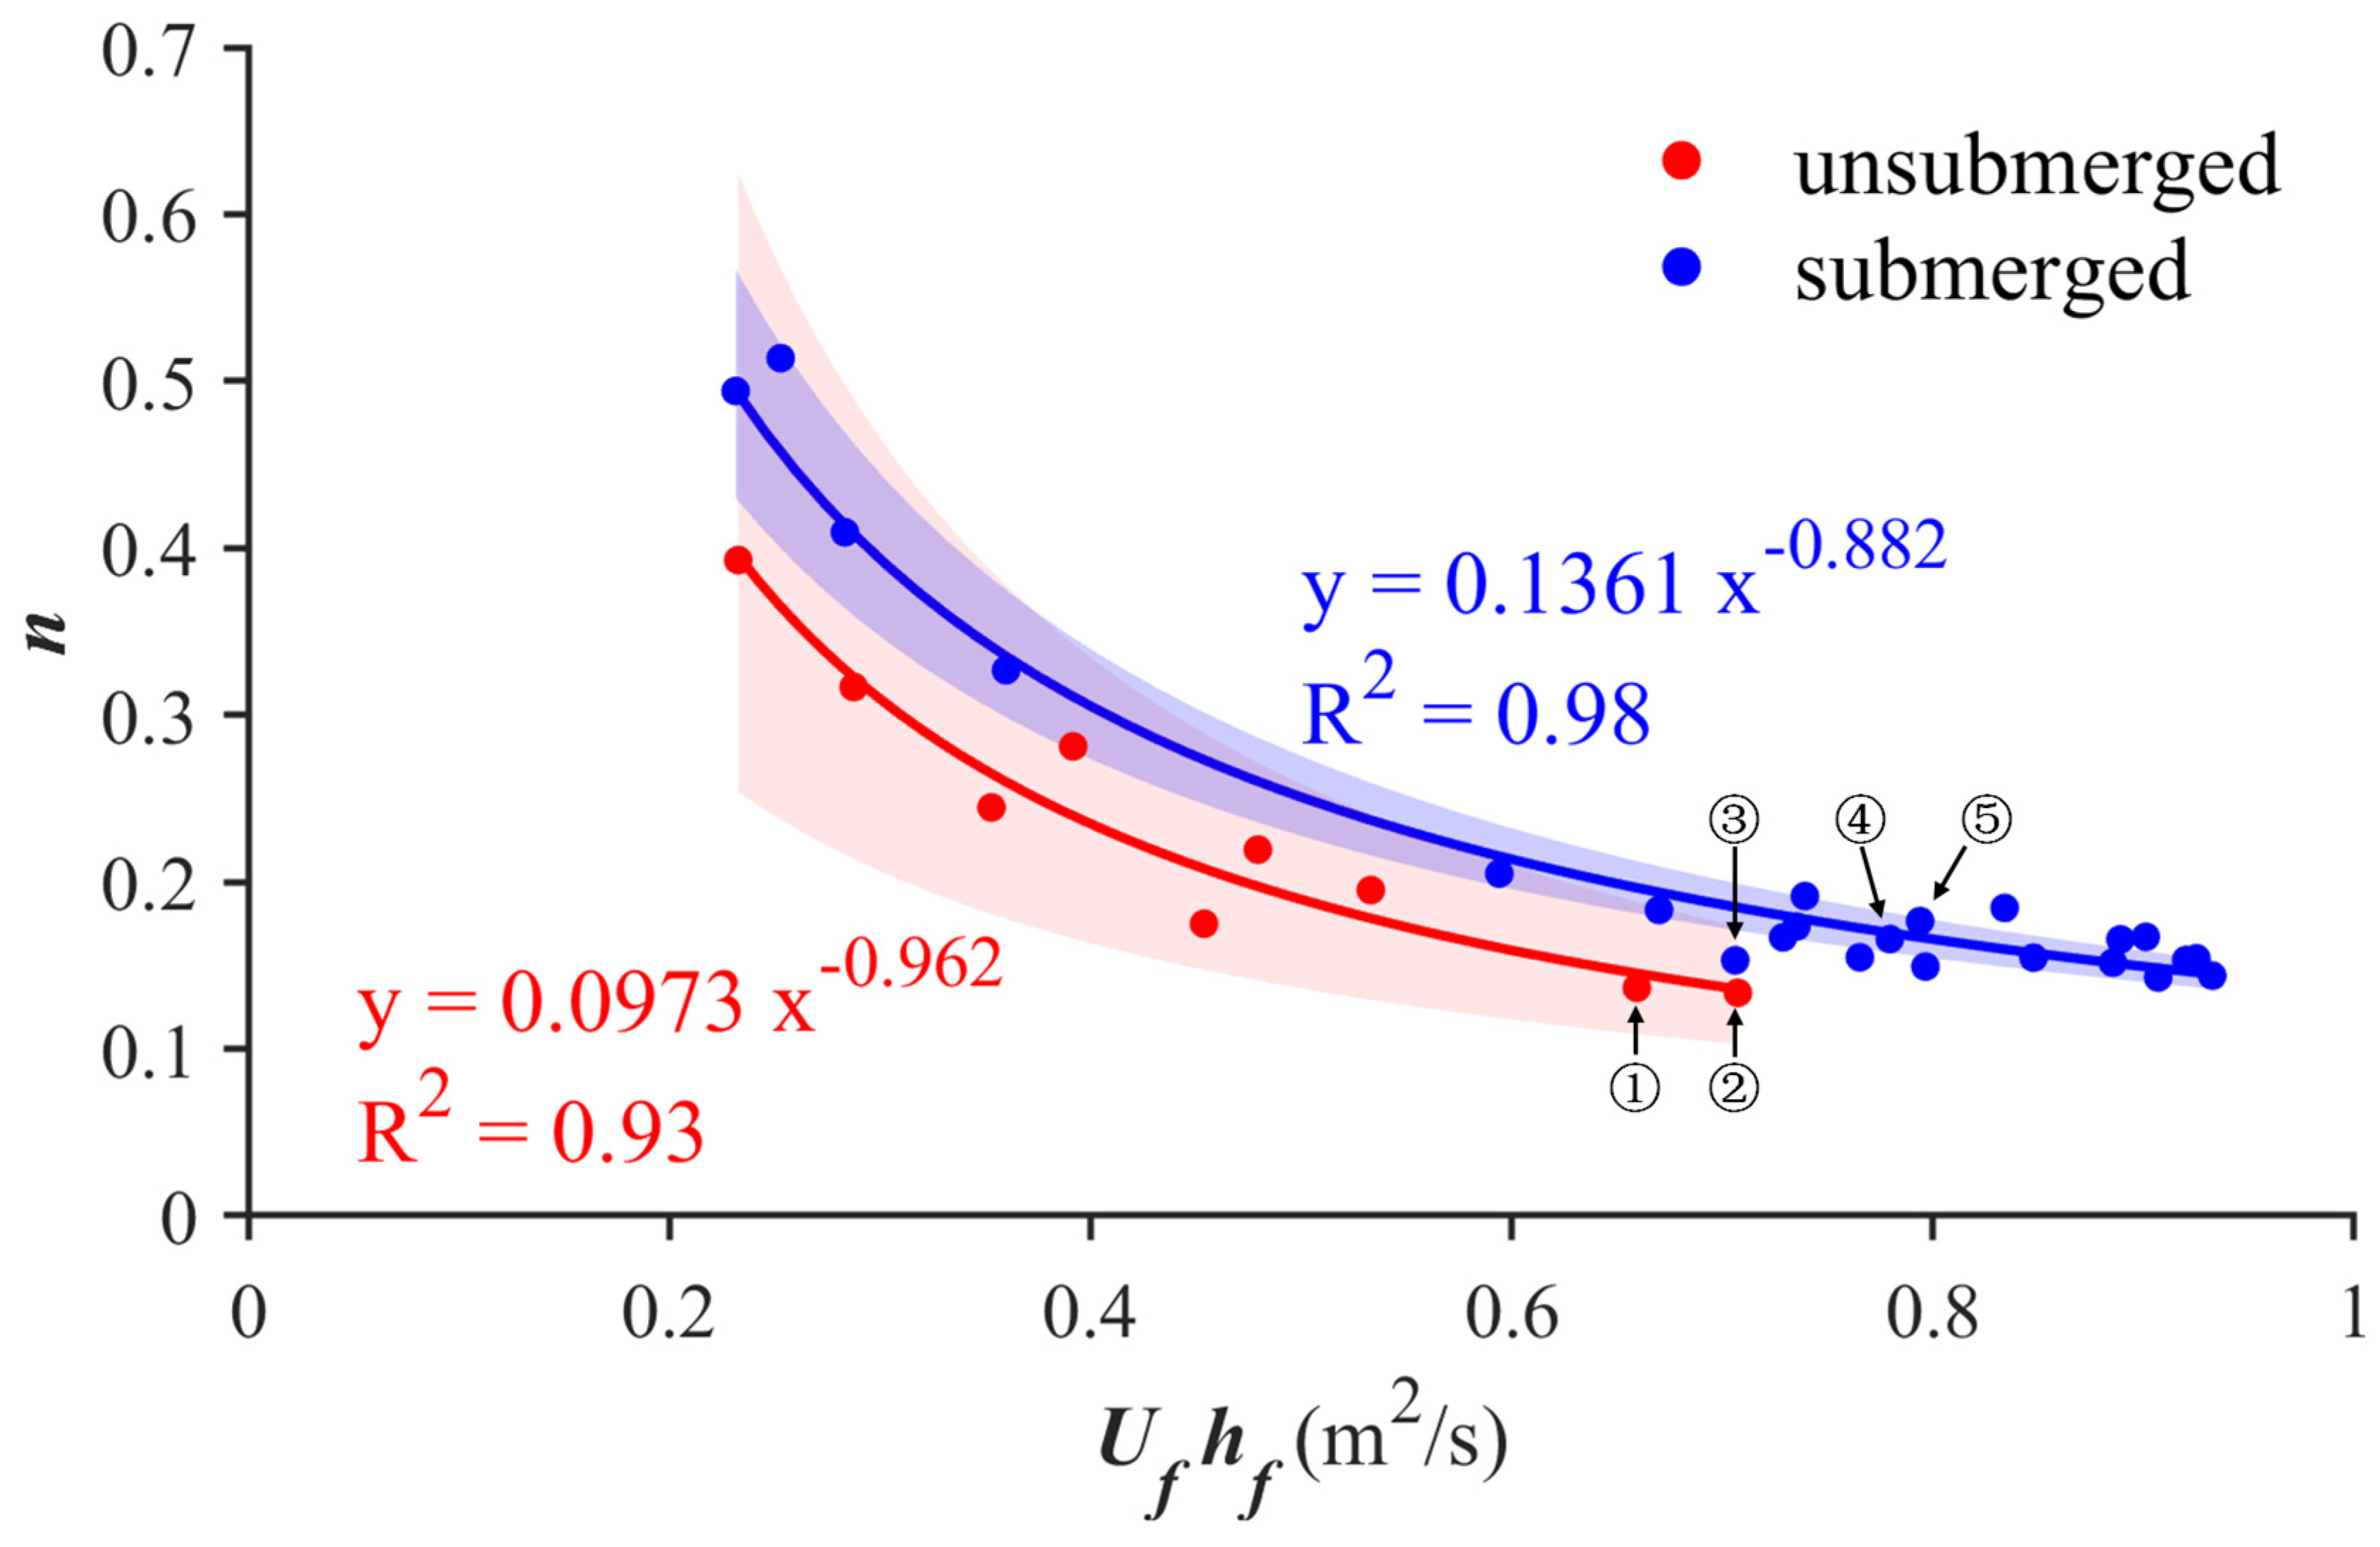
As previously mentioned, the roughness coefficient n showed a short-term increasing trend when the vegetated zone was nearly submerged (Figure 5). This phenomenon demonstrates that the submerged conditions of the vegetated zone influence the actual flow resistance.
Furthermore, we compared the relationship of n and Ufhf under the submerged condition with that under the non-submerged condition (Figure 8). It is indicated that the roughness coefficients n under these two conditions both exhibit inverse power-law relationships with Ufhf, and their determination coefficients are greater than that in Figure 6. Therefore, the roughness coefficient varies differently under different conditions of submergence. Specifically, the roughness coefficient n during the non-submerged period is generally smaller than that during the submerged period. Under the same Ufhf condition, the difference between the two ranges from 0.05 to 0.1. The absolute n -value differences decreased with the flow intensity (0.105 at Ufhf = 0.2 m2/s vs. 0.039 at Ufhf = 1.0 m2/s), while the relative differences exhibited an opposite trend (18.7% to 28.5% increase). This is acceptable because the contact area between vegetation and water under the submerged condition is larger than that under the non-submerged condition, which results in greater flow resistance under the submerged condition [35,36]. During the period in which the vegetated zone is nearly submerged (labels ①–⑤ in Figure 8), the roughness coefficient n shows a slight increase at the early stage of submergence compared to the preceding stage of non-submergence. Then, the roughness coefficient n during the submerged period remains higher than that during the non-submerged period. These findings not only confirm that the conditions of submergence affect flow resistance notably, but also validate the accuracy of the results in this study.

4.3. Applications and Limitations of New Method

In this study, we proposed a novel method for observing and calculating the roughness coefficient of salt marsh vegetation. This new method was confirmed to well represent temporal variations in vegetation flow resistance under the complex two-dimensional unsteady flow condition. The control volume method’s vegetation-independent nature stems from its fundamental momentum balance formulation, which integrates variable drag effects through spatial flux integration. This approach contrasts with empirical methods requiring species-specific coefficients. In addition, the proposed method is based on field measurement of hydrodynamic conditions (e.g., water level and flow velocity) at three (or more) observation stations outside the vegetated zone. The associated observation technologies (e.g., bottom-mounted observation systems) are convenient and mature. Our proposed method thereby has the potential for broad applications in research of coastal wetlands. For example, many eco-geomorphological models (coupling biotic and abiotic processes) have been established and applied to the simulation of the eco-geomorphological evolution of coastal wetlands. The determination and quantification of vegetation flow resistance (i.e., vegetation drag coefficient) are critical for the performance of eco-geomorphological models [37,38,39]. Thus, our proposed method can be used to validate and refine the roughness coefficient (a key parameter) in eco-geomorphological models, which may improve the simulation accuracy of vegetation dynamics and morphodynamics in coastal wetlands.
The control volume approach developed for the Jiuduansha Wetland exhibits strong transferability to other coastal wetland systems due to its foundation in fundamental momentum balance principles. The methodology’s robustness is evidenced by its consistent performance across diverse hydrodynamic and vegetation conditions when properly normalized. The n-Uh relationship demonstrates remarkable consistency when scaled by vegetation height and density, as confirmed by comparisons with the data of Lightbody and Nepf [40]. The method’s compatibility with numerical modeling frameworks is evidenced by its successful integration into unstructured-grid eco-morphodynamic models, where the triangular control volumes naturally align with finite element meshes. Its application in numerical models is also a part of future work.
There are still some limitations in our study. Firstly, our study focused on a specific region (i.e., Shangsha, a part of the Jiuduansha Wetland). That is, the vegetation flow resistance in other parts of the Jiuduansha Wetland was not examined. Previous studies show that the Jiuduansha Wetland is covered by multiple vegetation species, such as Spartina alterniflora, Phragmites australis, and Scirpus mariqueter. These different species of vegetation may exert diverse resistances on flow, which could lead to variations in the roughness coefficient, and this deserves further research. Moreover, biomass and the distribution of vegetation both vary seasonally. These seasonal variations in vegetation dynamics may increase the complexity of vegetation flow resistance. Under extreme conditions (e.g., storm surges or typhoons), the hydrodynamic balance may shift significantly, which could elevate Coriolis effects beyond our study. In the future, the proposed method could be applied in different regions (e.g., other parts of the Jiuduansha Wetland and other coastal wetlands around the world) and conducted at different timescales (e.g., seasonally and annually).

5. Conclusions

In this study, we derived the theoretical formula of the equivalent Manning roughness coefficient under the two-dimensional unsteady flow condition. Moreover, we conducted synchronized field observations of hydrodynamics within the salt marsh vegetated zone of an estuarine wetland. This study proposed and validated a new method for calculating the roughness coefficient of salt marsh vegetation. The main conclusions of this study are as follows:
(1)
For the salt marsh vegetated zone, the formula of the roughness coefficient under the condition of two-dimensional unsteady flow can be derived by coupling the flow resistance equation with the discretized momentum conservation equation. This formula, in combination with field observation data, could obtain temporal variations in the roughness coefficient.
(2)
Flooding currents are dominant in the salt marsh vegetated zone of the Jiuduansha Wetland, whereas ebbing currents are less dominant. Both flooding and ebbing currents are significantly influenced by vegetation. Specifically, flooding currents show characteristics of overland flow along the elevation gradient, and the flooding velocity exhibits a notable decrease after passing through the vegetated zone.
(3)
The vegetation flow roughness coefficient shows an inverse power-law relationship with the product of flow velocity and water depth at the center of the control volume. Additionally, the submerged vegetation condition significantly influences the flow resistance. The roughness coefficient n slightly increases when the vegetation is nearly submerged, and its value is greater during the submerged period than during the non-submerged period.
Although this study has some limitations, the observation and calculation method proposed in this study is reasonable and insightful. The derived roughness coefficients and their relationships with the product of flow velocity and water depth have been well validated against the previous results of flume experiments. Overall, our study proposes a new method for accurately determining flow resistance under two-dimensional unsteady flow, which may improve the performance of eco-geomorphological simulations of coastal wetlands.

Author Contributions

Conceptualization, H.C. and F.G.; methodology, H.C. and F.G.; software, Y.Z.; validation, Y.W.; formal analysis, H.C., L.Z. and Y.Z.; investigation, H.C., L.Z. and Y.W.; resources, H.C.; data curation, W.Z.; writing—original draft preparation, H.C. and L.Z.; writing—review and editing, F.G. and H.C.; visualization, H.C. and W.Z.; supervision, F.G.; project administration, H.C.; funding acquisition, H.C. All authors have read and agreed to the published version of the manuscript.

Funding

This research was funded by the National Key R&D Program of China, grant number 2023YFC3208500; the National Natural Science Foundation of China, grant numbers 52325903 and 42277070; and the fund of the National Key Laboratory of Water Disaster Prevention, grant number 5240152F2.

Data Availability Statement

The data presented in this study are available on request from the corresponding author. The data are not publicly available due to privacy/ethical restrictions protecting participant confidentiality.

Conflicts of Interest

The authors declare no conflicts of interest.

References

  1. D’Alpaos, A.; Toffolon, M.; Camporeale, C. Ecogeomorphological feedbacks of water fluxes, sediment transport and vegetation dynamics in rivers and estuaries. Adv. Water Resour. 2016, 93, 151–155. [Google Scholar] [CrossRef]
  2. Gran, K.; Paola, C. Riparian vegetation controls on braided stream dynamics. Water Resour. Res. 2001, 37, 3275–3283. [Google Scholar] [CrossRef]
  3. Gong, Z.; Chen, X.; Zhou, Z.; Ge, R.; Chen, X.; Yu, X.; Zhang, C. The roles of biological factors in coastal sediment transport: A review. Chin. Sci. Bull. 2020, 66, 53–62. [Google Scholar] [CrossRef]
  4. Crooks, S.; Sutton-Grier, A.E.; Troxler, T.G.; Herold, N.; Bernal, B.; Schile-Beers, L.; Wirth, T. Coastal wetland management as a contribution to the US National Greenhouse Gas Inventory. Nat. Clim. Change 2018, 8, 1109–1112. [Google Scholar] [CrossRef]
  5. Huai, W.X.; Li, S.; Katul, G.G.; Liu, M.Y.; Yang, Z.H. Flow dynamics and sediment transport in vegetated rivers: A review. J. Hydrodyn. 2021, 33, 400–420. [Google Scholar] [CrossRef]
  6. Belluco, E.; Camuffo, M.; Ferrari, S.; Modenese, L.; Silvestri, S.; Marani, A.; Marani, M. Mapping salt-marsh vegetation by multispectral and hyperspectral remote sensing. Remote Sens. Environ. 2006, 105, 54–67. [Google Scholar] [CrossRef]
  7. Boorman, L. Saltmarsh Review: An Overview of Coastal Saltmarshes, Their Dynamic and Sensitivity Characteristics for Conservation and Management; JNCC: Peterborough, UK, 2003.
  8. Wu, F.S.; Wang, W.Y.; Jiang, S.H. Hydrodynamics development in vegetated open channel. Adv. Water Sci. 2007, 18, 456–461. [Google Scholar]
  9. Chen, H.; Ni, Y.; Li, Y.; Liu, F.; Ou, S.; Su, M.; Peng, Y.; Hu, Z.; Uijttewaal, W.; Suzuki, T. Deriving vegetation drag coefficients in combined wave-current flows by calibration and direct measurement methods. Adv. Water Resour. 2018, 122, 217–227. [Google Scholar] [CrossRef]
  10. Tsujimoto, T. Fluvial processes in streams with vegetation. J. Hydraul. Res. 1999, 37, 789–803. [Google Scholar] [CrossRef]
  11. D’Alpaos, A.; Lanzoni, S.; Mudd, S.M.; Fagherazzi, S. Modeling the influence of hydroperiod and vegetation on the cross-sectional formation of tidal channels. Estuar. Coast. Shelf Sci. 2006, 69, 311–324. [Google Scholar] [CrossRef]
  12. Li, H.; Yang, S.L. A Review of Influences of Saltmarsh Vegetation on Physical Processes in Intertidal Wetlands. Adv. Earth Sci. 2007, 26, 583–591. [Google Scholar]
  13. D’Alpaos, A.; Lanzoni, S.; Marani, M.; Rinaldo, A. On the O’Brien–Jarrett–Marchi law. Rend. Lincei 2009, 20, 225–236. [Google Scholar] [CrossRef]
  14. Zheng, S.; Wu, Y.H.; Bai, Y.; Bao, L.; Mu, X.P. Experimental research on Manning’s roughness coefficient of an open channel with aquatic vegetation. J. Hydraul. Eng. 2017, 48, 874–881. [Google Scholar] [CrossRef]
  15. Lei, J.; Fan, D.; Angera, A.; Liu, Y.; Nepf, H. Drag force and reconfiguration of cultivated Saccharina latissima in current. Aquac. Eng. 2021, 94, 102169. [Google Scholar] [CrossRef]
  16. Luhar, M.; Nepf, H.M. From the blade scale to the reach scale: A characterization of aquatic vegetative drag. Adv. Water Resour. 2013, 51, 305–316. [Google Scholar] [CrossRef]
  17. Järvelä, J. Flow resistance of flexible and stiff vegetation: A flume study with natural plants. J. Hydrol. 2002, 269, 44–54. [Google Scholar] [CrossRef]
  18. Tang, H.W.; Yan, J.; Xiao, Y.; Lu, S.Q. Manning’s roughness coefficient of vegetated channels. J. Hydraul. Eng. 2007, 38, 1347–1353. [Google Scholar]
  19. Chow, V.T. Open-Channel Hydraulics; McGraw-Hill: New York, NY, USA, 1959. [Google Scholar]
  20. Kouwen, N.; Fathi-Moghadam, M. Friction Factors for Coniferous Trees along Rivers. J. Hydraul. Eng. 2000, 126, 732–740. [Google Scholar] [CrossRef]
  21. Kumar, B.; Patra, S.; Pandey, M. Experimental Investigation on Flow Configuration in Flexible and Rigid Vegetated Streams. Water Resour. Manag. 2023, 37, 6005–6019. [Google Scholar] [CrossRef]
  22. Iqbal, K.; Ghani, U.; Pasha, G.A.; Murtaza, N.; Kaleem Ullah, M.; Anjum, N. Laboratory investigation of flow behavior in an open channel with emerged porous rigid and flexible vegetation. J. Hydrodyn. 2025, 36, 1181–1199. [Google Scholar] [CrossRef]
  23. Wilson, C.A.M.E.; Stoesser, T.; Bates, P.D.; Pinzen, A.B. Open Channel Flow through Different Forms of Submerged Flexible Vegetation. J. Hydraul. Eng. 2003, 129, 847–853. [Google Scholar] [CrossRef]
  24. Zhang, C.; Tang, H.; Shi, B.; Wang, C.; Yin, Z.; Zhao, L. Roughness coeficent relations of open channel with flexible submerged vegetation. In Proceedings of the 16th IAHR-APD Congress and 3rd Symposium of IAHR-ISHS, Nanjing, China, 20–23 October 2008; p. 4. [Google Scholar]
  25. Shucksmith, J.D.; Boxall, J.B.; Guymer, I. Bulk Flow Resistance in Vegetated Channels: Analysis of Momentum Balance Approaches Based on Data Obtained in Aging Live Vegetation. J. Hydraul. Eng. 2011, 137, 1624–1635. [Google Scholar] [CrossRef]
  26. Gu, F.F.; Ni, H.G.; Qi, D.M. Roughness coefficient for unsubmerged and submerged reed. J. Hydrodyn. Ser.B 2007, 19, 421–428. [Google Scholar] [CrossRef]
  27. Zhang, J.; Lei, J.; Huai, W.; Nepf, H. Turbulence and Particle Deposition Under Steady Flow Along a Submerged Seagrass Meadow. J. Geophys. Res. Oceans 2020, 125, e2019JC015985. [Google Scholar] [CrossRef]
  28. Mohamed, S.A.E.; Samman, T.A.E. Manning roughness coefficient in vegetated open channels. Water Sci. 2020, 34, 124–131. [Google Scholar]
  29. Zhang, W.; Zhong, C.X.; Ying, H.H. Experimental study on hydraulic roughness of revetment with grass cover. Adv. Water Sci. 2007, 18, 483–489. [Google Scholar]
  30. Yang, F.; Li, H.; Cao, M. Roughness coefficient of seabuckthorn plant flexible dam under field water-flow experiment. Bull. Soil. Water Conserv. 2011, 31, 94–98. [Google Scholar] [CrossRef]
  31. Zhang, Y.; Wang, P.; Cheng, J.; Wang, W.J.; Zeng, L.; Wang, B. Drag Coefficient of Emergent Flexible Vegetation in Steady Nonuniform Flow. Water Resour. Res. 2020, 56, e2020WR027613. [Google Scholar] [CrossRef]
  32. Cui, H.; Felder, S.; Kramer, M. Predicting flow resistance in open-channel flows with submerged vegetation. Environ. Fluid Mech. 2023, 23, 757–778. [Google Scholar] [CrossRef]
  33. van Veelen, T.J.; Fairchild, T.P.; Reeve, D.E.; Karunarathna, H. Experimental study on vegetation flexibility as control parameter for wave damping and velocity structure. Coast. Eng. 2020, 157, 103648. [Google Scholar] [CrossRef]
  34. Tsihrintzis, V.A.; Madiedo, E.E. Hydraulic Resistance Determination in Marsh Wetlands. Water Resour. Manag. 2000, 14, 285–309. [Google Scholar] [CrossRef]
  35. Kirwan, M.L.; Guntenspergen, G.R. Feedbacks between inundation, root production, and shoot growth in a rapidly submerging brackish marsh. J. Ecol. 2012, 100, 764–770. [Google Scholar] [CrossRef]
  36. Lei, J.; Nepf, H. Evolution of flow velocity from the leading edge of 2-D and 3-D submerged canopies. J. Fluid Mech. 2021, 916, A36. [Google Scholar] [CrossRef]
  37. Lesser, G.R.; Roelvink, J.A.; van Kester, J.A.T.M.; Stelling, G.S. Development and validation of a three-dimensional morphological model. Coast. Eng. 2004, 51, 883–915. [Google Scholar] [CrossRef]
  38. Le Hir, P.; Monbet, Y.; Orvain, F. Sediment erodability in sediment transport modelling: Can we account for biota effects? Cont. Shelf Res. 2007, 27, 1116–1142. [Google Scholar] [CrossRef]
  39. Maanen, B.V.; Coco, G.; Bryan, K.R. Modelling the effects of tidal range and initial bathymetry on the morphological evolution of tidal embayments. Geomorphology 2013, 191, 23–34. [Google Scholar] [CrossRef]
  40. Lightbody, A.F.; Nepf, H.M. Prediction of velocity profiles and longitudinal dispersion in salt marsh vegetation. Limnol. Oceanogr. 2006, 51, 218–228. [Google Scholar] [CrossRef]
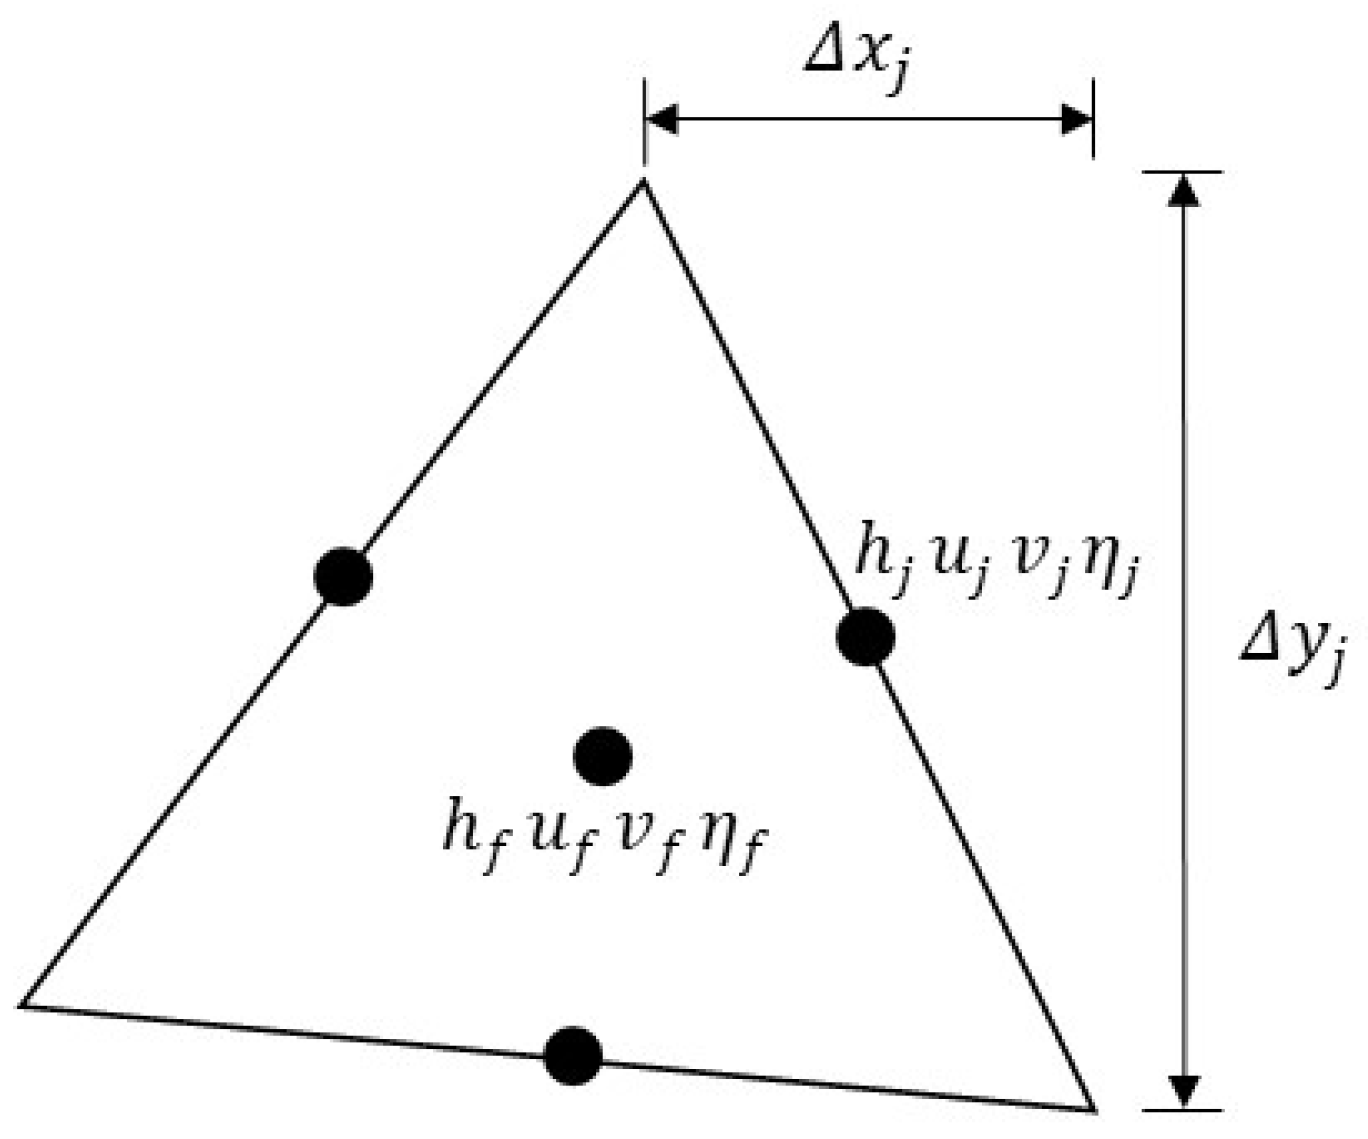
Figure 1. Schematic diagram of triangular control volume. Note: Δ x j and Δ y j are, respectively, the increments (m) in the x and y directions for the j -th edge of the control volume element; f is the center (m) of the control volume element; h is the water depth (m); u and v are the depth-averaged velocity components (m/s) in the x and y directions, respectively; η is the water level (m).
Water 17 01490 g001
Figure 2. Study area and field observation layout: (a) geographical location of the research area; (b) in situ photograph of monitoring stations; (c) instrument configuration at field stations; (d) schematic diagram of station arrangement and control volume, with green indicating vegetation areas.
Water 17 01490 g002
Figure 3. Water depth (a), flow velocity (b), and flow direction (c) at observation stations.
Water 17 01490 g003
Figure 4. Planar distributions of flow velocity and direction over a tidal cycle at observation stations. Note: The flooding and ebbing tidal cycle before 8 September was considered, and the time interval of the data was 5 min.
Water 17 01490 g004
Figure 5. Variation in the equivalent Manning roughness coefficient and depth-averaged velocity U f , water depth h f , and product of depth-averaged velocity and water depth U f h f at the center of the control volume.
Water 17 01490 g005
Figure 6. Relationship between the equivalent Manning roughness coefficient and the product of depth-averaged velocity and water depth Ufhf (gray shaded area indicates the 95% confidence interval).
Water 17 01490 g006
Figure 7. Comparison of observed and calculated results with previous flume experimental results. Note: Circles represent the observed and calculated results of this study, and the dashed line indicates the fitted line of the power-law relationship. Curves A, B, and C are the fitted lines of flume experimental results (based on natural vegetation species) [18,19].
Water 17 01490 g007
Figure 8. Relationships between the equivalent Manning roughness coefficient n and the product of depth-averaged velocity and water depth Ufhf under submerged and non-submerged conditions. Note: ①–⑤ indicate the time series of data before and after the complete submergence of the vegetated area, with a time interval of 5 min (blue and red shaded areas indicate the 95% confidence interval).
Water 17 01490 g008
Table 1. Key parameters at observation stations.
StationElevation (m)Maximum Water Depth (m)Maximum Flow Velocity (m/s)
BT11.301.740.36
BT20.542.620.45
BT30.402.600.59
Disclaimer/Publisher’s Note: The statements, opinions and data contained in all publications are solely those of the individual author(s) and contributor(s) and not of MDPI and/or the editor(s). MDPI and/or the editor(s) disclaim responsibility for any injury to people or property resulting from any ideas, methods, instructions or products referred to in the content.