Article

Daily Water Requirements of Vegetation in the Urban Green Spaces in the City of Panaji, India

1
Graduate School of Environmental Earth Science, Hokkaido University, Sapporo 060-0810, Japan
2
Faculty of Environmental Earth Science, Hokkaido University, Sapporo 060-0810, Japan
*
Author to whom correspondence should be addressed.
Water 2025, 17(10), 1487; https://doi.org/10.3390/w17101487
Submission received: 19 March 2025 / Revised: 2 May 2025 / Accepted: 4 May 2025 / Published: 15 May 2025

Abstract

:
From the urban sustainability perspective and from the steps essential for regulating/balancing the microclimate features, the creation and maintenance of urban green spaces (UGS) are vital. The UGS include vegetation of any kind in urban areas such as parks, gardens, vertical gardens, trees, hedge plants, and roadside plants. This “urban green infrastructure” is a cost-effective and energy-saving means for ensuring sustainable development. The relationship between urban landscape patterns and microclimate needs to be sufficiently understood to make urban living ecologically, economically, and ergonomically justifiable. In this regard, information on diverse patterns of land use intensity or spatial growth is essential to delineate both beneficial and adverse impacts on the urban environment. With this background, the present study aimed to address water requirements of UGS plants and trees during the non-rainy months from Panaji city (Koppen classification: Am) situated on the west coast of India, which receives over 2750 mm of rainfall, almost exclusively during June–September. During the remaining eight months, irrigating the plants in the UGS becomes a serious necessity. In this regard, the daily water requirements (DWR) of 34 tree species, several species of hedge plants, and lawn areas were estimated using standard methods that included primary (field survey-based) and secondary (inputs from key-informant survey questionnaires) data collection to address water requirement of the UGS vegetation. Monthly evapotranspiration rates (ETo) were derived in this study and were used for calculating the water requirement of the UGS. The day–night average ETo was over 8 mm, which means that there appears to be an imminent water stress in most UGS of the city in particular during the January–May period. The DWR in seven gardens of Panaji city were ~25 L/tree, 6.77 L/m2 hedge plants, and 4.57 L/m2 groundcover (=lawns). The water requirements for the entire UGS in Panaji city were calculated. Using this information, the estimated total daily volume of water required for the entire UGS of 1.86 km2 in Panaji city is 7.10 million liters. The current supply from borewells of 64,200 L vis a vis means that the ETo-based DWR of 184,086 L is at a shortage of over 2.88 times and is far inadequate for meeting the daily demand of hedge plants and lawn/groundcover.

1. Introduction

Urbanization is an inevitable modern phenomenon that is ongoing worldwide, and it is happening rapidly in developing countries. The perceived ‘comforts’ and benefits of urban facilities entice many rural populations to move into towns and cities, which then often become overcrowded. Education and employment opportunities, healthcare facilities, and access to advanced infrastructure are notable advantages in an urban setting. However, the drawbacks of rapidly expanding urbanization, which often haphazardly, include strain on resources and energy, environmental vulnerability to severe stormwater runoff [1], elevated land surface temperature (LST), and urban heat island (UHI) effect [2,3].
The urban green spaces (UGS), for their potential for removing CO2 from atmosphere and giving out oxygen can be regarded as “lungs of city” and reservoirs of “carbon stock”. Offering a broad range of benefits, their major ecosystem services of sequestering and storing large amounts of carbon [4] contribute to the mitigation of climate change. With the recent global trend of expanding urbanization, even the smaller share of carbon sink from the urban vegetation must be considered vital and facilitated by proper maintenance and by creating newer UGS for mitigating the increased land surface temperature (LST) and urban heat islands (UHI) for improving the urban living comfort.
Water requirement analysis of plants is overly complex to predict in practice [5]. However, to achieve “good appeal” in the UGS, irrigation and rainfall should replace the total water lost through evapotranspiration (ETo). This ETo is the sum of water lost through natural evaporation and plant transpiration. Therefore, the measurement of evapotranspiration rates has a great ecological relevance. For instance, with growing populations, there is increasing demand for water resources and, therefore, using water efficiently is important for both landscape and agricultural irrigation. This is necessary to minimize competition for limited water resources. For the landscape irrigation process, an estimate of ET is essential for water management for a good upkeep of landscaped plots in urban areas [4], which offer a variety of ecological and societal services.
Mostly the estimated EToL or those evolved by Allen et al. [6], calculated based on local microclimate data, are used to obtain the EToL. In these efforts all across the globe, the same standardized reference ET equations are used for deriving the regional ETo, usually with the hope of higher cost benefit ratios [7]. Since no study hitherto provided ETo-based daily water requirements for the UGS in almost all Indian cities or in many Asian cities, one of the objectives of this study was to derive ETo for local conditions in Panaji city. This was followed to provide a basis for estimating the daily water requirement (DWR) in a select few parks surveyed from Panaji (Sep–Oct 2020). This study also aimed to calculate the DWR for all parks/UGS in Panaji. The other objective was to examine the feasibility of whether treated/recycled water available regularly would be considered for irrigating the parks and gardens in Panaji city.

2. Materials and Methods

2.1. Data Collection from Urban Green Spaces

A set of key informant survey questionnaires was prepared to collect the required information from different gardens/parks and the smart city office of the Planning and Development Authority, Urban Planning. The data were collected by visiting the sites on different days during January–February 2019 and again in August–September 2020. The questionnaires prepared for obtaining information from parks, gardens, and STP are included in Appendix A Table A1, Table A2 and Table A3. In addition to collecting the on-site data, details obtained through interactive discussions with the garden staff and officers in charge were collated. Main details of these parks are available in Table 1 and in the study area details.

2.2. Study Area Details

As many as seven different parks/gardens (social forests) within Panaji city were covered for this study. Various climatological details of Panaji city proposed to be developed as a smart city under Smart City Mission of India are available in Ramaiah et al. [8].
With detailed discussion with garden staff at site, many details of these parks were collected (Table 1). In addition, information on the source and amount of water used daily in these parks was also collected. The general practice of watering the gardens in the parks included for this study is that there is no watering during the monsoon months of mid-June to mid-October. There have been instances of acute water shortage during mid-February till the onset of monsoon/pre-monsoon showers (sometime during late May/early June). During this mostly hot and humid period, the plants (in particular, the ornamental plants) and the lawn cover suffer from water deficiency as per the long-term observations by the garden staff.
Except for Joggers Park, the soil is mostly sandy in all the gardens adjacent to, and including, Mahavir Park. Garcia da Orta garden has sandy and silty (66% and 33%, respectively) soil. The leveled laterite base of the Joggers Park is topped with soil from elsewhere to grow hedge plants and to support nutrients to existing trees. Ambedkar Park (established 1992) exclusively uses treated wastewater of 16,000 L every day during the non-rainy period from October 15 to June 15 for maintaining the groundcover and long hedge within the garden ca 11,000 m2 total area.
Parks sourcing borewell water have drilled bores of varying lengths. The length of the bore in most of these parks is less than 40 m deep. This is due to their vicinity to the lower stretches of River Mandovi to their left (depicted in Figure 1) unlike the deepest borewell of 130 m with the Joggers Park on top of the Altinho hill, which is over 30 m above mean sea level and, at quite a distance of over 3 km from the northern or western banks of River Mandovi. Notably, in the Ambedkar Park, the borewell located less than 800 m south of Mandovi was drilled back during mid-1980s and yielded saline waters unsuitable for plant growth.
Striking differences in the maintenance practices between each of these parks is as follows: In Mahavir Park (established in 1963), the water is pumped out directly onto the ground cover and lane edge plants. In Kala Academy (established in 1982), the water is pumped out into two overhead tanks from where it is distributed through sprinklers to groundcover and through hand-held pipes to the hedge plants. Within the precincts of Mahavir Park are the North Goa Range Forest and South Goa Range Forest Office parks. In the former, the water is used only for ca 200 m hedge of ornamental plants. There is a saplings nursery measuring 800 m2 in the South Goa Range Forest Office Park. Year-round regular rearing of tree/forest plants and saplings of as many as 52 different species of medicinal plants (Appendix A Table A1) is performed. Saplings are sold or distributed free of cost to the interested public. There are also ornamental and hedge plants reared in Mahavir Park (Appendix A Table A2) and in Ambedkar Park (Appendix A Table A3). In the Art Park, which is right on the banks of River Mandovi, there are big trees (most of them older than 20 years and some planted within the last 6 years) and shrubs not at all watered. Garcia da Orta garden (the oldest park in Panaji established in 1876 in the middle of the city) is home to many raintrees older than 80 years, with as many of 76 of them having girth diameter close to 3 m.
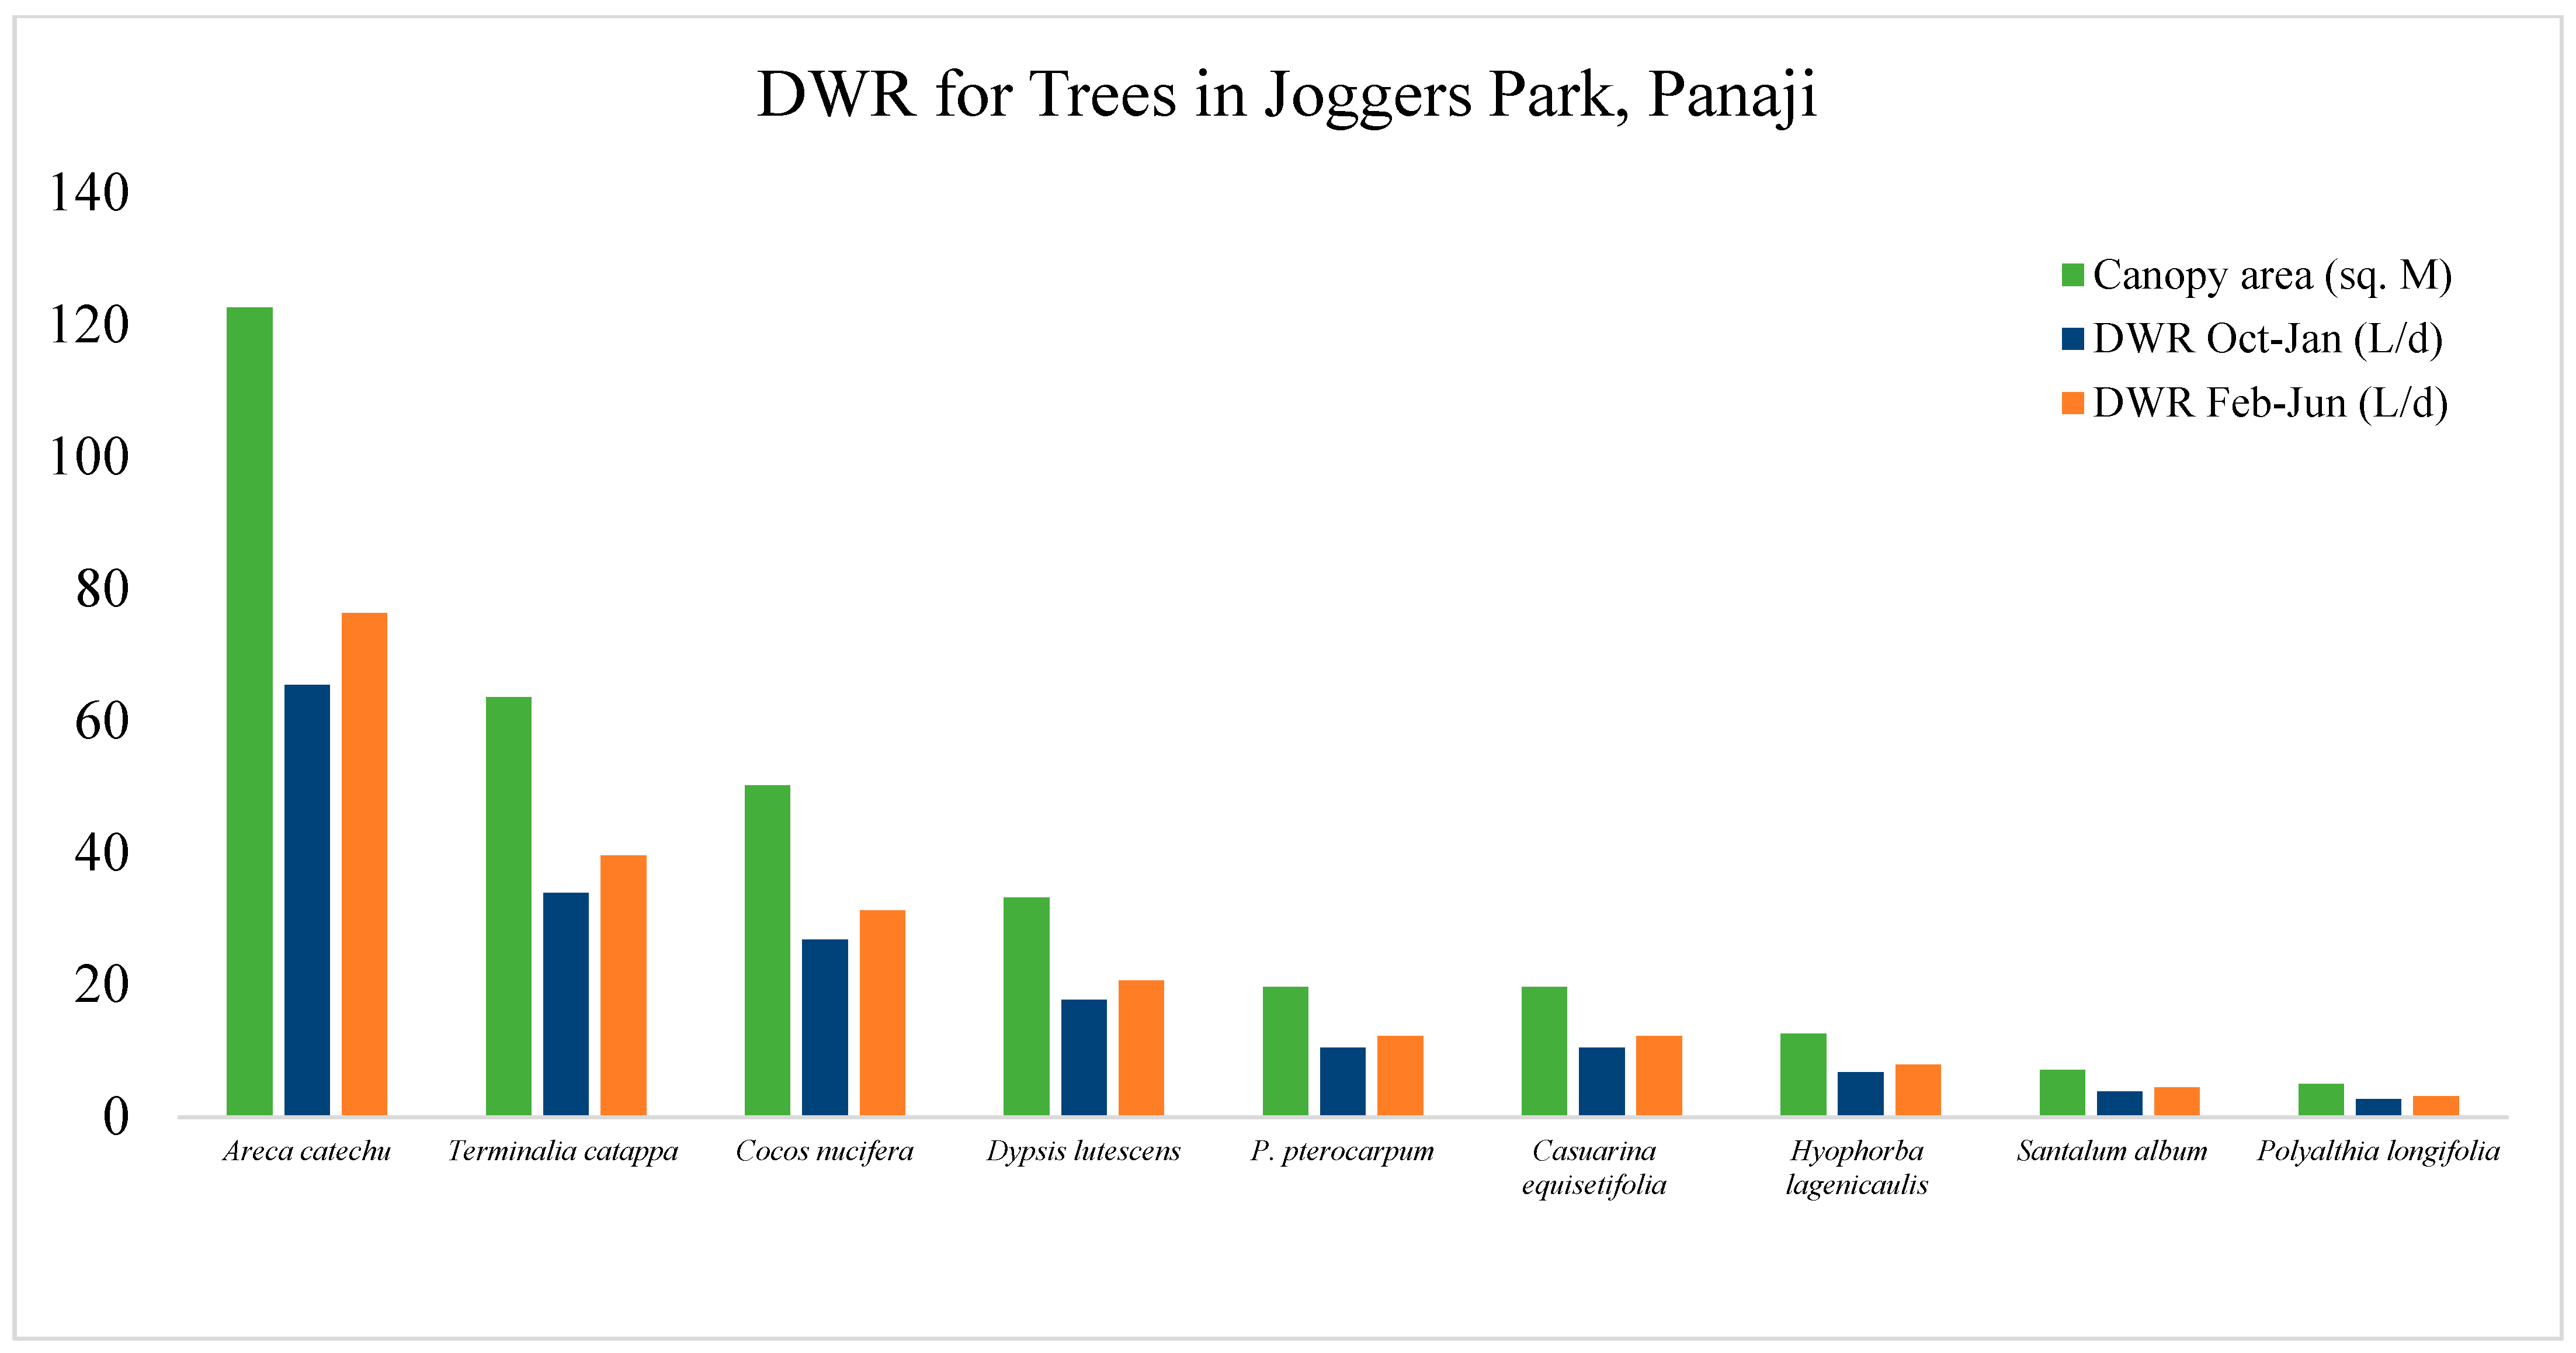
In most of these parks, watering is performed for three hours in the morning and three hours in the afternoon for covering only the groundcover (lawns) and ornamental plant–hedge along the walkways. About 20% of the total tall trees in Mahavir Park and those in the Range Forest offices of North and South Goa Districts are trimmed to a maximum height of 10 m to allow unobstructed passage of light signal from the lighthouse nearby. It is learnt that in addition to litter (dry leaves, twigs, prunes, mowed grass piles), over 30 tons of stem-wood is cut down annually from these trees. Mostly the Casuarina trees, ca 200 in numbers, stand in the path of the lighthouse signal beam. Joggers Park, created in 2002, is located on top of Altinho Hill in the central part of the city. Its hard laterite surface is leveled, suitably landscaped, and maintained to keep a largely plain surface for joggers, for a kindergarten playground and public amenity (toilet, parking space, and garden office) within an area totaling ca 700 m2.

2.3. Derivation of ETo for Panaji Region

The month-wise ETo (mm d−1) for the parks of in Panaji was derived using the formula provided by Snyder & Pruitt [9]:
E T o = [ 0.408 Δ R n G + γ   37 T + 273 u 2 e s e ] ÷ [ Δ + γ   1 + 0.24 u 2 ]
for daytime and
E T o = [ 0.408 Δ R n G + γ   37 T + 273 u 2 e s e ] ÷ [ Δ + γ   1 + 0.96 u 2 ]
for night-time
Variables in these equations are, net radiation (Rn, MJ m−2 h−1), ground heat flux density (G, MJ m−2 h−1), psychrometric constant (∆, kPa K−1), mean air temperature (T, °C), wind speed (u2, m s−1), saturation vapor pressure (es, kPa), vapor pressure (e, kPa), and slope of the saturation vapor pressure at temperature T (γ, kPa K−1). Data on meteorological parameters viz., solar radiation, temperature, vapor pressure, and wind speed available in the literature were used (Table 2 and Table 3). The psychometric constant, slope of the saturation vapor pressure at temperature T were either derived and, for reliability, compared with those of FAO Penman–Monteith datasets [6].

2.4. Considerations for Assessing Water Requirements in the UGS

The DWR estimates can be improved by deriving the ETo for the regions. Therefore, three basic steps were followed in this study. Firstly, based on tree/plant density and diverse species grown, the parks were categorized as mixed type. As per the WUCOLS plant density (Kd) coefficients, the parks in Panaji fall into the category of high or mixed (1.1–1.3) type. Thus, a Kd of 1.2 might seem appropriate for the purposes of inference.
The next step was to recognize which of the landscape coefficients best describes these parks. In their study, Snyder et al. [10] reviewed the WUCOLS and LIMP methods and identified the following coefficients as useful for deriving and practicing improved landscape management strategies. These are KL: landscape coefficient; Kmc: microclimate coefficient; Kp: plant species coefficient, which includes plant type and managed water stress, and Kd: plant canopy density. They stated that the Kp coefficients are subjectively separated, depending on estimated water use of specific vegetation as, extremely low (<0.1), low (0.1–0.3), moderate (0.4–0.6), and high (0.7–0.9). Similarly, Kp values are also “determined subjectively based on the experience of the authors of WUCOLS”. In that, the Kp for any plant species with moderate water use during the post-monsoon months of October–January can be up to 0.6 and higher (at least 0.7) during the warm months, wherein the water use in the high humidity coastal location of Panaji can be higher at 0.7. With this consideration, these two plant factors were used [11].
Briefly, temperature and season of the year, soil moisture content, soil’s water holding capacity, extent of tree root development, depth of root zone, root system-health, and tree species’ ability to resist drought are to be taken into account for working out the water requirement and frequency of watering [12]. Several authors [13,14] have used the values of ETo X PF X Canopy radius for estimating water requirement by a variety of groundcovers, shrubs, and trees. These authorities emphasize the importance of using appropriate factors of ETo for landscape groundcovers and shrubs to achieve acceptable landscape performance. A median ranged ETo value of 0.889 (equivalent to 0.35 as per Kjelgren et al. [7]) derived and used in this study is much more valuable than picking any ETo rate in the range of 0.16 to 0.48 supposedly holding good [13] for most tropical tree species considered to experience.
Estimating landscape irrigation requirements is problematic because mixtures of plants, small plots of vegetation, and multiple microclimates make it difficult to measure or estimate the ETo. To arrive at a process that can be helpful in landscape water management practices, several approaches have been ongoing for providing guidelines [5]. Among them, the Landscape Irrigation Management Program (LIMP) [15], the WUCOLS [16], and SLIDE rules [7] rely on deriving appropriate coefficients for estimating landscape evapotranspiration for helping landscape managers in defining programs to improve landscape irrigation meet this requirement [10]. Ideally, it would be better to calculate water requirement based on local ETL or local reference evapotranspiration (EToL) by all counts. This EToL is an estimate of the ETo for the local climate, “if it were possible to measure weather data over a well-watered grass surface to determine ETo in the local climate” [10]. Integrating these aspects to obtain a realistic picture of DWR was therefore attempted in this study,

2.5. Calculation of Water Requirements of Trees

Daily water requirement of different tree species, major ornamental shrubs maintained by pruning along both sides of the walk paths and of the turfgrass in the ground cover area was calculated based on the principles of Simplified Landscape Irrigation Demand Estimation (SLIDE) Rules [7]. Unlike the complicated WUCOLS and LIMP methods, the SLIDE rules are used widely to estimate landscape plant water demand as products of evapo-transpiration (ETo), canopy density, and plant factors (PF) which are discrete adjustment factors for broad plant types [10] based on multiple observations. Since there are many different species of shrubs (<3 m tall) and trees (>3 m tall) in the parks covered for this study, ranges of height and canopy diameter for each species of trees were obtained from Mahavir Park, Ambedkar Park, and Joggers’ Park during the field visits. The help and knowledge of park maintenance staff was sought to ascertain the height and canopy dimeter estimates. The steps followed are shown in the flow chart below (Figure 2):
Water requirements of isolated trees in the parks were calculated by appropriately substituting the formula: WR = ETo × PF × (R × R × 3.14) × 0.623, as follows:
WRTr (Ld−1) = EToP × PF × (R × R × 3.14)
and
WR (Ld−1) = EToT × PF × (R × R × 3.14)
WR is water requirement, EToP (Panjim) is evapotranspiration factors (cm d−1), and PF is Plant Factor for established landscape trees by following UCANR [11]. Two plant factors were used: (a) 0.6 for all trees during somewhat cooler, mildly humid October–January and (b) 0.7 for all trees during the warmer February–June. R, tree canopy radius in meters; R × R × 3.14, area of tree’s canopy-equivalent floor cover; and ETo in mm d−1 were multiplied with this floor cover area to calculate the daily water requirement in liters. Irrespective of the canopy shape (triangular, irregular or tapering), its area for a given tree was estimated by projecting the two far end points of the canopy to the floor for a straight line distance that was noted as canopy diameter as per UCANR [11].

2.6. Calculation of Water Requirements of Hedge Plants

With the average height of 0.8 m in all sampled parks where the pruning is performed to achieve circular/globular shaped canopy, the perimeter is 3.4 m. Hence, the DWR was calculated using the following relationship:
WRhp (L m−2 d−1) = πD × PF × EToP × Kd
where πD is the area of the perimeter, PF used is 0.65, EToP is the evapotranspiration rates cm d−1 and Kd of 1.02 for higher density mixed species (as per Snyder et al. [10]), which works out to 6.77 L m−2 d−1 vis a vis the 7 L m−2 d−1 calculated following SLIDE rules. Both these volumes closely corroborate the experience-based input by the garden staff watering 6 to 8 L m−1 hedge length.

2.7. Calculation of Water Requirements of Lawns (=Groundcover)

For estimating the daily water requirement of the groundcover, the “non-turf groundcover water demand calculator 2.0” (=NGWDC 2.0) was used [11]. The EToP (0.889 cm or equivalent to 0.36 inches as per the American style) derived for this study was applied to obtain the DWR for the groundcover of Paspalum grass (mostly used as lawn grass in public gardens). The DWR works out to 42.53 for a groundcover area of 9.29 m2 (=100 sq ft) (or 4.577 Ld−1 m−2). Using this rate, the DWR for groundcover was calculated for all parks from where the groundcover area was calculated.
Using these monthly day- and night-time averages of EToP (0.889 cm) derived in this study by following Snyder et al. [
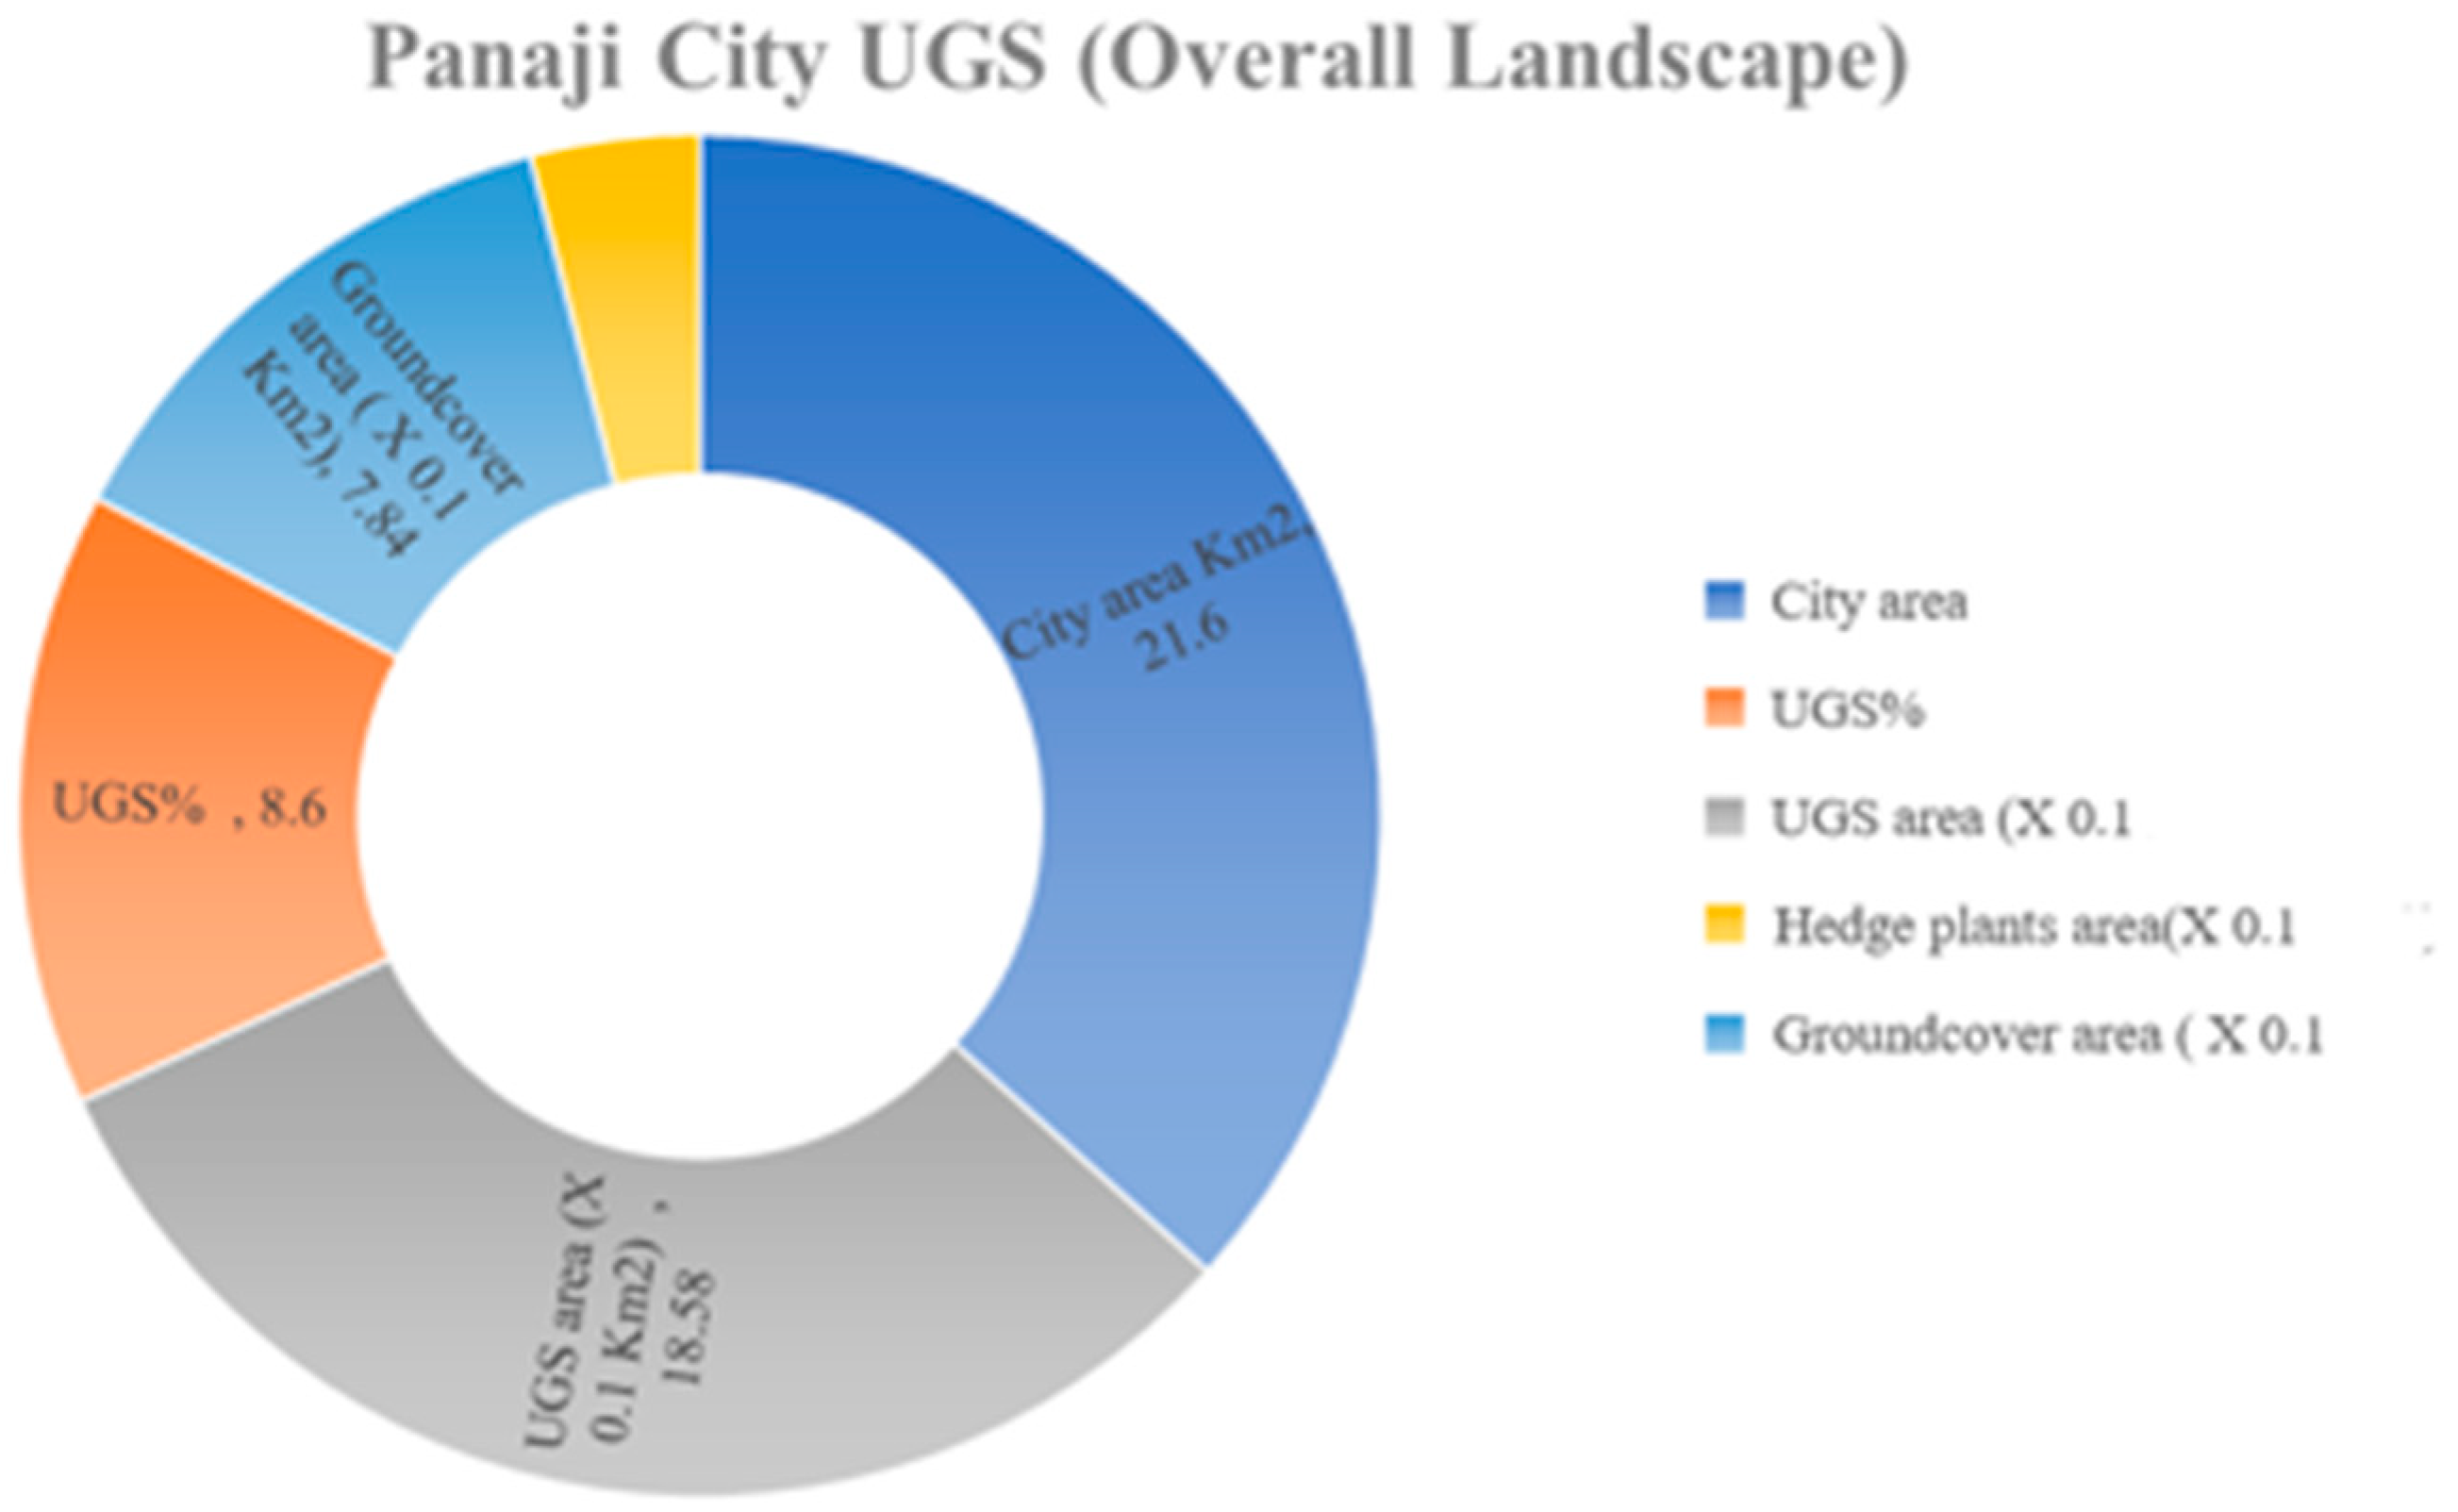
10], the daily water requirements were worked out for the number of trees, area of hedge plants and groundcover calculated from all 17 parks of Panaji [10] as per the weighted mean percentage of landscape spaces listed in Table 3.

3. Results

3.1. Determination of Evapotranspiration Rates

All required values for different variables essential for Equations (1) and (2) were determined appropriately. Using these derivatives, the daily evapotranspiration rates (mmd−1) for the Panaji (EToP) region for each month were obtained. The net radiation (Rn, MJ m−2 h−1) value was from the FAO site and the ground heat flux density (G, MJ m−2 h−1) used was zero since the ground flux was <2.5 to 3 MJ m−2 h−1. The monthly day and night averages EToP of 8.89 mm d−1 (=0.889 cm d−1; listed in Table 2) were used in all applicable calculations. It is to be noted that the ETop derived here was applied across all the parks considered for this study.

3.2. Daily Water Requirements (DWR) of Lawn and Groundcover

To calculate the pooled/total DWR of all plant types in all seven sampled/surveyed parks in Panaji, the percent proportion of areas in all of the Panaji city UGS calculated using the weighted mean mentioned in Table 3 were used. Hedge area in Joggers Park, Mahavir Park and Ambedkar Park, respectively, are 2340 m2 (20.34% of total), 2700 m2 (7.20%), and 1620 m2 (16.20%); and groundcover area is ~6410 m2 (35% of combined area of Mahavir Park and Art Park area of 37,211 m2), 6900 m2 (60% of 11,500 m2) in Joggers Park, and 6500 m2 (65% of 10,000 m2) in Ambedkar Park. These details are listed in (Table 4).
Borewells being the source of water for all parks except for the Ambedkar Park, which uses treated water (given out free of cost), which is ferried daily from the sewage treatment plant some 5 km south of this park. This supply either from borewells or from other sources is not enough for meeting the daily demand of hedge plants or groundcover (Table 4). For instance, the DWR for 27,860 m−2 ground cover is 127,320 L at 4.77 L.m−2, and 56,767 L for 8385 m−2 hedge area at 6.77 L m−2. The current supply of 64,200 L vis a vis this ETop based DWR of 184,086 L is at a shortage of over 2.88 times. It is to be noted that notwithstanding the presence of over 20 different ornamental plants randomly grown in these parks (Appendix A Table A1, Table A2 and Table A3), the DWR for the hedge-plants was calculated at the rate of 6.77 L m−2 of the hedge area.

3.3. Canopy Areas and Water Requirements of Different Species of Trees

At the outset, it is to be noted that most trees in all parks are not watered, except that they may obtain some moisture/wetness from the nearby groundcover or hedge area. However, in order to highlight their water requirement particularly during the non-rainy months of February to June, the DWR for trees was worked out for trees in three parks (Table 5, Table 6 and Table 7) from where confirmed details of taxonomic names were available. The water requirement was calculated for October–January (low to moderate water stress) and February–June (higher water stress) periods using the plant factors of (PF) 0.6 and 0.7, respectively.
Mostly older than 35 years, over 48% (or 1525) of the 3130 individual trees had more than 7 m canopy diameter. Canopy diameter is the most important parameter for estimating DWR, and for some trees with a larger canopy area, it is included in Table 5, Table 6 and Table 7. They were classified as large-, medium-, and small-sized trees and their DWR during two different periods are presented in Figure 3 for Mahavir Park. Likewise, for Ambedkar Park in Figure 4 and for Joggers’ Park in Figure 5.
By calculating the DWR, it was evidenced that it is different for different species solely based on the canopy area/diameter of a given species of tree. The DWR of 3130 trees in Mahavir Park (Figure 3a–c) during Oct–Jan period is 79,346 L (on an average of 25.35 L/tree). During Feb–June, the total volume of water required is 92,570 L (average 30 L/tree). Similarly, in Ambedkar Park (Figure 4), the DWR for 478 trees during Oct–Jan is 10,823 L (av. 23 L/tree). During Feb–June, it is 12,626 L (av. 26.41 L/tree). Further, the DWR of 402 younger (<15 years) trees with lesser canopy area in Joggers Park (Figure 5) during Oct–Jan is 7180 L (averaging 18 L/tree) and during Feb–June, the DWR is 8376 L (av. 21 L/tree).
For a sum of 4012 trees from Mahavir Park, Ambedkar Park, and Joggers’ Park together, the total volume of water required daily during Oct–Jan is ca. 0.098 MLD, and during Feb–June, 0.114 MLD. Thus, on an average for 4012 trees in three parks, the DWR for the eight non-rainy months period of 15 October–15 June is 0.211 MLD averaging 26.30 L/tree.
Indeed, a linear relationship was invariably seen between canopy diameter and volume of water required (Table 4). The larger the canopy diameter, the higher the volume required during both these periods using different PFs. During Oct–Jan, the minimum water required ranged from 13 L for Phyllanthus emblica to a high of 317 L for Rain tree, followed by Gulmohar, Dulce, Badam, Taman, Jambal, Peltophorum, and Chinch, most of which possess larger canopies and need higher volumes compared to narrow canopied Ashoka, Bottle palm, Avalo, Bayo, Casuarina, and Java cassia.

3.4. Regression Relationships

Regression relationship between independent variables (mean tree heights, canopy, and circumference) and dependent variables (DWR) were for lower PF 0.6 and higher PF 0.7 periods within a given tree species in Mahavir Park, Ambedkar Park, and Joggers Park (Table 8). Invariably, the level of significance between independent variable (canopy area) and dependent variable (DWR) was linear and highly significant in Mahavir (R2 = 0.9417) and Ambedkar Park (R2 = 0.833) among the taller, broader canopied, and bigger circumference trees. Indeed, the carbon dioxide fixed/tree/year also bore a linear relationship with DWR during both the periods specifically in Mahavir Park. Lower R2 values were found for trees in Joggers Park.

3.5. DWR in the UGS of Panaji City

Using the information derived from the seven parks, the water requirement was worked out for all the parks and gardens in Panaji city. In addition to these two main parameters, literature-search-based information on several parameters is also listed for comprehension. The mean proportions/percentages of hedge rows, ground cover, and tree areas in Panaji city are indicated in Figure 6 and their area distribution in Figure 7. The volume of water applied currently for watering mainly the hedge area of 236,287 m2 and the ground cover area of 784,465 m2 in all 17 parks is 2.66 MLD. These two volumes add up to 5.20 MLD (Figure 8). Similarly, the likely volumes of water applied daily to the hedge area of 117497 m2 and the ground cover area of 389,952 m2 may be about 1.2 MLD (Figure 7 and Figure 8). However, the DWR for hedge plants is about 0.8 MLD and for groundcover, 1.78 MLD. Thus, the daily supply for hedge plants and groundcover must be falling short by 1.53 MLD (or 46.57%) of the requirement (Table 9).

4. Discussion

4.1. Need for Background Details of Microclimate Factors

In Panaji parks with high plant diversity, the Kd would be 1.2. The Kmc of plants grown in a windy location such as Panaji city can be up to 1.2, as per Snyder et al. [10]. Using these inputs suitably in the equation KL = Kmc × Kd × Kp adapted from Snyder et al. [10], the landscape coefficient of Panaji parks could be KL = 1.2 × 1.2 × 0.6 (i.e., KL = 0.864) for October–January and KL = 1.2 × 1.2 × 0.7 (KL = 1.008) for February–June.

4.2. Importance of Establishing Regional ETo

ET0 rates ranging from 3.97 to 6.54 recorded mm d−1 for California Coachella Valley Water District with wide ranging annual temperature and weather are reported in the literature [5,7,9,10,17]. The EToP derived for the first time within the Tropic of Cancer are higher by over 20% of these values reported for Coachella Valley in the United States. The EToP in the total UGS area of 1.86 km2 in Panaji city would be accounting 8.89 mm (column) multiplied by 106 (sq km area converted to square meters) would equal a volume of 16.54 × 10⁶ L/d. Thus, the ETop derivations of this study, which suit most tropical regions, are useful to arrive at DWR in the UGS settings in the tropical regions. These derivations and the computed month-wise ETo could be of regional significance in many Asian countries.
By meeting the DWR of the hedge area (0.236 km2), ground cover area (0.784 km2) and the trees’ area of 0.538 km2 with their water requirement of 6.951 MLD, the daily transpiration losses of groundwater can be prevented. Containing the groundwater losses is of paramount value in sustainable use of natural resources in these rapidly urbanizing times.

4.3. Considerations for Assessing Water Requirements in the UGS

A median ranged ETo value of 0.889 (equivalent to 0.35 as per Kjelgren et al. [7] derived and used in this study is much more valuable than picking any ETo rate in the range of 0.16 to 0.48 supposedly holding good [13] for most tropical tree species. The same approach can be successful in estimating the amount of water required for landscape-tree species to provide acceptable performance in most landscape settings [18,19], though a tree species-specific PF may constrain its wider use. To overcome this, Kjelgren et al. [7] provided simplified landscape irrigation demand estimation (SLIDE) rules. However, focused research efforts across the spectrum of climatic conditions and plant species in UGS settings are called for, for a realistic measurement of DWR that permits acceptable performance of the given tree species.
For estimating daily water requirement of landscape-trees, Beeson [13] recommended a single Plant Factor (PF) of 0.5, or 50%, to adjust reference evapotranspiration (ETo), as in ETo × 0.5. This PF is reported as applicable to all established, climatically adaptable, traditionally grown, drought tolerant, low-water use, native, or social forestry compatible trees. As explained earlier, two different PFs of 0.6 (for less warm and less humid October–January period) and 0.7 (for warmer and more humid February–June period) were used in this study. The calculated DWR using the formula adapted in this study are largely in the ranges reported by Shaw & Pittenger [20] for many trees growing in tropical regions. In the absence of previous studies on water requirement data for all the species grown in the India urban areas including that of Panaji city, the realistic estimates of 25.81 L/tree can be adapted to project the DWR by trees in UGS in most Asian cities.
Due to reduced evapotranspiration efficiency in water-starved plants and trees [21], several physiological processes might be altered. For instance, their carbon fixation, growth rate, inflorescence output, and fruiting physiology can be adversely affected. Therefore, carbon sequestration potential during the warmer, non-rainy periods of over 6 months from January in the parks and gardens of Panaji ought to be low apart from reduced efficiency of constraining the UHI because of increased LST.

4.4. DWR for Trees, Hedges, and Groundcover

On the basis of DWR for the hedge-area and groundcover in these three parks, approximately 2.66 MLD of water is currently being used in Panaji city for all of its 17 parks with an estimated sum of the hedge area of 236,287 m2 and the groundcover area of 784,465 m2. Watering the tree—currently not in practice—would fetch several advantageous ecosystem services [2], including enhanced carbon fixation, biomass build up as well as sequestration.
There are no previous reports on DWR by hedge plants or groundcover in use in UGS in most settings in India or many Asian countries. The assessment was performed after deriving the EToP in this study, which included sizable lengths of hedge plants and groundcover. Thus, it can be proposed that the DWR is to the tune of 6.77 Lm−2 for hedge plants and 4.57 Lm−2 for groundcover, by applying the EToP derived in this study.
From the EToP derived, it could be estimated that over 16,500 m3 is the volume of evapotranspiration (equivalent to 8.89 mm d−1 m−2) taking place daily from the city’s total UGS area of 1.86 sq km. For the non-rainy 240 days, it amounts to 2134 mm m−2. In other words, close to 76% of the centennial mean rainfall of 2774 mm is lost through evapotranspiration in this region. Such a loss is an overly critical problem in Asian tropical UGS settings with higher ETo (of ≥9.00 mm d−1 m−2) and regions receiving far less rainfall annually [2,3]. Perhaps for such reasons are the rapid and huge depletion of groundwater in most low rainfall/snowfall areas across the globe.
Although Kjelgren et al. [7] suggest that this quantity is adequate for 1–4 days for acceptable plant performance, the porous, low retention characteristic of sandy/loamy soils in most of the parks covered for this study would need watering at least once every two days in Panaji. Thus, the results from this study may prove very pragmatic for several sustainable management steps. For instance, in the future, it might become an obligatory necessity to completely avoid extracting groundwater (through borewells) and use treated wastewater to maintain the UGS in Panaji city.

4.5. Need for Treated Wastewater Use in UGS in Reducing Groundwater Extraction

Over 49% is the combined short supply of water for hedge-plants and lawns in the whole of Panaji UGS. This implicitly suggests the water stress that the plants are experiencing. This is despite continuous groundwater pumping out (or frequent resorting to diversion of significant volumes of processed water meant for domestic use [22]. Therefore, not only this shortfall but also DWR for hedge plants and groundcover together can be effectively met by ferrying in the treated water available to the tune of over 13 MLD. Keeping aside the differences in species-wise requirement, the DWR per tree for 4012 trees in three parks during the eight month-period of October 15-June 15 averages ~24 L/tree daily. This average can be applied to all 67,275 trees in Panaji UGS.
Currently, Panaji city is practicing groundwater extraction for watering all of its UGS except that of Ambedkar Park. This park resorted to transporting ca 20,000 L after its borewells pumped out saline water found unsuitable for garden uses. In cities, due to failing borewells (some drilled deeper than 250 m: [23]), it is hard to avoid intense water stress during summer or during long spells of non-rainy days even during the monsoon months. It may be an issue to save the plants in the UGS even when a consideration-based option is to divert some portion of water processed for potable purposes to UGS use.
It may therefore be suggested that the greatly receding groundwater reserves year on year across the globe that pose severe water crises in many parts of the globe be recognized [1]. By using the treated wastewater from any STP that is meeting all the safe-discharge-limits criteria, a complete stoppage of groundwater extraction can be possible.
It is to be noted that there can be some uncertainties in such analysis and the data collected. As made clear above, the DWR was calculated using the regional ET derived in this study. It is to be recognized that over 4880 tree samples, and close to 8385 m2 hedge area and 27,860 m2 area of grass cover from seven parks (see data presented Table 4) in the city of Panaji were covered in this study. Indeed, this first-time data set from India presents the DWR for over 30 different tree-, 17 hedge plant-, and 2 grass (lawn/groundcover)- species. These large data sets are indeed robust enough. Such a type of sampling effort very likely demonstrates the value of DWR calculations, as were carried out in this study.

5. Conclusions

The knowledge of regional evapotranspiration (ETo) is vital for deciding on water management for irrigating the UGS. In this study, the ETo for Panaji (EToP) was calculated for every month of the year by assembling a variety of atmospheric data. Optimal irrigation application is typically achieved by applying the correct amount of water to maintain quality of the landscape plants without excessive losses to deep percolation or runoff onto hardscapes. Landscaped-UGS irrigation management is an extremely important factor for water conservation, efficient distribution, and sustainable long-term use in cities where water losses are often unrecoverable. These steps are increasingly important in a world with rapid population growth and decreased water supplies. Although the ET-based scheduling to improve on the efficient use of water for irrigation has seen considerable advancements in recent decades, there is still a need to derive and improve the estimation of ET in regions with multiple microclimatic variability and where the vegetation is mixed or the overall fetch is inadequate for measurement of ET using traditional methods. Thus, deriving and using the annual average evapotranspiration rate of 0.889 cm d−1 in Panaji region, the DWR for different plant types calculated was found to be higher by 3–4 L/tree (than the annual average of ~25 L/tree) in different parks during the warmer months from mid-February to mid-June.

Author Contributions

Conceptualization, methodology, software, validation, formal analysis, and data curation were performed by M.R. and R.A. Writing—review and editing, visualization, were performed by M.R and R.A. Supervision and project administration were by R.A. All authors have read and agreed to the published version of the manuscript.

Funding

No external funding received for this work.

Data Availability Statement

The original contributions presented in this study are included in the article. Further inquiries can be directed to the corresponding author(s).

Acknowledgments

M.R. gratefully acknowledges the JASSO assistantship provided through Hokkaido University.

Conflicts of Interest

The authors declare no conflicts of interest.

Appendix A

Table A1. List of medicinal plants grown in South Goa Range Forest Office Garden.
1Abrus precatorius27Jatropha curcas
2Acacia catechu28Justicia adhatoda
3Acorus calamus29Justicia gendarussa
4Aegle marmelos30Lawsonia inermis
5Aloe barbadensis31Mimusops elengi
6Alstonia scholaris32Mesua ferrea
7Andrographis paniculata33Moringa oleifera
8Annona muricata34Murraya koenigii
9Annona squamosa35Ocimum tenuiflorum
10Artemisia vulgaris36Phyllanthus emblica
11Asparagus racemosus37Phyllanthus fraternus
12Azadirachta indica38Pogostemon cablin
13Bacopa monnieri39Piper longum
14Boerhavia diffusa40Piper nigrum
15Bryophyllum pinnatum41Rauvolfia serpentina
16Butea monosperma42Saraca asoca
17Cassia fistula43Stevia rebaudiana
18Catharanthus roseus44Strychnos nux-vomica
19Centella asiatica45Syzygium cumini
20Cinnamomum zeylanicum46Terminalia arjuna
21Cissus quadrangularis47Terminalia bellirica
22Ficus racemosa48Terminalia chebula
23Garcinia indica49Tinospora cordifolia
24Gloriosa superba50Vitex negundo
25Gymnema sylvestre51Withania somnifera
26Hemidesmus indicus52Zanthoxylum rhetsa
Note(s): All these plants are reared in the nursery and sold or distributed occasionally free of cost to interested public. Only a few of these are grown in hedgerows.
Table A2. Ornamental and hedge plants in Mahavir Park.
Common NameBotanical Name
Golden durantaDuranta erecta
AcalyphaAcalypha wilkesiana
EranthemumEranthemum pulchellum
AllamandaAllamanda cathartica
Panama RoseArachnothryx leucophylla
GardeniaGardenia jasminoides
TutiaSolanum sisymbriifolium
DracenaDracaena marginata
BouganvillaBougainvillea spp.
CrotonCodiaeum variegatum
Areca PalmDypsis lutescens
PentasPentas lanceolata
BalsamImpatiens balsamina
AgaveAgave americana
HibiscusHibiscus rosa-sinensis
Spider plantsChlorophytum comosum
Table A3. Ornamental plants in Ambedkar Park grown in nursery and used * in hedge lines.
Local Name Botanical NameFamily
GardeniaGardenia jasminoidesRubiaceae
TutiaSolanum sisymbriifoliumSolanaceae
Panama RoseArachnothryx leucophyllaRubiaceae
AlmondaAllamanda catharticaApocynaceae
CrotonCodiaeum variegatumEuphorbiaceae
Golden durantaDuranta erectaVerbenaceae
EranthemumEranthemum pulchellumAcanthaceae
NeriumNerium oleanderApocynaceae
IxoraIxora coccineaRubiaceae
HibiscusHibiscus rosa-sinensisMalvaceae
Red and green dressinaDracaena marginataAsparagaceae
AlthernatumAlthernatum sp.
BalsamImpatiens balsaminaBalsaminaceae
Jocupus Rendulus
Note(s): * Ornamental plants. Many in the nursery area; grown for sales. Medicinal plants mostly in nursey and sold.

References

  1. Ramaiah, M.; Avtar, R. Urban Green Spaces and Their Need in Cities of Rapidly Urbanizing India: A Review. Urban Sci. 2019, 3, 94. [Google Scholar] [CrossRef]
  2. Ramaiah, M. Role of Treated Wastewater in Mitigating Urbanization Impacts and Maintaining Regulatory Ecosystem Services; Hokkaido University: Sapporo, Japan, 2021. [Google Scholar]
  3. Ramaiah, M.; Avtar, R.; Kumar, P. Treated Wastewater Use for Maintenance of Urban Green Spaces for Enhancing Regulatory Ecosystem Services and Securing Groundwater. Hydrology 2022, 9, 180. [Google Scholar] [CrossRef]
  4. Pereira, L.; Cordery, I.; Iacovides, I. Improved Indicators of Water Use Performance and Productivity for Sustainable Water Conservation and Saving. Fuel Energy Abstr. 2012, 108, 39–51. [Google Scholar] [CrossRef]
  5. Nouri, H.; Beecham, S.; Kazemi, F.; Hassanli, A. A Review of ET Measurement Techniques for Estimating the Water Requirements of Urban Landscape Vegetation. Urban Water J. 2013, 10, 247–259. [Google Scholar] [CrossRef]
  6. Allen, R.G.; Pereira, L.S.; Raes, D.; Smith, M. Chapter 4—Determination of ETo, 1998. Available online: http://www.fao.org/3/x0490e/x0490e08.htm# (accessed on 8 November 2020).
  7. Kjelgren, R.; Beeson, R.; Pittenger, D.; Montague, T. Simplified Landscape Irrigation Demand Estimation: SLIDE Rules. Appl. Eng. Agric. 2016, 32, 363–378. [Google Scholar] [CrossRef]
  8. Ramaiah, M.; Avtar, R.; Rahman, M.M. Land Cover Influences on LST in Two Proposed Smart Cities of India: Comparative Analysis Using Spectral Indices. Land 2020, 9, 292. [Google Scholar] [CrossRef]
  9. Snyder, R.; Pruitt, W. Evapotranspiration Data Management in California; ASCE: Baltimore, MD, USA, 1992; pp. 128–133. [Google Scholar]
  10. Snyder, R.L.; Pedras, C.; Montazar, A.; Henry, J.M.; Ackley, D. Advances in ET-Based Landscape Irrigation Management. Agric. Water Manag. 2015, 147, 187–197. [Google Scholar] [CrossRef]
  11. UCANR. Estimating Tree Water Requirements. Available online: https://ucanr.edu/sites/UrbanHort/Water_Use_of_Turfgrass_and_Landscape_Plant_Materials/Estimating_Water_Requirements_of_Landscape_Trees (accessed on 9 November 2020).
  12. Pittenger, D.R.; Shaw, D.A.; Hodel, D.R.; Holt, D.B. Responses of Landscape Groundcovers to Minimum Irrigation. J. Environ. Hortic. 2001, 19, 78–84. [Google Scholar] [CrossRef]
  13. Beeson, R.C. Development of a Simple Reference Evapotranspiration Model for Irrigation of Woody Ornamentals. HortScience Horts 2012, 47, 264–268. [Google Scholar] [CrossRef]
  14. Staats, D.; Klett, J.E. Water Conservation Potential and Quality of Non-Turf Groundcovers Versus Kentucky Bluegrass Under Increasing Levels of Drought Stress. J. Environ. Hortic. 1995, 13, 181–185. [Google Scholar] [CrossRef]
  15. Romero, C.C.; Dukes, M.D. Residential Benchmarks for Minimal Landscape Water Use; Agricultural and Biological Engineering Department, University of Florida UF Water Institute: Gainesville, FL, USA, 2010; pp. 1–49. [Google Scholar]
  16. Costello, L.R.; Matheny, N.P.; Clark, J.; Jones, K.S. A Guide to Estimating Irrigation Water Needs of Landscape Plantings in California, the Landscape Coefficient Method and Wucols III; University of California Cooperative Extension, California Department of Water Resources: Berkeley, CA, USA, 2000. [Google Scholar]
  17. Rosa, R.; Dicken, U.; Tanny, J. Estimating Evapotranspiration from Processing Tomato Using the Surface Renewal Technique. Biosyst. Eng. 2013, 114, 406–413. [Google Scholar] [CrossRef]
  18. Pittenger, D.R.; Shaw, D.A. Estimating Water Needs of Urban Landscapes; American Society for Horticultural Science: Alexandria, VA, USA, 2010; Volume 45, p. S96. [Google Scholar]
  19. Pannkuk, T.R.; White, R.H.; Steinke, K.; Aitkenhead-Peterson, J.A.; Chalmers, D.R.; Thomas, J.C. Landscape Coefficients for Single- and Mixed-Species Landscapes. HortScience Horts 2010, 45, 1529–1533. [Google Scholar] [CrossRef]
  20. Shaw, D.A.; Pittenger, D. Performance of Landscape Ornamentals given Irrigation Treatments Based on Reference Evapotranspiration. Acta Hortic. 2004, 664, 614. [Google Scholar] [CrossRef]
  21. Qaderi, M.M.; Martel, A.B.; Dixon, S.L. Environmental Factors Influence Plant Vascular System and Water Regulation. Plants 2019, 8, 65. [Google Scholar] [CrossRef] [PubMed]
  22. Corporation of the City of Panaji; CRISIL Risk and Infrastructure Solutions Limited. Revised City Development Plan for Panaji, 2041. Imagine Panaji. Available online: http://imaginepanaji.com/wp-content/uploads/2015/11/Revised-City-Development-Plan-for-Panaji-2041-2.pdf (accessed on 17 September 2019).
  23. Central Ground Water Authority (CGWA). NOCAP. Available online: https://cgwa.mowr.gov.in/ (accessed on 11 November 2020).
Figure 1. Parks and gardens in Panaji city surveyed for this study. In addition to labeling them on the map, the names are listed on the right side for clarity.
Water 17 01487 g001
Figure 2. Steps followed in the methods for estimating daily water requirements (DWR) of plants.
Water 17 01487 g002
Figure 3. Canopy areas of (a) larger, (b) medium, and (c) smaller sized trees in Mahavir Park in Panaji, Goa, and their daily water requirement (DWR; L d−1) depicted on a y-axis.
Water 17 01487 g003aWater 17 01487 g003b
Figure 4. Canopy areas (y-axis) of different tree species in Ambedkar Park in Panaji, Goa, and their daily water requirement (DWR; L d−1). Species names as per the sequence in Table 4.
Water 17 01487 g004
Figure 5. Canopy areas (y-axis) of different tree species in Joggers’ Park in Panaji, Goa, and their daily water requirement (DWR; L d−1).
Water 17 01487 g005
Figure 6. Estimated landscape proportions of UGS in Panaji (within 1.86 sq km spread in 17 parks).
Water 17 01487 g006
Figure 7. Overall landscaped spaces in Panaji city. All areas are in Sq Km.
Water 17 01487 g007
Figure 8. Daily water requirement (DWR in MLD) for hedge plants, lawn (=ground cover), and trees in the UGS of Panaji city.
Water 17 01487 g008
Table 1. Important details of seven different parks surveyed for this study.
ParkArea (m2)No of SpeciesGround Cover (m2)Source of WaterDaily Water Used (L)Annual Litter Fall (tons)Number of Staff
Trees (Total Number) #Ornamental (Hedge Length; m)
Kala Academy10,63021 (300)6 (400)2675Borewell10,000156
North Goa Range Forest Park500018 (390)6 (200)2250Borewell4800103
South Goa Range Forest Park65009 (200)52 medicinal1625Borewell840065
Mahavir Park18,31227 (3130)17 (3000)6410Borewell15,0006022
Art Park18,99900Not watered030
Garcia da Orta Garden400012 (180)6 (450)1500Corporation water + Borewell400065
Ambedkar Park10,00015 (400)17 (1800)6500Treated wastewater16,0002512
Joggers Park11,5008 (400)12 (2600)6900Borewell36,0001222
Note(s): # Number of trees together in Mahavir Park and Art Park as per the list provided by the Park Office.
Table 2. Day- and night-time evapotranspiration rates (ET0) for Goa **.
MonthRnPCTminTmaxTdws
(m s−1)
SVP Slope
kPa K−1
SVPVP e, kPaEToG
Day-Time
EToG Night-Time
Jan28.90.06720.331.5191.1940.1983.363.48.2136.829
Feb32.30.06721.031.4201.2780.2013.393.49.1807.564
Mar35.70.06723.432.1231.2780.2183.783.710.3958.500
Apr38.10.06725.833241.4720.2364.174.111.2339.227
May38.70.06727.033.4252.0830.2454.354.311.1998.676
Jun38.60.06725.230.8251.8330.223.783.810.9478.556
July38.50.06724.629.3252.8610.2093.573.610.1937.135
Aug38.10.06724.429252.6390.2063.533.610.1477.230
Sep36.40.06724.229.6251.5560.2083.583.610.2968.236
Oct33.20.06724.031.2240.9720.2163.763.79.7998.469
Nov29.60.06722.432.2221.0560.2123.753.68.6557.384
Dec27.90.06721.032200.9170.2043.463.58.1267.037
Note(s): ** Monthly mean climate and related data (from FAO) solar radiation (Rs), psychometric constant (PC) maximum (Tmax) and minimum (Tmin) dew point (Td) temperature, wind speed (ws), slope of saturation vapor pressure (SVP slope), saturation vapor pressure (SVP), vapor pressure (VP).
Table 3. Details of garden/park areas, different UGS parameters from sampled parks in Panaji, Goa $.
ParkKala AcademyNGRF Office ParkSGRF Office ParkMahavir Park + Art ParkGarcia da Orta GardenAmbedkar ParkJoggers Park
Total Area (m2)10,6305000650037,211400010,00011,500
Trees (n ^)2502901803130150480400
Hedge area (m2)360160800270040516202340
lawn (m2)2675225016256410150065006900
Road/lanes/parking lot (m2)43001200280060006007502500
Hedges area (%) [A]3.393.2012.317.2610.1316.220.35
Lawn area (%) [B]25.174525.0017.2337.506542.61
Road/parking area (%) [C]40.462443.0816.1315.007.5021.74
sum of [A] + [B] + [C]69.0172.2080.3840.6162.6288.7084.70
Area covered by trees (%)31.9927.8019.6259.3937.3811.3015.30
Area covered by trees (m2)32951390127522,101149511301760
No of trees2502901803130150480400
Area available per tree (m2)13.184.797.087.099.972.364.40
$ Data collected through personal visit. ^ rounded off to lower 10 s (for example 404 in Joggers park rounded to 400).
Table 4. Details of numbers of trees, hedge areas, and groundcover in different parks/gardens.
Park $Area (m2)Trees
(n ^)
Hedge Area (m2)Lawn (m2)Current Supply (LPD)Daily Water Requirement (Liters per Day, LPD)
Trees #HedgesLawnDemand
Kala Academy10,630250360267510,0005991.252437.2012,224.7520,653.20
NGRF Office Park5000290160225048006949.851083.2010,282.5018,315.55
SGRF office Park6500180800 *162560004313.705416.007426.2517,155.95
Mahavir Park + Art Park37,211313027006410840075,010.4518,279.0029,293.70122,583.20
Garcia da Orta Garden4000150405150015,0003594.752741.856855.0013,191.60
Ambedkar Park10,00048016206500400011,503.2010,967.4029,705.0052,175.60
Joggers Park11,5004002340690016,0009586.0015,841.8031,533.0056,960.80
Total84,8414880838527,86064,200116,949.2056,766.45127,320.20301,035.90
Note(s): $ Data collected through personal visit. ^ rounded off to lower 10 s (for example 404 in Joggers Park rounded to 400); # currently no direct watering of trees except for a small number nearer the hedge lanes or groundcover. Daily demand of water estimated at an average of 24 L per tree (see later), * nursery plot including narrow access lanes for watering, nursing/caring or for picking out the saplings for sale or free distribution. Their daily water requirement derived using the evapotranspiration factor of 0.889 mm d−1 in the Panaji region.
Table 5. Details of the different tree species from Mahavir Park, Panaji, Goa. It is to be noted that the canopy area is the main parameter useful for DWR.
Tree (Scientific Name)NumberHeight (m; Range)Canopydia (m; Range)Girth Circumference (cm)
nMean±SD
Casuarina (Casuarina equisetifolia)148518–225–623102.3519.24
Acacia (Acacia auriculiformis)5107–108–918129.5613.81
Karanj (Millettia pinnata)29415–187–815126.7321.3
Shankar (Caesalpinia pulcherima)1478–118–912101.6710.47
Badam (Terminalia catappa)1296–812–1412102.928.908
Ashok (Polyalthia longifolia)896–93–41076.406.168
Apto (Bauhinia purpurea)8711–158–911119.1817.14
Jambal (Syzygium cumini)749–1110–1211124.0921.61
Tecoma (Tecoma capensis)537–97–911112.3614.42
Gulmohar (Delonix regia)4416–1915–1810198.1015.99
Saton (Alstonia scholaris)278–108–1010112.9017.77
Taman (Lagerstroemia speciosa)2610–1212–149138.789.935
Peltophorum (Peltaphorum pterocarpum)2517–1910–121680.508.422
Spatodea (Spatodea companulata)2413–159–1113121.0810.28
Oval (Mimusops elengi)237–98–1011132.098.608
Palm (Dypsis lutescens)168–117–86124.3311.91
Musaenda (Mussaenda erythrophylla)154–66–71352.1544.947
Bottle Palm (Hyophorba lagenicaulis)138–124–5841.252.55
Bayo (Cassia fistula)139–125–67110.867.625
Rain tree (Samanea saman)1119–2325–306259.8323.56
Ritha (Sapindus mukorossi)95–78–106111.8324.76
Pithecellobium dulce (Inga dulcis)59–1214–153100.6711.72
Palas (Butea monosperma)47–107–8392.504.95
Avalo (Phyllantus emblica)37–95–6264.000
Chinch (Tamarindus indica)211–12152164.0011.31
Java cassia (Cassia javanica)178NMNM
Surang (Mammea suriga)199NMNM
Table 6. Details of the different tree species from Ambedkar Park, Panaji, Goa.
TreeNumberHeight (m; Range)Canopy Diameter (m; Range)Girth Circumference (cm)
nMean±SD
Peltophorum, P. pterocarpum18410–153–72281.676.64
Casuarina, Casuarina equisetifolia928–114–71395.2514.69
Ashoka tree, Polyalthia longifolia5210–123–5881.573.69
Bottle palm, Hyophorba lagenicaulis485–83–41042.402.99
Coconut palm, Cocos nucifera267–107–91298.175.97
Badam, Terminalia catappa267–108–1210102.808.40
Veni tree, Acacia ferruginea1211–157–10655.331.75
Rain tree, Samanea saman920–2220–244271.0035.35
Acacia, Acacia auriculiformis810–1211–145118.600.89
Bamboo, Phyllostachys pubescens78–107–1218 shoots38.223.04
Mango, Mangifera indica613–168–13672.673.56
Gulmohar, Delonix regia617–1925–304138.0018.20
Sandalwood, Santalum album232224.502.12
Table 7. Details of the different tree species from Joggers Park, Panaji, Goa.
TreeNumberHeight (m; Range)Canopy Diameter (m; Range)Girth Circumference (cm)
nMean±SD
Peltophorum, P. pterocarpum21312–153–71182.468.99
Coconut palm, Cocos nucifera485–117–91495.797.88
Beetlenut palm, Areca catechu426–1011–141034.673.74
Bottle palm (Hyophorba lagenicaulis)335–63–5667.335.79
Ashoka tree, Polyalthia longifolia)3210–122–3871.507.09
Palm, Dypsis lutescens123–104–98114.259.47
Casuarina, Casuarina equisetifolia107–104–61077.407.71
Badam, Terminalia catappa86–88–10540.602.07
Sandalwood Santalum album643629.002.83
Table 8. Regression equations for dependent (DWR) and independent variable (Canopy area) for calculating the daily water requirements.
Independent VariableDependent VariableRegression EquationR2
Mahavir Park
Mean CanopyDWR Oct–Jany = 236.42x − 622.420.8333
DWR Feb–Juny = 275.82x − 726.150.8333
Ambedkar Park
Mean CanopyDWR Oct–Jany = 469.32x − 2230.60.9417
DWR Feb–Juny = 547.55x − 2602.50.9417
Joggers Park
Mean CanopyDWR Oct–Jany = 20.306x + 3.52360.4358
DWR Feb–Juny = 23.69x + 4.11440.4358
Table 9. Compilation of different components of UGS in Panaji city.
ParametersPrimary Data from Seven Surveyed Parks #Data of DRW + Others
City area km221.60 *
UGS% in city area8.60 *
UGS area; km21.858 *
Hedge plants area (@12.72% of UGS, km2)83850.236
Groundcover area (@ 42.23% of UGS; km2)25,8600.784
Water used in UGS @ av. 2.6LPD (MLD)64,0002.66 *
Hedge DWR @ 6.77 L m−2 (MLD)56,766.451.599
Groundcover DWR @ 4.57 Lm−2 (MLD)118,180.23.585
Total DWR (MLD)107,945.65.184
% DRW shortage hedge + groundcover125,952.851.30
DRW @ for hedge + ground cover (MLD) $$0.1845.185
Trees’ area (28.97 ± 16.30% of UGS; km2)32,4460.538
Trees area in ha3.2553.82
No of trees [@ 1 tree in 8 (±13) m−2]488067,275
Average DRW/tree @ 23.87L (MLD)0.1171.606
Trees’ DRW % of available treated water15.25
Note(s): # Details of seven parks surveyed for this study are in Table 1, Table 3 and Table 4. * Data collected through informant questionnaire (officials). $$ Trees not watered presently in any UGS.
Disclaimer/Publisher’s Note: The statements, opinions and data contained in all publications are solely those of the individual author(s) and contributor(s) and not of MDPI and/or the editor(s). MDPI and/or the editor(s) disclaim responsibility for any injury to people or property resulting from any ideas, methods, instructions or products referred to in the content.

