Article

Spatio-Temporal Changes of Terrestrial Water Storage in Five Provinces of Northwest China from 2002 to 2022 and Their Driving Factors

by
Aimin Li
1,*,
Zekun Wu
2,*,
Meng Yin
1 and
Zhenqiang Guo
1
1
School of Geo-Science and Technology, Zhengzhou University, Zhengzhou 450001, China
2
TianDi (Changzhou) Automation Co., Ltd., Changzhou 213015, China
*
Authors to whom correspondence should be addressed.
Water 2025, 17(10), 1417; https://doi.org/10.3390/w17101417
Submission received: 3 April 2025 / Revised: 29 April 2025 / Accepted: 5 May 2025 / Published: 8 May 2025

Abstract

:
This study aims to explore the spatio-temporal changes in terrestrial water storage (TWS) in the five provinces of Northwest China and to assess the influences of various driving factors on the changes in TWS. Based on the Gravity Recovery and Climate Experiment (GRACE) satellite data of the five provinces from April 2002 to December 2022, combined with datasets of various driving factors (precipitation, evapotranspiration, runoff, and anthropogenic water use) from 1980 to 2022, a trend analysis was conducted using Sen’s slope method and Mann–Kendall (M-K) tests to characterize the spatial–temporal changes in TWS. The water balance method and quantification of contribution rates were used to analyze the spatio-temporal response of the change in TWS to driving factors and the contributions of driving factors thereto. The results showed that the eastern part of the Xinjiang Uygur Autonomous Region and the northern parts of Shaanxi Province and Ningxia Hui Autonomous Region belonged to the decreasing centers of TWS, while the northern part of the Qinghai–Tibet Plateau belonged to the enriching center of TWS, with a decreasing trend at a rate of 2.86 mm/yr. Precipitation contributed positively to the change in TWS and had a high spatio-temporal response, while the other driving factors (evapotranspiration, runoff, and anthropogenic water use) all contributed negatively to certain extents. The contribution rates of precipitation, evapotranspiration, runoff, and anthropogenic water use were 0.363, −0.265, −0.258 and −0.115, respectively. The results are helpful for the scientific planning and management of water resources in Northwest China.

1. Introduction

In recent years, research into regional water resources has become an important link in water environment treatment, with the frequent occurrence of extreme climatic events and increasingly stark contradictions between human water demand and water supply [1]. The five provinces of Northwest China, as a typical arid region of China [2], cover almost one-third of the territory of China. These provinces are core areas along the Silk Road, and their ecological environment has been impacted many times, triggering different levels of contradictions and conflicts regarding water resources [3]. Therefore, investigating and dynamically monitoring the terrestrial water storage (TWS) distribution and changes in the five provinces of Northwest China are key to the ecological governance and protection of the region.
The development of quantitative research on water storage has undergone significant advancements over the past twenty years. Early methods to estimate water storage were primarily based on hydrological station observations, which provided point-scale data on precipitation, soil moisture, and groundwater levels [4,5]. However, these stations only provide point-scale hydrological information, and large-scale TWS cannot be studied based on data collected from these stations; moreover, their data acquisition is limited, leading to incomplete spatio-temporal coverage. In such a context, various global land system models (LSMs) and global hydrology and water resources models (GHWRMs), including the ERA5, GLDAS, and FLDAS models, have been developed to simulate diverse hydrometeorological variables such as river discharge, soil water content, wind speed, temperature, precipitation, and runoff on a large scale and in long-term research on TWS [6]. While these models offer consistent spatial coverage, they are limited by inaccuracies in simulating water storage components due to model assumptions and uncertainties in input data.
The emergence of remote sensing technology has provided a suitable approach for monitoring large-scale changes in natural resources on the earth [7]. Surface water resources can be detected by extracting the cover areas of waters or glaciers from optical remote sensing images [8]. Rainfall intensity and soil water content can be measured using microwave remote sensors; because microwave sensors are unaffected by the weather, they can produce data pertaining to precipitation and soil humidity with high temporal resolution and are widely applicable to the monitoring of droughts, floods, and extreme weather events [9]. However, the soil water content in the root zone and groundwater storage, as main components of TWS, cannot be estimated based on optical or microwave sensors. In view of this, optical and microwave sensors both fail to obtain regional TWS changes. The Gravity Recovery and Climate Experiment (GRACE) double satellites launched in 2002 provide the global monthly terrestrial water storage abnormal (TWSA) by measuring changes in the earth’s gravitational field [10]. The TWSA includes anomalies for five TWS components, including snow water, canopy water, surface water, soil water, and groundwater. The GRACE TWSA can reveal large-scale overall changes in water storage and flux [11] and provides more direct estimates than global hydrological models and LSMs. The issued products of the GRACE TWSA include the Spherical Harmonics (SH) function and Mascon data [12].
The launch of the GRACE satellites has enabled the aforementioned global hydrological models to couple with LSMs through data assimilation based on the GRACE observations and then provide a determination of salient hydrometeorological variables. This has improved the simulation accuracy of hydrometeorological variables. Recent research in China and abroad on water storage mainly employed GRACE observations and relevant hydrometeorological variables as datasets to discuss their relationship. Recent studies have demonstrated the effectiveness of GRACE data in detecting groundwater depletion patterns in arid regions [2], while others have integrated GRACE with hydrological models like GLDAS to improve runoff simulations [3].
Ying et al. [13] studied the TWSA change trends of ten basins in China and their correlations with temperature, precipitation, and water usage. The TWSA in wet/semi-wet and semi-wet basins was found to increase, while that in arid and semi-arid basins declined. Jing et al. [8] discussed the response of TWS dynamics in the whole Lancang–Mekong River basin to climate change by quantifying the correlation between TWSA and multi-scale drought indices. The results evinced the difference in the response of TWS dynamics upstream and downstream of the basin to climate change and explored the influence possibility of human activities on the regional TWS. Anyah et al. [4] revealed the relationship between TWS changes and five global climate teleconnection indices using GRACE satellite data and the high-order statistical independent component correlation algorithm (ICA). Xiang et al. [14] analyzed the trend in TWS over the Qinghai–Tibet Plateau in the past 20 years, which was improved by adding post-processing filtering after combining the Mascon and SH-inversion solutions, thus obtaining more reliable TWS data. On the basis of the monthly TWSA data in the GRACE-Fo satellite data, Xiao et al. [15] proposed a linear regression interpolation of daily TWSA data and reconstructed the TWSA, combining it with data of the land data assimilation system. They found that the TWSA increased by 437.7 mm under the one-week extreme precipitation in northern Henan Province in July 2021, demonstrating the near-real-time flood monitoring capacity of GRACE-Fo. Based on the water balance method and TWSA data, Gao et al. [6] employed the phased statistical downscaling model to construct a groundwater storage anomaly dataset for the Qinghai–Tibet Plateau with 0.1° resolution. They also used a regression function to construct and analyze the downscaling data.
Previous GRACE-based studies have significantly advanced our understanding of terrestrial water storage (TWS) dynamics in arid Northwest China. Guo et al. and Mo et al. [16,17] demonstrated severe water depletion in this region, with groundwater storage declining at 7.79 mm/yr during 2003–2016, particularly highlighting the northwestern provinces as the most affected area. These studies linked TWS variations to climate drivers (precipitation and evapotranspiration) and anthropogenic pressures using GRACE data coupled with GLDAS hydrological variables. However, critical limitations persist: (1) spatial analyses remain fragmented, focusing on individual provinces (e.g., Xinjiang) or basins (e.g., Tarim) rather than systematically comparing subregional patterns across the entire northwestern territory; (2) temporal coverage is constrained to ≤15 years (2003–2019 and 2003–2013), which is insufficient to resolve decadal trends under accelerating climate change; (3) human impacts are often qualitatively described rather than quantitatively partitioned from climatic influences, especially regarding spatial heterogeneity in driving mechanisms.
This study addresses critical knowledge gaps through an integrated analysis framework that synergizes three key advances: (1) leveraging the full 21-year GRACE/GRACE-FO Mascon record (2002–2022) combined with extended hydrological observations (1980–2022), we establish the most temporally comprehensive TWS assessment for Northwest China to date, capturing multi-decadal trends across distinct hydroclimatic phases; (2) implementing a provincial-scale diagnostic approach that couples Sen–MK trend detection with water balance modeling to quantitatively partition climatic (precipitation, evapotranspiration, and runoff) and anthropogenic contributions to TWS dynamics; (3) revealing previously unrecognized spatial divergences in hydrological resilience through the identification of contrasting TWS enrichment cores (northern Qinghai–Tibet Plateau) and depletion hotspots (Junggar–Tarim Basins, Loess Plateau). This multiscale perspective—temporal (multi-decadal trends), spatial (provincial-to-basin gradients), and systemic (climate–human interactions)—provides novel insights for adaptive water governance across Northwest China’s arid landscapes.

2. Data and Methods

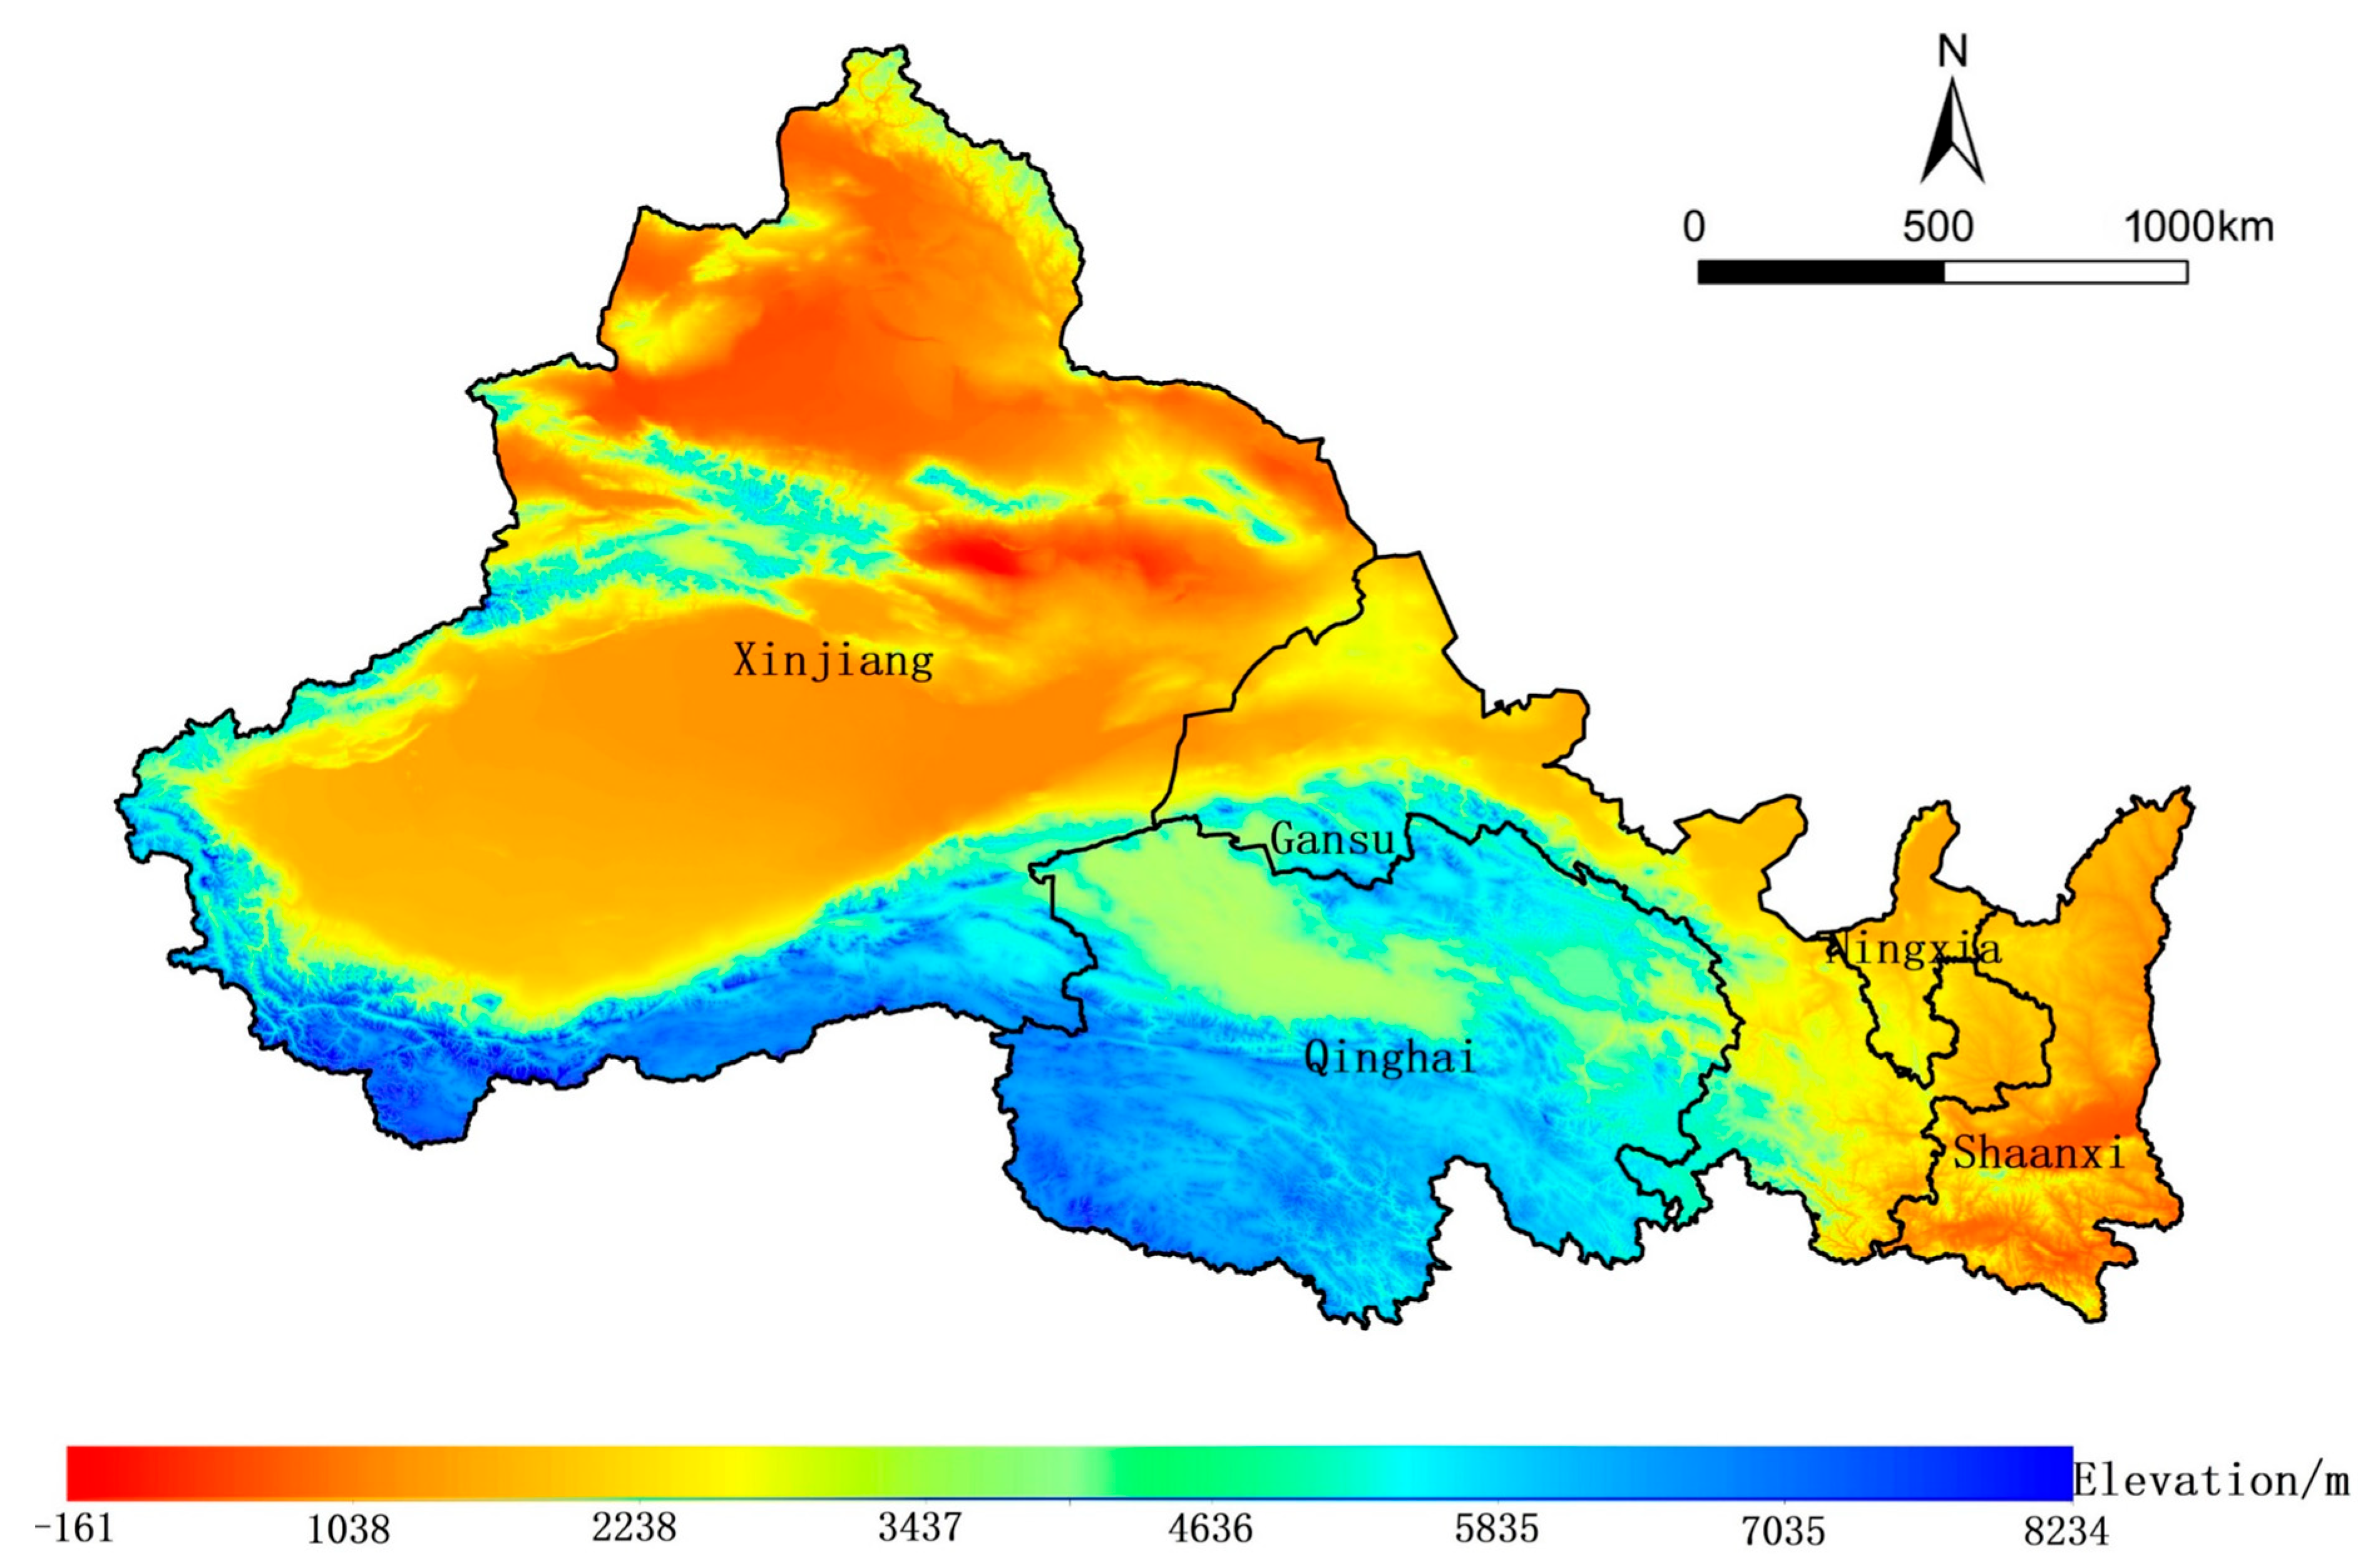
2.1. Research Region

The five provinces of Northwest China are the Xinjiang Uygur Autonomous Region, Ningxia Hui Autonomous Region, Qinghai Province, Gansu Province, and Shaanxi Province, which totally cover an area of 3.10 × 10⁶ km2, about one third of the territory of China [18]. As shown in Figure 1, the research region differs greatly in altitude and is generally high, mainly containing plateaus, mountains, and basins. In the region, multiple plateaus converge, and mountains and basins are distributed alternately. The climate in the region is characterized by cold and dry springs and winters with sandstorms driven by strong winds and hot and rainless summers and autumns. Owing to the inland Eurasian location and blockage of wet streams by the Qinghai–Tibet Plateau, most of the research region is within the temperate continental climatic and temperate monsoon climatic regions, with small areas under the control of a warm temperate continental monsoon climate [19]. The precipitation in the region is affected by factors including the geological location and altitude, showing a spatial pattern that declines from the southeast to the northwest as a whole. The five provinces of Northwest China are distributed in the Yellow, Yangtze, Lancang, Tarim, and Eerqisi River basins. The average annual TWS in the Xinjiang Uygur Autonomous Region, Ningxia Hui Autonomous Region, Qinghai Province, Gansu Province, and Shaanxi Province is 79.904 billion m3, 0.714 billion m3, 58.954 billion m3, 32.094 billion m3, and 42.328 billion m3, respectively, which account for 7.79% of the national TWS collectively. Obviously, the total TWS in the region is far from enough, considering the regional area. With the sparse population density in these five provinces, the per capita water availability in the region is only 80.81% of the national level [20].

2.2. Data

2.2.1. GRACE Satellite Data

RL06 data from the Center for Space Research (CSR), namely CSR GRACE/GRACE-FO RL06 Mascon Solutions (Version 02), were selected. The products are shown as TWSA data, that is, the result of subtracting the average values in 2004–2009 from the height of TWS per unit area, of which the spatial resolution is 0.25° and temporal resolution is at the monthly scale. The TWS of the five provinces of Northwest China in 2002–2022 was selected as the experimental data. Due to the maintenance, short design life, and interval between launches of the GRACE/GRACE-FO double satellites, some data are missing. For data missing in a single month, the average values in the same months in two years before and after that year were taken. With regard to missing long-term data, the autoregressive moving average (ARMA) model [21] was adopted to process long-term omissions in non-linear time series. To acquire the accurate TWS changes (both rate and trend), the data need to be read, their outliers must be calculated, and they must be processed by using Sen’s slope method [22] and Mann–Kendall (M-K) trend tests so as to obtain the rate of change and the trend of TWS.

2.2.2. Monthly Precipitation Dataset

Products of the monthly precipitation dataset with a resolution of 1 km from the Climatic Data Center of China Meteorological Administration (http://www.geodata.cn) were selected. Using data collected by the national-level ground-based meteorological stations and taking DEM data as covariates, the nationwide monthly precipitation data with a resolution of 1 km were generated via thin-plate spline interpolation (ANUSPLIN v4.4). Precipitation data in the five provinces of Northwest China in 1980–2022 were selected as experimental data. The downscaling method was adopted to match the spatial resolution of data with that of GRACE satellite data. The downscaling method was realized via resampling in ArcGIS Pro 3.4 (https://pro.arcgis.com/) In terms of parameter selection, cubic convolution was adopted, and the size of the target pixels was set to 0.25°. The same processing procedure as used for the GRACE satellite data was utilized in data reading and analysis herein.

2.2.3. Runoff and Evapotranspiration Data

The global land surface data assimilation system (GLDAS) jointly developed by the NASA Goddard Space Flight Center and National Oceanic Atmospheric Administration (NOAA) Center for Environmental Prediction can drive four different LSMs (CLM, NOAH, MOS, and VIC) and combine them with satellite data to generate 22 different land hydrological variables, including radiation flux, geothermal flux, evapotranspiration, surface pressure, and temperature [16]. This research selected the runoff and evapotranspiration data products in the GLDAS-NOAH LSM Version 1 (https://earthdata.nasa.gov/). The runoff and evapotranspiration products of the five provinces of Northwest China from 1980–2022 with the same spatio-temporal resolution as the GRACE satellite data were selected, of which the processing procedure matching that used on the GRACE satellite data was subsequently used.

2.2.4. Actual Total Anthropogenic Water Consumption

The WaterGAP hydrological model [23] can quantify human use of groundwater and surface water. Through analog computation and the simulation of water stress indices, a global water use model was established based on the model. In the research, the WaterGAP v2.2d hydrological model was selected, in which datasets of water used for irrigation, animal husbandry, human consumption, and manufacturing in these five provinces from 1980 to 2016 were used. Through summation, the actual total anthropogenic water consumption was obtained. After registration of the products with the spatio-temporal resolution of GRACE satellite data, the same processing procedure as used for the GRACE satellite data was subsequently used.

2.3. Methods

Figure 2 illustrates the multistage analytical framework for quantifying terrestrial water storage (TWS) dynamics and their drivers in Northwest China. The workflow integrates four parallel data streams:
(1)
GRACE/GRACE-FO Mascon solutions (Level-3 RL06) processed through an autoregressive moving average (ARMA) model to interpolate mission gaps (July 2017–May 2018), followed by Sen’s slope and Mann–Kendall trend analysis;
(2)
High-resolution precipitation data from the China Meteorological Science Data Center, spatially downscaled from station observations to a 0.25° grid via Kriging interpolation without in situ calibration;
(3)
The Kriging interpolation method for the evapotranspiration and runoff output of GLDA-NOAH v2.1;
(4)
Anthropogenic water consumption from WaterGAP v2.2d, regridded to 0.25°.
All datasets were harmonized to a common 0.25° × 0.25° grid and monthly temporal resolution. The water balance method was applied to quantify the contributions of climatic (P − E − R) and human activity (H) components to TWS anomalies via the mass balance equation: ΔTWS = P − E − R − H.
Figure 2. Technical route.
Water 17 01417 g002

2.3.1. ARMA Model

The ARMA model [21], as an important method used to process time series, is composed of an autoregressive model and a moving average model. In hydrometeorological research, the ARMA model is generally used to predict datasets with seasonal variation and fill in missing values. Gap filling proceeded in three stages: (1) pre-whitening—removed seasonal cycles using harmonic regression [24] to isolate interannual signals; (2) parameter calibration—trained ARMA coefficients on continuous GRACE segments (≥24 consecutive months) with synthetic gaps inserted; (3) uncertainty propagation—estimated filled-data errors via Monte Carlo simulations incorporating residual autocorrelation.
The model is expressed as follows:
x t = μ + a t θ 1 a t 1 θ q a t q
where x t is the missing TWS in the t-th month; μ denotes the initial missing value obtained using the regressive model; a represents the influencing factor; and θ is the influencing coefficient.

2.3.2. Sen’s Slope Method and M-K Trend Tests

Compared with the linear regression method and its significance tests commonly used for the time series analysis of long-term meteorological data, Sen’s slope method and M-K trend tests have the following advantages: one is the applicability to time series with data missing or outliers and the other is the ability to study the trend and level of significance of non-linear series better.
Sen’s slope method [22] constructs a rank sequence according to the variability in samples of different lengths and then carries out statistical tests based on a certain significance level α , thus obtaining the value range of variability (range of slopes) and judging the change trend and degree of time series according to the median. Sen’s slope method can reduce or avoid the influences of data that are missing or abnormal in the statistical results. The Sen’s slope is calculated thus:
S e n i j = M E D I A N ( x j x i ) ( j i )
where S e n i j is Sen’s slope; x j and x i are sequence values at the j -th and i -th moments ( 1 < i < j < n ); and n is the sequence length. Finally, Sen’s slope, namely, the median of slope, is ascertained by the odevity of the sum N of S e n i j determined by the sequence length n:
N = n ( n 1 )
S e n = S e n k + 1                                                 N = 2 k + 1 S e n k + S e n k + 1 / 2                       N = 2 k
where k is an integer related to the sequence length.
The main advantages of M-K trend tests [16] include being free from the influence of outliers, a wide detection range, and high applicability to the significance analysis and judgment of the trend of time series with outliers. In hydrological analyses, Sen’s slope is generally used to estimate the slope of series, and M-K trend tests are conducted at the same time to judge the significance of the temporal trend. The statistic S in the M-K trend tests is calculated using the following formula:
S = i = 1 n 1 j = i + 1 n s i g n ( x j x i )
where x i and x j are the values at the i -th and j -th moments; n is the length of the data series; and s i g n ( ) is a sign function, solved as follows:
s i g n ( x j x i ) = 1 ,                 x j x i > 0   0 ,                 x j x i = 0     1 ,           x j x i < 0        
S approximately follows the normal distribution, of which the average value is 0 and the variance is
V a r x = n ( n 1 ) ( 2 n + 5 ) i = 1 m t i ( t i 1 ) ( 2 t i + 5 ) 18
where m is the number of groups with the same series and t i is the amount of data with the same value in the i -th group. If n > 10 , the value of statistical testing Z is calculated as follows:
Z = S 1 ( V a r s ) 1 / 2 ,                             S > 0   0                               ,                           S = 0     S + 1 ( V a r s ) 1 / 2 ,                             S < 0      
Significance tests are performed based on the value of Z. Z > 0 and Z < 0 separately represent the ascending and descending trends of series. At the significance level of 0.1 , Z > 1.65 implies the rejection of the null hypothesis, which indicates a significance in the trend of series; at the significance level of 0.05 , Z > 1.96 implies the rejection of the null hypothesis, which indicates significance in the trend; and at the significance level of 0.01 , Z > 2.58 implies the rejection of the null hypothesis, suggesting significance in the trend. In the present research, a significance level p of 0.05 and a critical value of standard statistics of 1.96 were selected for trend analysis.

2.3.3. Water Balance Method

This research assumes that the average values of long-term precipitation, evapotranspiration, runoff, and anthropogenic water consumption are equilibrium values, namely, Δ T W S = 0 . Based on this assumption, the average and equilibrium values of precipitation, evapotranspiration, runoff, and anthropogenic water consumption in the research period are compared, thus obtaining contributions of various hydrological fluxes, including the precipitation to the change in T W S [25]:
Δ T W S = P E R H
where Δ T W S is the TWS change in the period of interest, that is, Sen’s slope of the TWS, and P , E , R , and H separately represent the precipitation, evapotranspiration, runoff, and anthropogenic water consumption.

2.3.4. Natural Breakpoint Method

The natural breakpoint method [26], as a common classification method, is a univariate classification method based on clustering analysis. It minimizes intra-class differences while maximizing inter-class differences by calculating inter-class data breakpoints under a certain number of grades. This method was selected here for classification due to its advantage of differentiating similar values of data. The differences in TWS change trends with various hydrological fluxes calculated using the water balance method were classified using the natural breakpoint method, which better analyzes the spatial responses of the TWS change trend to various hydrological fluxes.

2.3.5. Quantification of Contributions

The changes in TWS are a result of the joint action of human activities and climate change. The contributions of various hydrological fluxes to changes in TWS in the region can be quantified using the formula below [13]:
α p r e c = Δ T W S p r e c Δ T W S p r e c + Δ T W S e v a p + Δ T W S r o n f + Δ T W S h u m a × 100 %
α e v a p = Δ T W S e v a p Δ T W S p r e c + Δ T W S e v a p + Δ T W S r o n f + Δ T W S h u m a × 100 %
α r o n f = Δ T W S r o n f Δ T W S p r e c + Δ T W S e v a p + Δ T W S r o n f + Δ T W S h u m a × 100 %
α h u m a = Δ T W S h u m a Δ T W S p r e c + Δ T W S e v a p + Δ T W S r o n f + Δ T W S h u m a × 100 %
where Δ T W S p r e c , Δ T W S e v a p , Δ T W S r o n f , and Δ T W S h u m a represent differences in precipitation, evapotranspiration, runoff, and anthropogenic water consumption values in the research period with their long-term equilibrium values, respectively, and α p r e c , α e v a p , α r o n f , and α h u m a separately denote the contribution rates of precipitation, evapotranspiration, runoff, and anthropogenic water consumption to changes in TWS in the five provinces of Northwest China. A positive contribution rate suggests a positive influence on the regional TWS changes. Because precipitation is an inflow term of the TWS, the initial value of Equation (10) in Section 2.3.5 is positive; considering that evapotranspiration, runoff, and anthropogenic water consumption are outflow terms of the TWS, the initial values of Equations (11)–(13) are negative.

3. Results and Analysis

3.1. Spatio-Temporal Analysis of TWS Trends

The spatio-temporal changes in TWS in the five provinces of Northwest China obtained by processing GRACE datasets are shown in Figure 3. The spatial distribution analysis indicated that TWS predominantly declined across the five provinces. Classified using the natural breaks method, pronounced depletion centers were primarily observed in central Xinjiang (Junggar Basin, Tianshan Mountains, and northern Tarim Basin) and the Loess Plateau regions of northern Shaanxi and Ningxia. In contrast, notable enrichment zones occurred in southeastern Xinjiang and western Qinghai, corresponding to the northern Qinghai–Tibet Plateau. Observations of time series show that TWSs periodically persistently and significantly declined, along with fluctuations. The amplitudes were stable from 2002 to 2012 and TWS was high; the maximum amplitude in the research period appeared in 2012–2015; and the amplitude was low while TWS decreased significantly in the subsequent period. The results show that the TWS per unit area in the research region decreased at 2.86 mm/yr. Through the conversion of water volumes, the water resource depletion rate was 8.805 Gt/yr. When benchmarked against the West Lake with a water volume of 14 million tons, the water loss each year from the five provinces was equivalent to 629 West Lakes. Considering the limited water resources in Northwest China, this is a rather high rate of reduction.

3.2. Spatio-Temporal Analysis of Driving Factors

Datasets of hydrologic fluxes related to TWS were selected. After data processing, changes in the average values of these hydrologic fluxes in the research period relative to the long-term (assuming from 1980 to 2022) equilibrium values (obtained by water balance analysis) were determined, thus judging the spatio-temporal response trends of each hydrologic flux to TWS.

3.2.1. Precipitation

Precipitation, as the most important inflow source of water among the hydrological fluxes, can directly influence the enrichment of or reduction in the regional TWS [27]. Figure 4 depicts the difference in average annual precipitation between the study period (2002–2022) and the long-term period (1980–2022) in the research region. The spatial distribution shows that the precipitation tended to increase in most areas, which indicates that this factor positively contributed to the change in TWS in the whole region. Combined with the grading, precipitation decreased significantly in Junggar Basin and the northern part of the Tarim Basin in the Xinjiang Uygur Autonomous Region and the Loess Plateau in the northern part of the Ningxia Hui Autonomous Region, showing strong spatial responses to the decreasing areas of TWS. The rising precipitation in the northern part of the Qinghai–Tibet Plateau was correlated with the enriching area of TWS. The increasing precipitation in the Tianshan Mountains and the Loess Plateau in the northern part of Shaanxi Province showed a strong contrast to the reduction in TWS, which means that precipitation was not the main factor for the TWS change in the region. The response relationship between precipitation and TWS was also judged based on the time series data, and their extremes were compared. The maximum precipitations in 2003, 2005, 2007, 2018, and 2019 were correlated with the maximum TWS in the corresponding years, which indicates that increasing precipitation in these years caused the enrichment of TWS. The minimum precipitation in 2006, 2015, and 2022 corresponded to minimum TWS in the corresponding years, implying that the reduction in precipitation caused decreased TWS. On the whole, precipitation in the research period was positively driven by 9.99 mm/yr compared with the long-term equilibrium value, which conforms to the northwestern warming and humidification effect [28] found in many other recent studies.

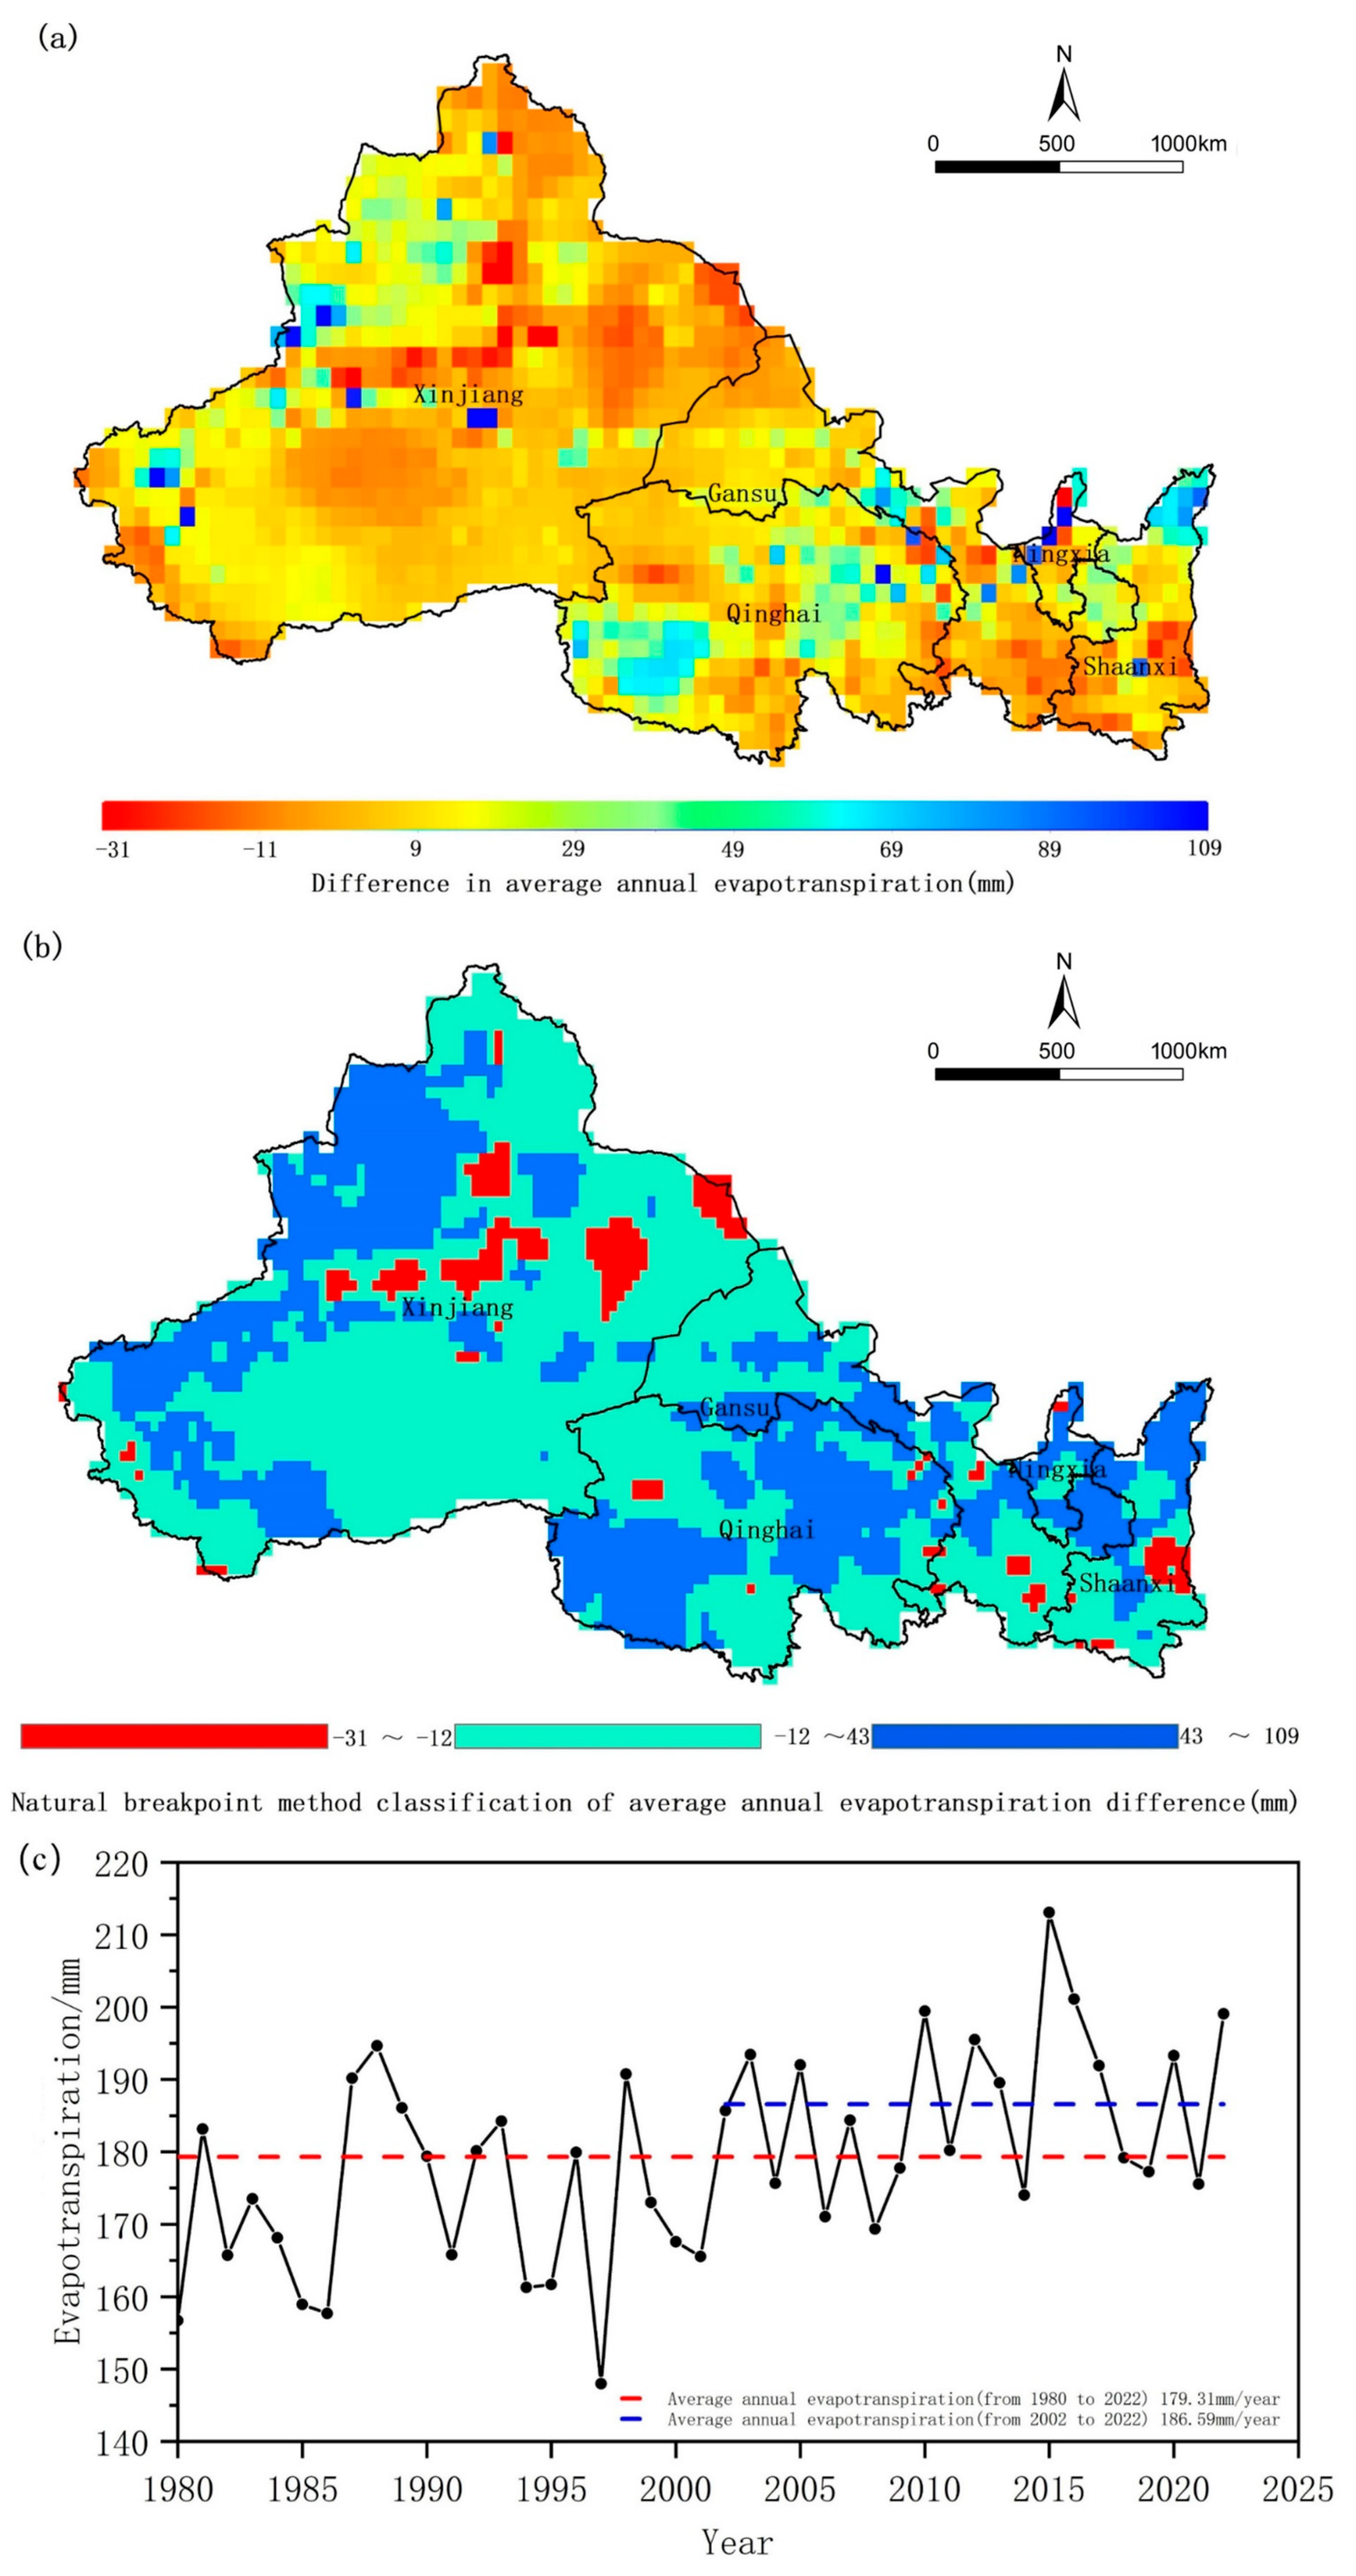
3.2.2. Evapotranspiration

Compared with precipitation, evapotranspiration is the largest outflow term in water circulation. Figure 5 shows the difference in the average annual evapotranspiration in the research region in 2002–2022 with that in 1980–2022. It can be seen from the spatial distribution that the differences in most areas are positive; that is, evapotranspiration exerted a negative influence on the change in TWS in the research period. According to the classification results and combining this with the trend in TWS, it is judged that evapotranspiration has positive anomalies in some areas in the center of the Xinjiang Uygur Autonomous Region and the Loess Plateau in the northern parts of Shaanxi Province and the Ningxia Hui Autonomous Region, which responds to the decreasing area of TWS. The positive anomalies in specific areas of the northern Qinghai–Tibet Plateau exhibit an inverse spatial correlation with TWS enrichment patterns, indicating that precipitation served as the dominant driver of TWS changes in these regions. Furthermore, the temporal analysis reveals that evapotranspiration increased substantially during the study period compared to earlier baselines, frequently reaching historical maxima. These evapotranspiration peaks were closely synchronized with observed TWS depletion phases, highlighting their critical role in water storage dynamics.
The comparison with the TWS time series data shows that the strong evapotranspiration in 2012, 2015, and 2022 highly responded to the decrease in TWS, whereas the time period with low evapotranspiration is near the line of the long-term equilibrium value. The analysis based on the water balance method reveals that in this time period, evapotranspiration did not exhibit strong temporal responses to the change in TWS. The comparison of the average and equilibrium values shows that evapotranspiration increased by 7.28 mm/yr over the period considered, which means that evapotranspiration becomes one of the main driving factors of the TWS reduction.

3.2.3. Runoff

Runoff is an important outflow term in water circulation. Figure 6 displays the difference in the average annual runoff in the research region in 2002–2022 compared to that in 1980–2022. It can be judged from the spatial distribution that the runoff in most areas of these five provinces tended to increase; that is, it negatively contributed to the change in TWS. The analysis reveals pronounced spatial coherence between runoff anomalies and TWS dynamics. Significant positive runoff anomalies in central Xinjiang and the Loess Plateau (northern Shaanxi and Ningxia) demonstrate strong coupling with regional TWS depletion patterns. Notably, similar to the spatial pattern of evapotranspiration, the runoff anomalies in the northern Qinghai–Tibet Plateau exhibit an inverse relationship with observed TWS increases, thereby confirming precipitation as the primary driver of TWS enhancement in this high-altitude zone.
Observations of the time series show that a situation similar to the precipitation series occurred: runoff increased significantly in the research period, and it oscillated more than before. With regard to the responses to the TWS time series, the runoff extreme in 2010–2011 did not respond to the TWS change in the same time period. Observations also show that evapotranspiration was relatively stable (approximate to the equilibrium value), while the precipitation increased significantly in the same time period. This finding indicates that the TWS change in this time period was positively influenced by precipitation while being negatively affected by runoff, and then it was relatively stable, while the runoff responded to the TWS again in 2022. The comparison of the average and equilibrium values shows that the runoff increased by 7.09 mm/yr over the years. The comprehensive analysis reveals that despite the comparable changes, such as those in evapotranspiration in terms of values, the runoff did not respond as strongly as precipitation and evapotranspiration.

3.2.4. Anthropogenic Water Consumption

The actual total anthropogenic water consumption has grown in recent years with the economic development and massive increase in population density, so it has become a key outflow index in water circulation. Figure 7 shows the time series of average annual anthropogenic water consumption in the five provinces of Northwest China. The data are derived from the WaterGAP v2.2d hydrological model from 1980–2016. Compared with the above factors, anthropogenic water consumption does not differ greatly in the amplitude value, and the maximum amplitude was only 7 mm in the research period. Therefore, it is not necessary to discuss spatial distributions of difference in this hydrologic flux and its spatial responses to the TWS. Whereas, according to the time series of the factor, anthropogenic water consumption ascended in a stepped manner at 3.16 mm/yr in the research period. This indicates that anthropogenic water consumption is becoming a factor that cannot be ignored in terms of its influence on the change in TWS.

3.3. Quantification of Contributions of Driving Factors

The contribution rates of various driving factors (precipitation, evapotranspiration, runoff, and anthropogenic water consumption) in 2002–2022 were calculated using Equations (10)–(13) to give the contribution rate as per Section 2.3.5. As displayed in Figure 8, because the anthropogenic water consumption dataset in WaterGAP was only updated to 2016, only contribution rates of other factors in the subsequent research period were calculated. Among various factors, precipitation was found to contribute most substantially to the TWS; this factor always drove the enrichment of TWS in most time periods except for some years. Evapotranspiration and runoff were the main factors for the reduction in TWS in the region in most years. Although the contribution rate of anthropogenic water consumption was not as high as other factors above in each year, it always showed a stable negative contribution rate. The long-term contribution rates of the four driving factors are separately 0.363, −0.265, −0.258, and −0.115, which means that precipitation is still the most powerful driving factor for the TWS, which enriches the TWS, while other factors all contribute negatively to different extents.

4. Discussion

At present, the analysis of changes in TWS based on GRACE satellite data has been widely adopted in research of many regions. Integrating datasets of multiple driving factors on the basis of TWS to explore the cause of TWS changes and driving effects of factors has become the main research direction at present [29,30]. This provides a scientific reference and basis for protecting and utilizing water resources, revealing the cause of water shortages, and proposing improvement measures in typical regions.

4.1. Evaluation of Causes for TWS Changes in Characteristic Regions

The northern part of the Qinghai–Tibet Plateau, as the enriching center of TWS, is generally regarded as a hot region in any discussion of the driving mechanism and effect of TWS enrichment. Many studies have shown that it is precipitation that causes TWS enrichment in the region [24], which agrees with the results in the current research. Considering the particularity of the Qinghai–Tibet Plateau, numerous studies have discussed the foundational cause for the TWS enrichment in the region, starting from glacial meltwater, snow, and global warming. The research fails to explore the root cause, while the increased evapotranspiration in the northern part of the Qinghai–Tibet Plateau also explains the effect of global warming on the TWS from another perspective. However, in the research period, the factor with the maximum weight that dominated the TWS change remained precipitation, of which the positive driving effect was stronger than the negative effects of evapotranspiration and runoff resulting from the rising temperature.
The TWS decreased in the center of the Xinjiang Uygur Autonomous Region and the Loess Plateau in the northern parts of Shaanxi Province and the Ningxia Hui Autonomous Region. In related research, some researchers used terrain as a factor to classify and study mountains in the Xinjiang Uygur Autonomous Region, by which it was concluded that precipitation plays a leading role in the reduction of TWS, and the effect is hysteretic [31], which agrees with results of the current research. The difference is that the current research also found on the basis of previous research that evapotranspiration and runoff also drove the reduction in TWS in the center of the Xinjiang Uygur Autonomous Region; in the Loess Plateau, it was large-scale revegetation that resulted in increased water consumption, decreased runoff, aridity [32], and finally reduced TWS. Similarly, this can be further verified in this research, particularly when evapotranspiration is taken as the benchmark.

4.2. Evaluation of Contributions of Driving Factors

The quantification process of contribution rates is based on the water balance equation. Most research takes the variability of driving factors as the index [33], which although the rough changes in driving factors can be characterized, data show low confidence in the quantitative analysis. On this basis, we extended the years of data pertaining to driving factors, used the difference between average and equilibrium values to quantify changes in driving factors, and utilized more scientific data for quantitative analysis. Moreover, the results of contribution rates of driving factors are consistent with the cause for TWS changes in the characteristic regions. This demonstrates that TWS in the study area is primarily driven by precipitation, while evapotranspiration and runoff serve as the principal outflow mechanisms. Although the progressive rise in anthropogenic water consumption has not yet emerged as the dominant driver of TWS depletion under current conditions, its growing influence—driven by accelerating industrialization and urbanization—is expected to intensify significantly. Projections suggest that human-induced water extraction will likely transition from a secondary contributor to a critical stressor in future hydrological regimes, necessitating proactive integration into water resource management frameworks.

5. Conclusions

This study systematically reveals the spatio-temporal evolution of terrestrial water storage (TWS) and its driving mechanisms across Northwest China’s five provinces during 2002–2022. The key innovation lies in leveraging the full 21-year GRACE/GRACE-FO observational record—the longer continuous TWS dataset currently available for this arid region—which enables the robust detection of multi-decadal hydrological trends through Sen–MK analysis. Our long-term perspective identifies previously underappreciated climate–human synergies. Methodologically, we advance human impact quantification by integrating WaterGAP’s high-resolution consumptive use estimates with water balance modeling, finding spatial heterogeneity in anthropogenic contributions. The following conclusions can be drawn:
(1)
TWS in most areas of the five provinces of Northwest China showed a decreasing spatial pattern. The decreasing centers were mainly located at the center of the Xinjiang Uygur Autonomous Region and the Loess Plateau in the northern parts of Shaanxi Province and the Ningxia Hui Autonomous Region, while the enriching center is concentrated at the northern part of Qinghai–Tibet Plateau. With regard to the temporal pattern, the regional TWS demonstrated a periodically persistent and significantly decreasing trend, along with fluctuations, and the reduction rate per unit area in the research region was 2.86 mm/yr.
(2)
Precipitation responded consistently to the TWS change in spatial and temporal dimensions in the same time period. According to a water balance analysis, precipitation exerted a positive driving effect of 9.99 mm/yr over the years. Evapotranspiration responded to the spatial TWS change in the center of the Xinjiang Uygur Autonomous Region and the Loess Plateau in the northern parts of Shaanxi Province and the Ningxia Hui Autonomous Region, and its time series increased at 7.28 mm/yr over the years, so evapotranspiration became an important factor that dominated the reduction in WTS. Runoff was similar to evapotranspiration in terms of the spatial responses, and it increased at 7.09 mm/yr over the years, while the magnitude of the response of its time series was lower than that of precipitation and evapotranspiration. The time series of anthropogenic water consumption rose in a step-wise manner at 3.16 mm/yr, and anthropogenic water consumption is becoming an important factor for the change in TWS.
(3)
Precipitation positively and most greatly contributed to the TWS changes in most years. Runoff and evapotranspiration always had a negative contribution except for a few years; despite the lower contribution than the above factors, anthropogenic water consumption exhibited a stable negative contribution. The contribution rates of precipitation, evapotranspiration, runoff, and anthropogenic water consumption over the years were 0.363, −0.265, −0.258, and −0.115, respectively.
This study achieved a systematic attribution analysis of terrestrial water storage (TWS) changes in the five northwestern provinces of China by integrating long-term GRACE satellite observations with multi-source hydrological cycle components. The framework revealed distinct spatial patterns of TWS enrichment zones and arid depletion hotspots and established a driving factor contribution model based on the water balance principle. However, a critical limitation remains: the lack of ground-based validation for regional applicability of WaterGAP human water use data and GLDAS hydrological variables may introduce uncertainties in anthropogenic impact assessments, particularly in hyper-arid regions. Future research should prioritize the validation of model parameters through groundwater monitoring networks and a couple of land surface process models to unravel the multi-factor synergistic effects on water storage dynamics.

Author Contributions

Formal analysis, Z.W. and Z.G.; Investigation, Z.W. and M.Y.; Data curation, M.Y.; Project administration, A.L.; Funding acquisition, A.L. All authors have read and agreed to the published version of the manuscript.

Funding

The work is supported by the Natural Science Foundation project of Henan Province (Grant no. 242300421372) and the key scientific research project of Higher Education Institutions in Henan Province (Grant no. 24B170010).

Data Availability Statement

The original contributions presented in this study are included in the article.

Conflicts of Interest

Zekun Wu is employed by TianDi (Changzhou) Automation Co., Ltd. The remaining authors declare that the research was conducted in the absence of any commercial or financial relationships that could be construed as a potential conflict of interest.

References

  1. Rodell, M.; Famiglietti, J.S.; Wiese, D.N.; Reager, J.T.; Beaudoing, H.K.; Landerer, F.W.; Lo, M.-H. Emerging trends in global freshwater availability. Nature 2018, 557, 651–659. [Google Scholar] [CrossRef] [PubMed]
  2. Ahamed, A.; Knight, R.; Alam, S.; Pauloo, R.; Melton, F. Assessing the utility of remote sensing data to accurately estimate changes in groundwater storage. Sci. Total Environ. 2022, 807, 150635. [Google Scholar] [CrossRef] [PubMed]
  3. Albarakat, R.; Le, M.-H.; Lakshmi, V. Assessment of drought conditions over Iraqi transboundary rivers using FLDAS and satellite datasets. J. Hydrol. Reg. Stud. 2022, 41, 101075. [Google Scholar] [CrossRef]
  4. Anyah, R.O.; Forootan, E.; Awange, J.L.; Khaki, M. Understanding linkages between global climate indices and terrestrial water storage changes over Africa using GRACE products. Sci. Total Environ. 2018, 635, 1405–1416. [Google Scholar] [CrossRef]
  5. Deng, H.; Chen, Y.; Chen, X. Driving factors and changes in components of terrestrial water storage in the endorheic Tibetan Plateau. J. Hydrol. 2022, 612, 128225. [Google Scholar] [CrossRef]
  6. Gao, G.; Zhao, J.; Wang, J.; Zhao, G.; Chen, J.; Li, Z. Spatiotemporal Variation and Driving Analysis of Groundwater in the Tibetan Plateau Based on GRACE Downscaling Data. Water 2022, 14, 3302. [Google Scholar] [CrossRef]
  7. Immerzeel, W.; Droogers, P.; de Jong, S.; Bierkens, M. Large-scale monitoring of snow cover and runoff simulation in Himalayan river basins using remote sensing. Remote Sens. Environ. 2009, 113, 40–49. [Google Scholar] [CrossRef]
  8. Jing, W.; Zhao, X.; Yao, L.; Jiang, H.; Xu, J.; Yang, J.; Li, Y. Variations in terrestrial water storage in the Lancang-Mekong river basin from GRACE solutions and land surface model. J. Hydrol. 2020, 580, 124258. [Google Scholar] [CrossRef]
  9. Neves, M.C.; Nunes, L.M.; Monteiro, J.P. Evaluation of GRACE data for water resource management in Iberia: A case study of groundwater storage monitoring in the Algarve region. J. Hydrol. Reg. Stud. 2020, 32, 100734. [Google Scholar] [CrossRef]
  10. Schmied, H.M.; Cáceres, D.; Eisner, S.; Flörke, M.; Herbert, C.; Niemann, C.; Peiris, T.A.; Popat, E.; Portmann, F.T.; Reinecke, R.; et al. The global water resources and use model WaterGAP v2.2d: Model description and evaluation. Geosci. Model Dev. 2021, 14, 1037–1079. [Google Scholar] [CrossRef]
  11. Panday, D.P.; Kumar, M. Application of remote sensing techniques to deal with scale aspects of GRACE data to quantify groundwater levels. MethodsX 2023, 10, 102108. [Google Scholar] [CrossRef] [PubMed]
  12. Tucker, C.J. Remote sensing of leaf water content in the near infrared. Remote Sens. Environ. 1980, 10, 23–32. [Google Scholar] [CrossRef]
  13. Ying, M. Research on the Impact of Climate Change and Human Activities on the Variation of Land Water Storage in China. J. North China Univ. Water Resour. Electr. Power 2021, 42, 47–57. [Google Scholar]
  14. Xiang, L.; Wang, H.; Steffen, H.; Jiang, L.; Shen, Q.; Jia, L.; Su, Z.; Wang, W.; Deng, F.; Qiao, B.; et al. Two Decades of Terrestrial Water Storage Changes in the Tibetan Plateau and Its Surroundings Revealed through GRACE/GRACE-FO. Remote Sens. 2023, 15, 3505. [Google Scholar] [CrossRef]
  15. Xiao, C.; Zhong, Y.; Feng, W.; Gao, W.; Wang, Z.; Zhong, M.; Ji, B. Monitoring the Catastrophic Flood With GRACE-FO and Near-Real-Time Precipitation Data in Northern Henan Province of China in July 2021. IEEE J. Sel. Top. Appl. Earth Obs. Remote Sens. 2022, 16, 89–101. [Google Scholar] [CrossRef]
  16. Guo, R.J.; Wang, H.J.; Cai, A.N.; Nan, J.N.; Zhang, L.L. Analysis of temporal and spatial changes of China terrestrial water storage under the background of gravity satellites. J. Tianjin Norm. Univ. (Nat. Sci. Ed.) 2022, 42, 43–52. [Google Scholar]
  17. Mo, X.; Wu, J.J.; Wang, Q.; Zhou, H.J. Variations in water storage in China over recent decades from GRACE observations and GLDAS. Nat. Hazards Earth Syst. Sci. 2016, 16, 469–482. [Google Scholar] [CrossRef]
  18. Chen, Y.N.; Yi, L. Ponder on the issues of water resources in the arid region of northwest China. Arid. Land Geogr. 2012, 35, 1–9. [Google Scholar]
  19. Zhang, P.; Chen, X.; Bao, A.; Liu, T.; Ndayisaba, F. Assessing spatio-temporal characteristics of water storage changes in the mountainous areas of Central Asia based on GRACE. Chin. Geogr. Sci. 2017, 27, 918–933. [Google Scholar] [CrossRef]
  20. Cheng, S.; Yu, H.; Ren, Y. Research progress on the mechanism of abnormal climate impact in arid and semi-arid regions of China. Chin. Desert 2023, 43, 21–35. [Google Scholar]
  21. Ding, H.; Shi, X.; Wu, M. Inversion of Land Water Storage Changes in the Yellow River Basin Based on GRACE Gravity Data. J. Water Resour. Water Eng. 2021, 32, 109–115. [Google Scholar]
  22. Du, X.; He, L.; Ren, S. The evolution of water resources and changes in water supply composition in northern China. J. Jilin Univ. Earth Sci. Ed. 2023, 53, 566–577. [Google Scholar]
  23. Huang, M. Research on Flood Disaster Monitoring and Prediction in Shouguang City Based on Seminel-1/2 Data. Ph.D. Thesis, Nanjing University of Information Science and Technology, Nanjing, China, 2022. [Google Scholar]
  24. Xu, P.; Jiang, T.; Zhang, C.; Rui, M.; Liu, Y. Data filling of terrestrial water storage anomaly during the gap period of GRACE/GRACE-FO: A case study of global typical basins. Chin. J. Geophys. 2021, 64, 3048–3067. [Google Scholar] [CrossRef]
  25. Lu, D.; Yan, L.; Xu, Y. Extreme precipitation trend analysis in the Beijing Tianjin Hebei region based on multiple trend analysis methods. Yellow River 2022, 44, 26–32. [Google Scholar]
  26. Lu, X. Analysis of Land Water Storage Changes and Potential Environmental Effects in the Yellow River Basin Based on GRACE Gravity Satellite. Master’s Thesis, China University of Mining and Technology, Beijing, China, 2022. [Google Scholar]
  27. Nie, S.; Li, W.; Zheng, W. Analysis of changes in land water storage in the Haihe River Basin before and after the South to North Water Diversion Project. Geod. Geodyn. 2023, 43, 128–134. [Google Scholar]
  28. Cai, Y.; Cao, S.; Du, M. Estimation of total anthropogenic heat in prefecture level cities in China and analysis of driving factors. J. Earth Inf. Sci. 2021, 23, 405–418. [Google Scholar]
  29. Shi, S. A Study on the Spatiotemporal Evolution of Ecological Environment Vulnerability in the Five Northwestern Provinces. Master’s Thesis, Northwest Normal University, Lanzhou, China, 2019. [Google Scholar]
  30. Wang, R.; Li, Z. Characteristics of water regime evolution in Poyang Lake over the past 60 years. Trop. Geogr. 2017, 37, 512–521. [Google Scholar]
  31. Zhang, Q.; Yang, J.; Ma, P.; Yue, P. The characteristics and formation mechanism of enhanced eastward expansion of climate warming and humidification in the northwest region and its important environmental impacts. Arid. Meteorol. 2023, 41, 351–358. [Google Scholar]
  32. Sun, W.; Jin, Y.; Yu, J.; Wang, G.; Xue, B.; Zhao, Y.; Fu, Y.; Shrestha, S. Integrating satellite observations and human water use data to estimate changes in key components of terrestrial water storage in a semi-arid region of North China. Sci. Total Environ. 2020, 698, 134171. [Google Scholar] [CrossRef]
  33. Yi, H.; Wen, L. Satellite gravity measurement monitoring terrestrial water storage change and drought in the continental United States. Sci. Rep. 2016, 6, 19909. [Google Scholar] [CrossRef]
Figure 1. Topographic profile of the research region. Legend: The image was prepared based on a standard map (GS(2024)0650) downloaded from the website of Surveying, Mapping and Geoinformation Standards of China, and the boundary of the base map was not modified. This also applies to the figures below.
Water 17 01417 g001
Figure 3. The spatio-temporal trend in TWS in the region of interest: (a) spatial distribution of the TWS Sen’s slope (change trend) in the research region in 2002–2022; (b) classification of the TWS Sen’s slope (change trend) in the research region in 2002–2022 using the natural breakpoint method; (c) temporal distribution of the change trend of TWS Sen’s slope in the research region in 2002–2022 (the shadow area in the spatial distribution image is the area passing through the 95% M-K significance tests).
Water 17 01417 g003
Figure 4. The spatio-temporal distribution of precipitation in the research region: (a) spatial distribution of the difference in average annual precipitation in the research region in 2002–2022 compared to that in 1980–2022; (b) classification of the difference using the natural breakpoint method; (c) time series of average annual precipitation in 1980–2022.
Water 17 01417 g004
Figure 5. The spatio-temporal distribution of evapotranspiration in the research region: (a) spatial distribution of the difference in average annual evapotranspiration in the research region in 2002–2022 with that in 1980–2022; (b) classification of the difference using the natural breakpoint method; (c) time series of average annual evapotranspiration in 1980–2022.
Water 17 01417 g005
Figure 6. The spatio-temporal distribution of runoff in the research region: (a) spatial distribution of the difference in the average annual runoff in the research region in 2002–2022 with that in 1980–2022; (b) classification of the difference using the natural breakpoint method; (c) time series of average annual runoff in 1980–2022.
Water 17 01417 g006
Figure 7. Time series of average annual water consumption in 1980–2016.
Water 17 01417 g007
Figure 8. Histogram for contribution rates of driving factors to TWS from 2002 to 2022.
Water 17 01417 g008
Disclaimer/Publisher’s Note: The statements, opinions and data contained in all publications are solely those of the individual author(s) and contributor(s) and not of MDPI and/or the editor(s). MDPI and/or the editor(s) disclaim responsibility for any injury to people or property resulting from any ideas, methods, instructions or products referred to in the content.

