Article

Free-Living Protozoa and Legionella spp. Coexistence and Bacterial Diversity in Drinking Water Systems in Apartment Buildings and Hotels in Riga and Its Surroundings

1
Institute of Food Safety, Animal Health and Environment “BIOR”, LV-1076 Riga, Latvia
2
The Faculty of Medicine and Life Sciences, University of Latvia, LV-1004 Riga, Latvia
*
Author to whom correspondence should be addressed.
Water 2025, 17(10), 1485; https://doi.org/10.3390/w17101485
Submission received: 20 March 2025 / Revised: 9 May 2025 / Accepted: 12 May 2025 / Published: 14 May 2025
(This article belongs to the Section Water Quality and Contamination)

Abstract

:
Free-living protozoa (FLP) can create biofilms in water supply systems and can harbor bacteria, which potentially can be pathogenic, such as Legionella spp. Each year there are more cases of legionellosis in Latvia, so this problem is actual: in 2019 there were 42 cases, but in 2024—88 cases. In this study, the investigated question of the coexistence of FLP and Legionella spp. and bacterial diversity in the drinking water supply systems of Riga, Salaspils, and Jurmala multiapartment buildings and hotels situated in Riga and Jurmala, identify the main FLP genus, and study factors associated with FLP and Legionella spp. occurrence. With microscopy, microbiological, and molecular biology methods, FLP and, specifically, free-living amoeba (FLA) were detected and identified, and Legionella spp. bacteria were isolated. Three FLP genera were identified, including Acanthamoeba, Vahlkampfia, and Hartmanella (Vermamoeba). In hot water, more FLP and Legionella co-existence occurrences were detected. In 64.7% of FLP-positive samples, Hartmanella (Vermamoeba) spp. was detected. Various potentially pathogenic bacteria, such as Coxiella, Leptospira, and Mycobacterium, were detected in the water sample DNA sequences. The average hot water temperature in Riga was lower than 50 °C, which is not enough to minimize the risk of the Legionella bacteria proliferation. The Shannon’s index values showed that bacterial diversity was higher in cold water samples, and the Pearson test showed that the correlation between building floor and Legionella quantity is positive. In this study, we also discovered that differences in bacterial diversity between water samples from two Daugava River banks’ water sources are not significant, but the biggest exception was a much higher percentage of Chaetonotida (hairybellies) in the left river bank samples. Noticeably, there are more Legionella and FLP-positive samples from the kitchen than from the apartment shower. Each hotel building from this study has its own similar bacterial diversity in its water supply system.

1. Introduction

Legionnaires’ disease, which is a form of atypical pneumonia, is caused by Legionella pneumophila. Gram-negative bacteria and free-living protozoa (FLP) are able to create biofilms in water pipes and can protect pathogenic bacteria and can serve as a reservoir for bacterial populations, and Legionella spp. can become intracellular parasites of FLP. The interaction of bacteria and protozoa can increase the resistance of microorganisms to antibiotics and their virulence. This represents a critical public health concern, as it contributes to the emergence of infectious diseases that are increasingly resistant to antibiotic treatment [1].
To limit the population of Legionella spp. in water supply systems, the World Health Organization [2] suggests ensuring that hot water temperature is not lower than 50 °C. In amendments to the regulations of the Cabinet of Ministers of 30 June 2015, No. 332, Rules on the Latvian building code LBN 221-15, “Internal water supply and sewerage of buildings”, it is said that hot water temperature in the apartments should not be lower than 55 °C and not higher than 70 °C.
Legionellosis cases are reported in Latvia, and the incidence increases each year. In 2019, there were 42 cases (2.2 per 100,000 people); but in 2024—88 cases (4.7 per 100,000 people) (data from the epidemiological bulletins published by the Latvian Center of Disease Prevention and Control). Statistics here show that from 2019 to 2024 number of cases increased more than two times, and here are listed only statistically recorded and confirmed cases of legionellosis. The high number of Legionnaires’ disease incidence in Latvia can be explained with high prevalence and virulence of the pathogen discovered in the previous studies [3].
The Shaheen and Ashbolt 2017 study [4] provides an overview of the problem of the amoeba Willaertia magna producing vesicles that contain Legionella. Studies in guinea pigs have shown that the infectious dose of Legionella is less than 129 cells [5,6]. 1–100 L. pneumophila cells inside the alveoli can cause infection in humans, and a concentration of 3.5 × 10⁶ to 3.5 × 10⁸ can cause infection using the shower. When amoeba and Legionella bacteria are cocultured, they are released from the amoeba in individual cells and vesicles [4,7]. This information is mentioned because showers remain one of the main sources of Legionella infection, highlighting the role of this habitat in the spread of Legionella.
As can be seen in other articles, this problem is actually not only for Latvia, so it is interesting to investigate FLP and Legionella in local water supply systems.
In a study by Kilvington et al., 2004 [8], it is described that cold water taps in England were more contaminated with FLP (47% of kitchen and 76% of bathroom taps) than hot water taps (16% and 24%). According to the study by Ji et al., 2018 [9], hot water is more often contaminated with bacteria because higher temperatures reduce the concentration of disinfectants. This article describes an experiment using two units with electric water heaters. In one, the temperature was constantly 60 °C, but in another, the temperature increased from 40 °C to 60 °C and then lowered to 40 °C in both, and it was noticed that short-term temperature rise does not have such an effect on bacteria numbers as a constantly high temperature, and they recover quickly. According to Bertelli et al. (2018) [10], residues of disinfectants are needed in water supply systems to control the growth of bacteria, but increased bacterial diversity protects against the proliferation of pathogenic bacteria, and it means that it is possible to reduce chlorine concentration. Some bacteria can form biofilms that give protection against disinfectants; for example, Pseudomonas aeruginosa was detected in all samples in this study.
Water quality also depends on water stagnation. In a study by Ling et al., 2018 [11], water from the student dormitories was examined before and after the summer holidays. Before stagnation, Proteobacteria, Cyanobacteria, Bacteroidetes, Planctomycetes, Actinobacteria, and Firmicutes predominated, but after it, Proteobacteria (Alpha and Beta). The number of cells was 1000-fold higher in the distal sections than in the proximal sections, and in the proximal stages of the tube, the microbial diversity mostly depends on where the water was taken, but in the periphery of the tubes, it depends on the biofilms.
Underground water, surface, thermal, seawater, and soils are the natural habitats of Legionella spp. [12], and because of this, it is possible to find these bacteria in water from underground sources. In other articles, it is said that there are differences between amoeba populations from underground water and surface water [13].
This study aimed to investigate the coexistence of FLP and Legionella spp. and bacterial diversity in the drinking water supply systems of Riga and its surrounding towns’ multiapartment buildings and hotels in Riga and Jurmala, identify the main FLP genus, and study factors associated with FLP and Legionella spp. occurrence: water temperature, building floor, type of how hot water is supplied in the apartment (with water heaters or a central hot water supply system), water consumption level, and at which bank of the Daugava River it is located (right or left bank). This study includes and uses real samples from water supply systems, and the results were helpful for apartment owners.

2. Materials and Methods

2.1. Sampling

Samples were obtained from apartment houses in Riga, Salaspils, and Jurmala from 28 August 2019 till 4 March 2021 and hotels in Riga and Jurmala from 4 August 2020 till 27 August 2020. We collected 81 water samples in sterile bottles from apartments and 50 from hotels. More detailed information about samples from multi-apartment buildings is available in Table 1. The number of buildings where sampling was performed built until 1917 was 6; in the 1920–1930s—4; in the 1960–1980s—27; and two were built after the 1990s. In total, there were 39 multi-apartment buildings and 5 hotel buildings. 4 hotel buildings were in Riga, 1 in Jurmala. In each hotel, water was taken from 5 rooms.
Sampling was performed by owners of apartments, who were provided with all the necessary equipment. It was recommended that water be sampled in the morning when the tap water has not been used, and it was advised first to take a cold water sample using the following procedure: remove the sieve; scrape the inside of the water tap with a sterile metal brush, if it is possible; open the water mixer tap and fill half of the sterile bottle (1 L); after 2 min of running the water, fill the other half (1 L) in the same bottle; repeat the procedure with the hot water tap; and measure the cold and hot water temperature with a calibrated thermometer. A used metal brush was rinsed inside the bottle. The owners filled out the questionnaire about various aspects: address, building floor, sampling place (kitchen, bathroom), hot water production system (individual water heaters or central supply system), and average hot and cold water consumption level per month in m3. Transport of the samples to the laboratory was obtained on the same day when they were taken.
Ten samples (1 L) were taken from each hotel’s different rooms. These samples were taken before and after flushing (5–10 min). In both cases, the water temperature was measured, and samples were transported (at 4 °C) to the laboratory the same day too.
It has to be taken into account that the Daugava River right and left bank Riga sides have different water supply sources: the right side from underground sources, but the left bank uses water from the Daugava River, which is previously treated (Figure 1). The total length of the water supply networks of the city of Riga at the beginning of 2024 was 1518.11 km. Water supply networks are built from pipelines of various materials (cast iron, steel, reinforced concrete, etc.). The United Water Quality Control Laboratory of the drinking water supply company checks the drinking water treated (purified and tested) in drinking water treatment plants and the drinking water in the centralized water distribution network of the city of Riga by the Cabinet of Ministers’ decision of 29 September 2023. regulations no. 547 “Monitoring and control procedure of mandatory safety and quality requirements of drinking water”, and microbiological indicators have been tested (https://www.rigasudens.lv/en/about-us, accessed on 11 May 2025).
The water supply system in Jurmala consists of three separate networks that supply treated underground water. The total length of water supply systems is 160 km. There is an underground water supply in Jurmala, and water is treated before being fed into the networks at four local treatment stations. (https://www.jurmalasudens.lv/?ct=iapgade, accessed om 11 May 2025) and Salaspils cities (https://www.valgums.eu/index.php/18-pakalpojumi/63-udensapgade, accessed on 11 May 2025)

2.2. Detection of Legionella spp. and FLP

According to the chosen methodology, the hot and cold drinking water samples were tested for the presence and serogroup of L. pneumophila according to the standard (ISO 11731: 2017 [14]) real-time PCR method. The filtration with a vacuum filtration device (Millipore WP6122050, EMD, Millipore Corporation, Burlington, MA, USA) through a membrane filter of diameter 47 mm and a pore size of 0.45 μm (cellulose nitrate filter, Sartorius Stedim Biotech GmbH, Göttingen, Germany) was used to concentrate a 1 L water sample. The filter was placed in a sterile Petri dish, rinsed with 5 mL of sterile distilled water, cut into pieces with sterile scissors, and then washed vigorously for 2 min to separate the micro-organisms from the filter. The ISO 11731: 2017 method was used to isolate L. pneumophila. The main medium was buffered charcoal yeast extract (BCYE) agar with L-cysteine and Fe-pyrophosphate. Selective media with antibiotics was GVPC, but media without antibiotics was BCYE (without or with cysteine). Approximately 0.1 mL from the concentrated sample was cultured on GVPC media and incubated at 36 °C for 10 days. Plates were analyzed every 2–4 days. Potentially, Legionella colonies are white, grey, or blue but can be rose brown; at the same time, L. pneumophila colonies are bluish. Suspicious colonies were cultured on two different BCYE media and incubated at 36 °C for 48 h: Legionella grows on BCYE-Cys media but not on BCYE without cysteine.
For the molecular tests, total DNA was extracted from the rest of the filtered sample using a QIAmp DNA Mini Kit (Qiagen, Hilden, Germany). Legionella genetic material was detected using the Legionella spp. Genesig Kit (Primerdesign Genesig, Southampton, UK) according to the manufacturers’ recommendations. This kit can detect less than 100 copies of the target template (23S/5S Intergenic Spacer Region).
Before and after cultivating on Page’s Amoeba saline (PAS) (salts from Enola, Riga, Latvia) with peptone yeast extract glucose (PYG) (Biolife, Milan, Italy), the presence of FLP was tested. It was done to study the uncultivated microbiome of water from water supply systems too, because cultivation changes it. PAS media is prepared from two stocks. The first contains NaCl—12.0 g, MgSO4 × 7H2O—0.40 g, CaCl2 × 2H2O—0.60 g per liter of water. The second stock contains Na2HPO4—14.20 g and KH2PO4—13.60 g per liter of water. To prepare PAS media, take 5 mL per liter of water from each stock. To prepare PYG media, per liter of water, it needs to take proteose peptone—20.0 g, yeast extract—1.0 g, 0.4 M MgSO4 × 7 H2O—10.0 mL, 0.05 M CaCl2—8.0 mL, 0.1 M sodium citrate × 2 H2O—34.0 mL, 0.005 M Fe (NH4)2(SO4)2 × 6H2O—10.0 mL, 0.25 M Na2HPO4—10.0 mL, 0.25 M KH2PO4—10.0 mL, 2 M glucose—50.0 mL [15]. PAS media was added to the Petri plate with filter pieces to cover them fully, and PYG media was added (50 µL). Plates are covered with parafilm (Bemis, Sheboygan Falls, WI, USA) and placed into a thermostat-incubator (Binder, Tuttlingen, Germany) at 27 °C. FLP genus was first identified by microscopy, which occurred on the fifth day of incubation. If FLP were not detected, then incubation lasted three more days, after which Petri plates were microscoped, pouring off liquid media and using different magnifications of the microscope (Leica, Wetzlar, Germany): 5×, 400×, and 1000×. Petri plates with positive samples were mechanically treated with a microbiological loop and rinsed with 1 mL of liquid media, which was used for DNA extraction using the QIAmp DNA Mini Kit (Qiagen, Hilden, Germany). The following FLP genera were detected with PCR applying specific primers for Acanthamoeba [16] (denaturation at 95 °C for 5 min, 40 cycles of 95 °C for 45 s, 52 °C for 45 s, 72 °C for 45 s ended with final elongation cycle at 72 °C for 10 min), Vahlkampfidae [17] (denaturation at 95 °C for 5 min, 35 cycles of 95 °C for 30 s, 50 °C for 1 min, 72 °C for 1 min ended with final elongation cycle at 72 °C for 10 min), Amoebaidae (denaturation at 95 °C for 5 min, 35 cycles of 95 °C for 30 s, 56 °C for 1 min, 72 °C for 1 min ended with final elongation cycle at 72 °C for 10 min) and Hartmanella (Vermamoeba) [18] (denaturation at 95 °C for 5 min, 35 cycles of 94 °C for 35 s, 56 °C for 45 s, 72 °C for 1 min ended with final elongation cycle at 72 °C for 10 min). The HotStarTaq DNA Polymerase Kit (Qiagen, Hilden, Germany) and ProFlex PCR system (Applied Biosystems, Thermo Fisher Scientific, Waltham, MA, USA) were used for PCR reactions. For the visualization of the PCR product, a QIAxcel Advanced capillary electrophoresis device was used (Qiagen, Hilden, Germany). Primers at their sequences are listed in Table 2.

2.3. 18S and 16S rRNA Amplicon Sequencing and Sequence Analysis

From each DNA extract, PCR product was obtained using Reuk454FWD1 forward [19] and V4 reverse [20] primers, which amplify the 18S ribosomal RNA (rRNA) gene V4 region. PCR conditions for amplification of 18S rRNA gene fragment were as follows: 95 °C for 5 min, 14 cycles of 98 °C for 30 s, 57 °C for 45 s, and 72 °C for 1 min, 21 cycles of 98 °C for 30 s, 47 °C for 45 s, and 72 °C for 1 min, with final extension at 72 °C for 5 min. Only samples with detectable PCR products were used for further sequencing. In total, PCR products of 80 samples were sequenced using molecular biology-grade water as a negative control and Vermamoeba (Hartmannella) vermiformis Page 50,237 culture purchased from ATCC, USA, as a positive control.
16S rRNA amplicon sequencing libraries were prepared according to Illumina’s 16S Metagenomic Sequencing Library Preparation guide (document part #15044223 Rev. B), which uses primers S-D-Bact-0341-b-S-17 and S-D-Bact-0785-a-A-21 from [21] to amplify a 464 bp long fragment of the V3–V4 regions of the bacterial 16S rRNA gene. Forty PCR cycles were used to obtain PCR products. In total, it was possible to obtain PCR products and sequences from 99 samples with water as a negative control and DNA from a Staphylococcus aureus culture (EQAS ST-9.1 from EURL for Antimicrobial Resistance) as a positive control. To obtain amplicon sequencing, the Illumina MiSeq platform and the MiSeq Reagent Kit v3 and MiSeq Reagent Kit v2 (Illumina, San Diego, CA, USA) were used, generating 2 × 300 bp and 2 × 250 bp paired-end (PE) reads, respectively (v2 kit was used only for the 18S rRNA amplicon libraries).

2.4. Statistical Analysis of Data

Correlation analysis (Excel, Microsoft office Home and business 2016) and χ2 test, which was performed at https://www.socscistatistics.com (accessed on 11 May 2025), were used to analyze data in this study.
Maps of Riga with sampling places were created using the GIMP/GNU Image Manipulation Program 2.10.38.
For taxonomic classification of 18S sequences, the SILVA rRNA sequence database was used.
The main method of 16S sequencing analysis was the Taxonomic Classification Service of the Bacterial and Viral Bioinformatics Resource Center (BV-BRC) (https://www.bv-brc.org/ (accessed on 11 May 2025), which helped to perform statistical analysis of bacterial diversity in water samples, including the following alpha diversity indexes: Shannon’s diversity index, Simpson’s diversity, Simpson’s reciprocal index, Berger–Parker’s diversity, and Fisher’s index. Shannon’s diversity index indicates how diverse the species in a particular community are. A higher value indicates a more significant number of species and the evenness of their abundance. Simpson’s diversity index shows a number of species and their abundance but also considers the number of prominent taxa, where a higher value indicates lower diversity. A higher value of the Simpson’s reciprocal index indicates higher diversity. The Berger–Parker index assumes linear distribution and indicates how many samples are assigned to the dominant species. Fisher’s index is an index of diversity as a log series distribution that corrects for the upward bias of the Laspeyres and the downward bias of the Paasche price index by taking the geometric average (https://www.bv-brc.org, (accessed on 11 May 2025)).
To obtain bacterial community clusters, https://biit.cs.ut.ee/clustvis/, (accessed on 11 May 2025), a web tool for visualizing the clustering of multivariate data, was used [22]. Both rows and columns were clustered using correlation distance (Pearson correlation subtracted from 1) and average linkage (average distance of all possible pairs).

3. Results and Discussion

3.1. Water Temperature in Apartment Houses and Hotels; Water Consumption

The average temperature of cold water samples in apartment houses was 15.32 °C (ranging from 7.00 to 23.50 °C). The average temperature of hot water samples was 48.11 °C (ranging from 26.00 to 58.00 °C). Individual water heaters were installed and used in 18 apartments, and for those, the average hot water temperature was 50.60 °C (ranging from 41.00 to 57.00 °C).
The average temperature of unflushed hot water samples from hotels was 35.80 °C (ranging from 23.00 to 53.80 °C), and the average flushed water sample temperature was 49.00 °C (ranging from 39.30 to 55.20 °C).
The average cold water consumption per month was 3.84 m3 (ranging from 0.8 to 12.00), and the average hot water consumption per month was 2.93 m3 (ranging from 1.0 to 8.0).
It is noticed that the average hot water temperature in Riga is lower than 50 °C, and sometimes it is even lower than 30 °C. The range of hot water temperature was quite wide, which means it is impossible to always protect against Legionella spp. bacteria growth. In a previous study, in 28 out of 50 hotels, hot water temperature was also relatively low and did not reach 50 °C [3]. World Health Organization recommendations say that water should be heated and stored at 60 °C [2], and the temperature to limit the population of Legionella spp. in water supply systems should not be lower than 50 °C [23].
In a study by Li et al. (2018) [24], water samples were taken from the first and top floors of the building before and during 28 min of flushing to describe chlorine concentration and the presence of Legionella spp., Mycobacterium avium, Acanthamoeba spp., and Vermamoeba vermiformis. It was noticed that the average temperature on the top floors was 2.5 °C higher than on the first floors, but the chlorine concentration was higher on the first floors. Legionella spp. and Mycobacterium spp. were detected in all water samples, Acanthamoeba spp. was detected in 20.5%, and Vermamoeba spp. in 5.1% of water samples. In buildings with water tanks on the roof, the prevalence of Legionella and Mycobacterium genes was higher on the top floors. It was noticed that flushing reduced the number of these genera only on the first floors.
As seen from other studies [9], a short increase in water temperature does not always protect from biofilm creation and a high number of bacteria. Hot water temperature should be constantly high. Such factors as water purification and disinfection, as well as the impact of pipe network material, were not directly investigated in the present study. However, according to the literature, they are significant. In the present study, such factors as water temperature, building floor, type of hot water supply method (individual water heaters or central supply system), water consumption level, and address location (right or left bank of the river Daugava) were considered.

3.2. Presence of FLP and Legionella spp. and Their Co-Existence

FLP were detected in 45 (55.60%) of 81 water samples from apartments by microscopy and in 32 (39.50%) samples by PCR. In 32 (39.51%) of all samples, FLP were detected with both methods (Table 3). Legionella spp. were detected in 41 (50.6%) water samples by the standard method and in 39 (48.1%) samples by real-time PCR. It is possible because less water was used for DNA extraction for PCR than for the ISO standard method—only what was left in the Petri plate with cut filter parts (statistically not significant differences between both methods according to χ2 test results). The number of colony-forming units (CFU) of Legionella spp. of positive samples ranged from 5.0 × 101 to 6.4 × 10³ CFU per liter. This number is smaller than in the article, which was mentioned before [4], where the smaller number was 3.5 × 10⁶, which can cause infection in humans. Legionella serogroups 1, 2, 3, and 9 were identified, but some were not identified precisely and marked as 2–15.
Approximately 72.20% of cold water samples, which were Legionella spp. positive, were also positive for FLP (13 samples) and 45.80% (11 samples) of the hot water samples were Legionella spp. and FLP positive. These results can possibly show that FLP and Legionella spp. co-existence occurrence can be discovered more in cold water than in hot water samples.
Using the Pearson correlation test, a medium-strong correlation was found between Legionella quantity (CFU/l) and the floor of a building: the larger Legionella quantity can be found at higher floors of buildings (Figure 2A,B). In cold water (A), this correlation (r = 0.27; R2 = 0.0737) was stronger than in hot water (r = 0.11; R2 = 0.012). It can be because at higher building floors, pressure in the water supply system pipes is lower, the water circulation is not so intense, and biofilms can be formed more easily. Other reasons for discrepancy in data correlation could be other factors like water temperature (r = −0.24) and history of the building (age, type of pipes, any renovation works, etc.). It should be noted that only one sample was taken from each apartment building, corresponding to the apartment where the study participants who wanted to participate in the study lived.
In our study, it was detected that there were more Legionella bacteria on higher floors of buildings. Biofilm formation depends on the material of the water pipes. An experiment showed that after 56 days, the biofilm thickness in copper pipes was 150 µm, and in PVC and PE pipes, it was 100 and 70 µm, respectively. The thinnest biofilm was formed in stainless steel pipes—40 µm [25]. In a study, Srinivasan et al. (2003) [26] used chlorine dioxide to reduce the Legionella population in buildings. After 17 months, the only remaining place where Legionella was detected was on the fifth floor of the building, farthest away from the chlorine dioxide source. Polymers or even stainless steel can be used on higher floors because biofilm forms faster [27]. It is not a cheap material, but using it only on high floors can lead to savings in money.
From nine locations with individual water heaters, Legionella positive samples were four (44.44%) hot water samples, which was below the total percentage of positive samples. Seven samples from locations with individual water heaters were FLP positive (77.78%). The χ2 statistic was 2.9755, and the p-value was 0.08, therefore not significant at p < 0.05.
Cold water consumption was slightly higher on average for negative samples, while hot water consumption was slightly lower for negative samples (Table 4). Cold and hot water consumption was very similar between FLP and Legionella-positive samples.
In total, 50% of samples from the left bank of river Daugava water supply system and 46% from the right bank water supply system were Legionella positive, but 54.5 and 61% of samples from water supply systems were FLP positive, respectively (Figure 3). These results show that at the left and right bank positive sample number was very similar, while Legionella was more common in samples from the left bank, but FLP was more common at the right bank. Results of χ2 statistical analysis of Legionella positive and negative at right and left Daugava banks showed that they are not significant at p < 0.05, but FLP is not significant at p < 0.05. More detailed results are shown in Table 5.
Microscopy identified the FLP genera Acanthamoeba, Vahlkampfia, and Hartmanella (Vermamoeba). Table 6 summarizes the positive sample quantity from the kitchen and shower. It is noticeable that more positive samples were collected from the kitchens.
The hypothesis, which explains why the tap water from the kitchen is more often Legionella and FLP positive, is that mostly in all apartments the kitchen tap is located at the end of the water supply system, and water stagnation there is more frequent compared with water in the shower, and the water volume passing through the tap is smaller. In a study by Ling et al. [11], changes in the population of microorganisms after water stagnation in the student dormitories were analyzed. The bacterial diversity of the first 100 mL of stagnant water was similar to that of the biofilm. Stagnant water is mostly in the periphery of the water supply system of the building. Analyzing DNA from apartment water samples with specific primers, FLP was detected in 32 samples out of 42, where FLP was detected using the microscopy method. In all these positive samples (except one), Hartmanella (Vermamoeba) was detected.
In water samples from Riga and Jurmala hotels, FLP were identified in 68% of 50 samples but was taken only in hot water before and after draining. From drained water, FLA positives were 60%, but from non-drained water, 76%. The same FLP genus were identified by microscopy as in samples from apartment buildings, while with specific primers, Hartmanella (Vermamoeba) spp. was identified in 64.7% of FLP-positive samples; second was Vahlkampfia (only in 3 samples), and no Acanthamoeba.
From samples detected as FLA positive with microscopy, 70% of apartment and 74% of hotel water samples were detected as positive with PCR methods.
FLP were not detected with PCR in all samples that were positive for FLP after microscopy, possibly because FLP on the surface of the Petri plate was not placed evenly. During incubation, some water samples in Petri plates were contaminated with mold, and it was impossible to isolate DNA. The process of FLP incubation requires sterility, and it is possible that the environment can contaminate it during water sampling. It can also happen because many water samples were taken by non-specialized persons who do not have sufficient knowledge about sterility.
This study showed that Legionella bacteria can often be detected in Riga apartments, so this problem is real, and it is necessary to take more samples in future studies to observe this problem more deeply. For example, the suitability of the PCR method has to be evaluated. According to χ2 test results, the differences in the numbers of positive samples are statistically not significant between both methods, but a weak agreement between the results of the two methods was observed. Such a difference could be explained by the different sensitivity levels of the two methods. The Legionella spp. Genesig Kit (Primerdesign Genesig, UK) can detect less than 100 copies of the target template (23S/5S Intergenic Spacer Region). The detection limit for the plate count method assumed in some studies is 100 CFU/L (Scaturro et al., 2020) [14]. The PCR method has to be validated in the future with a set of samples with known Legionella concentration.
At this moment, it can be said that the treatment of underground water and water from the Daugava River does have an effect on water quality because there are no big differences in FLA and bacterial diversity between these two sources. The biggest exception was a much higher percentage of Chaetonotida (hairybellies) in the left Daugava River water supply system samples.

3.3. 18S rRNA Amplicon Sequencing Results

After analyzing 18S rRNA sequencing results, it was discovered that the relative abundance of Vermamoeba in hot water samples was higher than in cold water: 60% and 20.3%, respectively (Figure 4A), but other eukaryotic organisms also were detected: Chromulinales (golden algae), Paracercomonas (genus of Rhizaria), Echinamoeba, and Oligohymenophorea (class of ciliates). Paramicrosporidium was detected from the clade Rozellomycota (Cryptomycota) and is known as an amoebae parasite [28]. The full summary of 18S rRNA amplicon sequencing results of apartment cold and hot water samples is given in Supplementary Materials Table S1.
This method showed that sample cultivation in PAS and PYG media raised Vermamoeba, Chromulinales, and Paracercomonas proportions in particular from 10.2% to 48.9% (Figure 4B). Other main taxa were Phyllopharyngea (class of ciliates), Euamoebida, and Spumella (golden algae).
Cold water samples and samples before cultivation have a higher proportion of uncultured eukaryotes. In hotel samples, 41.5% of the eukaryotes were uncultured, but after incubation, the diversity of protozoa decreased, but Amoebozoa started to prevail because the media used here is specific for amoebas.
It was noticed that the diversity of amoebas is connected with water temperature—Vermamoeba inhabit water samples with higher temperatures (60% against 20% in cold water samples) (Figure 4A).
There was no significant difference between samples from water supply systems from the right and left Daugava bank, except for some genera (Table 5). For example, the Chaetonotida average percentage is higher at the left Daugava bank (38.09 versus 1.60%). It was noticed that after cultivation, the average Vermamoeba quantity in percent in the right bank water supply system is 36.86%, but at the right bank, it is 65.64%.
A higher proportion of Chromulinales (11.39%) was detected in hotel water samples compared to apartment water samples (Table 7). Chaetonotida quantity is higher than at the right Daugava bank water supply system samples. The full summary of 18S rRNA amplicon sequencing results of hotel water samples is given in Supplementary Materials Table S2. It has to be admitted that the positive control sample consisted of Vermamoeba sequences by 99.86%, but the negative control samples did not have any PCR products after the PCR reaction.

3.4. 16S rRNA Amplicon Sequencing Results

16S results showed that there are more Legionella-positive samples, which are also FLP positive, according to the 18S results (Figure 5), which was observed in apartment and hotel water samples.
If we look at the phyla that were detected in water samples, then it can be seen that the most common were the phyla Pseudomonadota, Planctomycetota, Bacillota, Acidobacteriota, and Candidatus Omnitrophota in all samples. The most common was the Pseudomonadota phylum, which on average was 32.13% of all bacteria in cold water samples, 27.47% in hot, and 32.92% in hotel water samples. In the last ones, Deinococcota was also common (on average 7%). The full summary of 16S rRNA amplicon sequencing results of apartment cold and hot water samples can be found in Supplementary Materials Tables S3 and S4, respectively, while 16S rRNA amplicon sequencing results of hotel samples are given in Table S5.
In water samples, DNA extracts were detected 16S rRNA sequences of several genera of potentially pathogenic bacteria as, for example, Coxiella (cold 0.41%, hot 0.53%, hotel 0.17%), Leptospira (cold 0.05%, none in hot, hotel 0.59%), Listeria (cold 7%, hot 7.51%, hotel 1.59%), Corynebacterium (cold 1.06%, hot 2.16%, hotel 1.24%), Mycobacterium (cold 2.74%, hot 2.16%, hotel 5.32%), and Pseudomonas (cold 2.96%, hot 5.03%, hotel 6.51%).
16S rRNA sequencing showed that potentially pathogenic bacteria can be detected in water supply systems. Potentially, because this method allows us to detect bacteria only at the genus level, some genera, which contain potentially pathogenic bacteria, were detected. For example, the Coxiella genus, from which Coxiella burnetii causes Q fever. In the study, Sales-Ortells and Medema (2012) [29] calculated the possibility of water contamination with C. burnetii during water aeration at water treatment plants. Leptospira, which causes leptospirosis (kidney failure and pulmonary hemorrhage syndrome), was found in drinking water previously [30]. From Corynebacterium, pathogenic to humans is C. diphtheriae, but other species are natural flora of human skin [31]. Mycobacterium can be a pathogen to humans (M. tuberculosis, M. leprae) [32], but from water supply systems, mostly isolated Mycobacterium is a pathogen to animals (M. avium complex) [33]. From the Pseudomonas genus, P. aeruginosa can cause pneumonia [34]. Looking at these results, continuing water supply system studies and improving water treatment methods are important because we cannot be sure that these detected bacteria are not pathogenic.
In the study of Zhang et al., 2021 [35], Proteobacteria, Actinobacteria, and Bacteroidetes were dominant in water supply system samples. In our samples, such bacteria were also detected, but in different proportions. In the study, Ling et al. (2018) [11] showed similarly dominating bacteria phyla: Proteobacteria, Cyanobacteria, Bacteroidetes, Planctomycetes, Actinobacteria, and Firmicutes. After stagnation, Proteobacteria dominated in tap water. In this quoted study, Proteobacteria families were detected: Erythrobacteraceae, Sphingomonadaceae, Rhodocyclaceae, and Comamonadaceae—they are aerobic heterotrophs and often can be discovered in the drinking water ecosystem. In another publication [36], Proteobacteria, Bacteroidetes, Cyanobacteria, Verrucomicrobia, and Actinobacteria were the most dominant phyla. Samples were taken from the water treatment plant and the water supply system from the same plant. It can be concluded that phyla composition in different studies has major similarities.
In this study, using 16S sequencing, water samples have been found to contain not only human pathogenic bacteria but also parasites of free-living amoeba. Candidatus Berkiella is a parasite of A. polyphaga amoeba [37]. Candidatus Amoebophilus from phylum Zygomycota (fungi) can infect Mayorella vespertilioides amoeba [38]. This discovery shows that the water microbiome is connected with the free-living amoeba.
This study showed the importance of analyzing water samples using different methods. Microscopy cannot help in detecting all protozoa, especially for people who do not have much experience with protozoa detection, but it can be the first step to finding positive samples and then analyzing them with PCR or 18S rRNA sequencing. This study shows that Vahlkampfia are mostly detected only with microscopy, but not with PCR. The reason for that can be the difficulties of DNA extraction from this free-living amoeba.
Five bacterial alpha diversity indexes were analyzed (Table 8), as they were provided at https://www.bv-brc.org/ (accessed on 11 May 2025) site. Shannon’s diversity index shows that bacterial diversity was higher in cold water samples. The average Shannon’s index in cold water samples was 3.19, but in hot water, it was 2.72, and it was noticed that the minimal Shannon’s index was higher in cold water samples—2.25, whereas in hot water samples, it was 0.39. The same tendency was observed for the maximal values of Shannon’s diversity index. Simpson’s and Berger–Parker’s indices show that some prominent bacterial taxa did not dominate cold water samples.
In their study, Deepika and Sowmya (2016) [39] found that greater species diversity means more inter-specific interactions and more possibilities for negative feedback control, which reduces abrupt changes and the bacterial community becomes more stable. It is related to the context of Shannon’s index, which shows diversity, as was said before. In that article, it was in the range of 1.742–2.988, which is close to our data. In the study by Zhang et al., 2021 [35], the Shannon’s index of cold tap water was also higher than hot water (2.48 and 1.87). This was also the case for Simpson’s reciprocal index for cold water (8.03 and 4.73), as in our study (Table 8). In this cited article, they assume that it can be because not all drinking water bacteria can adapt to the increased temperature of hot tap water, and biofilm formation in hot and cold water pipes can be different.
In the 2012 study by Henne et al. [40], the drinking water, which in this study was called bulk water, had a higher Fisher index than the same index of biofilm samples. This means that bacterial diversity is higher in drinking water. For the water, this index was 64.97, but for biofilm samples, it was 59.30. Compared to our results, it can be said that diversity is lowest in hotel water samples but higher in cold water samples (Table 8). Berger–Parker’s dominant index is noticeably bigger for hotel and hot water samples. We can assume it is because diversity is smaller in these samples than in cold water, and some bacterial species can become dominant more easily because of interactions with other species. In the study by Deepika and Sowmya (2016) [39], this index was in the range of 0.1579–0.7702, which is similar to our results.
Simpson’s diversity index (theoretically ranging from 0 to 1) is higher for cold water in this study. In the study by Revetta et al. (2010) [41], this index for drinking water samples was lower (0.30–0.46), but the minimal index in our study was even lower (0.146) than in this study.
When making bacterial clusters, it was noticed that there is no connection between bacterial taxonomic diversity and water sampling place—the kitchen or bathroom, left or right bank of Daugava—but studying these clusters can show that in hotel water samples, there are groups around one hotel building, which means that in each hotel building, there is a common bacterial community. Figure 6 represents this sample grouping. The heatmaps of bacterial diversity clusters of apartment cold and hot water samples are given in Supplementary Materials Tables S6 and S7, respectively.
The positive control was 99.64% Staphylococcus positive, but the negative sample did not have PCR products after the PCR reaction.
A previous study in Latvia detected that 12.5% of cold-water samples contained Legionella spp., but hot water samples were positive in up to 54% of cases when untreated groundwater was used. Samples were taken in an apartment, a hotel, and public buildings. In total, at least one free-living amoeba (FLA) genus was detected in 77.2% of samples. Eight genera of FLA were identified: Acanthamoeba, Vermamoeba, Naegleria, Flamella, Centropyxis, Vrihiamoeba, Echinamoeba, and Tetramitus [26]. In samples from Latvia, T4 and T12 Acanthamoeba genotypes were detected. These genotypes are associated with keratitis and encephalitis [42]. In the present study, using 16S rRNA amplicon sequencing, the following were detected in the hot water pipe biofilms from Riga: Proteobacteria spp., Firmicutes, Nitrospirae, Planctomycetes, and Actinobacteria. Using 18S rRNA amplicon sequencing in these samples, the following main groups were detected: Archaeplastida, Opisthokonta, Amoebozoa, and the SAR supergroup (which contains Stramenopiles, Alveolata, and Rhizaria). Using cultivation methods, L. pneumophila was detected in 20% of biofilms after cultivation, and detected serogroups were 2, 3, 6, and 9, but serogroup 2 was the predominant one (>55% of biofilms) [43]. In a study [44] where water samples were collected in hotels from different cities of Latvia, Legionella was detected in 14 of 15 cities in this research. In Riga, the proportion of water samples from hotels that were Legionella spp. positive was lower than in other cities because hotels are supplied with purified surface water. The most common serogroup was 3, but 2, 1, 9, and 6 were also detected. The hot water temperature in 35% of hotels was lower than 50 °C. Above 55 °C, there are unfavorable conditions for Legionella growth and proliferation.
Implementing water treatment and disinfection strategies for inactivating protozoa should also improve the control of pathogenic microorganisms [45]. A big part of the Riga water supply network is made from cast iron and has a 300–800 mm diameter. In fact, 70 of 960 km of this network needs to be renewed [46]. As was told before [25], it can be seen that pipes from stainless steel do not support biofilm formation, but it is not a cheap material. Polyethylene and polyvinyl chloride have a similar effect and can also be used, but the water pipe material connection with bacterial and FLP diversity was not explored in this study.

4. Conclusions

  • Acanthamoeba, Vahlkampfia, and Hartmanella (Vermamoeba) free-living amoebas were identified in water samples, and 72.20% of cold water samples and 45.80% of hot water Legionella-positive samples were also FLP positive.
  • Legionella’s existence in water supply systems is still relevant in Riga City, and almost 66% of water samples were Legionella positive using at least one detection method.
  • 72.20% of the cold water and 45.80% of the hot water samples, which were Legionella spp. positive, were also positive for FLP, which can possibly show that in cold water samples there were more FLP and Legionella spp. co-existence occurrences that can be discovered.
  • Average hot water temperature in Riga is lower than 50 °C (48.11 °C), and sometimes it is lower even than 30 °C.
  • There was a medium-strong positive correlation between building floor and Legionella quantity, which was stronger in cold water samples.
  • More FLP- and Legionella-positive samples were collected from the kitchens than the showers.
  • There are no big differences between water supply system samples from the left and right Daugava banks regarding Legionella and FLP. However, in the left bank samples, there is a much bigger quantity of Chaetonotida (hairybellies) (38.09%).
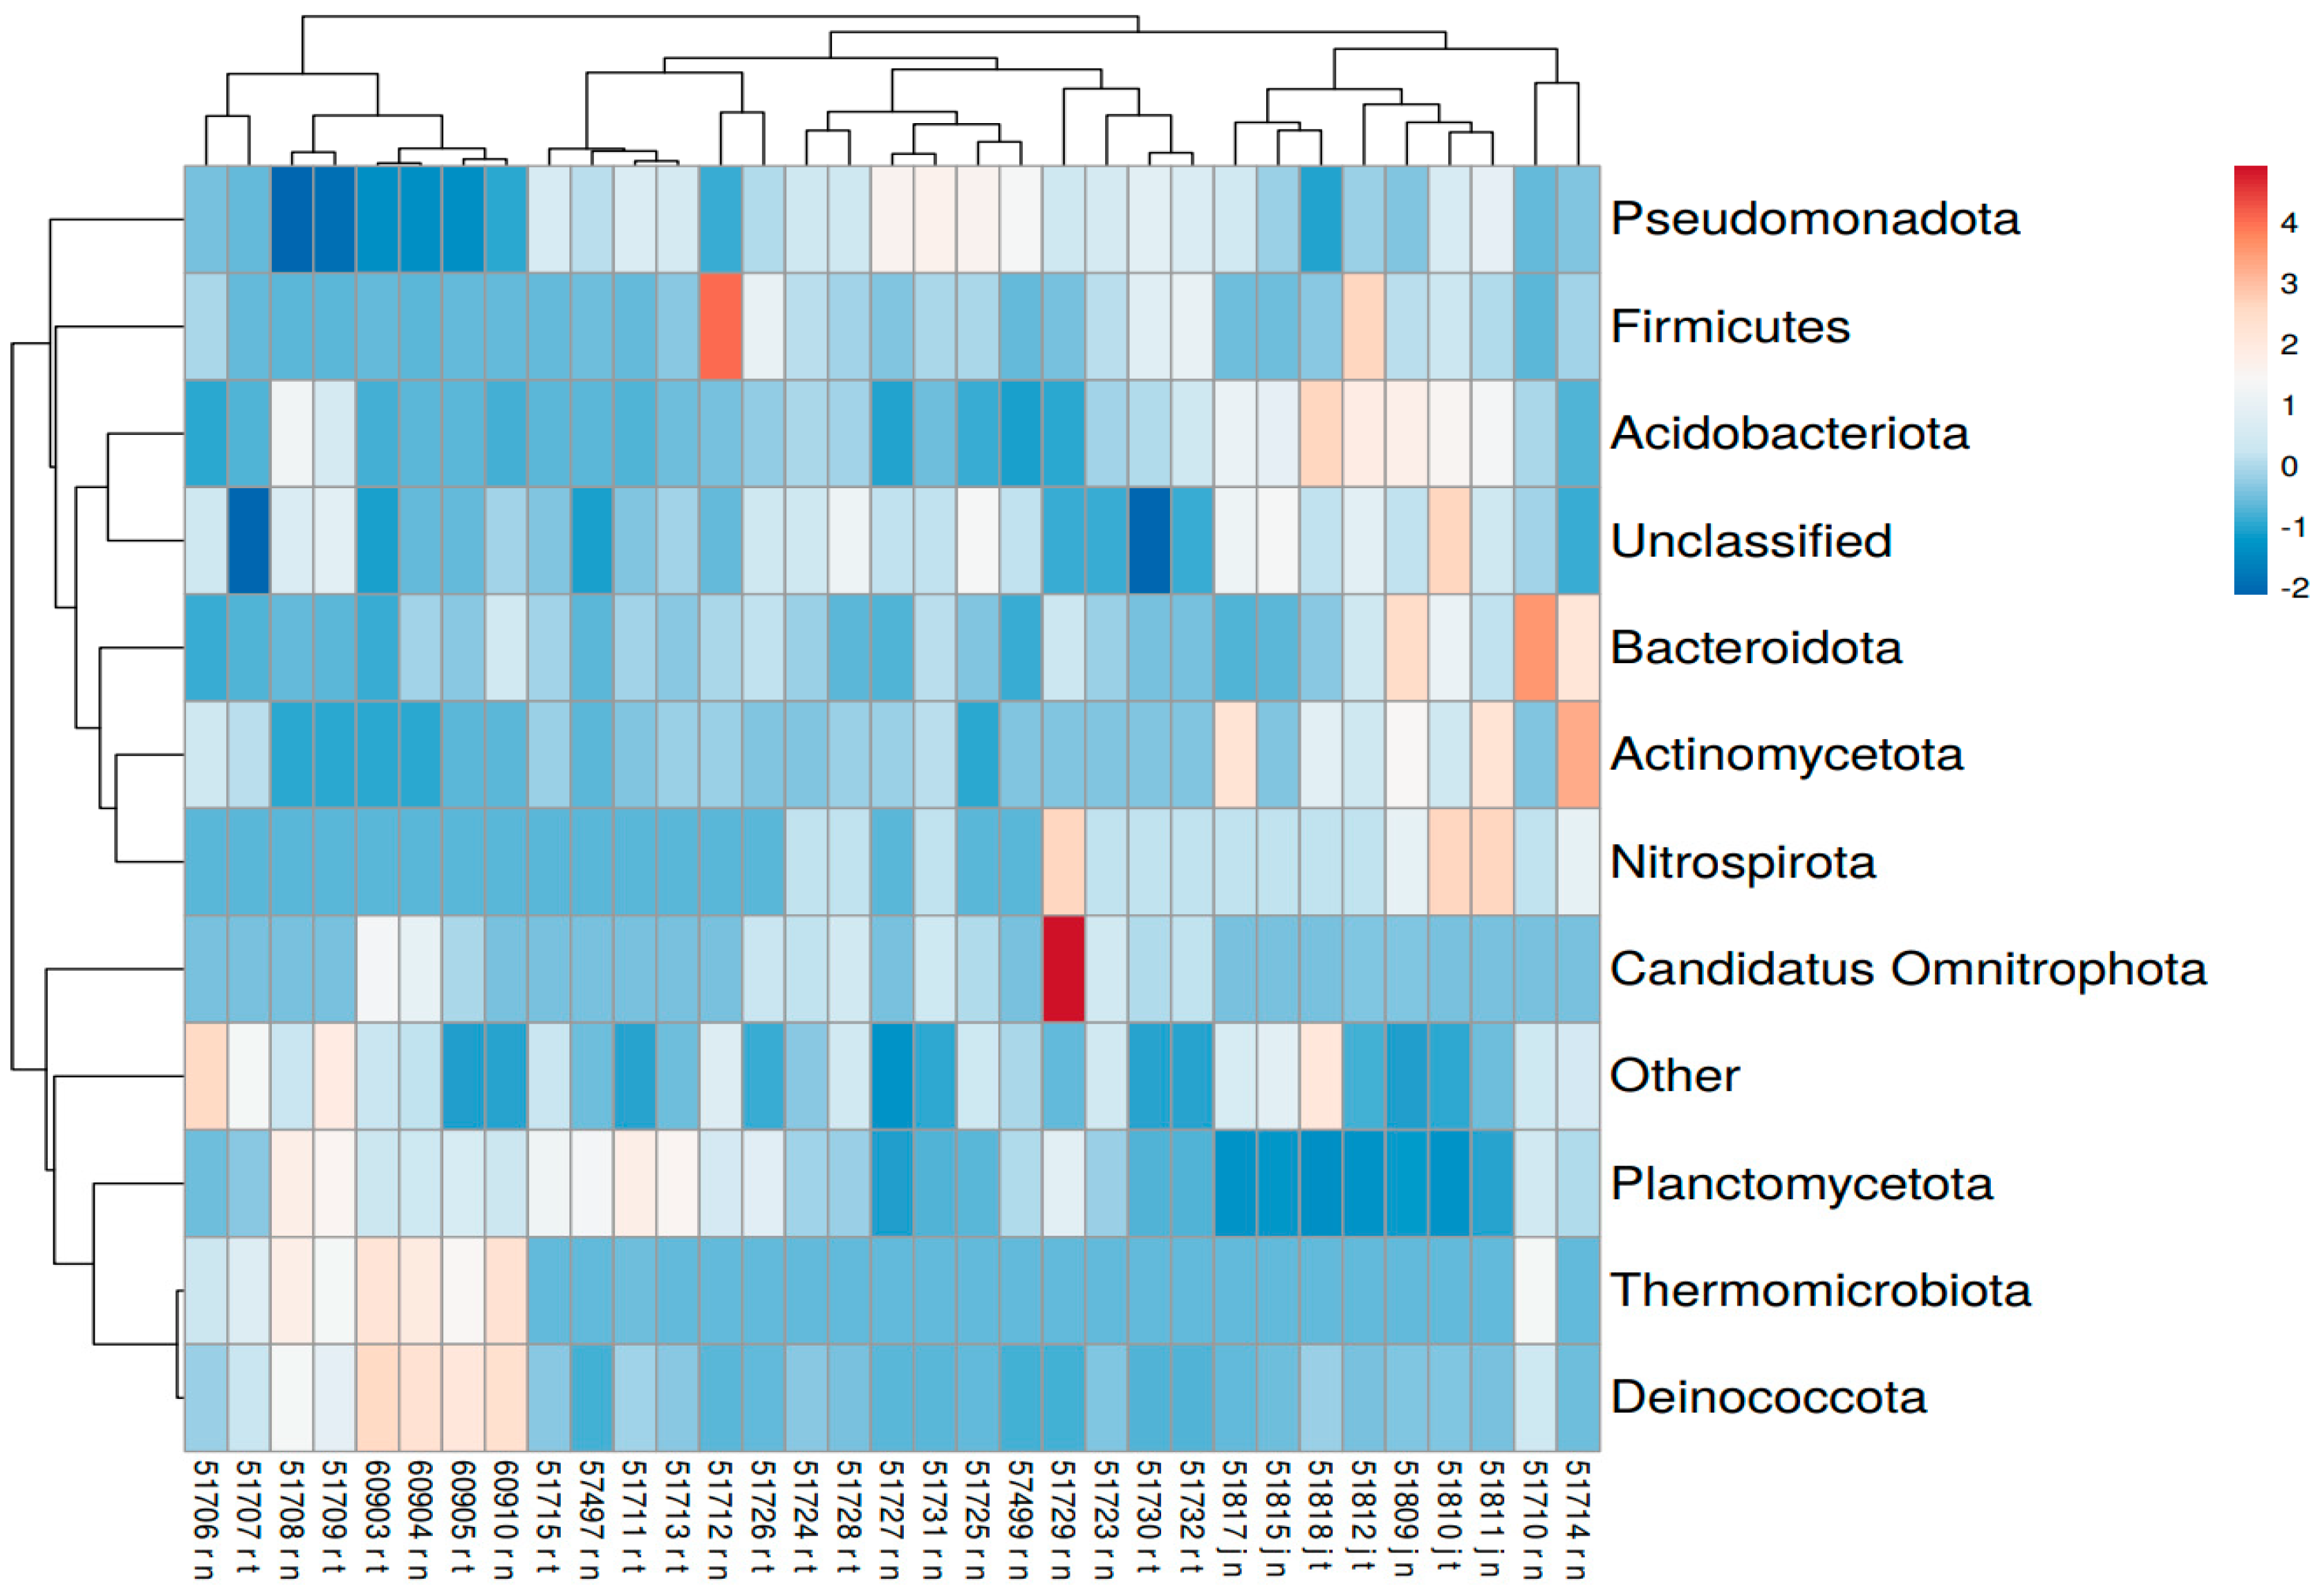
  • Using 16S rRNA sequencing, a long list of bacteria was detected, the most common of which were Pseudomonadota, Planctomycetota, Bacillota, Acidobacteriota, and Candidatus Omnitrophota. Some were potentially pathogenic to humans (Coxiella, Leptospira, Listeria, Corynebacterium, Mycobacterium, and Pseudomonas).
  • It was detected that each of the five hotel buildings in this study has its own bacterial diversity inside its water supply system.
  • Several methods are needed to analyze water samples completely: microbiological methods, microscopy PCR, and sequencing. Then, we can see the whole picture of bacterial and FLP diversity.

Supplementary Materials

The following supporting information can be downloaded at: https://www.mdpi.com/article/10.3390/w17101485/s1. Table S1, Taxons 18S, Table S2, Taxons 18S hotels, Table S3, Cold water 16S taxons, Table S4, Cold water 16S taxons, Table S5, Hotel 16S taxons, Table S6, ClusvisHeatmap cold water, Table S7, ClusvisHeatmap hot water, Table S8, ClusvisHeatmap hotels.

Author Contributions

Resources, G.K.; Writing—original draft, A.M.; Writing—review & editing, A.B. and L.G.-I.; Supervision, J.Ķ. and L.G.-I.; Project administration, D.P., O.V. and A.B. All authors have read and agreed to the published version of the manuscript.

Funding

This research was funded by National Science Base funding from the state budget of Latvia.

Data Availability Statement

The original contributions presented in this study are included in the article/Supplementary Materials. Further inquiries can be directed to the corresponding author.

Acknowledgments

The authors would like to express their gratitude to the Institute of Food Safety, Animal Health, and Environment “BIOR” for supporting this study and to all apartment owners and hotel representatives for agreeing to participate. The authors would like to express their greatest gratitude to Svetlana Makarova, a colleague who, unfortunately, is no longer with us.

Conflicts of Interest

The authors declare no conflict of interest.

References

  1. Muchesa, P.; Leifels, M.; Jurzik, L.; Barnard, T.G.; Bartie, C. Detection of amoeba-associated Legionella pneumophila in hospital water networks of Johannesburg. S. Afr. J. Infect. Dis. 2018, 33, 72–75. [Google Scholar] [CrossRef]
  2. World Health Organization (WHO). Legionella. In Guidelines for Drinking Water. Addendum: Microbiological Agents in Drinking Water, 2nd ed.; WHO: Geneva, Switzerland, 2002. [Google Scholar]
  3. Valciņa, O.; Pūle, D.; Ķibilds, J.; Labecka, L.; Terentjeva, M.; Krūmiņa, A.; Bērziņš, A. Evaluation of genetic diversity and virulence potential of Legionella pneumophila isolated from water supply systems of residential buildings in Latvia. Pathogens 2023, 12, 884. [Google Scholar] [CrossRef]
  4. Shaheen, M.; Ashbolt, N. Free-Living Amoebae Supporting Intracellular Growth May Produce Vesicle-Bound Respirable Doses of Legionella Within Drinking Water Systems. Expo. Health 2017, 110, 201–209. [Google Scholar] [CrossRef]
  5. Armstrong, T.W.; Haas, C.N. A Quantitative Microbial Risk Assessment Model for Legionnaires’ Disease: Animal Model Selection and Dose-Response Modelling. Risk Anal. 2007, 27, 1581–1596. [Google Scholar] [CrossRef]
  6. Berendt, R.F.; Young, H.W.; Allen, R.G.; Knutsen, G.L. Dose-Response of Guinea Pigs Experimentally Infected with Aerosols of Legionella pneumophila. J. Infect. Dis. 1980, 141, 186–192. [Google Scholar] [CrossRef]
  7. Armstrong, T.W.; Haas, C.N. Legionnaires’ disease: Evaluation of a quantitative microbial risk assessment model. J. Water Health 2008, 6, 149–166. [Google Scholar] [CrossRef]
  8. Kilvington, S.; Gray, T.; Dart, J.; Morlet, M.; Beeching, J.R.; Frazer, D.G.; Matheson, M. Acanthamoeba Keratitis: The Role of Domestic Tap Water Contamination in the United Kingdom. Investig. Ophthalmol. Vis. Sci. 2004, 45, 165–169. [Google Scholar] [CrossRef]
  9. Ji, P.; Rhoads, W.J.; Edwards, M.A.; Pruden, A. Effect of heat shock on hot water plumbing microbiota and Legionella pneumophila control. Microbiome 2018, 6, 30–44. [Google Scholar] [CrossRef]
  10. Bertelli, C.; Courtois, S.; Rosikiewicz, M.; Piriou, P.; Aeby, S.; Robert, S.; Loret, J.-F.; Greub, G. Reduced Chlorine in drinking water distribution systems impacts bacterial biodiversity in biofilms. Front. Microbiol. 2018, 9, 2520. [Google Scholar] [CrossRef]
  11. Ling, F.; Whitaker, R.; Le Chevallier, M.W.; Liu, W.-T. Drinking water microbiome assembly induced by water stagnation. ISME 2018, 12, 1520–1531. [Google Scholar] [CrossRef]
  12. Zimoch, I.; Paciej, J. Microbiological contaminants of Legionella spp. in hot water in public buildings in Silesia province. In Water Supply and Wastewater Disposal; Lublin University of Technology: Lublin, Poland, 2018; pp. 344–357. [Google Scholar]
  13. Delafont, V.; Bouchon, D.; Héchard, Y.; Moulin, L. Environmental factors shaping cultured free-living amoebae and their associated bacterial community within drinking water network. Water Res. 2016, 100, 382–392. [Google Scholar] [CrossRef]
  14. Scaturro, M.; Buffoni, M.; Girolamo, A.; Cristino, S.; Girolamini, L.; Mazzotta, M.; Bucci Sabattini, M.A.; Zaccaro, C.M.; Chetti, L.; Laboratory, M.A.N.; et al. Performance of Legiolert test vs. ISO 11731 to confirm Legionella pneumophila contamination in potable water samples. Pathogens 2020, 9, 690. [Google Scholar] [CrossRef]
  15. Vaerewijck, M.J.M.; Sabbe, K.; Hende, J.; Bare, J.; Houf, K. Sampling strategy, occurence and diversity of free-living protozoa in domestic refrigerators. J. App. Microbiol. 2010, 109, 1556–1578. [Google Scholar]
  16. Schroeder, J.M.; Booton, G.C.; Hay, J. Use of Subgenic 18S Ribosomal DNA PCR and Sequencing for Genus and Genotype Identification of Acanthamoebae from Humans with Keratitis and from Sewage Sludge. J. Clin. Microbiol. 2001, 39, 1903–1911. [Google Scholar] [CrossRef]
  17. Calvez, T.; Trouilhe, M.C.; Humeau, O. Detection of free-living amoebae by using multiplex quantitative PCR. Mol. Cell. Probes. 2012, 26, 116–120. [Google Scholar] [CrossRef]
  18. Solgi, R.; Niyyati, M.; Haghihgi, A.; Mojarad, N.E. Occurence of thermotolerant Hartmanella vermiformis and Naegleria Spp. in Hot Springs of Ardebil Province, northwest Iran. Iran. J. Parasitol. 2012, 7, 47–52. [Google Scholar]
  19. Stoeck, T.; Bass, D.; Nebel, M.; Christen, R.; Jones, M.D.; Breiner, H.W.; Richards, T.A. Multiple marker parallel tag environmental dna sequencing reveals a highly complex eukaryotic community in marine anoxic water. Mol. Ecol. 2010, 19, 21–31. [Google Scholar] [CrossRef]
  20. Bradley, I.M.; Pinto, A.J.; Guest, J.S. Design and evaluation of illumina miseq compatible, 18s rRNA gene-specific primers for improved characterization of mixed phototrophic communities. Appl. Environ. Microbiol. 2016, 82, 5878–5891. [Google Scholar] [CrossRef]
  21. Klindworth, A.; Pruesse, E.; Schweer, T.; Peplies, J.; Quast, C.; Horn, M. Evaluation of general 16s ribosomal RNA gene PCR primers for classical and next-generation sequencing-based diversity studies. Nucleic Acids Res. 2013, 41, e1. [Google Scholar] [CrossRef] [PubMed]
  22. Metsalu, T.; Vilo, J. ClustVis: A web tool for visualizing clustering of multivariate data using Principal Component Analysis and heatmap. Nucleic Acids Res. 2015, 43, 566–570. [Google Scholar] [CrossRef] [PubMed]
  23. World Health Organization. Legionella and Prevention of Legionellosis; WHO: Geneva, Switzerland, 2007; p. 30. [Google Scholar]
  24. Li, H.; Li, S.; Tang, W.; Yang, Y.; Zhao, J.; Xia, S.; Zhang, W.; Wang, H. Influence of secondary water supply systems on microbial community structure and opportunistic pathogen gene markers. Water Res. 2018, 136, 160–168. [Google Scholar] [CrossRef]
  25. Jing, H.; Sahle-Demessie, E.; Sorial, A.G. Inhibition of biofilm growth on polymer -MWCNTs composites and metal surfaces. Sci. Total Environ. 2018, 633, 167–178. [Google Scholar] [CrossRef]
  26. Srinivasan, A.; Bova, G.; Ross, T.; Mackie, K.; Paquette, N.; Merz, W.; Perl, T.M. A 17-month evaluation of a chlorine dioxide water treatment system to control Legionella species in a hospital water supply. Infect. Control. Hosp. Epidemiol. 2003, 24, 575–579. [Google Scholar] [CrossRef]
  27. Valciņa, O.; Pūle, D.; Mališevs, A.; Trofimova, J.; Makarova, S.; Konvisers, G.; Bērziņš, A.; Krūmiņa, A. Co-Occurrence of Free-Living Amoeba and Legionella in Drinking Water Supply Systems. Medicina 2019, 55, 492. [Google Scholar] [CrossRef]
  28. Quandt, C.A.; Beaudet, D.; Corsaro, D.; Walochnik, J.; Michel, R.; Corradi, N.; James, T.Y. The genome of an intranuclear parasite, Paramicrosporidium saccamoebae, reveals alternative adaptations to obligate intracellular parasitism. eLife 2017, 6, e29594. [Google Scholar] [CrossRef]
  29. Sales-Ortells, H.; Medema, G. Screening-Level Risk Assessment of Coxiella burnetii (Q Fever) Transmission via Aeration of Drinking Water. Environ. Sci. Technol. 2012, 46, 4125–4133. [Google Scholar] [CrossRef]
  30. Wynwood, S.J.; Graham, G.C.; Weier, S.L.; Collet, T.D.; McKay, D.B.; Craig, S.B. Leptospirosis from water sources. Pathog. Glob. Health 2014, 108, 334–338. [Google Scholar] [CrossRef]
  31. Rusin, P.A.; Rose, J.B.; Gerba, C.P. Health significance of pigmented bacteria in drinking water. War. Sci. Tech. 1997, 11–12, 21–27. [Google Scholar] [CrossRef]
  32. Vaerewijck, M.J.M.; Huys, G.; Palomino, J.C.; Swings, J.; Portaels, F. Mycobacteria in drinking water distribution systems: Ecology and significance for human health. FEMS Microbiol. Rev. 2005, 29, 911–934. [Google Scholar] [CrossRef] [PubMed]
  33. Falkinham, J.O., III; Norton, C.D.; Le Chevallier, M.W. Factors Influencing Numbers of Mycobacterium avium, Mycobacterium intracellulare, and other Mycobacteria in Drinking Water Distribution Systems. Appl. Environ. Microbiol. 2000, 3, 1225–1231. [Google Scholar] [CrossRef]
  34. Walker, J.; Moore, G. Pseudomonas aeruginosa in hospital water systems: Biofilms, guidelines, and practicalities. J. Hosp. Infect. 2014, 89, 324–327. [Google Scholar] [CrossRef]
  35. Zhang, C.; Qin, K.; Struewing, I.; Buse, H.; Domingo, J.S.; Lytle, D.; Lu, J. The bacterial community diversity of bathroom hot tap water was significantly lower than that of cold tap and shower water. Front. Microbiol. 2021, 12, 625324. [Google Scholar] [CrossRef]
  36. Kori, J.A.; Mahar, R.B.; Vistro, M.R.; Tariq, H.; Khan, I.A.; Goel, R. Metagenomic analysis of drinking water samples collected from treatment plants of Hyderabad City and Mehran University Employees Cooperative Housing Society. Environ. Sci. Pollut. Res. 2019, 26, 29052–29064. [Google Scholar] [CrossRef]
  37. Mehari, Y.T.; Hayes, J.; Redding, K.S.; Mariappan, P.V.G.; Gunderson, J.H.; Farone, A.L.; Farone, M.B. Description of ‘Candidatus Berkiella aquae’ and ‘Candidatus Berkiella cookevillensis’, two intranuclear bacteria of freshwater amoebae. Int. J. Syst. Evol. Microbiol. 2016, 66, 536–541. [Google Scholar] [CrossRef]
  38. Mrva, M. Mayorella vespertilioides Page, 1983 (Amoebozoa)—New host for the ectoparasitic fungus Amoebophilus simplex (Zygomycota). Biologia 2011, 66, 645–647. [Google Scholar] [CrossRef]
  39. Deepika, D.S.; Sowmya, K.L. Bioindices of Bacterial Communities. Int. J. Curr. Microbiol. Appl. Sci. 2016, 12, 219–233. [Google Scholar] [CrossRef]
  40. Henne, K.; Kahlisch, L.; Brettar, I.; Höfle, M.G. Analysis of Structure and Composition of Bacterial Core Communities in Mature Drinking Water Biofilms and Bulk Water of a Citywide Network in Germany. Appl. Environ. Microbiol. 2012, 78, 3530–3538. [Google Scholar] [CrossRef]
  41. Revetta, R.P.; Pemberton, A.; Lamendella, R.; Iker, B.; Domingo, J.W.S. Identification of bacterial populations in drinking water using 16S rRNA-based sequence analyses. Water Res. 2010, 44, 1353–1360. [Google Scholar] [CrossRef]
  42. Gavarāne, I.; Trofimova, J.; Mališevs, A.; Valciņa, O.; Kirjušina, M.; Rubeniņa, I.; Bērziņš, A. DNA extraction from amoebal isolates and genotype determination of Acanthamoeba from tap water in Latvia. Parasitol. Res. 2018, 117, 3299–3303. [Google Scholar] [CrossRef]
  43. Vilne, B.; Grantiņa-Ieviņa, L.; Ķibilds, J.; Mališevs, A.; Konvisers, G.; Makarova, S.; Pūle, D.; Valciņa, O. Investigating Bacterial and Free-Living Protozoa Diversity in Biofilms of Hot Water Pipes of Apartment Buildings in the City of Riga (Latvia). Front. Water 2021, 3, 799840. [Google Scholar] [CrossRef]
  44. Valciņa, O.; Pūle, D.; Ķibilds, J.; Lazdāne, A.; Trofimova, J.; Makarova, S.; Konvisers, G.; Ķimse, L.; Krūmiņa, A.; Bērziņš, A. Prevalence and Genetic Diversity of Legionella spp. in Hotel Water-Supply Systems in Latvia. Microorganisms 2023, 11, 596. [Google Scholar] [CrossRef]
  45. Lasjerdi, Z.; Niyyati, M.; Haghighi, A.; Shahabi, S.; Biderouni, F.T.; Taghipour, N.; Eftekhar, M.; Mojarad, E.N. Potentially pathogenic free-living amoebae isolated from hospital wards with immunodeficient patients in Tehran, Iran. Parasitol. Res. 2011, 109, 575–580. [Google Scholar] [CrossRef]
  46. Springe, G.; Juhna, T. Water supply and sanitation in Riga: Development, present, and future. In Environmental History of Water: Global Views on Community Water Supply and Sanitation; Juuti, P.S., Katko, T.S., Vuorinen, H.S., Eds.; Wiley: New York, NY, USA, 2007; pp. 401–410. [Google Scholar]
Figure 1. Provisional distribution of surface and underground water in the centralized water supply system of the city of Riga. The right Daugava River bank (red color) is supplied with underground water, but the left bank (blue color) is supplied with treated ground Daugava River water.
Water 17 01485 g001
Figure 2. Correlation between building floor and Legionella spp. quantity (colony forming units per liter (CFU/L)) in cold (A) and hot (B) water samples. Only Legionella spp. positive samples are included in this figure.
Water 17 01485 g002
Figure 3. Locations of water sampling places in Riga city. (A) Locations of positive (red points) and negative (green points) Legionella spp. samples. Black triangles designate hotel locations. (B) Locations of positive (red points) and negative (green points) FLP samples.
Water 17 01485 g003
Figure 4. Protozoa diversity detected with 18S rRNA sequencing in cold and hot water (A) and before and after cultivation of samples (B), indicated as average percentage of particular sequences from the total sample composition.
Water 17 01485 g004
Figure 5. Free-living amoeba (FLA) and Legionella coexistence in apartment (A) and hotel (B) water samples detected with 18S and 16S rRNA sequencing.
Water 17 01485 g005
Figure 6. Heatmap of bacterial diversity clusters in hotel water samples. R—Riga, J—Jurmala, t—flow-through water, n—non-flow-through water. Both rows and columns are clustered using correlation distance and average linkage.
Water 17 01485 g006
Table 1. Quantity of water samples taken in three city apartments depending on water temperature and sampling place inside the apartment.
Water SamplesRigaSalaspilsJurmala
Hot water3721
Cold water3821
Shower5042
Kitchen2600
Apartments3821
Table 2. Primers and their sequences used in free-living amoeba detection with PCR.
PrimerPrimer SequenceReference
JDP1-F“5′-GGCCCAGATCGTTTACCGTGAA-3′”[16]
JDP2-R“5′-TCTCACAAGCTGCTAGGGAGTCA-3′”
Vahl_560_F“5′-AGGTAGTGACAAGMYRTAGYGACT-3′”[17]
Vahl_730_R“5′-GGGCGTTTTAACTACARCAGTATTA-3′”
Amo_1400_F“5′-ATGCCGACCARSGATYMGGAG-3′”
Amo_1540_R“5′-CAAGSTGCYMGGGGAGTCAT-3′”
Hartm Solgi F“5′-GCT CCA ATA GCG TAT ATT AA-3′”[18]
Hartm Solgi R“5′-AGA AAG AGC TAT CAA TCT GT-3′”
Table 3. Summary of the results of the presence of Legionella spp. and FLP in the tested apartment samples.
ResultsCold Water Samples
(n = 41)
Hot Water Samples (n = 40)Total
(n = 81)
Legionella spp. positive by ISO 11731: 2017 method18 (43.90%)23 (57.50%)41 (50.60%)
Legionella spp. positive by real-time PCR 14 (34.15%)25 (62.5%)39 (48.10%)
Legionella spp. positive by at least one method22 (53.66%)31 (77.5%)53 (65.43%)
Legionella spp. positive by both methods10 (24.39%)17 (42.5%)27 (33.33%)
FLP positive by microscopy24 (58.54%)21 (52.50%)45 (55.60%)
FLP positive by PCR17 (41.46%)15 (37.5%)32 (39.50%)
FLP positive by at least one method24 (58.54%)21 (52.5%)45 (55.56%)
FLP positive by both methods17 (41.46%)15 (37.5%)32 (39.51%)
Table 4. Summary of the water consumption results in the apartments tested for Legionella spp. and FLP presence.
ParameterCold-Water Consumption Amount, m3 per MonthHot Water Consumption Amount, m3 per Month
Legionella spp. positive by ISO 11731: 2017 method3.38 (1.00–6.00)2.71 (1.00–6.00)
Legionella spp. negative by ISO 11731: 2017 method4.11 (0.80–12.00)2.69 (2.00–3.20)
FLP positive by microscopy3.39 (0.80–12.00)2.75 (1.20–6.10)
FLP negative by microscopy4.37 (1.00–7.00)2.66 (1.00–4.10)
Table 5. Results of statistical analysis of the difference between Legionella and FLP positive and negative samples from the water supply system at Daugava left and right banks.
χ2p-Value
Legionella0.010.94
FLP0.40.53
Table 6. Summary of the Legionella and FLP positive water sample quantity in percent depending on sampling place in the apartment. Detected with microscopy and PCR.
Water SampleLegionella spp. Positive %FLP Positive %
Shower46.4 48.2
Kitchen57.7 73.1
Table 7. The most common protozoa detected with 18S rRNA sequencing in apartment water supply systems from Riga left and right Daugava River banks and hotel water samples indicated as average relative abundance.
ProtozoaLeft Bank %Right Bank %Hotels %
Vermamoeba7.5610.2513.64
Uncultured eukaryote3.173.603.33
Chromulinales2.884.0411.39
Spumella0.621.140.77
Oligohymenophorea0.288.914.02
Phyllopharyngea1.385.961.92
Euamoebida3.694.090.76
Chytridiomycetes1.751.142.56
Haplotaxida2.688.266.09
Chaetonotida (hairybellies)38.091.609.37
Table 8. Average, minimal, and maximal bacterial diversity indexes in cold, hot water samples from apartments and hot water samples from hotels.
Shannon’s Diversity IndexSimpson’s DiversitySimpson’s Reciprocal IndexBerger–Parker’s DiversityFisher’s Index
Average, cold3.190.92215.2630.18689.419
Average, hot2.720.86111.1870.26475.433
Average, hotel2.320.8016.1810.3943.706
Minimal, cold2.250.7173.5390.062.399
Minimal, hot0.390.1461.1710.0830.819
Minimal, hotel1.340.5622.2820.1331.499
Maximal, cold3.900.97135.0180.521535.168
Maximal, hot3.810.96730.5140.923443.079
Maximal, hotel3.0140.93114.5440.9296.693
Disclaimer/Publisher’s Note: The statements, opinions and data contained in all publications are solely those of the individual author(s) and contributor(s) and not of MDPI and/or the editor(s). MDPI and/or the editor(s) disclaim responsibility for any injury to people or property resulting from any ideas, methods, instructions or products referred to in the content.

