Article

Coastal Flooding Hazards in Northern Portugal: A Practical Large-Scale Evaluation of Total Water Levels and Swash Regimes

by
Jose Eduardo Carneiro-Barros
1,2,*,
Ajab Gul Majidi
1,2,
Theocharis Plomaritis
3,
Tiago Fazeres-Ferradosa
1,2,
Paulo Rosa-Santos
1,2 and
Francisco Taveira-Pinto
1,2
1
Hydraulics, Water Resources, and Environmental Division, Department of Civil Engineering, Faculty of Engineering, University of Porto, 4200-465 Porto, Portugal
2
Interdisciplinary Centre of Marine and Environmental Research, University of Porto (CIIMAR), 4450-208 Matosinhos, Portugal
3
Faculty of Marine and Environmental Science, Department of Applied Physics, University of Cadiz, Puerto Real, 11510 Cádiz, Spain
*
Author to whom correspondence should be addressed.
Water 2025, 17(10), 1478; https://doi.org/10.3390/w17101478
Submission received: 13 April 2025 / Revised: 8 May 2025 / Accepted: 12 May 2025 / Published: 14 May 2025
(This article belongs to the Special Issue Urban Flood Frequency Analysis and Risk Assessment)

Abstract

:
The northern Portuguese coast has been increasingly subjected to wave-induced coastal flooding, highlighting a critical need for comprehensive overwash assessment in the region. This study systematically evaluates the total water levels (TWLs) and swash regimes over a 120 km stretch of the northern coast of Portugal. Traditional approaches to overwash assessment often rely on detailed models and location-specific data, which can be resource-intensive. The presented methodology addresses these limitations by offering a pragmatic balance between accuracy and practicality, suitable for extended coastal areas with reduced human and computational resources. A coastal digital terrain model was used to extract essential geomorphological features, including the dune toe, dune crest, and/or crown of defense structures, as well as the sub-aerial beach profile. These features help establish a critical threshold for flooding, alongside assessments of beach slope and other relevant parameters. Additionally, a wave climate derived from a SWAN regional model was integrated, providing a comprehensive time-series hindcast of sea-states from 1979 to 2023. The wave contribution to TWL was considered by using the wave runup, which was calculated using different empirical formulas based on SWAN’s outputs. Astronomical tides and meteorological surge—the latter reconstructed using a long short-term memory (LSTM) neural network—were also integrated to form the TWL. This integration of geomorphological and oceanographic data allows for a straightforward evaluation of swash regimes and consequently overwash potential. The accuracy of various empirical predictors for wave runup, a primary hydrodynamic factor in overwash processes, was assessed. Several reports from hazardous events along this stretch were used as validation for this method. This study further delineates levels of flooding hazard—ranging from swash and collision to overwash at multiple representative profiles along the coast. This regional-scale assessment contributes to a deeper understanding of coastal flooding dynamics and supports the development of targeted, effective coastal management strategies for the northern Portuguese coast.

1. Introduction

The Portuguese coast, known for its dynamic and energetic wave climate [1], plays a crucial role in the nation’s socio-economic structure. It hosts significant infrastructure and a substantial portion of the population while contributing to 80% of the country’s GDP [2]. This region, which directly faces strong storms from the North Atlantic, has increasingly experienced wave-induced flooding events [3], a trend expected to worsen due to climate change and rising sea-levels [4,5].
Despite the presence of coastal protection structures such as groins and breakwaters, these measures often prove insufficient in preventing frequent and severe coastal flooding. This flooding poses significant risks to local communities, economies, and ecosystems. With the increasing likelihood of extreme weather events, there is a growing need for improved methods to evaluate and manage coastal flooding risks [6].
The study area covers approximately 120 km of the Northern Portuguese coast, extending from the Minho River mouth at Caminha to the Barrinha de Esmoriz outlet [7]. This stretch aligns with the classification of the Portuguese Environmental Agency (APA) within its Coastal Programs (Programas da Orla Costeira—POC) [8]. Additionally, this study includes Furadouro, located 10 km south of Espinho, which is a well-documented site for coastal flooding episodes in Portugal [9,10]. The frequent flooding events in Furadouro provide a valuable reference for validating and calibrating methods for coastal flooding assessments.
This coastal stretch consists of a mix of low, sandy beaches and rocky shores, along with various coastal defense structures, primarily seawalls and breakwaters. The study area includes the municipalities of Caminha, Viana do Castelo, Esposende, Póvoa de Varzim, Vila do Conde, Matosinhos, Porto, Vila Nova de Gaia, Espinho, and Ovar. It is a densely populated and highly developed region, with significant socio-economic activity concentrated along the coastline. However, sporadic development and inadequate coastal management have contributed to environmental degradation and increased vulnerability to flooding. The area is also influenced by the discharge of major river basins, including the Minho, Lima, Cávado, Ave, and Douro, which play a key role in shaping coastal dynamics. Figure 1 illustrates the study area, highlighting key locations where wave overtopping has occurred during coastal flooding events.
Coastal water levels are driven by a complex interplay of factors, influenced by local, regional, and global processes [4,5]. Among these, tides, storm surges, and wave action are the primary components that shape the magnitude and variability of coastal water levels. Together, these factors define the total water level (TWL), a key metric for understanding and predicting coastal flooding. TWL serves as the basis for regional and global coastal flooding models, integrating the contributions of astronomical tides (T), wave runup (R2), and storm surges (S) [11,12].
TWL = T + R2 + S
While tides are predictable and driven by gravitational forces from the moon and sun, surges are influenced by meteorological factors such as atmospheric pressure and wind, making them more challenging to forecast. Waves, particularly in shallow coastal zones, add another layer of complexity, with infra-gravity (IG) waves playing a significant role in amplifying water levels near the shore. These long-period waves, generated by wave groups, can grow substantially as they propagate over a sloping seabed, contributing to extreme water levels during storm events [13,14,15]. The interplay of these components varies globally, with some regions dominated by tides or surges, while others are heavily influenced by wave dynamics [16].
Wave runup (R2) represents an additional vertical elevation of shoreline water level oscillations caused by ocean waves and serves as a critical component in assessing coastal flooding hazards. It plays a key role in determining the landward extent of wave action, influencing both coastal defense structures and sediment transport, particularly during storms [17,18]. Wave runup consists of two primary components: wave setup ( η )—the elevation of mean water levels due to breaking waves—and swash oscillations, which define the shifting boundary between sea and land [19]. During swash events, water moves landward in the uprush phase and retreats seaward in the downrush phase. If wave runup exceeds a critical threshold, such as the crest of a dune or a coastal defense structure, it leads to wave overtopping or overwash [20,21,22]. This abrupt increase in water levels during hazardous events intensifies the effects of tides and storm surges, making wave runup a crucial factor in managing coastal flooding.
Tailored and detailed approaches for coastal flooding risk assessment are often developed for specific local case studies, for instance, using high-resolution numerical modelling for obtaining wave overtopping discharges and flood modelling [9,23,24]. While these localized studies can provide accurate results, they require significant human and computational resources, limiting their application to larger areas [25,26].
Empirical formulas for wave runup are a good strategy to overcome computational limitations from numerical models, being practical and efficient [19]. However, they have some limitations regarding their efficiency in different setups from the ones they were developed for [27] and the omission of local small-scale processes. Despite that, they can be a reliable resort for analyzing coastal flooding hazards in broader scales.
Understanding each component of TWL is essential for coastal flood risk assessment, the design of defense structures, and managing the impacts of urban floods and extreme events such as hurricanes and cyclones. This paper explores the contributions of tides, surges, and waves to TWL, emphasizing their interactions and implications for coastal flooding. It introduces a systematic assessment of TWL, swash regimes, and consequently overwash potential along this critical stretch of coastline, aiming to balance practicality with the need for accurate risk prediction and mitigation strategies in response to these growing threats. The main objective of this study is to develop and evaluate a regional-scale methodology for estimating total water levels and classifying swash regimes, using a combination of empirical formulas, geospatial data, machine learning, and long-term oceanographic records.

2. Materials and Methods

2.1. Coastal Topography Data and Geoprocessing

Local topography data were obtained from the Direção Geral do Territorio (DGT) in partnership with the Portuguese Environmental Agency (APA), providing a LiDAR point cloud that can be translated into a digital terrain model (DTM) with 2 m resolution based on light detection and ranging (LIDAR) and aero-photogrammetry. This DTM includes both bathymetric and topographic surveys, extending roughly 400 m inland and 600 m seaward. It conforms to the PT-TM06/ETRS89 reference system and utilizes the Cascais Helmert 38 altimetric datum, and elevations refer to mean sea-level. The data, collected in December 2011, do not indicate whether they were gathered during winter or summer, making it a generalized model for Portugal’s coastal regions. The processing of these data involved the digital removal of buildings, although no substantial smoothing of the terrain was applied. The bathymetric component of the DTM exhibits irregularities and data gaps, which may limit its applicability in methods requiring high-precision underwater topography, unless further processing is applied. However, the landward section remains appropriate for the intended analysis, as it does not present any sort of irregularities.
The coastline was delineated using elevation points around z = 2 m, corresponding to the average astronomical tide along the northern Portuguese coast. Transects perpendicular to the coastline were established across this region, spaced at 200 to 300 m intervals, and extending 150 m in total—50 m seaward and 100 m inland from the designated coastline points—resulting in a total of 400 transects. The orientation of each transect, relative to the shore, is determined by constructing a line segment between points northwards and southwards, and then generating a perpendicular vector from this line. Transects with orientations that significantly deviated from surrounding ones were discarded in areas with highly irregular coastal contours, as their divergence could compromise the reliability of data.
The LIDAR point cloud data were converted into a geodataframe (gdf) using the Python library GeoPandas. Elevations along each transect were derived by accessing the gdf at these specific locations. An interactive chart of each profile was subsequently generated, allowing users to manually identify and extract key features of each beach profile, such as the start of the foreshore, closely related to the mean average tide, the dune toe, and the dune crest or critical threshold. The foreshore slope, a key factor in wave runup and overwash dynamics, was calculated based on the positions of the shoreline and the dune toe. Despite attempts by several studies to automate these feature extractions through advanced methods like machine learning, no universally accurate method has yet been established for every coastal geomorphological configuration. Thus, manual analysis by experienced users remains more effective. A general view of the transects’ location, along with key features, is presented in Figure 2.

2.2. Ocean Variables and Numerical Modelling

This study employs the SWAN model for wind–wave simulation [28,29], using hourly ERA5 wind reanalysis data with a spatial resolution of 0.25 × 0.25°, produced by the European Centre for Medium-Range Weather Forecasts (ECMWF) and renowned for its precision in climate research. To balance local wave dynamics with computational efficiency, an unstructured grid system was utilized, featuring cell sizes ranging from 0.002° (0.25 km) to 0.26° (29 km). The model configuration includes 114,518 vertices and 220,485 internal cells. Bathymetric input was sourced from the General Bathymetric Chart of the Oceans (GEBCO) dataset.
The SWAN model was run in non-stationary mode, using a JONSWAP spectrum with parameters like significant wave height, peak wave period, and peak wave direction, setting the peak enhancement factor at 3.3, which is the default value. Calibration of the model involved comparing its outputs with data from wave buoys operated by the Portuguese Hydrographic Institute and the Spanish Port Authority, leading to adjustments in the wind drag formulation and scaling factors.
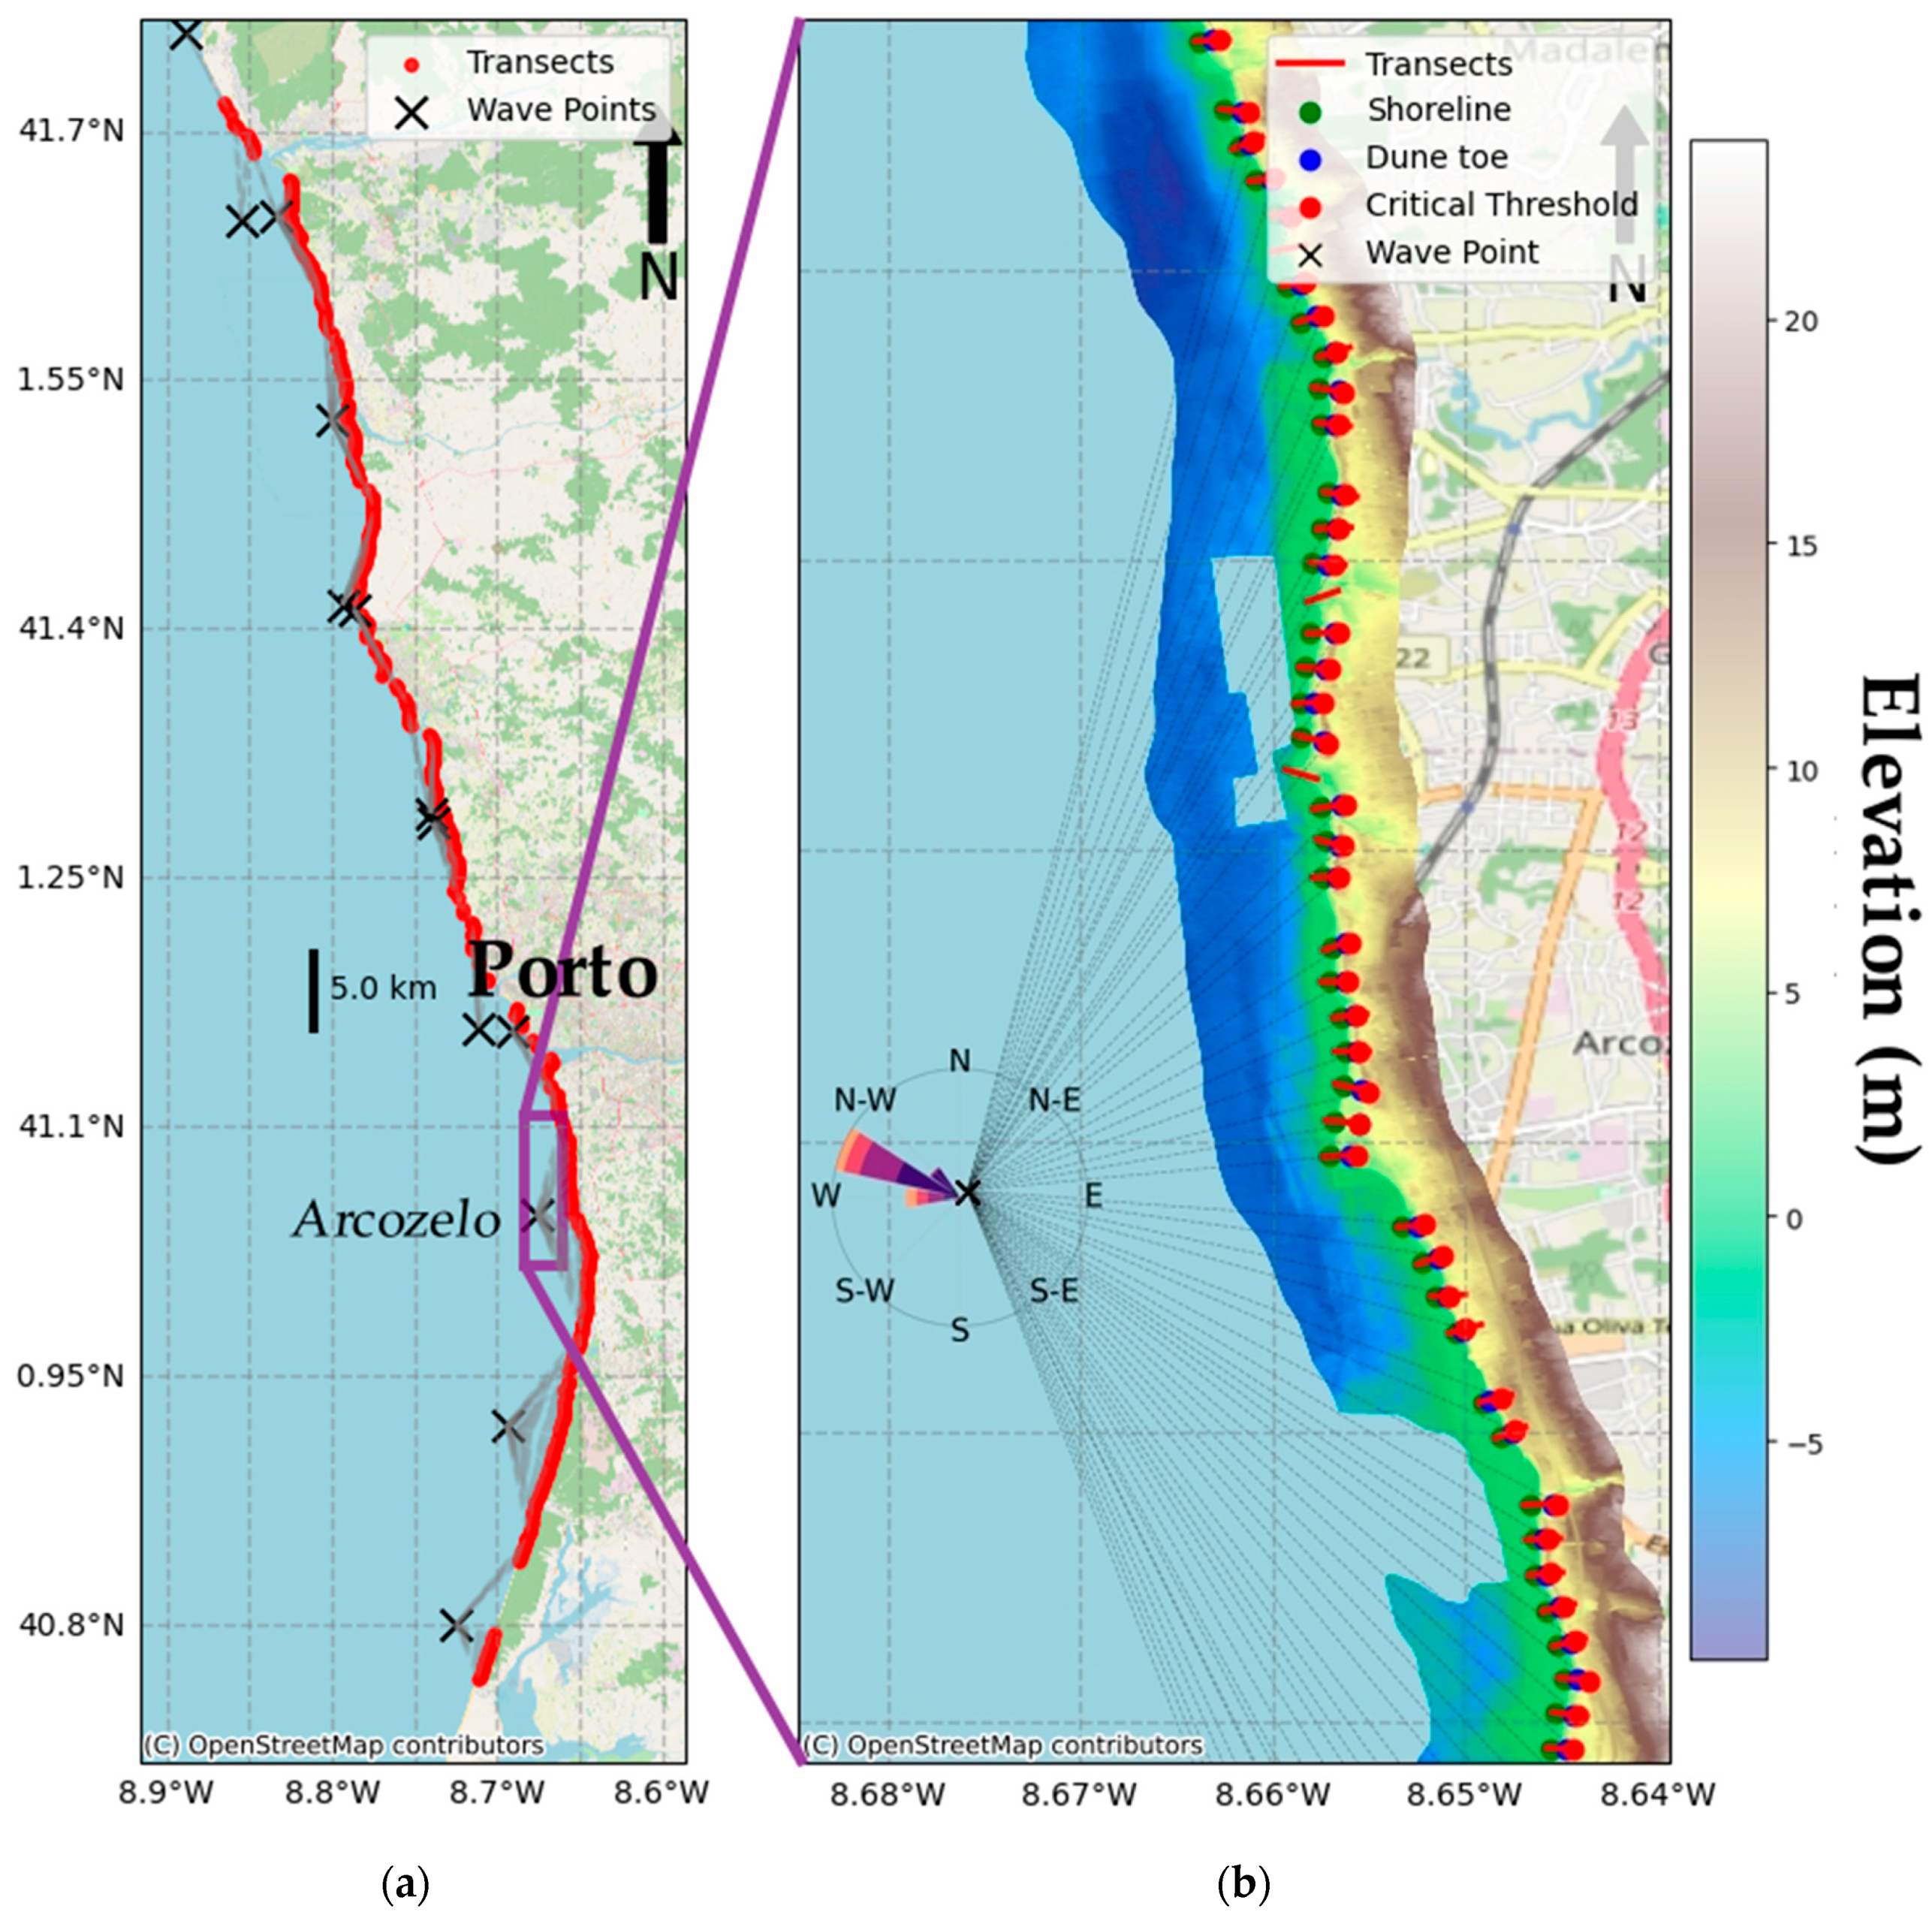
To ensure wave conditions were accurately represented for each transect along the coast, shallow-water points were extracted from the model at depths between 9 m and 12 m, reflecting local nearshore wave behavior. The wave heights were then reverse-shoaled to estimate the equivalent offshore wave height, as most wave runup formulas require offshore wave conditions as input. The positions of the nearshore wave points are also displayed in Figure 2.

2.3. Sea-Level

The astronomical tide data were sourced from the International Hydrographic Organization (IHO) through the Delft Dashboard platform [30], encompassing all astronomical tidal components.
Sea-level measurements from the Leixões Port tide gauge, used for both validating the astronomical tide data and enabling probabilistic modeling of the surge, were taken from 2005 to 2009, at six-minute intervals. The maximum observed difference between the measured tide and the astronomical prediction was 84 cm, while the mean close to 0. Although these series displayed differences, they were phase-aligned, suggesting that the discrepancies were likely due to meteorological influences on the sea-level.
While direct measurements provide the most reliable sea-level data, they are not without drawbacks, such as data gaps and sensor malfunctions, and they do not offer continuous long-term data. To address periods without measurements and align with the available wave climate data from 1979, a machine learning approach using long short-term memory (LSTM) networks was employed to model the differences between the astronomical tide and measured sea-levels [31]. Ultimately, a combined sea-level dataset was created with a two-hour resolution, incorporating both modelled and measured surge data from 1979 to 2024.

2.4. Runup Calculation

Based on the key features from topography, namely beach slope β , and from waves and sea-level, especially wave significant height H 0 and wave length L 0 , it was possible to implement simple parametrizations for runup based on empirical formulas [19,32,33,34,35]. These formulas were implemented through the Python 3.9 library py-wave-runup [36], which facilitates the operation, allowing systematic application. A sensitivity test was carried out by analyzing the results for wave runup from different formulas in the summer and during hazardous events to compare each formula’s accuracy. The formulas were the following:
STO06 [19]:
R 2 = 1.1 0.35 β H 0 L 0 0.5 + H 0 + L 0 0.563 β 2 + 0.004 0.5 2   f o r   ξ > 0.3 0.043 H 0 L 0 0.5   f o r   ξ < 0.3
VDK12 [35]
R 2 = 0.53 β H 0 L 0 + 0.58 ξ H 0 3 / L 0 + 0.45
NIE09 [33]:
R 2 = 1.188 β H 0 L 0 0.5   f o r   β < 0.1 ; 0.1188 H 0 L 0 0.5   f o r   β 0.1
HOL86 [32]:
R 2 = 0.83 β   H 0 L 0 + 0.2   H 0
RUG01 [34]
R 2 = 0.27 β   H 0 L 0
ATK17 [36]:
R 2 = 0.92 β   H 0 L 0 + 0.16   H 0
Another key objective of this paper is to perform a sensitivity analysis to evaluate which of the selected empirical formulas are most suitable for the study area, by identifying those that produce coherent estimates of wave contribution under hazardous conditions while remaining conservative during mild periods such as summer.

2.5. Flooding Records

The APA supplied numerous reports detailing hazardous coastal events from 2018 to 2024. These reports, in PDF format, contained critical information about each event, including the date, time, location, and horizontal maximum water reach, as well as additional details such as specific structural damages and dune erosion. This valuable information was systematically extracted from the PDFs and stored in a dataframe for analysis and reference.
These records are comprehensive and rich in detail; however, some discrepancies were noted, particularly in terms of unrealistic maximum water reaches and occasional mismatches in the time and date of the events. Despite these issues, these records remain the most reliable source for validating and calibrating methodologies for wave-induced coastal flooding in Portugal.
Additionally, data from the MOSAIC project [16,17,18], which offers a longer timescale of flooding event records along the Portuguese coast, provides a broader context. Although the MOSAIC data are less detailed regarding specific geolocations and event intensities, they serve as a valuable reference for validating this approach in the years where there are no APA records, from 1980 to 2018.

2.6. Swash Regimes

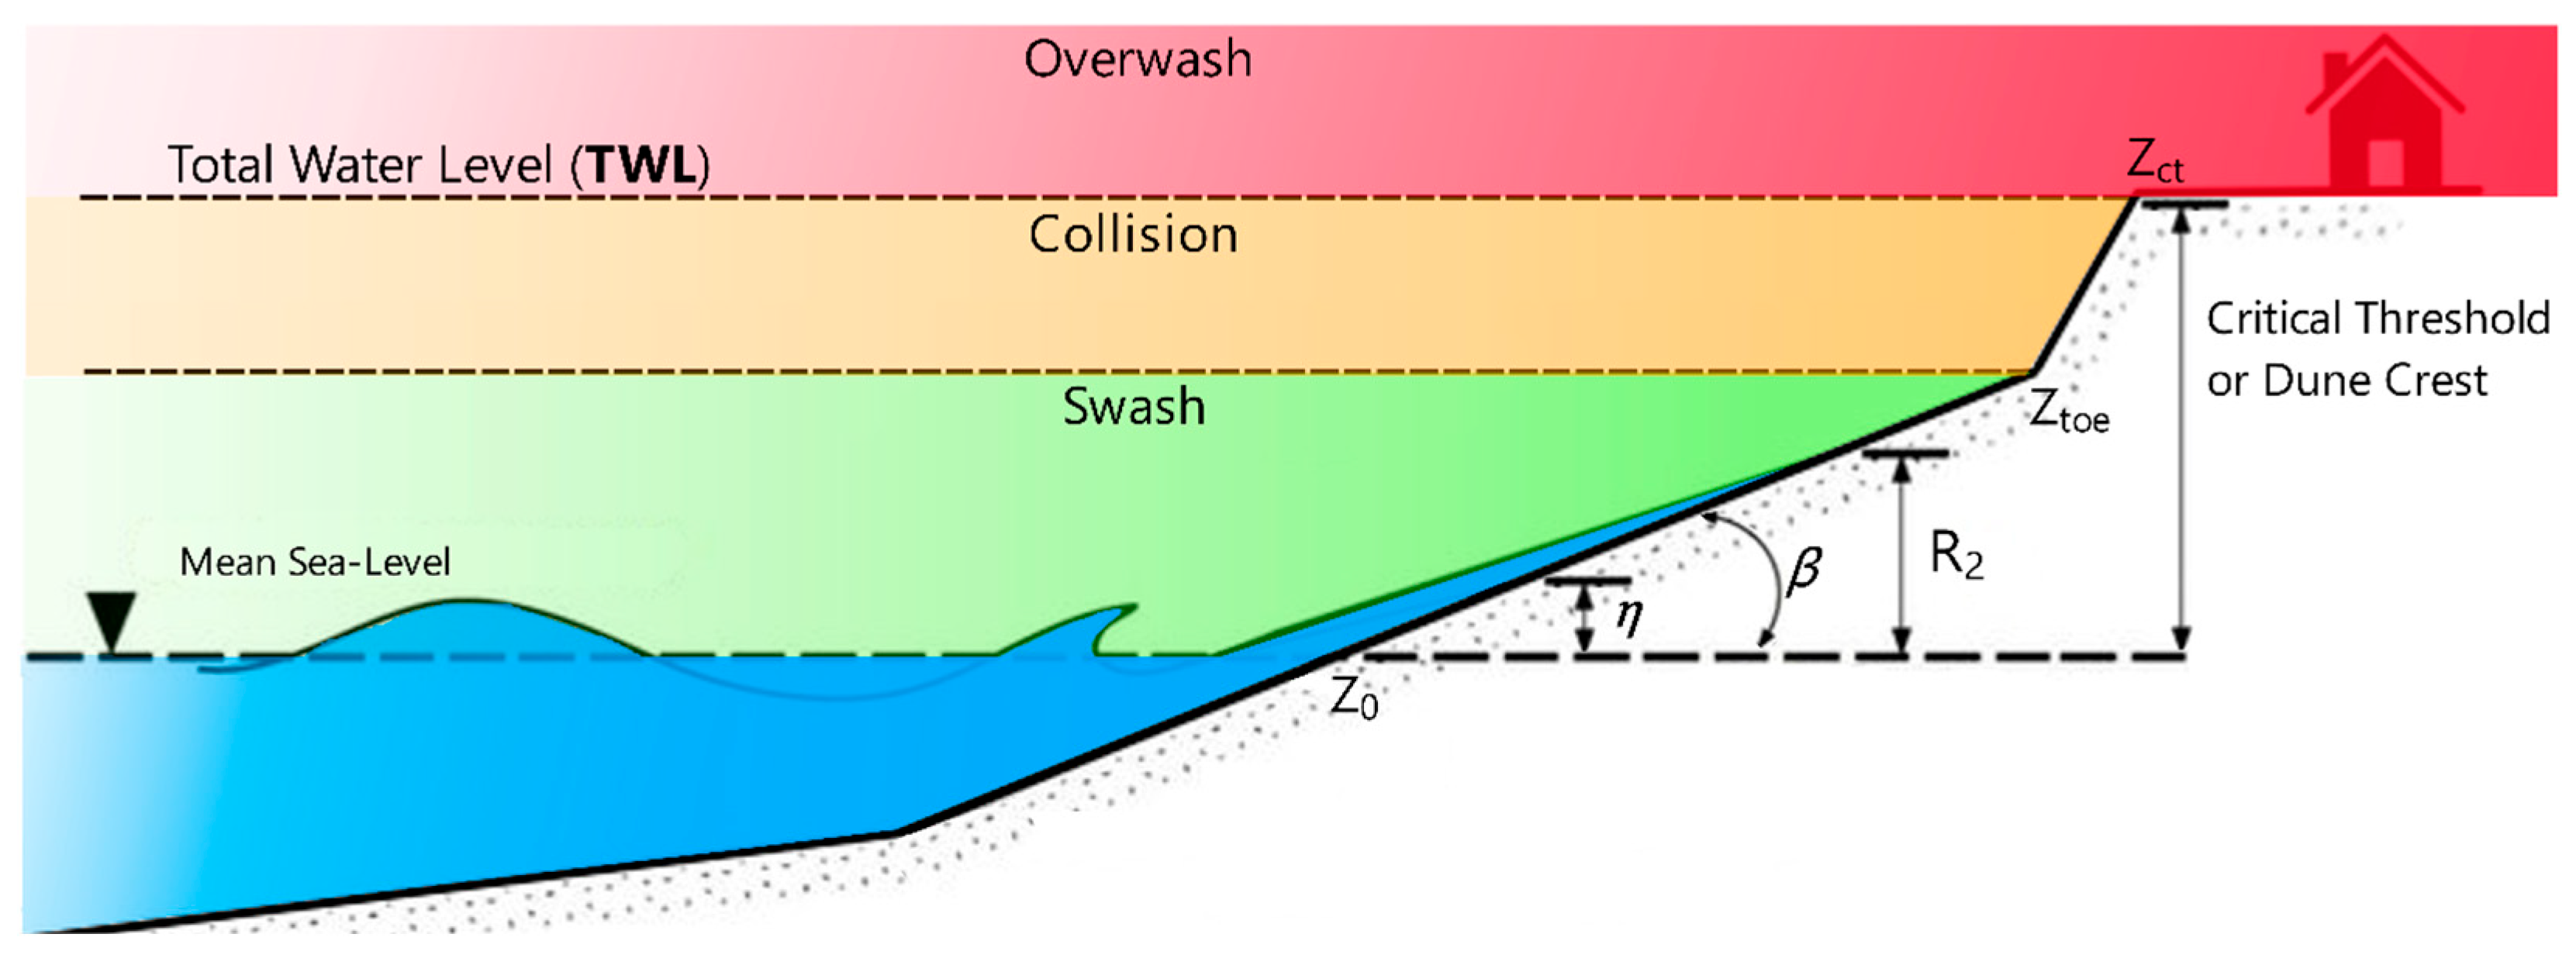
Swash regimes were adapted from prior authors [37,38]. They were assessed at different scenarios with seasonal variability (e.g., summer months) and locations (e.g., all transects, or hotspots). A visual scheme of how the swash regimes is classified is represented in Figure 3, together with a brief description, as follows:
  • The swash regime ( TWL < Z t o e ) does not reach the dune toe, thereby confining the swash to the beach area alone. This condition indicates the minimal level of coastal storm flooding hazard, maintaining a safe corridor for access or amenity between the dune and shoreline.
  • Collision regime ( Z t o e TWL < Z c t ): When the TWL impacts the dune, the adjacent beach area may be intermittently or continuously submerged. This scenario constitutes the second level of flooding hazard, eliminating the dry corridor between the dune and shoreline.
  • Overwash Regime ( TWL   Z c t ): When the dune crest is intermittently overtopped, potentially exposing assets and property behind the dune crest, or defense structure, to flooding. This represents a high level of coastal flooding hazard.

3. Results

3.1. Geoprocessing

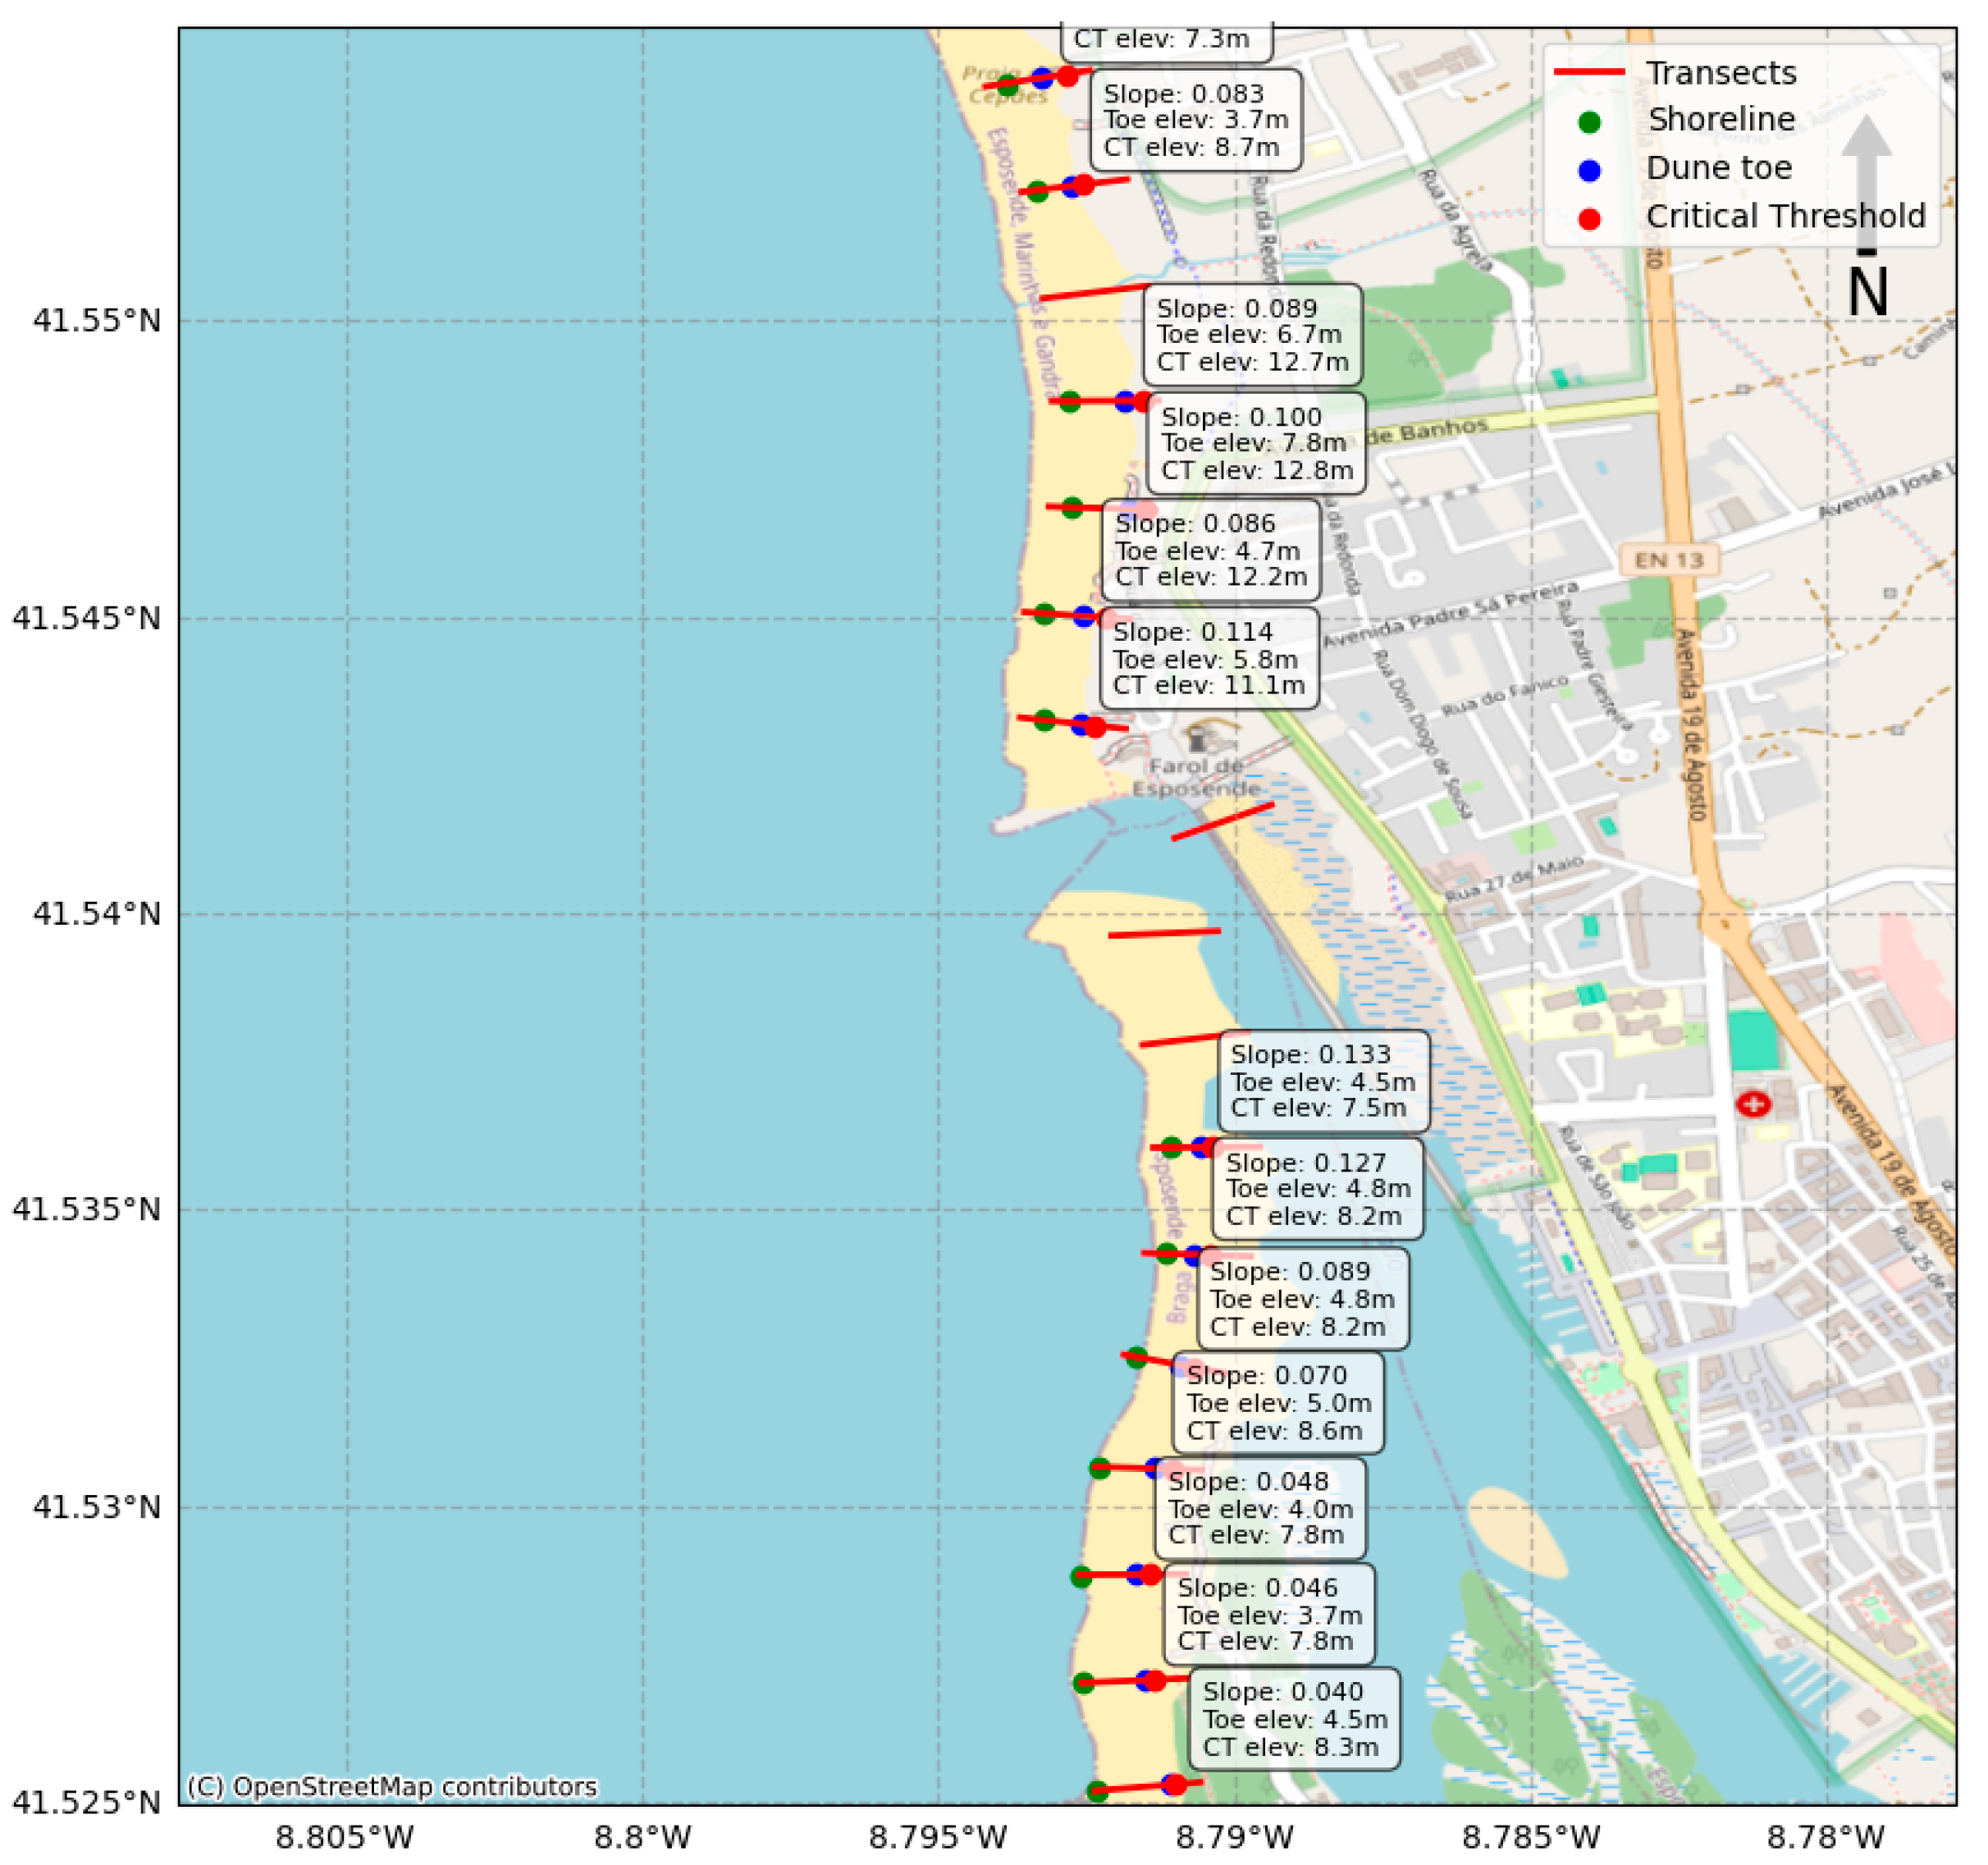
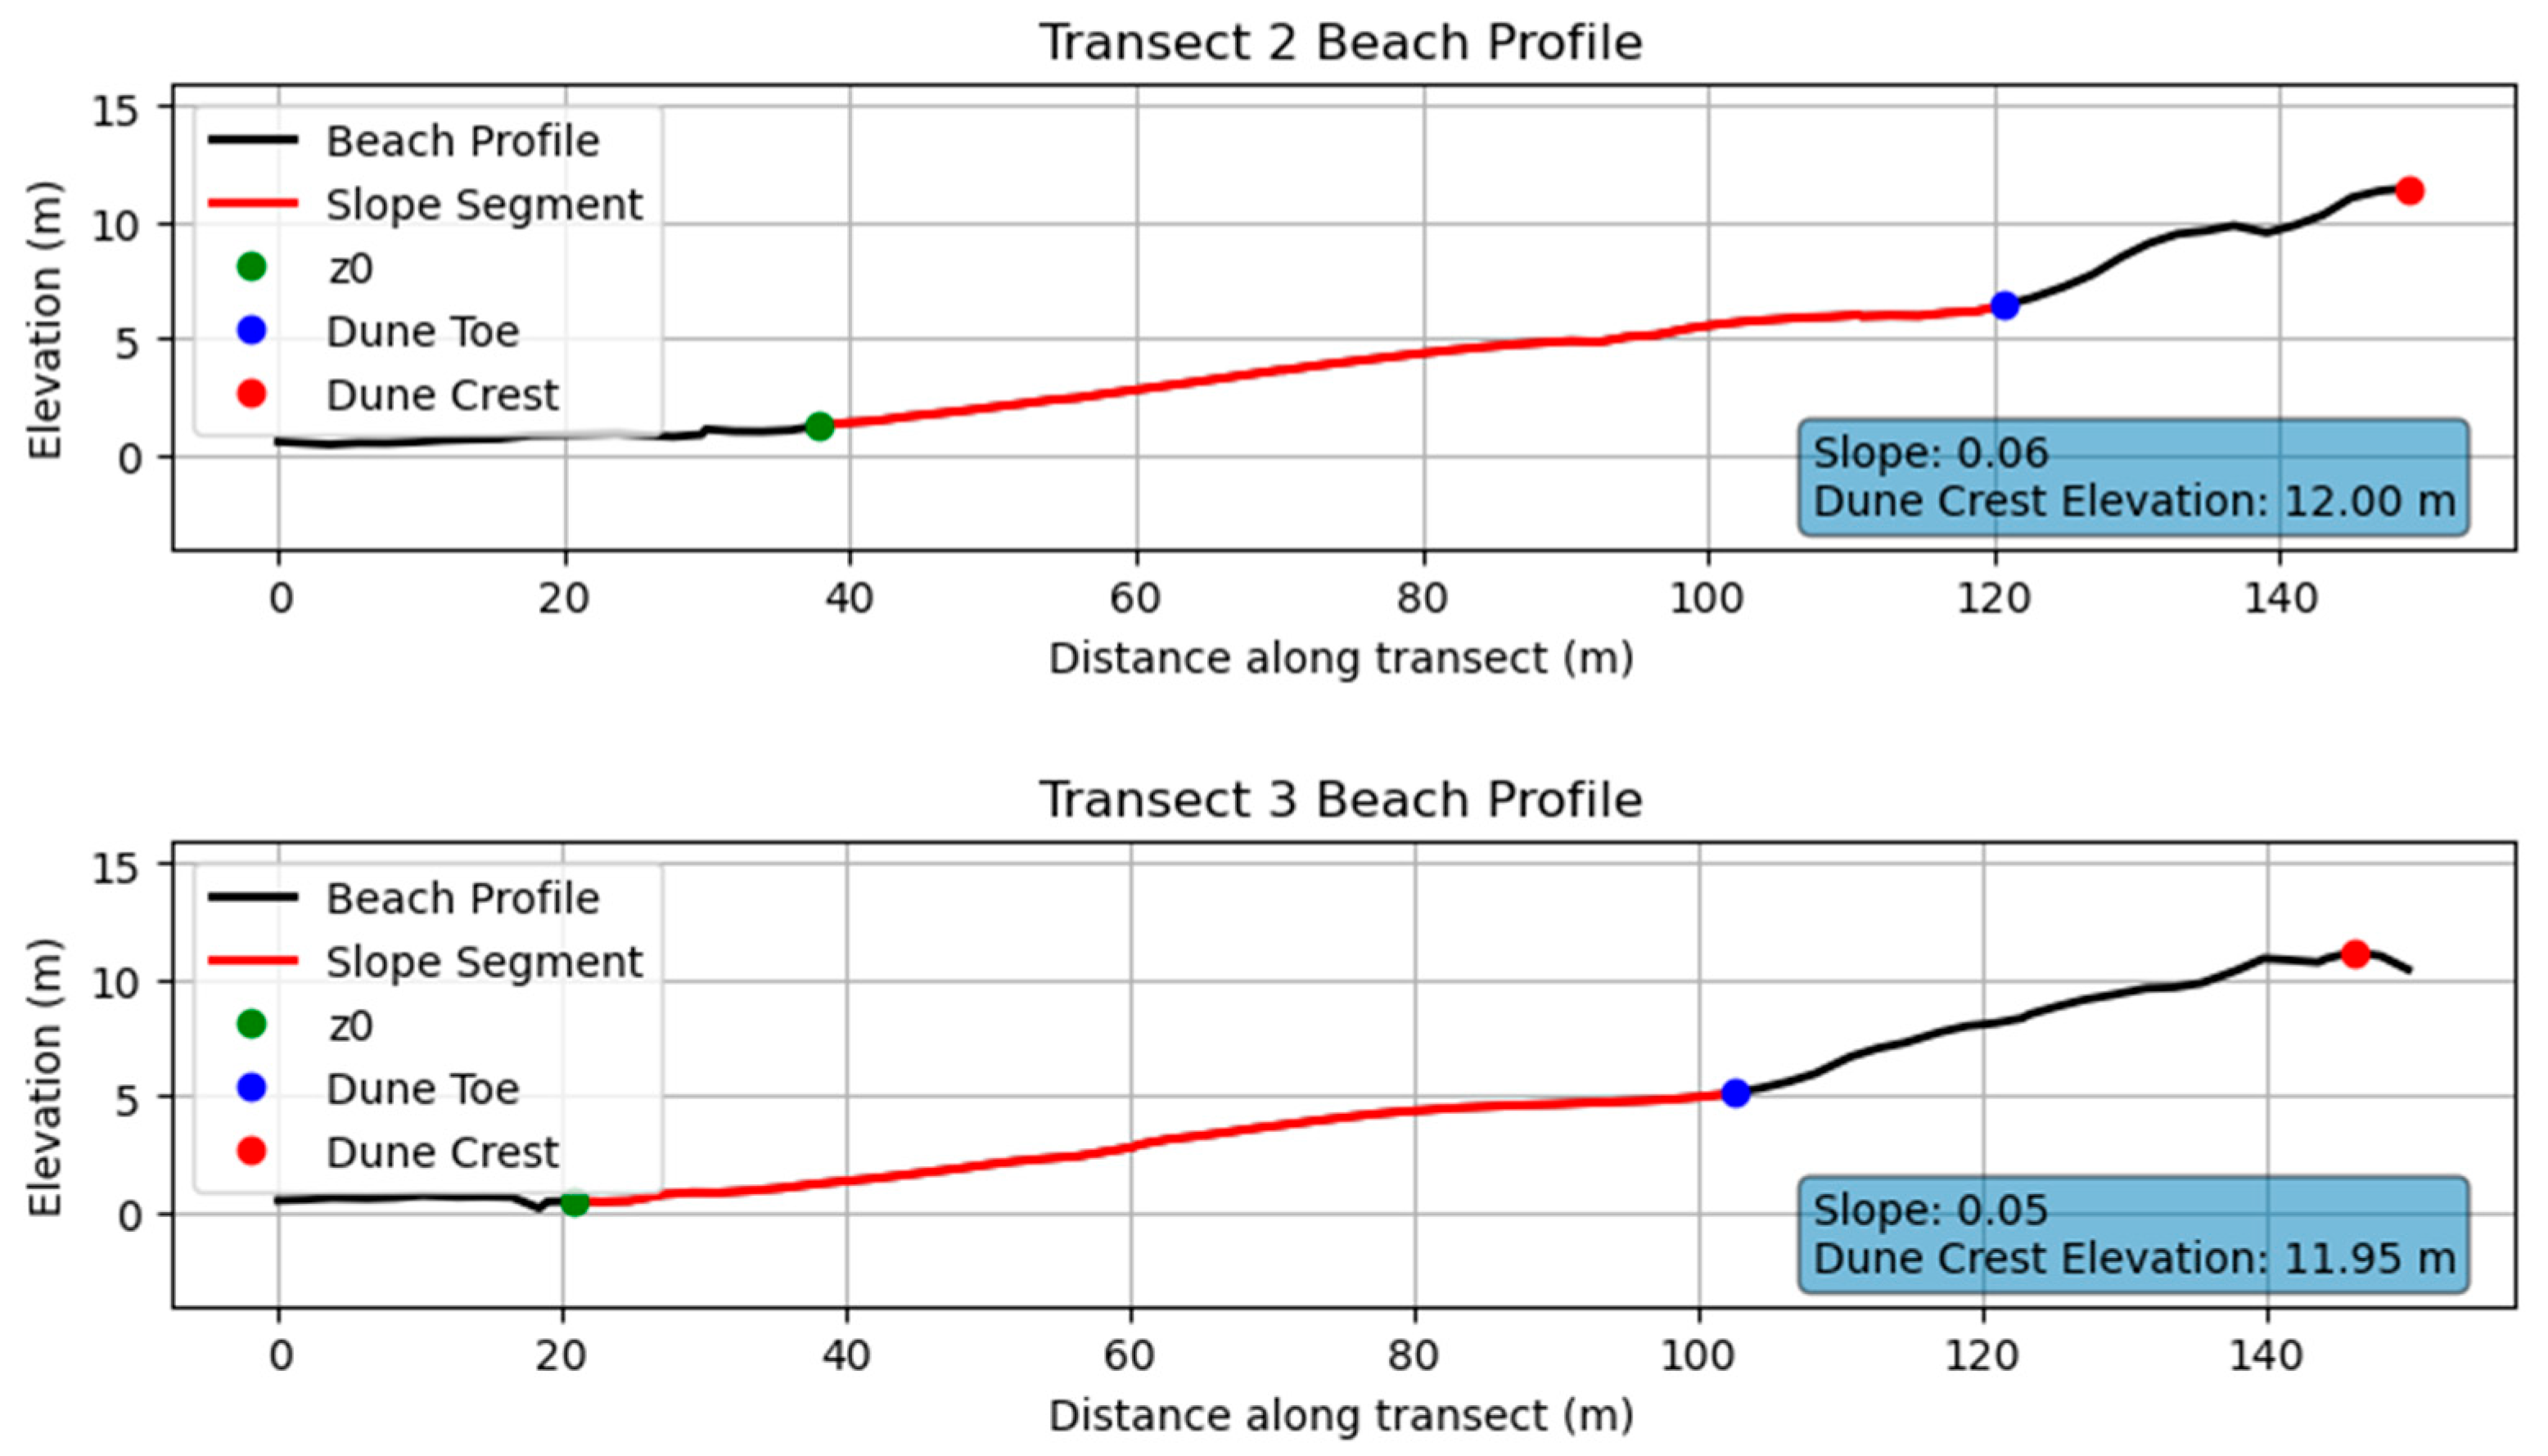
The geoprocessing of the digital terrain model (DTM) allowed a detailed assessment of areas along the northern Portuguese coast that are vulnerable to wave-induced coastal flooding. Critical areas that were identified include narrow beach profiles with steep slopes and low-lying zones where dune crest elevations are minimal, as well as low elevations for the crown of hard-engineering defense structures. Conversely, wider beaches featuring higher dune crests are more resilient to such flooding events. Figure 4 presents an overview of the transects along with the position of key geomorphological features in the Esposende zone, and Figure 5 presents two examples of actual profiles in the Viana do Castelo region. Table 1 presents general statistics of the morphological features.
These key geomorphological features provide a sufficient basis for establishing an index of coastal vulnerability to flooding when combined with other morphological types, such as dunes, marshes, mangroves, and cliffs. While this approach is typically aligned with geography studies, its application in practical engineering or coastal flooding management scenarios is limited, since there is no connection with the sea-states. Incorporating oceanic forces significantly enhances the robustness of this methodology, which is explored in subsequent sections.

3.2. Total Water Level and Swash Regimes

The TWL was computed for every transect, totalizing 400 time-series with 2 h resolution from 1979 to 2024, totalizing 199,416 observation points. The tide and surge were spatially uniform for all profiles, but the wave runup component varied according to the location geomorphology (beach slope and critical threshold), wave climate (different wave points from SWAN), and six wave runup formulas for sensitivity analysis.
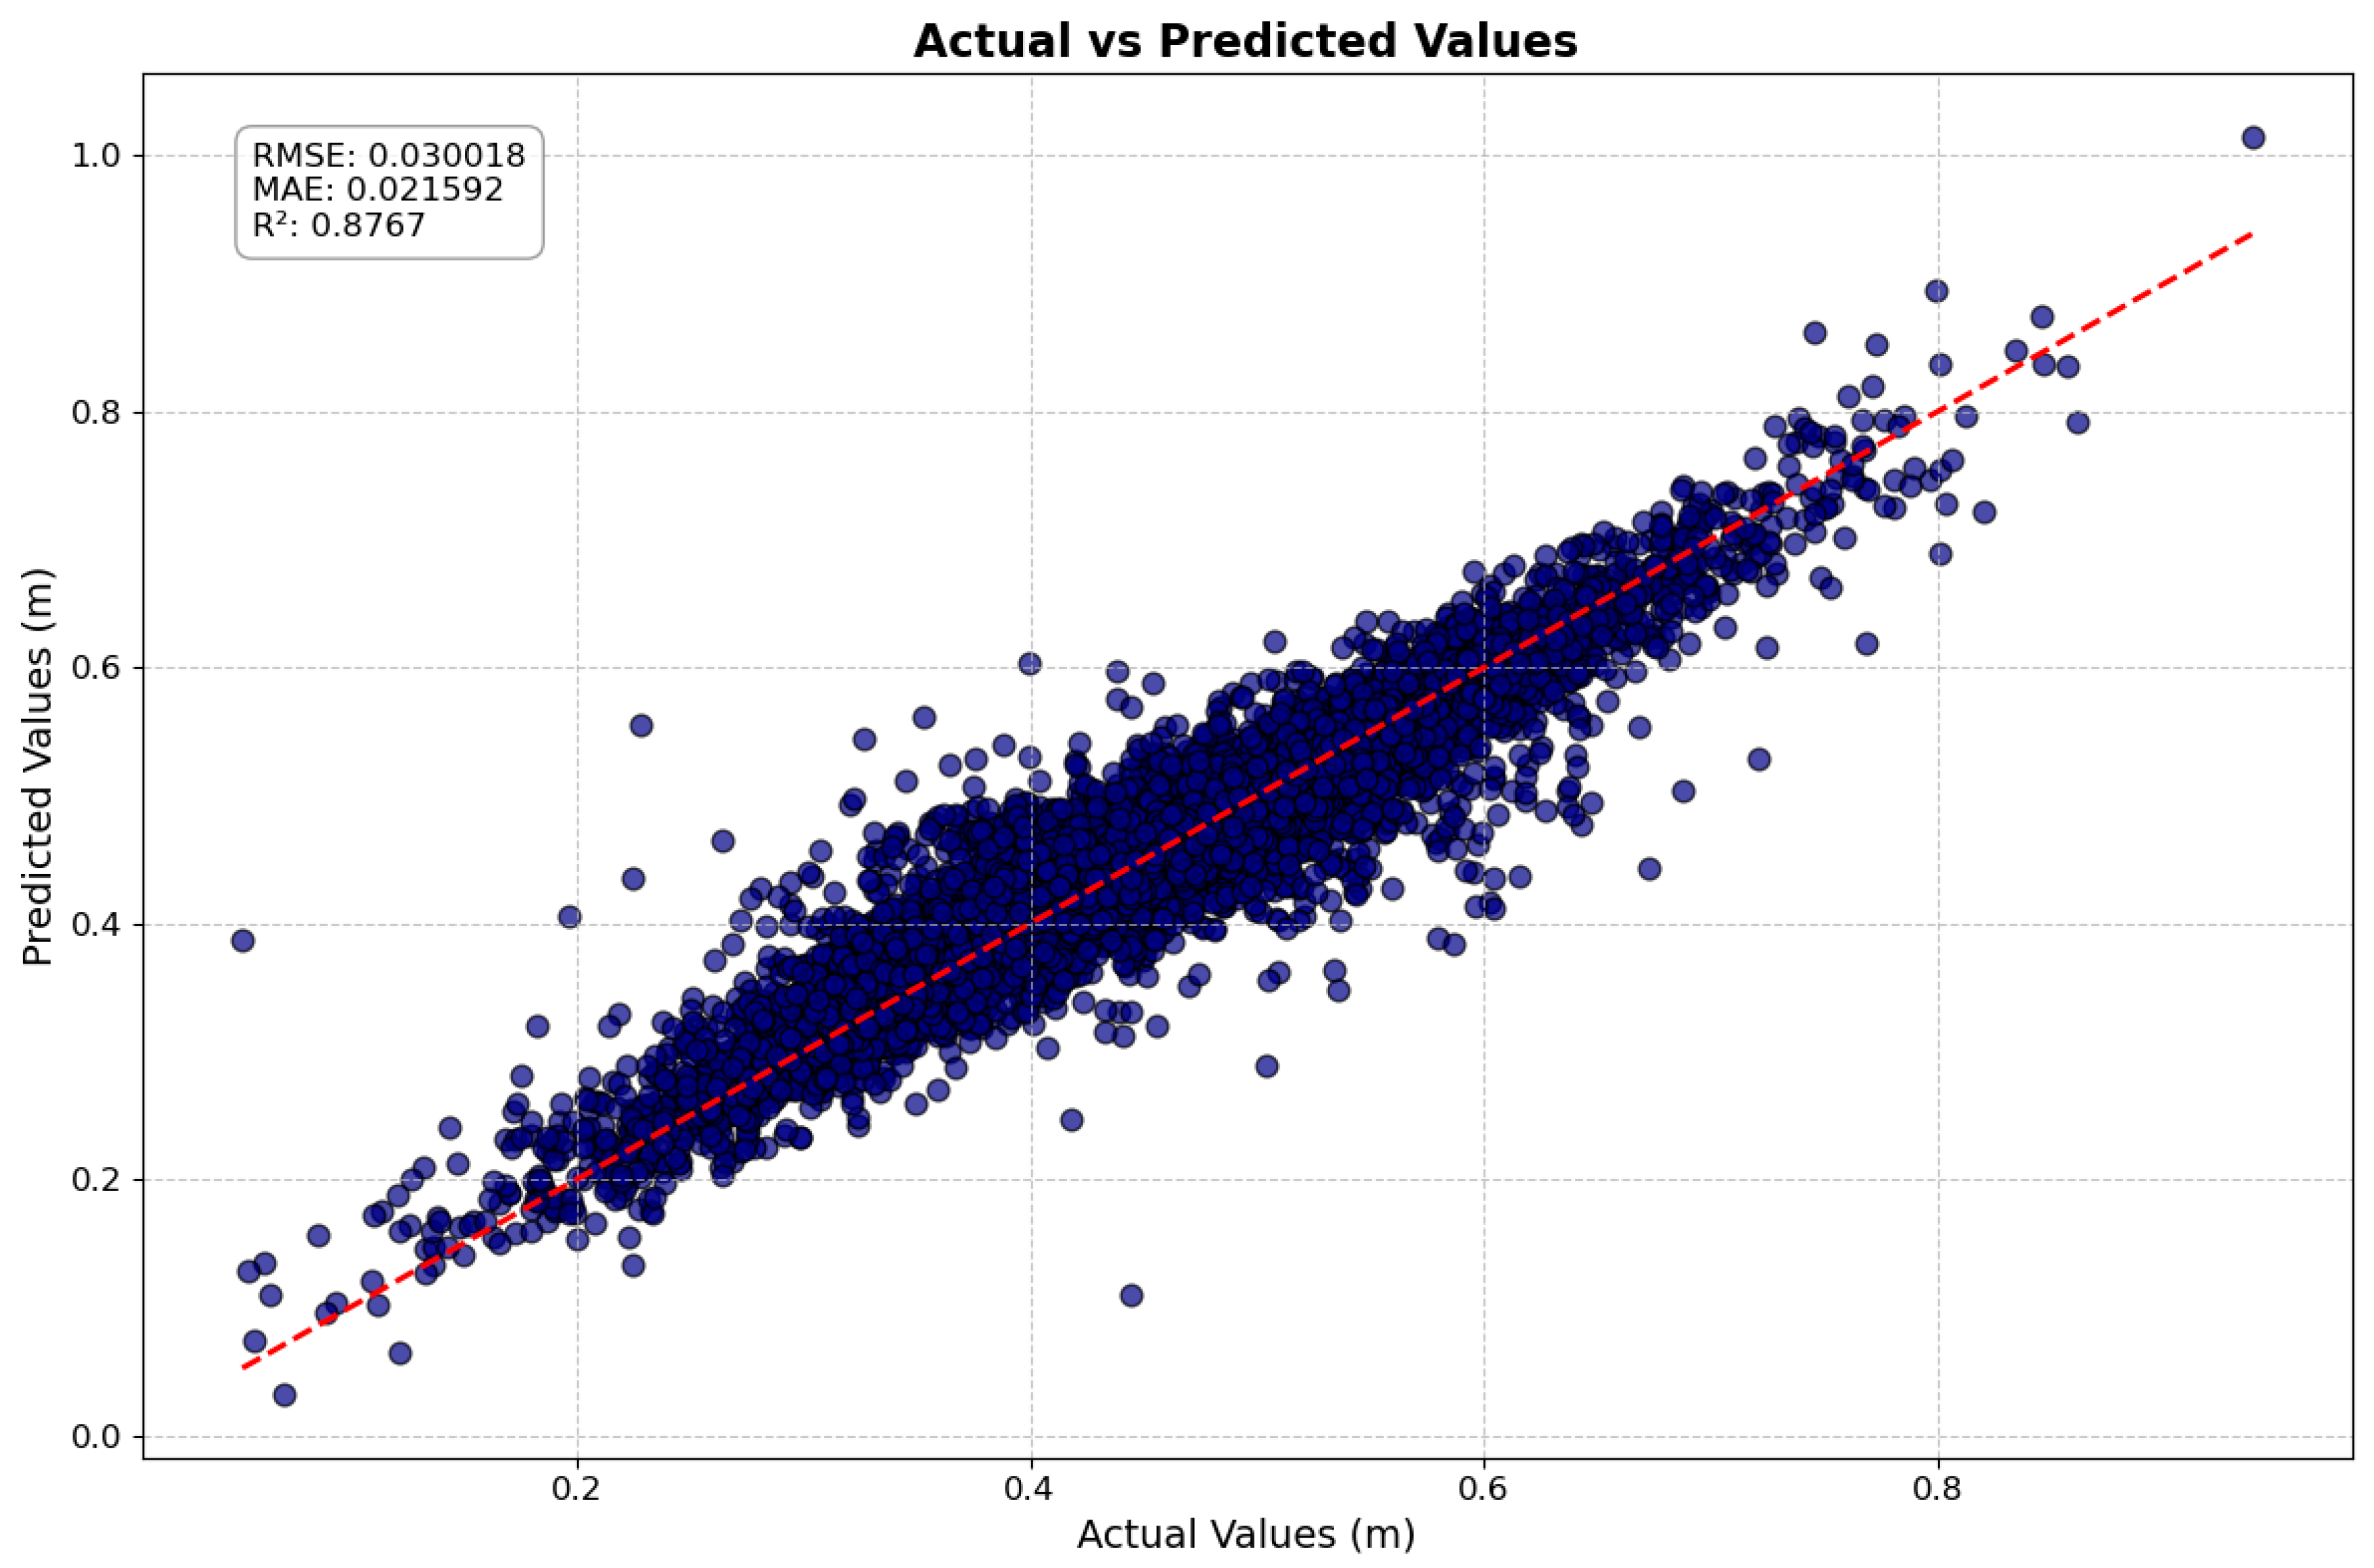
To reconstruct missing storm surge data, a long short-term memory (LSTM) model was implemented due to its suitability for time-series prediction. The model architecture consisted of a single LSTM layer with 50 units followed by a dense output layer. The input sequences were defined with three time steps and two features. The dataset included 79,041 samples, split into 80% for training (63,232 samples) and 20% for testing (15,809 samples). The model was trained using the Adam optimizer and ReLU activation function, with a mean squared error (MSE) loss function over 50 epochs. Evaluation on the test set yielded strong performance: RMSE = 0.0300, MAE = 0.0216, MSE = 0.0009, and R2 = 0.877, indicating good predictive accuracy. The mean absolute percentage error (MAPE) was 5.16%, further supporting the model’s reliability for reconstructing surge variability. These results demonstrate that the LSTM model provided a robust and accurate method for filling gaps in the storm surge time-series. Figure 6 presents the fit plot for actual and predicted values for surges.
The wave runup component of TWL was calculated using the wave climate and formulas detailed in Section 3.2. The runup calculations were performed in coherence with the wave climate data, at two-hour intervals for the entire time-series. During hazardous events as recorded by the APA, which feature a different time resolution, an envelope approach was adopted. This involved analyzing the 36 h period surrounding each event record, selecting the highest significant wave height (Hs) during this period, along with the corresponding peak period (Tp) and the highest sea-level recorded for the event.
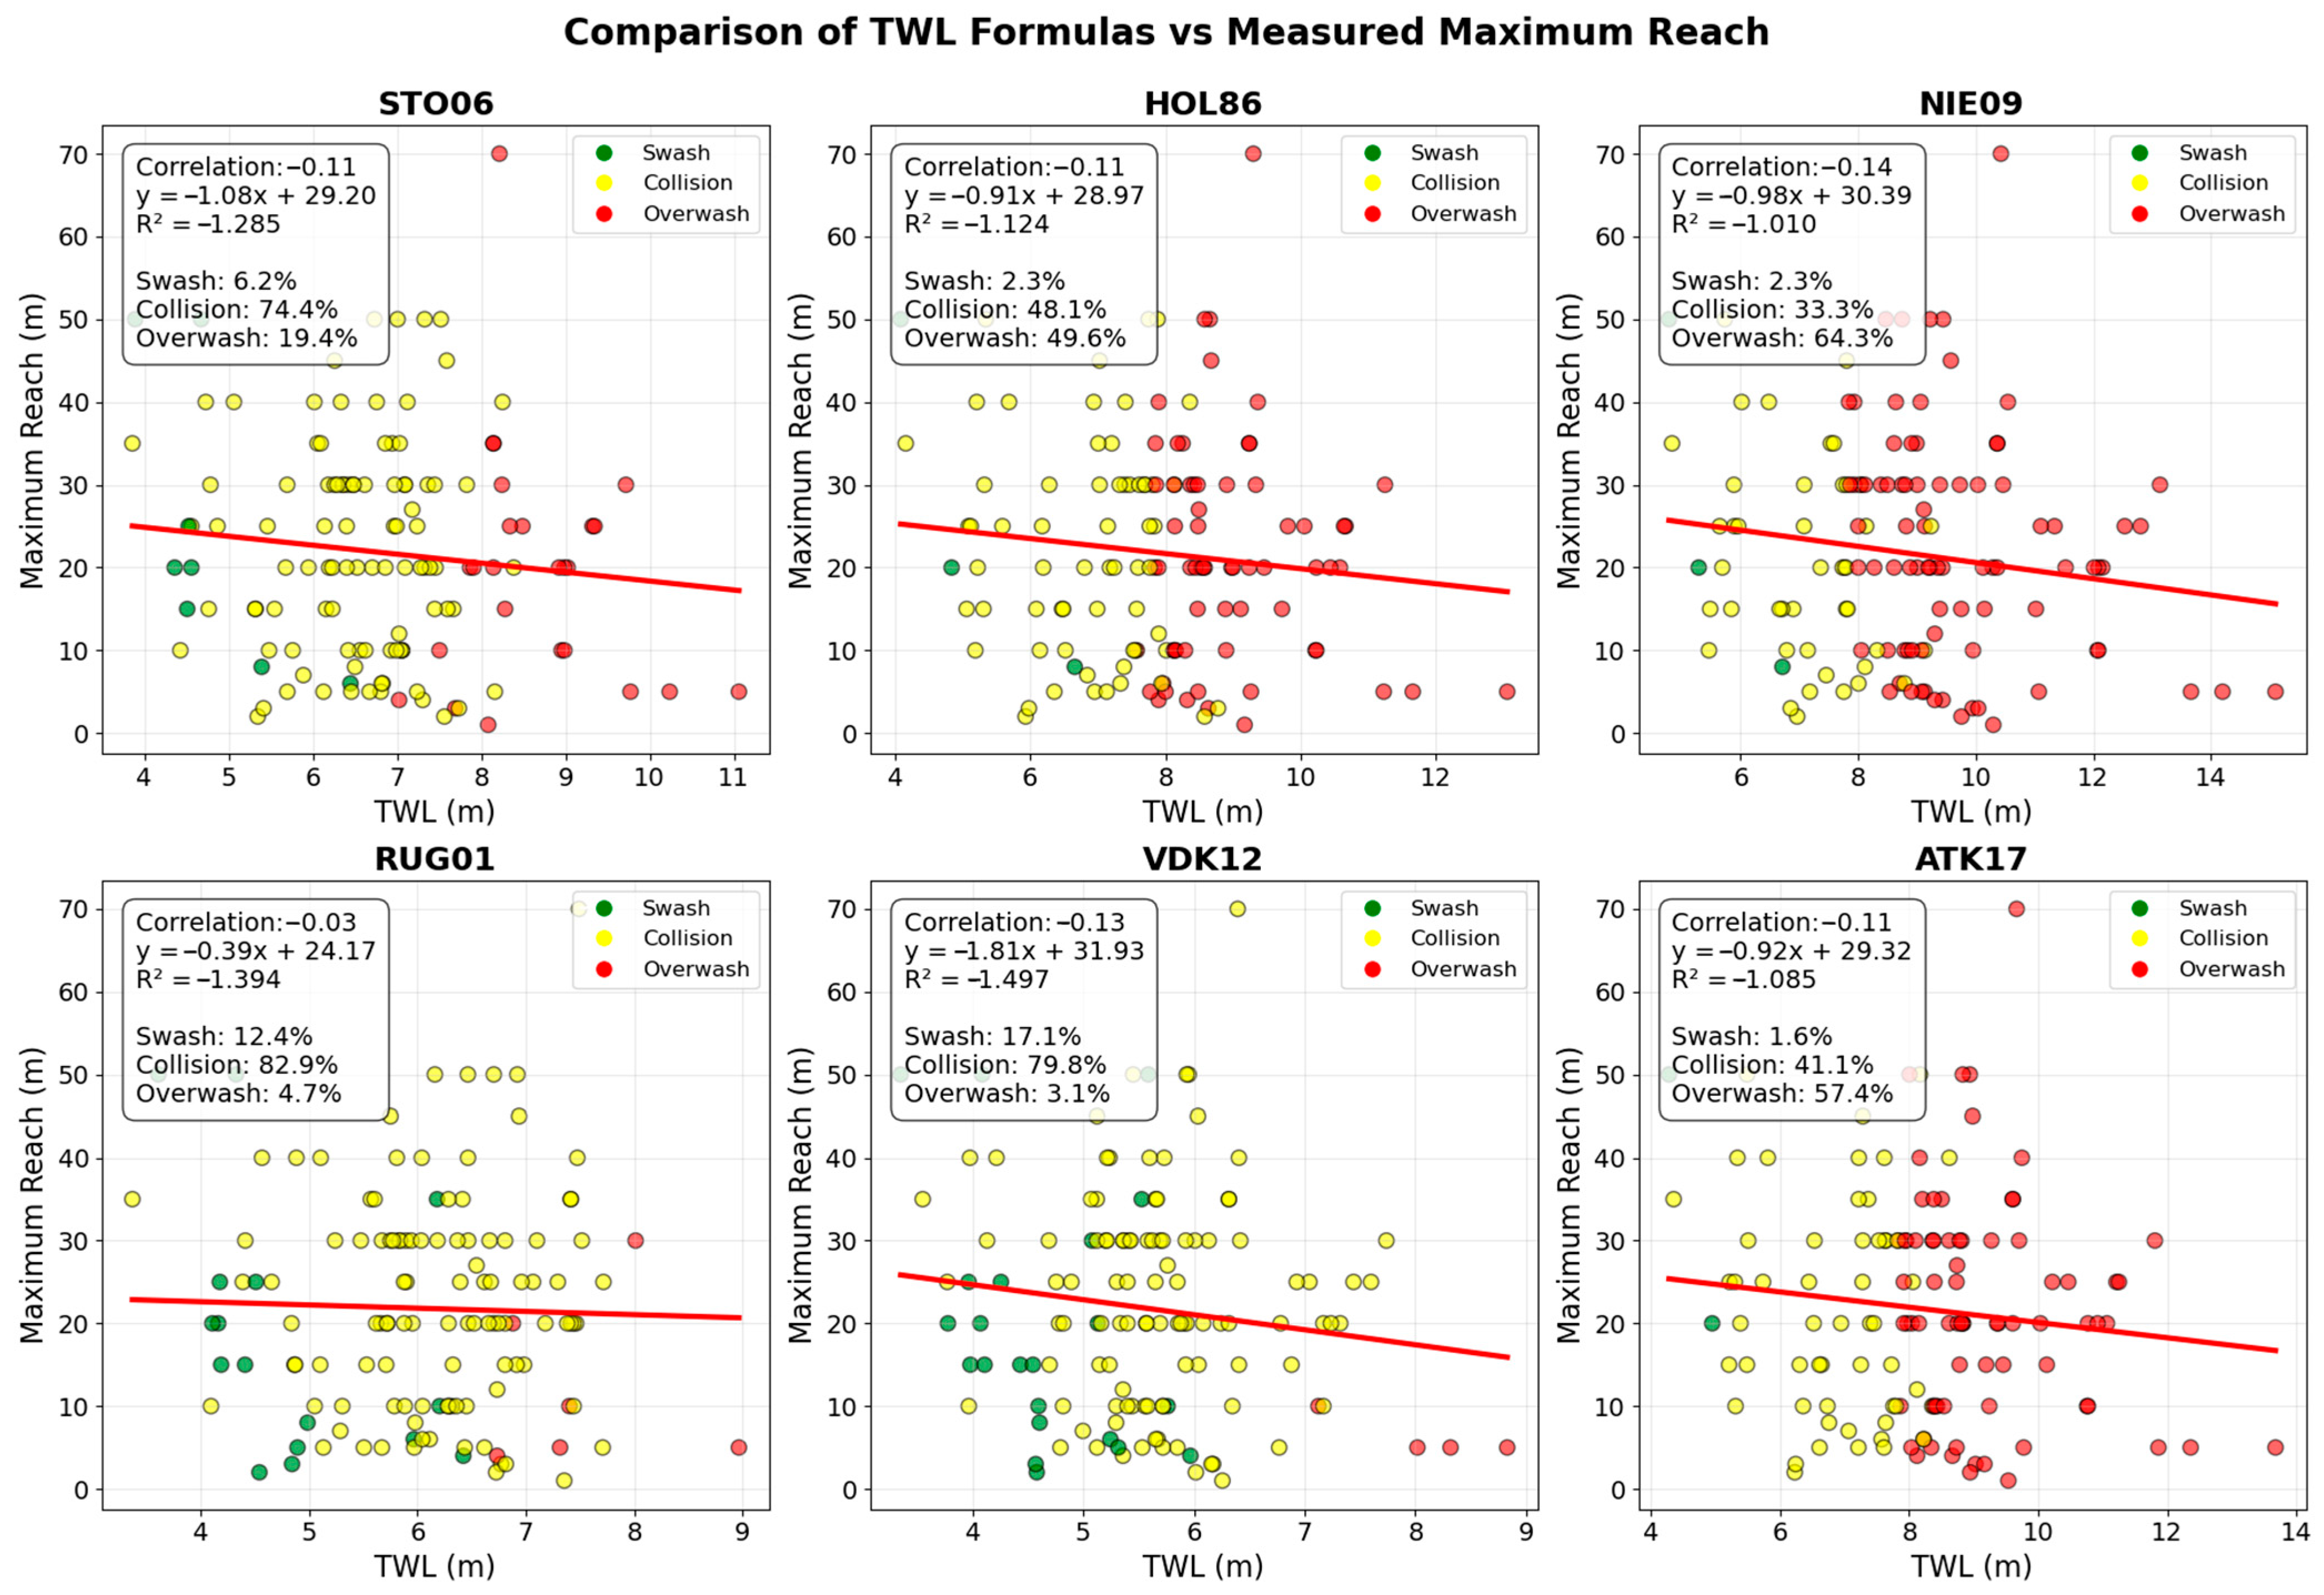
Figure 7 illustrates the correlation between the total water level (TWL) calculated using six different wave runup formulas and the maximum reach of water/debris recorded by the APA. Despite expectations that higher TWL values would correspond to greater inland water extent, all formulas exhibit a weak negative correlation with the observed maximum reach. This suggests that TWL alone does not fully explain the recorded inundation, likely due to additional influencing factors such as local topography, wind setup, or inaccuracies in the recorded data. The weak correlation also raises concerns about the reliability of the reported maximum reach values, as inconsistencies may stem from observational limitations, post-event modifications, or difficulties in distinguishing overwash from other coastal processes.
Despite these discrepancies, some formulas align more closely with expected swash regimes, displaying a reasonable distribution of swash, collision, and overwash classifications. Formulas that indicate higher collision and overwash occurrence (e.g., NIE09, HOL86, ATK17, STO06) may be more effective in identifying extreme inundation events, whereas those dominated by collision regimes with higher rates of swash (e.g., RUG01, VDK12) appear to be more conservative in their hazard assessments. The variability in results suggests that while some empirical formulas capture key aspects of wave runup dynamics, the accuracy of historical maximum reach records remains uncertain.
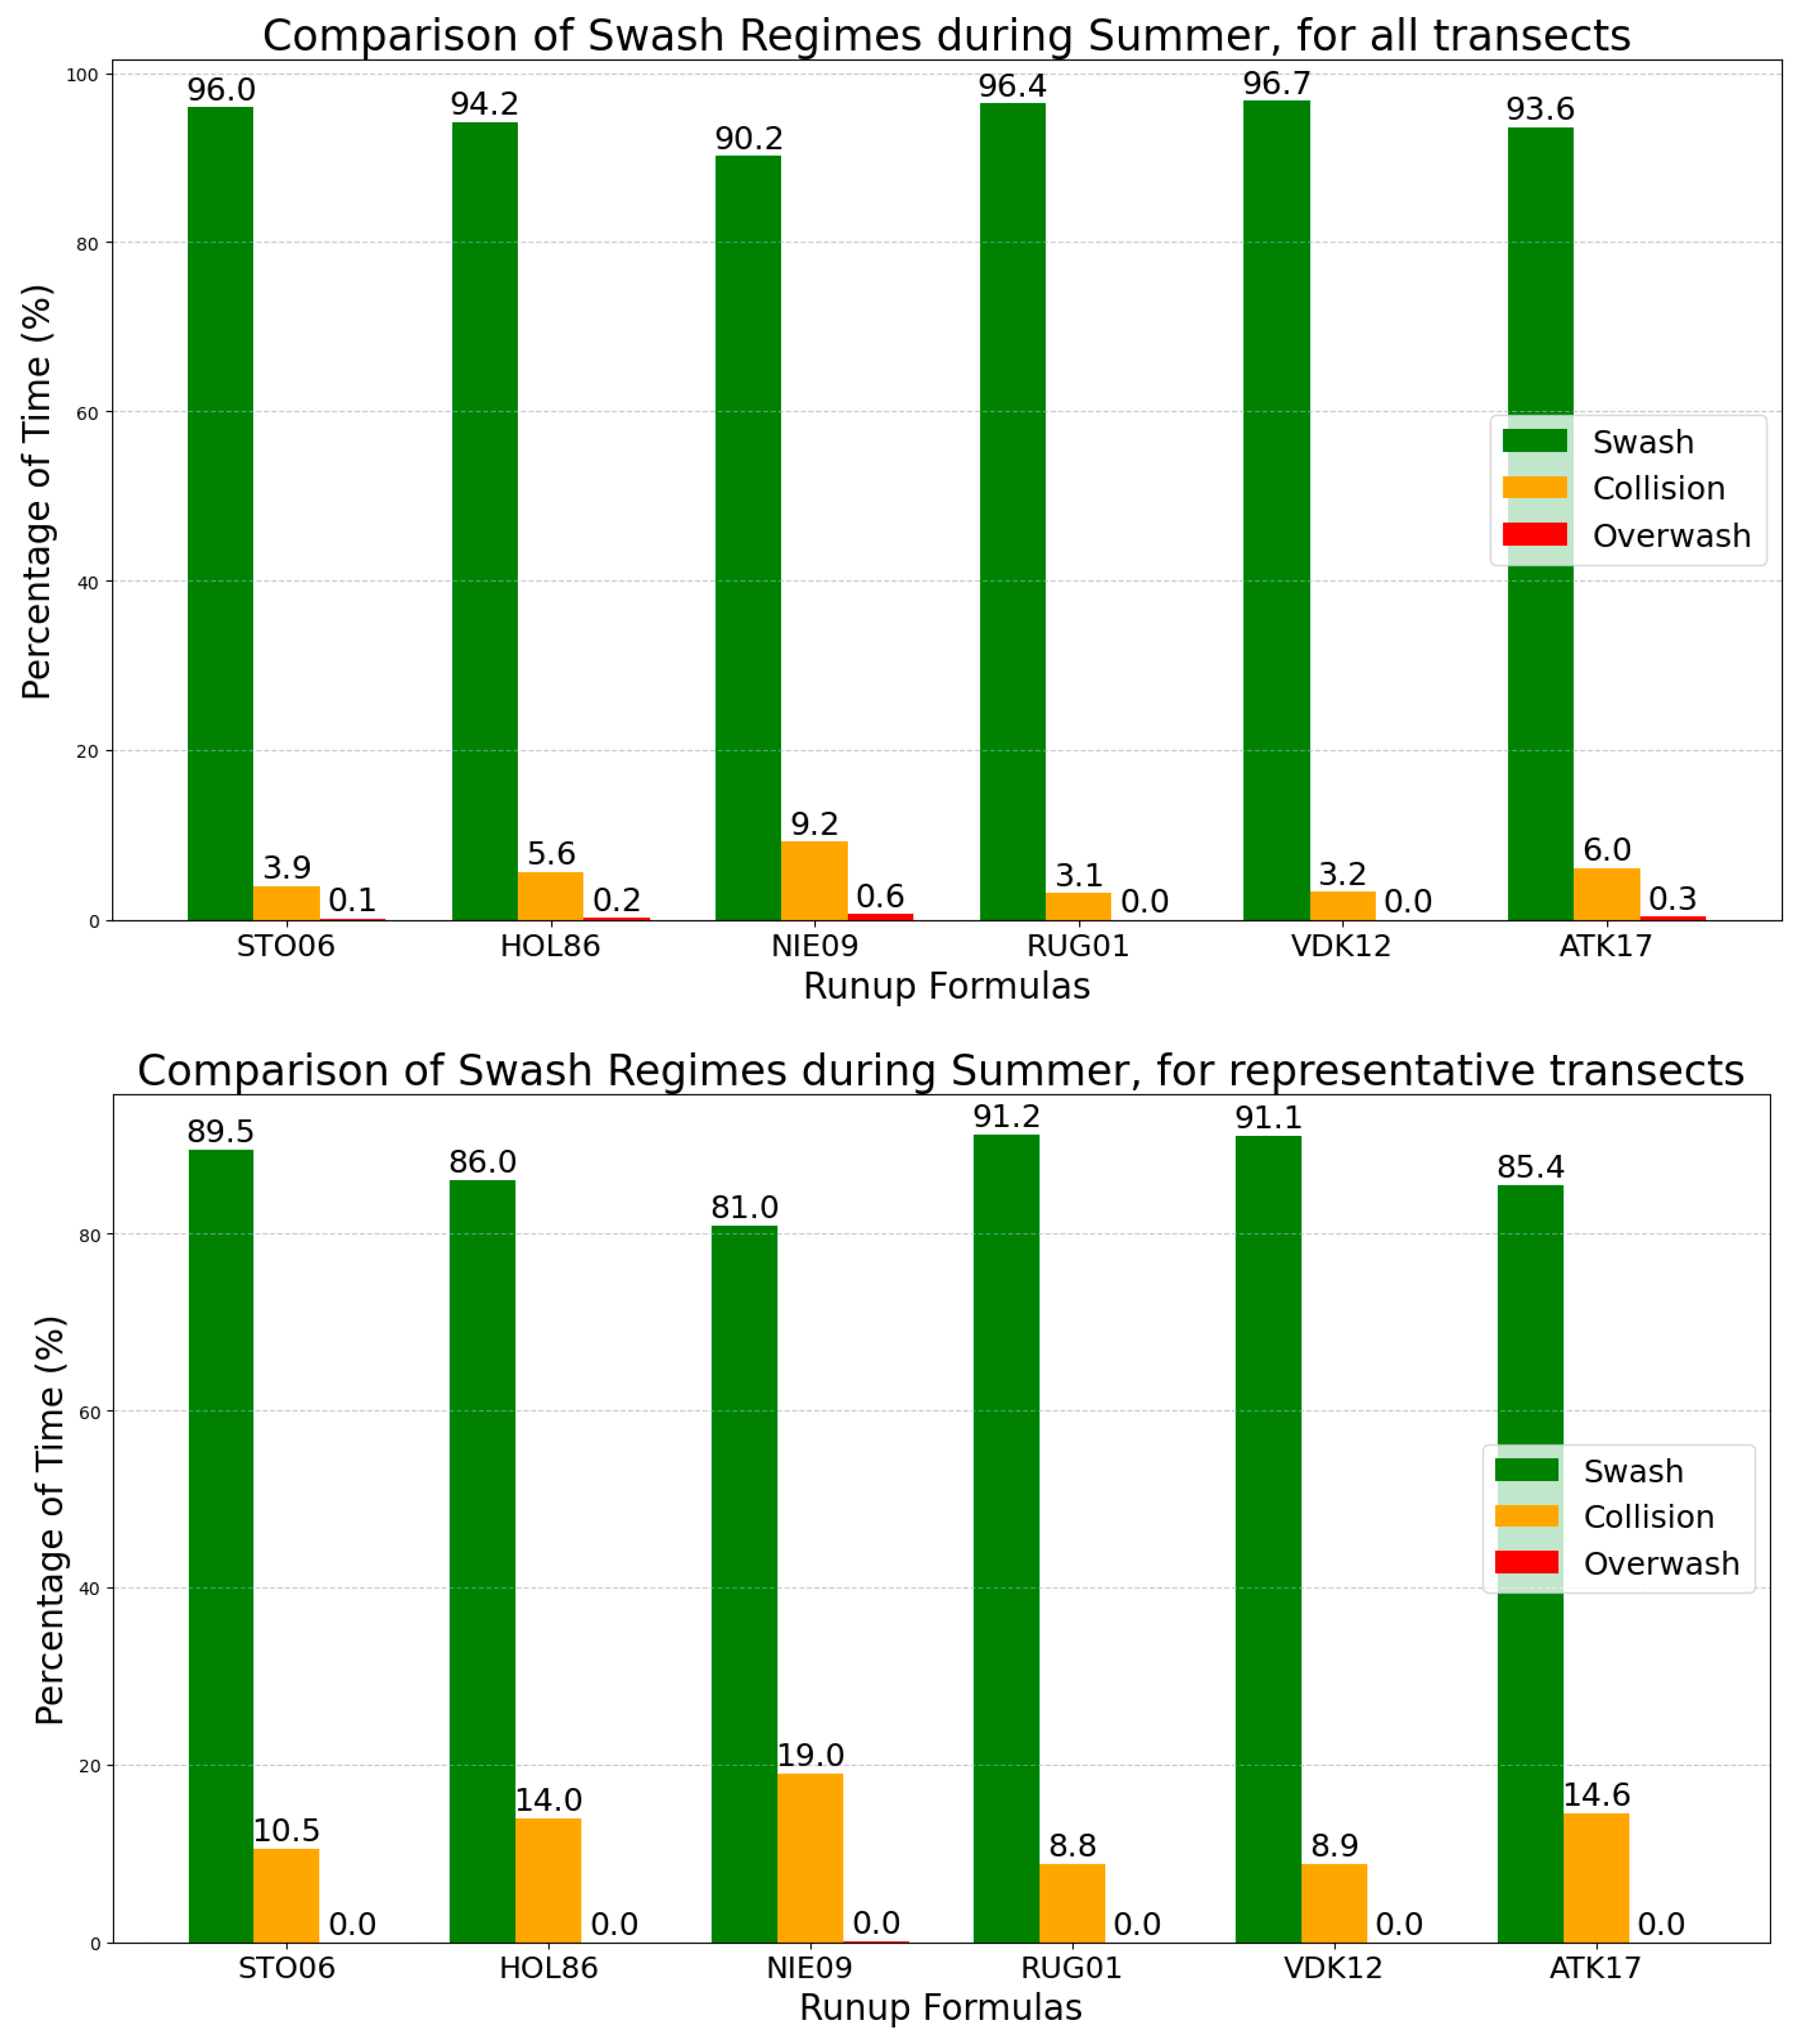
Figure 8 further explores the performance of different runup formulas by analyzing their sensitivity to swash regimes during summer months when hazardous conditions are less frequent. Since formulas that overestimate overwash during the APA’s recorded flood events may also overpredict TWL under normal conditions, this comparison helps assess their reliability across different wave climates. This analysis is carried out in two setups, for all the 400 transects, and for representative transects for the APA’s record locations. The results reflect the seasonal oscillation in ocean energy, with higher wave heights and total water levels typically occurring in winter due to more frequent and intense storm activity and lower energy conditions dominating in summer. This seasonal contrast allows for testing how well the formulas respond to both extreme and mild forcing scenarios. While this analysis offers useful insights into which formulas are conservative enough to represent non-hazardous summer conditions—reflected by a higher percentage of swash regime—future studies could benefit from a more detailed sensitivity analysis supported by advanced statistical methods.
The results show that while most formulas predominantly classify summer conditions as swash-dominated, there are notable differences in the proportions of collision and overwash regimes. NIE09, which exhibited the highest overwash rates during the APA’s recorded events, also presents the lowest swash percentage in summer. This suggests a tendency for overprediction of the TWL, leading to a higher frequency of overwash classification even in non-hazardous conditions. Similarly, ATK17 displays slightly elevated overwash and collision rates, indicating a more conservative approach to TWL estimation. In contrast, formulas such as STO06, HOL86, RUG01, and VDK12 show minimal overwash during summer, reinforcing their tendency to produce more moderate TWL values.
However, RUG01 and VDK12 did not present sufficient collision and overwash regimes during the APA’s records, so it is possible to conclude that STO06 and HOL86 may be the most adequate formulas for this study area. STO06 showed a 96% prevalence of the swash regime during summer months across all transects and 89.5% for the representative transects, with 6.2% occurrence during hazardous event records. Similarly, HOL86 showed a 94.2% swash prevalence across all transects, 86.0% for the representative transects, and only 3.1% during hazardous events. These results suggest that STO06 is slightly more conservative than HOL86 in identifying potentially hazardous conditions. Considering its consistent performance and the fact that STO06 is one of the most widely used empirical formulas for wave runup on sandy beaches, it was selected for the subsequent analysis in this work.
Given that the APA’s records only span from 2018 to 2024, while the TWL time-series extends back to 1979, a longer-term evaluation is necessary to provide a more comprehensive assessment and take advantage of this longer time-series. An alternative dataset for comparison is the MOSAIC project, which, although less detailed than the APA’s records, offers a valuable benchmark for validating the findings of this study. Given the extensive dataset covering 400 transects over a multi-decade period, this section focuses on representative results from the beach of Furadouro, while additional profile analyses are available upon request. Of the 149 flooding events recorded within the study area by the APA, 86 occurred in Furadouro. However, MOSAIC’s outputs only specify broader regions of occurrence (e.g., the territorial unit Ovar–Marinha Grande, rather than the Beach of Furadouro), making it difficult to pinpoint exact locations. Despite this limitation, MOSAIC still provides a useful national-scale perspective on wave overtopping events.
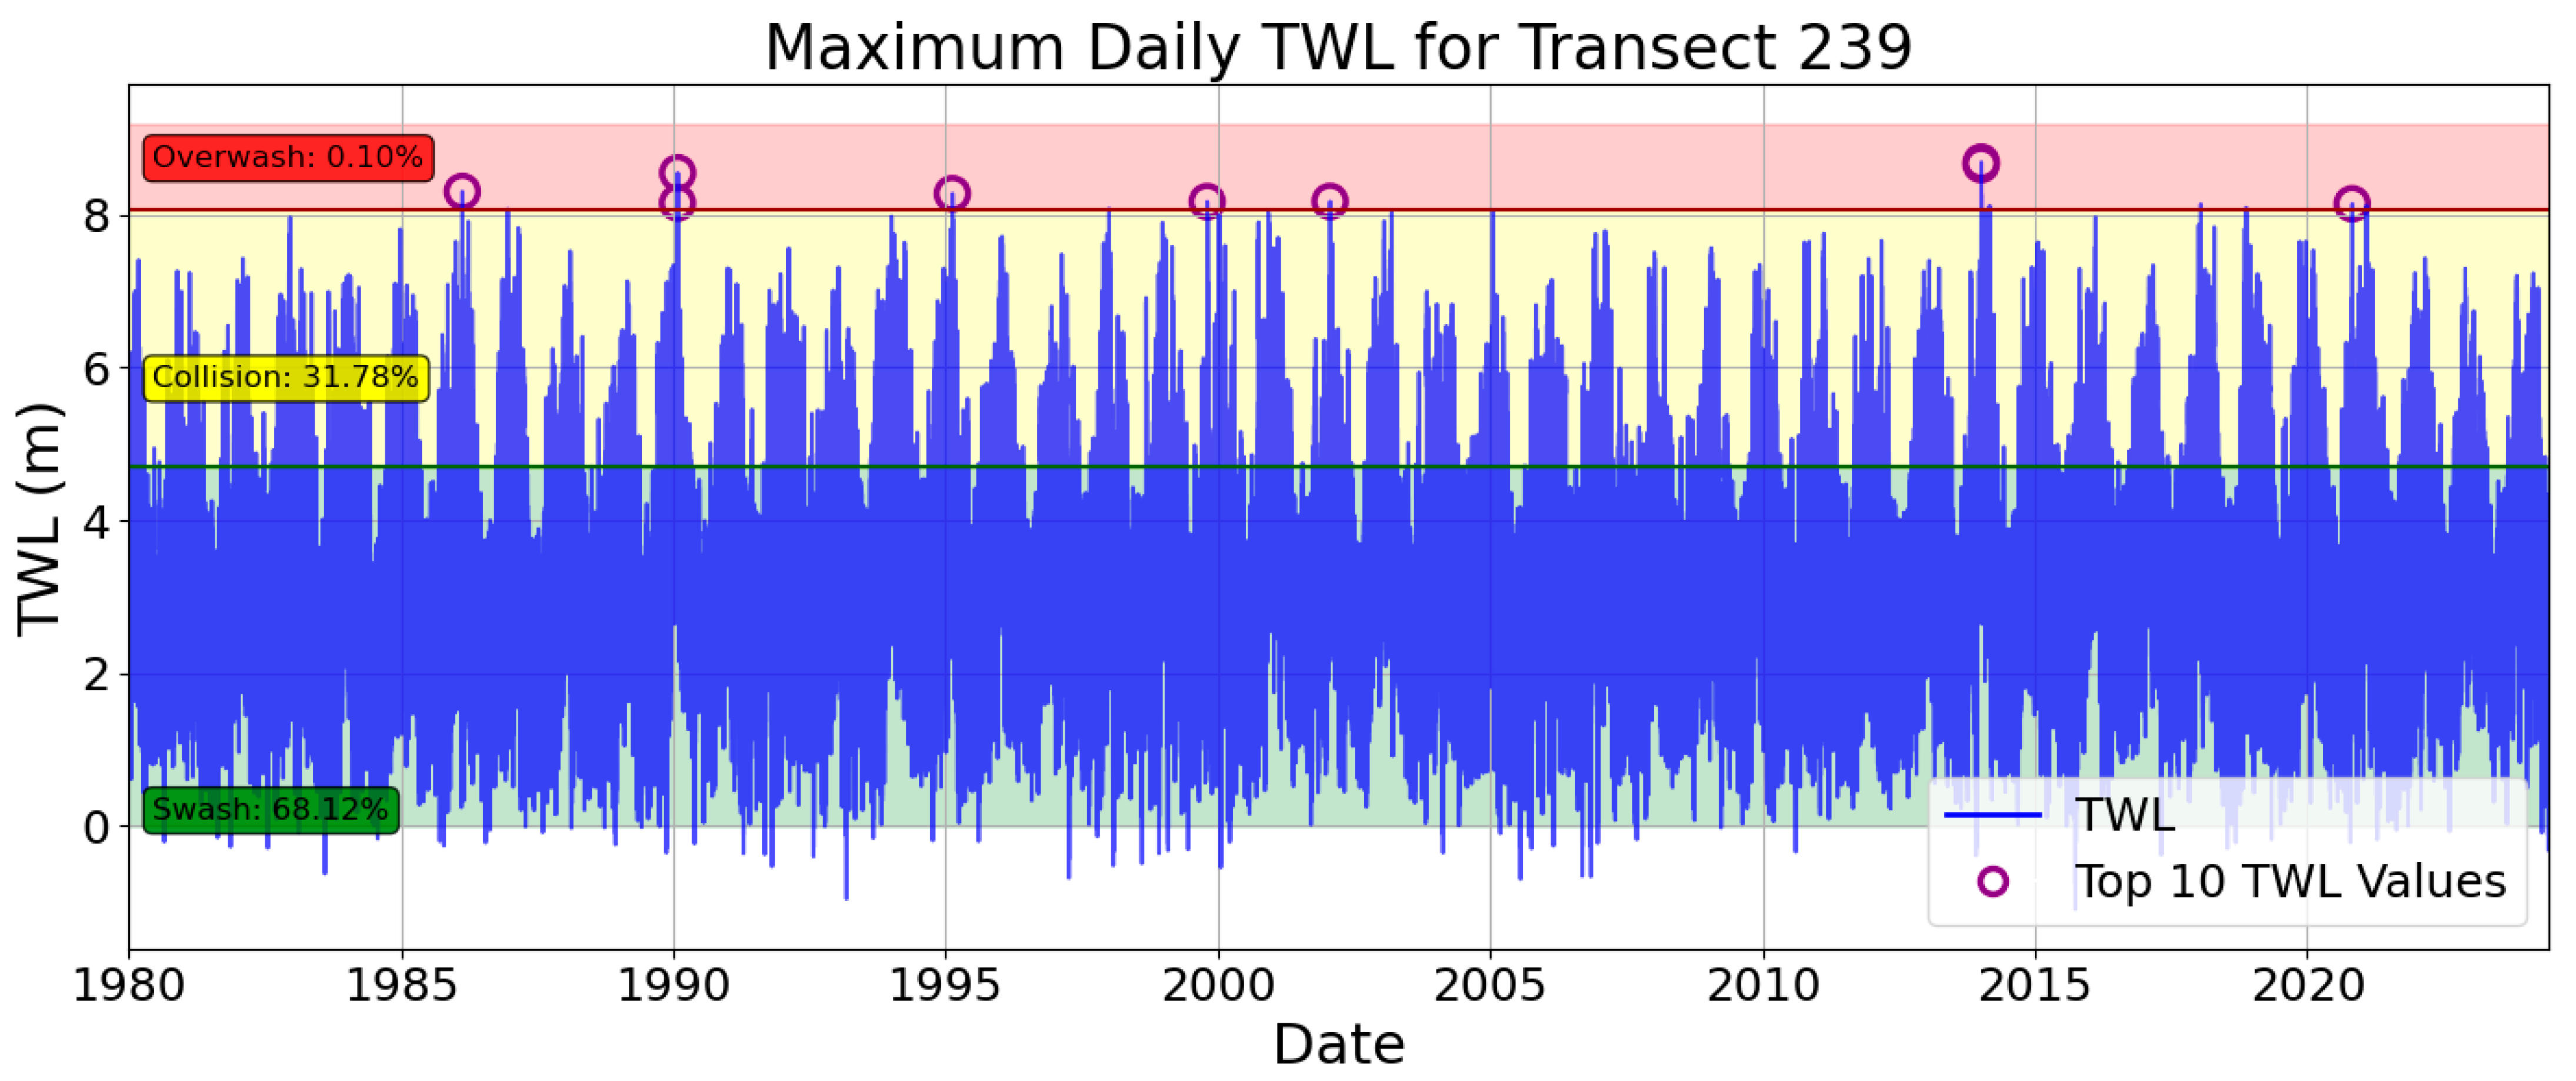
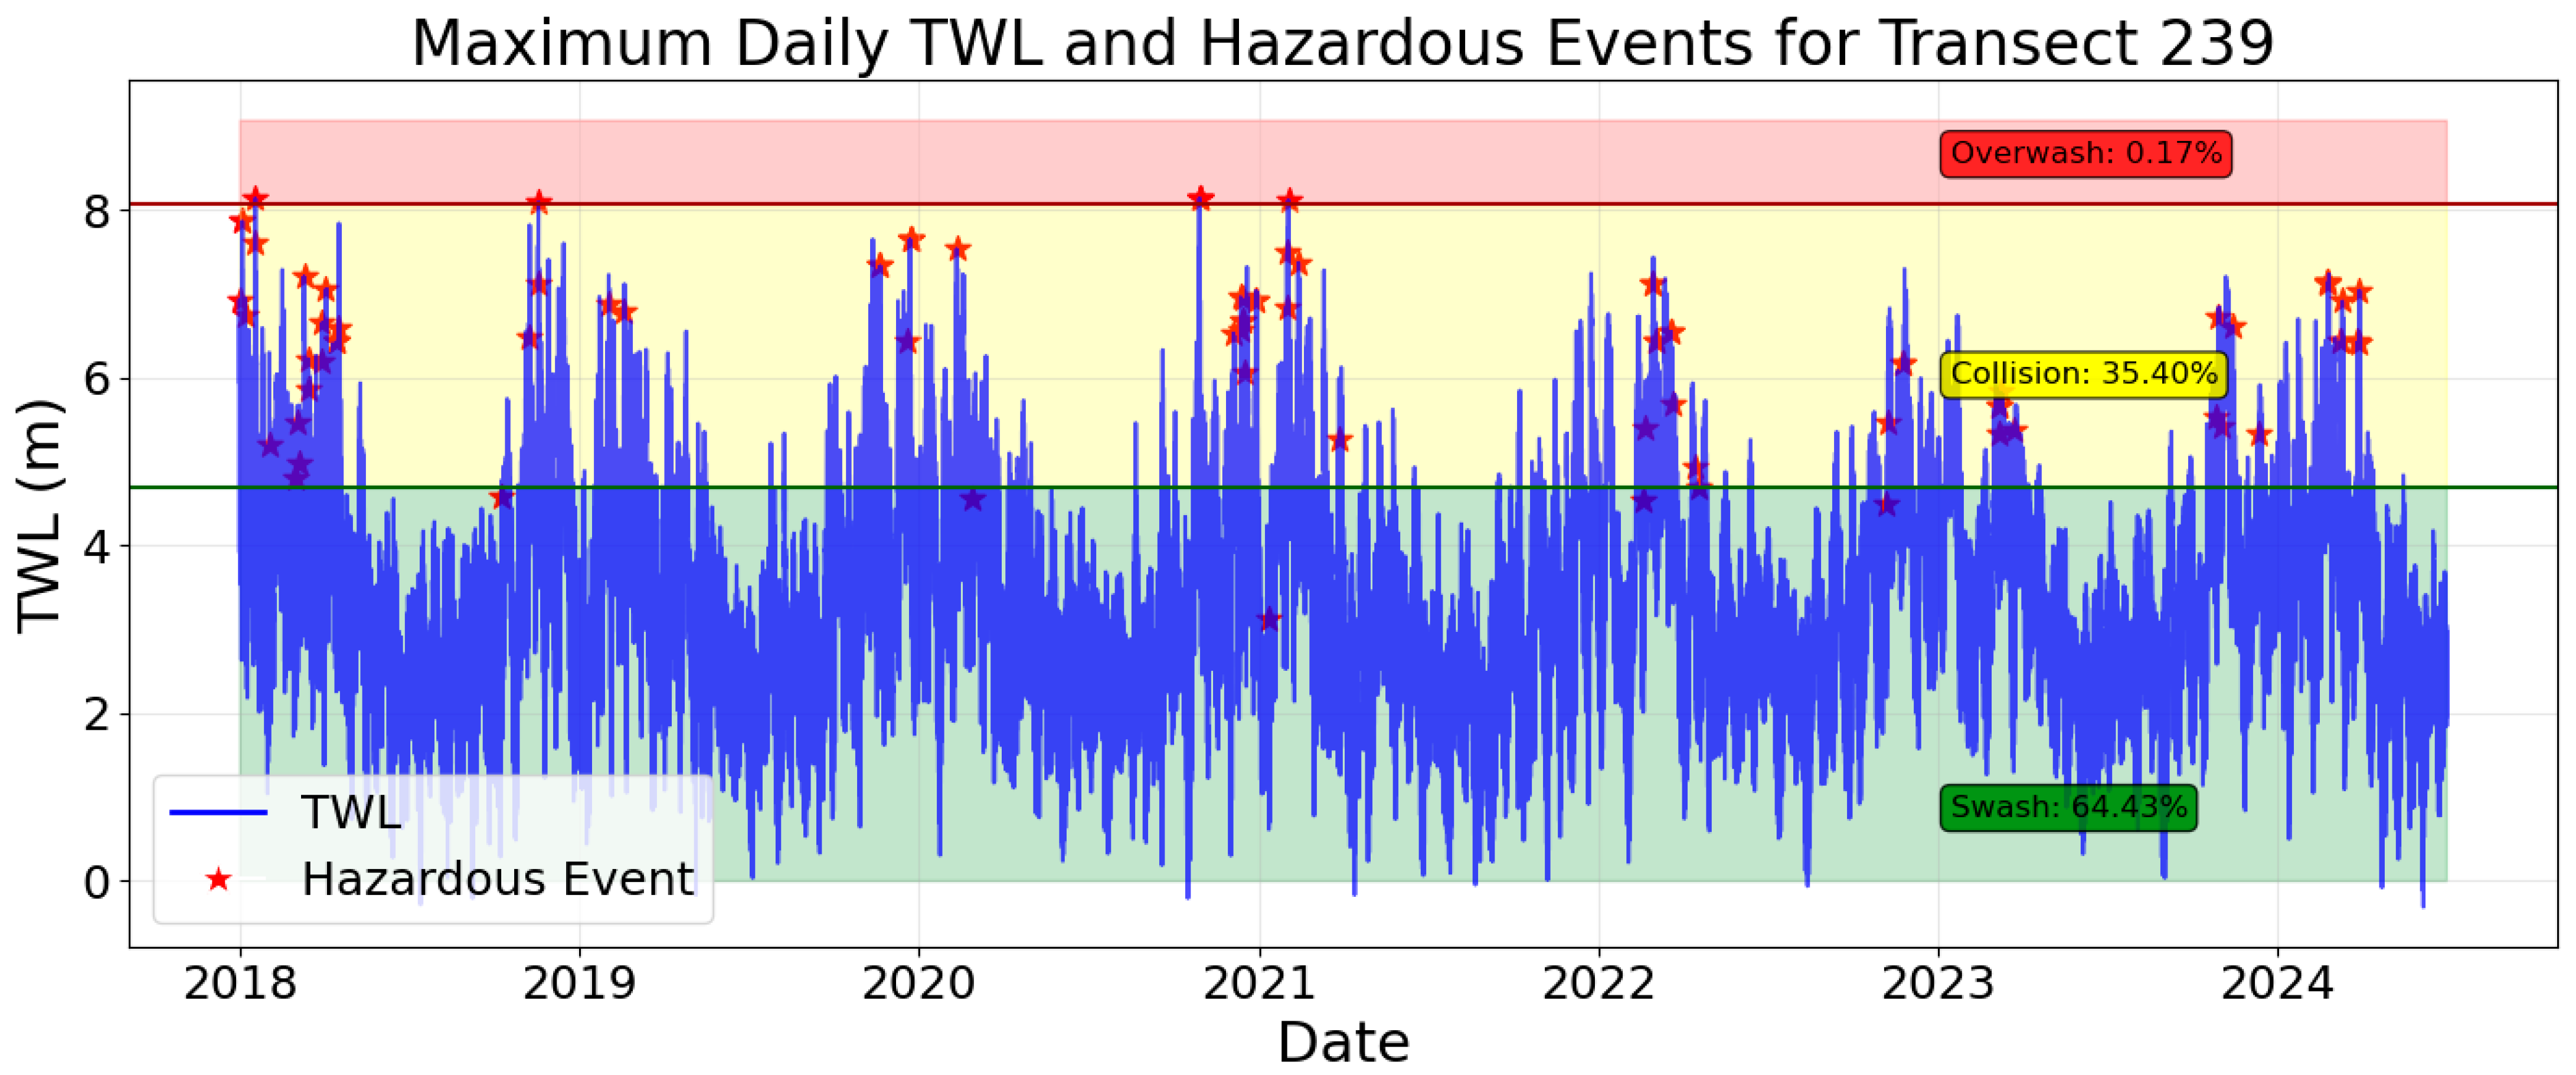
Figure 9 displays the full time-series of maximum TWL for Transect 239, which is representative of Furadouro Beach, located south of the main breakwater. This beach profile is characterized by a narrow sub-aerial beach profile and the presence of a seawall with a low toe at z = 4.69 m and its crest at 8.07 m. The low toe elevation frequently facilitates a collision regime, particularly during high tides combined with moderate to high sea roughness. As a result, 31.78% of the recorded days exhibited collision conditions at some point, based on maximum daily TWL values. The highest TWL was observed in January 2014, coinciding with Storm Hercules, which is recognized as one of the most severe coastal flooding events in Portugal in recent years [39,40]. This strong agreement with this historical extreme event suggests that the applied methodology has a reasonable level of reliability.
Figure 10 presents the time-series during the APA’s record period. During this timeframe, TWL exceeded the critical overwash threshold on four occasions, each aligning precisely with documented hazardous overwash events. This agreement underscores the predictive utility of TWL thresholds for overwash scenarios, despite their rarity (0.17% of recorded TWL daily maxima). In contrast, five instances were identified where reported hazards occurred despite TWL remaining below the dune toe elevation, representing missed predictions that warrant further investigation into localized factors or observational uncertainties.
Notably, 75 hazardous events coincided with TWL levels characteristic of the collision regime, which accounts for 35.40% of TWL regimes in the dataset. This substantial overlap highlights the dominance of collision-driven processes in hazard generation, as wave action exceeding the seawall toe elevation may suffice to trigger overtopping-related risks. Furthermore, the vertical extent of the structure (~4 m height) introduces variability in hazard intensity within the collision regime. For instance, TWL proximity to the structure’s crown (upper portion) during a collision regime likely amplifies impacts compared to scenarios where the TWL remains closer to the toe. This variation in how close the TWL gets to different parts of the structure shows that hazard intensity can change significantly within the same swash regime. Therefore, TWL-based thresholds should be refined to consider structural geometry, as classifying events only by regime type may not fully capture the range of potential impacts.
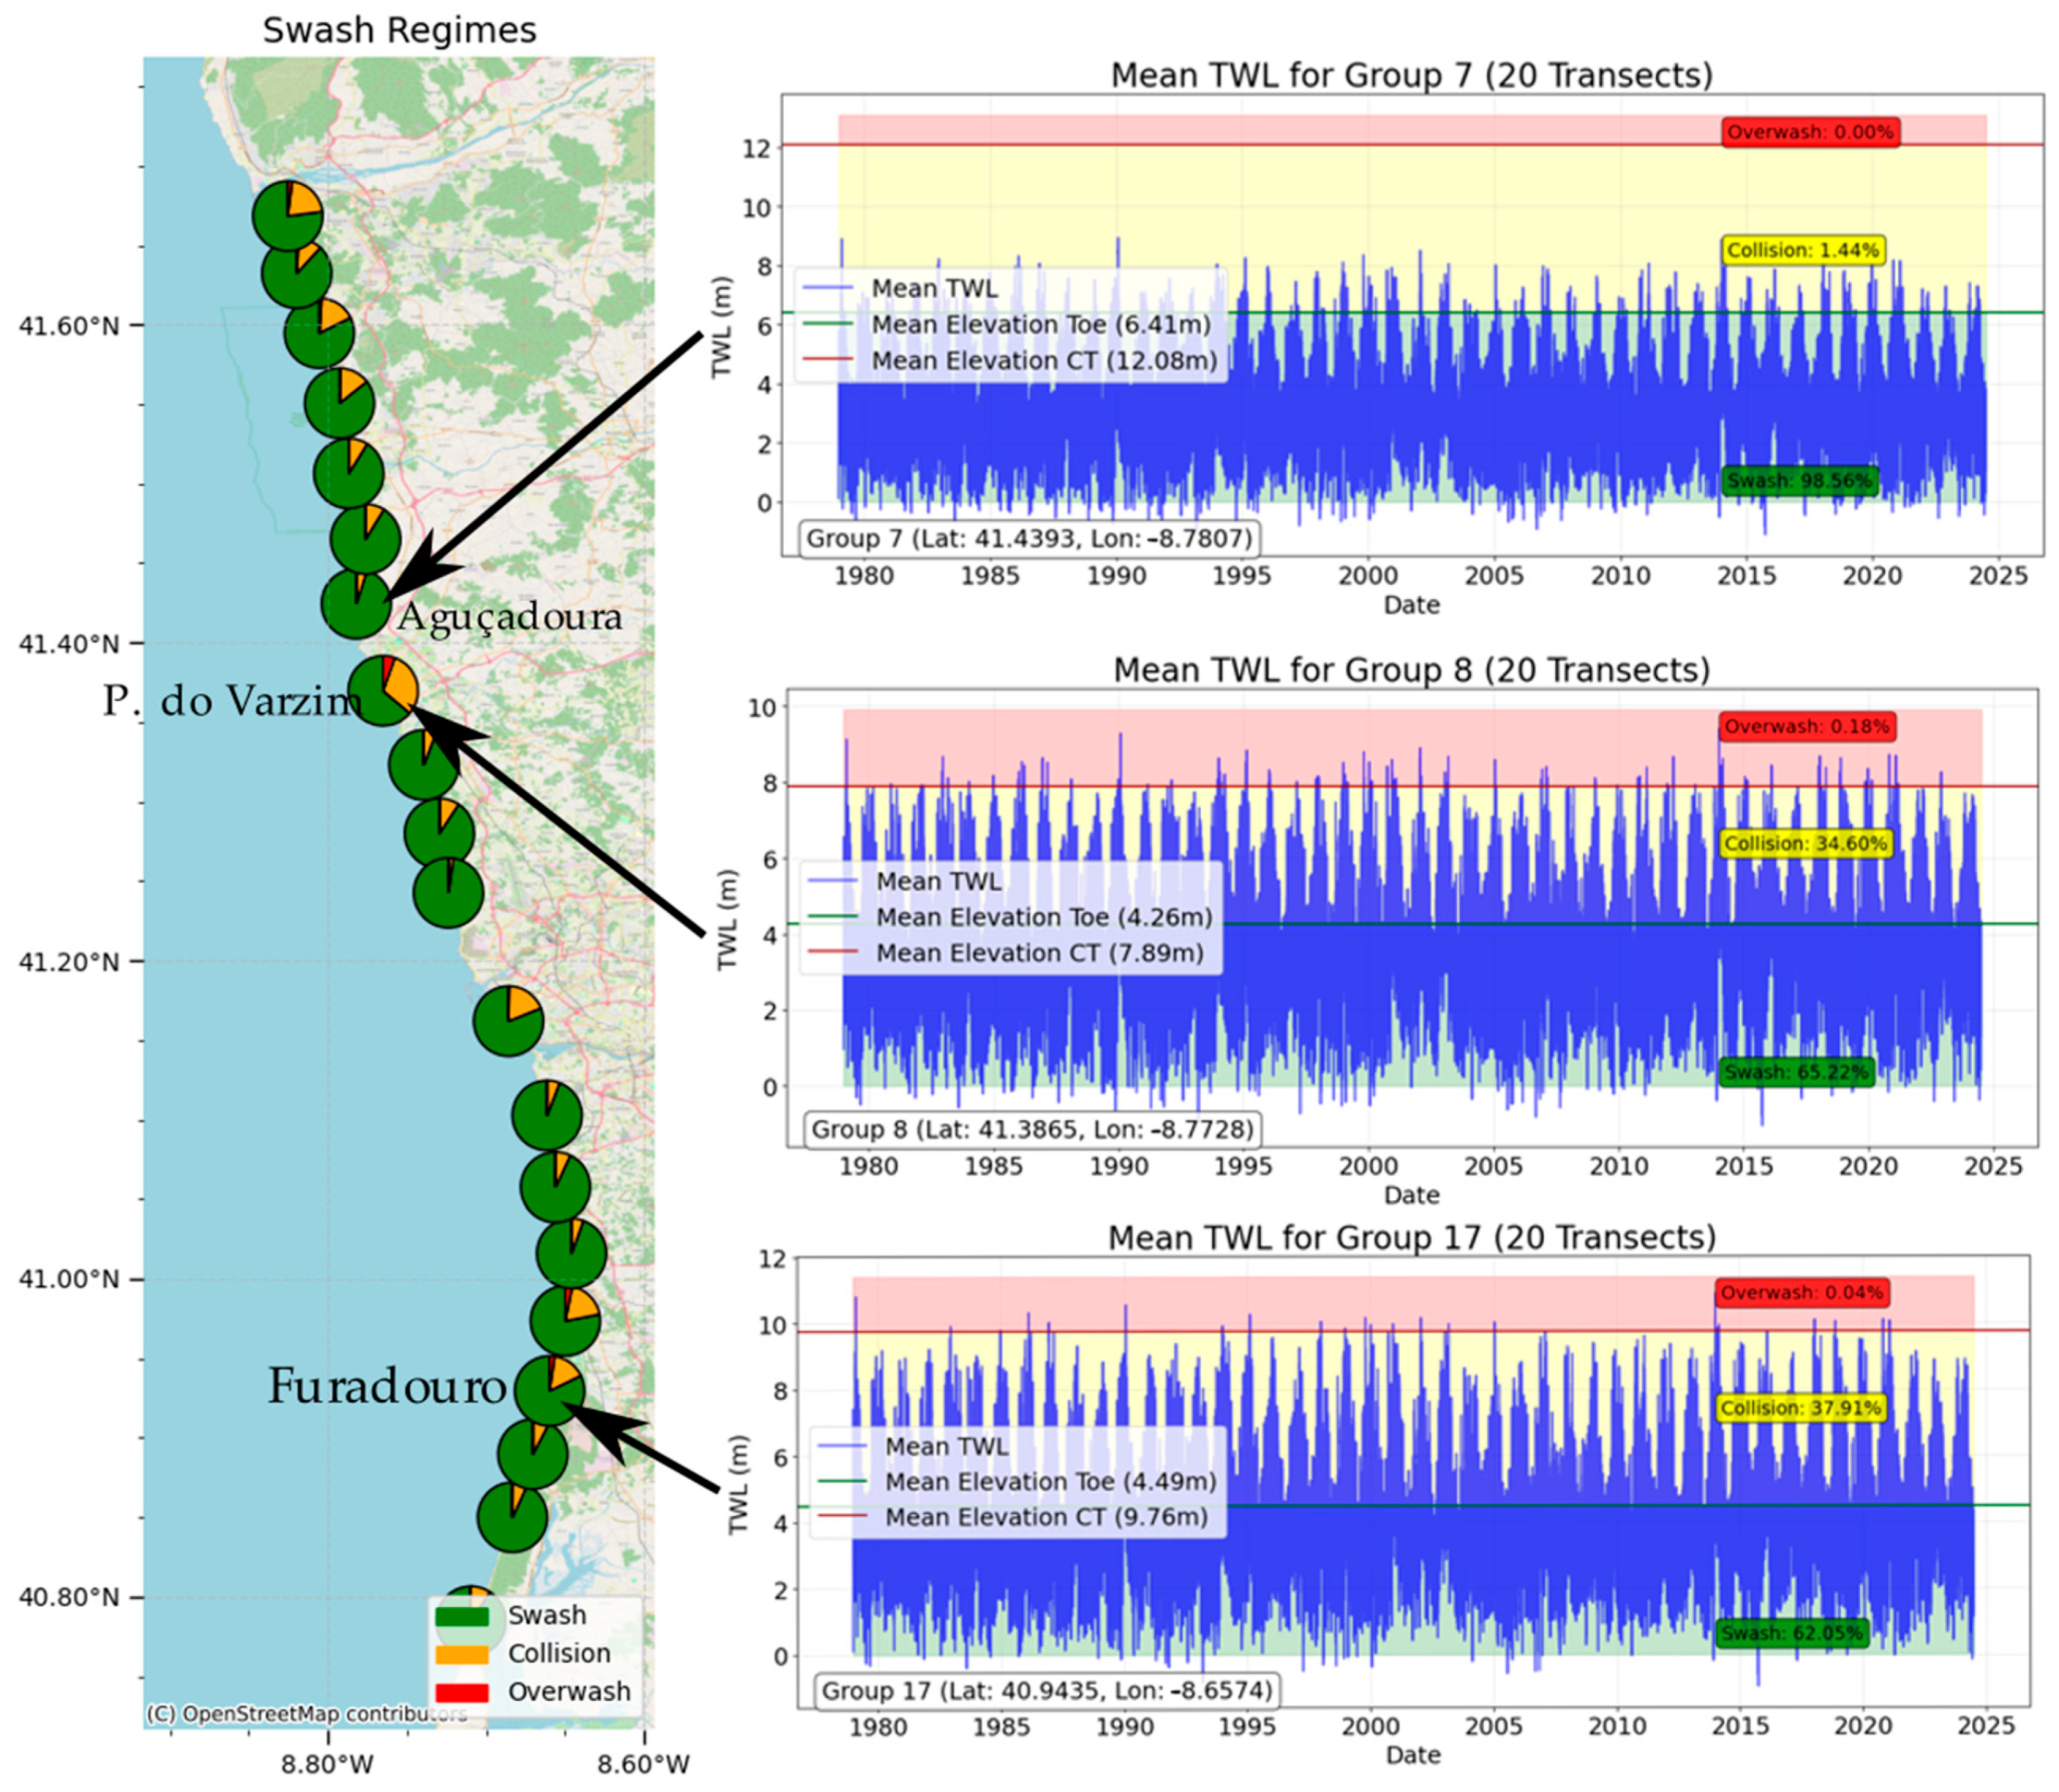
The spatial analysis at this scale, a novel component of this methodology, is presented in Figure 11, which delineates swash regime distributions across grouped transects spanning the study area. Here, 20 transects—collectively covering approximately 4–6 km of coastline each—are aggregated into 20 distinct groups to enhance clarity in visualizing long-term swash dynamics. While this grouping simplifies spatial interpretation, it inherently sacrifices resolution and information, as wave overtopping events are highly localized phenomena.
Figure 11 further illustrates mean total water level (TWL) trends and key geomorphological benchmarks (toe and crest elevations) for three representative groups (7, 8, 17). Notably, all three groups exhibit peak TWL values during January 2014, aligning with Storm Hercules, a major meteorological event that generated extreme hydrodynamic forcing across the region. The accompanying pie charts quantify swash regime prevalence over the 45-year study period, revealing distinct spatial and temporal patterns in coastal response.
Group 7, situated in the Aguçadoura region, encompasses a zone characterized by high crest elevations and a low beach slope. These geomorphological features attenuate TWL impacts, resulting in reduced collision and overwash frequencies, and a dominance of swash-dominated regimes (85%). In contrast, Group 8, located near Póvoa do Varzim, exhibits the highest overwash rates (22%) due to its proximity to a steeply sloped marina breakwater. This structure amplifies wave runup, elevating TWL and facilitating overwash even during moderate storm events. Group 17, encompassing the Furadouro zone, mirrors the behavior of Transect 239, with collision regimes dominating and occasional overwash events. This aligns with its intermediate geomorphology: moderate slopes and lower toe/crest elevations compared to Group 7. Collectively, these groups highlight the sensitivity of coastal hazards to localized geomorphology—steeper slopes and reduced structural elevations intensify collision and overwash, while gentler slopes with elevated toe/crest features promote swash dominance. Similar patterns emerge across other groups.

4. Discussion

The estimation of TWL presents several challenges. Among its three main components, tides are the most predictable due to their long-term cyclical nature and well-documented behavior [41]. Meteorological surge, on the other hand, is more challenging to forecast as it depends largely on atmospheric pressure, introducing a significant degree of uncertainty [42]. Surge plays a crucial role in regions frequently impacted by synoptic events, such as hurricanes and typhoons, where rapid pressure changes can cause substantial sea-level variations [43]. However, in areas like Portugal, its contribution to water levels is relatively minor compared to tides and waves, which exert a greater influence [44].
Some coastal flooding assessments neglect the meteorological component on sea-level [45,46,47] or rely on a static estimate for surge, which, while simplifying the analysis, may overlook localized variations and introduce a degree of oversimplification. This study presents a preliminary application of an LSTM model for modeling the surge component in Portugal, yielding a time-series that aligns with the literature in terms of order of magnitude [48,49,50], while significantly enhancing temporal variability compared to a static constant value. Although this approach is based on sea-level measurements, providing a reasonable level of reliability, further investigation is needed to assess its applicability in more critical analyses, such as extreme value assessments.
The third component of TWL, wave runup, is arguably the most impactful and challenging to estimate, particularly in highly energetic wave climates like the Portuguese coast [51]. While empirical formulas for runup rely on relatively simple input parameters, such as wave height, wave period, and beach slope, their accuracy is influenced by complex interactions [17]. These formulas are derived from site-specific field and laboratory setups, meaning their applicability may vary across different coastal environments. Nonetheless, they offer a practical and computationally efficient approach to estimating the wave contribution to TWL, making them valuable for large-scale assessments. Recent studies have explored ways to improve their performance by combining empirical methods with numerical models or data-driven approaches, including machine learning techniques that account for additional physical parameters and local variability [18,25,52], and also advanced parameters like Goda wave peak [53]. These hybrid approaches offer promising results, especially in regions where traditional formulations show consistent biases.
Several studies emphasize the importance of utilizing historical flood records to validate and calibrate coastal flooding models. National registry-reported flood events can enhance the accuracy of coastal flood risk assessments by providing reliable data for model validation, risk assessments, and more especially for regional scales [54,55,56]. Indeed, observations of prior flood events are essential for developing a thorough, comprehensive, and reliable framework for assessing coastal flooding risks. However, if records do not accurately reflect real conditions, such as by overestimating the maximum reach of water, they can compromise the effectiveness of applications like data-driven models.
A significant advantage for coastal managers in Portugal is the recent decision by the APA to document wave overtopping and coastal hazard events, and this study is among the first to utilize this dataset in scientific research. These reports have been available since 2018, making the dataset relatively limited for data-intensive models like machine learning. However, as more data are collected over time, its reliability and usefulness for such applications are expected to improve. One of the most valuable aspects of these reports is the recorded horizontal maximum reach of debris and water, as it could serve as a benchmark for data-driven or real event-based approaches, such as the tilted bathtub approach [9], to estimate the horizontal extent of wave-induced flooding. This could ultimately help link TWL vertical elevations to the corresponding horizontal flood extent.
While a data-driven model based on flood records warrants further investigation, the findings of this study indicate a lack of correlation between TWL and the horizontal reach of water. While this outcome is not ideal, it may have reasonable explanations. One likely factor is the potential misrepresentation of the maximum water and debris reach in the reports, as they were compiled by different agents across various locations, likely using inconsistent methodologies. The absence of clear technical standardization in determining the maximum extent may have contributed to this discrepancy.
Another possible reason for this mismatch could be the method used to calculate the TWL, which does not translate vertical water levels into horizontal flood extents. While a higher TWL is generally expected to lead to greater horizontal flooding, additional site-specific factors play a crucial role. One of the most significant is the “back beach slope”, or the terrain gradient immediately landward of the dune crest or critical threshold. Low-lying areas with negative slopes beyond the berm are more susceptible to extensive flooding. Another important factor that might influence the dynamic of the horizontal extension relationship with the vertical TWL is the terrain roughness, which can be addressed by a hydraulic modelling approach. Additionally, drainage systems designed primarily for managing runoff and precipitation can influence the extent of coastal flooding, especially in urban areas. During storm events, limited drainage capacity or backflow from overwhelmed systems may worsen surface flooding by preventing the proper discharge of wave overtopping flows and accumulated rainwater.
This work demonstrates that, despite the absence of correlation with maximum water extent, the calculated TWL and swash regimes exhibit strong coherence with recorded hazardous events, as clearly evidenced at the Furadouro transect. During the APA record period, all four overwash events identified by TWL calculations aligned with documented hazard reports, reinforcing this relationship. These findings underscore the utility of TWL as a reliable proxy for coastal hazard assessment—a critical tool for coastal management, particularly in urban flooding contexts.
A key contribution of this study lies in demonstrating the viability of this approach for large-scale coastal flood hazard assessments, such as application to the entire Portuguese coastline. While global studies [57] reveal broad patterns and local investigations provide detailed site-specific insights, this regional-scale approach uniquely identifies hazard hotspots while maintaining sufficient resolution for robust statistical and spatial analysis, as exemplified by the Furadouro case study. By bridging these scales, the methodology achieves an optimal balance between computational efficiency and analytical precision, offering coastal managers a practical yet reliable tool for long-term and wide-area flood risk assessment.

5. Conclusions

This study presents a systematic and regionally scalable approach to assessing coastal flooding hazards along a 120 km stretch of the northern Portuguese coast. By combining long-term oceanographic data with geomorphological processing and analysis from a national-scale high-resolution DTM, and integrating empirical wave runup estimates with tides and surge components, the method offers a practical framework for calculating total water levels (TWL) and classifying swash regimes at a regional scale.
A key strength of this work lies in its ability to strike a balance between methodological accuracy and operational feasibility. While traditional flood assessments often rely on detailed, site-specific numerical models that are limited in scope due to their computational and human resources demands, this study demonstrates how empirical approaches—grounded in observed data and geomorphological indicators—can provide meaningful results over broad areas with limited resources.
By applying and evaluating multiple empirical wave runup formulas, this study also provides valuable insight into their performance across both hazardous and non-hazardous conditions. The results indicate that formulas such as STO06 and HOL86 [19,32] yield more balanced outcomes, making them suitable for further application in this region. The classification of swash, collision, and overwash regimes, particularly when validated against flood reports from the Portuguese Environmental Agency (APA), further supports the methodology’s reliability. Despite some limitations in correlating TWL with the maximum horizontal reach of water due to potential inconsistencies in historical records, the coherence with documented hazardous events reinforces the utility of TWL as a proxy for flood hazard evaluation.
Importantly, this work contributes to the broader field of urban flood risk by offering a scalable approach for identifying flood-prone areas along densely populated coastal zones. In urbanized regions such as the northern Portuguese coast—where development, infrastructure, and socio-economic activity are concentrated—assessing overwash potential and understanding flooding dynamics is critical for both planning and emergency response. The findings also underscore the importance of maintaining and standardizing flood records, as these play a vital role in validating and improving coastal hazard assessments, and with enough records, possibly allowing a data-driven approach in the near future.
Finally, the presented methodology may serve as a foundation for future developments in large-scale coastal flood risk mapping, including integration with horizontal flood extent models using 2D hydrodynamic simulations [15,58,59] and the incorporation of land-use and infrastructure data to refine impact assessments. Adaptation to climate change scenarios—including sea-level rise projections and analysis of future extreme events—will also be explored to improve long-term coastal planning and resilience. This study supports the ongoing efforts to create robust, cost-effective tools for coastal managers and urban planners to enhance flood resilience in vulnerable coastal regions.

Author Contributions

Conceptualization, J.E.C.-B.; methodology, J.E.C.-B., T.F.-F. and T.P.; software, J.E.C.-B. and A.G.M.; validation, J.E.C.-B., T.P., T.F.-F., P.R.-S. and F.T.-P.; formal analysis, J.E.C.-B., T.F.-F., P.R.-S. and F.T.-P.; investigation, J.E.C.-B., T.P., T.F.-F., P.R.-S. and F.T.-P.; resources, J.E.C.-B., T.F.-F., P.R.-S. and F.T.-P.; data curation, J.E.C.-B.; writing—original draft preparation, J.E.C.-B.; writing—review and editing, J.E.C.-B., T.F.-F., P.R.-S. and F.T.-P.; visualization, J.E.C.-B.; supervision, F.T.-P.; project administration, J.E.C.-B., T.F.-F., P.R.-S. and F.T.-P.; funding acquisition, J.E.C.-B. All authors have read and agreed to the published version of the manuscript.

Funding

The main author acknowledges funding in the form of a Ph.D. fellowship granted by the “la Caixa” Foundation (ID 100010434) within the Doctoral INPhINIT program (ID LCF/BQ/DI22/11940021).

Data Availability Statement

The data presented in this study are available on request from the corresponding author. The data are not publicly available due to confidentiality and privacy concerns.

Conflicts of Interest

The authors declare no conflicts of interest.

References

  1. Sebastião, P.; Guedes Soares, C.; Booij, N. Wave Hindcasting off the Coast of Portugal. Coast. Eng. 2000, 40, 411–425. [Google Scholar] [CrossRef]
  2. Barros, J.L.; Santos, P.P.; Tavares, A.O.; Freire, P.; Fortunato, A.B.; Rilo, A.; Oliveira, F.S.B.F. The Complexity of the Coastal Zone: Definition of Typologies in Portugal as a Contribution to Coastal Disaster Risk Reduction and Management. Int. J. Disaster Risk Reduct. 2023, 86, 103556. [Google Scholar] [CrossRef]
  3. Barros, J.L.; Santos, P.P.; Tavares, A.O.; Freire, P. Inundações e Galgamentos Costeiros: Uma Base de Dados de Ocorrências e Seus Impactos Para a Costa Continental Portuguesa Entre 1980 e 2018. In O Compromisso da Geografia Para Territórios em Mudança. Livro de Atas do XIII Congresso da Geografia Portuguesa; Associação Portuguesa de Geógrafos: Lisbon, Protugal, 2022. [Google Scholar]
  4. Antunes, C.; Taborda, R. Sea Level at Cascais Tide Gauge: Data, Analysis and Results. J. Coast. Res. 2009, 56, 218–222. [Google Scholar]
  5. Vitousek, S.; Barnard, P.L.; Fletcher, C.H.; Frazer, N.; Erikson, L.; Storlazzi, C.D. Doubling of Coastal Flooding Frequency within Decades Due to Sea-Level Rise. Sci. Rep. 2017, 7, 1399. [Google Scholar] [CrossRef] [PubMed]
  6. Green, J.; Haigh, I.; Quinn, N.; Neal, J.; Wahl, T.; Wood, M.; Eilander, D.; De Ruiter, M.; Ward, P.; Camus, P. Review Article: A Comprehensive Review of Compound Flooding Literature with a Focus on Coastal and Estuarine Regions. EGUsphere 2024. [Google Scholar] [CrossRef]
  7. de Magalhães Oliveira Martins, B.T. Caracterização da Evolução Recente da Linha de Costa e Identificação de Zonas Vulneráveis no Trecho Costeiro Caminha-Espinho. Ph.D. Thesis, Universidade do Porto, Porto, Portugal, 2013. [Google Scholar]
  8. Agência Portuguesa do Ambiente. Programas da Orla Costeira; APA: Amadora, Portugal, 2021. [Google Scholar]
  9. Carneiro-Barros, J.E.; Plomaritis, T.A.; Fazeres-Ferradosa, T.; Rosa-Santos, P.; Taveira-Pinto, F. Coastal Flood Mapping with Two Approaches Based on Observations at Furadouro, Northern Portugal. Remote Sens. 2023, 15, 5215. [Google Scholar] [CrossRef]
  10. Pinto, I.M.P. Galgamentos e Inundações Costeiras Na Frente Urbana Do Furadouro-Concelho de Ovar. Master’s Thesis, Universidade do Porto, Porto, Portugal, 2022. [Google Scholar]
  11. Turner, I.L.; Leaman, C.K.; Harley, M.D.; Thran, M.C.; David, D.R.; Splinter, K.D.; Matheen, N.; Hansen, J.E.; Cuttler, M.V.W.; Greenslade, D.J.M.; et al. A Framework for National-Scale Coastal Storm Hazards Early Warning. Coast. Eng. 2024, 192, 104571. [Google Scholar] [CrossRef]
  12. Stockdon, H.F.; Long, J.W.; Palmsten, M.L.; Van Der Westhuysen, A.; Doran, K.S.; Snell, R.J. Operational Forecasts of Wave-Driven Water Levels and Coastal Hazards for US Gulf and Atlantic Coasts. Commun. Earth Environ. 2023, 4, 169. [Google Scholar] [CrossRef]
  13. Bertin, X.; de Bakker, A.; van Dongeren, A.; Coco, G.; André, G.; Ardhuin, F.; Bonneton, P.; Bouchette, F.; Castelle, B.; Crawford, W.C.; et al. Infragravity Waves: From Driving Mechanisms to Impacts. Earth-Sci. Rev. 2018, 177, 774–799. [Google Scholar] [CrossRef]
  14. Lashley, C.H.; Jonkman, S.N.; Van Der Meer, J.; Bricker, J.D.; Vuik, V. The Influence of Infragravity Waves on the Safety of Coastal Defences: A Case Study of the Dutch Wadden Sea. Nat. Hazards Earth Syst. Sci. 2022, 22, 1–22. [Google Scholar] [CrossRef]
  15. Leijnse, T.W.B.; van Ormondt, M.; van Dongeren, A. Estimating Nearshore Infragravity Wave Conditions at Large Spatial Scales. Front. Mar. Sci. 2024, 11, 1355095. [Google Scholar] [CrossRef]
  16. Parker, K.; Erikson, L.; Thomas, J.; Nederhoff, K.; Barnard, P.; Muis, S. Relative Contributions of Water-Level Components to Extreme Water Levels along the US Southeast Atlantic Coast from a Regional-Scale Water-Level Hindcast. Nat. Hazards 2023, 117, 2219–2248. [Google Scholar] [CrossRef]
  17. Gomes Da Silva, P.; Coco, G.; Garnier, R.; Klein, A.H.F. On the Prediction of Runup, Setup and Swash on Beaches. Earth-Sci. Rev. 2020, 204, 103148. [Google Scholar] [CrossRef]
  18. Villarroel-Lamb, D.; Williams, A.H. Quantifying Wave Runup in Data-Sparse Locations for Planning. West Indian J. Eng. 2022, 44, 58–69. [Google Scholar] [CrossRef]
  19. Stockdon, H.F.; Holman, R.A.; Howd, P.A.; Sallenger, A.H. Empirical Parameterization of Setup, Swash, and Runup. Coast. Eng. 2006, 53, 573–588. [Google Scholar] [CrossRef]
  20. Donnelly, C.; Wamsley, T.V.; Kraus, N.C.; Larson, M.; Hanson, H. Morphologic Classification of Coastal Overwash. In Proceedings of the Coastal Engineering 2006; World Scientific Publishing Company: San Diego, CA, USA, 2007; pp. 2805–2817. [Google Scholar]
  21. Plomaritis, T.A.; Ferreira, Ó.; Costas, S. Regional Assessment of Storm Related Overwash and Breaching Hazards on Coastal Barriers. Coast. Eng. 2018, 134, 124–133. [Google Scholar] [CrossRef]
  22. Ferreira, Ó.; Plomaritis, T.A.; Costas, S. Process-Based Indicators to Assess Storm Induced Coastal Hazards. Earth-Sci. Rev. 2017, 173, 159–167. [Google Scholar] [CrossRef]
  23. Gallien, T.; Kalligeris, N.; Delisle, M.-P.; Tang, B.-X.; Lucey, J.; Winters, M. Coastal Flood Modeling Challenges in Defended Urban Backshores. Geosciences 2018, 8, 450. [Google Scholar] [CrossRef]
  24. De Santiago, I.; Plomaritis, T.A.; Avalos, D.; Garnier, R.; Abalia, A.; Epelde, I.; Liria, P. Comparison of Wave Overtopping Estimation Models for Urban Beaches. Towards an Early Warning System on the Basque Coast. Sci. Total Environ. 2024, 912, 168783. [Google Scholar] [CrossRef]
  25. Vousdoukas, M.I.; Mentaschi, L.; Voukouvalas, E.; Verlaan, M.; Jevrejeva, S.; Jackson, L.P.; Feyen, L. Global Probabilistic Projections of Extreme Sea Levels Show Intensification of Coastal Flood Hazard. Nat. Commun. 2018, 9, 2360. [Google Scholar] [CrossRef]
  26. Hinkel, J.; Feyen, L.; Hemer, M.; Le Cozannet, G.; Lincke, D.; Marcos, M.; Mentaschi, L.; Merkens, J.L.; de Moel, H.; Muis, S.; et al. Uncertainty and Bias in Global to Regional Scale Assessments of Current and Future Coastal Flood Risk. Earth’s Future 2021, 9, e2020EF001882. [Google Scholar] [CrossRef]
  27. Palmsten, M.L.; Holman, R.A. Laboratory Investigation of Dune Erosion Using Stereo Video. Coast. Eng. 2012, 60, 123–135. [Google Scholar] [CrossRef]
  28. Majidi, A.G.; Ramos, V.; Calheiros-Cabral, T.; Neves, L.D.; Rosa-Santos, P.; Taveira-Pinto, F. Integrated Assessment of Offshore Wind and Wave Power Resources in Mainland Portugal. Energy 2024, 308, 132944. [Google Scholar] [CrossRef]
  29. Majidi, A.G.; Ramos, V.; Amarouche, K.; Rosa Santos, P.; Das Neves, L.; Taveira-Pinto, F. Assessing the Impact of Wave Model Calibration in the Uncertainty of Wave Energy Estimation. Renew. Energy 2023, 212, 415–429. [Google Scholar] [CrossRef]
  30. Van Ormondt, M.; Nederhoff, K.; Van Dongeren, A. Delft Dashboard: A Quick Set-up Tool for Hydrodynamic Models. J. Hydroinformatics 2020, 22, 510–527. [Google Scholar] [CrossRef]
  31. Giaremis, S.; Nader, N.; Dawson, C.; Kaiser, C.; Nikidis, E.; Kaiser, H. Storm Surge Modeling in the AI Era: Using LSTM-Based Machine Learning for Enhancing Forecasting Accuracy. Coast. Eng. 2024, 191, 104532. [Google Scholar] [CrossRef]
  32. Holman, R.A. Extreme Value Statistics for Wave Run-up on a Natural Beach. Coast. Eng. 1986, 9, 527–544. [Google Scholar] [CrossRef]
  33. Nielsen, P.; Hanslow, D.J. Wave Runup Distributions on Natural Beaches. J. Coast. Res. 1991, 7, 1139–1152. [Google Scholar]
  34. Ruggiero, P.; Komar, P.D.; McDougal, W.G.; Marra, J.J.; Beach, R.A. Wave Runup, Extreme Water Levels and the Erosion of Properties Backing Beaches. J. Coast. Res. 2001, 17, 407–419. [Google Scholar]
  35. Vousdoukas, M.I.; Wziatek, D.; Almeida, L.P. Coastal Vulnerability Assessment Based on Video Wave Run-up Observations at a Mesotidal, Steep-Sloped Beach. Ocean. Dyn. 2012, 62, 123–137. [Google Scholar] [CrossRef]
  36. Leaman, C.; Beuzen, T.; Goldstein, E.B. Chrisleaman/Py-Wave-Runup: V0.1.10 2020. Available online: https://py-wave-runup.readthedocs.io/en/latest/ (accessed on 1 December 2023).
  37. Sallenger, A.H. Storm Impact Scale for Barrier Islands. J. Coast. Res. 2000, 16, 890–895. [Google Scholar]
  38. Leaman, C.K.; Harley, M.D.; Splinter, K.D.; Thran, M.C.; Kinsela, M.A.; Turner, I.L. A Storm Hazard Matrix Combining Coastal Flooding and Beach Erosion. Coast. Eng. 2021, 170, 104001. [Google Scholar] [CrossRef]
  39. Lemos, G.; Soares, P.M.M.; Simões, R.; Antunes, C.; Bosnic, I.; Pinto, C. A Physical Climate Storyline for the Hercules Storm in Portugal: Extreme Coastal Flooding in Southwestern Europe under a Changing Climate. Sci. Total Environ. 2025, 971, 179050. [Google Scholar] [CrossRef]
  40. Santos, Â.; Mendes, S.; Corte-Real, J. Impacts of the storm Hercules in Portugal. Finisterra 2014, 49, 197–220. [Google Scholar] [CrossRef]
  41. Haigh, I.D.; Pickering, M.D.; Green, J.A.M.; Arbic, B.K.; Arns, A.; Dangendorf, S.; Hill, D.F.; Horsburgh, K.; Howard, T.; Idier, D.; et al. The Tides They Are A-Changin’: A Comprehensive Review of Past and Future Nonastronomical Changes in Tides, Their Driving Mechanisms, and Future Implications. Rev. Geophys. 2020, 58, e2018RG000636. [Google Scholar] [CrossRef]
  42. Marcos, M.; Rohmer, J.; Vousdoukas, M.; Mentaschi, L.; Le, C.G.; Amores, A. Increased Extreme Coastal Water Levels Due to the Combined Action of Storm Surges and Wind-Waves. Geophys. Res. Lett. 2019, 46, 4356–4364. [Google Scholar] [CrossRef]
  43. Needham, H.F.; Keim, B.D.; Sathiaraj, D. A Review of Tropical Cyclone-Generated Storm Surges: Global Data Sources, Observations, and Impacts. Rev. Geophys. 2015, 53, 545–591. [Google Scholar] [CrossRef]
  44. Dodet, G.; Melet, A.; Ardhuin, F.; Bertin, X.; Idier, D.; Almar, R. The Contribution of Wind-Generated Waves to Coastal Sea-Level Changes. Surv. Geophys. 2019, 40, 1563–1601. [Google Scholar] [CrossRef]
  45. Poseiro, P.; Reis, M.T.; Fortes, C.J.E.M.; Lopes, E.M.; Sabino, A.; Rodrigues, A. Aplicação do Sistema de Previsão e Alerta de Inundações HIDRALERTA: Caso de Estudo da Costa da Caparica. In Proceedings of the 3as Jornadas de Engenharia Hidrográfica, Lisbon, Portugal, 24–26 June 2014. [Google Scholar] [CrossRef]
  46. Manz, A.; Zózimo, A.C.; Garzon, J.L. Application of SWASH to Compute Wave Overtopping in Ericeira Harbour for Operational Purposes. J. Mar. Sci. Eng. 2022, 10, 1881. [Google Scholar] [CrossRef]
  47. Fortes, C.J.E.M.; Reis, R.; Reis, M.T.; Poseiro, P.; Craveiro, J.; Santos, J.A. Risco de galgamento nas estruturas marítimas da praia da Vitória: Resultados do sistema HIDRALERTA. Territorium 2015, 22, 103–117. [Google Scholar] [CrossRef]
  48. Antunes, C.; Lemos, G. A Probabilistic Approach to Combine Sea Level Rise, Tide and Storm Surge into Representative Return Periods of Extreme Total Water Levels: Application to the Portuguese Coastal Areas. Estuar. Coast. Shelf Sci. 2025, 313, 109060. [Google Scholar] [CrossRef]
  49. Lemos, G.; Bosnic, I.; Antunes, C.; Vousdoukas, M.; Mentaschi, L.; Espírito Santo, M.; Ferreira, V.; Soares, P.M.M. The Future of the Portuguese (SW Europe) Most Vulnerable Coastal Areas under Climate Change–Part II: Future Extreme Coastal Flooding from Downscaled Bias Corrected Wave Climate Projections. Ocean. Eng. 2024, 310, 118448. [Google Scholar] [CrossRef]
  50. Lemos, G.; Bosnic, I.; Antunes, C.; Vousdoukas, M.; Mentaschi, L.; Soares, P.M.M. The Future of the Portuguese (SW Europe) Most Vulnerable Coastal Areas under Climate Change–Part I: Performance Evaluation and Shoreline Evolution from a Downscaled Bias Corrected Wave Climate Ensemble. Ocean. Eng. 2024, 302, 117661. [Google Scholar] [CrossRef]
  51. Garcia, T.; Ferreira, O.; Matias, A.; Dias, J.A. Coastal Hazards Representation for Praia Do Barril (Algarve, Portugal). J. Coast. Res. 2005, 49, 28–33. [Google Scholar]
  52. Beuzen, T.; Goldstein, E.; Splinter, K. Ensemble Models from Machine Learning: An Example of Wave Runup and Coastal Dune Erosion. Nat. Hazards Earth Syst. Sci. 2019, 19, 2295–2309. [Google Scholar] [CrossRef]
  53. Bujak, D.; Ilic, S.; Miličević, H.; Carević, D. Wave Runup Prediction and Alongshore Variability on a Pocket Gravel Beach under Fetch-Limited Wave Conditions. J. Mar. Sci. Eng. 2023, 11, 614. [Google Scholar] [CrossRef]
  54. Kralj, E.; Kumer, P.; Meulenberg, C.J.W. Coastal Flood Risk Assessment: An Approach to Accurately Map Flooding through National Registry-Reported Events. J. Mar. Sci. Eng. 2023, 11, 2290. [Google Scholar] [CrossRef]
  55. Rilo, A.; Tavares, A.O.; Freire, P.; Zêzere, J.L.; Haigh, I.D. Improving Estuarine Flood Risk Knowledge through Documentary Data Using Multiple Correspondence Analysis. Water 2022, 14, 3161. [Google Scholar] [CrossRef]
  56. Molinari, D.; De Bruijn, K.; Castillo, J.; Aronica, G.; Bouwer, L. Validation of Flood Risk Models: Current Practice and Possible Improvements. Int. J. Disaster Risk Reduct. 2018, 33, 441–448. [Google Scholar] [CrossRef]
  57. Almar, R.; Ranasinghe, R.; Bergsma, E.W.J.; Diaz, H.; Melet, A.; Papa, F.; Vousdoukas, M.; Athanasiou, P.; Dada, O.; Almeida, L.P.; et al. A Global Analysis of Extreme Coastal Water Levels with Implications for Potential Coastal Overtopping. Nat. Commun. 2021, 12, 3775. [Google Scholar] [CrossRef]
  58. Leijnse, T. SFINCS Documentation. Available online: https://sfincs.readthedocs.io/en/latest/ (accessed on 1 December 2024).
  59. Leijnse, T.; Van Ormondt, M.; Nederhoff, K.; Van Dongeren, A. Modeling Compound Flooding in Coastal Systems Using a Computationally Efficient Reduced-Physics Solver: Including Fluvial, Pluvial, Tidal, Wind- and Wave-Driven Processes. Coast. Eng. 2021, 163, 103796. [Google Scholar] [CrossRef]
Figure 1. Location map of study area (left) and remarkable examples of coastal flooding events in three locations, Viana do Castelo, Foz do Douro, and Furadouro.
Water 17 01478 g001
Figure 2. Map showing the locations of wave points and transects (a), with a zoomed-in view of the Arcozelo region displaying the transects, shoreline, dune toe, critical threshold position, wave points, and digital terrain model (DTM) (b).
Water 17 01478 g002
Figure 3. Visual scheme for swash regimes, together with important variables in TWL assessment, like wave setup ( η ), beach slope ( β ), and wave runup ( R 2 ), as well as elevation points at mean sea-level, dune toe, and dune crest or critical threshold ( Z 0 , Z t o e , and Z c t , respectively).
Water 17 01478 g003
Figure 4. Overview of transects and position of key geomorphological features over Esposende zone.
Water 17 01478 g004
Figure 5. Two beach profiles along transects and key obtained features, such as dune toe, dune crest, and beach slope. These profiles were extracted from the Viana do Castelo region.
Water 17 01478 g005
Figure 6. Comparison between predicted values and actual values for surge component using LSTM model.
Water 17 01478 g006
Figure 7. TWL calculated using 6 different formulas for R2 and statistical comparison with maximum reach of water and debris recorded by APA.
Water 17 01478 g007
Figure 8. Swash rates proportions for each R2 formula, for all transects (up) and for APA’s record transects (down), during summer months.
Water 17 01478 g008
Figure 9. Full time-series of maximum TWL for transect 239, located in Furadouro.
Water 17 01478 g009
Figure 10. Time-series for the APA’s record period (2018–2024) for Transect 239, located in Furadouro.
Water 17 01478 g010
Figure 11. Spatial distribution of 20 groups of transects and exemplification of TWL time-series for three of these.
Water 17 01478 g011
Table 1. Statistic description of key geomorphological features.
Dune Toe Elev. (m)Beach SlopeDune Crest Elev. (m)
mean5.10.1019.7
std1.20.0452.2
min0.40.0274.3
25%4.50.0768.1
50%5.20.0949.5
75%5.80.11611.1
max10.00.54015.7
Disclaimer/Publisher’s Note: The statements, opinions and data contained in all publications are solely those of the individual author(s) and contributor(s) and not of MDPI and/or the editor(s). MDPI and/or the editor(s) disclaim responsibility for any injury to people or property resulting from any ideas, methods, instructions or products referred to in the content.