Article

Grey Situation Decision Method Based on Improved Whitening Function to Identify Water Inrush Sources in the Whole Cycle of Coal Mining

Coal Industry Engineering Research Center for Exploration and Early Warning of Mine Water Disaster, School of Earth and Environment, Anhui University of Science and Technology, Huainan 232001, China
*
Author to whom correspondence should be addressed.
Water 2025, 17(10), 1479; https://doi.org/10.3390/w17101479
Submission received: 11 April 2025 / Revised: 28 April 2025 / Accepted: 13 May 2025 / Published: 14 May 2025
(This article belongs to the Special Issue Engineering Hydrogeology Research Related to Mining Activities)

Abstract

:
This study proposes a comprehensive model for identifying mine water inrush sources in coal mines throughout the full mining cycle, utilizing an improved whitening function and the CRITIC-weighted grey situational decision method. Traditional water source identification methods often fail to account for the dynamic changes in water sources during the mining process, which can be influenced by geological and hydrological conditions. The model integrates an exponential whitening function with the CRITIC weighting approach to address the high variability and correlations between variables. Through the analysis of 244 groundwater samples from the Sunan mining area, the model demonstrated significant improvements in accuracy across different mining stages. The results showed overall classification accuracies exceeding 85%, indicating the model’s effectiveness in providing real-time early warnings for water hazards. This model not only optimizes traditional methods but also offers a robust tool for dynamic water source identification, thereby supporting safer and more efficient coal mining operations.

1. Introduction

The identification of mine water inrush sources during coal mining operations has always been a core issue in the research of coal mine water hazard prevention. Coal mine water hazards not only threaten the safe production of mines but also potentially cause enormous economic losses and casualties [1,2,3]. Therefore, accurately identifying water sources during the mining process and providing timely early warning of water inrush risks has become a pressing problem in the field of coal mine water hazard prevention. As the depth of coal mining continues to increase, water source conditions are becoming increasingly complex, especially under certain special geological and hydrological conditions, where traditional water source identification methods often fail to address the dynamic changes in water sources throughout the entire coal mining process [4,5,6]. To address this challenge, researching methods for identifying water sources throughout the full mining cycle can provide more scientific water source identification techniques, offering comprehensive and reliable protection for the safe production of mines.
Currently, most research on coal mine water source identification focuses on local area or specific time period water source monitoring and early warning, often neglecting the dynamic changes during the mining process [7,8,9]. However, coal mining is a complex and continuously changing process, and the dynamic changes in water sources exhibit significant time dependence. Traditional methods largely rely on static data analysis and fail to fully consider the variations in water sources at different mining stages and under different geological conditions. As mining progresses, water source conditions change, so the accuracy of relying solely on traditional methods for water source identification is low, making it difficult to address the increasingly complex task of coal mine water hazard prevention [10,11,12,13]. In recent years, with the development of data processing technologies and computational models, dynamic monitoring and full-cycle water source identification have gradually become research trends in coal mine water hazard prevention. Therefore, this study proposes a method for identifying water sources throughout the full cycle of coal mining operations, combined with an improved whitening function technique, aiming to improve the accuracy and real-time capabilities of water source identification.
The innovation of this paper lies in the fact that it introduces a method for identifying water sources throughout the full cycle of coal mining and adopts an improved whitening function method to process water source data. During the entire coal mining process, the changes in water sources are influenced by various factors, including mining methods, geological structures, and hydrological conditions, leading to significant differences in the sources, flow paths, and variation patterns of water sources at different stages [14,15,16]. To improve the accuracy of water source identification, this study has made important improvements to the traditional whitening function method, particularly in terms of data preprocessing and noise suppression, significantly enhancing the data fitting degree and the precision of water source identification [17,18]. The improved whitening function method can effectively eliminate interference from complex hydrological data and extract the most representative water source features, thus enabling dynamic tracking and accurate identification of water source changes throughout the entire mining cycle. In addition, this study also introduces multivariable data fusion technology, integrating hydrological data from different time periods and geological conditions, further improving the robustness and reliability of water source identification. By establishing a full-cycle water source identification model, this method can comprehensively monitor the water source change trends during coal mining operations, providing scientific and timely water hazard early warning and prevention decision support for coal mines.
In conclusion, the method for identifying mine water inrush sources throughout the full cycle of coal mining proposed in this paper not only innovates the approach but also optimizes traditional water source identification methods, offering significant theoretical and practical value. By dynamically identifying water source changes throughout the mining cycle, this method can provide more accurate and real-time early warning for coal mine water hazard prevention, reducing the occurrence of water inrush incidents and ensuring the safe production of coal mines. With the continuous advancement of coal mining technologies and data analysis methods, the full-cycle water source identification method proposed in this paper will provide new insights for future coal mine water hazard prevention research and drive the progress of mine safety management and water hazard prediction technologies.

2. Materials and Methods

2.1. Study Area

The Sunan mining area is located in the northern part of Anhui Province, in the southern region of the Huang-Huai Plain (Figure 1). The main river in the area is the Huai River, a tributary of the Huai River. The elevation is approximately 23–24 m, with an annual average precipitation ranging from 750 to 900 mm, and an annual average temperature between 14 and 15 °C. In summer, southeastern winds prevail, while northwestern winds are dominant in winter. The study area has five actively operating mines: Zouzhuang Mine, Qianyingzi Mine (QYZ), Qinan Mine (QN), Qidong Mine (QD), and Taoyuan Mine (TY), with a total annual coal production of 10.24 million tons. The main sources of mine water inrush in the mining area are the Quaternary loose aquifer, the Permian roof sandstone fracture aquifer (PFA), and the Carboniferous limestone aquifer (CLA). The thickness of QLA is generally around 10 m, consisting of sand gravel, gravel, and clay gravel. The thickness of PFA is 20–40 m, composed of sandstone. The CLA has a thickness of 47–135 m and is composed of limestone.

2.2. Methods

2.2.1. Sampling and Testing

In this study, a total of 244 groundwater samples were collected from the Sunan mining area, including 84 samples from the QLA, 73 samples from the PFA, and 87 samples from the CLA. The sampling period was from 2010 to 2022, and the locations of the sampling points are shown in Figure 1. According to the geological and hydrological records of the mines, the Qidong Mine was constructed from 1994 to 2001 and began production in 2002; the Qinan Mine started construction in 1992 and officially commenced production in 2002; the Taoyuan Mine began construction in 1995 and started production in 1996; the Zouzhuang Mine started construction in 2009 and began production in 2014; and the Qianyingzi Mine was constructed between 2006 and 2009, with production starting in 2010. Based on the chronological order and the construction timeline and mining progress of each mine, the study period can be roughly divided into three stages: the early mining stage (before 2011), the mid-mining stage (2012–2016), and the late mining stage (2017–2021). All groundwater samples were collected in strict accordance with the relevant requirements of the “Technical Specifications for Groundwater Environmental Monitoring” issued by the National Environmental Protection Agency.
Surface sampling was mainly carried out by using a bailer pipe to collect water from observation wells, while underground samples were collected from water drainage in tunnels and water discharge holes. Each sampling point’s coordinates were recorded using a Global Positioning System (GPS). The 500 mL bottles used for sampling were thoroughly cleaned at least three times with ultrapure water and then sealed with caps that had been rinsed with pure water.
The collected groundwater samples were primarily used to analyze anions (HCO3, Cl, SO42−) and cations (Na+ + K+, Ca2+, Mg2+). The samples used for major cation analysis were acidified with nitric acid to a pH < 2. Conventional water chemistry indicators were tested within two weeks of sample collection. Ion chromatography was used to determine the major anions, with a detection limit of 0.1 mg/L and an analytical precision of better than 3.0%. Cations and trace elements were analyzed using inductively coupled plasma mass spectrometry (ICP-MS), with detection limits of 0.1 mg/L for cations and 0.01 μg/L for trace elements, and an accuracy of better than 0.5%. The ion balance method was applied to verify the accuracy of the anion and cation test results. Samples with an absolute ion balance error greater than 5% were retested until they met the standard.

2.2.2. A Water Source Discrimination Model Integrating Exponential Whitening Function and Weighted Grey Situational Decision Method

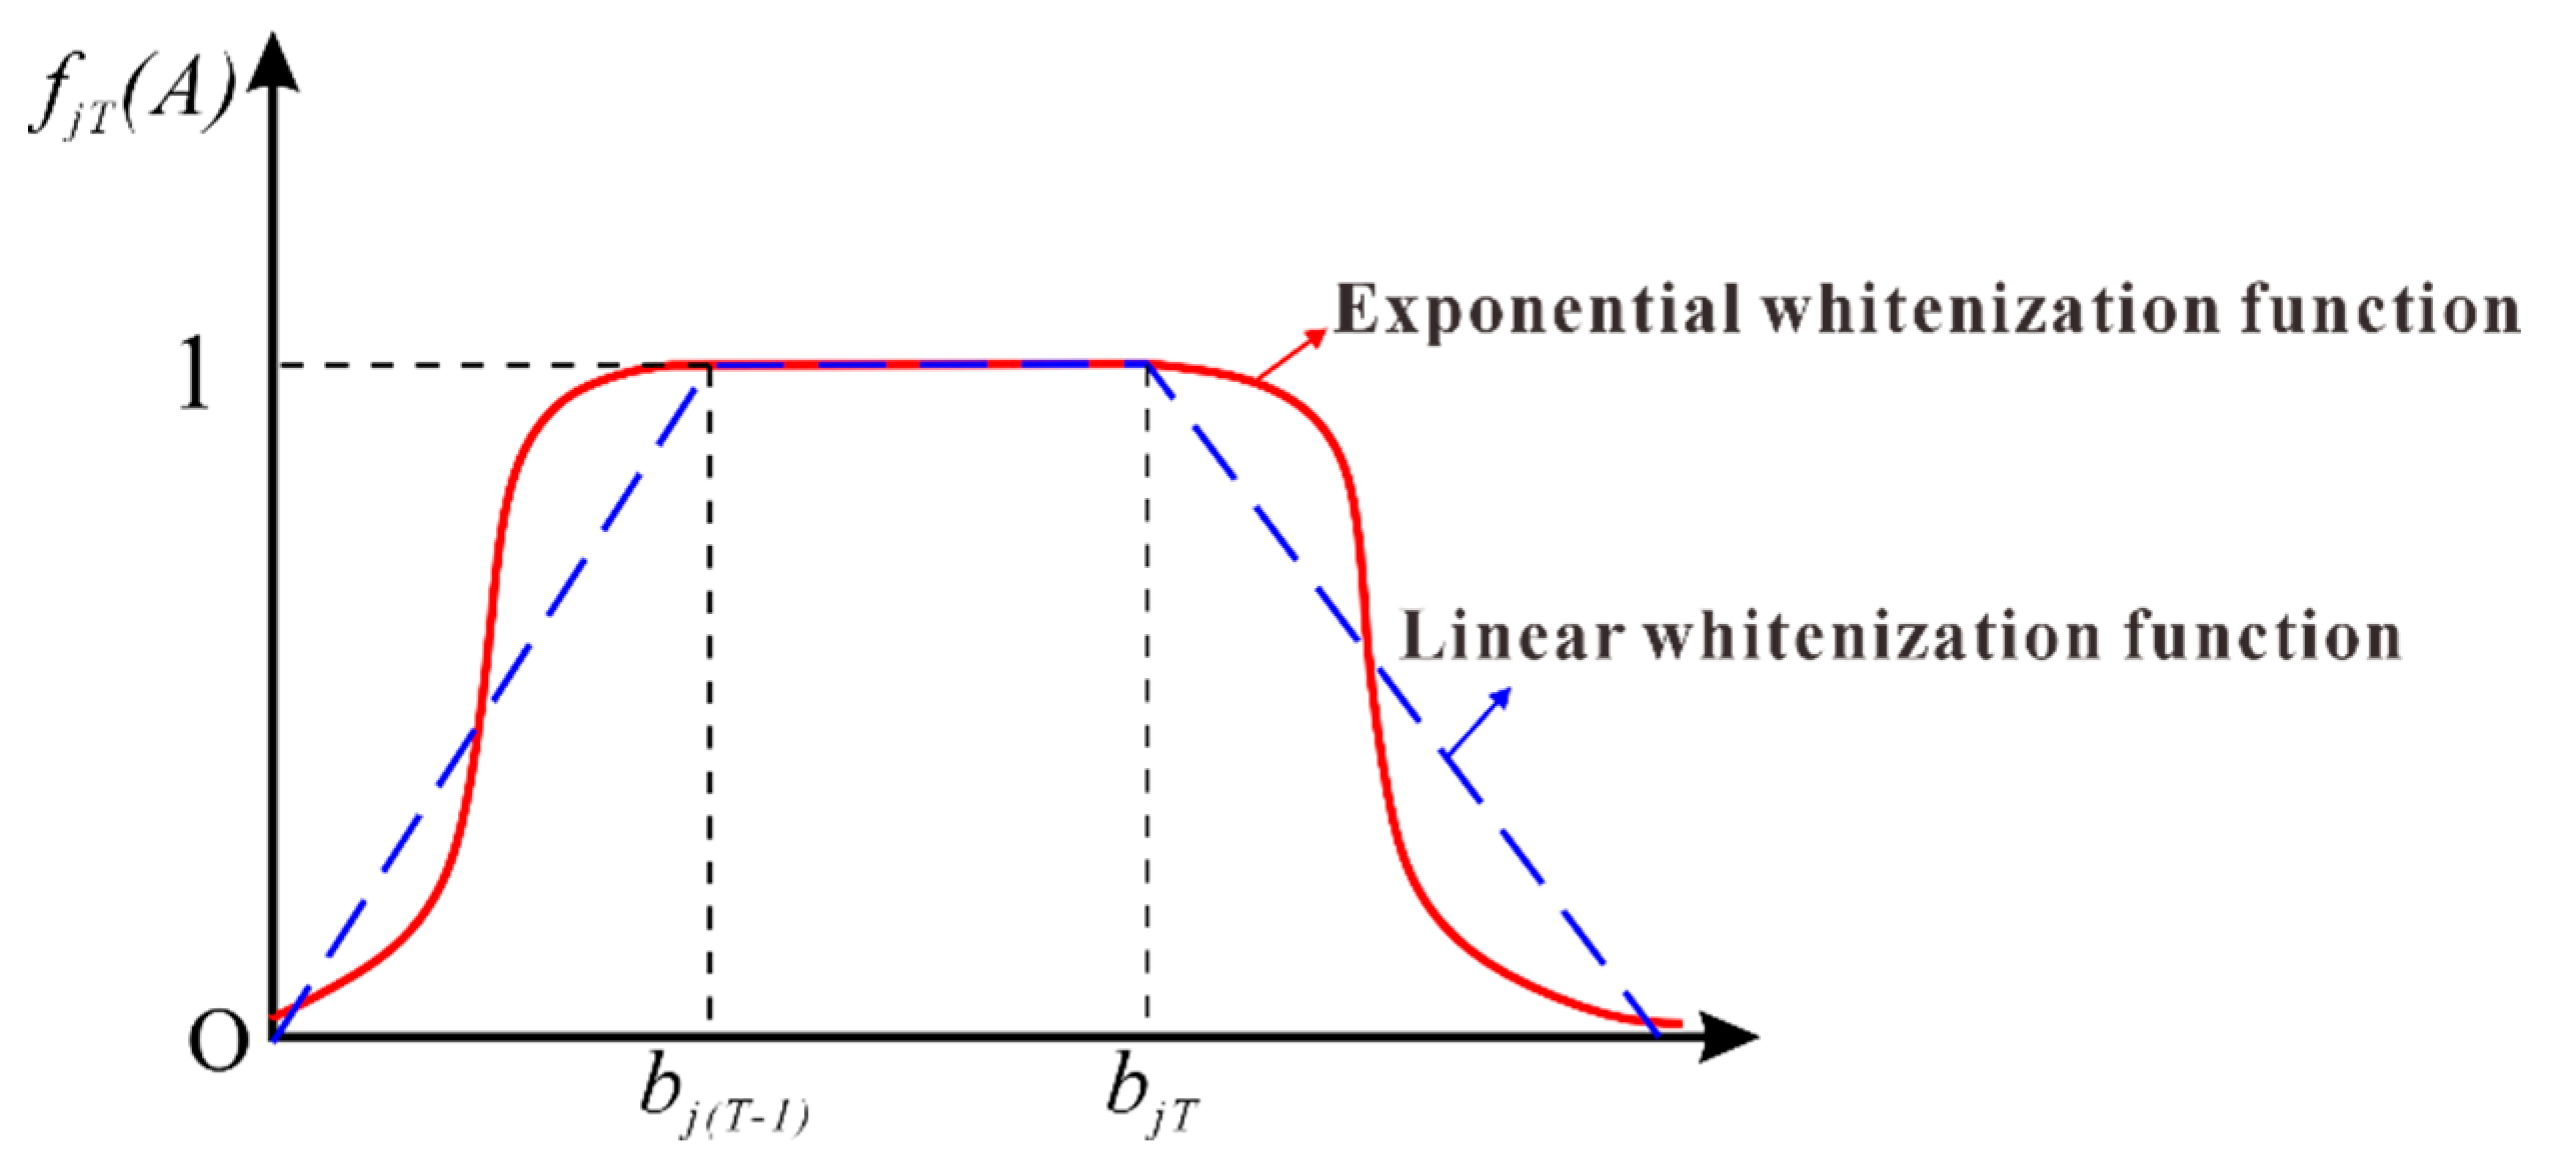
An exponential whitening function is a mathematical tool used in grey system theory to transform grey relational data (partially known or uncertain information) into explicit values. It employs an exponential function to adjust the membership degree or weight distribution of variables, enhancing the distinction between data categories or patterns. The traditional linear whitening function calculates the membership values of adjacent levels as 0, resulting in the loss of valuable information. In contrast, the exponential whitening function reduces information loss (as shown in Figure 2). Furthermore, the grey situation decision model combines multiple factors to identify water source types, avoiding the limitations of single-factor models that fail to fully capture water quality characteristics. It also assigns weights to multi-factor variables rather than treating them equally, thereby improving accuracy. During the mining process, complex water-rock interactions and geochemical reactions occur in groundwater, leading to strong correlations among various chemical variables and significant data fluctuations. The use of critic weighting helps address these issues. As a result, a water source discrimination model was developed, integrating the exponential whitening function with CRITIC-weighted grey situation decision-making.

2.2.3. Establishing the Exponential Whitening Function

The exponential whitening function is shown in Figure 2. Equations (1)–(3) outline the steps for constructing the whitening function [19].
For T = 1, the membership function of the “half-step trapezoidal curve” is given by
f j 1 A = 1 0 A b j 1 e α ( A b j 1 ) 2 β j 2 b j 1 < A
For 2 ≤ T < p, the membership function of the “curved trapezoid” is given by
f j T A = e α ( A b j ( T 1 ) ) 2 β j 2 0 A b j ( T 1 ) 1 b j ( T 1 ) < A b j T e α ( A b j 1 ) 2 β j 2 b j T < A
For T = p, the membership function of the “ascending half-step trapezoidal curve” is as follows:
f j p A = e α ( A b j ( T 1 ) ) 2 β j 2 0 A b j ( T 1 ) 1 b j ( T 1 ) < A
In the equation, f j T represents the exponential membership whitening function of the j-th ion in the t-th target (aquifer type); p is the total number of targets (number of aquifers). b j T denotes the upper limit of the concentration of the j-th ion variable in aquifer T, while b j 0 represents the lower limit of the j-th ion variable concentration, which is 0. β j is the reference standard for the j-th ion variable, serving as the average of the standard classification values for each type of the j-th ion variable. The calculation of β j is shown in Equation (4).
β j = 1 p T = 1 p b j p
The exponential whitening function used in the model relies on α to adjust the curve shape, which could potentially affect the membership values and, consequently, the water source discrimination accuracy. No sensitivity analysis on α was reported in the current study. The exponential coefficient α is defined by Equation (5):
α = ( int p + 1 2 ) 2
The whitening membership values u i j ( T ) for different targets are calculated using the whitening function, as shown in Equation (6).
u i j T = u 11 1 u 1 m ( p ) u n 1 1 u n 1 ( p )

2.2.4. Calculation of CRITIC Weights

The CRITIC weighting method is an objective weighting method. The idea behind it is to use two indicators: contrast intensity and conflict indicators [20]. Contrast intensity is represented by the standard deviation, where a larger standard deviation indicates greater fluctuation, and therefore, a higher weight [21]. Conflict is represented by the correlation coefficient, where a higher correlation coefficient between indicators means lower conflict, and thus, a lower weight. During the weight calculation, the contrast intensity and conflict indicators are multiplied and normalized to obtain the final weight [22,23]. The CRITIC method, by considering both contrast intensity (standard deviation) and conflict (correlation coefficient), inherently mitigates the impact of multicollinearity by assigning lower weights to highly correlated variables. The basic steps are as follows:
Maximization method:
N i = x i min ( x i ) max ( x i ) min ( x i )
Minimization method:
N i = max ( x i ) x i max ( x i ) min ( x i )
The correlation coefficient is as follows [19]:
ρ X Y = i = 1 N ( X i X ¯ ) ( Y i Y ¯ ) i = 1 N ( X i X ¯ ) 2 i = 1 N ( Y i Y ¯ ) 2
The standard deviation of the variables is as follows:
σ = 1 n i = 1 n ( X i X ¯ ) 2
E j = σ j i = 1 n ( 1 ρ i j )
The objective weight w j for the j-th variable is as follows:
w j = E j j = 1 m E j
where N i is the normalized quantified value of the iii-th primary control factor attribute data; x i is the quantified value of the i-th primary control factor attribute data before normalization; min ( x i ) is the minimum value of the i-th primary control factor attribute data before normalization; max ( x i ) is the maximum value of the i-th primary control factor attribute data before normalization; X i ,   Y i are the values of the i-th evaluation point of the X and Y evaluation indicators, respectively; X ¯ , Y ¯ are the average values of the X and Y evaluation indicators, respectively; N is the number of evaluation points for the indicators; i = 1 n ( 1 ρ i j ) is the quantification of the conflict between the j-th indicator and the other n primary control factors; m is the number of evaluation indicators.

2.3. Establishment of Comprehensive Discrimination Model

Based on Formulas (6) and (12), the comprehensive membership degree matrix r i T is determined as shown in Formula (13):
r i T = j = 1 m w j · u i j ( T )
As shown in Formula (14), based on the principle of maximum membership degree, the water source category with the maximum membership degree for each water sample is identified, i.e., the mine water inrush source.
r i T = m a x i   r i T

3. Results and Discussion

During the mining process, groundwater composition undergoes significant changes due to both natural and anthropogenic factors. The chemical composition of water sources exhibits considerable differences and fluctuations across different time periods. Therefore, it is essential to establish a water source identification model for different periods, which is of great significance for tracing the geochemical evolutionary characteristics of groundwater sources from historical periods for unknown water samples. A water source discrimination model was developed, integrating the exponential whitening function and the weighted grey situational decision method. The construction process of the model is outlined in Equations (1)–(14).
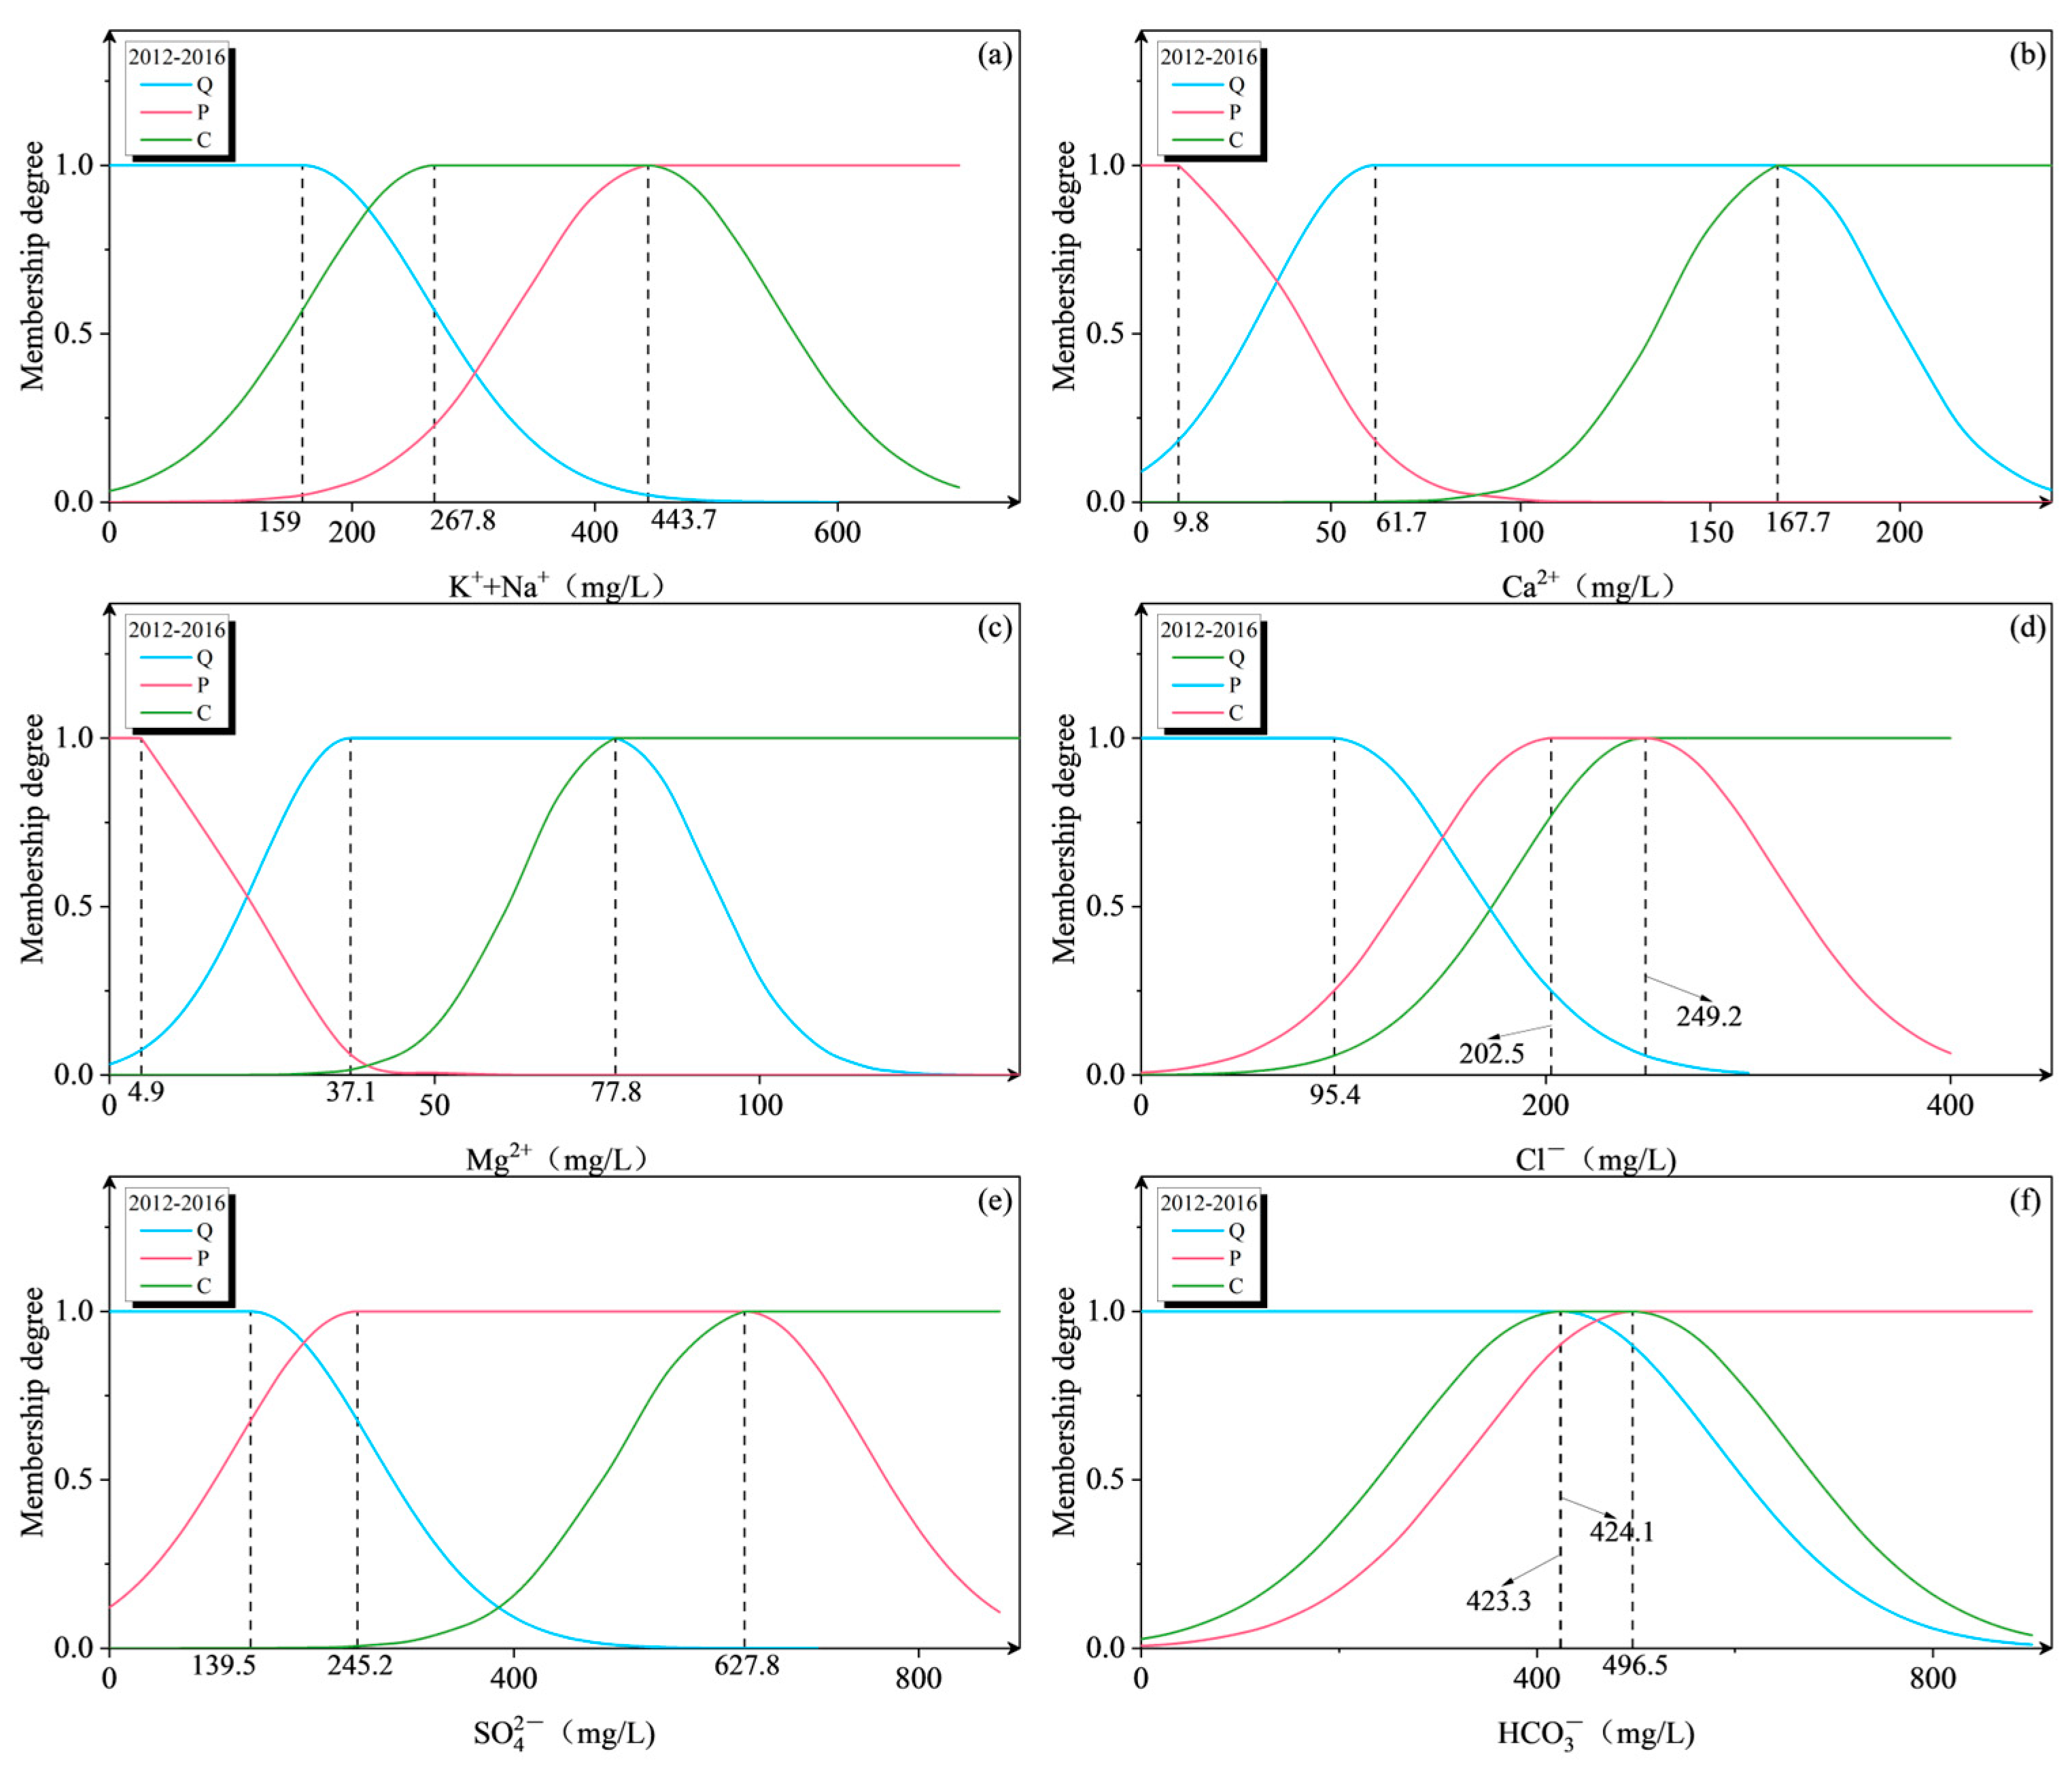
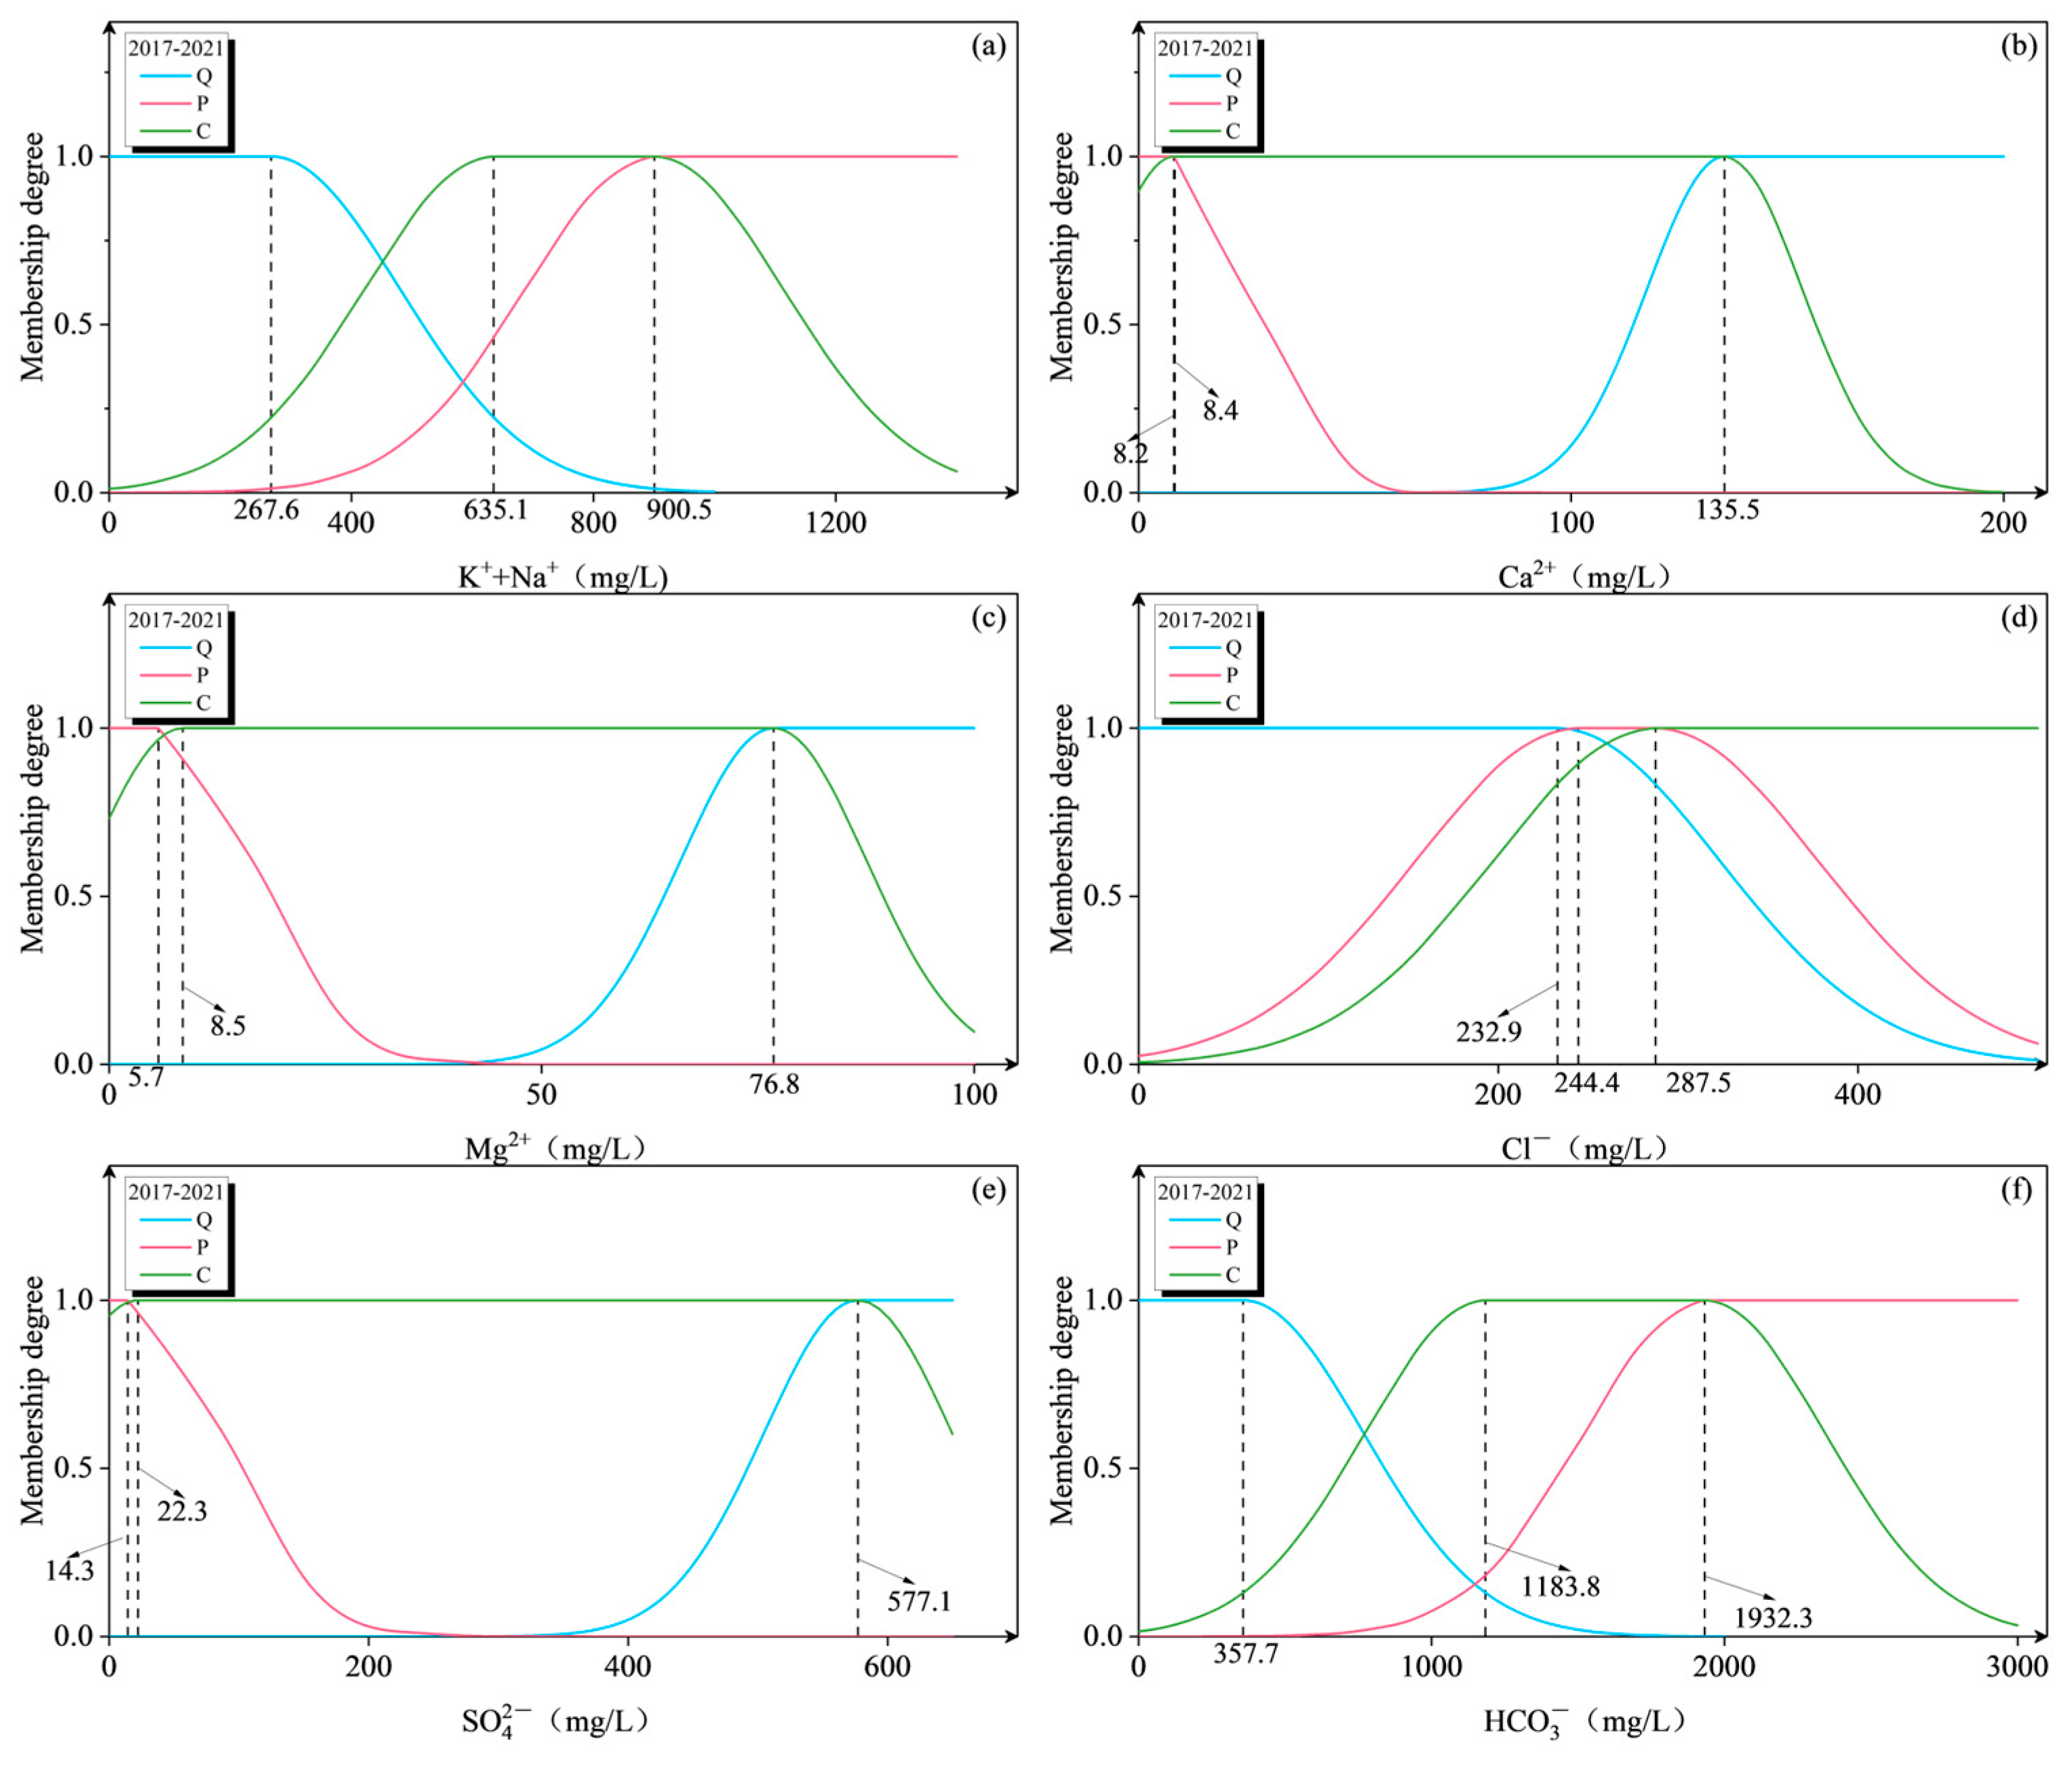
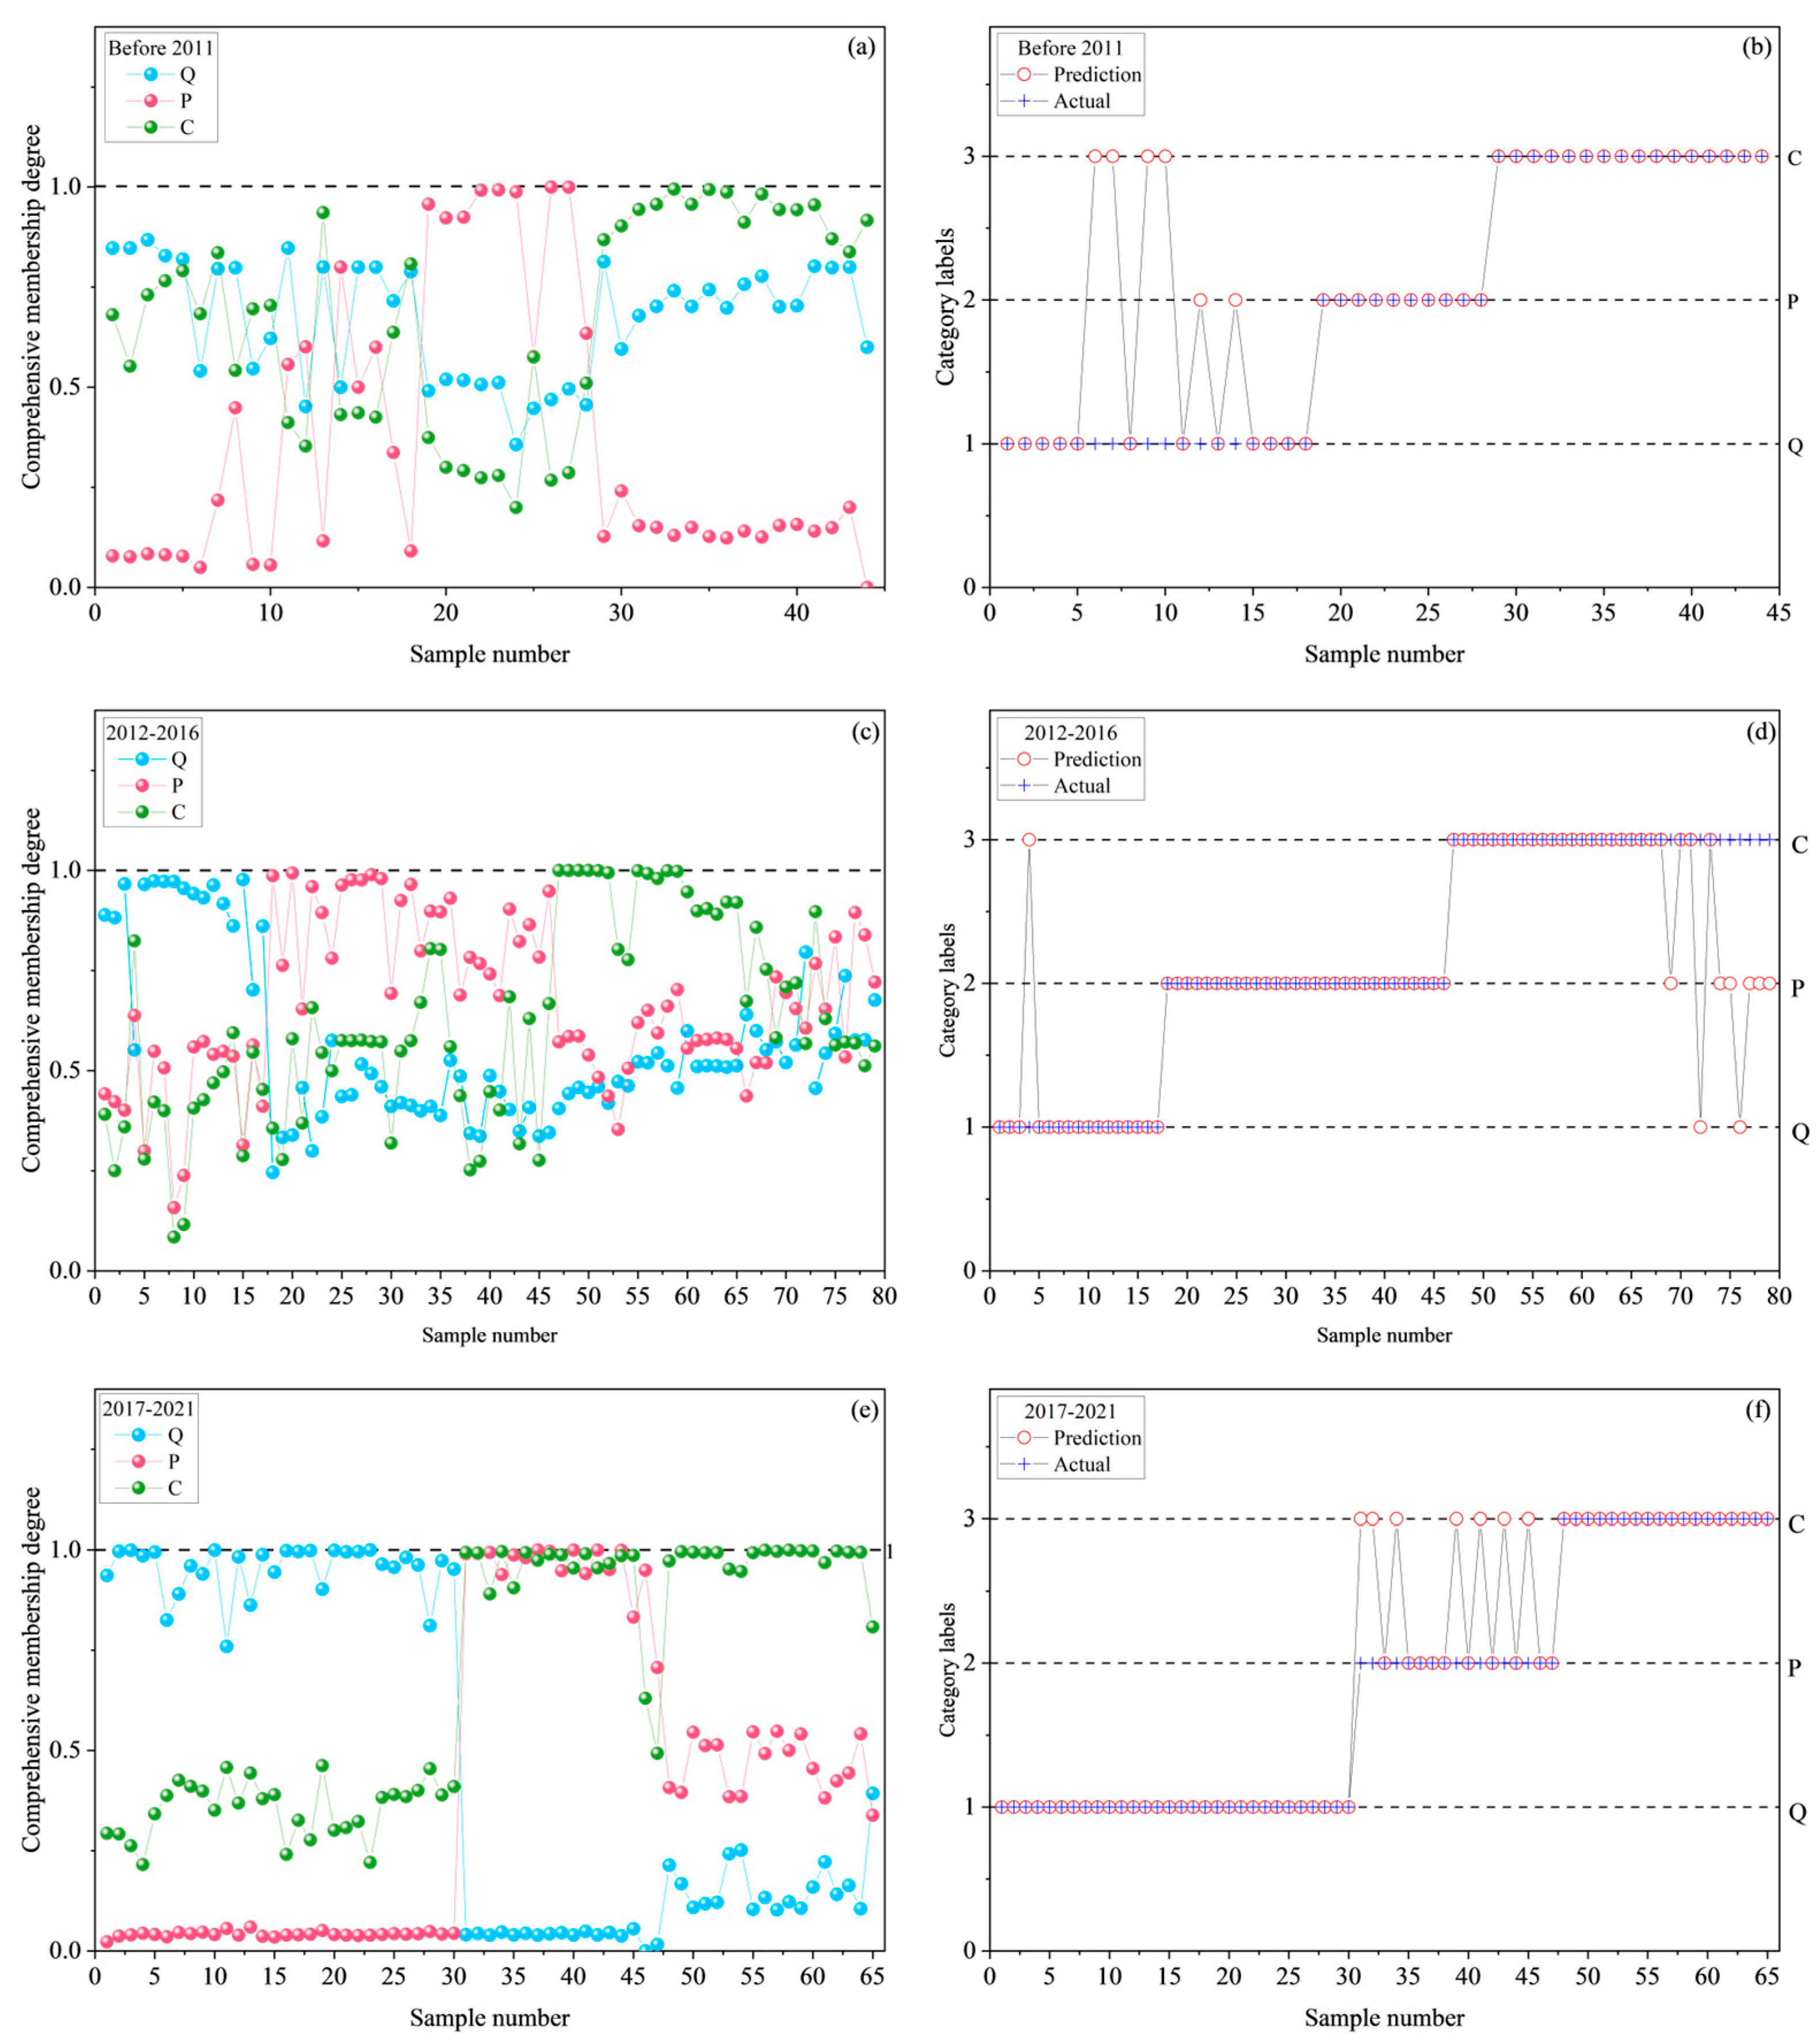
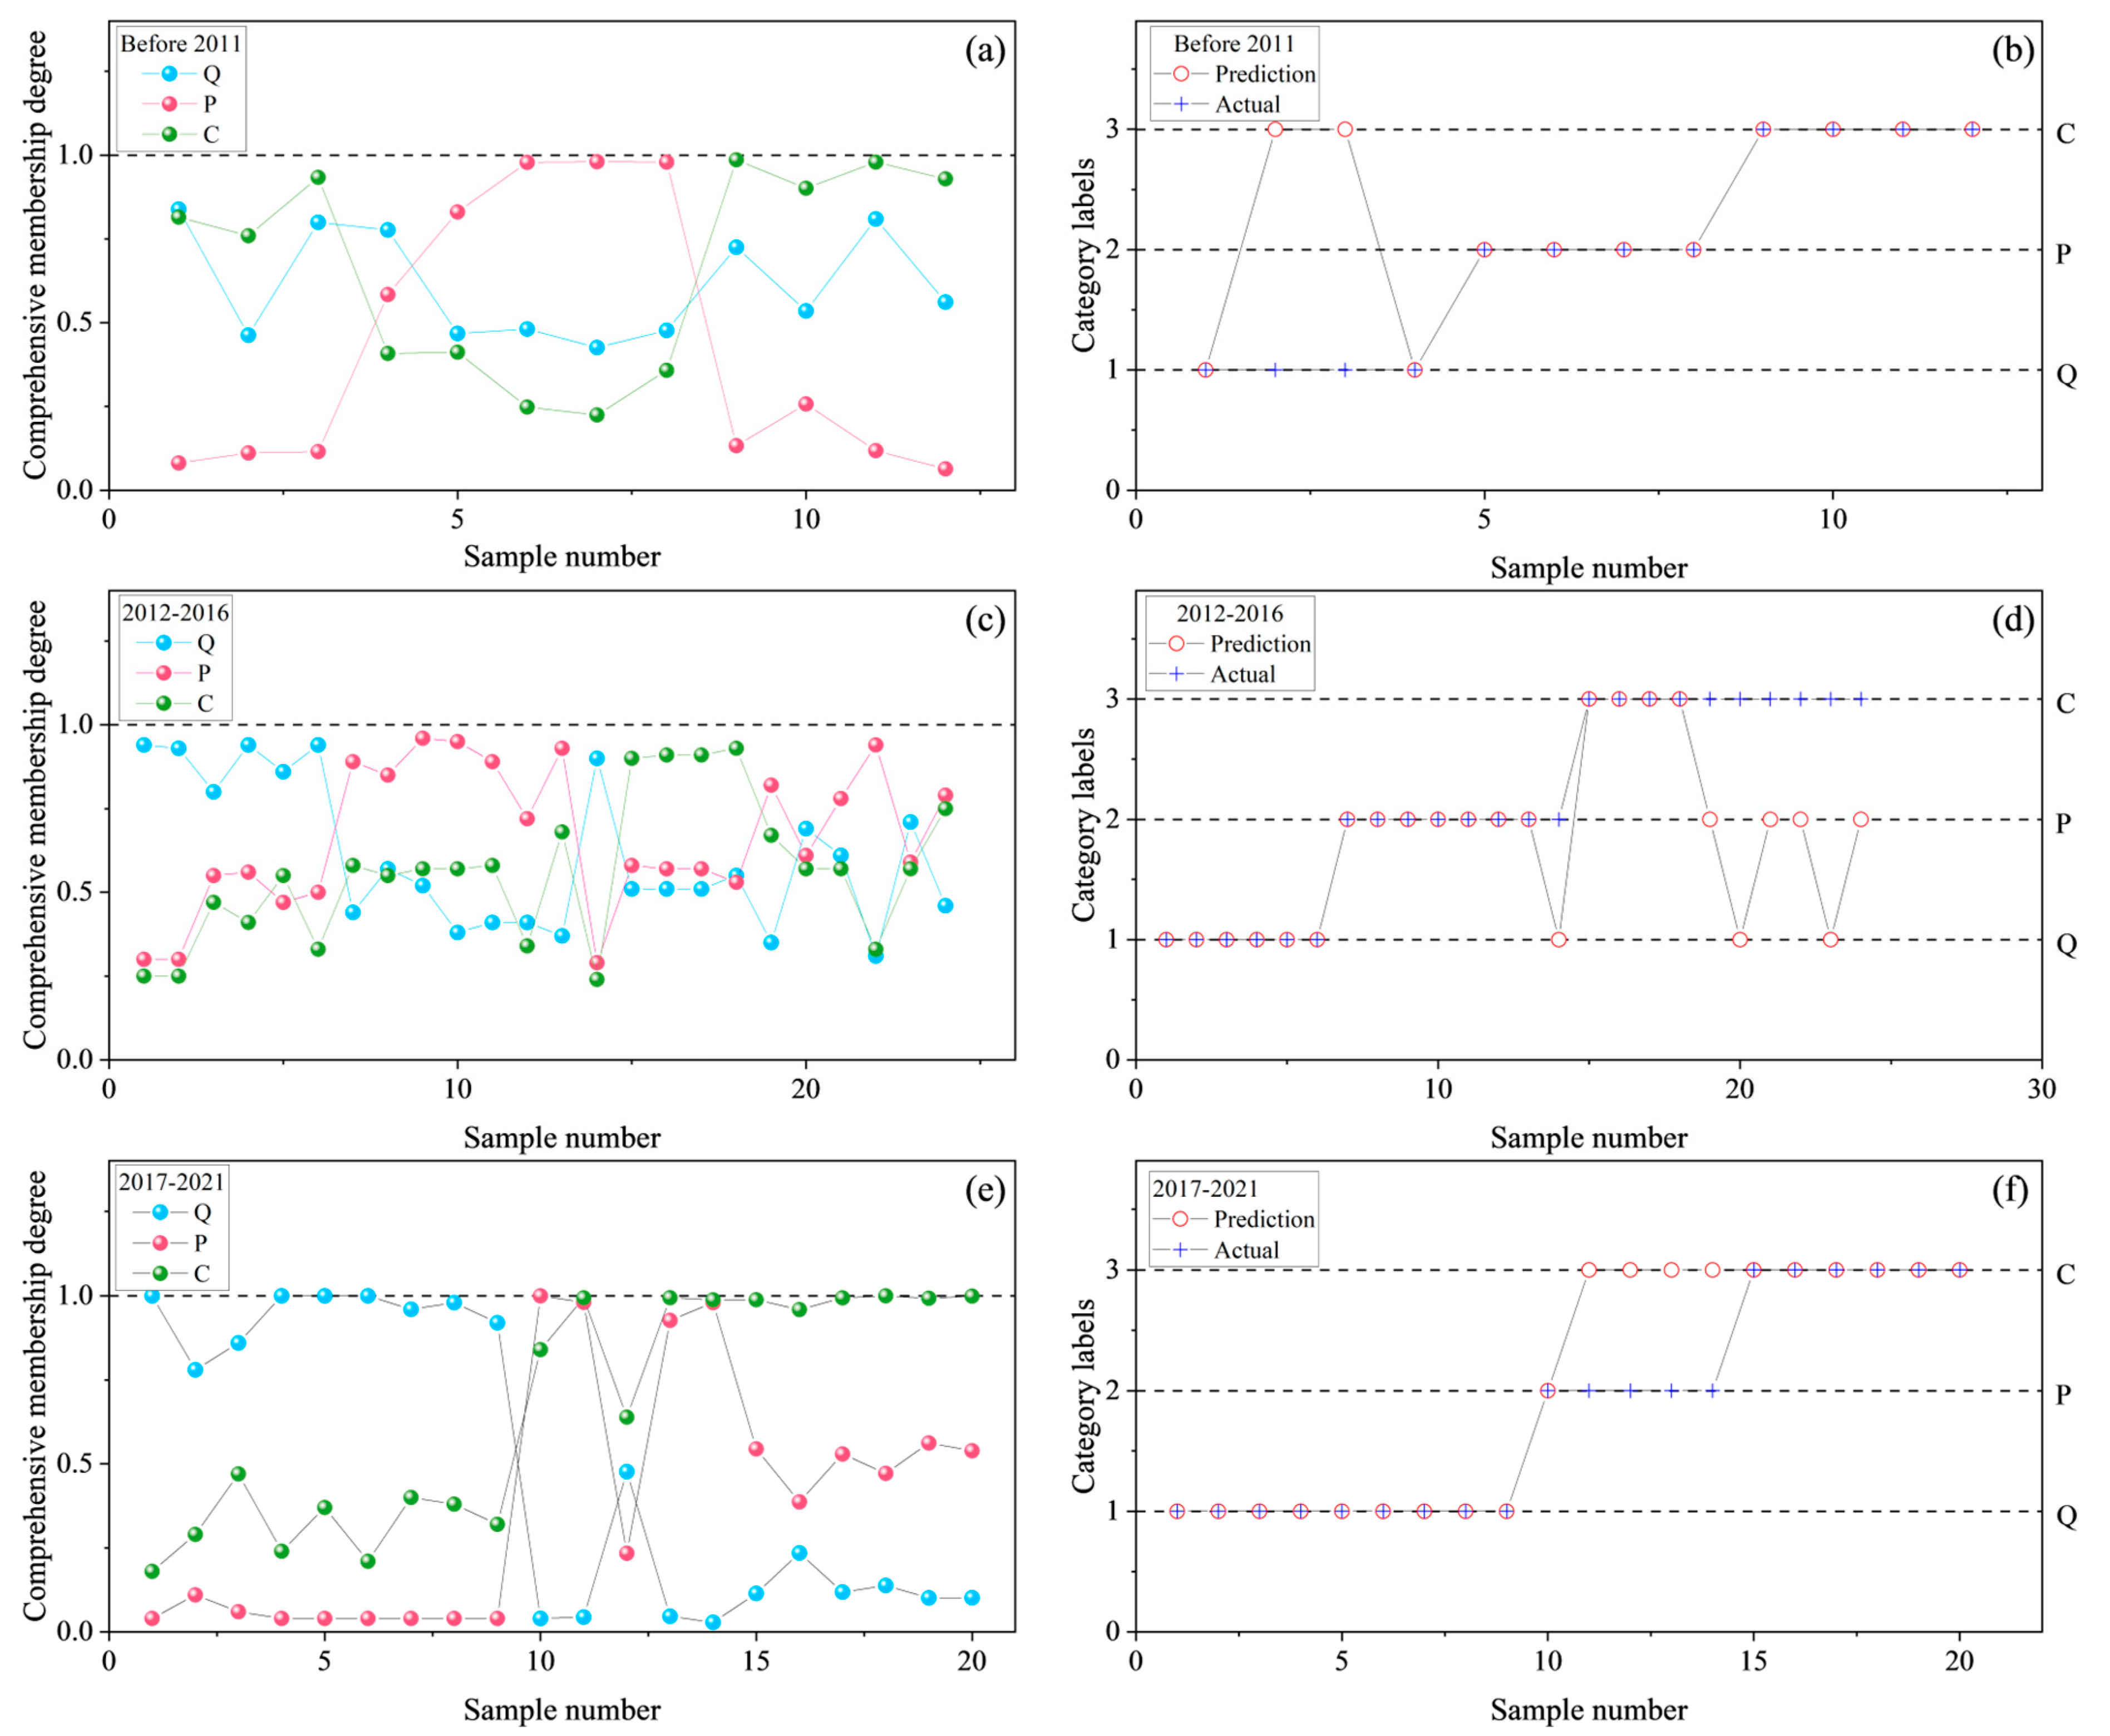
The M-estimation method of Huber was applied to classify the variable levels of the three aquifers [24,25]. Given the volatility of the data and the strong correlations between indicators [26], the critic weight method was chosen, significantly improving the accuracy of the discrimination. Therefore, the critic weights for each stage were calculated, as shown in Table 1. The CRITIC method is chosen for its ability to handle the high variability and correlations between variables, which are prevalent in hydrochemical data. This suggests that CRITIC may offer advantages over methods that do not account for both contrast and conflict in weight assignment. Based on the exponential whitening function equations (Equations (1)–(3)), an exponential whitening function model was established, and the function curves are shown in Figure 3, Figure 4 and Figure 5. The vertical axis represents the membership degree (whitening function value), and the horizontal axis represents the variable concentration values. The variable concentration values of all samples were substituted into the corresponding whitening function equations, yielding the membership degrees of each ion variable to the respective water sources. A sample is classified into a particular water source if its whitening function value is higher for that source. Finally, the comprehensive membership degree was calculated by applying weights according to Equation (13), as shown in Figure 6a,c,e.
Based on the maximum membership degree principle (Equation (14)), the water source categories for all water samples in different periods were determined, as shown in Figure 6b,d,f. The labels Q, P, and C in the schematic diagram denote three distinct groundwater systems: the Quaternary unconfined aquifer (Q), the Permian sandstone confined aquifer (P), and the Carboniferous limestone karst aquifer (C). The back-calculation discrimination accuracy for each period was also calculated. Before 2011, the discrimination accuracy for Quaternary loose aquifer water samples was 66.7%, while the accuracy for Permian sandstone water and Carboniferous limestone water was both 100%, with an overall accuracy of 86.4%. From 2012 to 2016, the discrimination accuracy for Quaternary loose aquifer water samples was 94.1%, 100% for Permian sandstone water, and 75.8% for Carboniferous limestone water, yielding an overall accuracy of 88.6%. From 2017 to 2021, the discrimination accuracy for both Quaternary loose aquifer and Carboniferous limestone water was 100%, while the accuracy for Permian sandstone water was 58.8%, with an overall accuracy of 89.2%. The paper does not discuss uncertainty ranges for predicted classifications or the probabilistic interpretation of membership degrees. However, the use of the exponential whitening function and CRITIC weighting method provides a numerical basis for membership degree calculation, which could potentially be extended to probabilistic interpretations with further development.
It can be observed that before 2011, the discrimination rate for loose water was relatively low, during 2012–2016, the discrimination rate for limestone water was relatively low, and from 2017 to 2021, the discrimination rate for sandstone water was relatively low. The mixed effects between aquifers, caused by fractures or faults induced by mining, led to lower discrimination rates. In addition, geological factors such as fault zone or fracture density may play an important role in influencing the flow path, resulting in the misclassification rate. The relatively small number of predictive samples used in each stage, which could introduce variability in the accuracy estimates. Variations in water source conditions and data characteristics between the training and predictive samples, even within the same mining stage. The inherent complexity of water source discrimination, especially in dynamic mining environments. However, the overall discrimination accuracy of the model was above 85%, indicating good performance.
To enhance the practicality of the model, we selected predictive water samples from each stage: 12 samples before 2011, 20 samples from 2012 to 2016, and 24 samples from 2017 to 2021. Using the model trained on the training set, unknown water samples were discriminated, as shown in Figure 7. The overall accuracy for the three stages was 83.3%, 70.8%, and 80.0%, respectively. Due to the relatively small number of predictive samples, the discrimination accuracy of the model for the samples was lower. Therefore, this model is based on a certain number of water samples, and additional water samples are required to improve the model’s accuracy. We do not mention the use of cross-validation or bootstrapping for model validation. Instead, it relies on back-substitution and a relatively small prediction set. Cross-validation or bootstrapping would likely provide a more robust estimate of the model’s predictive performance by ensuring that the validation process is independent of the training data.
Considering the statistical advantages of the exponential whitening function and the grey situational decision method, as well as the characteristics of water source identification, the exponential whitening function was selected primarily because, compared to the linear whitening function, the exponential whitening function emphasizes that the whitening function values for adjacent levels are not zero, thus preventing an increase in the weight of adjacent levels and avoiding the loss of valid information. This, in turn, enhances the identification rate. Moreover, the grey situational decision method overcomes the issue of equal treatment of multi-factor variables in traditional models. Therefore, based on this approach, a water source discrimination model was developed for the mining process, providing a reference for dynamic water source identification and a basis for tracing the geochemical evolution mechanisms of historical groundwater sources.

4. Conclusions

A water source discrimination model based on the exponential whitening function and CRITIC-weighted grey situational decision method was used to identify water sources during the mining process. In the early mining stage, the discrimination accuracy for Quaternary loose aquifer water samples was 66.7%, while the accuracy for Permian sandstone water and Carboniferous limestone water was 100%, yielding an overall accuracy of 86.4%. In the middle mining stage, the discrimination accuracy for Quaternary loose aquifer water was 94.1%, 100% for Permian sandstone water, and 75.8% for Carboniferous limestone water, with an overall accuracy of 88.6%. In the late mining stage, the discrimination accuracy for both Quaternary loose aquifer and Carboniferous limestone water was 100%, while the accuracy for Permian sandstone water was 58.8%, resulting in an overall accuracy of 89.2%. Furthermore, the model was used to classify unknown water samples, with overall discrimination rates for the early, middle, and late stages being 83.3%, 70.8%, and 80.0%, respectively. The model effectively addressed the issues of single-factor evaluation, large data fluctuations, and strong correlations between variables during the mining process, providing a comprehensive reflection of water quality information. In addition, the isotope end element model analysis may distinguish the mixing effect of aquifers, which will be the next step we need to study.

Author Contributions

Q.J.: Conceptualization, Methodology, Software, Writing—Original Draft. Y.H.: Data Curation, Writing—Review and Editing, Validation. Q.L.: Visualization, Investigation, Supervision. All authors have read and agreed to the published version of the manuscript.

Funding

The work was funded by Open Fund of Coal Industry Engineering Research Center for Exploration and Early Warning of Mine Water Disaster (2023-CIERC-01) and Scientific Research Foundation for High-level Talents of Anhui University of Science and Technology (2023yjrc41).

Data Availability Statement

The original contributions presented in this study are included in the article. Further inquiries can be directed to the corresponding author.

Conflicts of Interest

The authors declare no conflicts of interest.

References

  1. Dong, S.; Wang, H.; Guo, X.; Zhou, Z. Characteristics of Water Hazards in China’s Coal Mines: A Review. Mine Water Environ. 2021, 40, 325–333. [Google Scholar] [CrossRef]
  2. Suh, J.; Kim, S.-M.; Yi, H.; Choi, Y. An Overview of GIS-Based Modeling and Assessment of Mining-Induced Hazards: Soil, Water, and Forest. Int. J. Environ. Res. Public Health 2017, 14, 1463. [Google Scholar] [CrossRef]
  3. Wang, D.; Sui, W.; Ranville, J.F. Hazard identification and risk assessment of groundwater inrush from a coal mine: A review. Bull. Eng. Geol. Environ. 2022, 81, 421. [Google Scholar] [CrossRef]
  4. Kumar, J.; Brill, E.D.; Mahinthakumar, G.; Ranjithan, S.R. Contaminant source characterization in water distribution systems using binary signals. J. Hydroinform. 2012, 14, 585–602. [Google Scholar] [CrossRef]
  5. Liu, S.; Auckenthaler, P. Optimal sensor placement for event detection and source identification in water distribution networks. J. Water Supply Res. Technol. AQUA 2014, 63, 51–57. [Google Scholar] [CrossRef]
  6. Zeng, Y.; Mei, A.; Wu, Q.; Meng, S.; Zhao, D.; Hua, Z. Double verification and quantitative traceability: A solution for mixed mine water sources. J. Hydrol. 2024, 630, 130725. [Google Scholar] [CrossRef]
  7. Hou, Z.; Huang, L.; Zhang, S.; Han, X.; Xu, J.; Li, Y. Identification of groundwater hydrogeochemistry and the hydraulic connections of aquifers in a complex coal mine. J. Hydrol. 2024, 628, 130496. [Google Scholar] [CrossRef]
  8. Cui, M.; Huang, P.; Hu, Y.; Chai, S.; Zhang, Y.; Li, Y. Application of dynamic weight in coal mine water inrush source identification. Environ. Earth Sci. 2024, 83, 69. [Google Scholar] [CrossRef]
  9. Xiao, J.; Wang, L.; Chai, N.; Liu, T.; Jin, Z.; Rinklebe, J. Groundwater hydrochemistry, source identification and pollution assessment in intensive industrial areas, eastern Chinese loess plateau. Environ. Pollut. 2021, 278, 116930. [Google Scholar] [CrossRef]
  10. Motyka, J.; Cien, D.; d’Obyrn, K. The Use of Hydrochemical Zoning to Predict Water Hazards: The Example of the Olkusz-Pomorzany Zn-Pb Mine. Mine Water Environ. 2024, 43, 198–209. [Google Scholar] [CrossRef]
  11. Kim, S.-M.; Suh, J.; Oh, S.; Son, J.; Hyun, C.-U.; Park, H.-D.; Shin, S.-H.; Choi, Y. Assessing and prioritizing environmental hazards associated with abandoned mines in Gangwon-do, South Korea: The Total Mine Hazards Index. Environ. Earth Sci. 2016, 75, 369. [Google Scholar] [CrossRef]
  12. Bukowska, M.; Bukowski, P. Changes of Properties of Carboniferous Rock Mass and the Occurrence of Some Natural Hazards in the Conditions of Flooding of Roadways within Abandoned Coal Mines. J. Min. Sci. 2021, 57, 759–774. [Google Scholar] [CrossRef]
  13. Al Heib, M.; Varouchakis, E.A.; Galetakis, M.; Renaud, V.; Burda, J. A framework for assessing hazards related to pit lakes: Application on European case studies. Environ. Earth Sci. 2023, 82, 365. [Google Scholar] [CrossRef]
  14. Karan, S.K.; Samadder, S.R.; Singh, V. Groundwater vulnerability assessment in degraded coal mining areas using the AHP-Modified DRASTIC model. Land Degrad. Dev. 2018, 29, 2351–2365. [Google Scholar] [CrossRef]
  15. Qiao, W.; Li, W.; Zhang, S.; Niu, Y. Effects of coal mining on the evolution of groundwater hydrogeochemistry. Hydrogeol. J. 2019, 27, 2245–2262. [Google Scholar] [CrossRef]
  16. Zhan, H.; Liu, S.; Wu, Q.; Li, Y.; Qi, K.; Zhang, X. Quantitative prediction of the impact of deep extremely thick coal seam mining on groundwater. Process Saf. Environ. Prot. 2023, 178, 511–527. [Google Scholar] [CrossRef]
  17. Osawa, H.; Hino, M.; Shinohara, N.; Okamoto, Y.; Nakamura, Y.; Muraoka, H. Simplified Neural Network Equalizer With Noise Whitening Function for GPRML System. IEEE Trans. Magn. 2008, 44, 3777–3780. [Google Scholar] [CrossRef]
  18. Zhang, H.; Fan, Y. A Grey Evaluation Method Based on the Center-point Double S-shaped Whitening Weight Function. J. Grey Syst. 2013, 25, 95–104. [Google Scholar]
  19. Wang, D.; Ju, Q.; Wang, Y.; Hu, Y.; Liu, Q.; Chai, H.; Liu, Y. Source identification of mine water inrush based on the exponential whitenization function and the grey situation decision model. Energy Explor. Exploit. 2022, 40, 1217–1235. [Google Scholar] [CrossRef]
  20. Farzanegan, B.; Moghadam, R.; Jagannathan, S.; Natarajan, P. Optimal Adaptive Tracking Control of Partially Uncertain Nonlinear Discrete-Time Systems Using Lifelong Hybrid Learning. IEEE Trans. Neural Netw. Learn. Syst. 2024, 35, 17254–17265. [Google Scholar] [CrossRef]
  21. Haktanir, E.; Kahraman, C. A Novel CRITIC Based Weighted FMEA Method: Application to COVID-19 Blood Testing Process. J. Mult. Valued Log. Soft Comput. 2021, 37, 247–275. [Google Scholar]
  22. Krishnan, A.R.; Kasim, M.M.; Hamid, R.; Ghazali, M.F. A Modified CRITIC Method to Estimate the Objective Weights of Decision Criteria. Symmetry 2021, 13, 973. [Google Scholar] [CrossRef]
  23. Sharkasi, N.; Rezakhah, S. A modified CRITIC with a reference point based on fuzzy logic and hamming distance. Knowl. Based Syst. 2022, 255, 109768. [Google Scholar] [CrossRef]
  24. Chang, L.; Hu, B.; Chang, G.; Li, A. Robust derivative-free Kalman filter based on Huber’s M-estimation methodology. J. Process Control 2013, 23, 1555–1561. [Google Scholar] [CrossRef]
  25. Niyazi Cankaya, M.; Arslan, O. M-Estimation Method Based Asymmetric Objective Function. arXiv 2017, arXiv:1702.00378. [Google Scholar]
  26. Ju, Q.; Hu, Y.; Liu, Q.; Chen, K. Spatial and Temporal Evolutions of Shallow Groundwater with Anthropogenic Activities: A Case Study of Sunan Mine Region, China. Pol. J. Environ. Stud. 2024, 33, 2715–2725. [Google Scholar] [CrossRef]
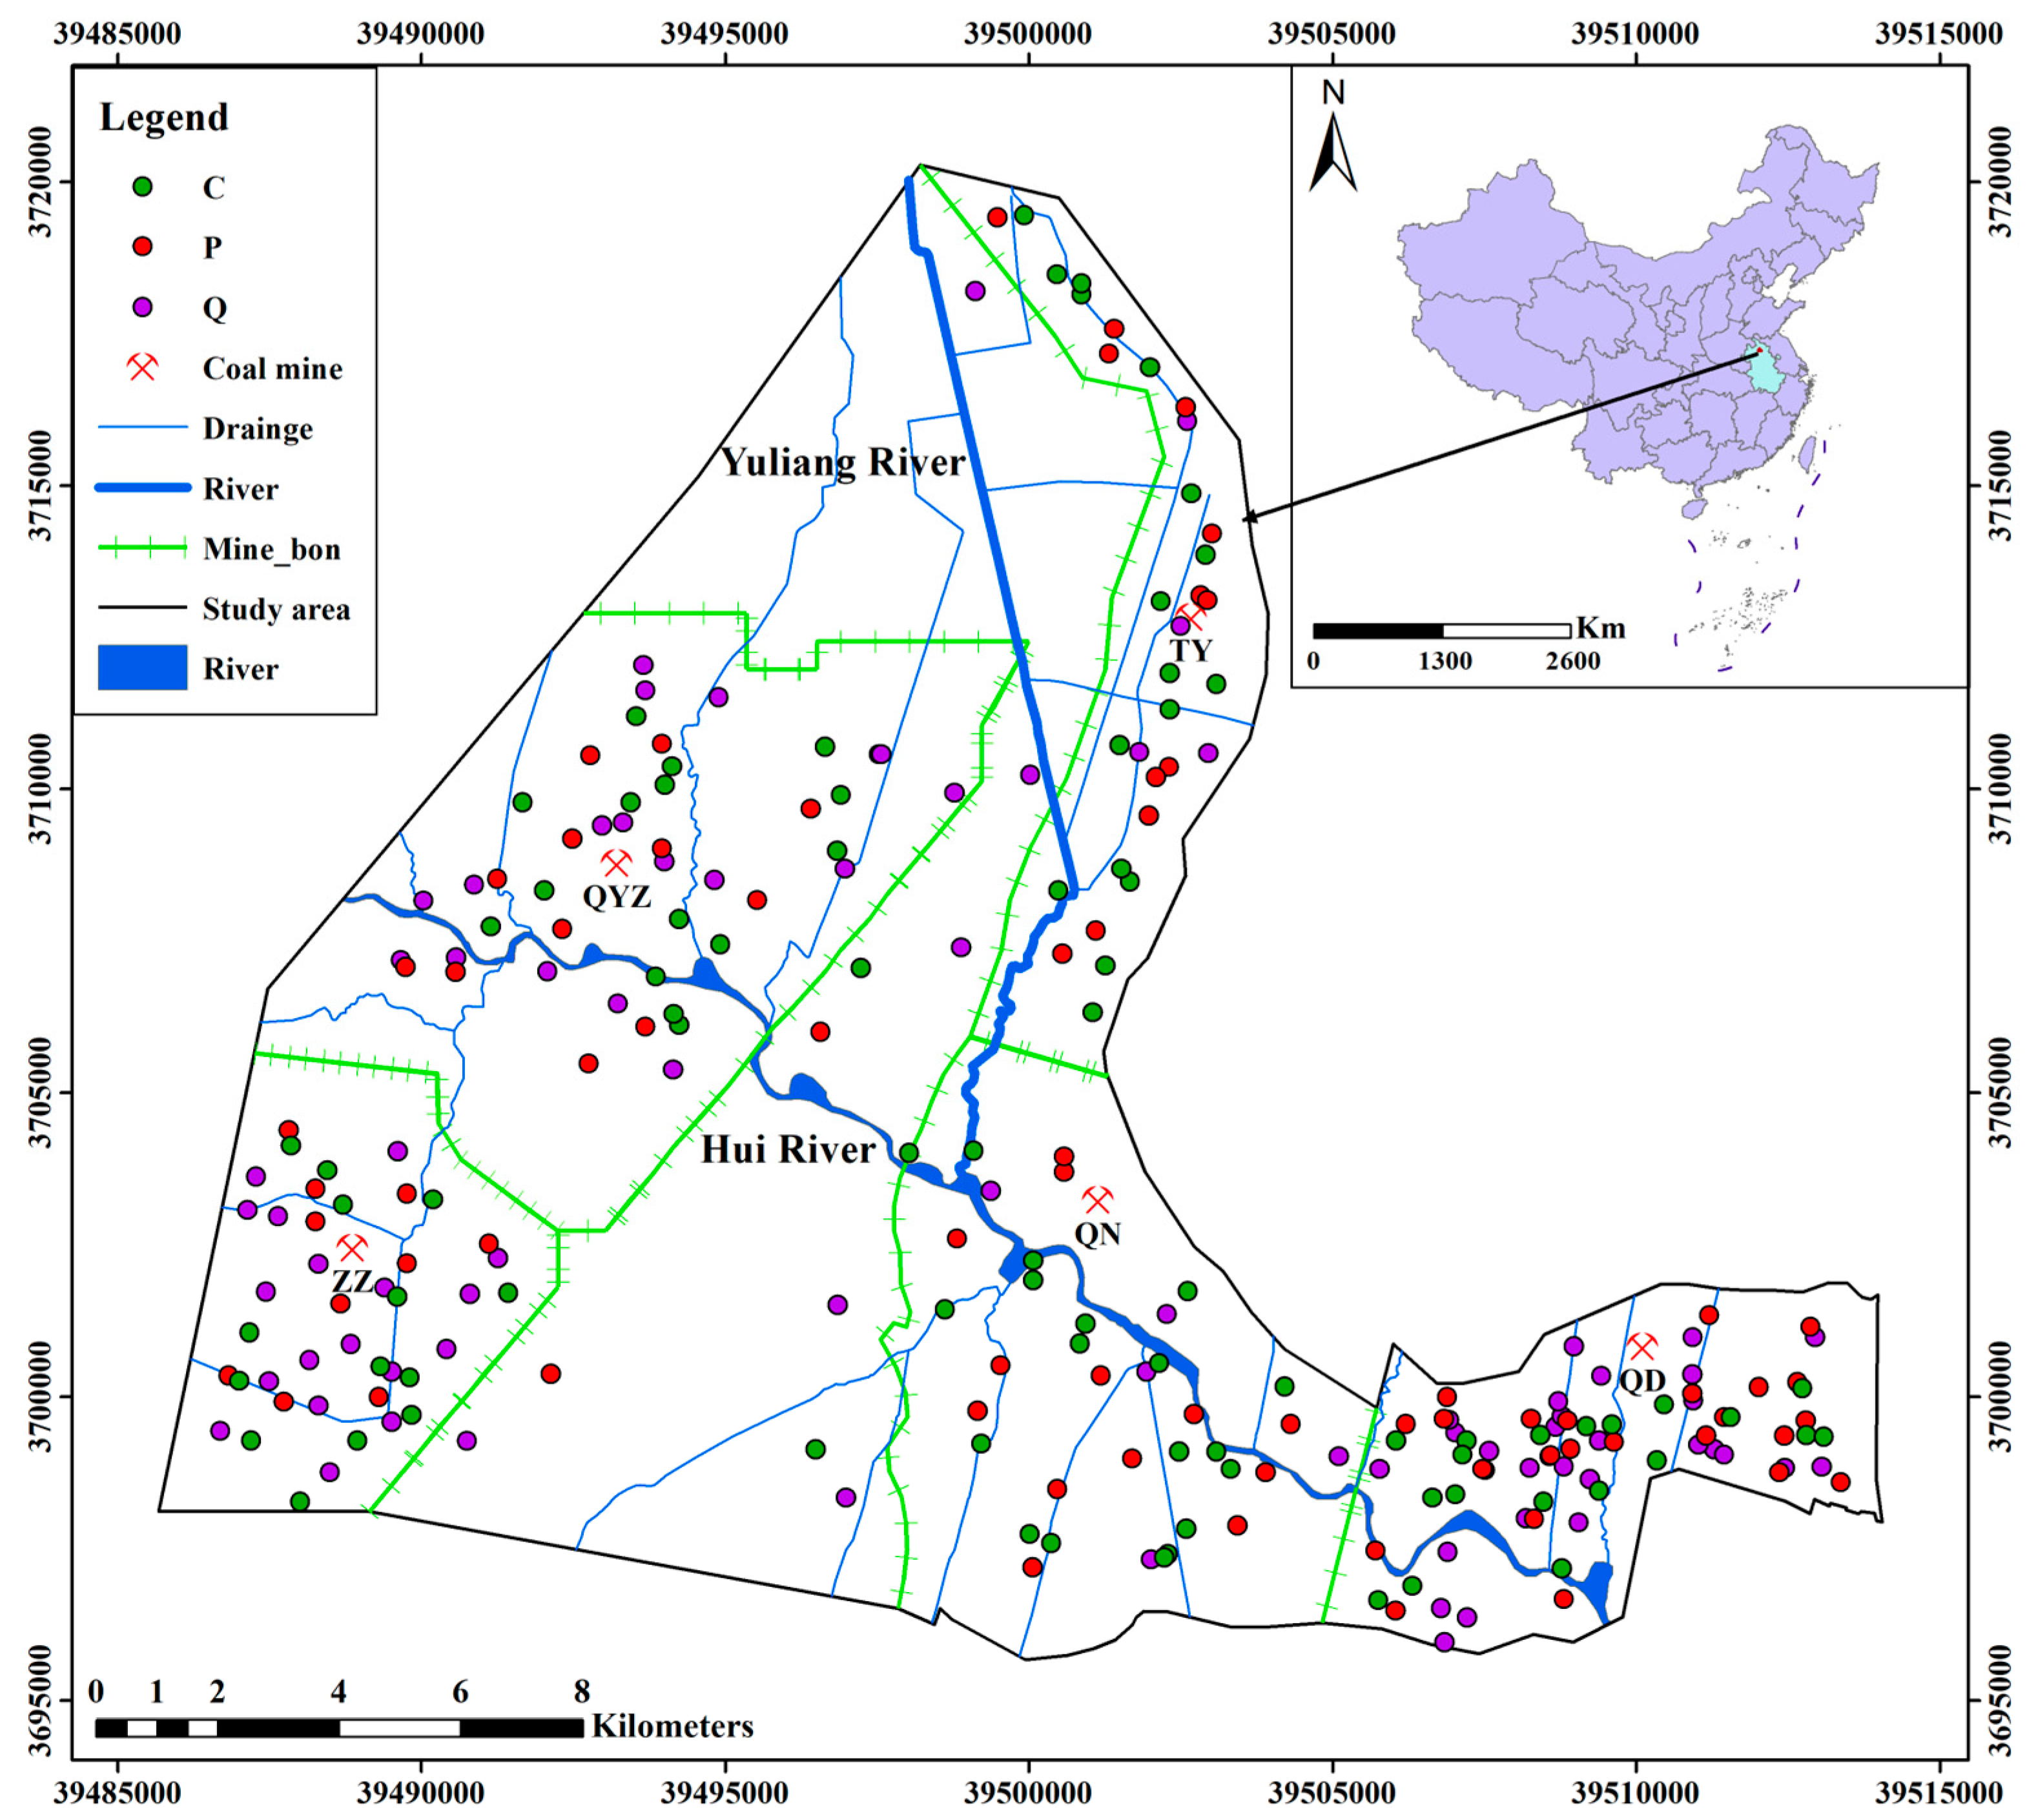
Figure 1. Location of the study area and sampling sites.
Water 17 01479 g001
Figure 2. Whitening function diagram.
Water 17 01479 g002
Figure 3. Exponential whitening function of different variables in all aquifers before 2011: (a) Na+ + K+; (b) Ca2+; (c) Mg2+; (d) Cl; (e) SO42−; (f) HCO3.
Water 17 01479 g003
Figure 4. Exponential whitening function of different variables in all aquifers during 2012–2016: e.g., (a) Na+ + K+; (b) Ca2+; (c) Mg2+; (d) Cl; (e) SO42−; (f) HCO3.
Water 17 01479 g004
Figure 5. Exponential whitening function of different variables in all aquifers during 2017–2021: e.g., (a) Na+ + K+; (b) Ca2+; (c) Mg2+; (d) Cl; (e) SO42−; (f) HCO3.
Water 17 01479 g005
Figure 6. Integrated affiliation and back substitution discriminatory results during 2011–2021: (a,c,e) Comprehensive membership of training samples; (b,d,f) back substitution discriminatory results of training samples.
Water 17 01479 g006
Figure 7. Integrated affiliation and discriminatory results of unknown samples in different stages: (a,c,e) Comprehensive membership of samples; (b,d,f) discriminatory results of samples.
Water 17 01479 g007
Table 1. Classification table of aquifers and critic weight.
Stage (Year)CategoryK+ + Na+Ca2+Mg2+ClSO42−HCO3
(mg/L)(mg/L)(mg/L)(mg/L)(mg/L)(mg/L)
Before 2011Quaternary476.5225.7121.1551.61007.9298.4
Permian1262.223.95.5117.82369.7324.1
Carboniferous503.5177.276.6325.2921.2476.5
Mean747.40142.2667.74331.511432.93366.36
Weight0.220.060.040.170.430.08
2012–2016Quaternary159.061.737.195.4139.5423.3
Permian443.79.84.9202.5245.2496.5
Carboniferous267.8167.777.8249.2627.8424.1
Mean290.279.740.0182.3337.5448.0
Weight0.230.10.050.070.280.27
2017–2021Quaternary267.6135.576.8232.9577.1357.7
Permian900.58.25.7244.414.31932.3
Carboniferous635.18.48.5287.522.31183.8
Mean601.150.730.4254.9204.61157.9
Weight0.21400.04180.02390.03900.18040.5009
Disclaimer/Publisher’s Note: The statements, opinions and data contained in all publications are solely those of the individual author(s) and contributor(s) and not of MDPI and/or the editor(s). MDPI and/or the editor(s) disclaim responsibility for any injury to people or property resulting from any ideas, methods, instructions or products referred to in the content.