Article

Regional Flood Risk Assessment and Prediction Based on Environmental Attributes and Pipe Operational Characteristics

1
School of Water Conservancy and Transportation, Zhengzhou University, Zhengzhou 450001, China
2
Yellow River Institute for Ecological Protection & Regional Coordinated Development, Zhengzhou 450001, China
3
School of Civil Engineering, North Minzu University, Yinchuan 750030, China
*
Author to whom correspondence should be addressed.
Water 2025, 17(10), 1477; https://doi.org/10.3390/w17101477
Submission received: 29 March 2025 / Revised: 24 April 2025 / Accepted: 13 May 2025 / Published: 14 May 2025
(This article belongs to the Special Issue Urban Flood Frequency Analysis and Risk Assessment)

Abstract

:
Urban flood risk assessments play a crucial role in urban resilience and disaster management. This paper proposes a comprehensive method for urban flood risk assessment and prediction that is based on environmental attributes and the operational characteristics of pipe networks. Using the central urban area of Zhengzhou as a case study, an integrated urban flood risk evaluation index system was developed, and the entropy weight method was applied to quantify risk indicators. A loosely coupled RF-XGBoost model was constructed to predict the flood risk of different rainfall scenarios. The results indicate that (1) the overall flood risk in the study area exhibits an increasing trend from the northeast to the southwest, with medium- to high-risk zones being predominant; (2) the spatial distribution pattern of the comprehensive flood risk closely aligns with that of the environmental risk but shows slight variations under the influence of pipe network operational risks; (3) the RF-XGBoost model demonstrates superior predictive accuracy under multi-factor coupling scenarios. When rainfall characteristics, environmental attributes, and pipe network operational risks are comprehensively considered, the Nash–Sutcliffe Efficiency (NSE) of the predictions improves from 0.85 (when using only rainfall characteristics) to 0.94. This study provides valuable insights and technical support for mitigating urban flood risks.

1. Introduction

Urban flooding has emerged as a critical challenge to global urbanization [1]. With rapid urban development and changes in land use patterns, the frequency and intensity of urban flooding events have significantly increased [2,3]. These disasters pose severe threats to human lives and property while causing profound impacts on urban infrastructure, economic operations, social stability, and ecological systems [4,5]. Thus, scientifically evaluating urban flood risks is vital for enhancing urban resilience and improving the emergency management capabilities of urban areas.
Existing studies on urban flood risk assessments can be broadly divided into two categories: risk evaluations based on numerical simulation [6,7] and risk evaluations based on regional attributes [8]. Numerical simulation methods rely on extensive observational data on flood events, analyzing key parameters such as water depth and flow velocity to construct risk models that accurately reflect actual flood risks. However, these methods are heavily dependent on monitoring data, which can be costly and challenging to obtain in data-scarce regions [9]. In contrast, regional attribute-based methods focus on natural and social factors, typically evaluating flood risks from the perspective of environmental conditions such as surface characteristics and pipe systems [10,11]. While these methods can provide insights into the static factors influencing flood risks, they often overlook the dynamic operational characteristics of pipe systems under extreme rainfall conditions. In reality, the dynamic operational characteristics of pipe systems, such as their node overflow and pipeline overload, are critical factors that reflect the pipe capacity of urban infrastructure during storm events [12,13]. Insufficient pipe capacity is often a major cause of urban flooding. Therefore, incorporating these dynamic characteristics into urban flood risk assessments is essential.
In addition, current urban flood risk prediction models based on machine learning often rely solely on rainfall characteristics to estimate potential flood threats. However, urban flooding is a complex process driven by multiple nonlinear factors. Relying on rainfall characteristics as the only meteorological indicators in a model does not fully capture the mechanisms driving flood formation. Urban flood risks are not only directly influenced by rainfall but are also closely linked to regional environmental attributes (including natural and socio-economic environments) and the operational characteristics of pipe systems [14]. Environmental attributes determine the surface runoff water generated and the area’s flood mitigation capacity, while pipe system characteristics directly affect the carrying capacity and overflow risk of the urban pipe network. Using these factors as input data in prediction models can provide a more comprehensive understanding of flood risk drivers and significantly enhance a model’s predictive accuracy [15,16]. This integrative approach represents the key innovation of this study.
In recent years, machine learning methods have been widely used in urban flood risk evaluation and prediction. Random Forest (RF) and Extreme Gradient Boosting (XGBoost) were chosen for this study due to their complementary strengths. RF is renowned for its stability and strong feature importance analysis [17,18,19,20], but it has limitations in handling complex nonlinear relationships [21]. XGBoost, on the other hand, excels in modeling nonlinear data and handling sparse features by optimizing the loss function of weighted decision trees [22]. Compared to other machine learning techniques, such as Support Vector Machines (SVMs) or Artificial Neural Networks (ANNs), RF and XGBoost offer advantages in terms of their computational efficiency and interpretability. For instance, SVMs are effective for small datasets but struggle with scalability, while ANNs require extensive computational resources and are less interpretable [23]. RF and XGBoost provide a balance between performance and practicality, making them well suited to this study’s dataset and objectives. By combining the predictive outputs of RF and XGBoost using a stacking method, it is possible to further improve the accuracy of flood risk prediction models.
Based on this background, this study focuses on the central urban area of Zhengzhou and proposes a comprehensive urban flood risk evaluation and prediction method that makes use of environmental attributes and pipe network operational characteristics. First, eight indicators were selected, including slope, elevation, imperviousness, pipe network density, population density, emergency facilities, node risk, and pipeline risk, to construct an urban flood risk evaluation index system. Then, the individual indicators were quantified based on their characteristics, with pipe system characteristics quantified through the SWMM. Next, the entropy weight method was employed to calculate indicator weights, which were integrated to derive a comprehensive risk value. Finally, a loosely coupled RF-XGBoost model was developed, with various combinations of rainfall conditions, regional environmental attributes, and pipe system characteristics used as inputs to predict urban flood risks under different rainfall scenarios. The proposed risk evaluation and prediction method offers a more scientific, reasonable, and effective solution for urban flood risk management.

2. Study Area and Data Sources
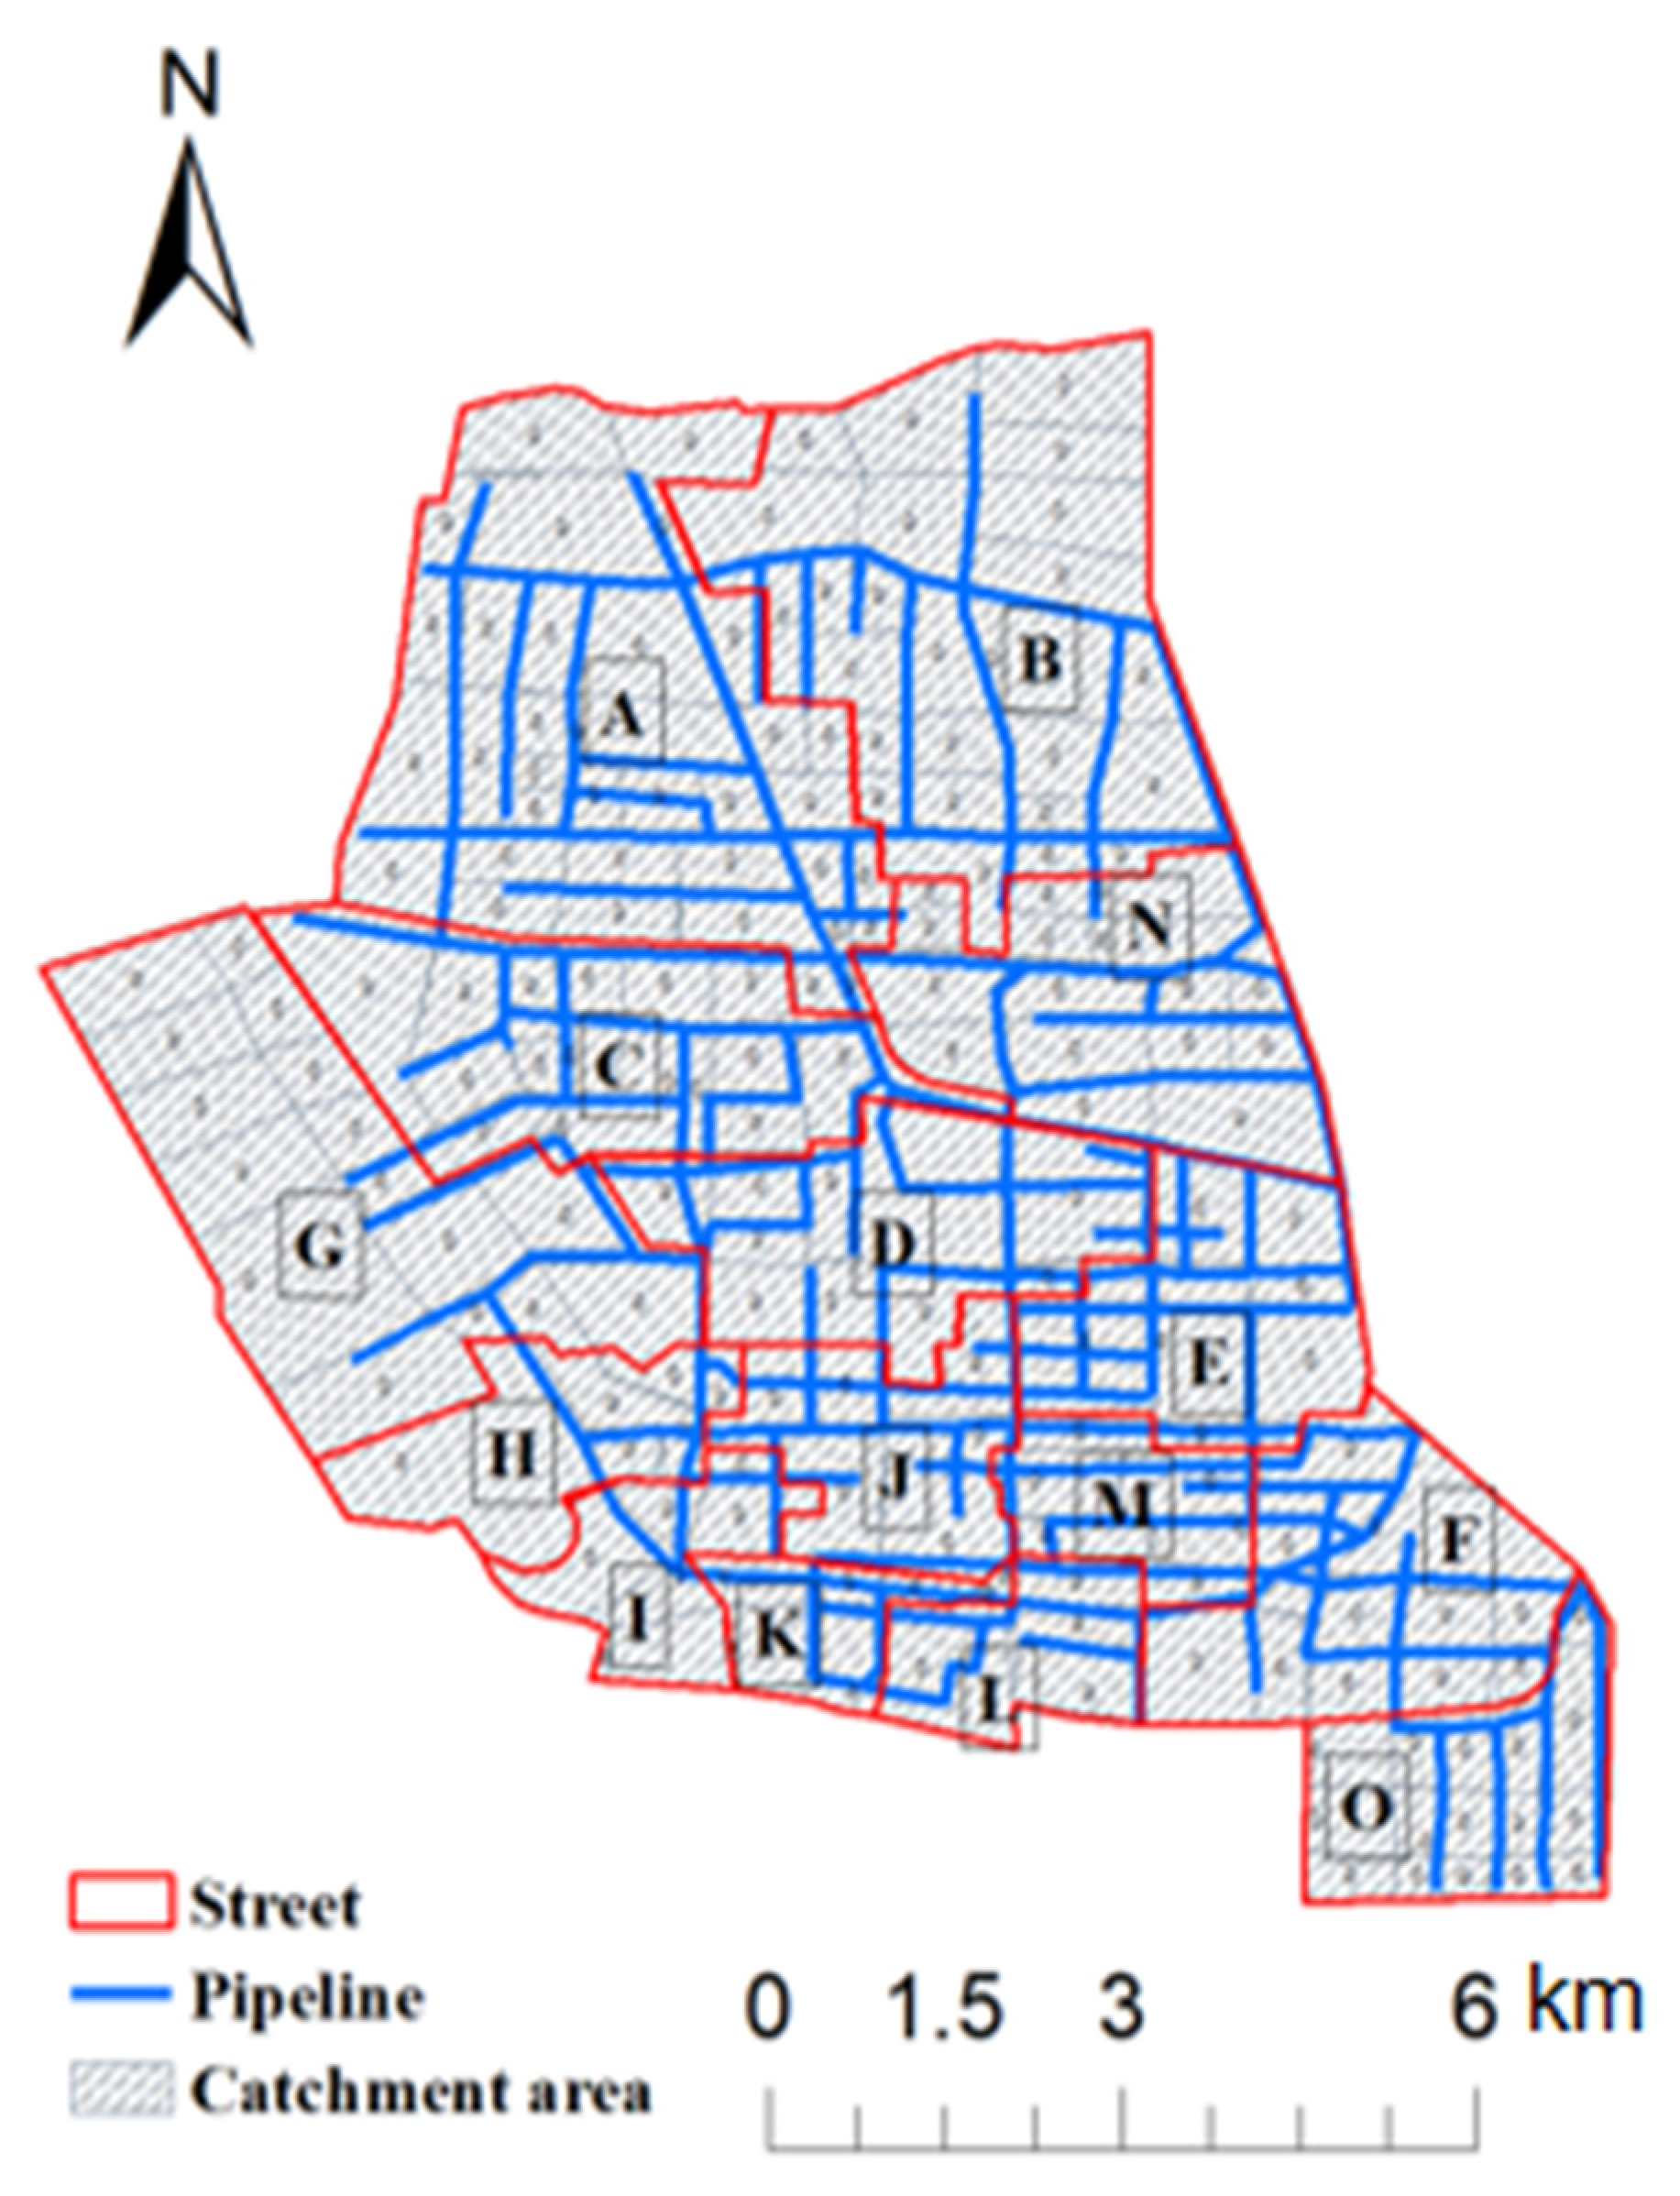
2.1. Study Area

The study area is located in the central urban district of Zhengzhou, Henan Province, China, and encompasses 15 sub-district offices, labeled as A through O. This region serves as the administrative center of Henan Province, hosting both the provincial government and party committee offices. Geographically, the area is situated between 113°40′ and 113°46′ E longitude and 30°51′ and 34°57′ N latitude, covering a total area of 77.5 square kilometers. The population of the study area is approximately 940,000, accounting for 58% of the total population of the Jinshui District.
The terrain of the study area slopes from west to east, and the region has a semi-arid to semi-humid continental monsoon climate. Summers are characterized by frequent heavy rainfall, with an average annual temperature of 14.8 °C and an average annual precipitation of 586.1 mm. The Jinshui District is traversed by four major rivers: the Jinshui River, Dongfeng Canal, Wei River, and Xionger River. These rivers, along with parts of the pipe network discharging into them, provide the region with effective urban flood management and its discharge capacity. The overview of the study area is shown in the Figure 1.

2.2. Data Sources

The basic data used in this study include rainfall data, underground pipe network data, DEM elevation data, land use data, and social and economic data. The data and their sources are as follows in Table 1.

3. Research Methods

3.1. Construction of Urban Flood Risk Evaluation System

3.1.1. Selection of Evaluation Indicators

This study establishes an urban flood risk evaluation system that includes both environmental attributes and pipe network operational characteristics.
The environmental attributes used are divided into natural attributes and socio-economic attributes. Natural attributes, including slope, ground elevation, and impermeability, are the main surface parameters that affect the characteristics of rainfall runoff. Socio-economic attributes include pipeline density, population density, and the number of emergency facilities nearby. The pipeline density determines the pipe capacity of the catchment area, the population density is the main factor determining the region’s risk classification, and the number of emergency facilities reflects the region’s disaster prevention and relief capacity.
The index of the operational characteristics of the pipe network refers to the node risk and pipeline risk in the operation of pipe network during urban flooding caused by rainstorms. The node risk is comprehensively evaluated using the overflow flow, ponding duration, and maximum ponding depth, which reflects the risk at the junction of the pipe network and reveals the carrying capacity of the pipe system under rainfall. The pipeline risk is evaluated using the pipeline overload duration, maximum flow, and maximum velocity. It reflects the strength of the pipe capacity of the pipeline and reveals the pipe potential and operating load of the pipe network. Therefore, the operating characteristics of the pipe network directly reflect the actual overflow of the pipe system and the operating state of the pipeline during rain-induced waterlogging.
The natural and socio-economic attributes used in this study were selected based on their relevance to urban flood risk assessments, as reported in the literature, and the feasibility of collecting relevant data in the study area. Attributes such as slope, elevation, and the impervious surface ratio are widely recognized in the literature as critical determinants of surface runoff generation and its velocity [24,25,26]. Socio-economic attributes like pipeline density, population density, and the number of emergency facilities are key factors reflecting the capacity of local infrastructure and its vulnerability to floods [27,28,29]. Other potential factors, such as vegetation cover or economic loss data, were not considered due to the unavailability of data or their limited relevance to the urban context of the study area. The final selection of factors was guided by the entropy weight method, which ensured that each indicator had a significant influence on the comprehensive flood risk assessment while avoiding redundancy.
Therefore, our index system for urban regional waterlogging risk can be constructed as shown in Table 2.

3.1.2. Quantification of Evaluation Indicators

(1)
Quantification of Environmental Attribute Indicators
The environmental attribute indicators for the study area were derived directly from available datasets. The data values for each indicator are summarized in Figure 2.
The calculation formula for the environmental risk is shown in Equation (1):
R e x = S x W S x + H x W H x + I P x W I P x + L D x W L D x + P D x W P D x + E x W E x                  
where R e x represents the environmental risk of street x and S x ,   H x ,   I P x ,   L D x ,   P D x ,   a n d E x denote the slope, elevation, impervious surface ratio, pipeline density, population density, and number of emergency facilities on street x , respectively. W S x , W H x , W I P x ,   W L D x , W P D x ,   a n d   W E x are the weights corresponding to the slope, elevation, impervious surface ratio, pipeline density, population density, and number of emergency facilities on street x .
1
Quantification of Pipe Network Operational Characteristics
Calculation Formula:
The calculation formula for the risk of a single node is shown in Equation (2):
N R i = j = 1 n L i j W L j + T i j W T j + D i j W D j
where N R i represents the risk value of node i , L i j is the overflow volume at node i during the j rainfall event, T i j is the ponding duration at node i during the j rainfall event, and D i j is the maximum ponding depth at node i during the j rainfall event. W L j ,   W T j ,   a n d   W D j are the weights for the overflow volume, ponding duration, and maximum ponding depth of node i during the j rainfall event, respectively. n represents the total number of rainfall events.
The calculation formula for the risk of a single pipeline is shown in Equation (3):
P R i = j = 1 n P t i j W P t j + M q i j W M q j + M s i j W M s j
where P R i represents the risk value of pipeline i , P t i j is the duration of the overload of pipeline i during the j rainfall event, M q i j is the maximum flow rate in pipeline i during the j rainfall event, and M s i j is the maximum flow velocity in pipeline i during the j rainfall event. W P t j , W M q j , and W M s j are the corresponding weights of these pipeline indicators. The weights in the above formula are calculated using the entropy weight method, and the parameters in the equation are obtained through simulation using the SWMM.
The formulas for street node risk and pipeline risk are shown in Equations (4) and (5), respectively:
R n x = i = 1 a N R i a     ( x = 0 ~ 14 )
R P x = i = 1 b P R i b     ( x = 0 ~ 14 )
where R n x ,   R P x represent the node risk and pipeline risk for street x , respectively. a is the number of nodes in street x and b is the number of pipelines in street x .
Equation (6) presents the calculation formula for the risk represented by the pipe network operational characteristics:
R N x = R n x W R n x + R P x W R P x
where R N x represents the risk of pipe network operational characteristics for street x and W R n x , W R P x are the weights for the node risk and pipeline risk of street x , respectively.
Table 3 shows the weights of each indicator.
2
SWMM Construction
The SWMM (Storm Water Management Model) is a dynamic rainfall runoff simulation tool developed by the U.S. Environmental Protection Agency [30]. It mainly consists of modules for surface runoff calculation, pipeline flow, and surface ponding. It calculates surface runoff based on the areas that fit into the permeable, impermeable with depressions, and impermeable without depressions sub-catchments. The runoff process is approximated as a nonlinear reservoir, and the flow calculation for the pipe network uses the dynamic wave method [31]. When the pipe network becomes overloaded and cannot discharge water in time, the ponding flows from the nodes to the surrounding areas, resulting in flooding.
The SWMM is recognized for its reliability and flexibility in simulating urban hydrologic processes, particularly those involving stormwater and combined sewer systems [32]. Its strengths include its ability to model dynamic rainfall runoff processes and evaluate the performance of urban drainage systems under various conditions. However, the model has limitations, such as requiring detailed input data, which may not be readily available in all regions. Additionally, the accuracy of the results heavily depends on the quality of the calibration and validation data. Another limitation is its high computational demand for large-scale or complex networks. Despite these challenges, the SWMM remains a robust tool for urban flood risk assessment and management due to its comprehensive features and adaptability.
The key steps in constructing the SWMM include pipe network conceptualization and sub-catchment division [33]. The network’s conceptualization primarily involves retaining the main pipelines, key nodes, and important control facilities while merging or deleting minor branches. Sub-catchment division is based on terrain features, land use types, and the layout of the pipe network [34]. The study area is divided into multiple runoff units using the Thiessen polygon method, and hydrological parameters such as area, imperviousness, and slope are assigned to each unit. Finally, each sub-catchment is allocated to a street based on the actual boundaries of the study area. The SWMM used in this study comprises 160 sub-catchments, 261 pipeline sections, and 215 manholes and is shown in Figure 3.
The parameters of the SWMM are divided into deterministic and uncertain parameters. Deterministic parameters (such as pipe length and diameter) are set according to actual conditions, while uncertain parameters (such as the Manning coefficient) are established by referring to the ranges provided in the “SWMM User Manual” and optimized through multiple simulations to determine the best values.
Three typical measured rainfall events with return periods of 1 year, 2 years, and 5 years were selected for the simulation. The results were validated using indicators such as the surface runoff continuity error and flow calculation continuity error and the comprehensive runoff coefficient method. The results are presented in Table 4.
According to the SWMM User Manual, if the model’s continuity error is less than or equal to 2%, the model can be preliminarily considered reasonable. Additionally, the comprehensive runoff coefficient for the central urban area of Zhengzhou is approximately 0.65, which is close to the calculated value. Therefore, it can be concluded that the SWMM constructed in this study is reasonable and feasible.

3.1.3. Flood Risk Calculation and Classification

The flood risk for a street, based on its environmental attributes and pipe network operational characteristics, can be calculated using the following formula:
R x = R e x W R e x + R N x W R N x
where R x represents the flood risk for street x and W R e x , W R N x are the weights for the environmental risk and pipe network operational risk of street x , respectively.
The classification of the flood risk into three levels (low, medium, and high) based on equal intervals (0–0.33, 0.33–0.67, and 0.67–1) ensures a balanced distribution of the risk categories. This approach allows for consistent interpretation across different regions and datasets, especially when there is no predefined threshold in the literature for urban flood risk classification. Using equal intervals avoids the potential overrepresentation or underrepresentation of specific risk categories and maintains consistency in risk interpretation across the study area. This method aligns with established practices in multi-criteria decision analysis, where equal intervals are commonly used for preliminary risk stratification when no specific thresholds are defined.
These classifications are shown in Table 5.

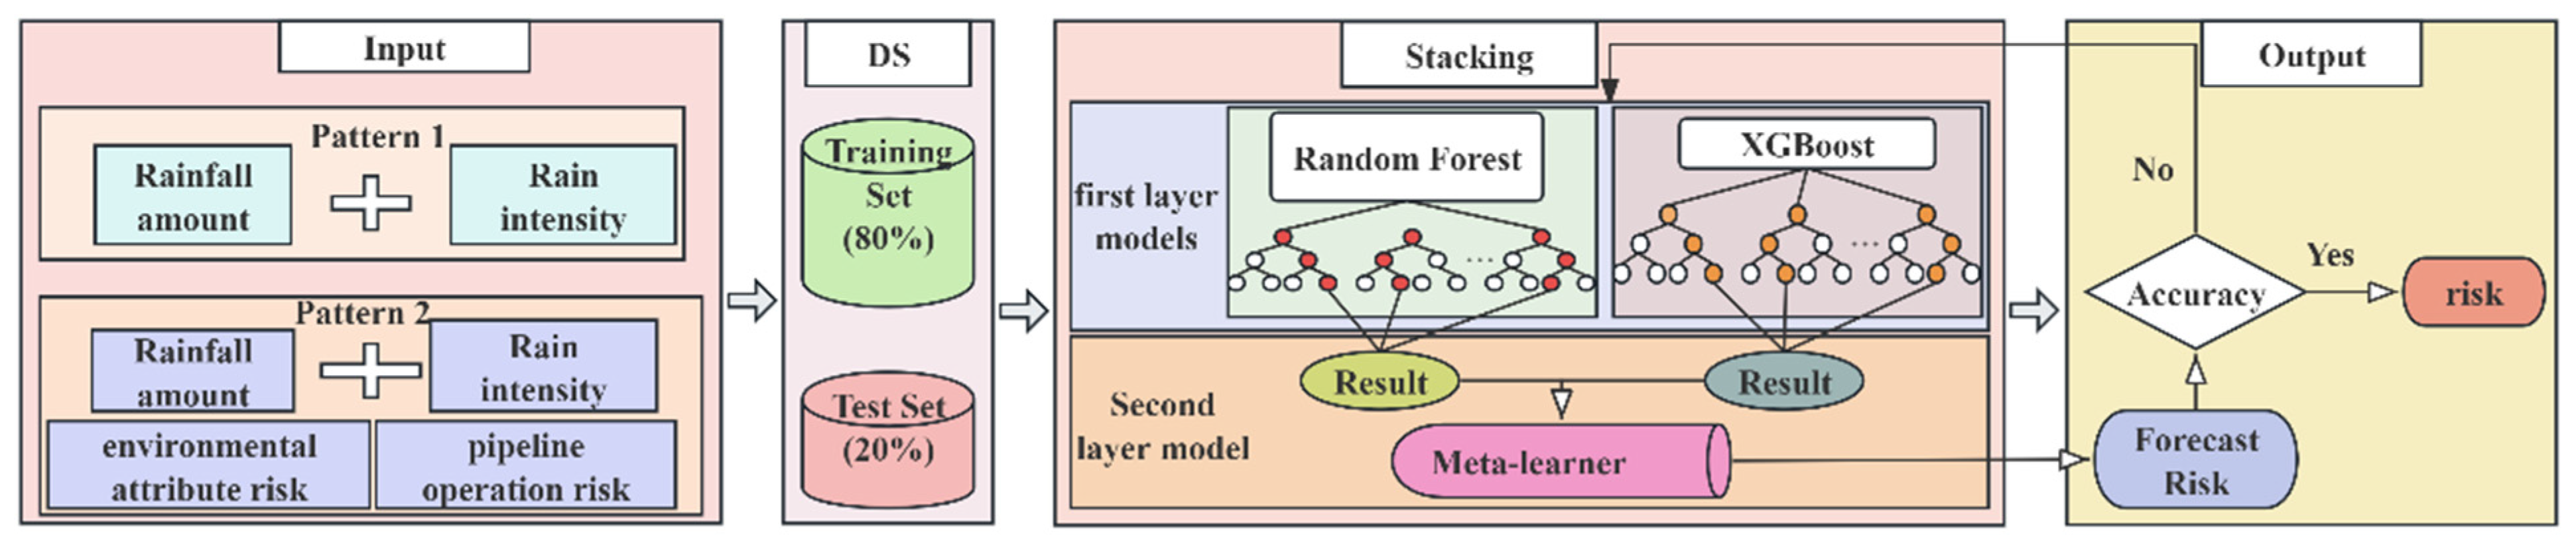
3.2. Construction of the Flood Risk Prediction Model

Random Forest is a machine learning algorithm based on the ensemble of decision trees. It builds multiple decision trees by randomly sampling data and features and generates its final prediction through voting or averaging [35]. XGBoost is an efficient model based on the gradient boosting framework, which gradually optimizes itself by fitting its residuals. It conducts regularization to prevent overfitting and supports parallel computing and various objective functions [36]. By introducing the stacking method into ensemble learning, with Random Forest and XGBoost selected as the base learners, both models fit the training data separately to output prediction results. Then, the outputs of these two models are used as new features to construct a meta-learner. The role of the meta-learner is to integrate the predictions from the first-layer models, learn the relationships between them, and generate a final prediction. Through this two-layer stacking approach, the model can fully leverage the diversity and complementarity of the base models, improving the overall accuracy of its prediction.
Using the 15 administrative districts of the study area, the model dataset is divided into 15 sub-datasets. Each sub-dataset consists of 155 short-duration rainfall events, including information about the amount of rainfall, rain intensity, environmental attribute risk, and pipeline operation risk. The model outputs its flood risk assessment results, with two input modes considered: one mode inputs only the amount and intensity of the rainfall, while the other mode inputs the amount and intensity of the rainfall, the environmental attribute risk, and the pipeline operation risk. Additionally, 80% of the dataset is selected to be the training set, with 20% thus used as the test set. The model construction process is shown in Figure 4. During model construction, the optimization parameters considered for Random Forest mainly include the number of trees, maximum depth, and minimum leaf node count, while the optimization parameters for XGBoost mainly include tree parameters, regularization parameters, and the learning rate. After cross-validation, the final optimized parameters are tree count = 100; minimum leaf node = 5; and maximum depth = 5 for Random Forest and tree count = 50; maximum depth = 5; minimum leaf node = 5; and learning rate = 0.15 for XGBoost.

4. Analysis of the Results

4.1. Urban Flood Risk Analysis

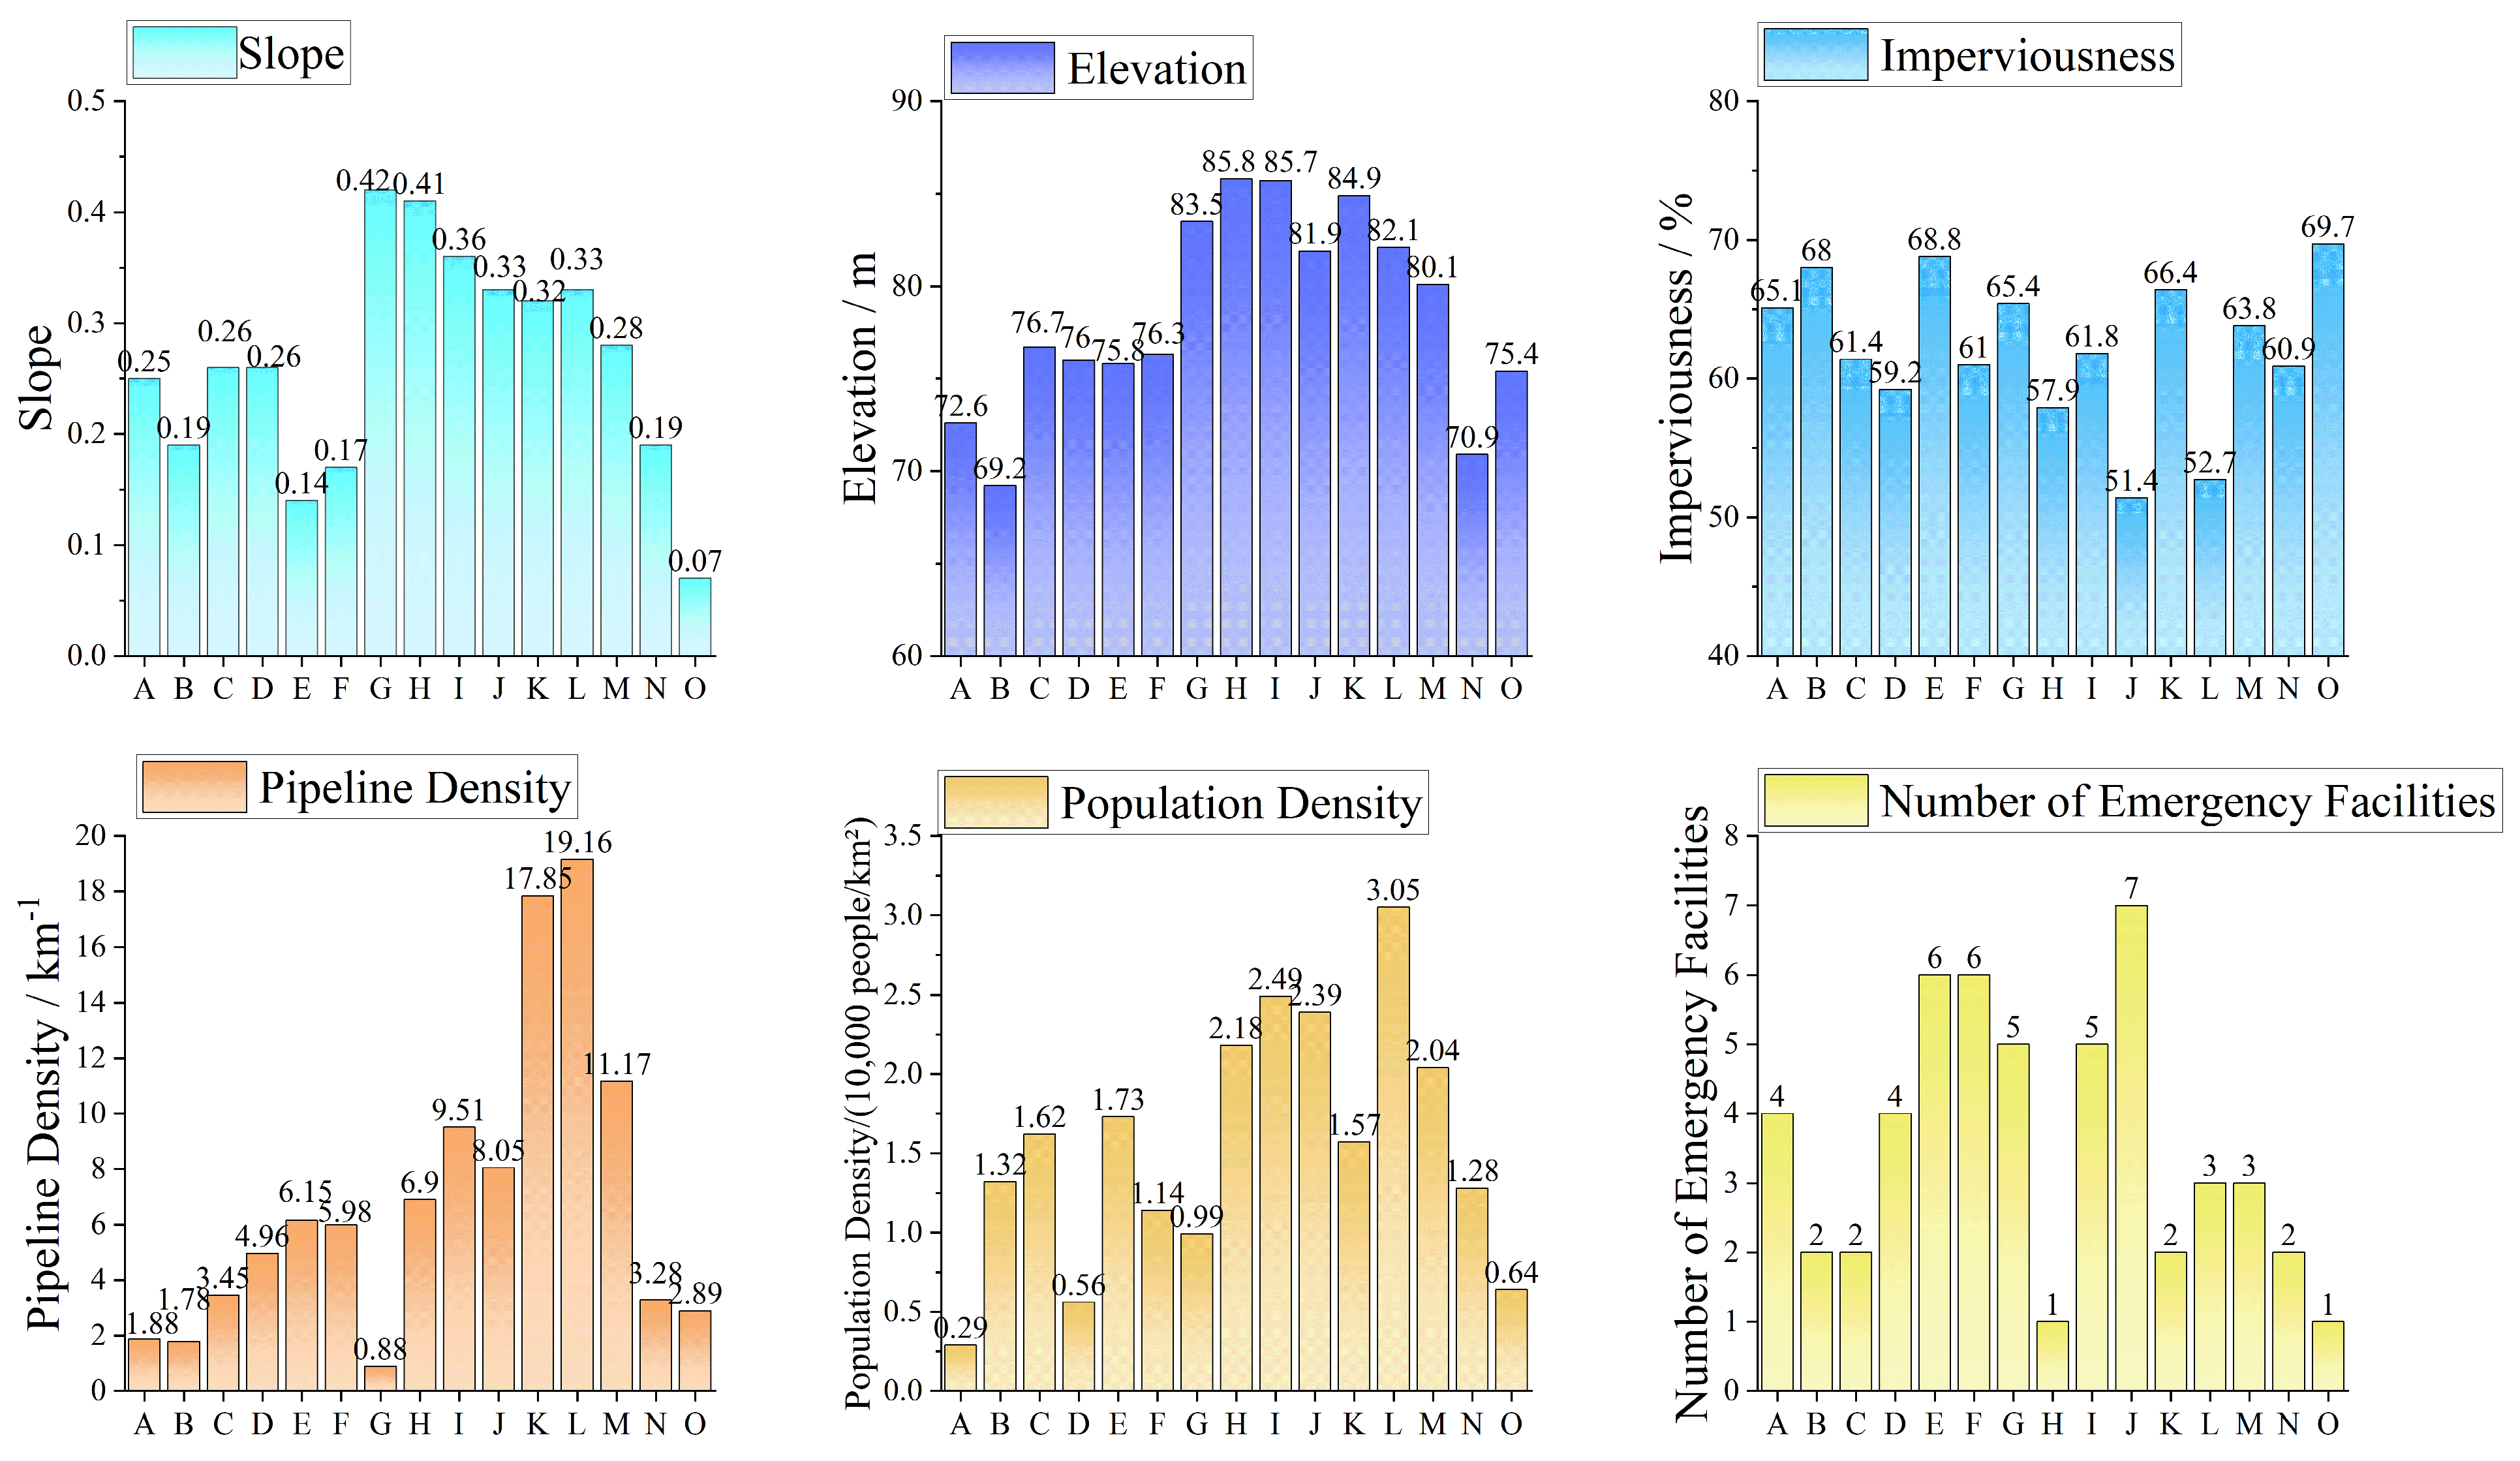
4.1.1. Environmental Attribute Risk

The environmental attribute risks of each street are shown in Figure 5.
The flood risks calculated based on environmental attributes are shown in Figure 5. High-risk areas account for 20% of the study area, medium-risk areas make up 53%, and low-risk areas comprise 27%. The spatial distribution of environmental risk in the study area shows a decreasing trend from south to north, with high-risk areas mainly concentrated in southern areas. This region is densely populated, with a large volume of socio-economic activity taking place. Despite a relatively high density of pipe networks, which provides good flood discharge capabilities, the high impermeability of the area significantly increases the rainfall runoff speed, leading to pipe capacity overload and urban flooding. In contrast, although the northern areas have a lower pipe network density, the terrain is flat, the population density is relatively low, and the runoff process during heavy rainfall is slower. Additionally, rivers pass through this area and excess rainwater can be directly discharged, resulting in a lower flood risk. It is also noteworthy that the lower region in the southeast corner of the study area, with similar favorable environmental attributes, also has a relatively low flood risk.
Overall, the spatial variation in the administrative street risk values reflects the complex interactions between natural geographical attributes and socio-economic attributes. According to our weight analysis, natural attributes dominate the risk assessment (65%), with elevation and slope together accounting for 40% of the risk. Socio-economic attributes contribute around 35%, with population density (18%) being the primary influencing factor within the socio-economic attributes considered. It is clear that the rainfall runoff characteristics determined by elevation and slope are key factors influencing natural attribute-based flood risks, while population, as the main disaster-bearing socio-economic entity, is a critical aspect to focus on for urban flood risk management.

4.1.2. Pipeline Operation Characteristics Risk

The risk map of the pipeline operation characteristics is shown in Figure 6.
As shown in Figure 6, high-risk streets account for 40% of the study area, medium-risk streets also make up 40%, and low-risk streets comprise 20%. The high-risk streets, in terms of pipeline operation characteristics, are mainly distributed in the central region of the study area. In this region, both the node risk and pipeline risk of high-risk streets are high, which places significant pressure on the pipe system’s ability to discharge rainwater. Notably, Street G has the highest pipeline operation risk value, 0.89, indicating that the pipe network in this street nears its maximum capacity under heavy rainfall conditions.
In contrast, the risk values for the nodes and pipelines in Street O, located in the southeastern part of the study area, are relatively low, with an overall risk value of only 0.11. This phenomenon can be attributed to two main factors: (1) the pipe infrastructure in this area is relatively well-developed, with large-diameter pipes, which significantly improve the system’s water-carrying capacity and effectively reduce node and pipeline operation risks; (2) this street is geographically more isolated, situated at the southeastern edge of the study area, with less likelihood of being affected by cumulative pressures from neighboring streets, further reducing its operational risk.
Additionally, the other low-risk areas are primarily located at the edges of the study area. This distribution reflects the impact of the connectivity between urban pipe systems on the distribution of risk. Central streets, due to their close connections with surrounding areas, are more susceptible to the interconnected effects of upstream water flows and downstream pipes, resulting in higher risk levels. In contrast, peripheral streets, with fewer connections to other areas’ pipe systems and weaker interconnections, are less prone to chain reactions, and thus exhibit relatively lower risk levels.

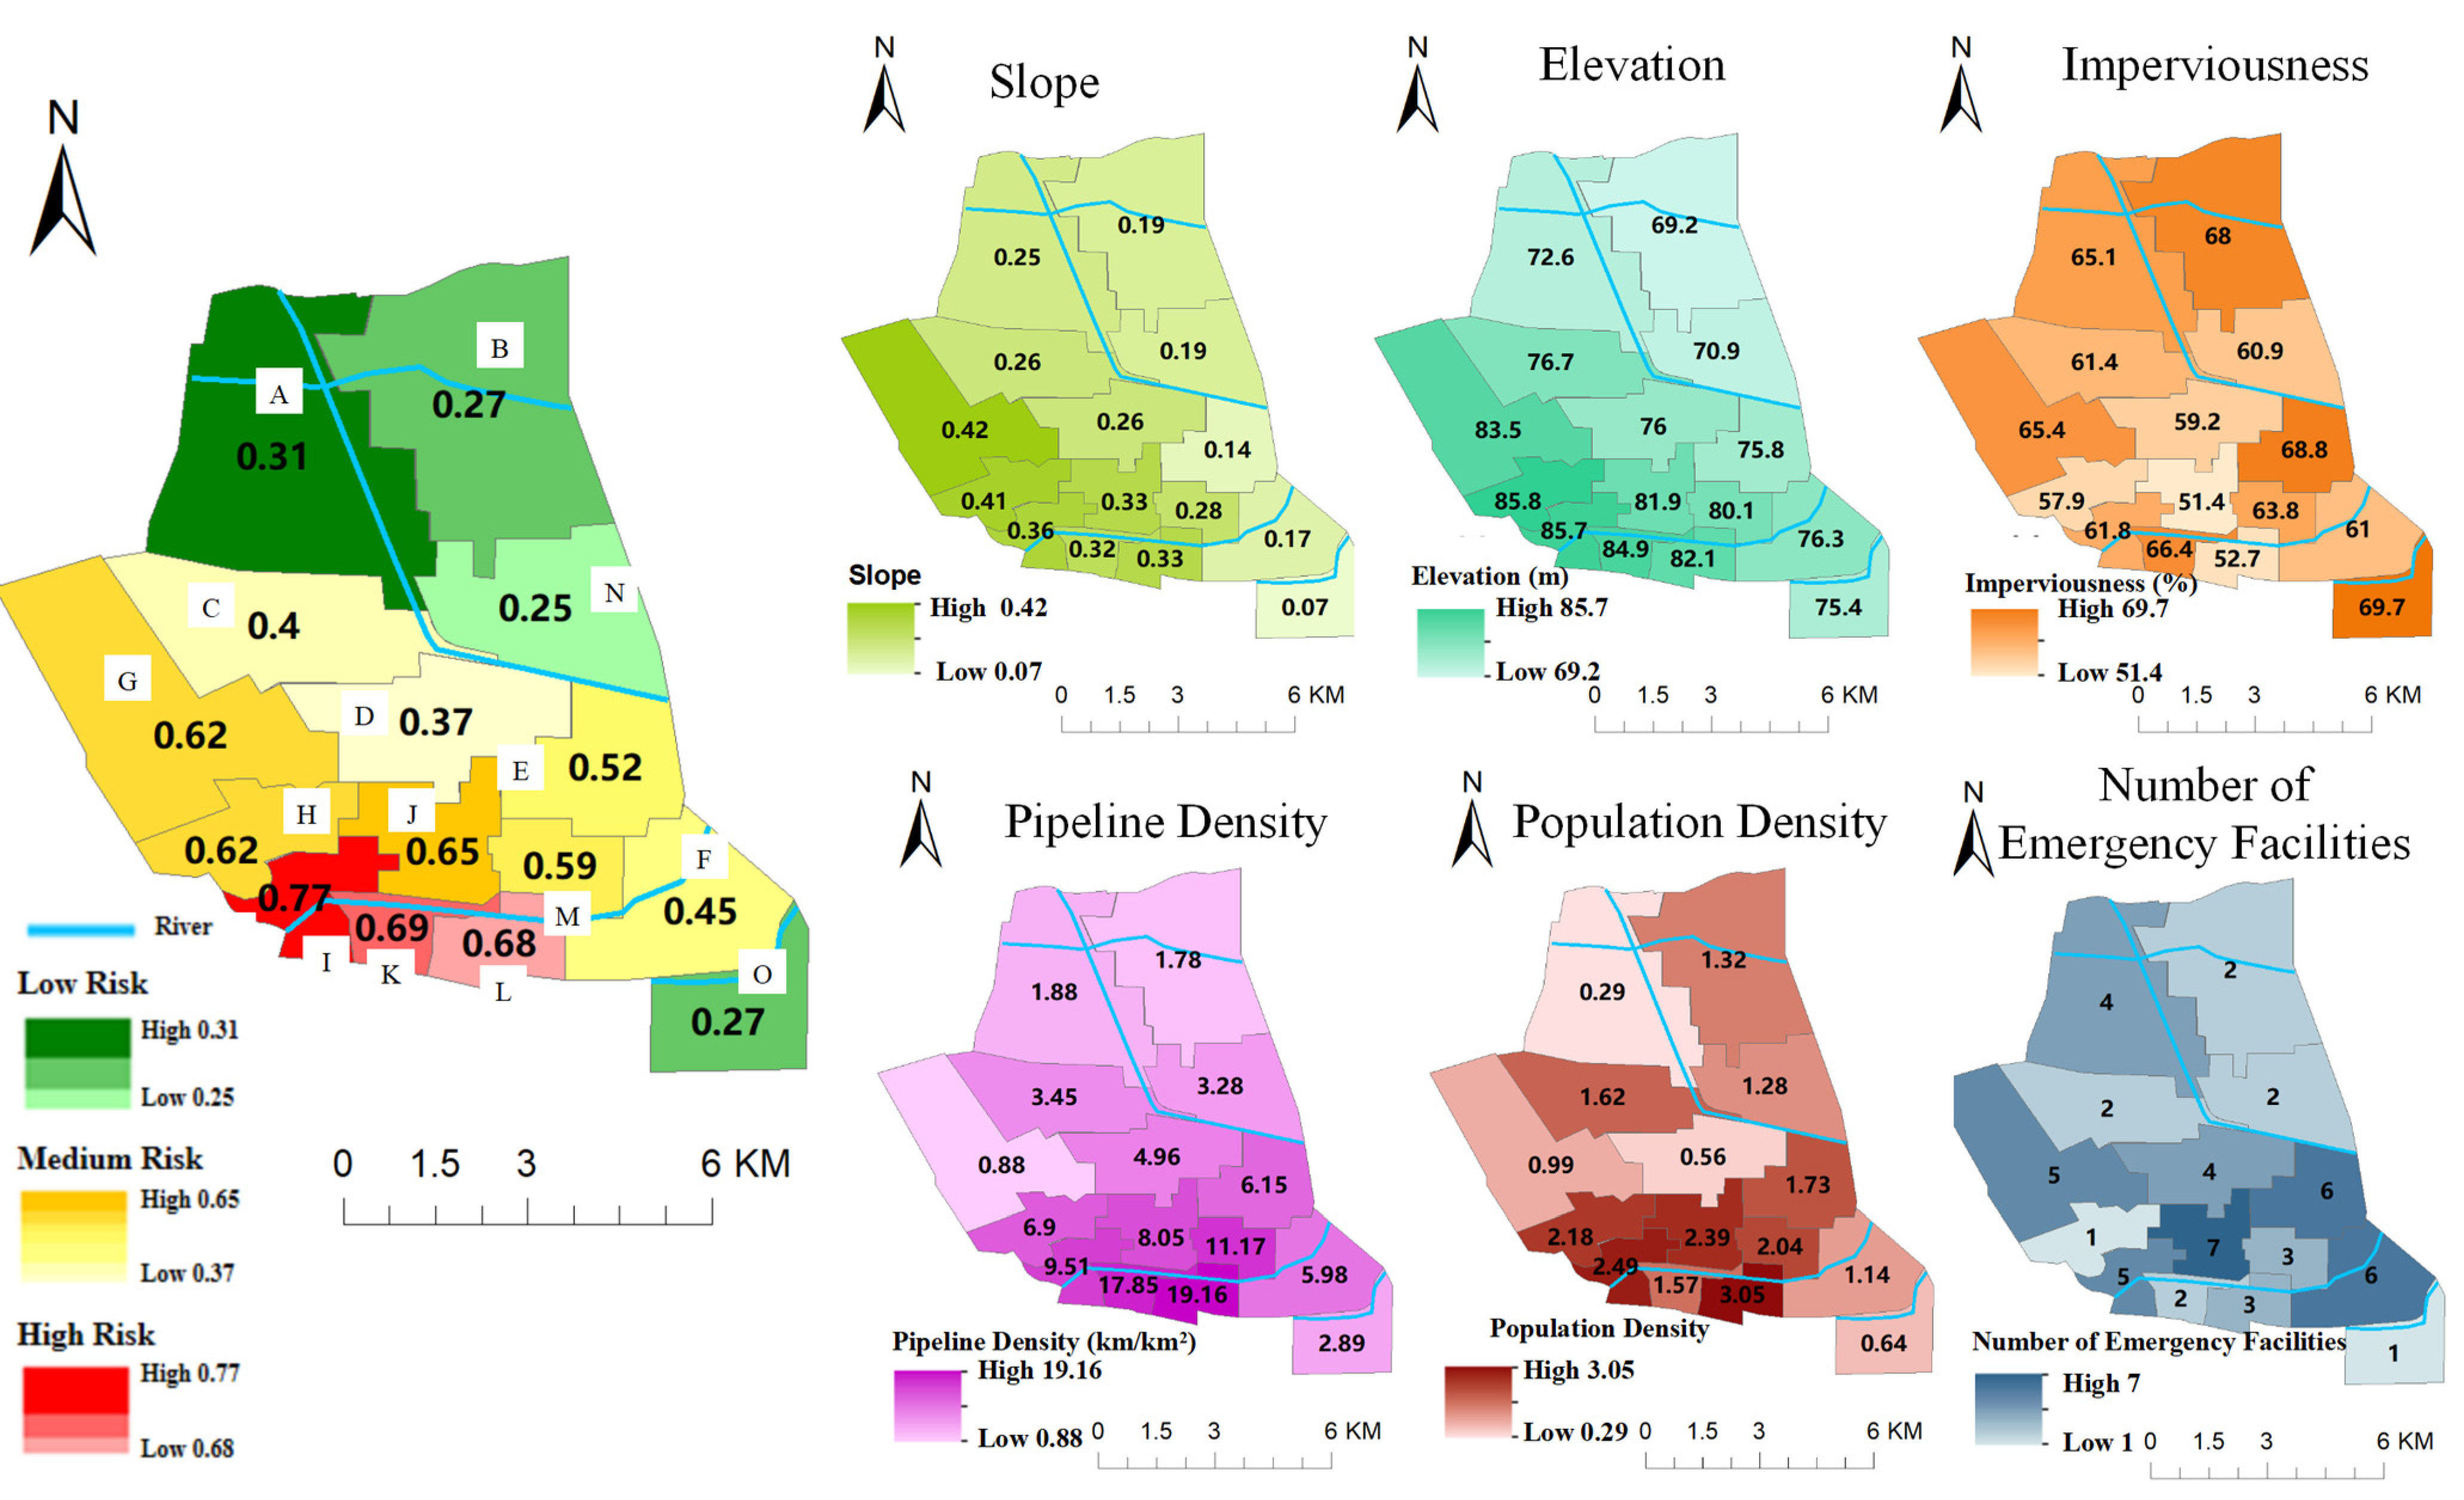
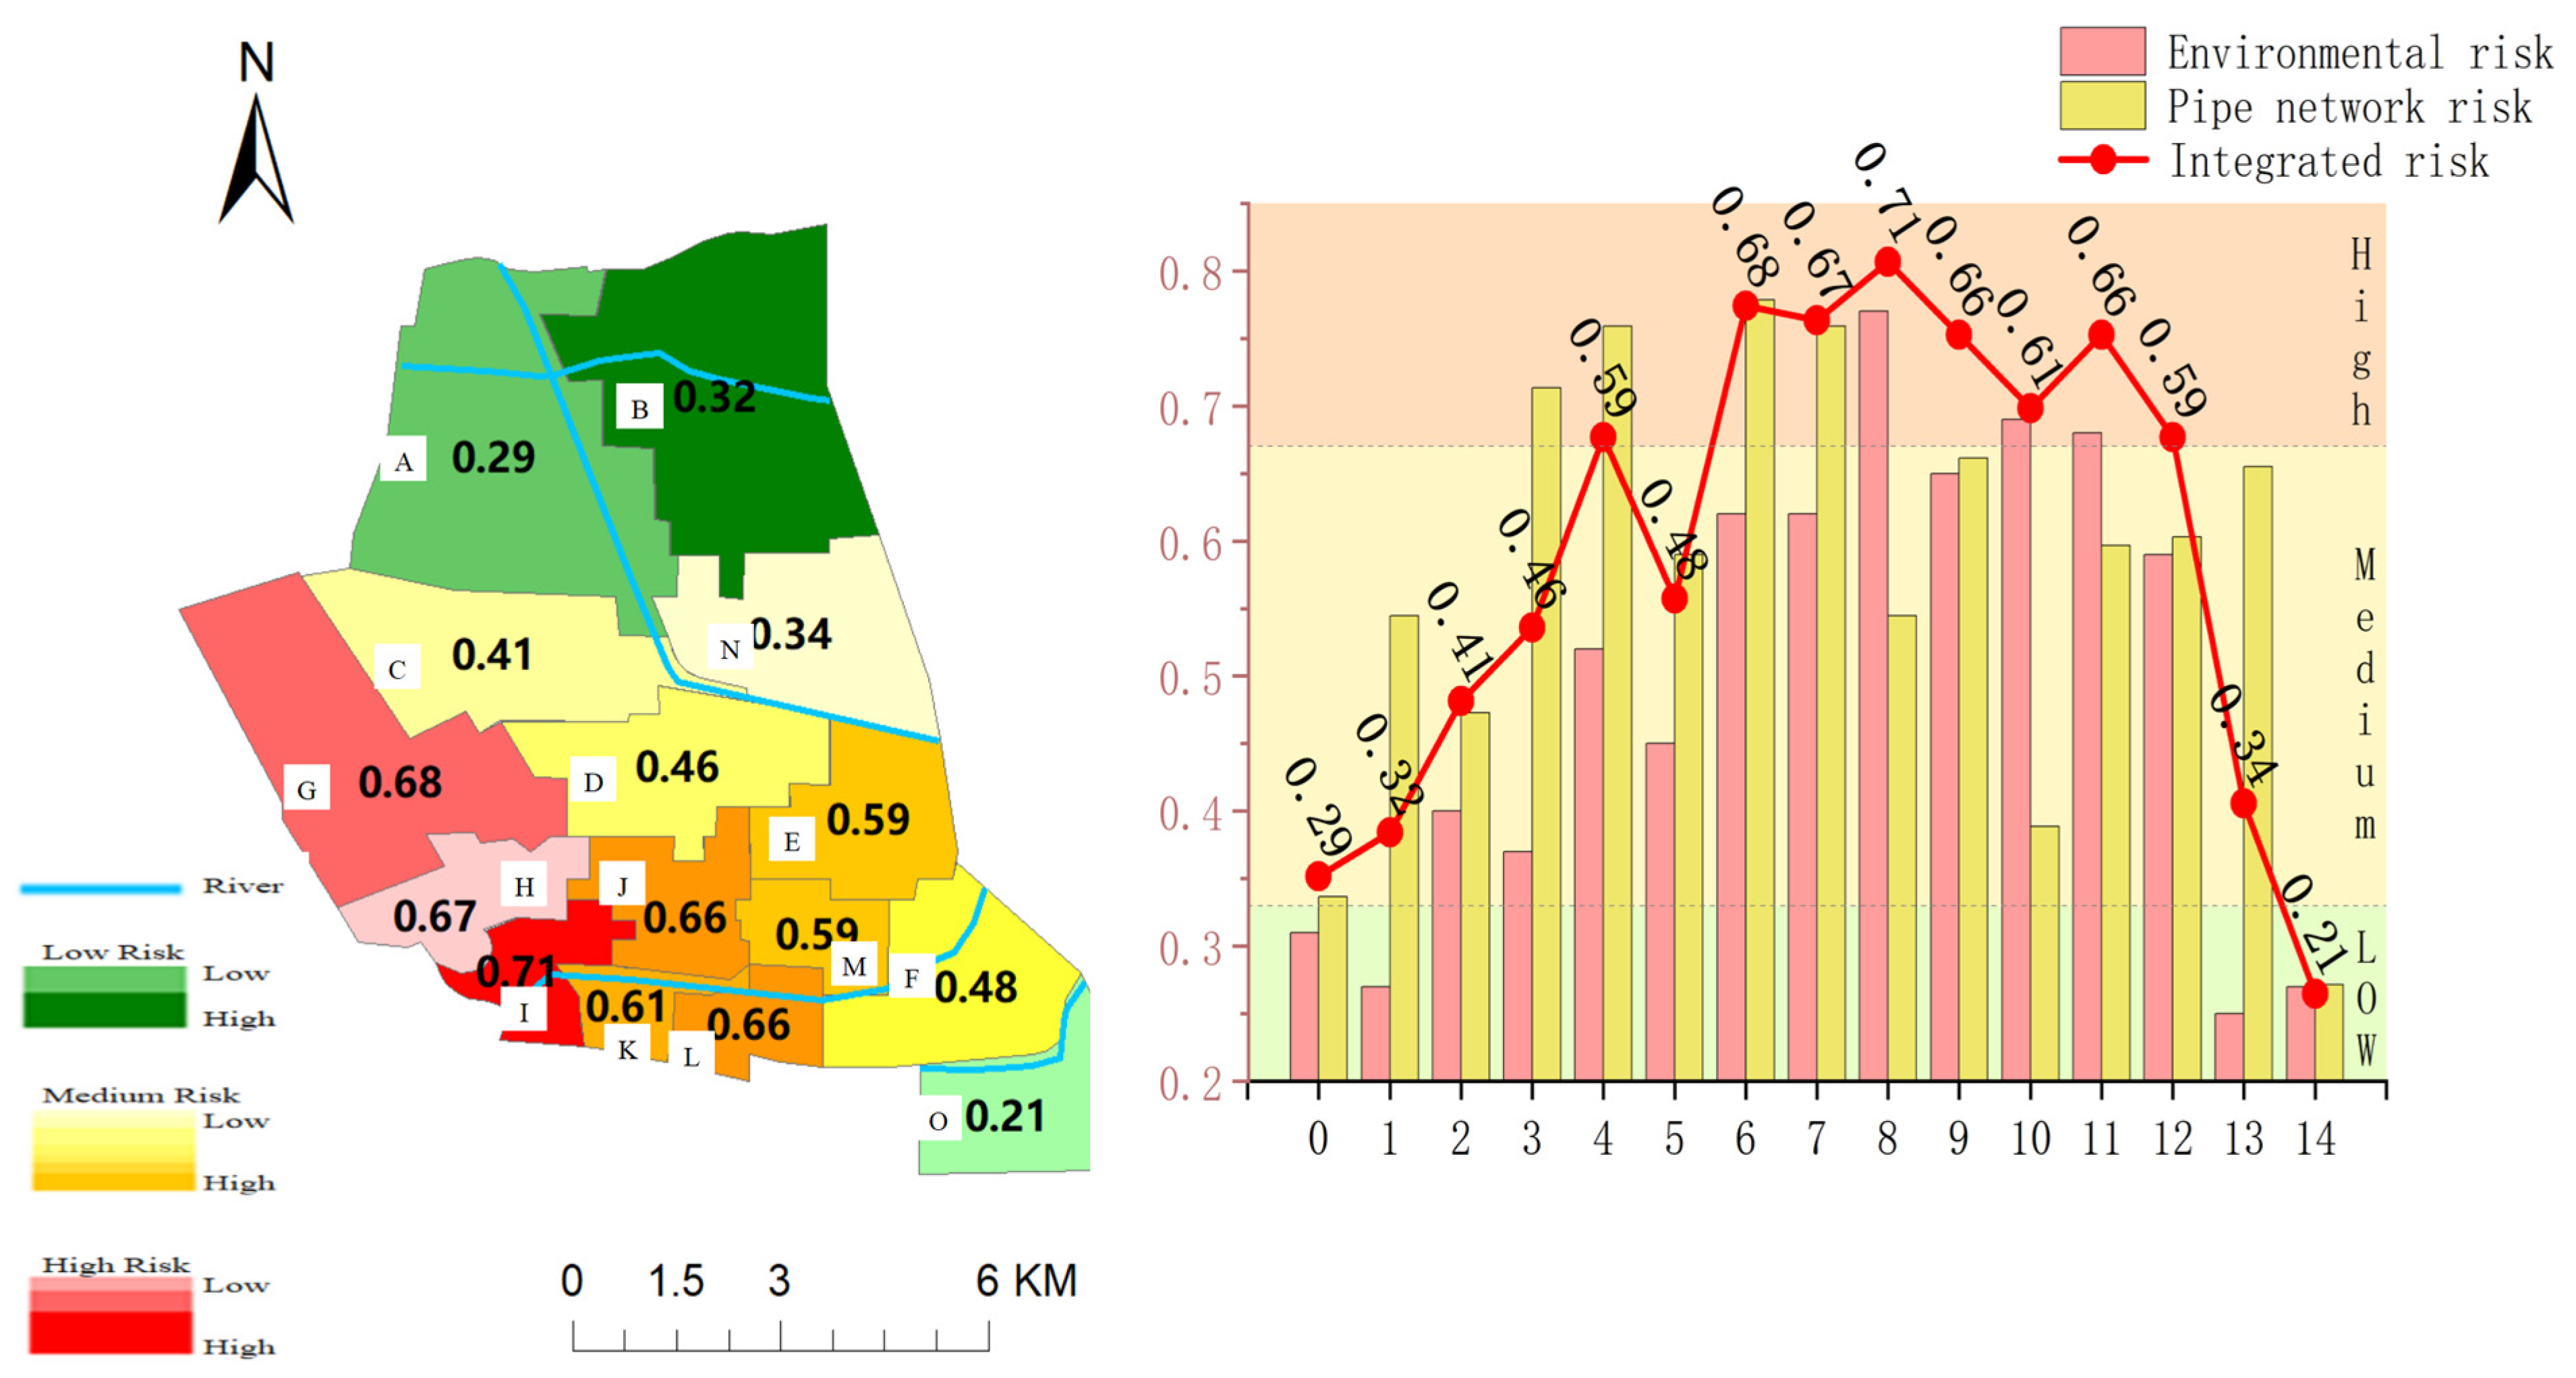
4.1.3. Comprehensive Attribute Risk

The comprehensive regional risk map, calculated by combining environmental attributes and pipeline operation characteristics, is shown in Figure 7.
From Figure 7, it can be seen that 20% of the entire study area is classified as high-risk, with the high-risk areas mainly concentrated in the southwestern part of the map. The medium-risk areas are predominantly located in the central part of the map, accounting for 60% of the total area, while the remaining 20%, the low-risk areas, are mainly distributed in the northern and eastern parts of the map. Overall, the flood risk in the region shows a gradual increase from the northeast to the southwest, and this distribution pattern is largely similar to the spatial distribution of the environmental attribute risk. This trend indicates that environmental attributes play a dominant role in flood risk assessments.
However, in high-risk areas (such as Streets G and H), the environmental attribute risk is generally at a medium level due to their large surface slope and high population density. The pipeline operation characteristics risk, on the other hand, is in a high-risk state due to the generally high node risk and pipeline risk, suggesting that pipeline operation risks dominate in high-risk areas. On the other hand, although Street L has a high environmental attribute risk, its dense pipeline network and good pipeline conditions result in a lower pipeline operation risk, making the overall flood risk in the region only medium. The comparison of flood risks in the above streets suggests that single-attribute assessments may not accurately reflect the true flood risk of the region. By considering both environmental attributes and pipeline operation characteristics, a more comprehensive and accurate flood risk assessment can be achieved.

4.2. Urban Flood Risk Prediction

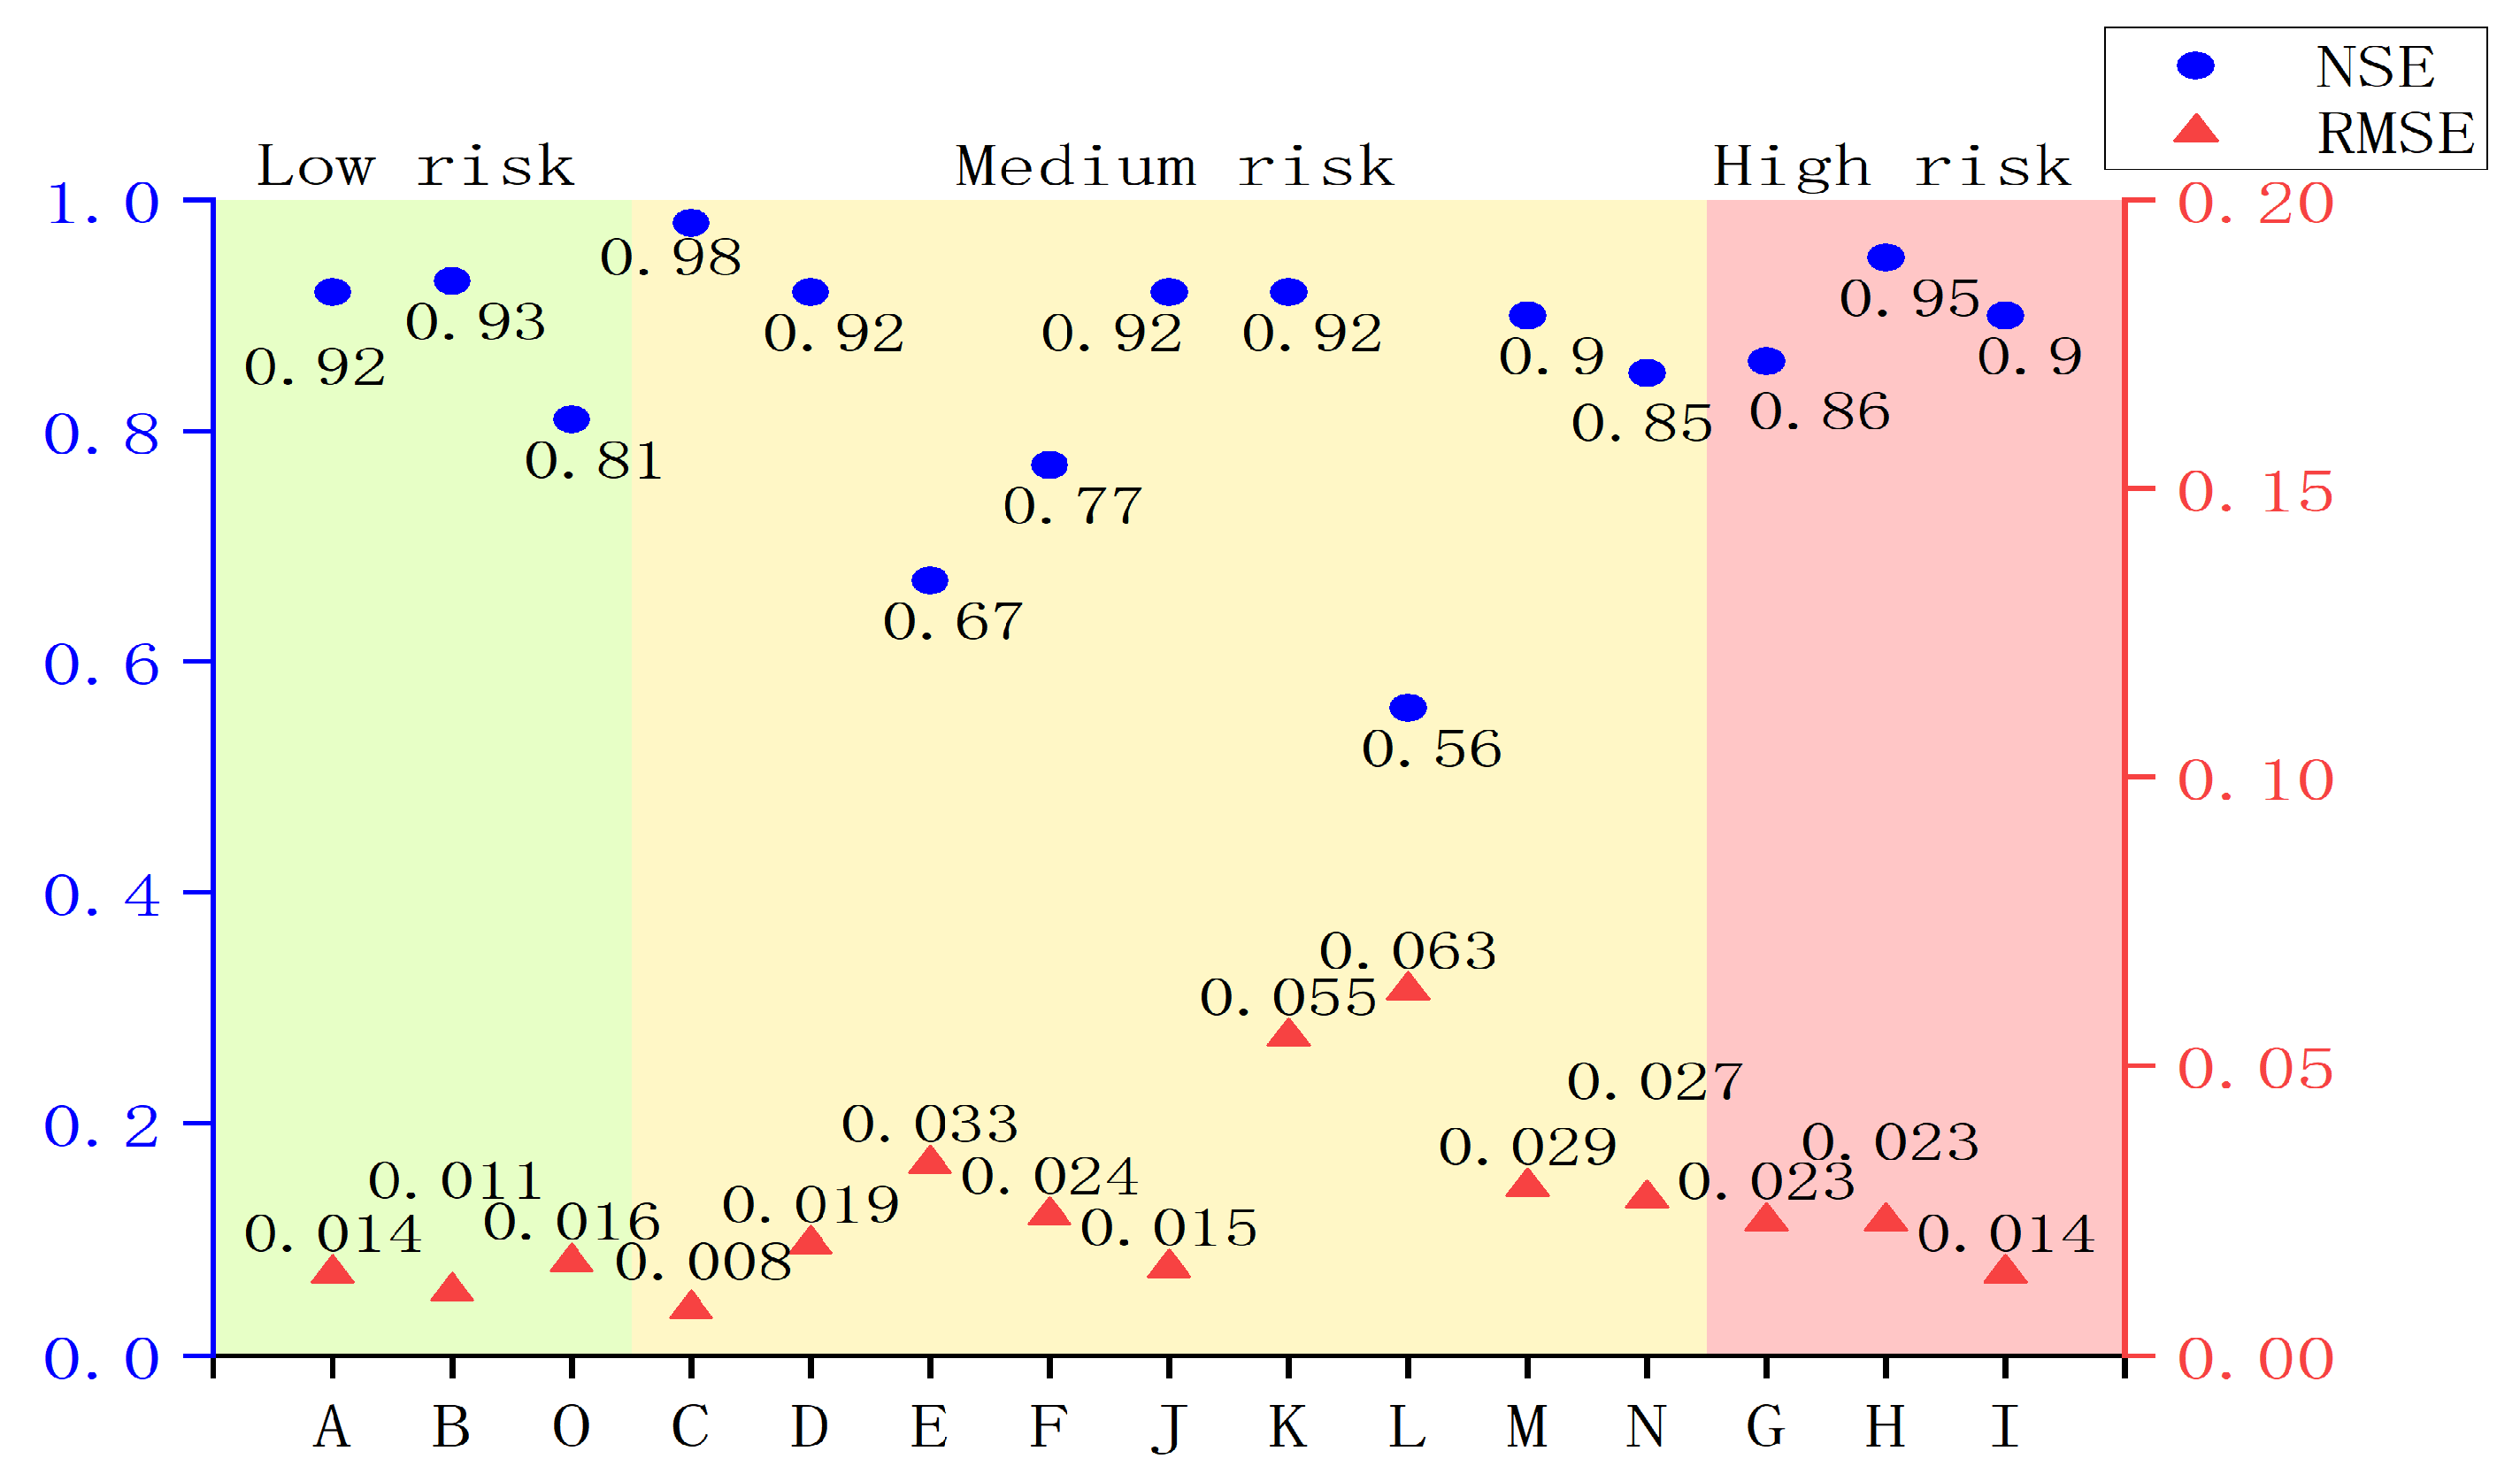
4.2.1. Prediction Model Evaluation

(1) When the input data consist of the rainfall and rainfall intensity from Pattern 1, the flood risk prediction results are as shown in Figure 8.
Using the Root Mean Square Error (RMSE) and Nash–Sutcliffe Efficiency (NSE) as evaluation metrics, the model’s evaluation indicators are shown in Figure 9.
From Figure 9, it can be seen that the NSE for low- and high-risk areas is relatively high, while the RMSE is very low, indicating that the model performs well in predicting low- and high-risk areas. The fluctuation in rainfall data is small, making the data easier to fit. However, the RMSE in high-risk areas is relatively higher than that in low-risk areas, suggesting greater volatility in the rainfall data. This indirectly reflects that low-risk areas are typically associated with low amounts of rainfall, while high-risk areas are the result of conditions such as a light rainfall with high intensity or heavy rainfall with low intensity.
The NSE values for medium-risk Streets E, F, and L are significantly lower than those of other medium-risk streets, while their RMSE values are relatively higher. However, the model performs better in predicting other medium-risk streets, with smaller errors and a higher fitting accuracy seen. This suggests that rainfall data alone do not fully capture the variation in street risk; other factors also contribute to changes in risk values.
(2) When the input data follow Pattern 2 (in terms of rainfall characteristics, environmental attribute risk, and pipeline operation characteristics risk), the prediction results are as shown in Figure 10.
The Root Mean Square Error (RMSE) and Nash–Sutcliffe Efficiency (NSE) of these results are shown in Figure 11.
From our analysis, it is evident that under this input mode, the NSE is generally above 0.90 and the RMSE is less than 0.05, indicating a very high prediction accuracy. The NSE values for high-risk areas are concentrated between 0.95 and 0.99, approaching the ideal value. For medium-risk areas, the NSE values range from 0.89 to 0.98, which are slightly lower than those of the high-risk areas. The NSE values for the low-risk areas are slightly lower, with Street O having the lowest value of only 0.80.
In summary, the model performs well in predicting risk areas, indicating that it can effectively capture the characteristics of high-risk urban flood areas. The data, which combine rainfall information, environmental risks, and pipeline operation characteristics, enhance the model’s prediction capability.

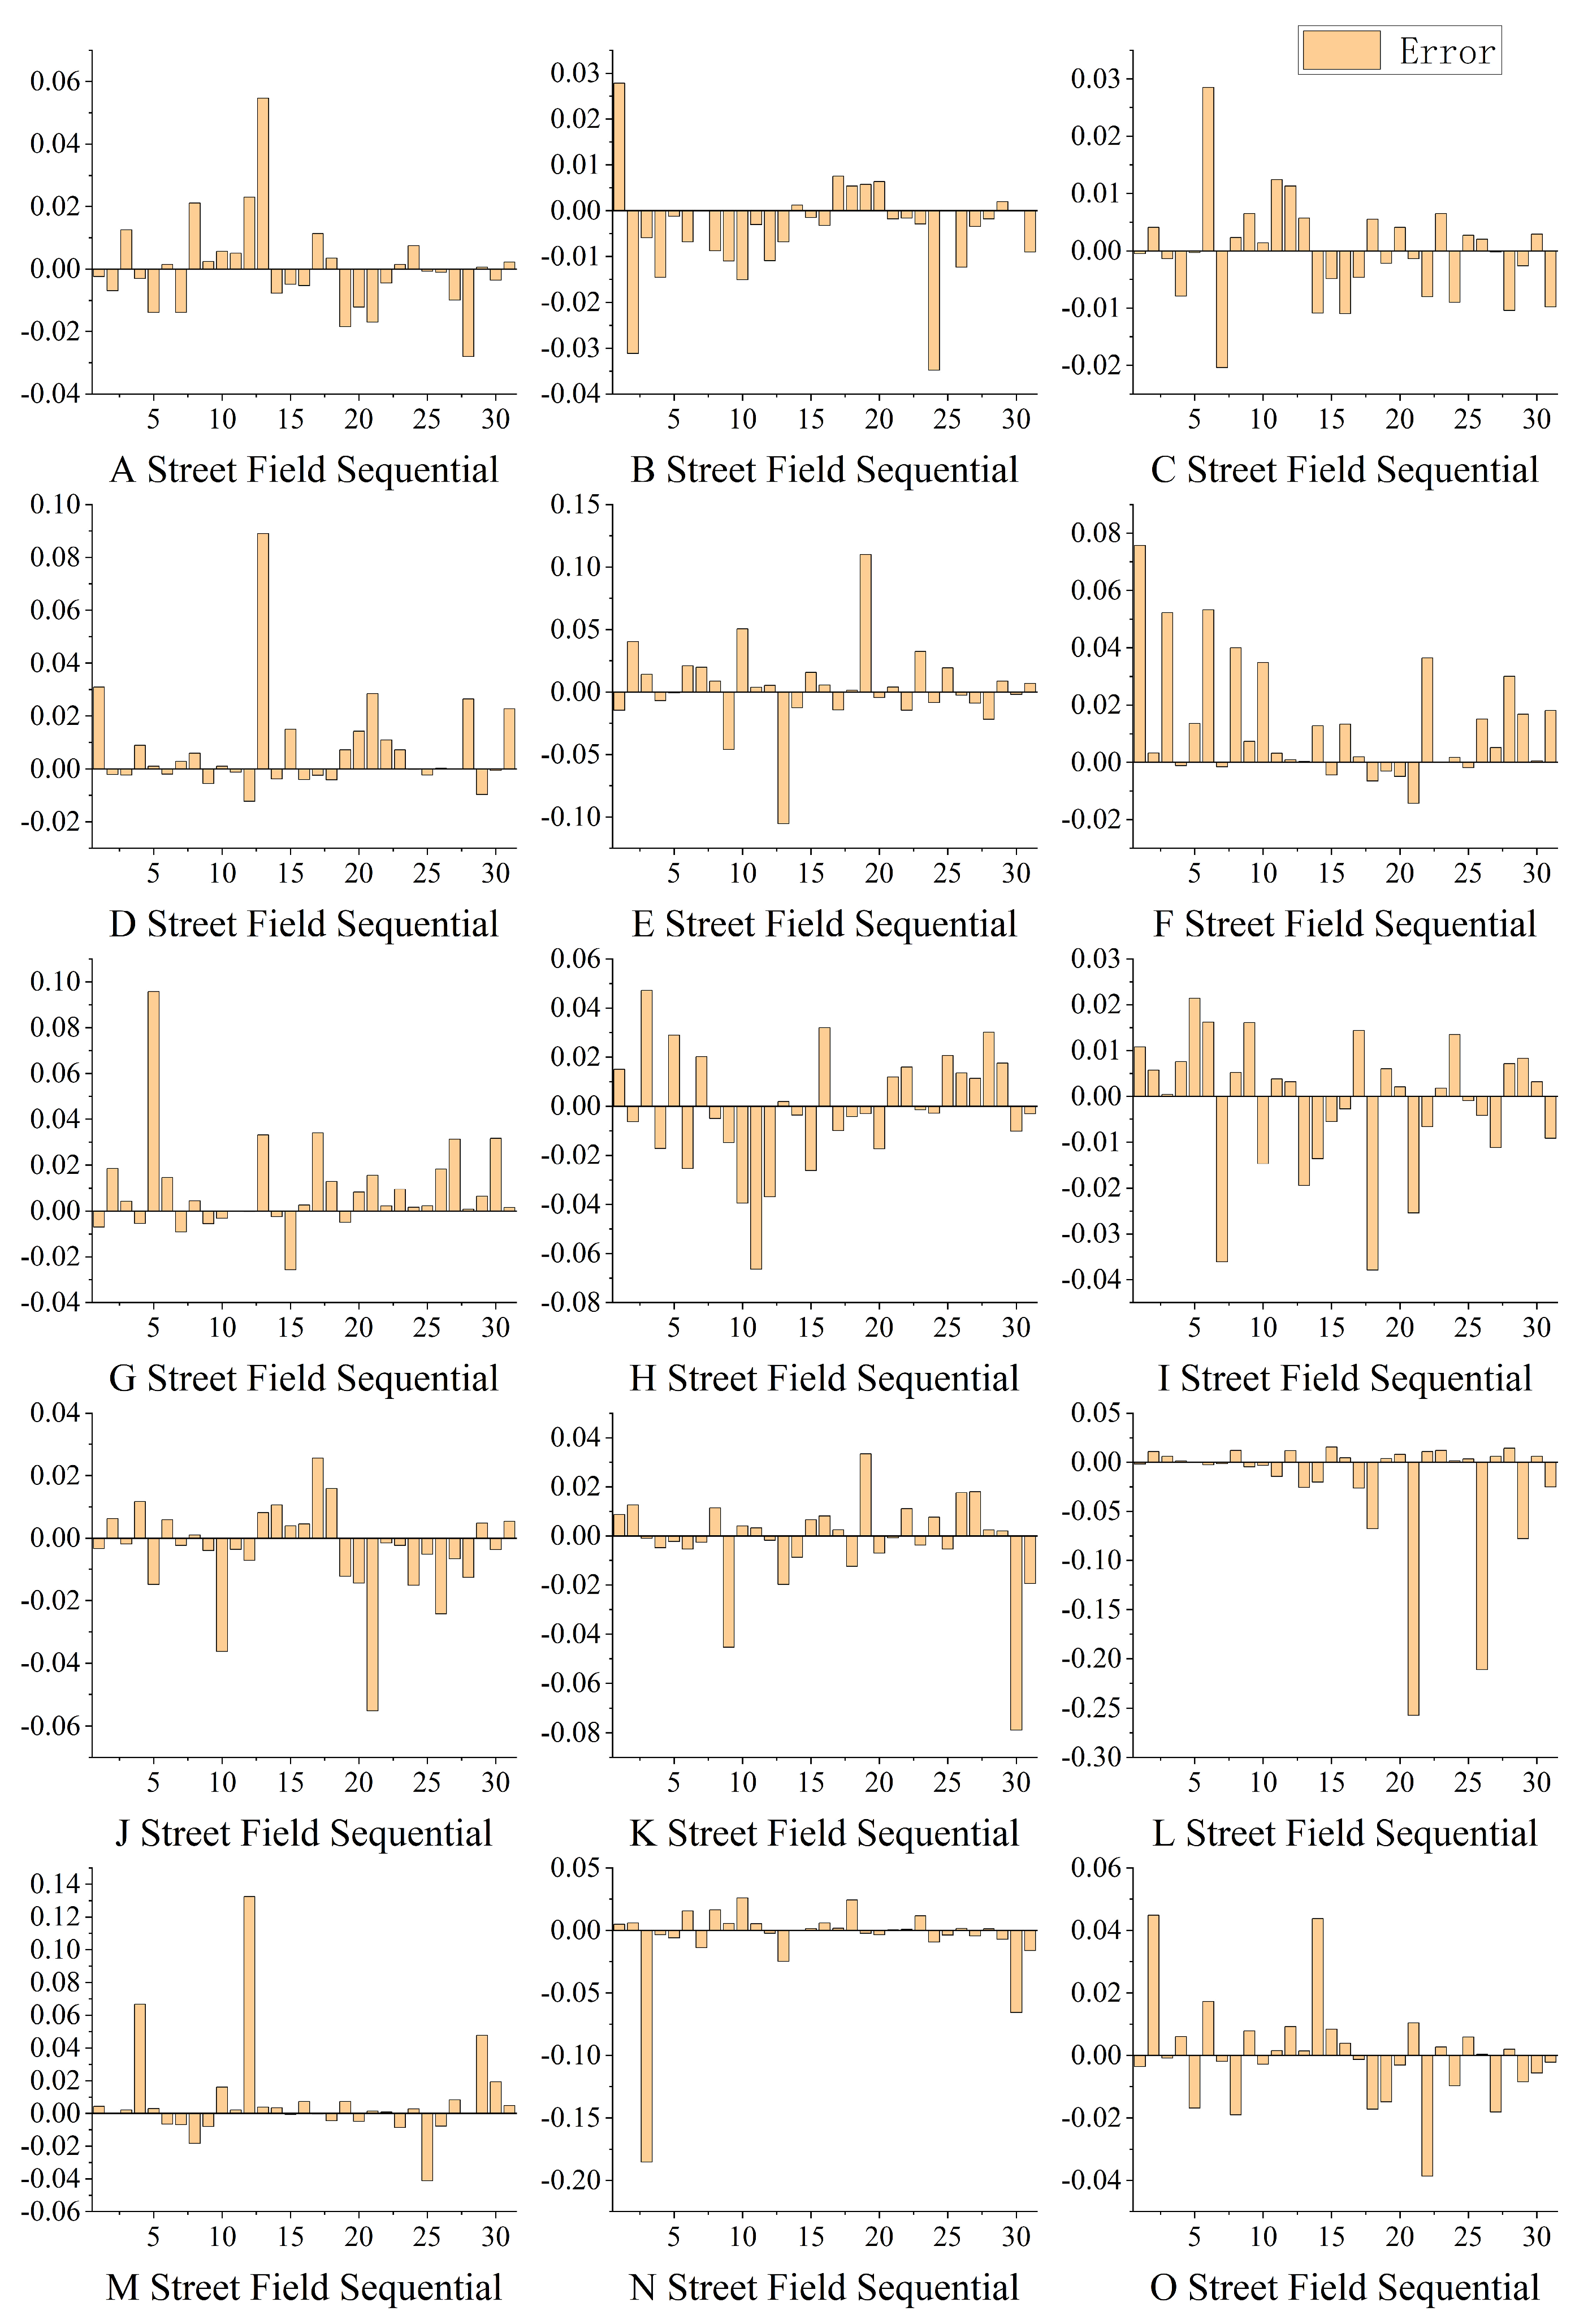
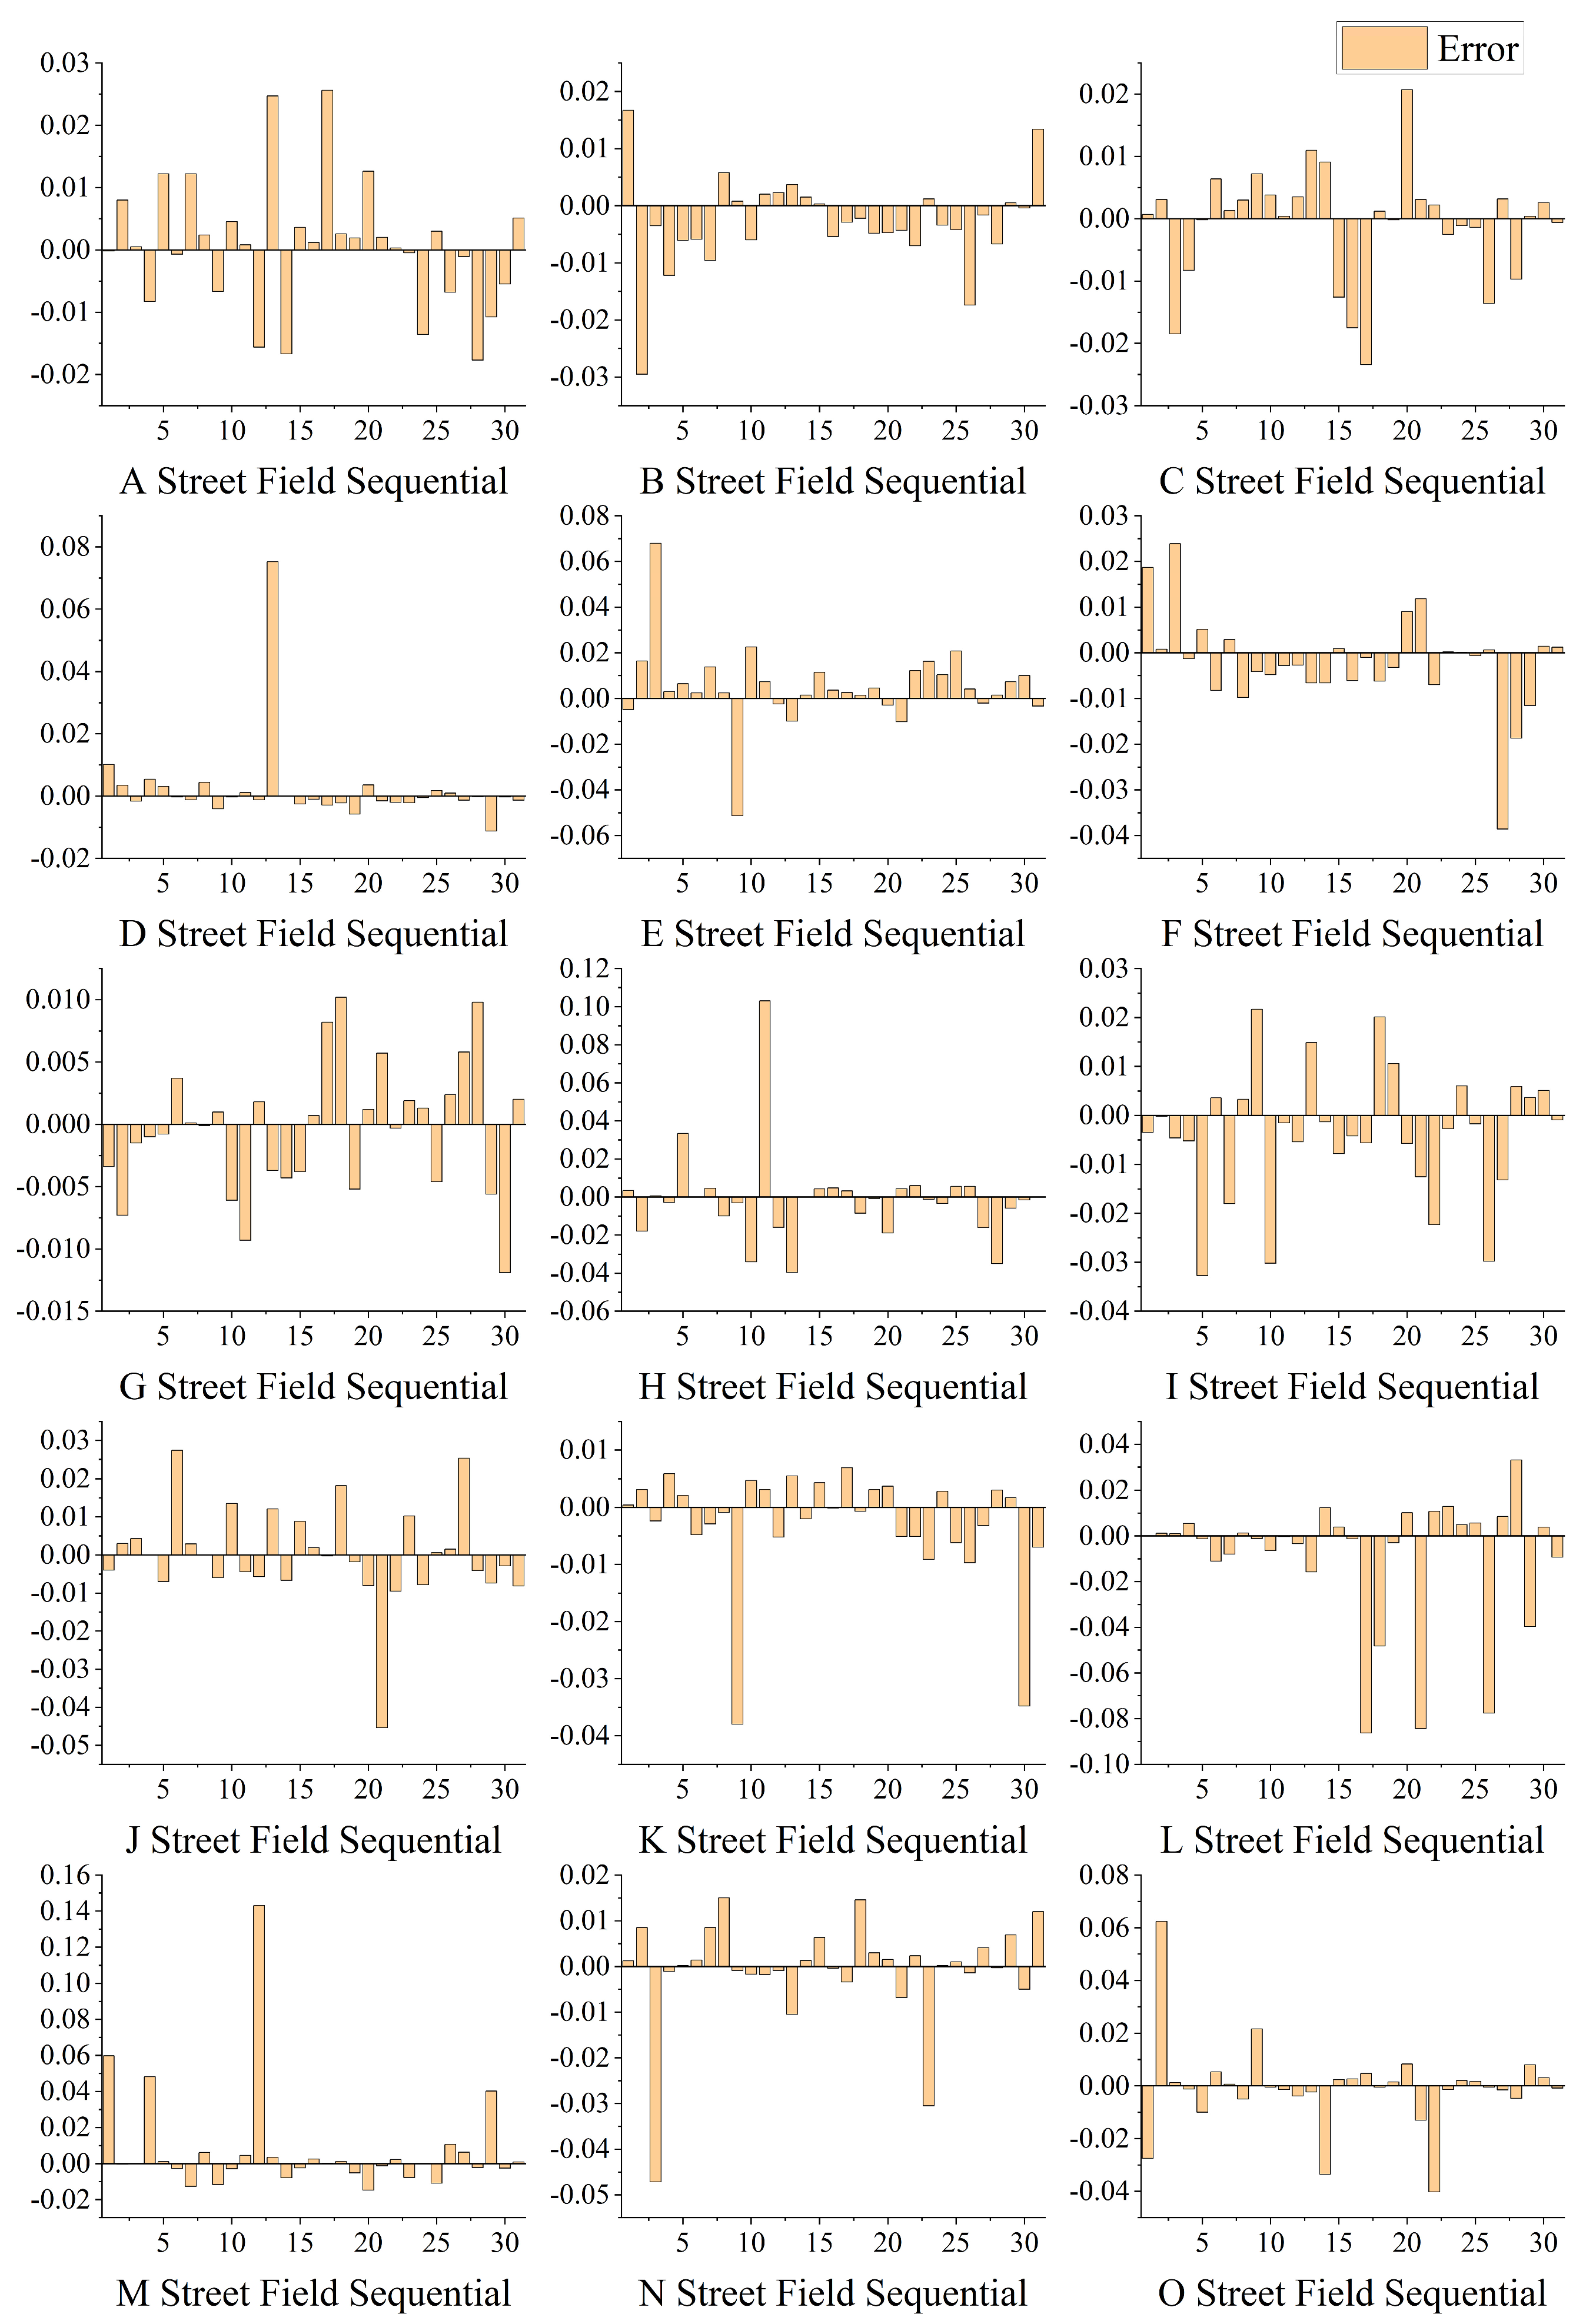
4.2.2. Comparison of Prediction Results

A comprehensive comparison of the two input modes shows that the NSE and RMSE values for the same street follow a consistent trend in both modes, with high-risk areas typically performing better than medium- and low-risk areas. In terms of low-risk areas, Street O has lower NSE values in both input modes compared to the other streets, suggesting that its prediction performance is relatively poor.
In Pattern 1, due to the single form of input data used (only rainfall and rainfall intensity), the model primarily relies on dynamic precipitation characteristics for its predictions, leading to relatively lower NSE and higher RMSE values, especially in medium- and some low-risk areas. This indicates that the model cannot fully capture the complexity of the flood risk. In Pattern 2, the input data are more detailed, and the model’s ability to learn from multiple factors significantly improves, leading to a noticeable reduction in error and more accurate predictions.

5. Discussion

This study proposes a new method for the comprehensive evaluation and prediction of urban flood risks based on environmental attributes and pipe pipeline operation characteristics. It also validates the applicability and effectiveness of the model in Zhengzhou’s Jinshui District. Compared with similar studies, this research builds upon the growing body of literature emphasizing the importance of integrating multiple risk factors. Previous studies have often relied on single−factor analyses, such as analyses of rainfall characteristics or static environmental attributes [37]. While these approaches provide valuable insights, they fail to capture the dynamic interactions between rainfall, land use, and pipe network operation. By incorporating pipe system characteristics, including node overflow and pipeline overload, into our model, our study addresses this gap and aligns recent advancements in the field [38]. In addition, the results show the significant impact of regional terrain, the impermeable surface ratio, and population density on flood risk, which is consistent with the conclusions of Jiali Zhu [14]. Furthermore, the environmental-attribute-based calculation of the prevalence of high-, medium-, and low-risk areas was 20%, 53%, and 27%, respectively. When considering the combined risk of environmental attributes and pipeline operation characteristics, the high-, medium-, and low-risk areas were calculated to be 20%, 60%, and 20%, respectively, with a different distribution pattern. This highlights the importance of considering pipeline operation characteristics, in line with Leandro’s emphasis on the critical role of pipeline overflow characteristics in urban flood risk [39], further supporting the key influence of nodes and pipelines on regional flood risk calculations.
This study enhances the accuracy of urban flood risk prediction by using a stacked Random Forest (RF) and XGBoost model that combines rainfall characteristics, environmental attributes, and pipeline operation characteristics. The model’s Nash–Sutcliffe Efficiency (NSE) is better than traditional input models that are based solely on rainfall and rainfall intensity. Research by Viavattene also indicates that while rainfall data are a major influencing factor on flood risk, urban surface properties also play an important role [40]. By adding environmental attributes and pipeline operation characteristics to the input data, this study not only improves the accuracy of regional flood risk predictions but also enhances this model’s applicability. The stacking ensemble approach, combining RF’s stability with XGBoost’s capacity for identifying nonlinear relationships, outperformed models relying on individual algorithms. The NSE’s improvement from 0.85 (Pattern 1) to 0.94 (Pattern 2) underscores the efficacy of integrating diverse data sources. This finding corroborates other studies that have highlighted the advantages of ensemble methods in urban flood risk prediction [41].
Although this study has achieved success in flood risk evaluation and prediction, some limitations remain. Future research could design and select more targeted indicator systems based on the characteristics of different regions to enhance the model’s general applicability. Additionally, while the current model incorporates rainfall characteristics, environmental attributes, and pipeline operation characteristics, there is room to further expand the dimensions of the rainfall characteristics considered. For example, more refined rainfall variables (such as rainfall duration) could be introduced to capture the complex mechanisms by which rainfall impacts urban flooding, further optimizing prediction accuracy and better enabling urban disaster prevention and mitigation. Additionally, while the RF−XGBoost model provides high accuracy, its interpretability could be further improved by the addition of explainable AI techniques.

6. Conclusions

This study constructs a comprehensive flood risk assessment system based on environmental attributes and pipeline operation characteristics, and proposes an RF−XGBoost-coupled flood risk prediction model. The main conclusions are as follows:
(1)
The overall urban flood risk shows an increasing trend from northeast to southwest, with high-risk areas concentrated in the southwest. These areas are typically highly impermeable and have high pressure on their pipelines. Low-risk areas are located in regions with lower population densities and better pipe facilities.
(2)
Environmental attributes and pipeline operation characteristics influence urban flood risk. Relying solely on environmental attributes or pipeline operation characteristics for risk assessments may limit their utility. Introducing a model for the evaluation of pipeline operation characteristics based on environmental attributes enables a more reasonable risk assessment. Impermeability, slope, and population density are key environmental factors influencing regional flood characteristics and risk distribution. The pipe system’s operational status, influenced by upstream and downstream pipeline interactions, is an important medium for flood risk propagation. Additionally, rivers play a vital role in alleviating local waterlogging and regulating regional pipe pressure.
(3)
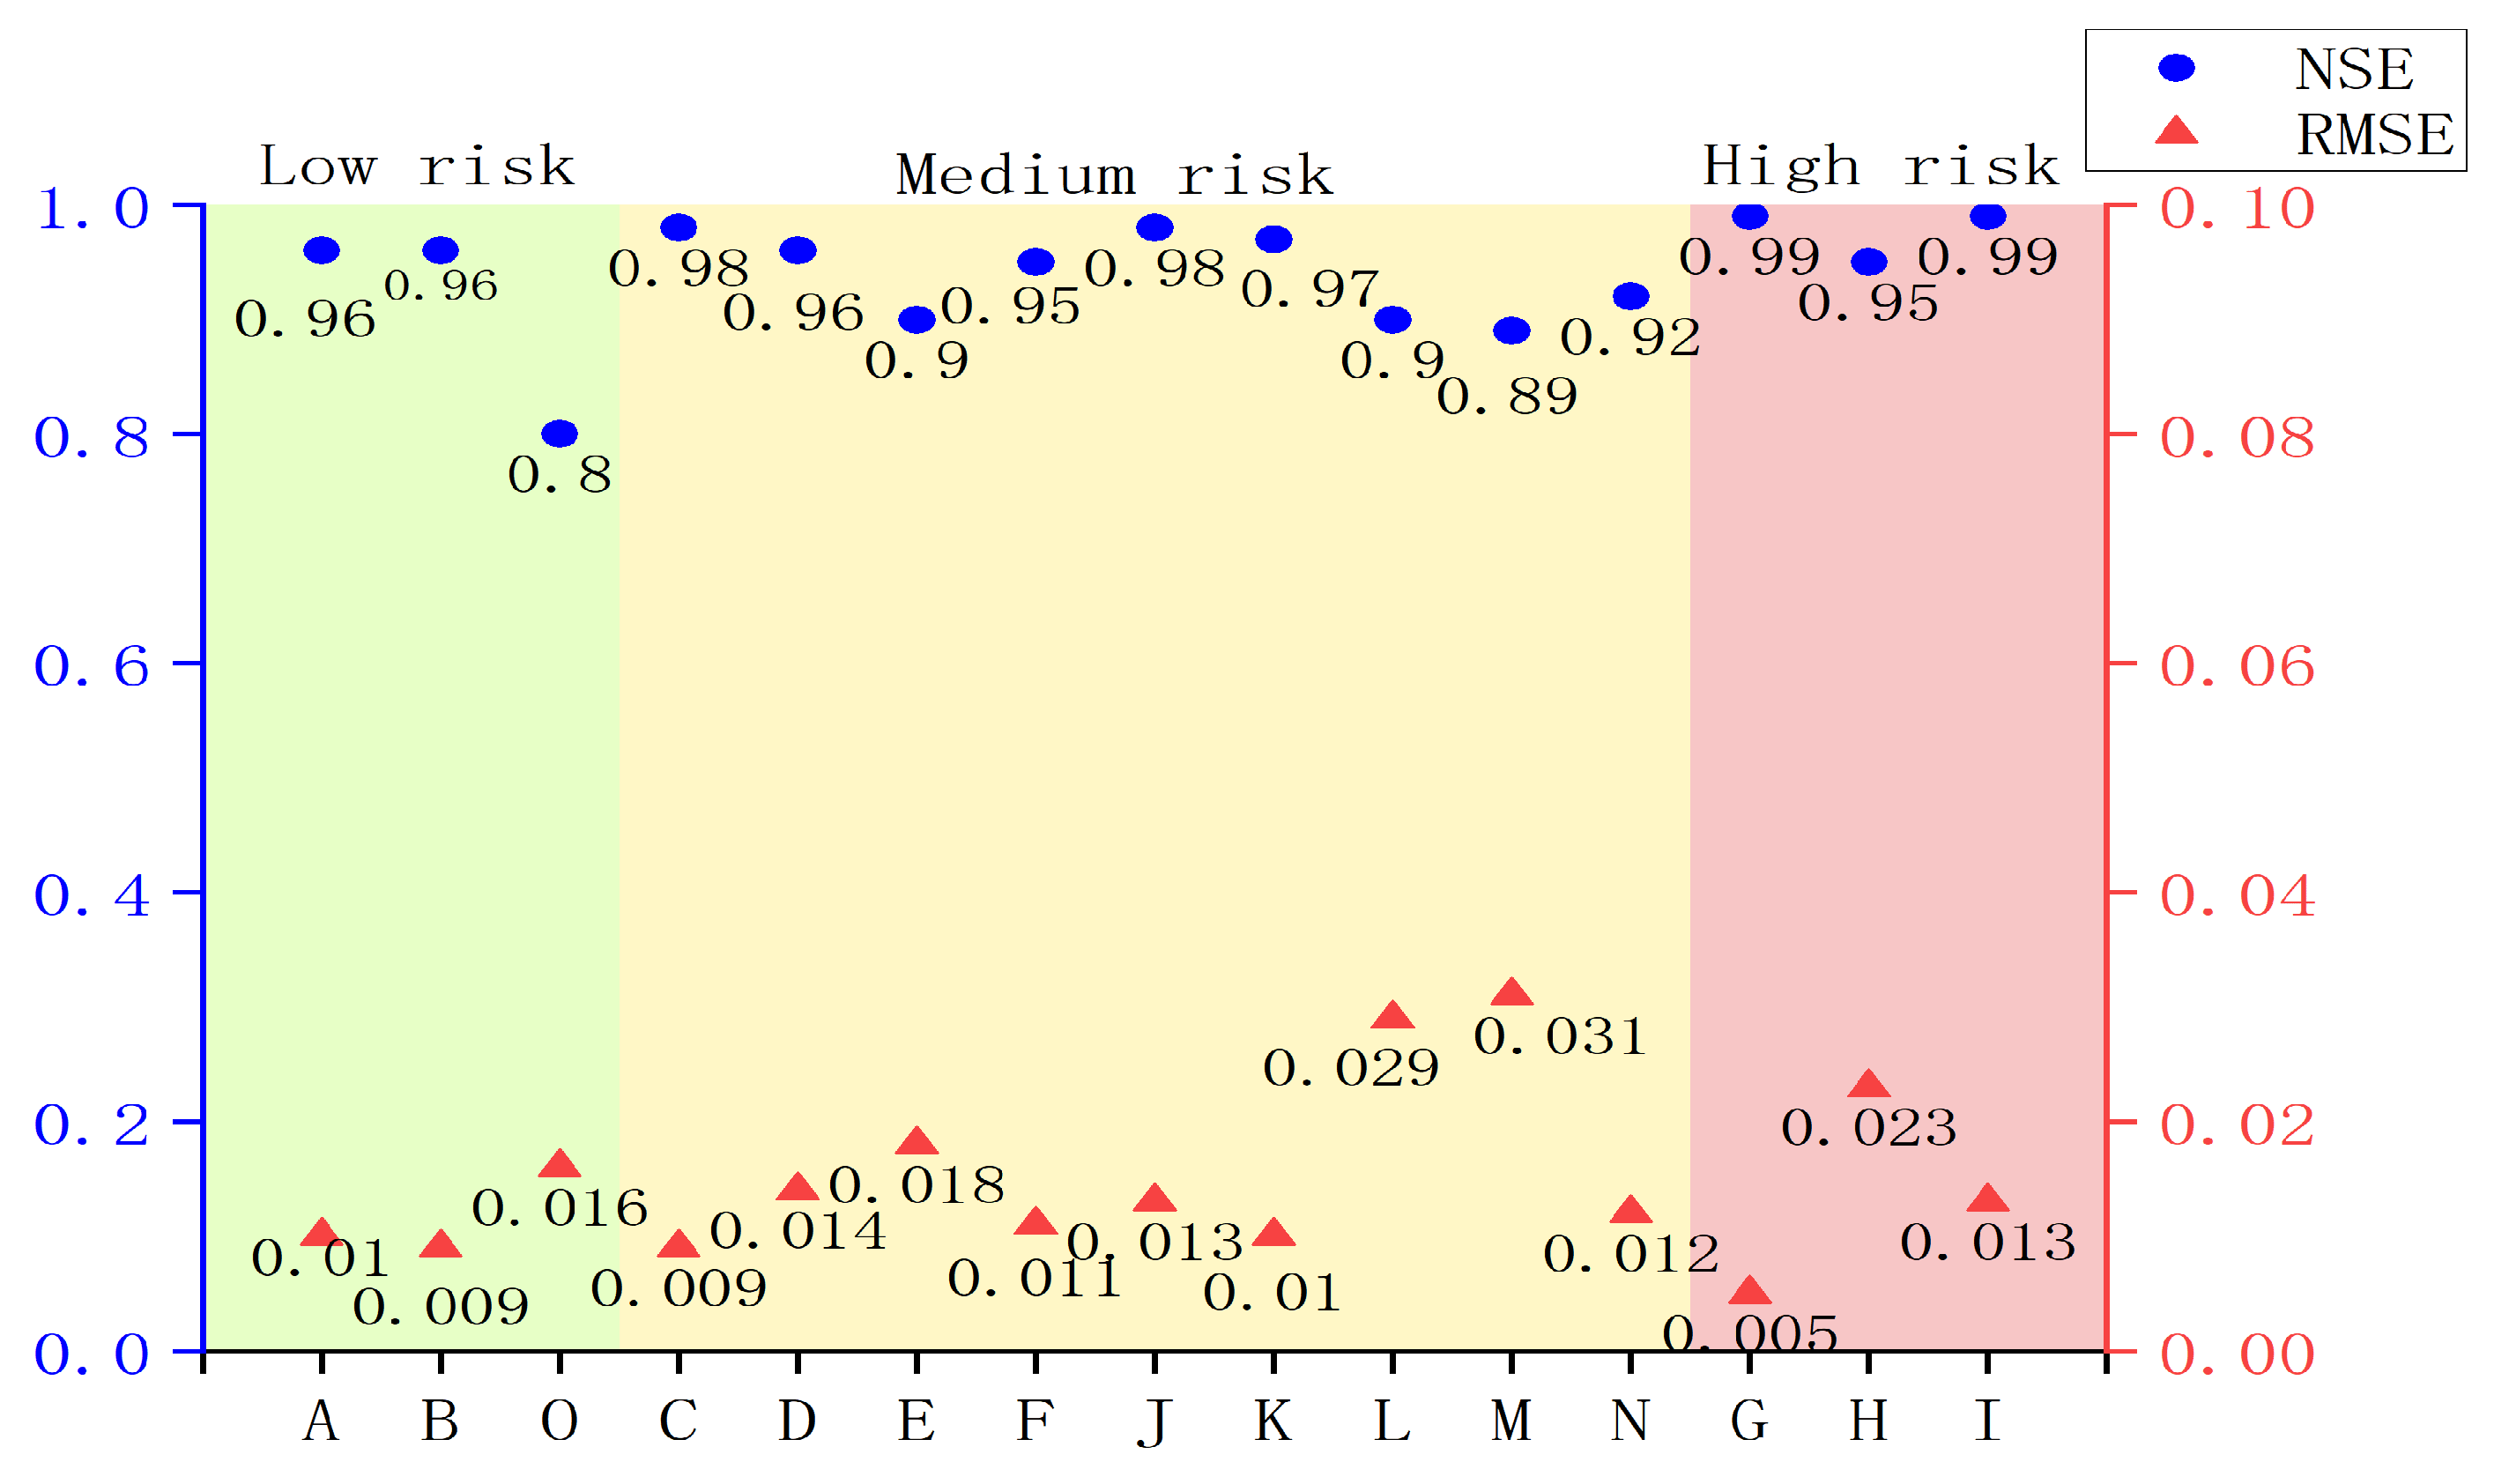
The loosely coupled RF−XGBoost model improves prediction accuracy. In Pattern 1, where only rainfall characteristics are considered, the average Nash–Sutcliffe Efficiency is 0.85, demonstrating the model’s good prediction performance. In Pattern 2, which combines precipitation characteristics, environmental attributes, and pipeline operation characteristics, the model shows a higher prediction accuracy and robustness, with an average NSE of 0.94 and better RMSE values than those for Pattern 1. Comprehensive consideration of environmental attributes, pipeline operation characteristics, and meteorological conditions is key to improving urban flood risk prediction accuracy.

Author Contributions

J.Z. and Y.Y.: Conceptualization, Formal analysis, Funding acquisition, Investigation, Methodology, Project administration, Supervision, Validation, Visualization, Writing—original draft, and Writing—review and editing. L.Z.: Data curation, Formal analysis, Investigation, Methodology, Software, Validation, and Visualization. X.Z. and Y.W.: Software, Visualization, Data curation, and Methodology. J.Z.: Funding acquisition, Project administration, and Resources. All authors have read and agreed to the published version of the manuscript.

Funding

This research is supported by the National Natural Sciences Foundation of China (Grant No. 52379028) and Natural Science Foundation of Henan (Grant No. 242300421007).

Data Availability Statement

Data will be made available on request.

Conflicts of Interest

The authors declare that they have no known competing financial interests or personal relationships that could have appeared to influence the work reported in this paper.

References

  1. Beltramone, G.; Alaniz, E.; Ferral, A.E.; Aleksinko, A.; Arijón, D.R.; Bernasconi, I.; German, A.; Ferral, A. Risk mapping of urban areas prone to flash floods in mountain basins using the analytic hierarchy process and geographical information systems. In Proceedings of the 2017 XVII Workshop on Information Processing and Control (RPIC), Mar del Plata, Argentina, 20 September 2017. [Google Scholar]
  2. Su, W.; Ye, G.; Yao, S.; Yang, G. Urban Land Pattern Impacts on Floods in a New District of China. Sustainability 2014, 6, 6488–6508. [Google Scholar] [CrossRef]
  3. Feyen, L.; Barredo, J.I.; Dankers, R. Implications of global warming and urban land use change on flooding in Europe. Water Urban Dev. Paradig. 2008, 3, 235–244. [Google Scholar]
  4. Dimitriou, E.; Efstratiadis, A.; Zotou, I.; Papadopoulos, A.; Iliopoulou, T.; Sakki, G.K.; Mazi, K.; Rozos, E.; Koukouvinos, A.; Koussis, A.D.; et al. Post-Analysis of Daniel Extreme Flood Event in Thessaly, Central Greece: Practical Lessons and the Value of State-of-the-Art Water-Monitoring Networks. Water 2024, 16, 980. [Google Scholar] [CrossRef]
  5. Wang, H.W.; Kuo, P.H.; Shiau, J.T. Assessment of climate change impacts on flooding vulnerability for lowland management in southwestern Taiwan. Nat. Hazards 2013, 68, 1001–1019. [Google Scholar] [CrossRef]
  6. Qi, H.; Altinakar, M.S. Simulation-based decision support system for flood damage assessment under uncertainty using remote sensing and census block information. Nat. Hazards 2011, 59, 1125–1143. [Google Scholar] [CrossRef]
  7. Song, T.X.; Liu, J.H.; Mei, C.; Zhang, M.X.; Wang, H.; Nazli, S. Coupling effect analysis of dam break flood spread and building collapse based on numerical simulation. Sci. China Technol. Sci. 2024, 67, 3571–3584. [Google Scholar] [CrossRef]
  8. Li, Y.; Han, H.; Sun, Y.; Xiao, X.; Liao, H.; Liu, X.; Wang, E. Risk Evaluation of Ice Flood Disaster in the Upper Heilongjiang River Based on Catastrophe Theory. Water 2023, 15, 2724. [Google Scholar] [CrossRef]
  9. Ying, X.; Ni, T.; Lu, M.; Li, Z.; Lu, Y.; Bamisile, O. Urban Flooding Risk Assessment Based on Numerical Simulation of Sub-catchment Area: A Case Study From Chengdu, China. Res. Sq. 2021. [Google Scholar] [CrossRef]
  10. Merz, B.; Aerts, J.; Arnbjerg-Nielsen, K.; Baldi, M.; Nied, M. Floods and climate: Emerging perspectives for flood risk assessment and management. Nat. Hazards Earth Syst. Sci. 2014, 14, 1921–1942. [Google Scholar] [CrossRef]
  11. Mustafa, A.; Bruwier, M.; Archambeau, P.; Erpicum, S.; Pirotton, M.; Dewals, B.; Teller, J. Effects of spatial planning on future flood risks in urban environments. J. Environ. Manag. 2018, 225, 193–204. [Google Scholar] [CrossRef]
  12. Kim, G.; Cho, H.T. Development of an Urban Flood Forecast Model Using Lumped Pipe Networks. J. Korean Soc. Hazard Mitig. 2022, 22, 79–88. [Google Scholar] [CrossRef]
  13. Ren, Y.; Zhang, H.; Wang, X.; Gu, Z.; Fu, L.; Cheng, Y. Optimized Design of Sponge-Type Comprehensive Pipe Corridor Rainwater Chamber Based on NSGA-III Algorithm. Water 2023, 15, 3319. [Google Scholar] [CrossRef]
  14. Zhu, J.; Zhou, W.; Yu, W.; Wang, W. Block-level spatial integration of population density, social vulnerability, and heavy precipitation reveals intensified urban flooding risk. Sustain. Cities Soc. 2024, 117, 105984. [Google Scholar] [CrossRef]
  15. Adams, R.; Rees, P.L.; Bedient, P.B.; Vieux, B.E. Improved Flood Prediction in an Urban Watershed Using a Physically-Based Modeling Approach. AGU Spring Meet. Abstr. 2005, 2005, H21C-03. [Google Scholar]
  16. Xudong, Z.; Kun, Y.; Shuangyun, P.; Quanli, X.; Chao, M. The study of urban rainstorm waterlogging scenario simulation based on GIS and SWMM model—Take the example of Kunming Dongfeng East Road catchment area. In Proceedings of the International Conference on Geoinformatics, Kaifeng, China, 20–22 June 2013. [Google Scholar]
  17. Ahmed, N.S. Machine Learning Models for Pavement Structural Condition Prediction: A Comparative Study of Random Forest (RF) and eXtreme Gradient Boosting (XGBoost). Open J. Civ. Eng. 2024, 14, 17. [Google Scholar] [CrossRef]
  18. Quanlong, F.; Jiantao, L.; Jianhua, G. Urban Flood Mapping Based on Unmanned Aerial Vehicle Remote Sensing and Random Forest Classifier—A Case of Yuyao, China. Water 2015, 7, 1437–1455. [Google Scholar] [CrossRef]
  19. Lee, S.; Kim, J.C.; Jung, H.S.; Lee, M.J.; Lee, S. Spatial prediction of flood susceptibility using random-forest and boosted-tree models in Seoul metropolitan city, Korea. Geomat. Nat. Hazards Risk 2017, 8, 1185–1203. [Google Scholar] [CrossRef]
  20. Hitouri, S.; Mohajane, M.; Lahsaini, M.; Ali, S.A.; Setargie, T.A.; Tripathi, G.; D’Antonio, P.; Singh, S.K.; Varasano, A. Flood Susceptibility Mapping Using SAR Data and Machine Learning Algorithms in a Small Watershed in Northwestern Morocco. Remote Sens. 2024, 16, 858. [Google Scholar] [CrossRef]
  21. Auret, L.; Aldrich, C. Interpretation of nonlinear relationships between process variables by use of random forests. Miner. Eng. 2012, 35, 27–42. [Google Scholar] [CrossRef]
  22. Aydn, Y.; Nigdeli, S.M.; Bekda, G. Determination of the Effect of XGBoost’s Parameters on a Structural Problem; Springer: Cham, Switzerland, 2024; pp. 319–339. [Google Scholar]
  23. Jialei, C.; Guoru, H.; Wenjie, C. Towards better flood risk management: Assessing flood risk and investigating the potential mechanism based on machine learning models. J. Environ. Manag. 2021, 293, 112810. [Google Scholar]
  24. Zhang, J.; Wang, Y.; He, R.; Hu, Q.; Song, X. Discussion on the urban flood and waterlogging and causes analysis in China. Adv. Water Sci. 2016, 27, 485–491. [Google Scholar]
  25. Leitao, J.P. Enhancement of Digital Elevation Models and Overland Flow Path Delineation Methods for Advanced Urban Flood Modelling. Ph.D. Thesis, Imperial College London, South Kensington, London, UK, 2009. [Google Scholar]
  26. Wang, C. Urban flood risk analysis for determining optimal flood protection levels based on digital terrain model and flood spreading model. Vis. Comput. 2010, 26, 1369–1381. [Google Scholar] [CrossRef]
  27. Pedersen, A.N.; Mikkelsen, P.S.; Arnbjerg-Nielsen, K. Climate change-induced impacts on urban flood risk influenced by concurrent hazards. J. Flood Risk Manag. 2012, 5, 203–214. [Google Scholar] [CrossRef]
  28. Xu, K.; Tian, Y.; Bin, L.; Xu, H.; Xue, X.; Lian, J. Analysis of Urban Flooding Driving Factors Based on Water Tracer Method and Optimal Parameters-Based Geographical Detector. Int. J. Disaster Risk Sci. 2025, 16, 276–290. [Google Scholar] [CrossRef]
  29. Yuan, D.; Xue, H.; Du, M.; Pang, Y.; Wang, J.; Wang, C.; Song, X.; Wang, S.; Kou, Y. Urban waterlogging resilience assessment based on combination weight and cloud model: A case study of Haikou. Environ. Impact Assess. Rev. 2025, 111, 107728. [Google Scholar] [CrossRef]
  30. Xiangyu, C.; Guangheng, N.; Shibo, H.; Fuqiang, T.; Tong, Z. Simulative analysis on storm flood in typical urban region of Beijing based on SWMM. Water Resour. Hydropower Eng. 2006, 37, 64–67. [Google Scholar]
  31. Jiang, L.; Chen, Y.; Wang, H. Urban flood simulation based on the SWMM model. Proc. IAHS 2015, 368, 186–191. [Google Scholar] [CrossRef]
  32. Bisht, D.S.; Chatterjee, C.; Kalakoti, S.; Upadhyay, P.; Sahoo, M.; Panda, A. Modeling urban floods and drainage using SWMM and MIKE URBAN: A case study. Nat. Hazards 2016, 84, 749–776. [Google Scholar] [CrossRef]
  33. Yu, H.; Huang, G.; Wu, C. Application of the stormwater management model to a piedmont city: A case study of Jinan City, China. Water Sci. Technol. A J. Int. Assoc. Water Pollut. Res. 2014, 70, 858–864. [Google Scholar] [CrossRef]
  34. Yuqing, T.; Qiming, C.; Fengwei, L.; Fei, L.; Linhao, L.; Yihong, S.; Shaochun, Y.; Wenyu, X.; Zhen, L.; Yao, C. Hydrological reduction and control effect evaluation of sponge city construction based on one-way coupling model of SWMM-FVCOM: A case in university campus. J. Environ. Manag. 2024, 349, 119599. [Google Scholar]
  35. Gall, J.; Razavi, N.; Gool, L.V. An Introduction to Random Forests for Multi-class Object Detection; Springer: Berlin/Heidelberg, Germany, 2012; pp. 243–263. [Google Scholar]
  36. Joshi, A.; Vishnu, C.; Mohan, C.K.; Raman, B. Application of XGBoost model for early prediction of earthquake magnitude from waveform data. J. Earth Syst. Sci. 2024, 133, 5. [Google Scholar] [CrossRef]
  37. Camarasa-Belmonte, A.M.; Soriano-García, J. Flood risk assessment and mapping in peri-urban Mediterranean environments using hydrogeomorphology. Application to ephemeral streams in the Valencia region (eastern Spain). Landsc. Urban Plan. 2012, 104, 189–200. [Google Scholar] [CrossRef]
  38. Muthu, K.; Ramamoorthy, S. Urban flood risk assessment using fuzzy logic and real-time flood simulation model—A geomatics techniques. Earth Sci. Inform. 2024, 18, 72. [Google Scholar] [CrossRef]
  39. Leandro, J.; Chen, A.S.; Djordjevic, S.; Savic, D.A. Comparison of 1D/1D and 1D/2D Coupled (Sewer/Surface) Hydraulic Models for Urban Flood Simulation. J. Hydraul. Eng. 2009, 135, 495–504. [Google Scholar] [CrossRef]
  40. Viavattene, C.; Ellis, J.B. The management of urban surface water flood risks: SUDS performance in flood reduction from extreme events. Water Sci. Technol. A J. Int. Assoc. Water Pollut. Res. 2013, 67, 99–108. [Google Scholar] [CrossRef]
  41. Kumar, K.L.; Sirisati, R.S. Development and Comparative Analysis of Advanced Machine Learning Algorithms for Flood Prediction and Susceptibility Mapping. Neuro Quantology 2024, 22, 201–214. [Google Scholar]
Figure 1. Overview of the study area.
Water 17 01477 g001
Figure 2. Data map of environmental attribute indicators (the letters A–O on the horizontal axes represent the different sub-district offices in the study area).
Water 17 01477 g002
Figure 3. SWMM pipe network and sub-catchment map.
Water 17 01477 g003
Figure 4. Flowchart of urban flood risk prediction model construction.
Water 17 01477 g004
Figure 5. Environmental attribute risk map.
Water 17 01477 g005
Figure 6. Risk map of pipeline operation characteristics.
Water 17 01477 g006
Figure 7. Comprehensive risk map.
Water 17 01477 g007
Figure 8. Prediction results of Pattern 1.
Water 17 01477 g008
Figure 9. Scatter plot of Pattern 1 indicators.
Water 17 01477 g009
Figure 10. Prediction results of Pattern 2.
Water 17 01477 g010
Figure 11. Scatter plot of Pattern 2 indicators.
Water 17 01477 g011
Table 1. Data and their sources.
Data NameExplanationSource
Rainfall data10 min raster data (2018–2022)Zhengzhou Meteorological Bureau
DEM data with elevation dataaccuracy of 12.5 m (2023)ZhongKetusin (http://www.tuxingis.com)
Pipe network dataZhengzhou pipe engineering pipe network mapZhengzhou Municipal Administration Office
Land use dataESA resolution of 10 m for land use data, including woodland, grassland, cultivated land, and buildingsEuropean Space Agency (https://esa-worldcover.org/en)
Social and economic dataIncludes population density, pipeline network density, and the number of emergency facilitiesZhengzhou Bureau of Statistics
Table 2. Regional waterlogging risk assessment indicators.
Evaluation ContentPrimary IndicatorsSecondary IndicatorsTertiary Indicators
Urban Flood Risk EvaluationEnvironmental AttributesNatural AttributesSlope
Elevation
Impervious Surface Ratio
Socio-economic AttributesPipeline Density
Population Density
Number of Emergency Facilities
Pipe Network Operational CharacteristicsNode RiskOverflow Volume
Ponding Duration
Maximum Ponding Depth
Pipeline RiskOverload Duration
Maximum Flow
Maximum Velocity
Table 3. Indicator weights.
IndicatorsWeight (%)IndicatorsWeight (%)
Slope13.4Overflow Volume5.5
Elevation8.4Ponding Duration7.9
Impervious Surface Ratio11.8Maximum Ponding Depth6.6
Pipeline Density8.3Overload Duration6.3
Population Density12.6Maximum Flow4.7
Number of Emergency Facilities10.1Maximum Velocity4.3
Table 4. Model error table.
Return Period of RainfallSurface Runoff Continuity ErrorFlow Calculation Continuity ErrorComprehensive Runoff Coefficient
1a−0.08%−0.09%0.633
2a−0.06%0.03%0.687
5a−0.02%−0.71%0.652
Table 5. Risk level classification table.
Risk ValueRisk Level
<0.33Low Risk
0.33–0.67Medium Risk
>0.67High Risk
Disclaimer/Publisher’s Note: The statements, opinions and data contained in all publications are solely those of the individual author(s) and contributor(s) and not of MDPI and/or the editor(s). MDPI and/or the editor(s) disclaim responsibility for any injury to people or property resulting from any ideas, methods, instructions or products referred to in the content.

